Embed Size (px)
Citation preview

HAL Id: hal-02612987https://hal.archives-ouvertes.fr/hal-02612987
Submitted on 19 May 2020
HAL is a multi-disciplinary open accessarchive for the deposit and dissemination of sci-entific research documents, whether they are pub-lished or not. The documents may come fromteaching and research institutions in France orabroad, or from public or private research centers.
L’archive ouverte pluridisciplinaire HAL, estdestinée au dépôt et à la diffusion de documentsscientifiques de niveau recherche, publiés ou non,émanant des établissements d’enseignement et derecherche français ou étrangers, des laboratoirespublics ou privés.
Laminar buffet and flow controlVincent Brion, Julien Dandois, Rouven Mayer, Philippe Reijasse, Thorsten
Lutz, Laurent Jacquin
To cite this version:Vincent Brion, Julien Dandois, Rouven Mayer, Philippe Reijasse, Thorsten Lutz, et al.. Laminarbuffet and flow control. Proceedings of the Institution of Mechanical Engineers, Part G: Journal ofAerospace Engineering, SAGE Publications, 2020, 234 (1), pp.124-139. �10.1177/0954410018824516�.�hal-02612987�

Laminar buffet and flow controlV. Brion*, J. Dandois*, R. Mayer**, P. Reijasse*, T. Lutz**, L. Jacquin*
*[email protected], ONERA, The French Aerospace Lab
** USTUTT, University of Stuttgart
Abstract
An experimental investigation of the transonic flow past the laminar OALT25 airfoil hasbeen conducted to analyze the impact of laminar flow upon the shock wave dynamics and theexistence of a laminar buffet like phenomenon. Tests have been carried out at freestream Machnumbers varying in the range 0.7 to 0.8, angle of attack from 0.5 to 4 degrees and with twotripping configurations at the upper surface of the wing. The (airfoil) chord based Reynoldsnumber is about 3 millions. Results obtained from pressure taps and sensors measurements, aswell as Schlieren visualizations of the flow reveal the presence of a laminar buffet phenomenonin sharp contrast with the turbulent phenomenon, as it features a (freestream and chord)based normalized frequency of about unity while turbulent buffet occurs for a frequency closeto 0.07 (Jacquin et al., AIAA Journal, vol. 47, number 9, 2009). A low frequency mode, ata frequency about 0.05 is also present in the laminar situation, notably lower than the highfrequency component. The latter exhibits strong oscillations of the shock foot and verticalwavelike deformations of the shock wave and the former moves the shock back and forth over asmall portion of chord, quite similarly to the turbulent phenomenon. The mean flow past thelaminar wing is characterized by a laminar separation bubble under the shock foot which likelycontributes much to the novel dynamics revealed by the present experiments. Two controlstrategies of the unsteady shock wave are implemented, one consisting of three-dimensionalbumps and one consisting of steady jets blowing transversely to the freestream. It is foundthat bumps provide a significant reduction of the buffet intensity in the laminar situation.The jets are able to completely remove the flow unsteadiness in both laminar and turbulentconditions.
1 Introduction
Transonic buffet is one of the limitations of the flight envelope of commercial aircrafts. It alsolimits the performance of military aircrafts engaged in air-to-air combat at high subsonic speedsdue to the development of flow separation on the wing and oscillations of the shock wave which maycause the buffeting of the airframe and steep increases in drag (Ray and Taylor [36]). For civilianaircraft certification authorities buffet onset boundaries is based on accelerometer recordings atthe position of the pilot’s seat with peak to peak amplitudes of 0.25 acceleration of gravity (g)(Obert [34]). Buffet onset is therefore an important feature to be determined in the developmentof a wing configuration as it dictates the necessary margin to critical conditions and aircraft certi-fication. Mabey [29] and Ray and Taylor [36] used the data of a strain gage installed at the rootof an elastically similar wing to determine the oscillations of the wing structure in response to theenergy provided by shock oscillation and flow separation. In this process they could describe theonset of buffet. However using similarity for the wing elastic response is a difficult task and pureaerodynamical studies of the buffet, with ideally rigid wing, is a much easier way to go. In this case,criteria based on selected divergences in the static aerodynamic characteristics allow a qualitativedetermination of the buffet onset (see John [23]).
At a fundamental level, much understanding of the buffet phenomenon has been obtained fromexperiments of the transonic flow past simple airfoils. In this case it is known that starting froma stable configuration an increase in Mach number or angle of attack eventually causes the de-
1

velopment of large oscillations of the shock wave that forms at the end of the supersonic pocketabove the upper surface of the profile. This two-dimensional buffet phenomenon has been muchdescribed in experiments (see Jacquin et al. [22], McDevitt [31] and Lee [27]) and has recently beenshown to correspond to the nonlinear saturation of a global unstable mode by Crouch et al. [12] andSartor et al. [38]. Earlier Lee [26] proposed an acoustic feedback loop scenario to explain the buffetphenomenon, that comprises hydrodynamic waves travelling from the shock to the trailing edge,where acoustic waves are emitted. These acoustic waves travel upstream and reach the shock back,triggering new hydrodynamic perturbations at the shock foot. This mechanism was also consideredby Jacquin et al. [22] and recent Particle Image Velocimetry (PIV) tend to confirm this scenario,see Hartmann et al. [21, 20]. Numerical simulations using RANS models and hybrid RANS-LESmodels have also successfully been used to simulated buffet for various airfoils [15, 5, 44, 4, 6].Compared to the two-dimensional phenomenon, the three-dimensional buffet on typical aircraftwing geometries appears quite different. It implies much less shock oscillations and a wider spectralcontent of fluctuations (see Dandois [13] and Sartor and Timme [39]).
These previous studies were concerned with the shock interaction with a turbulent boundarylayer, meaning, from an experimental point of view at least, that the boundary layer that forms atthe upper surface of the wing is tripped turbulent at some location close to the leading edge. Thecase of an interaction with a laminar boundary layer has been comparatively much less investigated.The experimental analysis of Dor et al. [16], one of the few references in this domain, suggests theabsence of a marked unsteadiness in the laminar, free transition, case. On the contrary Finke [18]mentions, based on transonic experiments past the NACA631 − 012 airfoil, the existence of a highfrequency mode at normalized frequency (based on free stream and chord) St ' 0.2 − 0.4 at lowangle of attack and of a low frequency mode St ' 0.08 at higher angles of attack. The low frequencymode is associated with a large extension of the shock movement, similar to the turbulent buffetphenomenon and unlike the high frequency mode which negligeably moves the shock. Finke furtheranalyzes the high frequency mode as the result of a loop of excitations that proceeds within thelaminar separation bubble present under the shock foot in the laminar case. This loop seeminglydevelops between the separation point and the reattachment point where pressure waves are emitted,then propagating upstream. The low frequency mode is analyzed similarly to the acoustic feedbackloop scenario which was made popular by Lee [26]. The work of Finke, recently summarized bySoda [43], also contains models based on these scenari that match experimental results rather well.Finally, at a more general level, Liepmann [28] stresses the importance of boundary layer effectsupon the shock wave phenomenon using experimental investigations of the flow past a circularairfoil.
From the numerical side little work has been done on the influence of laminar flow on buffet.There is, on general grounds, some numerical difficulty to model and capture the transitionalstate of the boundary layer, to account for the coupling with the external shocked flow, and todeal with the flow unsteadiness. In Reyhner and Flugge-Lotz [37] the problem of the interactionis treated by fixing the positions of the start of the interaction and of an idealized shock wavethen using an iterative procedure to ensure the compatibility of the shock strength with thesepositions. However the entire flow remains laminar. Reynolds Average Navier Stokes (RANS)approaches implement transition criteria to account for varying boundary layer states, that rangefrom practical to stability based theoretical approaches. However recent simulations performed inthe framework of the Buterfli project led by Europe and Russia on this specific issue, this programbeing the one that funded the current wind tunnel tests, showed the limitations of current numericalmethods (see one of the summary report of the project results [1]). These were found to fail inproviding or even converging a realistic average flow field when reaching critical conditions. As aconsequence one needs to use Direct Numerical Simulation (DNS) or Large Eddy Simulation (LES)to calculate the situation, although at a high computational cost and with little possibilities tocarry out the parametric study necessary to improve current understanding. Recently Dandois et
2

al. [14] exposed a Large Eddy Simulation (LES) reproduction of the present experiment, implicitlytaking advantage of the strong shock at the upper surface of the airfoil to trigger the transition,and letting the numerical scheme accounting for the details of the small scale fluctuations.
The present experimental analysis aims at describing this flow behavior associated with freetransition. A transonic airfoil with a laminar design is considered and wind tunnel tests are per-formed. Following the previous tests performed on this setup by the same authors (Brion et al. [8]),it is known that the laminar separation bubble that forms under the shock foot in the laminar caseis a key changer of the dynamics compared to the turbulent case. The presence of this laminarseparation in the shock interaction under buffet condition was first mentionned by Finke [18]. Froma general perspective, it is well known that laminar flow upstream is more sensitive to adversepressure gradient. In the case of a laminar boundary layer interacting with a normal shock wavetypical of the transonic flow past an airfoil flow separation can not be avoided (Schlichting [40]) andoccurs at some distance, named the interaction length, upstream of the shock wave. The resultinglaminar recirculation bubble tends to hasten the developement of turbulence as shear instabilities(Kelvin-Helmholtz) generate strong amplification of upstream perturbations, as illustrated in theincompressible case by Jones et al. [24]. As a consequence the flow downstream of the interactionis generally turbulent. The recirculating flow inside the laminar separation can also favors feedbackfrom the reattachment to the separation points. The latter, which is highly sensitive to disturbances,causes additional perturbations to the laminar bubble. Due to the strong amplification producedby the Kelvin-Helmholtz instability, the complete process can become unstable, as proposed byFinke [18] to explain the high frequency dynamics of the laminar interaction. Finally Reyhner andFlugge-Lotz [37] and Babinski and Harvey [3] describe how a laminar interaction creates a twostage pressure increase in the shock region, one from the compression waves formed at the flowseparation upstream from the shock wave and one from the very shock wave. The resulting patternis typical of the laminar interaction.
The improvement of numerical codes to capture the flow dynamics in a such transitional configu-rations relies on the availability of experimental data to confront the outputs of models or motivatetheir development. One concern is about the setup of transition criteria capable of unsteadiness,as this does not seem to have ever been developped so far. The data obtained in the current studycould provide reference data in this domain, with variations in Mach number, angle of attack, andconsidering both turbulent and laminar boundary layer configurations upstream of the shock wave.
It will be shown from the experimental results that unlike the description of Dor et al. [16] andsimilarly to the analysis of Finke [18] an unsteady phenomenon also exists in the laminar case abovecritical conditions, at a rather high frequency compared to turbulent buffet. The existence of thisphenomenon was reported in a previous article (Brion et al. [8]) and the present article providesadditional details on the flow dynamics, in particular the existence of a low frequency peak similarto the turbulent buffet, which was also mentioned by Finke [18]. Another goal of the present studyis to investigate the possibility to reduce or postpone buffet. Flow control for wing operation isuseful to increase flight envelope and maneuverability. Delaying buffet can extend the upper limitof the flight enveloppe. As such it has been attempted in several occasions. Cornettte [11] identifieda reduction in turbulent buffet intensity and an increased margin to buffet onset when using specialbodies for reduced shock-induced separation, one of the basic phenomenon correlated with buffetonset. In a three-dimensional turbulent configuration Molton et al. [33] showed that mechanical,continuous, and pulsed fluidic vortex generators were capable of postponing buffet onset in a three-dimensional buffet half wing configuration, through the reduction of flow separation behind theshoch wave.
This paper first describes the experimental setup that is deployed to investigate the flow dy-namics in laminar conditions, taking the turbulent flow case as a preliminary validation of theexperimental method and then as a reference for the rest of the analysis. The second part dealswith the analysis of the experimental database, that comprises time averaged and fluctuations of
3

pressure at the wing surface, Schlieren visualizations and observations of the laminar separationbubble with water droplets obtained by naturally condensing the water vapor present in the airof the wind tunnel. The last section is devoted to the control of the flow using two techniques,three-dimensional bumps and steady jets, considering the turbulent and laminar cases.
2 Description of the experiment
2.1 Wind tunnel setup
The experimental setup is an airfoil installed horizontally in the test section of the S3Ch transonicwind tunnel at the ONERA Meudon research center. The test section is 2.2m long, 0.763m in heightand 0.804m in width. The Mach number in the test section can be varied from 0.3 to 1.2 and is usedhere in the high subsonic range 0.7-0.8. In this range the Mach number is set using a second throatlocated downstream of the test section. The use of this second throat ensures an independence ofthe flow in the test section with regards to perturbations generated in the diffusor and allows tostabilize the Mach number to ±0.001. Stagnation pressure in the settling chamber is equalized toatmospheric conditions ahead of the last turbulence wire mesh. Automatic temperature controlsmaintain a uniform and constant stagnation temperature of 316K. The dewpoint is controlled inorder to prevent condensation in the test section, unless otherwise stated.
The airfoil features the OALT25 design, an ONERA shape targetted for improved laminar flow,that is close to OAT15A design previously used to investigated the buffet phenomenon in a turbulentsituation, see Jacquin et al. [22]. The airfoil is displayed in figure 2 in dimensionless units. Herethe chord of the wing is c = 0.23m and the freestream velocity U0 are considered for normalization.The Reynolds number is approximately 3×10⁶. The angle of attack of the airfoil can be varied from0 to 4 degrees. The freestream dynamic pressure is noted q0 and equals 1
2ρU2. Time is normalized
on cU0
and frequencies are usually presented in terms of Strouhal number St = fcU0
.Adaptive upper and lower walls allow to counter test section variations due to the presence of
the model and boundary layer growth at the side walls so as to minimize Mach number and flowincidence changes in the volume of the wing. At first order, upper and lower walls provide contouringclose to the streamlines of the flow past the wing as if it was in free atmospheric conditions. Walladaptation is performed whenever a setting of the test is changed, that is Mach number, angleof attack or state of the boundary layer at the wing upper surface. Three-dimensional effects areminimized by the large aspect ratio of the wing λ = s
c ' 3.5 where s = 0.804 is the wing span, equalto the width of the test section. Moreover there is no support inside the test section to preventunwanted surface interactions and wake development.
An important flow parameter in the present study is the state of the boundary layer upstream ofthe shock wave at the suction side. In the free transition case the boundary layer remains laminarup to the shock wave. This is evidenced in figure 1 which shows the upper surface of the wing in theinfrared (IR) 2.5− 5.1µm light range with the flow coming from the left. The surface temperatureshows a steep increase approximately at mid-chord as a result of the compression (and thus externalflow temperature increase) associated with the shock wave. An isolated roughness has been installedslightly downstream of the leading edge at a specific spanwise position to illustrate the impact ofa turbulent wedge in the IR image. The wedge is easily identified in the image. By contrast, thisshows that a laminar state is established in the rest of the wing up to the shock wave. In practice,IR thermography was used to check that the upper surface was free from such unwanted turbulenttransition wedge. Indeed any roughness would cause the same visualization as the one in figure 1.No IR monitoring could be applied at the lower surface and thus to ascertain the boundary layerstate it was forced turbulent by tripping tape installed at 7% of chord. The tripping tape featuresa sawtooth design and is taken with a thickness equal to 0.1mm when installed at 7% of chord.
To conduct IR monitoring the wing has first been painted with black mast paint of the brand
4

Figure 1: Infrared image of the upper surface of the wing at Mach number 0.73 and angle ofattack 2 degrees. The flow comes from the left. An isolated roughness installed at the leading edgecreates the turbulent wedge that protrudes ahead of the temperature increase (from dark to white)associated with the shock wave and the rise of turbulence. The wedge semi-angle is about 7o.
Sacotherm. This increases the emissivity of the surface and improves the contrast of the IR im-age. Furthermore due to constraints with the optical access the IR imaging has been establishedthrough a reflection at the upper wall of the test section, which had been polished beforehand. IRthermography has only been used in the first part of the wind tunnel tests that correspond to theuncontrolled case. In the second part of the tests dedicated to control an unpainted surface wasused instead and the laminar quality of the flow was checked using a laminar pattern in the pressuredistribution at the upper surface of the airfoil. The possibility to use pressure distribution to checkfor flow laminarity is explained in the present paper.
An individual test in the present experiment is described by the freestream Mach number, theangle of attack of the wing and the position of the tripping that is installed at the upper surface ofthe wing. In the following any tests will hence be characterized by the set of parameters (M,α, tr)with M the Mach number, α the angle of attack of the wing and tr the location of the trippingtape on the upper surface in percent of chord from the leading edge. The case tr = 0 means freetransition, i.e. no tripping is used. Furthermore an indication of the presence of paint (w/) or not(w/o) is given when necessary, as this is shown to play a role in the flow dynamics.
The first diagnostic is performed with a Schlieren visualization of the flow, on the basis of ahigh-speed recording (Phantom camera) at a frame rate equal to 6006 frame per second (fps),exposure time of 1µs and 16bits resolution per pixel (px). The size of the sensor is 800px × 600px.The intensity of the Schlieren visualisations results from an integration process of the light beamsdeflected by the variations in refractive index perpendicular to the knive edge that are caused bythe flow [42]. For a gas refractive index is linearly related to flow density with the Gladstone-Daleconstant [32]. Here the knive is set vertically and the Schlieren images show the field of I = ∂ρ
∂xthat primarily highlights the shock wave and the flow structures that form downstream.
The wing is equipped with pressure taps and sensors, as illustrated in figure 2. Sensors and tapsare aligned along two different lines which are inclined about the free stream at an angle largerthan 7 degrees (the typical angle of a turbulent wedge, as obtained in the present test, see figure 1)to prevent cross-contamination and early transition to turbulence. For similar reasons the fore part(20%) of the wing is free of any equipment. From 40% of chord, sensors and taps at the uppersurface are almost uniformly distributed at a spacing equal to 3-4% of chord. The lower surface isequipped with a few devices.
5
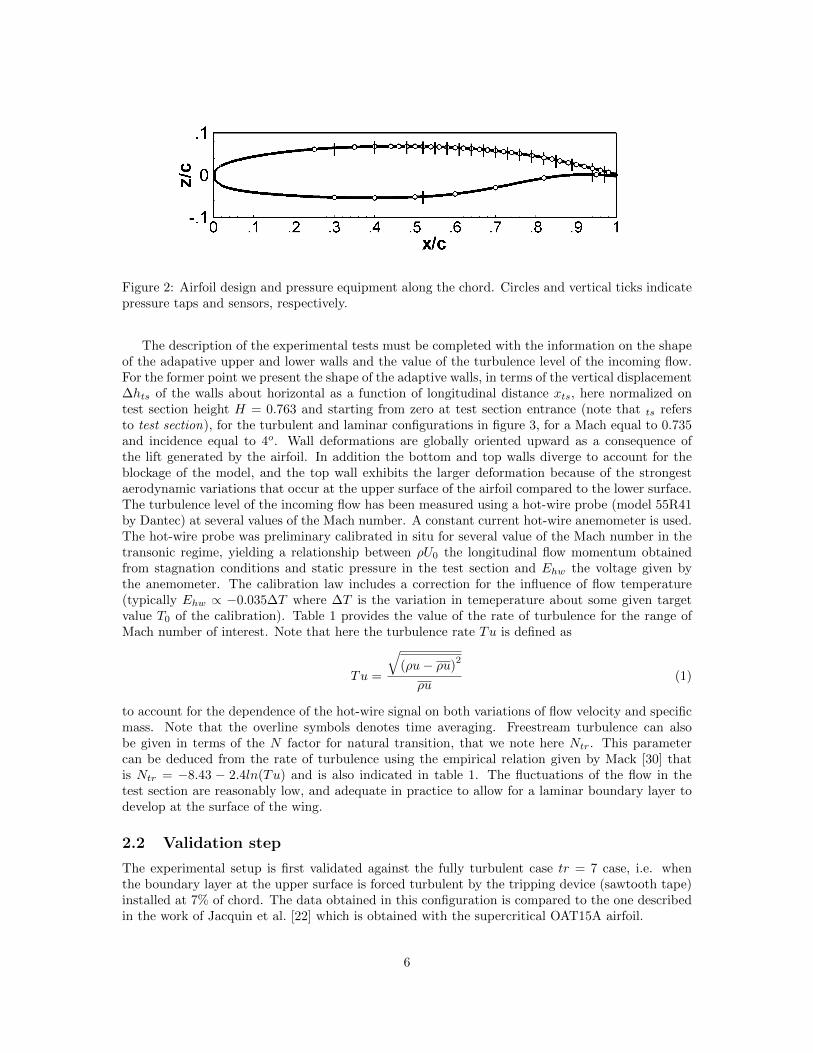
Figure 2: Airfoil design and pressure equipment along the chord. Circles and vertical ticks indicatepressure taps and sensors, respectively.
The description of the experimental tests must be completed with the information on the shapeof the adapative upper and lower walls and the value of the turbulence level of the incoming flow.For the former point we present the shape of the adaptive walls, in terms of the vertical displacement∆hts of the walls about horizontal as a function of longitudinal distance xts, here normalized ontest section height H = 0.763 and starting from zero at test section entrance (note that ts refersto test section), for the turbulent and laminar configurations in figure 3, for a Mach equal to 0.735and incidence equal to 4o. Wall deformations are globally oriented upward as a consequence ofthe lift generated by the airfoil. In addition the bottom and top walls diverge to account for theblockage of the model, and the top wall exhibits the larger deformation because of the strongestaerodynamic variations that occur at the upper surface of the airfoil compared to the lower surface.The turbulence level of the incoming flow has been measured using a hot-wire probe (model 55R41by Dantec) at several values of the Mach number. A constant current hot-wire anemometer is used.The hot-wire probe was preliminary calibrated in situ for several value of the Mach number in thetransonic regime, yielding a relationship between ρU0 the longitudinal flow momentum obtainedfrom stagnation conditions and static pressure in the test section and Ehw the voltage given bythe anemometer. The calibration law includes a correction for the influence of flow temperature(typically Ehw ∝ −0.035∆T where ∆T is the variation in temeperature about some given targetvalue T0 of the calibration). Table 1 provides the value of the rate of turbulence for the range ofMach number of interest. Note that here the turbulence rate Tu is defined as
Tu =
√(ρu− ρu)
2
ρu(1)
to account for the dependence of the hot-wire signal on both variations of flow velocity and specificmass. Note that the overline symbols denotes time averaging. Freestream turbulence can alsobe given in terms of the N factor for natural transition, that we note here Ntr. This parametercan be deduced from the rate of turbulence using the empirical relation given by Mack [30] thatis Ntr = −8.43 − 2.4ln(Tu) and is also indicated in table 1. The fluctuations of the flow in thetest section are reasonably low, and adequate in practice to allow for a laminar boundary layer todevelop at the surface of the wing.
2.2 Validation step
The experimental setup is first validated against the fully turbulent case tr = 7 case, i.e. whenthe boundary layer at the upper surface is forced turbulent by the tripping device (sawtooth tape)installed at 7% of chord. The data obtained in this configuration is compared to the one describedin the work of Jacquin et al. [22] which is obtained with the supercritical OAT15A airfoil.
6
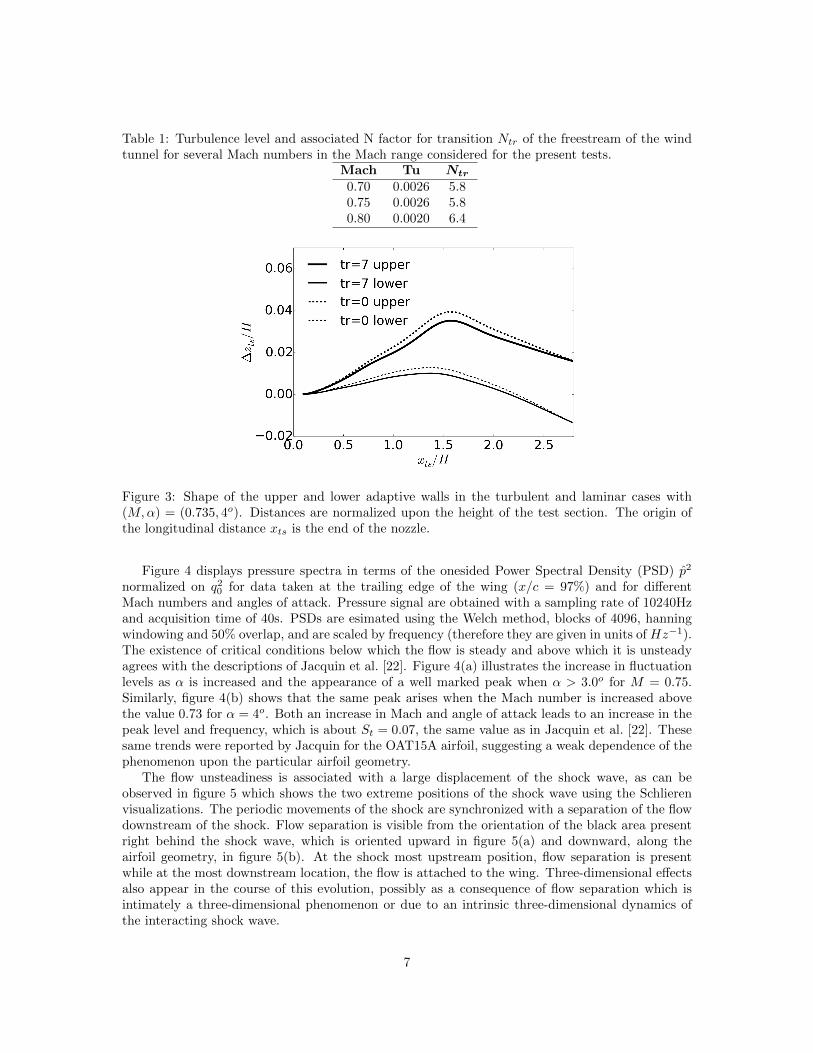
Table 1: Turbulence level and associated N factor for transition Ntr of the freestream of the windtunnel for several Mach numbers in the Mach range considered for the present tests.
Mach Tu Ntr
0.70 0.0026 5.80.75 0.0026 5.80.80 0.0020 6.4
Figure 3: Shape of the upper and lower adaptive walls in the turbulent and laminar cases with(M,α) = (0.735, 4o). Distances are normalized upon the height of the test section. The origin ofthe longitudinal distance xts is the end of the nozzle.
Figure 4 displays pressure spectra in terms of the onesided Power Spectral Density (PSD) p2
normalized on q20 for data taken at the trailing edge of the wing (x/c = 97%) and for differentMach numbers and angles of attack. Pressure signal are obtained with a sampling rate of 10240Hzand acquisition time of 40s. PSDs are esimated using the Welch method, blocks of 4096, hanningwindowing and 50% overlap, and are scaled by frequency (therefore they are given in units of Hz−1).The existence of critical conditions below which the flow is steady and above which it is unsteadyagrees with the descriptions of Jacquin et al. [22]. Figure 4(a) illustrates the increase in fluctuationlevels as α is increased and the appearance of a well marked peak when α > 3.0o for M = 0.75.Similarly, figure 4(b) shows that the same peak arises when the Mach number is increased abovethe value 0.73 for α = 4o. Both an increase in Mach and angle of attack leads to an increase in thepeak level and frequency, which is about St = 0.07, the same value as in Jacquin et al. [22]. Thesesame trends were reported by Jacquin for the OAT15A airfoil, suggesting a weak dependence of thephenomenon upon the particular airfoil geometry.
The flow unsteadiness is associated with a large displacement of the shock wave, as can beobserved in figure 5 which shows the two extreme positions of the shock wave using the Schlierenvisualizations. The periodic movements of the shock are synchronized with a separation of the flowdownstream of the shock. Flow separation is visible from the orientation of the black area presentright behind the shock wave, which is oriented upward in figure 5(a) and downward, along theairfoil geometry, in figure 5(b). At the shock most upstream position, flow separation is presentwhile at the most downstream location, the flow is attached to the wing. Three-dimensional effectsalso appear in the course of this evolution, possibly as a consequence of flow separation which isintimately a three-dimensional phenomenon or due to an intrinsic three-dimensional dynamics ofthe interacting shock wave.
7

(a) (b)
Figure 4: Power Spectral Density of pressure normalized on free stream dynamic pressure q0 atx/c = 97%. Influence of (a) angle of attack when M = 0.75 and (b) Mach number when α = 4o onthe shock dynamics in the turbulent tr = 7 case.
(a) (b)
Figure 5: Schlieren visualizations of the flow in the turbulent case tr = 7. Shock wave in (a) mostupstream and (b) most downstream position.
3 Analysis and laminar results
3.1 Exploration of the laminar dynamics
A preliminary exploration of the laminar dynamics is obtained by removing the tripping tape fromthe previous turbulent situation. Figure 6 compares the previous turbulent tr = 7 and the nowlaminar tr = 0 cases in terms of pressure distribution and PSD for (M,α) = (0.735, 4o). It isobserved that the laminar case deviates significantly from the turbulent case. First the shockwave is located at a much more downstream location, shifting from approximately 50% of chord(on average) for tr = 7 to 60% of chord for tr = 0. The pressure plateau is also higher in thelaminar case which indicates a stronger increase of the velocity at the upper surface. Finally thelongitudinal extent of the slope of the pressure increase associated with the shock wave is steeperin the laminar case. This indicates that the shock exhibits weaker oscillations, since it is knownthat shock oscillations lead to a smearing of the shock signature in the pressure distribution.
Pressure PSD in figure 6(b) show that the flow also exhibits an unsteadiness in the laminar
8

case, with a dominant peak at a normalized frequency St = 1.1 which is to be compared to thevalue St = 0.07 associated with the turbulent case. Two harmonics of the main frequency peak aresimilarly observed in the two configurations (turbulent and laminar) and the primary peak levelsare approximately equal. In addition to the main peak, a low frequency bump is also apparent inthe laminar case at about St = 0.05.
(a) (b)
Figure 6: Comparison between turbulent tr = 7 and laminar tr = 0 configurations. (a) Chord-wisetime averaged pressure distributions. (b) PSD of the pressure signals in the laminar and turbulencecases, sensor location being x/c = 73%.
A Fourier analysis of the Schlieren images I(x, z, t) in the laminar tr = 0 case reveals the sametwo dominant unsteady modes that were captured by the pressure spectra. Figure 7 shows the PowerSpectral Density of |I|(x, z, f) for the low and high frequency modes, that is St = 0.05 and St = 1.1,and the PSD as function of normalized frequency considering the maximum PSD intensity at eachfrequency. This spectrum exhibits the low frequency mode, and the high frequency mode, with itsfirst harmonics. The low frequency mode is distributed along the shock wave and corresponds toa low frequency oscillations of the shock wave in the chordwise direction. The oscillations of theshock induced by this mode, typically on the order of 5% of chord, are well observed when theSchlieren snapshots are animated (not shown). The high frequency mode shows that the dominantmode affects the bottom part of the shock wave, and features an upward travelling wave along theshock, which can be guessed from the two vertically aligned lobes that are present on top of it.
Overall this preliminary comparison of the turbulent and laminar dynamics establishes thatlaminarity strongly affects the aerodynamics of the airfoil, in terms of forces as is apparent fromthe difference in pressure distributions and in terms of flow dynamics as the laminar case introducesa reduced low frequency mode and a dominant high frequency mode, the latter being not presentin the turbulent case. This shift in the dynamics is associated with a much smaller extension ofthe shock movement in the chordwise direction and an intense dynamics of the shock foot. Thedominant modes of the laminar setting at M = 0.735 are at St = 0.05 and St = 1.1, which mustbe compared to the turbulent tr = 7 case which features St = 0.07. The low frequency dynamicsof the laminar case resembles that of the turbulent case, although the shock movement is muchweaker and involves a wider range of frequencies.
3.2 Effect of Mach number and angle of attack
In this section the variations of the laminar flow with M and α are presented. Figure 8 shows theeffect of angle of attack and Mach number on the evolution of time averaged pressure along theairfoil in the laminar tr = 0 case. In figure 8(a) the angle of attack is varied from 1.5o to 4o at
9

Figure 7: Fourier analysis of the recording of the Schlieren visualizations showing in (top left) thePSD mode at St = 0.05, in (top right) the PSD mode at St = 1.1 and in (bottom) the PSD ofSchlieren image intensity, considering maximum intensity at each frequency maxx,z|I| (and scaledto one) as a function of normalized frequency. The airfoil contour is shown in the top frames forclarity.
M = 0.735. As α increases the flow at the suction side accelerates more. This strengthens theshock wave and pushes it further downstream. In fact only a weak variation of the shock locationis observed above α = 2.5o, with the maximum value being about 60% of chord. The region aheadof the shock exhibits a plateau which corresponds to the rather flat geometry of the first half ofthe suction surface (see figure 2). Above α = 3.5o the shock starts to spread in the streamwisedirection and flow separation is apparent at the trailing edge as the mean Cp moves away from thevalue adopted at lower incidences.
The increase in Mach number evaluated by figure 8(b), for α = 4o, shows that as M rises theshock is moved downstream but only weakly strengthened. The shock position locks at the 60%position reported previously above M = 0.73 and starts to spread as the Mach is further increased.For this incidence of 4o the increase in Mach number causes a lower plateau level ahead of the shockwhich indicates that lift is being reduced. This agrees with the flow separation that is evidencedby the increase in Cp level at the trailing edge for the highest Mach number value.
The effect of Mach number and angle of attack on the shock dynamics is illustrated in the PSDof pressure plotted in figure 9 with the pressure delivered by the sensor located at x/c = 97%. Itappears that an increase in M or α leads to a reduction of the frequency of the high frequency mode.This is opposite to the turbulent case and in agreement with the results obtained by Finke [18].
10
(a) (b)
Figure 8: Time averaged pressure distribution for the laminar tr = 0 case. Effect of (a) angle ofattack for M = 0.735 and (b) Mach number for α = 4o.
(a) (b)
Figure 9: Power Spectral Density of pressure fluctuations at the location x/c = 97%. Effect of (a)angle of attack for M = 0.735 and (b) Mach number for α = 4o.
In figure 9(b) the low frequency peak can be observed for M = 0.75. Figure 10 shows morespecifically the evolution of this low frequency peak as a function of angle of attack and Machnumber. The low frequency peak is seen to increase in amplitude and frequency as either M or αare increased. It must be noted that this matches the behavior of the turbulent buffet phenomenondescribed by Jacquin et al. [22] and the results of Finke [18]. Lastly figure 9 and figure 10 showthat the low frequency peak arises at larger values of α and M than the high frequency mode.
3.3 Laminar separation bubble
Figure 11 shows the evolution of the mean pressure coefficient along the suction surface when Cp isreferenced about the value Cp0 taken at x/c = 30% in the plateau region where pressure levels varylittle and the x coordinate is offset with respect to the mean location of the shock wave xshock. Thelatter is approximated as the location of the chord-wise maximum of the time averaged pressurevariations. This particular choice allows to automatically locate the shock wave in the data. Thedata is shown for the turbulent tr = 7 and laminar tr = 0 cases and highlights two importantfeatures of the laminar case. The first one is the presence of a pressure rise ahead of the shock wavewhich is absent in the turbulent case. From literature (see Schlichting [41]) it appears that this
11

(a) (b)
Figure 10: Power Spectral Density of pressure fluctuations at x/c = 97%. Zoom in the low frequencydomain and analysis of the effect of (a) angle of attack at M = 0.75 and (b) Mach number at α = 4o.
behavior is typical of a laminar separation in a supersonic flow. This pressure rise is followed by apressure plateau prior to the strong compression associated with the shock wave. The behavior ofthe flow in such a circumstance is described by the free interaction theory by means of empiricalcorrelations, see for instance Babinsky and Harvey [3]. Figure 11(b) shows that the pressure curvesfeature all this pre-compression pattern. Therefore it appears that the laminar separation is presentfor all the Mach numbers investigated.
(a) (b)
Figure 11: Evolution of the time averaged pressure in the regon of the shock. Analysis of theeffect of increasing Mach number for the (a) turbulent and (b) laminar case. The x coordinates isreferenced to the position of the shock xshock, taken here as the location of maximum variation inthe time averaged pressure. The pressure coefficient is referenced about the pressure coefficient Cp0taken at x/c = 30%.
A close-up view of the region where pressure starts to rise is displayed in figure 12. In thisfigure, pressure is normalized on the minimum pressure pmin that occurs ahead of the shock waveand not on free stream properties like in figure 11(b) while axial distance remains referenced aboutthe mean shock location xshock. This makes the curves start all from the same level ahead ofthe laminar separation and the curve nicely arrange on top of one another in the plot. It allowsthen to compare the current setup with the free interaction theory that predicts that the level ofpressure in the plateau region pplateau increases with the skin friction coefficient at separation and
12

decreases with the Mach number outside the boundary layer. The main effect is expected to bethat of the Mach number, the position of the shock wave and the Reynolds number, that scale thefriction coefficient, varying little in the current configuration. The decrease of the pressure levelin the plateau in figure 12 as the upstream Mach number increases therefore agrees with the freeinteraction theory, which reinforces the claim that the laminar separation in the current flow issimilar to the pattern generally found in laminar shock wave boundary layer interactions.
The second feature to be observed in figure 11 is that the pressure increase due to the shockis larger in the laminar than in the turbulent case. This is to be related to the more downstreamlocation of the shock in the laminar case, as seen in figure 6. An important consequence of theincreased shock strength in the laminar case is that it should lead to higher wave drag and thus couldpenalize the benefit of the laminar stream passing by the airfoil. This consequence is important tobear in mind in case a practical application of such a system were to be attempted.
Figure 12: Same as figure 11(b) but with the pressure referenced to the minimum pressure pmin inthe plateau region before the laminar separation, and normalized upon pmin.
3.4 Laminar separation bubble
In this section we detail visualizations of the laminar separation bubble that were made usingcondensed humidity as a flow tracer. The process goes as follows. Without input of dry air intothe wind tunnel flow stream, flow acceleration at the body surface and the associated temperaturedecrease can lead to condensation and formation of water droplets. In the present analysis thiswas implemented by turning off the humidity control of the wind tunnel. A laser illumination(identical to the one used for Particle Image Velocimetry), flashing at 4Hz, of a plane aligned withthe flow and vertical above the top surface of the airfoil was then used to visualize the behavior ofthese water droplets. Figure 13 shows a zoom of the flow close to the suction side in the laminarseparation region. What is seen are the water droplets passing above the surface and leaving a darkregion free of any seeding right above the surface. Unlike previous tests, in these flow experimentswith condensed water the surface of the wing is not painted and the smooth metal surface playsthe role of a mirror. This explains why the image appears symmetric. Therefore only the top partis of interest, and the curve delineating the symmetry axis is in fact the top surface of the airfoil.
The height of the separation is on the order of 1mm. Attemps to qualify it using PIV were ruinedby the intense light reflections at the wall, which could not be sufficiently removed and preventedany measurements in the bubble region. The current method with natural seeding proved to be freeof these reflections and to allow for the visualization of the bubble separating streamline, thanksto the important contrast between the recirculation region without droplets and the region above,filled with droplets. It is thought that this contrast is also helped by the rather larger size of these
13

droplets compared to PIV seeding, which allows intense scattering of the laser light. A side effectis that the inertia of these particles being more pronounced their use as tracers may be affected.However owing to the mostly longitudinal motion of the flow in the region of interest, and the factthat the gradient imposed by the shock is almost normal to the particles trajectories, this effectdoes not seem detrimental to observe the separating streamline of the bubble.
The absence of seeding in the laminar separation bubble is a well known phenomenon (seeGiepman et al. [19]) and seems to be the consequence of the low diffusion rate of particles at theinterface of the bubble in the laminar regime. In the present case, one has also to consider thecondensation process to explain why condensation occurs in the upstream boundary layer and notin the bubble. For a stationary bubble, and from a general perspective, the mechanism could be thatthe recirculating fluid gets warmer due to its friction at the wall and its persistence in the bubble,which prevents the condensation of humidity, contrary to the external flow which is persistently fedby humid and cold (due to the flow acceleration at the airfoil suction side) air. In the unsteadycase, it is known (see for instance Piponniau et al. [35]) that the bubble exchanges fluid with theabove flow. However, this occurs at the rear of the bubble where the fluid is also warmer andcharacterized by a lower concentration of particles due to turbulent diffusion. It thus appears fromthis analysis that the droplets physically remain above the separating streamline at the fore partof the bubble and that the separation between the seeded and the unseeded zones can be used todelineate the locus of this separating streamline.
To analyze the behavior of the bubble figure 13 hence shows a sequence of this naturally seededflow passing above the bubble. This sequence shows several realizations of the bubble separatingstreamline, that are uncorrelated since laser flashes at 4Hz. One can observe the separation of theboundary layer at the left, the development of the separated flow, with the recirculation belowand the external flow above, and the development of turbulence through the action of the Kelvin-Helmholtz (KH) instability. The latter is evidenced by the wavy deformations of the separatingstreamline at the top of the recirculation region and the formation of large scale eddies. Thissequence suggests that one of the mechanism of the high frequency peak may be the destabilizationof the laminar separation bubble.
3.5 Effect of surface roughness
Surface roughness has been sampled at several locations on the wing upper and lower surfaceswith and without paint. The surface roughness measuring instrument is the Mitutoyo SurftestSJ-301 instrument that scans over a length of 4mm at a speed of 0.5mm/s and delivers as rough-ness parameters the arithmetical mean Ra, the root mean square Rq and the average distancebetween a selection of highest peaks and lowest valleys Rz according to the Japanese IndustrialStandard JIS2001. Table 2 indicates the results averaged over the ensemble of sampling locationsfor the different roughness situations. In particular the case with paint comprises a preliminaryraw configuration that was found to generate an early transition of the boundary layer and wasthen sandpapered to reduce roughness. This successfully allowed the laminar state up to the shockwave. Generally the table indicates that a Ra value larger than roughly 2µm leads to the transitionof the boundary layer upstream of the shock wave. In details the investigation does not allow todifferentiate the effects of mean and maximum roughness but gives indication on the typical level ofroughness needed to allow the laminar boundary layer for the current setting and Reynolds number,i.e. Ra,Rq = 0.1− 1µm and Rz < 10µm.
It was further discovered that the presence of paint modifies the frequency of the shock unsteadi-ness as is illustrated in figure 14. This figure shows the case with paint and several cases withoutpaint. The noticeable change is that the frequency of the high frequency peak without paint is lowerthan with paint. The influence of Mach number is retained (frequency decreases as Mach increases).Several works (see Agostini et al. [2], Piponniau et al. [35] or Larcheveque et al. [25]) show thatthe frequency of the dynamics of a shock wave boundary layer interaction in presence of a mean
14

Figure 13: Laminar separation bubble visualized using naturally forming water droplets and laserflashes. The flow is for (M,α, tr) = (0.735, 4o, 0) and exhibits the high frequency peak.
separation at the shock foot scales on the bubble length. In the present situation the additionalroughnesses with the paint introduce extra perturbations upstream of the laminar separation thatare expected to drive a faster establishment of turbulence in the interaction and thus a more rapidreattachment of the flow. The bubble must accordingly be smaller and the associated frequency,which following this theory, would scale as the inverse of this distance, to be higher, as is observed.
4 Flow control
Two control strategies have been tested to increase the stability of the flow: three-dimensionalbumps and steady jets. These devices have been developped in a separate and preliminary investi-gation that is not described here. The design of the bumps and jets is schematized in figure 15.
The jet configuration has been designed for the test case (M,α, tr) = (0.74, 4o, 0). The jetsare located at 56.5% of chord slightly upstream of the shock wave which is at 60% of chord. Jetsare oriented at pitch and toe angle of 30 and 90 degrees respectively. This inclination of the jetsabout the stream above the surface of the wing causes the generation of longitudinal vortices, theeffect of which tends to reduce flow separation behind the shock, as was previously observed forthe control of flow separation on a three-dimensional wing in the transonic regime, see Molton etal. [33]. The jet device comprises 75 jets uniformely distributed along the span, at intervals equal
15

Parameter w/o paint w/ paint (raw) w/ paint (sandpapered)Ra (µm) 0.3 2.4 1.6Rq (µm) 0.4 3.1 2.0Rz (µm) 1.75 14.7 9.0
laminar/turbulent laminar turbulent laminar
Table 2: Surface roughness parameters with and without paint and indication of the state of theboundary layer developing on the upper surface.
Figure 14: Power Spectral Density of the pressure fluctuations taken at x/c = 97%. Influence ofthe paint compared to the unpainted case. The unpainted case comprises several Mach numbers tovalidate that the same Mach influence (decrease of peak frequency with Mach number) is obtainedwith and without paint.
to λj = 20dj = 10mm where dj = 0.5mm is the jet diameter.
Figure 15: Schematics of the control devices. (a) three-dimensional bumps and (b) steady jets. Toprow : top view. Bottom row : airfoil section view.
Bumps have been originally introduced as a method to control transonic flows in order to reducewave drag, see Ashill et al. [9]. While wave drag at design conditions is usually minimized it strongly
16

increases at off-design conditions when either Mach number or angle of attack is increased. Thistransonic drag rise can be efficiently controlled with such bumps, that contour the airfoil in order todeflect the supersonic flow at the suction side and generate oblique shock waves ahead of the mainstraight shock, which creates a more isentropic transformation. Colliss et al. [10] and Bogdanskyet al. [7] showed that three-dimensional, finite-span bumps, on top of reducing wave drag, can alsobe advantageous to postpone buffet. The yet to be confirmed mechanism [7, 17, 9] would lie in theformation of longitudinal vorticity at the side flanks of the three-dimensional bumps, which helppreventing the flow from separating behind the shock wave.
In the present setting the bump device comprises 11 bumps uniformely distributed along thespan. Each bump features a wedge shape growing in width from the bump leading edge locatedat 46.2% of chord to the bump trailing edge located at 80% of chord. Maximum bump height isreached at the crest at the middle of the bump and equals 0.28% of chord, i.e. 6.44mm. The crestis 10% of chord wide and 3% of chord long, and starts 17% of chord from the bump leading edge.The bump trailing edge is 21.2% of chord wide.
4.1 Three-dimensional bumps
Figure 16 shows the pressure distribution about the airfoil with the bump installed compared to thebaseline (smooth) case. With the bumps, pressure was sampled along two separate lines, one at aspanwise location corresponding to the bump leading edge and another one in-between two bumps.It is observed that the bump slightly reduces shock strength, as is evidenced from the departure ofthe pressure distribution at the bump line compared to baseline and to the data taken in betweentwo bumps.
(a) (b)
Figure 16: Effect of the bumps on (a) the time averaged pressure distribution along the airfoil and(b) Power Spectral Density of pressure fluctuations at x/c = 64%. The flow case is (M,α, tr) =(0.73, 3.5o, 0).
Regarding flow unsteadiness, figure 16(b) shows that a reduction in intensity of the high fre-quency peak is achieved. Yet the flow unsteadiness is not fully suppressed. This reduction of theunsteadiness seems to validate the scenario following which three-dimensional bumps generate axialvorticity which is able to limit flow separation behind the shock wave. However these vortices areapparently not strong enough to fully control flow separation and cancel buffet.
17

4.2 Steady jets
The strength of the jets is controlled using the jet momentum coefficient given by
Cµ =ρjU
2j Sj
0.5ρU20Sref
(2)
where Sref is the reference surface taken here as the surface of the wing Sref = s × c, U0 is thevelocity of the freestream and ρ the specific mass of the air in the test section, Uj is the velocityof the jets obtained by assuming an isentropic transformation between plenum and outside, ρj thespecific mass of air in the jet and Sj the surface of the holes that form the jets. The value of Cµis obtained from the total mass flow rate going through the jets, which is the parameter which ismeasured and controlled during the tests. Mass flow rates from 0 to 9.5g/s have been tested, whichyield Cµ values from 0 to 0.075%.
Figure 17(a) shows the modification of the pressure distribution when the jets are activated.For sufficient momentum coefficient, Cµ > 0.065%, the pressure map is clearly modified and anincreased lift is achieved. From the PSD of pressure shown in figure 17(b), it can be observed thatthe jets are able to fully stabilize the flow. Indeed the high frequency peak is completely suppressedfrom the dynamics.
(a) (b)
Figure 17: Influence of Cµ with, in (a), the time averaged pressure distribution and in (b) PowerSpectral Density of pressure fluctuations. Laminar flow case (M,α, tr) = (0.735, 4o, 0).
The jets were also tested in the turbulent tr = 7 case and the results are shown in figure 18. Inthe turbulent case when buffet occurs, the jets lie behind the mean position of the shock wave whichis at about 50% of chord. Figure 18(a) shows the pressure distribution without and with control. Itis observed that a significant increase in lift is also achieved with the control in the turbulent case.This is related to the suppression of the buffet phenomenon, as can be observed in figure 18(b)where the low frequency peak of the turbulent buffet phenomenon has disappeared thanks to thejet blowing. Therefore the jets are also successful to stabilize the flow in the turbulent situation.
5 Conclusion
An experimental investigation of the transonic flow past a laminar wing has been accomplishedin order to investigate the effect of laminar flow on the buffet phenomenon. Results reveal theexistence of a critical phenomenon peculiar to the laminar case which occurs at a frequency aboutSt = 1.1, in sharp contrast with the turbulent buffet phenomenon which occurs at a frequency close
18

(a) (b)
Figure 18: Influence of Cµ with, in (a), the time averaged pressure distribution and in (b) the PowerSpectral Density of pressure fluctuations. Turbulent flow case (M,α, tr) = (0.735, 4o, 7).
St = 0.07. A similar low frequency dynamics is also shown to exist in the laminar case, yet ata slightly lower frequency St = 0.05. These low and high frequency modes look similar to thosefound by Finke [18] in particular the evolution of their frequency with Mach and angle of attackare consistent with Finke’s results. However the frequency of the high frequency peak is notablyhigher in the present case. It is difficult to say at this stage whether this is due to the differentairfoil geometry or if these are two different dynamics. It appears though that both are related tothe bubble dynamics.
An interesting feature is that the shock is stronger in the laminar configuration than in theturbulent one. Wave drag will hence certainly be higher in the laminar case. This means that theuse of laminar flows to reduce drag requires to take into account all the components of drag, notonly the benefit of reduced skin friction, to analyze the overall drag reduction.
Finally flow control has been tested in order to reduce the oscillations of the flow caused bythe high frequency peak, using two different control strategies, bumps and steady jet blowing. It isshown that bumps are able to reduce the intensity of the laminar buffet phenomenon. Jets appearas the most efficient technique as they allow a full stabilization of the flow in both the laminar andturbulent cases.
Acknowledgements
This work has been supported by the European FP7 Project BUTERFLI (FP7-AAT-2013.8-1-RTDRUSSIA) program. The authors would like to thank all the people who dedicated much oftheir time to make this experiment possible, in particular Jean-Pierre Tobeli, Jean-Charles Abart,Paul Paillart, Francois Lambert, Philippe Geffroy, Michel Vegran, Thierry Pot and Pascal Audo.
References
[1] Buffet and transition delay control investigated with european-russian cooperation for improvedflight performance. final report. https://cordis.europa.eu/docs/results/605/605605/final1-buterfli-final-report-complete-report.pdf. Accessed: 2018-10-23.
[2] L. Agostini, L. Larcheveque, and P. Dupont. Mechanism of shock unsteadiness in separatedshock/boundary-layer interactions. Physics of Fluids, 27(12):126103, 2015.
19

[3] H. Babinsky and J.K. Harvey. Shock wave-boundary-layer interactions, volume 32. CambridgeUniversity Press, 2011.
[4] G. Barakos and D. Drikakis. Numerical simulation of transonic buffet flows using variousturbulence closures. International Journal of Heat and Fluid Flow, 21(5):620–626, 2000.
[5] R. E. Bartels. Computation of shock buffet onset for conventional and supercritical airfoil. In35th AIAA Aerospace Sciences Meeting and Exhibit, number 97-0833, 1997.
[6] R.E. Bartels. Flow and turbulence modeling and computation of shock buffet onset for con-ventional and supercritical airfoils. 1998.
[7] S. Bogdanski, K. Nubler, T. Lutz, and E. Kramer. Numerical investigation of the influenceof shock control bumps on the buffet characteristics of a transonic airfoil. In New Results inNumerical and Experimental Fluid Mechanics IX, pages 23–32. Springer, 2014.
[8] V. Brion, J. Dandois, J.-C. Abart, and P. Paillart. Experimental analysis of the shock dynamicson a transonic laminar airfoil. Progress in Flight Physics–Volume 9, 9:365–386, 2017.
[9] P.J.K. Bruce and S.P. Colliss. Review of research into shock control bumps. Shock Waves,25(5):451–471, 2015.
[10] S.P. Colliss, H. Babinsky, K. Nubler, and T. Lutz. Vortical structures on three-dimensionalshock control bumps. AIAA Journal, pages 2338–2350, 2016.
[11] E.S. Cornette. Wind-tunnel investigation of the effects of wing bodies, fences, flaps, and afuselage addition on the wing buffet response of a transonic-transport model. 1961.
[12] J.D. Crouch, A. Garbaruk, D. Magidov, and A. Travin. Origin of transonic buffet on aerofoils.Journal of Fluid Mechanics, 628:357–369, 2009.
[13] J. Dandois. Experimental study of transonic buffet phenomenon on a 3d swept wing. Physicsof Fluids, 28(1):016101, 2016.
[14] Julien Dandois, Ivan Mary, and Vincent Brion. Large-eddy simulation of laminar transonicbuffet. Journal of Fluid Mechanics, 850:156–178, 2018.
[15] S. Deck. Numerical simulation of transonic buffet over a supercritical airfoil. AIAA journal,43(7):1556–1566, 2005.
[16] J.B. Dor, A. Mignosi, A. Seraudie, and B. Benoit. Wind tunnel studies of natural shockwave separation instabilities for transonic airfoil tests. In Symposium Transsonicum III, pages417–427. Springer, 1989.
[17] J.P. Eastwood and J.P. Jarrett. Toward designing with three-dimensional bumps for lift/dragimprovement and buffet alleviation. AIAA journal, 50(12):2882–2898, 2012.
[18] K Finke. Shock oscillations in transonic flows and their prevention. In Symposium Transson-icum II, Gottingen, September 8-13, 1975, page 57. Not Avail, 1976.
[19] RHM Giepman, FFJ Schrijer, and BW Van Oudheusden. High-resolution piv measurements ofa transitional shock wave–boundary layer interaction. Experiments in Fluids, 56(6):113, 2015.
[20] A. Hartmann, A. Feldhusen, and W. Schroder. On the interaction of shock waves and soundwaves in transonic buffet flow. Physics of Fluids, 25(2):026101, 2013.
20

[21] A. Hartmann, M. Klaas, and W. Schroder. Time-resolved stereo piv measurements of shock–boundary layer interaction on a supercritical airfoil. Experiments in fluids, 52(3):591–604,2012.
[22] L. Jacquin, P. Molton, S. Deck, B. Maury, and D. Soulevant. Experimental study of shockoscillation over a transonic supercritical profile. AIAA journal, 47(9):1985–1994, 2009.
[23] H. John. Critical review of methods to predict the buffet capability of aircraft. Technicalreport, DTIC Document, 1974.
[24] L.-E. Jones, R.-D. Sandberg, and N.-D. Sandham. Direct numerical simulations of forced andunforced separation bubbles on an airfoil at incidence. Journal of Fluid Mechanics, 602:175–207, 2008.
[25] L. Larcheveque. Low–and medium–frequency unsteadinesses in a transitional shock–boundaryreflection with separation. In 54th AIAA Aerospace Sciences Meeting, page 1833, 2016.
[26] B.H.K. Lee. Self-sustained shock oscillations on airfoils at transonic speeds. Progress inAerospace Sciences, 37(2):147–196, 2001.
[27] B.H.K. Lee and F.C. Tang. Transonic buffet of a supercritical airfoil with trailing-edge flap.Journal of Aircraft, 26(5):459–464, 1989.
[28] H.W. Liepmann. The interaction between boundary layer and shock waves in transonic flow.Journal of the Aeronautical Sciences, 2012.
[29] D.G. Mabey. Buffeting criteria for a systematic series of wings. Journal of Aircraft, 26(6):576–582, 1989.
[30] LM Mack. Special course on stability and transition of laminar flow. AGARD report, 709,1984.
[31] J. B. McDevitt and A. F. Okuno. Static and dynamic pressure measurements on a NACA0012 airfoil in the Ames high Reynolds number facility, volume 2485. National Aeronauticsand Space Administration, Scientific and Technical Information Branch, 1985.
[32] W. Merzkirch. Flow visualization. Elsevier, 2012.
[33] P. Molton, J. Dandois, A. Lepage, V. Brunet, and R. Bur. Control of buffet phenomenon ona transonic swept wing. AIAA journal, 51(4):761–772, 2013.
[34] E. Obert. Aerodynamic design of transport aircraft. IOS press, 2009.
[35] S. Piponniau, J.P. Dussauge, J.F. Debieve, and P. Dupont. A simple model for low-frequencyunsteadiness in shock-induced separation. Journal of Fluid Mechanics, 629:87–108, 2009.
[36] E.J. Ray and R.T. Taylor. Buffet and static aerodynamic characteristics of a systematic seriesof wings determined from a subsonic wind-tunnel study. 1970.
[37] T.A. Reyhner and I. Flugge-Lotz. The interaction of a shock wave with a laminar boundarylayer. International Journal of Non-Linear Mechanics, 3(2):173–199, 1968.
[38] F. Sartor, C. Mettot, and D. Sipp. Stability, receptivity, and sensitivity analyses of buffetingtransonic flow over a profile. AIAA Journal, 53(7):1980–1993, 2014.
[39] F. Sartor and S. Timme. Delayed detached–eddy simulation of shock buffet on half wing–bodyconfiguration. AIAA Journal, pages 1–11, 2016.
21

[40] H. Schlichting and K. Gersten. Boundary-layer theory. Springer Science & Business Media,2000.
[41] H. Schlichting, K. Gersten, E. Krause, H. Oertel, and K. Mayes. Boundary-layer theory,volume 7. Springer, 1960.
[42] G.S. Settles. Schlieren and shadowgraph techniques: visualizing phenomena in transparentmedia. Springer Science & Business Media, 2012.
[43] Ante Soda. Numerical investigation of unsteady transonic shock/boundary-layer interactionfor aeronautical applications. PhD thesis, RWTH Aachen, 2007.
[44] Q. Xiao, H. Tsai, and F. Liu. Numerical study of transonic buffet on a supercritical airfoil.AIAA journal, 44(3):620–628, 2006.
22