Embed Size (px)
Citation preview
LAMBOO RESOURCES LIMITED ABN 27 099 098 192
FINANCIAL REPORT
FOR THE YEAR ENDED 30 JUNE 2015
For
per
sona
l use
onl
y

1
CORPORATE DIRECTORY Board of Directors Neville Miles Non-Executive Chairman Anthony Cormack Executive Director and CEO Garry Plowright Non-Executive Director
Company Secretaries
Leni Stanley Brent Van Staden
Registered Office Level 16 344 Queen Street Brisbane QLD 4000 GPO Box 363 Brisbane QLD 4001 Telephone: +61 7 3221 6022 Email: [email protected] Website: www.lambooresources.com.au
Management Office Level 1 5 Kingscote Street Kewdale WA 6105 Telephone: +61 427 349 451
Auditors BDO Audit Pty Ltd Level 10, 12 Creek Street Brisbane QLD 4000 Telephone: 07 3237 5999 Fax: 07 3221 9227 Website: www.bdo.com.au
Share Registry BoardRoom Pty Limited Level 12 225 George Street Sydney NSW 2000 Telephone: 1300 737 760 Facsimile: 1300 653 459 Website: www.boardroomlimited.com.au
For
per
sona
l use
onl
y

2
CONTENTS
Chairman’s Report 3
Directors’ Report 4
including: Review of Operations 8 Remuneration Report 49
Auditors Independence Declaration 57
Interests in Exploration Tenements 58
Mineral Resources & Ore Reserves (MROR) Statement 59
Statement of Comprehensive Income 61
Balance Sheet 62
Statement of Changes in Equity 63
Statement of Cash Flows 64
Notes to the Financial Statements 65
Directors Declaration 92
Additional Stock Exchange Information 93
Independent Auditor’s Report 94
For
per
sona
l use
onl
y

3
CHAIRMAN’S REPORT Dear Shareholders, I would like to firstly thank our loyal shareholders for their continued support in the company. The team at Lamboo have spent the last 9 months working to substantially upgrade both the South Korean and Australian assets and improve the way we operate. Our share price however has not reflected this. Looking back, 2014/15 was a year of transition for Lamboo. In the first half the board was fully focused on the Hengda transaction which did not complete. Post this transaction falling through, the company was faced with a cash problem and reputation problem that led it to raise cash via issuing a convertible note. The second half was also challenging, with a lot of board focus on topics that were not directly related to moving our Projects forward. A few of the more important topics include:
a) Substantial focus was put on trying to recover the non-bank escrowed $US2M deposit. b) Cleaning up the Companies Governance Practices. c) Cutting many unsustainable costs the company was faced with (examples include offices in Hong Kong
and South Korea) d) Closing out the Convertible Note.
These changes led to a new board, a much strengthened governance model, and cost savings for everything that was not related to getting moving Projects forward. On top of this Lamboo had no core samples in storage in order to further negotiate with potential offtake partners. During the second half the team was able to progress the Heritage study in order to prepare for additional drilling at McIntosh. The board made the decision not to run both McIntosh and Geunum in parallel and to focus the efforts on moving McIntosh forward whilst progressing Geunum as our second project in the pipeline. This is significant because aggressively exploring both projects was burning through cash whilst the board knew that also funding through to production both projects simultaneously would be impossible. Both projects remain a going concern for the company with both producing exciting results during the year. Looking forward, post year-end, Lamboo is in a strong cash position, has completed a substantial drilling program and had some preliminary impressive results in both metallurgy and in the drilling assays. We will now focus the next months on:
a) Updating the JORC resource for McIntosh b) Revising the Scoping Study to incorporate the excellent results from T4, T5 and T6 c) Investigating how we can explore the anomalies found in T4. d) Using the material from the recent program in further discussions with potential offtake partners.
As we move into the second half of the financial year the focus will shift into looking into funding models to bring McIntosh into production as well as taking the necessary steps towards production, many of which work have already been initiated. In closing, the year has been challenging for all of us whether shareholders or the team at Lamboo. But I believe the company has turned a substantial corner and with the leadership of our CEO, Tony Cormack, we are taking the necessary steps focused on getting this high grade, flake graphite out of the ground and in the hands of Offtake partners. Whilst there are still many unknowns such as the promises of an explosion in battery usage and graphene, the team will continue to work to our goal of producing graphite at both of our exciting projects and maximising shareholder return. Thank you. Neville Miles Chairman
For
per
sona
l use
onl
y
4
DIRECTORS' REPORT Your Directors present their report on Lamboo Resources Limited (the Company) and its controlled entities (the Consolidated Entity) for the year ended 30 June 2015. DIRECTORS The names and details of the Directors of Lamboo Resources Limited in office at the date of this report or at any time during the financial year are: Current Directors:
Name Position Period of Directorship
Neville Miles Non-Executive Chairman Appointed 9 December 2014
Anthony Cormack Executive Director and CEO Appointed 17 December 2014
Garry Plowright Non-Executive Director Appointed 10 June 2015
Past Directors: Name Position Period of Directorship
Alvars Lee Hon Nam Non-Executive Director Appointed 11 September 2014, Resigned 26 May 2015
Richard Trevillion Managing Director and CEO Appointed 20 December 2010, Resigned 16 April 2015
Wenzhao Xie Non-Executive Director Appointed 1 August 2014, Resigned 19 December 2014
Bruce Preston Non-Executive Chairman Appointed 6 January 2014, Resigned 9 December 2014
Greg Baynton Former Non-Executive Director Appointed 6 January 2014, Resigned 11 September 2014
Information of directors The following information is current as at the date of this report.
Neville Miles B.E.(Electrical) UNSW, MAICD Non-executive ChairmanExperience and expertise
Mr. Miles is Singapore based, where he is currently COO of Invicara, an IT company providing solutions to the building industry. Mr Miles has strong corporate experience in business strategy, strategy execution and marketing. Mr Miles has extensive senior management experience, having run a variety of businesses for Siemens internationally for over 15 years. These include large operational businesses in a variety of fields and in a number of regions globally, including China. Most recently, he was head of SmartGrid Applications, Asia Pacific, where he dealt with Energy Storage and Distribution (industrial battery storage and eCar) initiatives.
Other current directorships
None
Former directorships in last 3 years
None
Special responsibilities Chairman Interests in shares and options
Direct – Ordinary shares – 1,104,860 Indirect - Ordinary shares – 537,383
Anthony (Tony) Cormack B.Sc.(Geology) MAusIMM Executive director and Chief Executive Officer Experience and expertise
Mr. Cormack is a geologist with more than 20 years’ experience in the exploration and mining industry in Western Australia. Mr Cormack has held a number of senior roles including Resource Development Manager with Atlas Iron, and Geology Team Leader for BHP Billiton’s Area C Project, and has gathered extensive experience in a broad range of commodities including gold, nickel, tantalum, iron and graphite. Mr Cormack was employed as the company’s Operations Manager prior to being appointed to the Board.
Other current directorships
None
Former directorships in last 3 years
None
Special responsibilities Chief Executive Officer Interests in shares and options
Indirect - Ordinary shares – 270,359
For
per
sona
l use
onl
y

5
Garry Plowright Non-executive director Experience and expertise
Mr. Plowright is an experienced executive with over 25 years’ experience in commercial and technical development within the mining and exploration industry, working for some of Australia’s leading resource companies. He had been involved in gold, base metals and iron ore exploration and mining development projects in Australia and worldwide. Previous experience with the supply and logistics of services to the mining and exploration industry including capital raising, corporate governance and compliance, project management, mining and environmental approvals and regulations, contract negotiations, tenure management, land access, stakeholder and community engagement. Mr Plowright has extensive experience in mining law and has provided services to the industry in property acquisitions, project generation and joint venture negotiations. Mr Plowright has held global operational and corporate roles with Gindalbie Metals Ltd, Mt Edon Gold Ltd, Pacmin Mining, Atlas Iron Ltd, Tigris Gold (South Korea) and Westland Titanium (New Zealand). He has a strong background in strategic management, business planning, building teams, capital/debt raising, and experience with a variety of commodities.
Other current directorships
None
Former directorships in last 3 years
None
Special responsibilities None Interests in shares and options
Nil
Company Secretaries The names and details of the Company’s key management personnel during the financial year and until the date of this report are as follows: Leni Stanley Company Secretary Leni Stanley, CA, B.Com., is the principal of a chartered accounting firm. Ms Stanley has extensive experience in publicly listed company administration and holds similar positions with other ASX listed companies. Brent Van Staden Company Secretary Brent Van Staden is a corporate lawyer with more than 15 years’ experience. Mr Van Staden has advised multiple resource companies on their initial public offerings, secondary capital raisings, project acquisitions and general compliance. Mr Van Staden has a Bachelor of Laws (Hons) and Masters of Law degrees in Tax and Commercial Law and is admitted to practice in Queensland, New South Wales, England and Wales, and South Africa. MEETINGS OF DIRECTORS The following table sets out the number of meetings of the Company’s Directors held during the year ended 30 June 2015 and the number of meetings attended by each Director.
Meetings attended Eligible to attendNeville Miles 29 31 Anthony Cormack 31 31 Garry Plowright 1 2 Bruce Preston 1 1 Richard Trevillion 23 24 Greg Baynton 1 1 Wenzhao Xie 0 2 Alvars Lee Hon Nam 26 26
There are no committees of directors. All relevant matters are considered by the Board.
For
per
sona
l use
onl
y

6
CORPORATE INFORMATION Lamboo Resources is a company limited by shares, incorporated and domiciled in Australia whose shares are publicly traded on the Australian Securities Exchange (ASX). Lamboo Resources has prepared a consolidated financial report encompassing the entities that it controlled during the financial year (see note 25). NATURE OF OPERATIONS AND PRINCIPAL ACTIVITIES During the course of the year the principal activity of the Consolidated Entity was mineral exploration on its projects in Western Australia, New South Wales and South Korea. ENVIRONMENTAL REGULATION AND PERFORMANCE The Company’s operations are subject to environmental regulations in relation to its exploration activities. The Directors are not aware of any significant breaches during the period covered by this report. CURRENCY The financial report is presented in Australian dollars and amounts are rounded to the nearest dollar. FINANCIAL REVIEW Capital Structure At 30 June 2015 the Company had 171,211,687 ordinary shares, 10,000,000 performance rights and 12,637,835 options on issue. Subsequent to the end of the financial year the Company has issued 34,242,560 shares under a rights issue raising $2,054,554. In addition, since the end of the financial year 4,387,835 unlisted options have expired and the 10,000,000 shares have been issued on the conversion of performance rights. Treasury Policy The Board controls the funds which are handled on a day to day basis by the Company Secretary. Dividends No dividends were paid during the financial year ended 30 June 2015 (2014: nil) and no dividend is recommended for the current year. Operating Results Comparison with Prior Year For the year ended 30 June 2015, the loss for the Consolidated Entity after providing for income tax was $5,693,038 (2014: loss of $1,888,768). The Company received a research and development income tax concession of $856,696 (2014: $1,248,013) and drilling grants of $98,403 (2014: $150,000) during the year which were offset against capitalised exploration expenditure. Revenue As an early stage exploration company, Lamboo Resources Limited does not generate any income other than interest on its cash holdings and some minor consulting work. The Consolidated Entity generated $15,150 in revenue during the period, in comparison to $77,199 generated in the prior year. Expenses The Consolidated Entity’s main sources of expenses are as follows: 2015 2014
$ $
Employee expenses 728,419 822,564
Corporate and administration expenses 1,323,476 1,077,587
Due diligence expenses 1,012,545 -
Provision for non-recovery of Hengda Deposit 2,593,362 -
Fair value loss on financial liability at fair value through profit or loss 591,875
For
per
sona
l use
onl
y

7
The major expenses and cash outflows for 2015 financial year were associated with the Hengda transaction. On 7 July 2014, the Company announced it had entered into to a Binding Framework Agreement, subject to due diligence to merge up to 100% of the issued capital of China Sciences Hengda Graphite Co, Ltd (Hengda), a graphite mining, processing and products company with Lamboo Resources with the combined entity to be listed on the ASX. The details of the proposed merger were outlined in the 2014 Annual Report. Under the Agreement, in July 2014 Lamboo paid to Mr Wang Fengjun, General Manager and major shareholder of Hengda, a refundable deposit of US$2,000,000 guaranteed by Hengda. In late October 2014, the Company discovered that the loan position of Hengda was substantially different from what had been presented and that the proper ownership of the shares proposed to be acquired under the Agreement, could not be established. Since then the Company has been working to secure the return of the US$2 million deposit, however this has not been successful to date. During the financial year the Company spent $1,012,545 on due diligence activities relating to the Hengda transaction and a provision for non-recovery of the US$2 million deposit, being $2,593,362 has been recognised in the profit and loss of the Company. There has been an offsetting unrealised foreign exchange gain on the Hengda Deposit of $383,905 recognised during the year. Employee expenses decreased by $94,145 as the Consolidated Entity has worked to decrease its running expenses in the 2nd half of 2015 financial year. Corporate and administration expenses have increased by $245,889. This includes activities focused on recovery of the Hengda deposit and increased activities in both Australia and South Korea. Cashflows The major items of cash expenditure during the year were: 2015 2014
$ $
Payments relating to the exploration and evaluation of projects 2,897,081 4,152,648
Payment of Hengda deposit 2,209,456 -
Payments for due diligence activities 1,012,545 -
Payments to suppliers and employees 1 2,023,745 1,911,253 1 Employee payments for technical staff that relate specifically to the Company’s projects are included in “Payments relating to the exploration and evaluation of projects”.
For
per
sona
l use
onl
y

8
REVIEW OF OPERATIONS EXPLORATION
The Company’s tenements include advanced exploration projects at McIntosh, Halls Creek and Mabel Downs in the East Kimberley of Western Australia, Valla in Northern New South Wales as well as advanced projects in South Korea. The prime focus of the Company continues to be the McIntosh flake graphite project in the East Kimberley and its flake graphite project in Geuman, South Korea. There has been limited field work undertaken at the Halls Creek, Mabel Downs and Valla projects during the period. MCINTOSH PROJECT VTEM SUPER MAX SURVEY The VTEM Super Max system flown by Geotech Ltd. is the most advanced time-domain electromagnetic system in the world. It has a 35 metre diameter transmitter loop (see Photo 1) and is designed to discriminate between moderate to excellent conductors using a low base frequency, long pulse width, and derived B field. The geometry of the system provides a systematic response allowing for intuitive conductor interpretation as well as providing high spatial resolution. The VTEM Super Max provides high near surface resolution combined with depth of penetration.
Photo 1: VTEM Super Max survey at the McIntosh Flake Graphite Project
For
per
sona
l use
onl
y

9
In September 2014 a total of 642 line kilometres of geophysical data was acquired which identified a total of 12 high-priority anomalies (Figure 1). Five of these were previously identified by induced polarisation (IP) and historical electromagnetic (EM) techniques and confirmed to be flake graphite schist by geological field mapping, petrographic analysis, rock chip sampling and exploration drilling.
Figure 1: Final processed VTEM supermax imagery of the McIntosh Flake Graphite Project East Kimberley,
Western Australia
The VTEM supermax survey flown by Geotech Ltd was completed on 200m line spacing's with infill lines flown at 100m spacing over the more prospective ground in the northern half of the McIntosh project area. Results of the 3-dimensional interpretation of Targets 1, 3, 4, 5, 6, 10 and 11 are presented below. F
or p
erso
nal u
se o
nly

10
TARGET 1
Figure 2: Target 1 anomaly with drill hole collars, resource outline and VTEM flight lines
The 3-dimensional VTEM interpretation at Target 1 is a very robust model, with clear indication of areas of thickness in the graphite unit apparent. There is a well observed signature specifically in the main Target 1 resource area and a local zone approximately 1kilometre south-west of the main resource area (see Figure 2). Stronger conductance values >300S are defined by the purple model plates and <300S as defined by the red model plates (see Figure 3 and 4).
For
per
sona
l use
onl
y

11
Figure 3: Plan view of the Target 1 anomaly with model plates
Figure 4: South-west looking oblique view of the Target 1 anomaly with model plates
For
per
sona
l use
onl
y
12
TARGET 3
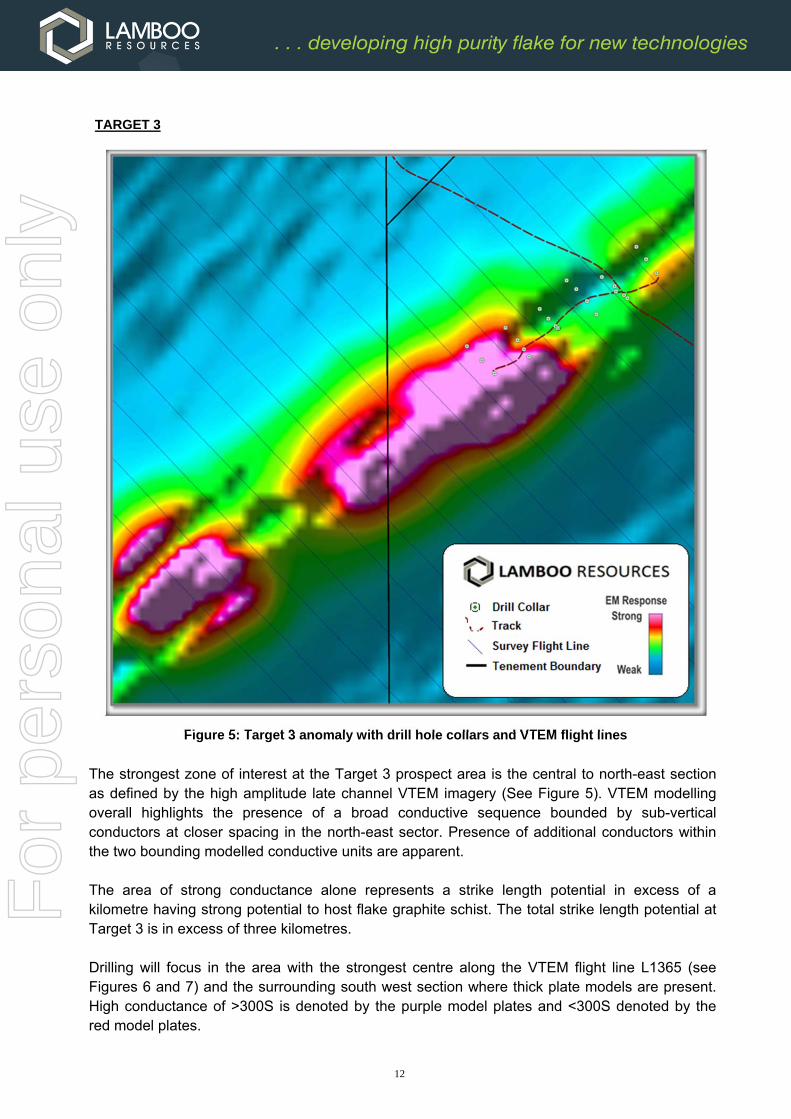
Figure 5: Target 3 anomaly with drill hole collars and VTEM flight lines
The strongest zone of interest at the Target 3 prospect area is the central to north-east section as defined by the high amplitude late channel VTEM imagery (See Figure 5). VTEM modelling overall highlights the presence of a broad conductive sequence bounded by sub-vertical conductors at closer spacing in the north-east sector. Presence of additional conductors within the two bounding modelled conductive units are apparent. The area of strong conductance alone represents a strike length potential in excess of a kilometre having strong potential to host flake graphite schist. The total strike length potential at Target 3 is in excess of three kilometres. Drilling will focus in the area with the strongest centre along the VTEM flight line L1365 (see Figures 6 and 7) and the surrounding south west section where thick plate models are present. High conductance of >300S is denoted by the purple model plates and <300S denoted by the red model plates.
For
per
sona
l use
onl
y
13
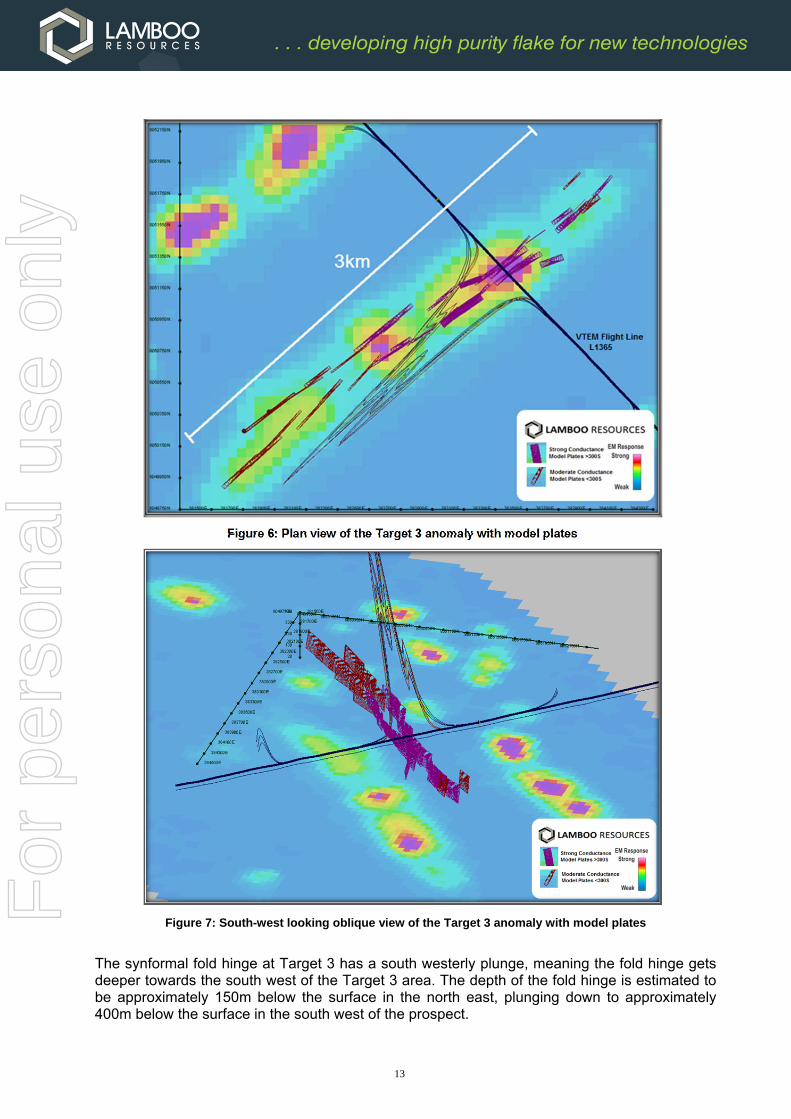
Figure 6: Plan view of the Target 3 anomaly with model plates
Figure 7: South-west looking oblique view of the Target 3 anomaly with model plates
The synformal fold hinge at Target 3 has a south westerly plunge, meaning the fold hinge gets deeper towards the south west of the Target 3 area. The depth of the fold hinge is estimated to be approximately 150m below the surface in the north east, plunging down to approximately 400m below the surface in the south west of the prospect.
For
per
sona
l use
onl
y
14
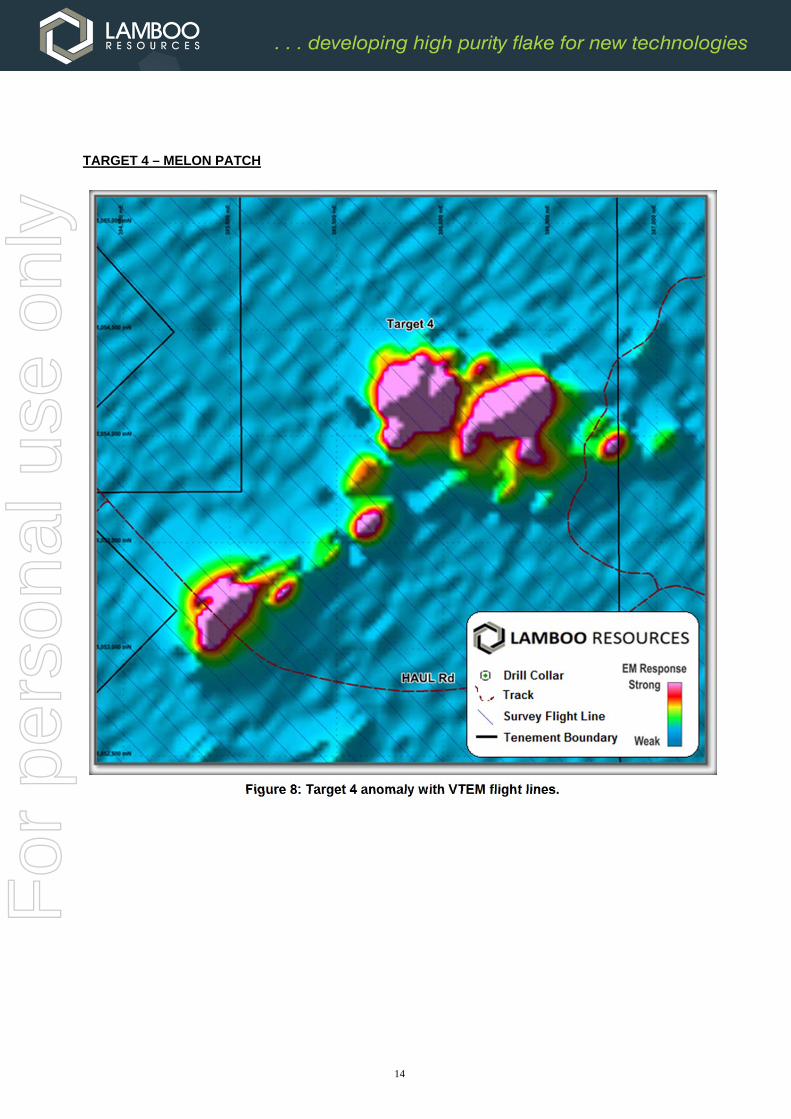
TARGET 4 – MELON PATCH
Figure 8: Target 4 anomaly with VTEM flight lines.
For
per
sona
l use
onl
y
15
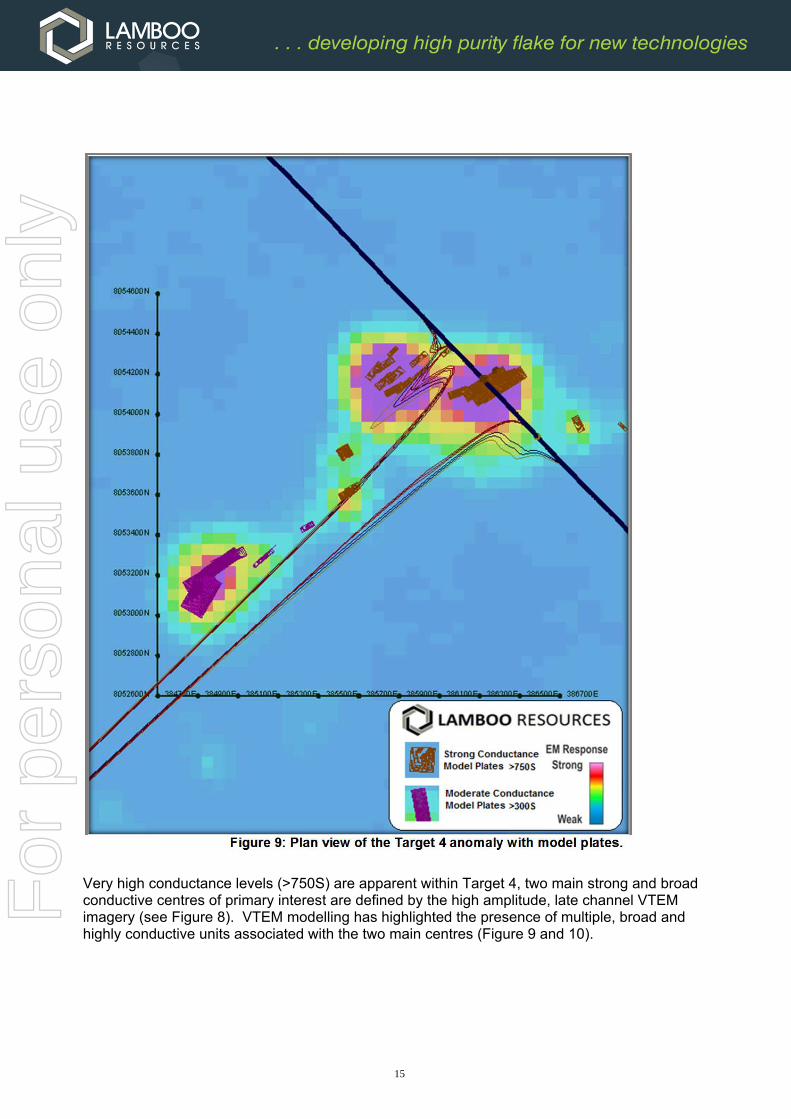
Figure 9: Plan view of the Target 4 anomaly with model plates.
Very high conductance levels (>750S) are apparent within Target 4, two main strong and broad conductive centres of primary interest are defined by the high amplitude, late channel VTEM imagery (see Figure 8). VTEM modelling has highlighted the presence of multiple, broad and highly conductive units associated with the two main centres (Figure 9 and 10).
For
per
sona
l use
onl
y

16
Figure 10: South-west looking oblique view of the Target 4 anomaly with model plates.
For
per
sona
l use
onl
y
17
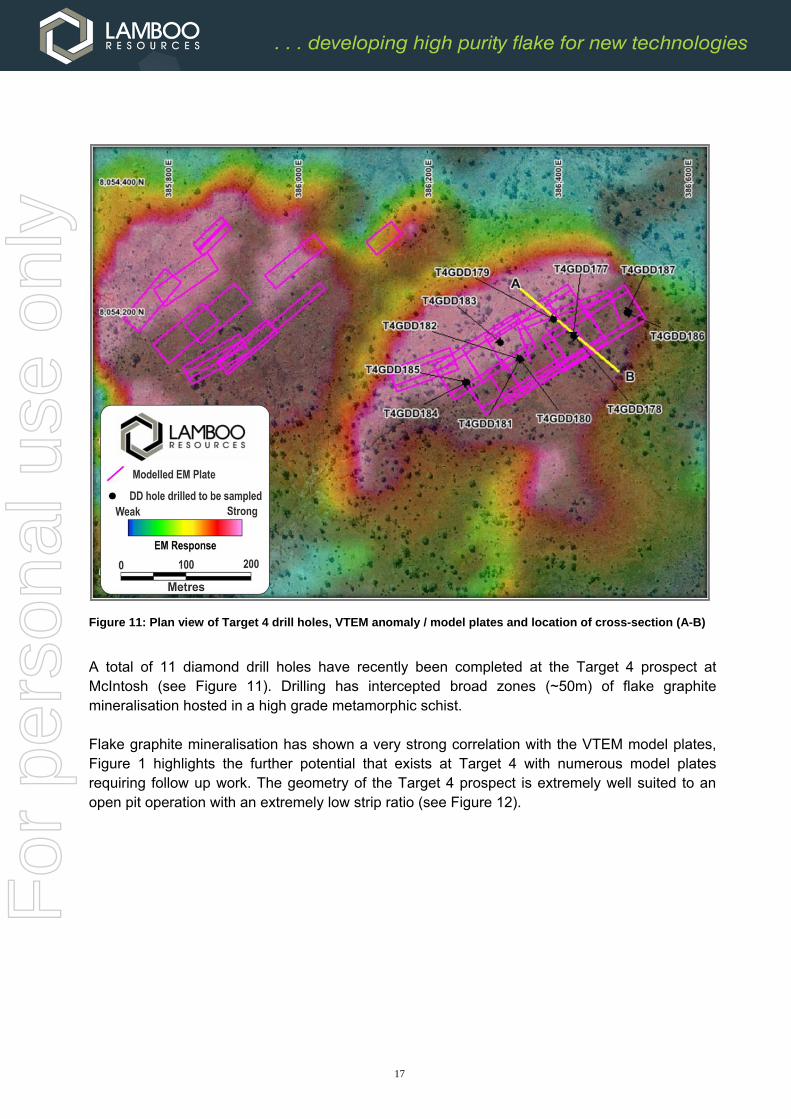
Figure 11: Plan view of Target 4 drill holes, VTEM anomaly / model plates and location of cross-section (A-B)
A total of 11 diamond drill holes have recently been completed at the Target 4 prospect at McIntosh (see Figure 11). Drilling has intercepted broad zones (~50m) of flake graphite mineralisation hosted in a high grade metamorphic schist. Flake graphite mineralisation has shown a very strong correlation with the VTEM model plates, Figure 1 highlights the further potential that exists at Target 4 with numerous model plates requiring follow up work. The geometry of the Target 4 prospect is extremely well suited to an open pit operation with an extremely low strip ratio (see Figure 12).
For
per
sona
l use
onl
y

18
Figure 12: Cross section of diamond drill holes T6GDD177 - 179 at Target 4
Structural logging has confirmed Target 4 to be a large scale synform (convex down), with outcropping flake graphite schist and base of mineralisation approximately 100m below surface (see Figure 12 and 15). Thin section testwork completed on diamond drill core samples from Target 4 has reported large to jumbo flake graphite (See Figures 13 and 14). Initial floatation and gravity testwork has commenced on diamond core samples from Target 4 with results expected in the coming weeks.
For
per
sona
l use
onl
y

19
Figure 13: Photomicrograph of T4GDD177 (84 - 85m) showing large to jumbo flake graphite
Figure 14: Photomicrograph of T4GDD177 (99 - 100m) showing large to jumbo flake graphite
For
per
sona
l use
onl
y

20
Figure 15: Target 4 interpretation, oblique view looking south
TARGET 4 - POTENTIAL FOR COPPER / NICKEL
The VTEM supermax imagery of the Target 4 - Melon Patch prospect also identified large highly conductive bodies believed to be associated with the presence of copper and nickel. The Geological Survey of Western Australia's 1:100,000 mapping (see Figure 16) has recorded a biotite bearing olivine gabbronorite associated with the Sally Downs supersuite of the layered gabbroic McIntosh Sill intrusion.
Figure 16: Target 4 geology (GSWA 1:100,000) with 2005 Thundelarra stream / soil / rock chip locations
For
per
sona
l use
onl
y

21
The Target 4 - Melon Patch area has been the focus of previous exploration as reported by Thundelarra in a 2005 open file annual report. Graphical results of a stream / soils / rock chip program of the Melon Patch area are provided in Figure 10 below. The geochemical sampling program identified a broad zone of anomalous copper and nickel, this zone also correlates extremely well with the highly conductive bodies identified by the VTEM. Copper values of >500ppm were recorded in soil and 250 to 500ppm in rock chip, Nickel values ranging between 80 to 250ppm were recorded in soil samples (see Figure 17).
Figure 17: 2005 Thundelarra stream / soil / rock chip results for copper (left) and nickel (right) at Target 4
For
per
sona
l use
onl
y
22
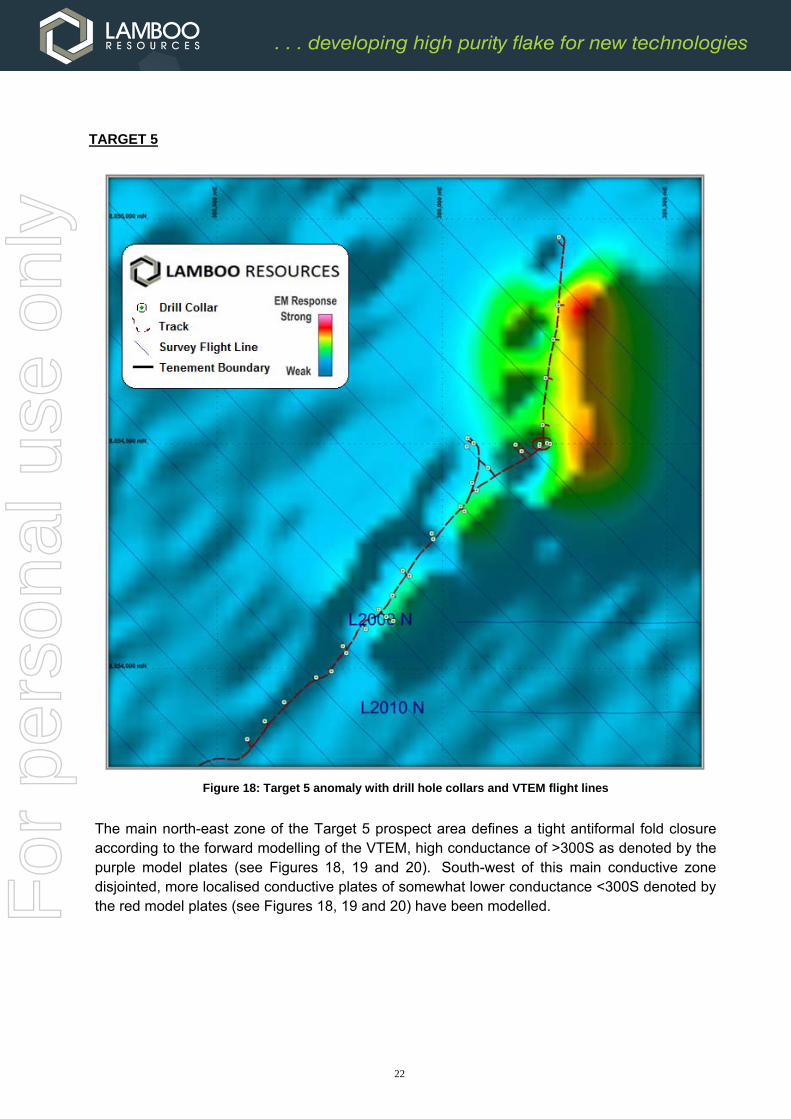
TARGET 5
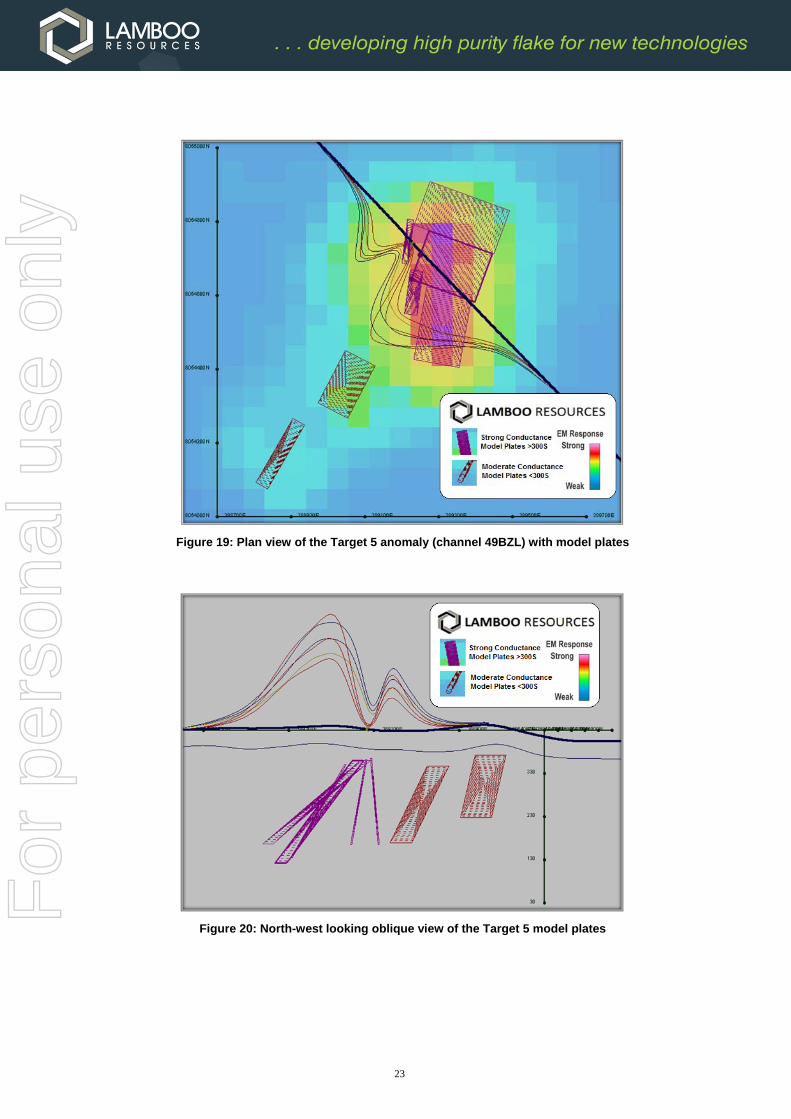
Figure 18: Target 5 anomaly with drill hole collars and VTEM flight lines
The main north-east zone of the Target 5 prospect area defines a tight antiformal fold closure according to the forward modelling of the VTEM, high conductance of >300S as denoted by the purple model plates (see Figures 18, 19 and 20). South-west of this main conductive zone disjointed, more localised conductive plates of somewhat lower conductance <300S denoted by the red model plates (see Figures 18, 19 and 20) have been modelled.
For
per
sona
l use
onl
y
23
Figure 19: Plan view of the Target 5 anomaly (channel 49BZL) with model plates
Figure 20: North-west looking oblique view of the Target 5 model plates
For
per
sona
l use
onl
y

24
TARGET 6
Figure 21: Target 6 anomaly with drill hole collars and VTEM flight lines
A reasonably complex series of dominantly thick plate / block model conductors were generated for the core section of Target 6. VTEM data supports the presence of a folded antiformal hinge zone being present with multiple limbs / bodies being present. Additional graphite units / bodies may be below these modelled units. The majority of the core sequence has stronger conductance levels at >300S as denoted by purple model plates with <300S model plates at the peripheral sections in the southern end (see Figures 21, 22 and 23).
For
per
sona
l use
onl
y

25
Figure 22: Plan view of the Target 6 anomaly with model plates
Figure 23: North-north-west looking oblique view of the Target 6 anomaly with model plates
For
per
sona
l use
onl
y

26
Figure 24: Target 6 plan view of diamond drill holes completed to date
To date 14 diamond drill holes for a total of 1,769 metres have been completed at the Target 6 prospect, in addition to the 12 reverse circulation drill holes completed during 2014 (see Figure 24). Drilling has identified broad intersections of commercially viable flake graphite within a high grade metamorphic schist. Drilling has also confirmed the structure to be a regional scale fold hinge with flake graphite outcropping at the surface (see Figures 25 and 26). Metallurgical test work conducted on diamond core from Target 6 has identified excellent liberation characteristics and a good percentage of large to jumbo flake. First pass flotation, gravity and magnetic separation test work on Target 6 diamond core also produced a flake graphite concentrate of >94%, along with high recoveries. The initial metallurgical test work has also confirmed that grades in the 4-6% TGC range (known as the ‘sweet spot’ for flake graphite) exhibit superior metallurgical characteristics, including superior liberation characteristics along with higher concentrate purity when compared to the higher head grades of 16% TGC.
For
per
sona
l use
onl
y
27
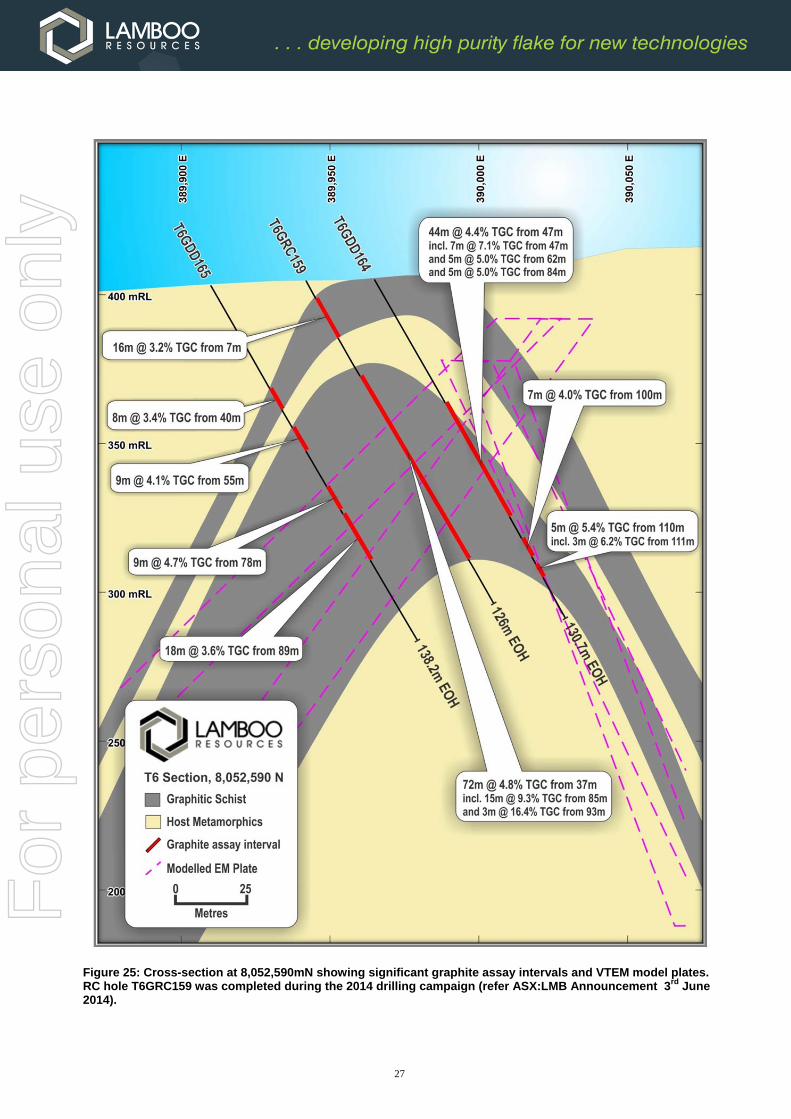
Figure 25: Cross-section at 8,052,590mN showing significant graphite assay intervals and VTEM model plates. RC hole T6GRC159 was completed during the 2014 drilling campaign (refer ASX:LMB Announcement 3rd June 2014).
For
per
sona
l use
onl
y

28
Figure 26: Cross-section at 8,052,670mN showing significant graphite assay intervals and VTEM model plates
Figures 25 and 26 represent interpreted cross-sections from the Target 6 prospect highlighting the large scale antiform along with significant assay intercepts (see Table 1 and 2) and the VTEM model plates. The fold hinge area at the Target 6 prospect is ideally suited to a low strip ratio open pit operation with the base of the open pit envisaged to be approximately 100 to 150 metres below surface. The Target 6 prospect is also located alongside an existing haul road, 20 kilometres from the Great Northern Highway and 280 kilometres through to the Port of Wyndham making the logistics of the McIntosh project extremely appealing.
For
per
sona
l use
onl
y
29
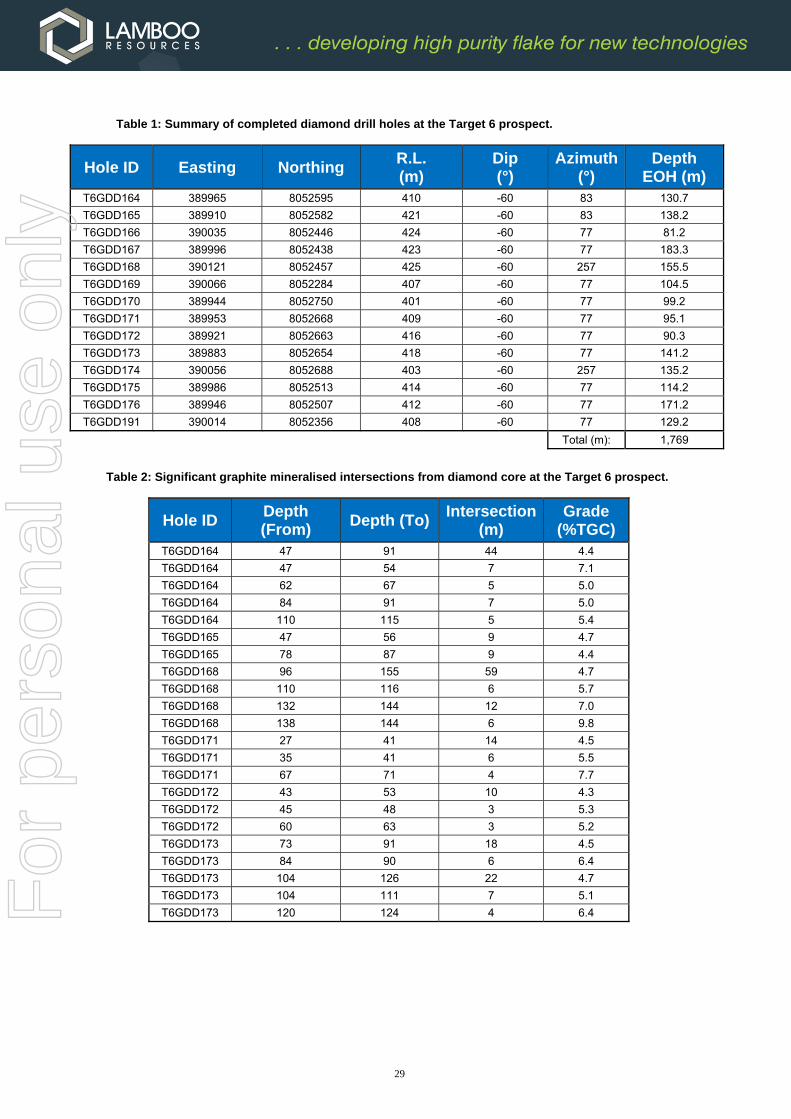
Table 1: Summary of completed diamond drill holes at the Target 6 prospect.
Hole ID Easting Northing R.L. (m)
Dip (°)
Azimuth (°)
Depth EOH (m)
T6GDD164 389965 8052595 410 -60 83 130.7
T6GDD165 389910 8052582 421 -60 83 138.2
T6GDD166 390035 8052446 424 -60 77 81.2
T6GDD167 389996 8052438 423 -60 77 183.3
T6GDD168 390121 8052457 425 -60 257 155.5
T6GDD169 390066 8052284 407 -60 77 104.5
T6GDD170 389944 8052750 401 -60 77 99.2
T6GDD171 389953 8052668 409 -60 77 95.1
T6GDD172 389921 8052663 416 -60 77 90.3
T6GDD173 389883 8052654 418 -60 77 141.2
T6GDD174 390056 8052688 403 -60 257 135.2
T6GDD175 389986 8052513 414 -60 77 114.2
T6GDD176 389946 8052507 412 -60 77 171.2
T6GDD191 390014 8052356 408 -60 77 129.2
Total (m): 1,769
Table 2: Significant graphite mineralised intersections from diamond core at the Target 6 prospect.
Hole ID
Depth (From)
Depth (To) Intersection
(m) Grade
(%TGC) T6GDD164 47 91 44 4.4
T6GDD164 47 54 7 7.1
T6GDD164 62 67 5 5.0
T6GDD164 84 91 7 5.0
T6GDD164 110 115 5 5.4
T6GDD165 47 56 9 4.7
T6GDD165 78 87 9 4.4
T6GDD168 96 155 59 4.7
T6GDD168 110 116 6 5.7
T6GDD168 132 144 12 7.0
T6GDD168 138 144 6 9.8
T6GDD171 27 41 14 4.5
T6GDD171 35 41 6 5.5
T6GDD171 67 71 4 7.7
T6GDD172 43 53 10 4.3
T6GDD172 45 48 3 5.3
T6GDD172 60 63 3 5.2
T6GDD173 73 91 18 4.5
T6GDD173 84 90 6 6.4
T6GDD173 104 126 22 4.7
T6GDD173 104 111 7 5.1
T6GDD173 120 124 4 6.4
For
per
sona
l use
onl
y

30
Figure 27: Photomicrograph of T6GDD164 (66.7m) showing large to jumbo flake graphite
Figure 27 is a photomicrograph from diamond core sample T6GDD164 (66.7m) showing the strong foliation of the graphitic schist and also shows a later deformational event that has resulted in micro-folding of the minerals. The graphite occurs in well oriented bunches and individuals hosted by the micas. Individual flakes of graphite frequently exceed 300μm. Greater than 300μm is classified as extra-large jumbo flake. The estimated flake graphite content in the thin section analysis had a range between 10-20%.
Figure 28: Oblique view of the Target 6 interpretation showing the large scale anticline and thickening of the graphitic schist unit along the fold hinge.
For
per
sona
l use
onl
y
31
Results of first pass metallurgical testwork conducted on recently drilled diamond core samples from Target 6 at McIntosh have recovered high grade graphitic concentrate of up to 94% Total Graphitic Carbon (TGC) using simple flotation and gravity methods. Testwork has also confirmed the substantial presence of Large to Jumbo flake graphite of 25%. Initial flotation testwork has indicated that a very high graphite recovery of >93% at a relatively course grind of 600μm is achievable. The process involved a primary grind, a rougher floatation stage, 2 stages of polishing grind and 4 cleaner floatation stages. Testwork is now focussed on optimising the concentrate grades, overall recovery and final concentrate product size distribution. End users have identified product purity and flake size as most important for their specific applications, this is especially important in the manufacture of batteries. The metallurgical results achieved highlight the high purity of the Target 6 product with testwork underway to upgrade the concentrate to battery grade specification. Drill hole assays will guide more detailed metallurgical and mineralogical investigations to be carried out over the coming months on larger scale bulk samples from across the mineralised zones. Metallurgical optimisation testwork, including magnetic separation, will focus on refining the graphite flotation methods and will be looking for ways to maximise the overall recovery and conservation of the graphite flakes. Further metallurgical testwork will also be optimised to meet end user specifications and for the future growth applications of flake graphite including batteries for electric vehicles and energy storage.
For
per
sona
l use
onl
y

32
TARGET 10
Figure 29: Target 10 anomaly with VTEM flight lines
The VTEM interpretation of the Target 10 prospect has identified large, highly conductive bodies believed to be associated with the presence of flake graphite schist (see Figure 29). The VTEM interpretation has identified an extensive north-east / south west trending conductive package represented by moderately south easterly dipping conductors. The conductance ranges between ~200 and 700S+ and are believed to be associated with a graphitic schist horizon. Target 10 has a strike length potential in excess of 2 kilometres (see Figure 30). Target 10 is situated adjacent to mining tenement M80/416 with outcropping graphitic schist running parallel, and approximately 250m from the tenement boundary (see Figure 31).
For
per
sona
l use
onl
y

33
Figure 30: Plan view of the Target 10 anomaly with model plates
Figure 31: South-west looking oblique view of the Target 10 anomaly with model plates
For
per
sona
l use
onl
y

34
TARGET 11
Figure 32: Target 11 anomaly with VTEM flight lines
The VTEM interpretation of the Target 11 East prospect has identified large, highly conductive bodies associated with the presence of graphitic schist (see Figure 32), the Target 11 prospect is located directly alongside an existing haul road.
For
per
sona
l use
onl
y

35
Figure 33: Plan view of the Target 4 anomaly with model plates
Very high conductance levels (+500S) are apparent within Target 11 East prospect. An extensive north / north-north-east striking conductive sequence has been modelled with conductive units being sub-vertical to steeply west dipping. Strongest conductance is positioned along survey flight line L2150 and L2190 (see Figure 33) with thicker plates modelled to satisfy the data in the northern extents, there is also evidence for multiple / separated conductors along survey flight lines L2160 and L2170.
For
per
sona
l use
onl
y

36
MCINTOSH EXPLORATION POTENTIAL Lamboo Resources has an extensive tenement package surrounding the McIntosh Flake Graphite Project area having strong potential to contain economic flake graphite mineralisation (see Figure 34). Field observations along with geological mapping have confirmed the EM anomalies are contributable to flake graphite schist. The strike length potential of the combined McIntosh tenement package to host flake graphite schist has been estimated to be in the range of 30 - 50 kilometres.
Figure 34: McIntosh Project Area / Exploration Potential, VTEM 2014, Hoist EM 2005 and Airborne EM 2005
For
per
sona
l use
onl
y

37
MCINTOSH EXPLORATION TARGET ESTIMATE A review of the McIntosh Project was completed by international consulting firm CSA Global Pty Ltd (CSA). CSA utilised a combination of reverse circulation (RC) and diamond drilling (DD) data, geological mapping of graphitic mineralisation, geophysical data and interpretations to determine reasonable Exploration Targets of graphitic material at Targets 2, 3, 4, 5, 6, 10 and 11. Additional petrography work was also undertaken on selected core, RC chip and rock samples. This work has resulted in the definition of seven new Exploration Targets (see Figure 35 and Table 3) totaling 80 - 127 Mt @ 2.5 - 6.0% TGC (total graphitic carbon).
Figure 35: Exploration Target estimates at McIntosh Flake Graphite Project East Kimberley, Western Australia.
Exploration Target - Cautionary Statement: The potential quantity and grade of the exploration targets are conceptual in nature, there has been insufficient exploration to estimate a mineral resource and it is uncertain if further exploration will result in the estimation of a mineral resource.
For
per
sona
l use
onl
y

38
Table 3: McIntosh Flake Graphite Project - Exploration Target Estimate
Target Tonnage Range (Mt) TGC Range (%)
Target 2 5 - 15 2.5 – 5.0
Target 3 30 - 42 2.5 – 4.5
Target 4 5 - 8 2.5 – 4.5
Target 5 4 - 6 3.0 – 6.0
Target 6 18 - 25 3.0 – 5.5
Target 10 15 - 25 3.0 – 6.0
Target 11 3 - 6 3.0 – 5.5
Total 80 - 127 Mt 2.5 - 6.0 %TGC Note: Exploration Targets used a TGC% cut-off grade of 1.9%
CONCEPTUAL STUDY
The Conceptual Study referred to in this report is based on conceptual technical and economic assessments. There is no assurance of an economic development case at this stage, or any certainty that the conclusions of the study will be realised. The Conceptual Study is based on the Company's Exploration Targets and should not be solely relied upon by investors when making investment decisions. Geological and geophysical evidence was used to develop the Exploration Targets but the potential quantity and grade of the Exploration Targets are conceptual in nature. There has been insufficient exploration to estimate a Mineral Resource and it is uncertain if further exploration will result in the estimation of a Mineral Resource. The Conceptual Study was undertaken and prepared by independent geological and mining consultant CSA Global Pty Ltd (CSA Global) of Perth, Western Australia (W.A.). CSA Global was engaged to evaluate the technical and economic potential of the McIntosh Flake Graphite Project and to provide recommendations for further work. The Conceptual Study has assessed the likely economics, mining process and infrastructure for a conceptual crystalline flake graphite project at McIntosh. This work was supported by specialist metallurgical work undertaken by Nagrom Metallurgical in Perth, W.A.; SGS in Perth, W.A.; Wuhan University of Technology in China; and Guangzhou Research Institute of Non-ferrous Metals (GZIRM) in China. The metallurgy and process engineering inputs to the conceptual Study were provided by independent consultants Battery Limits Pty Ltd (BatteryLimits) in Perth, W.A. based on their experience in several other graphite projects.
Exploration Targets were developed using geophysical, mapping and drill sampling data as detailed in Lamboo’s ASX announcement released on 23rd February 2015.
Preliminary open pit optimisations were based on grade ranges established for the Exploration Targets referred to above to determine the tonnage required for optimum project development at those grades. Successful outcomes were indicated if grades are obtained at the high end of the Exploration Target ranges.
Assumed mining and production schedules based on the optimisation outputs were used to develop order of magnitude production scenarios.
A conceptual metallurgical process flow sheet was based on previous experience at comparable projects, with an assumed 80% metallurgical recovery and an assumed concentrate grade of >90% TGC.
For
per
sona
l use
onl
y

39
Preliminary capital and operating cost estimates were based on the mining and processing production scenarios using data from relevant projects and industry standard estimating factors.
Pricing estimates were based on ‘basket prices’ for assumed flake graphite size ranges, using published 2015 marketing data and forecast 2020 prices.
Required infrastructure was assessed including power, water, camp and transport.
Environmental and heritage impacts have been determined from field studies with no major issues identified to date.
For the Conceptual Study the upper and lower grade ranges were used for initial pit optimisations. Note that in each case all material within the Target is assigned the single grade for that Target. For all runs, wire-frame models were used which represented the currently interpreted geology based on all available current data (geophysical interpretations supplemented by mapping, logging and sampling). The optimisation process selects only those tonnes that meet the mining cut-off grade after considering all assumed operating costs and allow for expected waste stripping. Preliminary capital costs estimates for a notional 2.4 Mtpa flake graphite operation were prepared by CSA Global and BatteryLimits (Table 1) to produce a sized, graphite flake concentrate product.
Table 1: Preliminary capital cost estimates for a notional 2.4Mtpa operation (A$ Millions)
Capital Cost Estimates
Item ($M/AUD)
Earthworks and Access Roads 2
Power Supply and Diesel Storage 3
Crushing, Screening, Milling, Flotation 45
Reagents and Services 18
Plant Infrastructure 5
Concentrate Handling 21
Water Systems and Utilities 6
Tailings Storage Facility 6
Camp 12
Offices, Workshops, Vehicles, etc. 5
Expected project operating costs were based on a recent contractor mining quotation for a project of similar scale and location to cover mining of ore and waste to a ROM plant feed pad and waste dump respectively. Expected average costs per tonne for mining, processing and selling were developed for each Exploration Target in $A/tonne of material mined, processed and sold (see Table 2).
For
per
sona
l use
onl
y

40
Table 2: Notional operating cost estimates (A$/t)
Operational Cost Estimates
Item ($AUD/t)
Mining Costs / tonne mined $3.60
Processing Costs / tonne processed $16.70
Selling Costs / tonne product $58.00
HERITAGE CLEARANCE A Heritage Clearance Survey was completed from the 22nd April 2015 through to the 26th April 2015. The Heritage Survey was conducted with members of Lamboo staff, representatives from the Traditional Owner group, the Marlarngowem, along with representatives from Environmental, Heritage and Social Impact Services ("EHSIS"). The Heritage Survey covered Target areas 1, 2, 3, 4, 5, 6, 10, 11 along with the campsite (Figure 36), no sites of significance were identified during the survey.
Figure 36: Heritage Clearance Survey completed 22nd - 26th April 2015
For
per
sona
l use
onl
y
41
COMMERCIALISATION
Metallurgical results achieved to date show that a commercial flake graphite product can be produced from McIntosh. Testwork has also produced marketing samples which will now be distributed to our existing and potential offtake partners and will also allow for testwork on downstream applications including spherical, expandable, micronised and purified graphite to be conducted by the end users. Given that Lamboo’s strategy of upgrading the size and quality of its flake graphite resource is being realised, the company is now focussing all its efforts towards commercialisation of the McIntosh Flake Graphite Project. Lamboo have scheduled meetings with current and potential offtake partners and key end users in the coming months. These meetings are centred on the ability to provide these end users high quality flake graphite samples, thus allowing the end users to complete test work using their specific processes. The excellent metallurgical results from McIntosh achieved in first pass testwork provides the company a great deal of confidence in firming up the existing offtake agreements and also establishing new relationships with other offtake partners.
For
per
sona
l use
onl
y

42
GEUMAM PROJECT
MAIDEN INDEPENDENT RESOURCE ESTIMATE
Drill holes used in the Mineral Resource estimate for Area B included 13 diamond holes for a total of 1,782m within the Mineral Resource wireframes. The full database contained records for 23 drill holes for 2,853m of drilling conducted over Areas B and C by Lamboo. Drilling in the project extends to a vertical depth of approximately 190m and the flake graphite mineralisation was modelled from surface to a depth of approximately 175m below surface. The estimate is based on good quality diamond core (DD) drilling data. Drill hole spacing varies from approximately 100m by 25m in the well-defined areas of the project to 120m by 50m over the remaining areas. RungePincockMinarco Limited (“RPM”) was contracted by Lamboo Resources Limited (LMB) to complete an independent Mineral Resource estimate for the Geumam Area B flake graphite deposit. The Mineral Resource was estimated in accordance with the 2012 Edition of the ‘Australasian Code for Reporting of Exploration Results, Mineral Resources and Ore Reserves’ prepared by the Joint Ore Reserves Committee of The Australasian Institute of Mining and Metallurgy, Australian Geoscientists and Minerals Council of Australia (The JORC Code 2012). The Geumam Area B Mineral Resource (as at 31 July 2014), is summarised in Table 6 below and the block model is presented in Figure 37.
Table 6: Geumam Area B July 2014 Inferred Mineral Resource Estimate (1% C graphite Cut-off)
Area Ore Type Resource Classification
Tonnes (Mt)
Graphite (%TGC)
Contained Graphite (tonnes)
Geumam (Area B)
Primary Indicated 1.0 6.3 65,000Oxidised Indicated 0.5 7.2 37,000Primary Inferred 3.8 4.8 183,000Oxidised Inferred 0.1 7.8 11,000
Oxide + Primary Total Resources 5.5 5.4 296,000Note – Totals may differ due to rounding Mineral Resources reported on a dry in-situ basis
Figure 37: Area B Block Model Coloured by C graphite Grade – Long Section Facing West
For
per
sona
l use
onl
y

43
The Mineral Resource tonnages and grades for Area B were estimated on a dry in-situ basis and the resource model is undiluted. The Mineral Resource was classified on the basis of data quality, sample spacing and continuity of the interpreted zones and has been classified as Indicated and Inferred Mineral Resource. The Indicated portion of the Mineral Resource was confined to the southern part of Area B, where the continuity and thickness of graphite mineralization was good and there was high confidence in the geological interpretation. The portions of the deposit classified as Inferred Mineral Resource include those with wider-spaced drilling, small zones peripheral to the main structures, and zones of increased complexity which require more detailed information.
PHASE 2 DRILLING PROGRAM
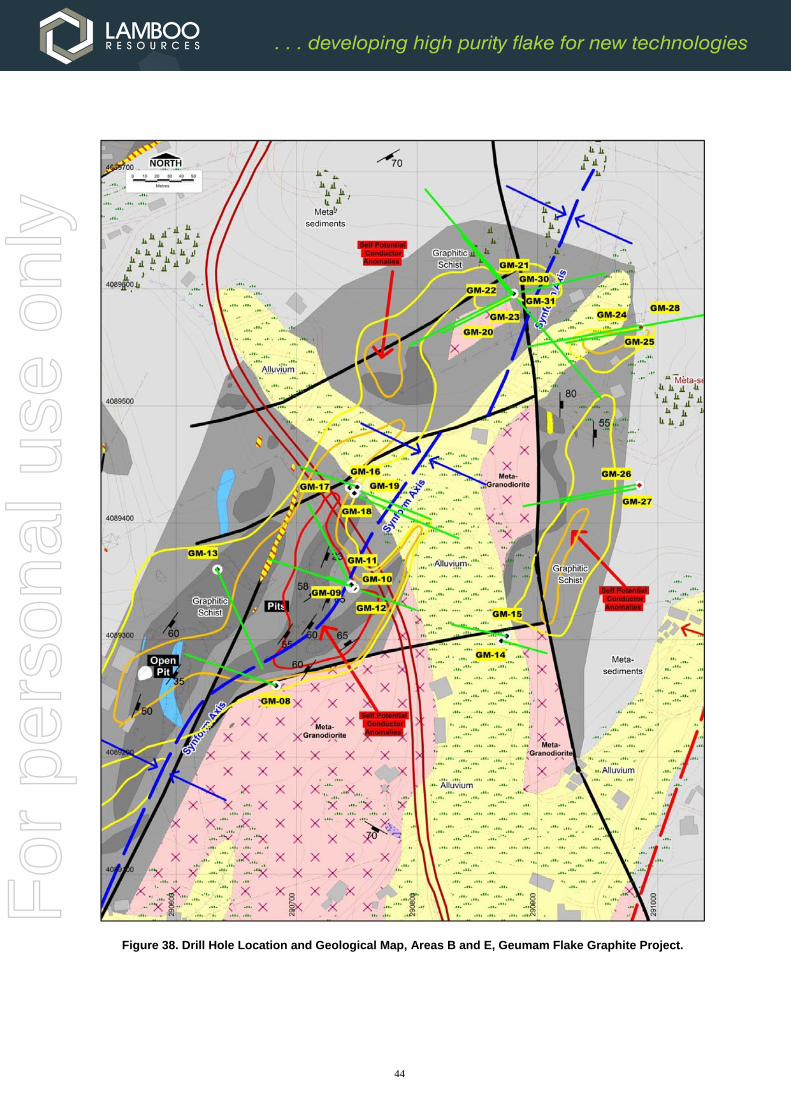
The continuing Phase 2 resource drilling program was designed to substantially increase the current graphite resource base at Geumam. From July 2014 the focus of the drilling program shifted to Areas C and E. Table 7 below indicates the recorded graphite mineralized intersections of >2m thickness and >2%Cg and Figure 38 locates all drill hole collars at the Geumam Flake Graphite Project.
Table 7: Graphite Mineralized Intersections (>2m; >2%Cg)
HOLE ID DEPTH
From (m) DEPTH To (m)
INTERSECTION (m)
GRADE (% Cg)
GM-24
18 21 3 5.15
54 56 2 7.35
72 80 8 5.68
82 104 22 5.12
GM-25
27 32 5 2.02
40 47 7 9.85
56 65 9 4.91
71 73 2 3.40
78 100 22 6.09
GM-26 29 31 2 3.05
73 111 38 10.30
GM-28 15 18 3 4.01
GM-30
13 15 2 3.34
23 26 3 3.39
100 122 22 7.33
181 184 3 3.63
186 191 5 2.31
GM-31
25 29 4 2.13
59 61 2 6.82
103 112 9 5.14
GM-32
79 94 15 3.41
128 130 2 3.76
133 138 5 5.60 NOTES: Significant grade x thickness graphite mineralized zones are highlighted in red. No significant assays were recorded in GM-27. No samples were collected from GM-29, which was terminated early at 12.3m depth.
For
per
sona
l use
onl
y
44
Figure 38. Drill Hole Location and Geological Map, Areas B and E, Geumam Flake Graphite Project.
For
per
sona
l use
onl
y

45
METALLURGICAL TESTWORK
Mineral Liberation Analyser (MLA) results from ActLabs on 13 samples of drill core, indicate the Geumam Flake Graphite Project has an average insitu flake graphite size of 102µm at Area B and 75µm at Area C. The graphite flakes are mainly hosted in graphitic arenite and minor metalimestone, accompanied mainly by quartz, biotite, sericite, chlorite and muscovite.
The flake graphite mineralisation at Geumam is characterised by cataclasite brecciation, massive form and internal deformation styles. The graphite mineralisation is usually accompanied by veinlet stockworks, comprising grey, fine-grained, cryptocrystalline quartz (5- 10% volume) in the upper section, with a lower section characterised by fracture infilling quartzcalcite veinlets (<5% volume). Fine-grained disseminated pyrite was the only sulphide mineral observed and is mainly confined to the upper section (<1% volume). A structured metallurgical testwork program on Geumam flake graphite is underway at ActLabs metallurgical laboratory in Thunder Bay, Canada. The metallurgical study is based on the four ore types identified at Geumam and is designed to support a Scoping Study. ActLabs has considerable experience in the testing and flowsheet development of graphitic ores. The metallurgical testwork program is being independently supervised by RungePincockMinarco. Table 8 details the chemical characteristics of the ore types at Geumam being tested. The mineralogical and comminution requirements of the various ore types at Geumam have now been established. Comminution studies have concluded that the ore types ranged from soft to moderate hardness and would present no difficulties in milling. The Bond Ball Mill Work Indices (BBMWI) ranged between 11.3 and 14.2 kWh/t).
Table 8. Chemical Characteristics of Geumam Graphite Ore Types
Sample Source
Sample Head Assay (%)
Al Ca Carbon (IR) Fe K Mg Na P S S
TD-ICP
TD-ICP
Total Due to
Graphite Organic
(calc)
Amorphous (calc)
TD-ICP
TD-ICP
TD-ICP
TD-ICP
TD-ICP
TD-ICP
IR
Deposit 'B' Primary
3.57 9.68 8.72 4.90 < 0.5 <3.32 2.40 1.79 2.27 0.17 0.11 0.86 0.78
Deposit 'B' Weathered
3.86 1.02 8.27 7.30 0.7 0.27 2.55 1.64 0.75 0.17 0.16 0.36 0.34
Deposit 'C' Primary
4.83 9.17 6.82 3.64 < 0.5 <2.68 2.84 1.64 1.48 0.56 0.06 0.65 0.61
Deposit 'C' Weathered
6.51 0.20 4.89 4.67 < 0.5 <0.22 4.26 2.23 0.41 0.13 0.06 0.11 0.15
Mineralogical analyses found that quartz was the major gangue mineral present, along with calcite and minor quantities of ankerite, dolomite and muscovite. Low levels of pyrite sulphide (<1%) was also present.
For
per
sona
l use
onl
y

46
Based on a crush size of 850µm, MLA analyses has determined the average in-situ graphite flake size of 102µm at Area B and 75µm at Area C. Pre-concentration studies indicated that there was limited potential for upgrading using classification. The likely separation flowsheet is based on flotation, with regrinding of the cleaner concentrates to produce a >85% Cg graphite concentrate. Separation testwork has finalised the optimum grinding and flotation roughing conditions. The optimum grind size is moderately coarse at 80% passing 212µm for the Area B deposit and slightly finer at 80% passing 180µm for Area C. These results are similar to that undertaken in a testwork program conducted in 1983 by the Korean Mining Promotion Corporation (1983a) for the original historical Geumam mine and achieved in the milling operation. Cleaning testwork is currently underway with the target of producing a flotation graphite concentrate with grades of 85% Cg and overall recoveries in excess of 80%. Once the final flotation cleaning testwork has been completed, graphite concentrate leaching studies will commence. Based on anticipated domestic market demand, very high purity graphite concentrates would be prepared by leaching of the final flotation concentrates to remove any relict quartz, calcite, ankerite, dolomite and muscovite gangue minerals. This testwork will target a high-purity grade of >93% Cg, previously achieved in historical leaching studies conducted in 1983 by the Korean Mining Promotion Corporation (1983b). In addition, the recovery of pyrite from the flotation tailings is also to be studied. Pyrite is a potentially saleable by-product and its removal also ensures that the flotation tailings are marketable as a fine concrete sand product. This has the added potential benefits to the project of eliminating the need for a tailings storage facility at Geumam and significantly reducing the environmental impacts.
For
per
sona
l use
onl
y

47
Competent Persons Statement Information in these ‘Annual Financial Statements’ relating to Exploration Results, Geological Data and Mineral Resources is based on information previously compiled and / or reviewed by Mr. Tony Cormack, Member of the Australasian Institute of Mining and Metallurgy and a full-time employee of Lamboo Resources Limited. Mr. Cormack has sufficient experience which is relevant to the activity previously undertaken to qualify as a "Competent Person", as defined in the 2012 edition of the Australasian Code of Reporting of Exploration Results and consents to the inclusion in this report of the matters reviewed by him in the form and context in which they appear. The information relating to the Mineral Resources at the McIntosh Project is extracted from the ASX Announcements as follows: ASX announcement titled ‘VTEM Super Max Survey Confirms Potentially Significant Additional Flake Graphite
at McIntosh Project dated 15 September 2014 ASX announcement titled ‘Significant Bulk Sample Testwork Results from Target 5 and 6 of the McIntosh
Graphite Project Achieves a High Grade Concentrate with a High Recovery’ dated 29 September 2014 ASX announcement titled ‘Significant Bulk Sample Testwork Results from Target 5 and 6 of the McIntosh
Graphite Project Achieves a High Grade Concentrate with a High Recovery’ dated 29 September 2014 ASX announcement titled ‘2014 Annual Report’ dated 31 October 2014 ASX announcement titled ‘Huge Potential at McIntosh Flake Graphite Project Confirmed by VTEM Supermax
Final Data and 3-Dimensional Interpretation’ dated 8 December 2014 ASX announcement titled ‘Outstanding Target 3 VTEM Results Exceeds Expectations. Interpretation of Target
4 Imminent, with Significant Copper and Nickel Potential’ dated 15 December 2014 ASX announcement titled ‘McIntosh Continues to Grow with Significant Flake Graphite Potential Confirmed at
Target 10’ dated 19 January 2015 ASX announcement titled ‘Significant Copper / Nickel Potential at Target 4’ dated 27 January 2014 ASX announcement titled ‘Significant added potential demonstrated at the McIntosh Flake Graphite Project’
dated 23 February 2015 ASX announcement titled ‘Positive Conceptual Study Results for the McIntosh Flake Graphite Project’ dated
15 April 2015 ASX announcement titled ‘McIntosh Project Update’ dated 29 May 2015 ASX announcement titled ‘Preliminary Advice Received for McIntosh Heritage Clearance Survey’ dated 2 June
2015 ASX announcement titled ‘Diamond Drilling Commences Following Final Heritage Approval’ dated 22 June
2015 ASX announcement titled ‘Excellent Metallurgical Results Advance the McIntosh Project’ dated 17 August
2015 ASX announcement titled ‘Target 4 Drilling and Metallurgical Update’ dated 22 June 2014 ASX announcement titled ‘High Quality Flake Graphite in Broad Intersections at T6’ dated 16 September 2014
The information relating to Mineral Resources and Exploration Results associated with the Company's projects in South Korea is extracted from the ASX Announcements as follows: ASX announcement titled ‘Maiden Independent Resource Estimate – Area B Prospect South Korean –
Geumam Flake Graphite Project’ dated 4 August 2014 ASX announcement titled ‘Phase 2 Drilling Program Results. Geumam Graphite Project, South Korea’ dated
16 September 2015 ASX announcement titled ‘2014 Annual Report’ dated 31 October 2014 ASX announcement titled ‘Significant Drill Hole Intercepts and Metallurgical Test Results at Geumam Flake
Graphite Project’ dated 2 February 2015
The reports are available to view on the Lamboo Resources website www.lambooresources.com.
The reports were issued in accordance with the 2012 Edition of the JORC Australasian Code for Reporting of Exploration Results, Mineral Resources and Ore Reserves. The company confirms that it is not aware of any new information or data that materially affects the information included in the original market announcement and, in the case of estimates of Mineral Resources or Ore Reserves that all material assumptions and technical parameters underpinning the estimates in the relevant market announcement continue to apply and have not materially changed. The company confirms that the form and context in which the Competent Person's findings are presented have not been materially modified from the original market announcement.
For
per
sona
l use
onl
y

48
SIGNIFICANT CHANGES IN THE STATE OF AFFAIRS There were no significant changes in the state of affairs during the period. LIKELY DEVELOPMENTS AND FUTURE OPERATIONS During FY2016, the Company will continue to advance its existing exploration assets aiming to bring them into production in the near future. The Company’s planned activities for the coming year include: McIntosh Maiden Resource Estimate for Targets 4, 5 and 6; Feasibility study of the McIntosh Project Planned Reverse Circulation Grade Control drilling program at Targets 4, 5 and 6; Commence exploration at the Wills Creek area, including a VTEM survey; Continue work on obtaining the necessary government and environmental approvals in support of the Mining
Lease Application (MLA) at McIntosh; Ongoing environmental, engineering and metallurgical studies.
South Korea Maiden Resource Estimate for Area C and E; Scoping Study of the Geumam Project Ongoing environmental, engineering and metallurgical studies
INDEMNIFICATION OF OFFICERS OR AUDITOR Each of the Directors and the Secretaries of the Company has entered into a Deed with the Company whereby the Company has provided certain contractual rights of access to books and records of the Company and certain indemnification to those Directors and Secretaries. The Company has insured all of the Directors and Officers of Lamboo Resources Limited. The contract of insurance prohibits the disclosure of the nature of the liabilities covered and amount of the premium paid. The Corporations Act 2001 does not require disclosure of the information in these circumstances.
The Company has agreed to indemnify and hold harmless its auditors, BDO Audit Pty Ltd, against any and all losses, claims, costs, expenses, actions, demands, damages, liabilities or any other proceedings whatsoever incurred by the auditors in respect of any claim by a third party arising from or connected to any breach by the Company.
PROCEEDINGS ON BEHALF OF THE COMPANY No person has applied for leave of Court to bring proceedings on behalf of the Company or intervene in any proceedings to which the Company is a party for the purposes of taking responsibility on behalf of the Company for all or any part of those proceedings. The Company was not a party to any such proceedings during the year. SHARE OPTIONS Details of options issued, exercised and expired during the financial year are set out below:
Movements
Expiry Date Exercise Price
1 July 2014
Issued Exercised Expired 30 June 2015
15 August 2015 $0.15 5,717,835 - (1,330,000) - 4,387,835 30 June 2016 $0.20 - 5,250,000 - - 5,250,000 3 March 2018 $0.16162 - 3,000,000 - - 3,000,000
TOTAL 5,717,835 8,250,000 (1,330,000) - 12,637,835
Since year end 4,387,835 options have expired and as at the date of this report there were 8,250,000 options on issue.
For
per
sona
l use
onl
y

49
REMUNERATION REPORT - AUDITED This report outlines the remuneration arrangements in place for the Directors and key management personnel of Lamboo Resources Limited (the Company). Remuneration Policy The performance of the Company depends upon the quality of its Directors and executives. To prosper, the Company must attract, motivate and retain highly skilled Directors and executives. The Board of Directors is responsible for determining and reviewing compensation arrangements for the Directors and the executive team. The Board of Directors assesses the appropriateness of the nature and amount of emoluments of such officers on a periodic basis by reference to relevant employment market conditions with the overall objective of ensuring maximum stakeholder benefit from the retention of a high quality board and executive team. Such officers are given the opportunity to receive their base emolument in a variety of forms including cash, equity and fringe benefits. It is intended that the manner of payments chosen will be optimal for the recipient without creating undue cost for the Company. Further details on the remuneration of Directors and executives are set out in this Remuneration Report. The Company aims to reward the executive Directors and key management personnel with a level and mix of remuneration commensurate with their position and responsibilities within the Company. The Board’s policy is to align Director and executive objectives with shareholder and business objectives by providing a fixed remuneration component and offering long-term incentives. In accordance with best practice corporate governance, the structure of non-executive Director, executive Director and key management personnel remuneration is separate and distinct except that non-executive Directors, as well as executives may participate in incentives involving the issue to them of securities in the Company. Non-Executive Director Remuneration The Board seeks to set aggregate remuneration at a level which provides the Company with the ability to attract and retain Directors of the highest calibre, whilst incurring a cost which is acceptable to shareholders. The Company’s specific policy for determining the nature and amount of emoluments of board members of the Company is as follows: In accordance with the Constitution, the existing Shareholders of the Company have determined in general meeting that the maximum non-executive Director remuneration to be $300,000 in total, per annum. As at 30 June 2015 each non-executive Director was entitled to receive fees of $60,000 per annum and the Chairman $90,000 per annum. On 5 August 2015, the Directors resolved to reduce the amounts payable effective from 1 August 2015 to $40,000 per annum for each non-executive Director and $60,000 per annum for the Chairman. A Director will not be entitled to receive Directors’ fees if he or she is employed by the Company in a full-time executive capacity. A Director may also be paid fees or other amounts as the Directors determine if a Director performs special duties or otherwise performs services outside the scope of the ordinary duties of a Director. A Director will also be reimbursed for out of pocket expenses incurred as a result of their Directorship or any special duties. The remuneration of non-executive Directors for the year ending 30 June 2015 is detailed in Table 1 of this Remuneration Report. Executive Directors and Key Management Personnel Remuneration The Company aims to reward the executive Directors and key management personnel with a level and mix of remuneration commensurate with their position and responsibilities within the Company and so as to: reward executives for Company and individual performance against targets set by reference to appropriate
benchmarks; align the interests of executives with those of shareholders; link reward with the strategic goals and performance of the Company; and ensure total remuneration is competitive by market standards. The remuneration of the executive chairman and key management personnel for the year ending 30 June 2015 is detailed in Tables 1 and 2.
For
per
sona
l use
onl
y

50
Employment Contracts
Agreement with the Chief Executive Officer and Executive Director On 1 July 2014, the Company and Anthony Cormack entered into an agreement containing the terms and conditions under which he will provide his services to the Company. Mr Cormack was initially appointed a Chief Operating Officer, and became an Executive Director on 17 December 2014. On 16 April 2015 Mr Cormack was appointed as Interim Chief Executive Officer of the Company. The agreement: has no specified term; involves the payment to Anthony Cormack of an annual salary of $240,000 plus statutory superannuation and
reimbursement of all reasonable business expenses; participate in an annual incentive plan (at the discretion of the Board); has provision for three months’ notice for termination. The Company may terminate this employment agreement by
providing three months written notice or providing payment in lieu of the notice period; and otherwise contains standard terms relating to confidentiality, conflicts of interest and representations and warranties. Agreement with the former Managing Director On 15 March 2012, the Company and Richard Trevillion entered into an agreement containing the terms and conditions under which he will provide his services as chief executive officer of the Company. This agreement was updated on 1 June 2014. The agreement: has no specified term; involves the payment to Richard Trevillion of an annual salary of $300,000 plus statutory superannuation and
reimbursement of all reasonable business expenses; participate in an annual incentive plan (at the discretion of the Board); has provision for six months’ notice for termination. The Company may terminate this employment agreement by
providing 6 months written notice or providing payment in lieu of the notice period; and otherwise contains standard terms relating to confidentiality, conflicts of interest and representations and warranties. Richard resigned effective 16 April 2015. Agreement with the former Chief Technical Officer On 23 May 2014, the Company and Craig Rugless entered into an agreement containing the terms and conditions under which he will provide his services as chief technical officer of the Company. The agreement: has no specified term; involves the payment to Craig Rugless of an annual salary of $175,000 plus statutory superannuation and
reimbursement of all reasonable business expenses; participate in an annual incentive plan (at the discretion of the Board); has provision for three months’ notice for termination. The Company may terminate this employment agreement by
providing 3 months written notice or providing payment in lieu of the notice period; and otherwise contains standard terms relating to confidentiality, conflicts of interest and representations and warranties.
Craig Rugless resigned from the Company on 21 August 2014. Agreement with Company Secretaries Since her appointment on 20 November 2014, the Joint Company Secretary and CFO, Ms Leni Stanley, is engaged on an on-going consultancy style agreement for the provision of services as company secretary and chief financial officer. Services are invoiced monthly based on an agreed monthly fee. The contract provides for a three month notice period. Since his appointment on 20 November 2014, the Joint Company Secretary, Mr Brent Van Staden, is engaged on an on-going consultancy style agreement for the provision of services as company secretary. Services are invoiced monthly based on an agreed monthly fee. The contract provides for a three month notice period. In addition, Mr Van Staden provides legal services which are invoiced based on the services provided. Agreement with the former Company Secretary Up until his resignation on 25 November 2014, the Company Secretary and CFO, Mr Paul Marshall, was engaged on an on-going consultancy style agreement for the provision of services as company secretary and chief financial officer. Services were invoiced monthly based on services provided. The contract provided for a three month notice period.
For
per
sona
l use
onl
y

51
Details of Directors and Key Management Personnel Directors - Current Name Position Period of Directorship
Neville Miles Non-Executive Chairman Appointed 9 December 2014
Anthony Cormack Executive Director and CEO Appointed 17 December 2014
Garry Plowright Non-Executive Director Appointed 10 June 2015
Directors - Past Name Position Period of Directorship
Bruce Preston Non-Executive Chairman Appointed 6 January 2014. Resigned 9 December 2014
Richard Trevillion Managing Director and CEO Appointed 20 December 2010. Resigned 16 April 2015
Wenzhao Xie Non-Executive Director Appointed 1 August 2014. Resigned 19 December 2014
Alvars Lee Hon Nam Non-Executive Director Appointed 11 September 2014. Resigned 26 May 2015
Greg Baynton Non-Executive Director Appointed 6 January 2014. Resigned 11 September 2014
Key Management Personnel Name Position Detail
Leni Stanley Joint Company Secretary & CFO Commenced 20 November 2014
Brent Van Staden Joint Company Secretary Commenced 20 November 2014
Paul Marshall Company Secretary Commenced 15 June 2012. Ceased 25 November 2014
Craig Rugless Chief Technical Officer Commenced in position 23 May 2014. Ceased 21 August 2014
Key management personnel are those directly accountable and responsible for the operational management and strategic direction of the Company and the Consolidated Entity.
For
per
sona
l use
onl
y

52
Table 1: Director Remuneration
2014
Short Term Long Term
Post-Employment Share-based
Payments
Salary & Fees
Cash Bonus
Leave Entitle-ments
Superan-nuation
Retirement benefits
Options Total Performance
Related %
% consisting of options
$ $ $ $ $ $ $
Directors
Richard Trevillion 208,333 - 21,885 19,271 - - 249,489 - -
Craig Rugless(1) 156,781 - 16,469 14,503 - - 187,753 - -
Bruce Preston(2) 45,000 - - - - - 45,000 - -
Greg Baynton(2) 32,500 - - - - - 32,500
Rod Williams(3) 54,167 - - - - - 54,167 - -
Rick Anthon(4) 45,000 - - - - - 45,000 - -
541,781 - 38,354 33,774 - - 613,909
(1) Craig Rugless resigned as director on 23 May 2014. From 24 May 2014 to 30 June 2014 he continued employment with the Company on the same remuneration terms in a
management capacity. (2) Bruce Preston and Greg Baynton were appointed as directors on 6 January 2014. (3) Rod Williams resigned as director on 2 May 2014. (4) Rick Anthon resigned as director on 6 January 2014.
2015
Short Term Long Term
Post-Employment Share-based
Payments
Salary & Fees
Cash Bonus
Leave Entitle-ments
Superan-nuation
Retirement benefits
Options Total Performance
Related %
% consisting of options
$ $ $ $ $ $
Directors
Neville Miles(1) 50,671 - - - - - 50,671 - -
Anthony Cormack(2) 240,000 - - 21,886 - - 261,886 - -
Garry Plowright(3) 3,333 - - - - - 3,333 - -
Richard Trevillion(4) 275,000 - - 26,125 - - 301,125 - -
Alvars Lee Hon Nam(5) 46,511 - - - - - 46,511 - -
Wenzhao Xie(6) 24,917 - - - - - 24,917 - -
Bruce Preston(7) 45,000 - - - - - 45,000 - -
Greg Baynton(8) 12,639 - - - - - 12,639 - -
698,071 - - 48,011 - - 746,082
(1) Neville Miles was appointed Non-Executive Director on 9 December 2014. (2) Anthony Cormack was a fulltime employee for the whole year and was appointed Director on 17 December 2014. (3) Garry Plowright was appointed Non-Executive Director on 10 June 2015. (4) Richard Trevillion resigned as Managing Director and CEO on 16 April 2015. (5) Alvars Lee Hon Man was appointed Director on 11 September 2014 and resigned on 26 May 2015. (6) Wenzhao Xie was appointed Director on 1 August 2014 and resigned 19 December 2014. (7) Bruce Preston resigned on 9 December 2014. (8) Greg Baynton resigned on 11 September 2014.
Table 2: Remuneration of key management personnel
2014
Short Term Long Term
Post-Employment Share-based
Payments
Salary & Fees
Cash Bonus
Leave Entitle-ments
Superan-nuation
Retirement benefits Options Total
Performance Related %
% consisting of options
$ $ $ $ $ $ $
Key Management Personnel
Craig Rugless(1) 18,219 - 1,914 1,685 - - 21,818
Paul Marshall 52,667 - - - - - 52,667
70,886 - 1,914 1,685 - - 74,485 - -
(1) Craig Rugless resigned as director on 23 May 2014. From 24 May 2014 to 30 June 2014 he continued employment with the Company on the same remuneration terms in a
management capacity.
For
per
sona
l use
onl
y

53
2015
Short Term Long Term
Post-Employment Share-based
Payments
Salary & Fees
Cash Bonus
Leave Entitle-ments
Superan-nuation
Retirement benefits Options Total
Performance Related %
% consisting of options
$ $ $ $ $ $ $
Key Management Personnel
Leni Stanley (1) 16,664 - - - - - 16,664
Brent Van Staden (2) 13,179 - - - - - 13,179
Craig Rugless (3) 35,208 - 11,396 4,427 - - 51,031
Paul Marshall (4) 25,000 - - - - - 25,000
90,051 - 11,396 4,427 - - 105,874 - -
(1) Leni Stanley was appointed Joint Company Secretary on 20 November 2014. (2) Brent Van Staden was appointed Joint Company Secretary on 20 November 2014. (3) Craig Rugless ceased employment on 21 August 2014. (4) Paul Marshall ceased as Company Secretary on 25 November 2015.
Termination benefits No termination benefits were paid during the 2015 financial year (2014: Nil). Bonuses No proportion of the remuneration of any key management personnel was performance based. No key management personnel received cash bonuses, performance related bonuses, termination benefits or non-cash benefits during the year or comparative year. Equity instruments issued as part of remuneration No equity instruments were issued to Directors and executives as part of their remuneration. No shares were issued on the exercise of compensation options in the 2015 financial year (2014: Nil). Table 3: Director/Key Management Personnel shareholdings (number of shares) 2015 Opening
Balance Additions Options
Exercised Performance
Rights exercised
Net Change Other
Closing Balance
Directors
Neville Miles 1 - 602,756 - - 522,383 1,125,139
Anthony Cormack - 168,974 - - - 168,974
Garry Plowright - - - - - -
Richard Trevillion 1 3,826,040 - - - (3,826,040) -
Alvars Lee Hon Nam - - - - - -
Wenzhao Xie - - - - - -
Bruce Preston 1 300,000 - 150,000 - (450,000) -
Greg Baynton 1 2,634,304 - - 2,247,997 (4,882,301) -
Key Management Personnel
Leni Stanley - - - - - -
Brent Van Staden - - - - - -
Craig Rugless 2 10,685,000 - - - (10,685,000) -
Paul Marshall 697,498 - - - (697,498) -
Total 18,142,842 771,730 150,000 2,247,997 (20,018,456) 1,294,113
1 Net change other - movement on appointment/(retirement) as Director. 2 Net change other - movement on appointment/(retirement) as Key Management Personnel.
For
per
sona
l use
onl
y
54
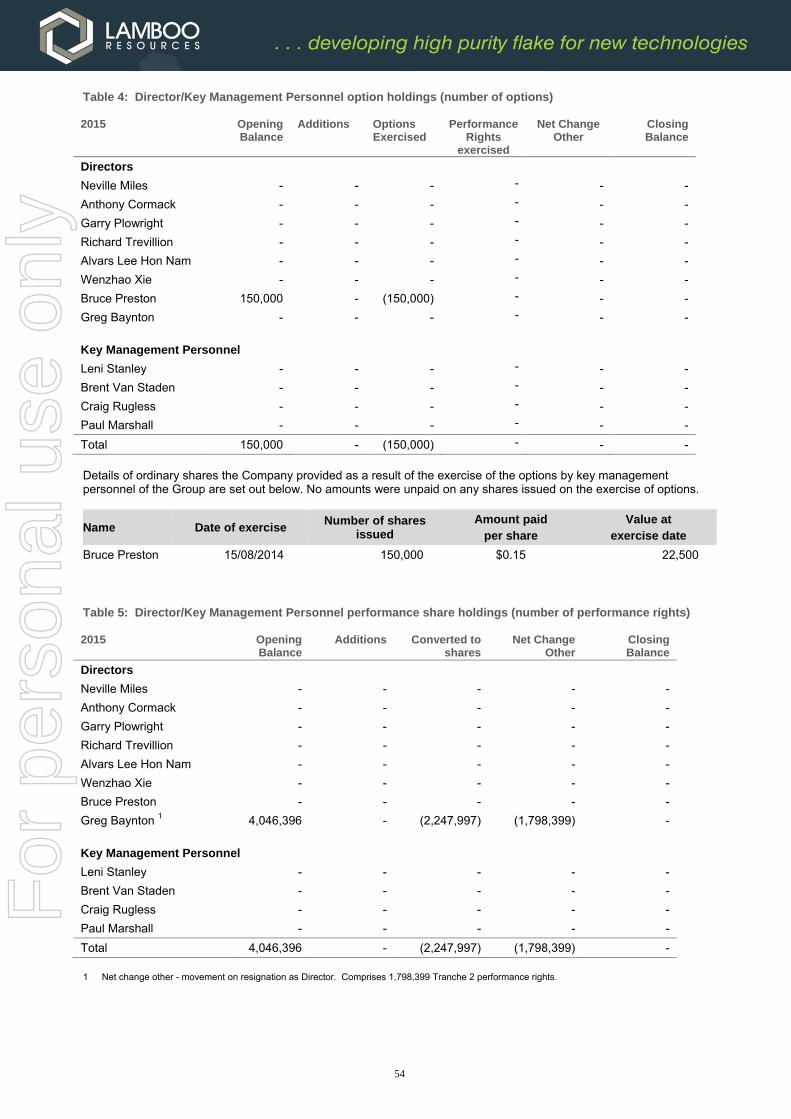
Table 4: Director/Key Management Personnel option holdings (number of options) 2015 Opening
Balance Additions Options
Exercised Performance
Rights exercised
Net Change Other
Closing Balance
Directors
Neville Miles - - - - - -
Anthony Cormack - - - - - -
Garry Plowright - - - - - -
Richard Trevillion - - - - - -
Alvars Lee Hon Nam - - - - - -
Wenzhao Xie - - - - - -
Bruce Preston 150,000 - (150,000) - - -
Greg Baynton - - - - - -
Key Management Personnel
Leni Stanley - - - - - -
Brent Van Staden - - - - - -
Craig Rugless - - - - - -
Paul Marshall - - - - - -
Total 150,000 - (150,000) - - -
Details of ordinary shares the Company provided as a result of the exercise of the options by key management personnel of the Group are set out below. No amounts were unpaid on any shares issued on the exercise of options.
Name Date of exercise Number of shares
issued Amount paid
per share Value at
exercise date
Bruce Preston 15/08/2014 150,000 $0.15 22,500 Table 5: Director/Key Management Personnel performance share holdings (number of performance rights) 2015 Opening
Balance Additions Converted to
shares Net Change
Other Closing Balance
Directors
Neville Miles - - - - -
Anthony Cormack - - - - -
Garry Plowright - - - - -
Richard Trevillion - - - - -
Alvars Lee Hon Nam - - - - -
Wenzhao Xie - - - - -
Bruce Preston - - - - -
Greg Baynton 1 4,046,396 - (2,247,997) (1,798,399) -
Key Management Personnel
Leni Stanley - - - - -
Brent Van Staden - - - - -
Craig Rugless - - - - -
Paul Marshall - - - - -
Total 4,046,396 - (2,247,997) (1,798,399) -
1 Net change other - movement on resignation as Director. Comprises 1,798,399 Tranche 2 performance rights.
For
per
sona
l use
onl
y

55
Other transactions with key management personnel
PEI International Limited, an entity associated with Alvars Lee Hon Nam, provided consulting services totaling $126,078 (2014: $Nil) to the Company during the year. The amount payable at year end was $Nil (2014: $Nil).
Norvale Pty Ltd, an entity associated with Rod Williams, provided geological services totaling $Nil (2014: $18,000) to the Company during the year. The amount payable at year end was $Nil (2014: $Nil).
Pathfinder Exploration Pty Ltd, an entity associated with Craig Rugless, leased geological equipment totaling $Nil (2014: $37,120) to the Company during the year. The amount payable at year end was $Nil (2014: $Nil).
Relationship between remuneration and Company performance
The factors that are considered to affect shareholder return over the last 5 years are summarised below:
Measures 2015 2014 2013 2012 2011
Share price at end of financial year ($) 0.06 0.90 0.08 0.38 0.02
Market capitalisation at end of financial year ($M) 10.27 107.97 6.37 25.52 1.08
Profit/(loss) for the financial year ($) (5,693,038) (1,888,768) (5,215,600) (4,736,892) (2,402,326)
Director and Key Management Personnel remuneration 851,956 688,394 646,998 1,129,690 385,392
Given that the remuneration is commercially reasonable, the link between remuneration, Company performance and shareholder wealth generation is tenuous, particularly in the exploration and development stage of a minerals company. Share prices are subject to the influence of international metal prices and market sentiment towards the sector and increases or decreases may occur independently of executive performance or remuneration.
The Company may issue options to provide an incentive for key management personnel which, it is believed, is in line with industry standards and practice and is also believed to align the interests of key management personnel with those of the Company’s shareholders.
The Company did not engage remuneration consultants during the 2015 financial year to review management and other staff remuneration packages.
End of Remuneration Report
For
per
sona
l use
onl
y

56
NON-AUDIT SERVICES
The Company may decide to employ the auditor on assignments additional to their statutory audit duties where the auditor's expertise and experience with the Company and/or the group are important.
The Board of Directors has considered the position and are satisfied that the provision of the non-audit services is compatible with the general standard of independence for auditors imposed by the Corporations Act 2001. The Directors are satisfied that the provision of non-audit services by the auditor, as set out below, did not compromise the auditor independence requirements of the Corporations Act 2001 for the following reasons:
all non-audit services have been reviewed by the Board of Directors to ensure they do not impact theimpartiality and objectivity of the auditor
none of the services undermine the general principles relating to auditor independence as set out in APES 110Code of Ethics for Professional Accountants.
During the year the following fees were paid or payable for non-audit services provided by the auditor of the parent entity, BDO Audit Pty Ltd and its related practices:
$
Taxation services 36,468
Independent Accountants Report for Prospectus 20,000
Technical Advice 4,000 Due Diligence (BDO Financial Services Limited – Hong Kong)
82,588
AUDITOR’S INDEPENDENCE DECLARATION
The Auditor’s Independence Declaration forms part of the Directors’ Report and is attached on page 57.
EVENTS AFTER BALANCE SHEET DATE
Capital Raising
Since the end of the financial year the Company has issued 34,242,560 fully paid ordinary shares under a rights issue raising $2,054.554.
Performance Rights
Since the end of the financial year the Company has issued 10,000,000 fully paid ordinary shares following the exercise of Tranche 2 of the performance rights issued in 2012 in relation to the acquisition of Opirus Minerals Pty Ltd. As at the date of this report there are no more performance rights on issue.
Options
Since 30 June 2015 4,387,835 unlisted options have expired.
Signed in accordance with a resolution of the Board of Directors
Anthony Cormack Director Dated this 29th day of September 2015 F
or p
erso
nal u
se o
nly
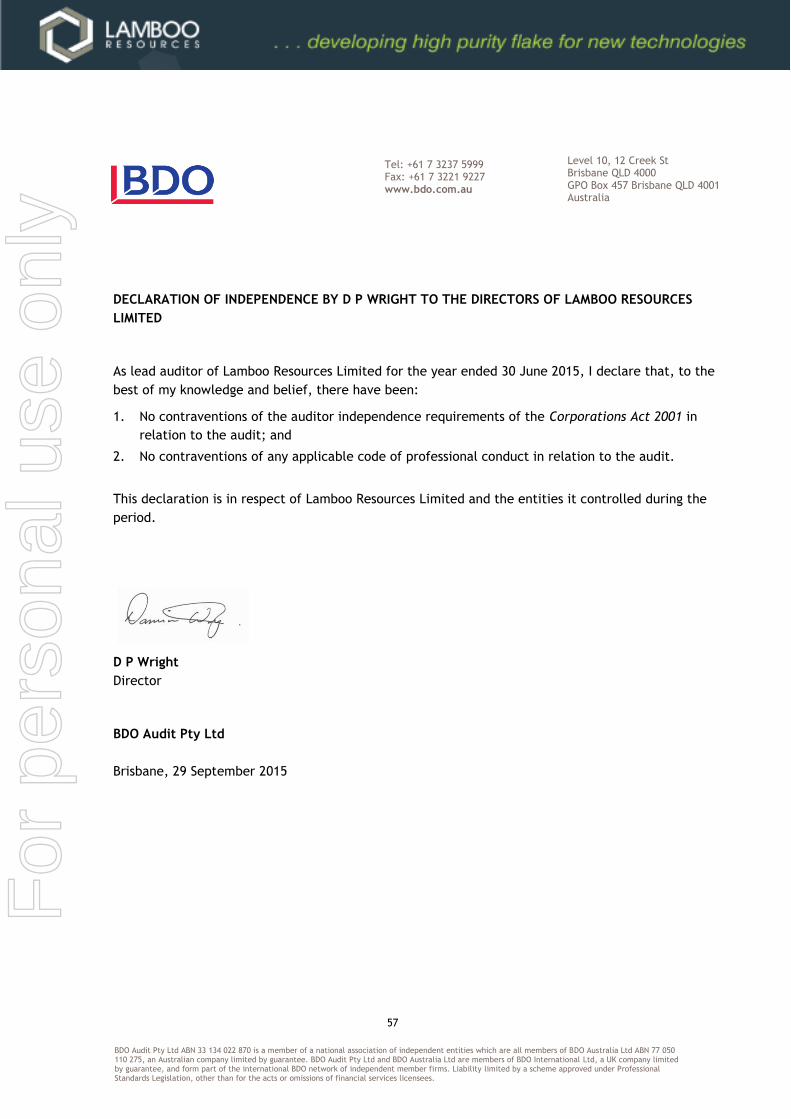
Tel: +61 7 3237 5999 Fax: +61 7 3221 9227 www.bdo.com.au
Level 10, 12 Creek St Brisbane QLD 4000 GPO Box 457 Brisbane QLD 4001 Australia
BDO Audit Pty Ltd ABN 33 134 022 870 is a member of a national association of independent entities which are all members of BDO Australia Ltd ABN 77 050 110 275, an Australian company limited by guarantee. BDO Audit Pty Ltd and BDO Australia Ltd are members of BDO International Ltd, a UK company limited by guarantee, and form part of the international BDO network of independent member firms. Liability limited by a scheme approved under Professional Standards Legislation, other than for the acts or omissions of financial services licensees.
DECLARATION OF INDEPENDENCE BY D P WRIGHT TO THE DIRECTORS OF LAMBOO RESOURCES
LIMITED
As lead auditor of Lamboo Resources Limited for the year ended 30 June 2015, I declare that, to the
best of my knowledge and belief, there have been:
1. No contraventions of the auditor independence requirements of the Corporations Act 2001 in
relation to the audit; and
2. No contraventions of any applicable code of professional conduct in relation to the audit.
This declaration is in respect of Lamboo Resources Limited and the entities it controlled during the
period.
D P Wright
Director
BDO Audit Pty Ltd
Brisbane, 29 September 2015
57
For
per
sona
l use
onl
y

58
INTERESTS IN EXPLORATION TENEMENTS Lamboo Resources Limited held the following interests in exploration tenements as at 20 September 2015:
Project Tenement Application Date Grant Date Expiry Date
McIntosh E80/4385 7/12/2009 7/4/2011 6/4/2016
WA E80/4797 23/5/2013 3/9/2014 2/9/2019
E80/4814 24/7/2013 3/9/2014 2/9/2019
E80/3864 29/1/2007 8/4/2008 7/4/2018
E80/3906 16/3/2007 3/12/2013 2/12/2018
E80/3907 16/3/2007 3/12/2008 2/12/2018
E80/3928 17/4/2007 2/6/2014 1/6/2019
E80/4396 22/1/2010 2/8/2011 1/8/2016
E80/4688 15/2/2012 25/10/2012 24/10/2017
E80/4732 24/8/2012 14/11/2013 13/11/2018
E80/4733 28/8/2012 15/11/2013 14/11/2018
E80/4739 20/9/2012 14/11/2013 13/11/2018
E80/4734 29/08/2012 17/9/2014 16/9/2019
E80/4825 28/08/2013 3/9/2014 2/9/2019
E80/4841 3/12/2013 27/8/2014 26/8/2019
E80/4842 3/12/2013 27/8/2014 26/8/2019
E80/4879 12/05/2014 23/7/2015 22/7/2020
E80/4931 16/12/2014 12/8/2015 11/8/2020
Halls P80/1799 9/5/2012 3/09/2013 2/09/2017
Creek P80/1800 9/5/2012 3/09/2013 2/09/2017
WA P80/1801 9/5/2012 3/09/2013 2/09/2017
E80/4793 17/5/2013 3/11/2014 2/11/2019
E80/4794 17/5/2013 3/9/2014 2/9/2019
E80/4795 17/5/2013 10/12/2014 9/12/2019
E80/4858 23/1/2014 Pending Pending
P80/1814 5/9/2013 7/10/2014 6/10/2018
P80/1815 5/9/2013 7/10/2014 6/10/2018
P80/1816 5/9/2013 7/10/2014 6/10/2018
P80/1817 5/9/2013 7/10/2014 6/10/2018
P80/1818 5/9/2013 7/10/2014 6/10/2018
P80/1821 31/10/2013 27/8/2014 26/8/2018
Valla EL6702 15/01/2015 14/01/2017
NSW
South Korea Dangjin 54-4 30/07/2014 31/07/2021
Dangjin 56-3 30/07/2014 31/07/2021
Dangjin 66-1 30/07/2014 31/07/2021
Dangjin 55-3 7/02/2012 6/02/2032
Dangjin 65-1 8/12/2011 7/12/2031
Dangjin 65-2 17/12/2009 16/12/2029
Dangjin-54-2 23/05/2013 22/05/2020
Dangjin-55-4 23/05/2013 22/05/2020
Hongcheon 91-2 15/11/2011 14/11/2031
Samcheok 09-2 9/01/2013 9/01/2020
For
per
sona
l use
onl
y

59
2015 MINERAL RESOURCES AND ORE RESERVES (MROR) STATEMENT SUMMARY
This statement represents the Mineral Resources and Ore Reserves (MROR) for Lamboo Resources Ltd (Lamboo or the Company) as at 31 August 2015.
This MROR statement has been compiled and reported in accordance with the guidelines of the 2012 Edition of the ‘Australasian Code for Reporting of Exploration Results, Mineral Resources and Ore Reserves’ (2012 JORC Code) also represents the first MROR statement for the Company.
This statement is to be reviewed and updated annually in accordance with Section 15 of the 2012 JORC Code. The nominated annual review date for this MROR statement going forward is 30 June.
The information in this statement has been extracted from the relevant reports as indicated below in each Mineral Resource table.
The McIntosh Project Mineral Resource estimates were reported in January 2014 in accordance with the guidelines of the 2012 Edition of the JORC Code. The Company is not aware of any new information or data that materially affects the information included in the relevant market releases for these estimates. The Company confirms that all material assumptions and technical parameters underpinning the estimates in the relevant market releases continue to apply and have not materially changed. The Company confirms that the form and context in which the Competent Person’s findings are presented here have not been materially modified.
The Geumam Project Mineral Resource estimates were reported in August 2014 in accordance with the guidelines of the 2012 Edition of the JORC Code. The Company is not aware of any new information or data that materially affects the information included in the relevant market releases for these estimates. The Company confirms that all material assumptions and technical parameters underpinning the estimates in the relevant market releases continue to apply and have not materially changed. The Company confirms that the form and context in which the Competent Person’s findings are presented here have not been materially modified. MINERAL RESOURCES
As at 31 August 2015 the Company’s Mineral Resources are: McIntosh Project, Western Australia
JORC 2012 compliant indicated and inferred resource for Target 1 at McIntosh of 7.135 Mt at 4.73% TGC (4.95% TC) over a strike length of 400 m and to a depth of 200 m RL. The resource contains 337.7 Kt of contained graphite at a nominal cut-off grade of 2% TGC.
Target 1 Flake Graphite Resource estimated at 2.0% TGC lower cut off.
The McIntosh Target 1 Mineral Resource was most recently reported in January 2014 in accordance with the 2012 JORC Code (refer to ASX Release 'Significant Flake Graphite JORC Resource Increase at McIntosh Target 1’ dated 20 January 2014 available to view at www.lambooresources.com.au). The original report was prepared by Mr Rod Williams (CP) in January 2014.
Comparison with previous year’s estimate
There was no change in the JORC 2012 compliant resource at McIntosh from that reported at the end of the 2014 financial year, the current resource at the project remains at 7.135 Mt at 4.73% TGC (4.95% TC) as noted above. The resource contains 337.7 Kt of contained graphite at a nominal cut-off grade of 2% TGC.
For
per
sona
l use
onl
y

60
Geumam Project, South Korea A JORC 2012 compliant maiden indicated and inferred mineral resource estimate of 5.5Mt at 5.4% Cg for 300,000 tonnes of contained graphite at Area B Prospect, Geumam Flake Graphite Project, South Korea was completed in July 2014.
Geumam Area B July 2014 Inferred Mineral Resource Estimate (1% C graphite Cut-off)
Note – Totals may differ due to rounding Mineral Resources reported on a dry in-situ basis The Geumam Mineral Resource was most recently reported in August 2014 in accordance with the 2012 JORC Code (refer to ASX Release 'Maiden Independent Resource Estimate – Area B Prospect South Korean - Geumam Flake Graphite Project’ dated 4 August 2014 available to view at www.lambooresources.com.au). The original report was compiled by Mr Shaun Searle and reviewed by Mr Robert Dennis who is a Member of the Australasian institute of Mining and Metallurgy and a Member of the Australian Institute of Geoscientists. Mr Dennis is an employee of RungePincockMinarco Limited.
ORE RESERVES
As at 31 August 2014 the Company had no reportable Ore Reserves in accordance with the 2012 JORC Code.
GOVERNANCE SUMMARY
The Mineral Resource estimates listed in this report are subject to Lamboo’s governance arrangements and internal controls. Lamboo’s Mineral Resource estimates are derived by Competent Person’s (CP) with the relevant experience in the style of mineralisation and type of deposit under consideration and to the activity which they are undertaking. The CP carries out reviews of the quality and suitability of the data underlying the Mineral Resource estimate. Lamboo management and board conducts its own internal review of the estimate to ensure that it has been classified and reported in accordance with the 2012 JORC Code.
COMPETENT PERSONS REVIEW This Mineral Resources and Ore Reserves Statement as a whole has been prepared and approved by Mr Tony Cormack, based on the information and supporting documentation prepared and consented to previously by the Competent Persons referred to above. Mr Cormack is a full-time employee of the Company, and is a Member of the Australasian Institute of Mining and Metallurgy. Mr Cormack has sufficient experience to qualify as a Competent Person as defined in the 2012 Edition of the ‘Australasian Code for Reporting of Exploration Results, Mineral Resources and Ore Reserves’. Mr Cormack confirms that the form and context in which the Competent Persons’ findings are presented have not been materially modified from the original market announcements. Mr Cormack has approved the Statement as a whole and consents to its inclusion in the Annual Report in the form and context in which it appears.
Area Ore TypeResource
ClassificationTonnes (Mt)
Graphite (%TGC)
Contained Graphite (tonnes)
Geumam (Area B) Primary Indicated 1.0 6.3 65,000
Oxidised Indicated 0.5 7.2 37,000
Primary Inferred 3.8 4.8 183,000
Oxidised Inferred 0.1 7.8 11,000
Oxide + Primary Total Resource 5.5 5.4 296,000
For
per
sona
l use
onl
y

61
Consolidated Statement of Comprehensive Income For the year ended 30 June 2015
Note 2015
2014
(restated) $ $ Interest revenue 15,073 55,474
Other revenue 77 21,725
Unrealised FX on Hengda Deposit 2 383,905 -
Fair value gain on Lind options derivative liability 12 185,180 -
Employee expenses (728,419) (822,564)
Corporate and administration expenses (1,323,476) (1,077,587)
Exploration costs expensed (27,596) -
Costs relating to acquiring and managing tenements under application - (65,816)
Due diligence expenses 2 (1,012,545) -
Provision for non-recovery of Hengda Deposit 2 (2,593,362) -
Fair value loss on financial liability at fair value through profit or loss 12 (591,875) -
Loss before income tax (5,693,038) (1,888,768)
Income tax - -
Loss after income tax expense (5,693,038) (1,888,768)
Other comprehensive income
Items that may be reclassified to profit or loss
Exchange differences on translation of foreign operations 15 20,101 9,214
Other comprehensive income for the year, net of tax 20,101 9,214
Total comprehensive income (5,672,937) (1,879,554)
Loss per Share Cents Cents Basic and diluted loss per share 5 (4.1) (1.9)
Basic and diluted loss per share 5 (4.1) (1.9)
The Consolidated Statement of Comprehensive Income should be read in conjunction with the Notes to the Financial Statements.
For
per
sona
l use
onl
y
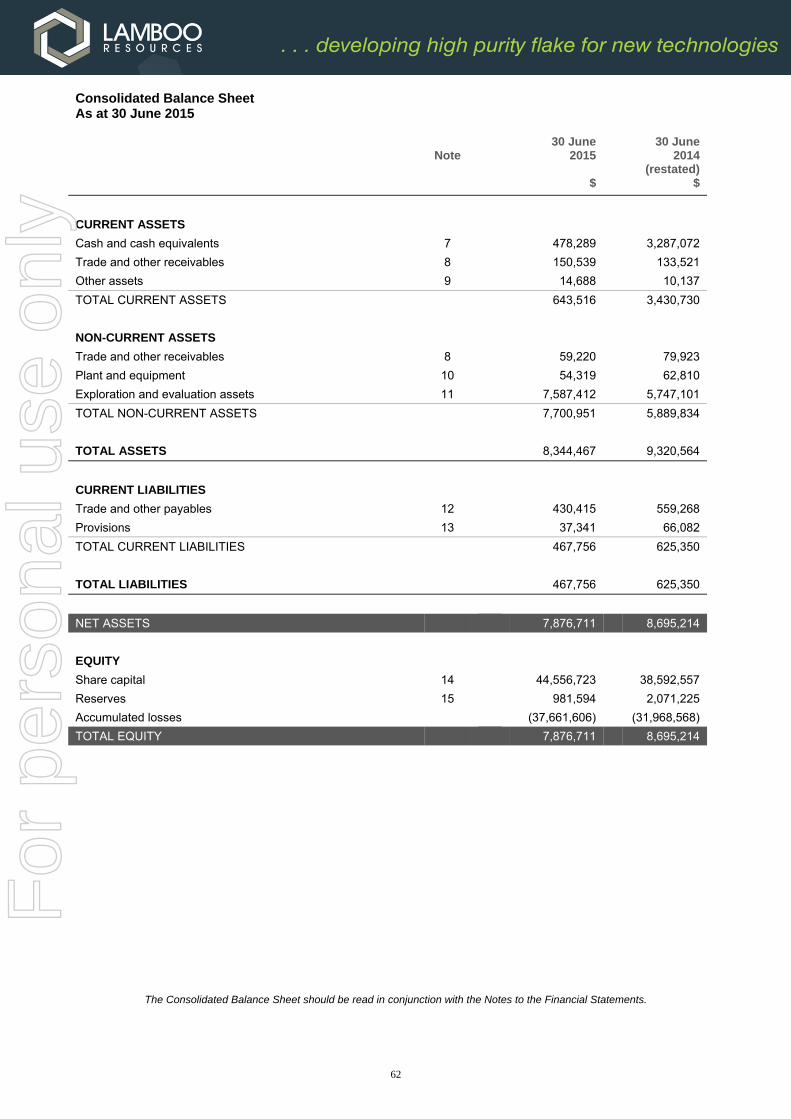
62
Consolidated Balance Sheet As at 30 June 2015
Note 30 June
2015 30 June
2014 (restated)
$ $
CURRENT ASSETS
Cash and cash equivalents 7 478,289 3,287,072
Trade and other receivables 8 150,539 133,521
Other assets 9 14,688 10,137
TOTAL CURRENT ASSETS 643,516 3,430,730
NON-CURRENT ASSETS
Trade and other receivables 8 59,220 79,923
Plant and equipment 10 54,319 62,810
Exploration and evaluation assets 11 7,587,412 5,747,101
TOTAL NON-CURRENT ASSETS 7,700,951 5,889,834
TOTAL ASSETS 8,344,467 9,320,564
CURRENT LIABILITIES
Trade and other payables 12 430,415 559,268
Provisions 13 37,341 66,082
TOTAL CURRENT LIABILITIES 467,756 625,350
TOTAL LIABILITIES 467,756 625,350
NET ASSETS 7,876,711 8,695,214
EQUITY
Share capital 14 44,556,723 38,592,557
Reserves 15 981,594 2,071,225
Accumulated losses (37,661,606) (31,968,568)
TOTAL EQUITY 7,876,711 8,695,214
The Consolidated Balance Sheet should be read in conjunction with the Notes to the Financial Statements.
For
per
sona
l use
onl
y
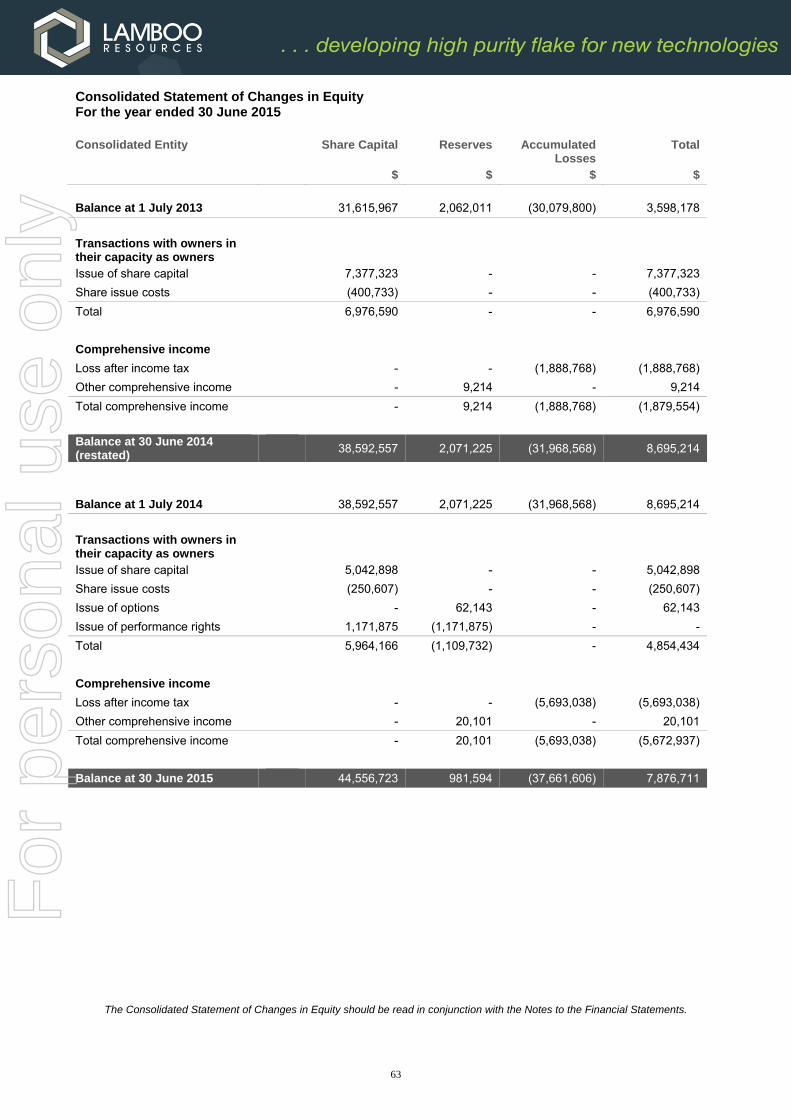
63
Consolidated Statement of Changes in Equity For the year ended 30 June 2015 Consolidated Entity
Share Capital Reserves Accumulated Losses
Total
$ $ $ $
Balance at 1 July 2013 31,615,967 2,062,011 (30,079,800) 3,598,178
Transactions with owners in their capacity as owners
Issue of share capital 7,377,323 - - 7,377,323
Share issue costs (400,733) - - (400,733)
Total 6,976,590 - - 6,976,590
Comprehensive income
Loss after income tax - - (1,888,768) (1,888,768)
Other comprehensive income - 9,214 - 9,214
Total comprehensive income - 9,214 (1,888,768) (1,879,554)
Balance at 30 June 2014 (restated)
38,592,557 2,071,225 (31,968,568) 8,695,214
Balance at 1 July 2014 38,592,557 2,071,225 (31,968,568) 8,695,214
Transactions with owners in their capacity as owners
Issue of share capital 5,042,898 - - 5,042,898
Share issue costs (250,607) - - (250,607)
Issue of options - 62,143 - 62,143
Issue of performance rights 1,171,875 (1,171,875) - -
Total 5,964,166 (1,109,732) - 4,854,434
Comprehensive income
Loss after income tax - - (5,693,038) (5,693,038)
Other comprehensive income - 20,101 - 20,101
Total comprehensive income - 20,101 (5,693,038) (5,672,937)
Balance at 30 June 2015 44,556,723 981,594 (37,661,606) 7,876,711
The Consolidated Statement of Changes in Equity should be read in conjunction with the Notes to the Financial Statements.
For
per
sona
l use
onl
y

64
Consolidated Statement of Cash Flows For the year ended 30 June 2015
Note
2015 2014
(restated) $ $
CASH FLOWS FROM OPERATING ACTIVITIES
Payments to suppliers and employees (1,921,745) (1,911,253)
Payments for due diligence activities (1,012,545) -
Interest received 15,073 52,979
Receipts from consulting revenue - 21,725
Net cash used in operating activities 16 (2,919,217) (1,836,549)
CASH FLOWS FROM INVESTING ACTIVITIES
Payments for plant and equipment (49,773) (18,011)
Payments for exploration and evaluation (2,897,081) (4,152,648)
Government grants in relation to exploration assets 856,696 1,398,013
Payments for Hengda Deposit (2,209,456) -
Receipt of security deposit refund 34,539 -
Payments for security deposits (13,836) (18,065)
Net cash used in investing activities (4,278,911) (2,790,711)
CASH FLOWS FROM FINANCING ACTIVITIES
Proceeds from issue of shares 4,426,429 7,209,823
Share issue costs (250,607) (461,233)
Proceeds from borrowings 900,000 -
Repayment of borrowings (786,477) -
Share application monies - 121,760
Net cash provided by financing activities 4,389,345 6,870,350
Net increase/ (decrease) in cash and cash equivalents (2,808,783) 2,243,090
Cash and cash equivalents at the beginning of the year 3,287,072 1,034,769
Net foreign exchange differences - 9,213
Cash and cash equivalents at the end of the year 7 478,289 3,287,072
The Consolidated Statement of Cash Flows should be read in conjunction with the Notes to the Financial Statements.
For
per
sona
l use
onl
y

65
NOTE 1 SUMMARY OF SIGNIFICANT ACCOUNTING POLICIES Introduction This financial report covers the Consolidated Entity of Lamboo Resources Limited (the “Company”) and its controlled entities (together referred to as the “Consolidated Entity” or “Group”). Lamboo Resources Limited is a listed public company, incorporated and domiciled in Australia. The Consolidated Entity is a for-profit entity for the purpose of preparing the financial statements. The following is a summary of the material accounting policies adopted by the Consolidated Entity in the preparation of the financial report. The accounting policies have been consistently applied, unless otherwise stated. Operations and principal activities The principal activity of the Consolidated Entity is mineral exploration. Currency The financial report is presented in Australian dollars, rounded to the nearest dollar, which is the functional currency of the Parent Entity. Authorisation of financial report The financial report was authorised for issue on 29 September 2015. Basis of preparation These general purpose financial statements have been prepared in accordance with Australian Accounting Standards and the Corporations Act 2001. Compliance with IFRS The consolidated financial statements of the Lamboo Resources Limited Group also comply with International Financial Reporting Standards (IFRS) as issued by the International Accounting Standards Board (IASB). Material accounting policies adopted in the preparation of these financial statements are presented below and have been consistently applied unless otherwise stated. Historical cost convention The financial statements have been prepared on an accruals basis and are based on historical costs, modified, where applicable, by the measurement at fair value of selected non-current assets, financial assets and financial liabilities. Critical accounting estimates and judgements The preparation of financial statements in conformity with IFRS requires the use of certain critical accounting estimates. It also requires management to exercise its judgement in the process of applying the Consolidated Entity’s accounting policies. The Directors evaluate estimates and judgments incorporated into the financial report based on historical knowledge and best available current information. Estimates assume a reasonable expectation of future events and are based on historical experiences and the best available current information on current trends and economic data, obtained both externally and within the Consolidated Entity. These estimates and judgements made assume a reasonable expectation of future events but actual results may differ from these estimates. The estimates and underlying assumptions are reviewed on an ongoing basis. Revisions to accounting estimates are recognised in the period in which the estimate is revised if the revision effects only that period or in the period and future periods if the revision affects both current and future periods. There were no key adjustments during the year which required estimates and/or judgements. Key estimates – impairment The Consolidated Entity assesses impairment at each reporting date by evaluating conditions specific to the Consolidated Entity that may lead to impairment of assets. Where an impairment trigger exists, the recoverable amount of the asset is determined. Key judgements – Exploration & evaluation expenditure The Consolidated Entity performs regular reviews on each area of interest to determine the appropriateness of continuing to carry forward costs in relation to that area of interest. These reviews are based on detailed surveys and analysis of drilling results performed to balance date.
For
per
sona
l use
onl
y

66
NOTE 1 SUMMARY OF SIGNIFICANT ACCOUNTING POLICIES (continued) Going Concern The Consolidated Entity incurred a net loss of $5,693,038 for the year ended 30 June 2015. As at 30 June 2015 the Consolidated Entity had cash reserves of $478,289, net current assets of $175,760 and net assets of $7,876,711. The Consolidated Entity has not generated revenues from operations during the year. The ability of the Consolidated Entity to continue as a going concern is principally dependent upon one or more of the following: the ability of the company to raise additional capital in the future; and the successful exploration and subsequent exploitation of the consolidated entity’s tenements.
These conditions give rise to material uncertainty which may cast significant doubt over the Consolidated Entity’s ability to continue as a going concern. The directors believe that the going concern basis of preparation is appropriate due to the following reasons: To date the Consolidated Entity has funded its activities through issuance of equity securities and it is expected that
the Consolidated Entity will be able to fund its future activities through further issuances of equity securities; and The Directors believe there is sufficient cash available for the Consolidated Entity to continue operating until it can
raise sufficient further capital to fund its ongoing activities.
Should the Consolidated Entity be unable to continue as a going concern, it may be required to realise its assets and extinguish its liabilities other than in the ordinary course of business, and at amounts that differ from those stated in the financial statements. This financial report does not include any adjustments relating to the recoverability and classification of recorded asset amounts or the amounts or classification of liabilities and appropriate disclosures that may be necessary should the Consolidated Entity be unable to continue as a going concern. Accounting policies (a) Principles of Consolidation
Subsidiaries are all entities (including structured entities) over which the Consolidated Entity has control. The Consolidated Entity controls an entity when the Consolidated Entity is exposed to, or has rights to, variable returns from its involvement with the entity and has the ability to affect those returns through its power to direct the activities of the entity. Subsidiaries are fully consolidated from the date on which control is transferred to the Consolidated Entity. They are deconsolidated from the date that control ceases. The acquisition method of accounting is used to account for business combinations by the Consolidated Entity. Intercompany transactions, balances and unrealised gains on transactions between Consolidated Entity companies are eliminated. Unrealised losses are also eliminated unless the transaction provides evidence of an impairment of the transferred asset. Accounting policies of subsidiaries have been changed where necessary to ensure consistency with the policies adopted by the Consolidated Entity. Non-controlling interests in the results and equity of subsidiaries are shown separately in the consolidated income statement, statement of comprehensive income, statement of changes in equity and balance sheet respectively. Business combinations Business combinations occur where an acquirer obtains control over one or more businesses. A business combination is accounted for by applying the acquisition method, unless it is a combination involving entities or businesses under common control. The business combination will be accounted for from the date that control is attained, whereby the fair value of the identifiable assets acquired and liabilities (including contingent liabilities) assumed is recognised (subject to certain limited exemptions). F
or p
erso
nal u
se o
nly
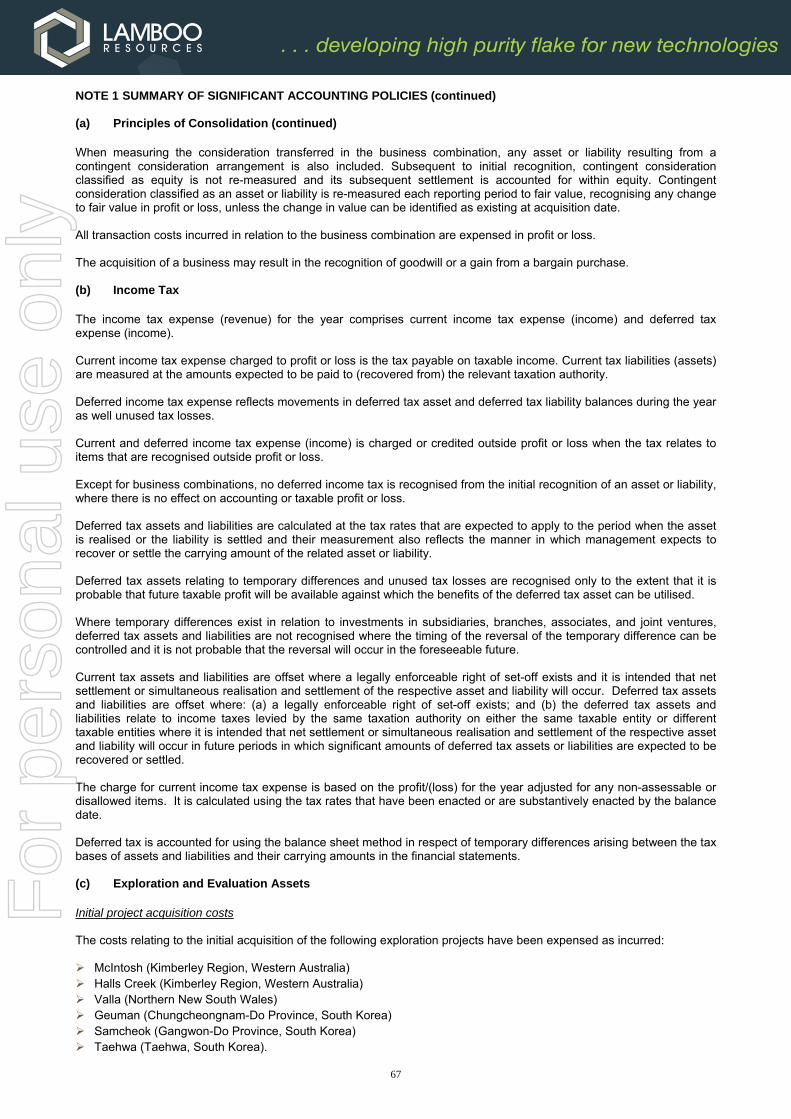
67
NOTE 1 SUMMARY OF SIGNIFICANT ACCOUNTING POLICIES (continued) (a) Principles of Consolidation (continued)
When measuring the consideration transferred in the business combination, any asset or liability resulting from a contingent consideration arrangement is also included. Subsequent to initial recognition, contingent consideration classified as equity is not re-measured and its subsequent settlement is accounted for within equity. Contingent consideration classified as an asset or liability is re-measured each reporting period to fair value, recognising any change to fair value in profit or loss, unless the change in value can be identified as existing at acquisition date. All transaction costs incurred in relation to the business combination are expensed in profit or loss. The acquisition of a business may result in the recognition of goodwill or a gain from a bargain purchase. (b) Income Tax
The income tax expense (revenue) for the year comprises current income tax expense (income) and deferred tax expense (income). Current income tax expense charged to profit or loss is the tax payable on taxable income. Current tax liabilities (assets) are measured at the amounts expected to be paid to (recovered from) the relevant taxation authority. Deferred income tax expense reflects movements in deferred tax asset and deferred tax liability balances during the year as well unused tax losses. Current and deferred income tax expense (income) is charged or credited outside profit or loss when the tax relates to items that are recognised outside profit or loss. Except for business combinations, no deferred income tax is recognised from the initial recognition of an asset or liability, where there is no effect on accounting or taxable profit or loss. Deferred tax assets and liabilities are calculated at the tax rates that are expected to apply to the period when the asset is realised or the liability is settled and their measurement also reflects the manner in which management expects to recover or settle the carrying amount of the related asset or liability. Deferred tax assets relating to temporary differences and unused tax losses are recognised only to the extent that it is probable that future taxable profit will be available against which the benefits of the deferred tax asset can be utilised. Where temporary differences exist in relation to investments in subsidiaries, branches, associates, and joint ventures, deferred tax assets and liabilities are not recognised where the timing of the reversal of the temporary difference can be controlled and it is not probable that the reversal will occur in the foreseeable future. Current tax assets and liabilities are offset where a legally enforceable right of set-off exists and it is intended that net settlement or simultaneous realisation and settlement of the respective asset and liability will occur. Deferred tax assets and liabilities are offset where: (a) a legally enforceable right of set-off exists; and (b) the deferred tax assets and liabilities relate to income taxes levied by the same taxation authority on either the same taxable entity or different taxable entities where it is intended that net settlement or simultaneous realisation and settlement of the respective asset and liability will occur in future periods in which significant amounts of deferred tax assets or liabilities are expected to be recovered or settled. The charge for current income tax expense is based on the profit/(loss) for the year adjusted for any non-assessable or disallowed items. It is calculated using the tax rates that have been enacted or are substantively enacted by the balance date. Deferred tax is accounted for using the balance sheet method in respect of temporary differences arising between the tax bases of assets and liabilities and their carrying amounts in the financial statements. (c) Exploration and Evaluation Assets
Initial project acquisition costs The costs relating to the initial acquisition of the following exploration projects have been expensed as incurred: McIntosh (Kimberley Region, Western Australia) Halls Creek (Kimberley Region, Western Australia) Valla (Northern New South Wales) Geuman (Chungcheongnam-Do Province, South Korea) Samcheok (Gangwon-Do Province, South Korea) Taehwa (Taehwa, South Korea).
For
per
sona
l use
onl
y
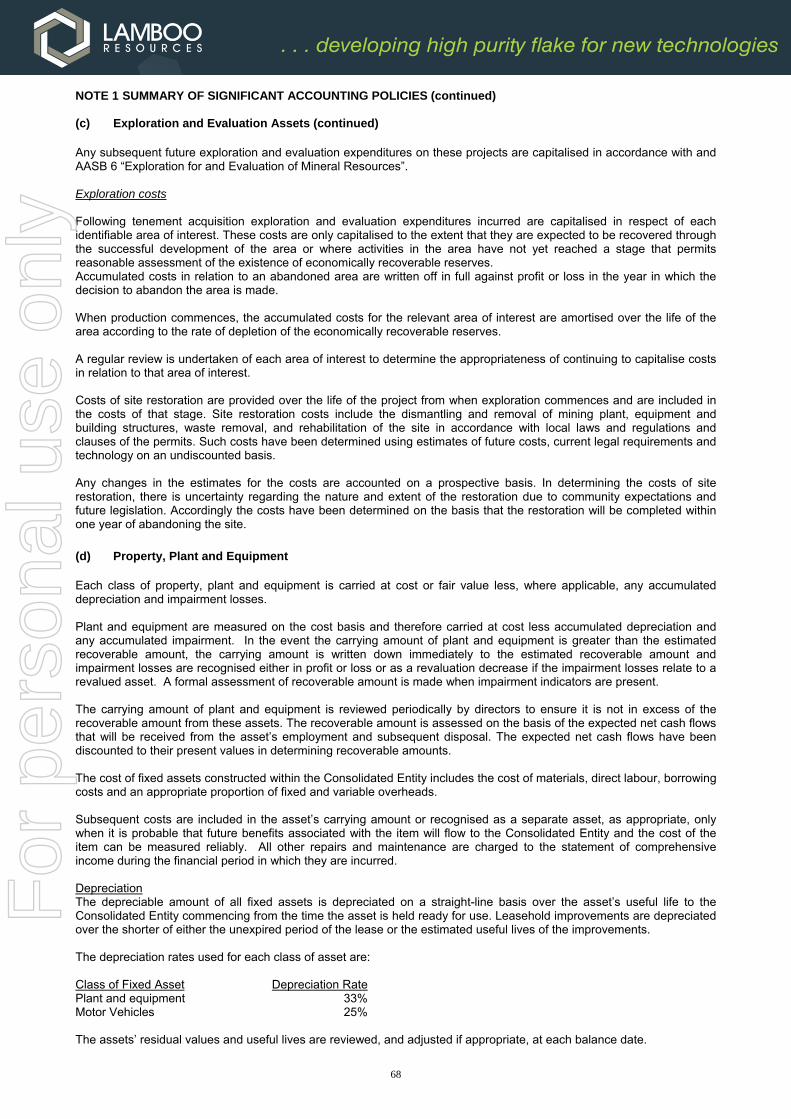
68
NOTE 1 SUMMARY OF SIGNIFICANT ACCOUNTING POLICIES (continued) (c) Exploration and Evaluation Assets (continued)
Any subsequent future exploration and evaluation expenditures on these projects are capitalised in accordance with and AASB 6 “Exploration for and Evaluation of Mineral Resources”. Exploration costs Following tenement acquisition exploration and evaluation expenditures incurred are capitalised in respect of each identifiable area of interest. These costs are only capitalised to the extent that they are expected to be recovered through the successful development of the area or where activities in the area have not yet reached a stage that permits reasonable assessment of the existence of economically recoverable reserves. Accumulated costs in relation to an abandoned area are written off in full against profit or loss in the year in which the decision to abandon the area is made. When production commences, the accumulated costs for the relevant area of interest are amortised over the life of the area according to the rate of depletion of the economically recoverable reserves. A regular review is undertaken of each area of interest to determine the appropriateness of continuing to capitalise costs in relation to that area of interest. Costs of site restoration are provided over the life of the project from when exploration commences and are included in the costs of that stage. Site restoration costs include the dismantling and removal of mining plant, equipment and building structures, waste removal, and rehabilitation of the site in accordance with local laws and regulations and clauses of the permits. Such costs have been determined using estimates of future costs, current legal requirements and technology on an undiscounted basis. Any changes in the estimates for the costs are accounted on a prospective basis. In determining the costs of site restoration, there is uncertainty regarding the nature and extent of the restoration due to community expectations and future legislation. Accordingly the costs have been determined on the basis that the restoration will be completed within one year of abandoning the site.
(d) Property, Plant and Equipment
Each class of property, plant and equipment is carried at cost or fair value less, where applicable, any accumulated depreciation and impairment losses. Plant and equipment are measured on the cost basis and therefore carried at cost less accumulated depreciation and any accumulated impairment. In the event the carrying amount of plant and equipment is greater than the estimated recoverable amount, the carrying amount is written down immediately to the estimated recoverable amount and impairment losses are recognised either in profit or loss or as a revaluation decrease if the impairment losses relate to a revalued asset. A formal assessment of recoverable amount is made when impairment indicators are present. The carrying amount of plant and equipment is reviewed periodically by directors to ensure it is not in excess of the recoverable amount from these assets. The recoverable amount is assessed on the basis of the expected net cash flows that will be received from the asset’s employment and subsequent disposal. The expected net cash flows have been discounted to their present values in determining recoverable amounts. The cost of fixed assets constructed within the Consolidated Entity includes the cost of materials, direct labour, borrowing costs and an appropriate proportion of fixed and variable overheads. Subsequent costs are included in the asset’s carrying amount or recognised as a separate asset, as appropriate, only when it is probable that future benefits associated with the item will flow to the Consolidated Entity and the cost of the item can be measured reliably. All other repairs and maintenance are charged to the statement of comprehensive income during the financial period in which they are incurred. Depreciation The depreciable amount of all fixed assets is depreciated on a straight-line basis over the asset’s useful life to the Consolidated Entity commencing from the time the asset is held ready for use. Leasehold improvements are depreciated over the shorter of either the unexpired period of the lease or the estimated useful lives of the improvements. The depreciation rates used for each class of asset are: Class of Fixed Asset Depreciation Rate Plant and equipment 33% Motor Vehicles 25% The assets’ residual values and useful lives are reviewed, and adjusted if appropriate, at each balance date.
For
per
sona
l use
onl
y

69
NOTE 1 SUMMARY OF SIGNIFICANT ACCOUNTING POLICIES (continued) (d) Property, Plant and Equipment (continued)
Gains and losses on disposals are determined by comparing proceeds with the carrying amount. These gains and losses are included in the statement of comprehensive income. When revalued assets are sold, amounts included in the revaluation surplus relating to that asset are transferred to retained earnings. (e) Leases
Leases of fixed assets where substantially all the risks and benefits incidental to the ownership of the asset, but not the legal ownership that is transferred to entities in the Consolidated Entity, are classified as finance leases. Finance leases are capitalised by recognising an asset and a liability at the lower of the amounts equal to the fair value of the leased property or the present value of the minimum lease payments, including any guaranteed residual values. Lease payments are allocated between the reduction of the lease liability and the lease interest expense for the period. Leased assets are depreciated on a straight-line basis over the shorter of their estimated useful lives or the lease term. Lease payments for operating leases, where substantially all the risks and benefits remain with the lessor, are recognised as expenses on a straight line basis over the lease term. Lease incentives under operating leases are recognised as a liability and amortised on a straight-line basis over the lease term. (f) Financial Instruments
Recognition and initial measurement Financial assets and financial liabilities are recognised when the entity becomes a party to the contractual provisions to the instrument. For financial assets, this is equivalent to the date that the Consolidated Entity commits itself to either the purchase or sale of the asset (i.e. trade date accounting is adopted). Financial instruments are initially measured at fair value plus transaction costs, except where the instrument is classified “at fair value through profit or loss”, in which case transaction costs are expensed to profit or loss immediately. Classification and subsequent measurement Financial instruments are subsequently measured at fair value, amortised cost using the effective interest rate method, or cost. Amortised cost is the amount at which the financial asset or financial liability is measured at initial recognition less principal repayments and any reduction for impairment, and adjusted for any cumulative amortisation of the difference between that initial amount and the maturity amount calculated using the effective interest method. Fair value is determined based on current bid prices for all quoted investments. Valuation techniques are applied to determine the fair value for all unlisted securities, including recent arm’s length transactions, reference to similar instruments and option pricing models. The effective interest method is used to allocate interest income or interest expense over the relevant period and is equivalent to the rate that discounts estimated future cash payments or receipts (including fees, transaction costs and other premiums or discounts) through the expected life (or when this cannot be reliably predicted, the contractual term) of the financial instrument to the net carrying amount of the financial asset or financial liability. Revisions to expected future net cash flows will necessitate an adjustment to the carrying value with a consequential recognition of an income or expense item in profit or loss. (i) Financial assets at fair value through profit or loss Financial assets are classified at “fair value through profit or loss” when they are held for trading for the purpose of short-term profit taking, derivatives not held for hedging purposes, or when they are designated as such to avoid an accounting mismatch or to enable performance evaluation where a group of financial assets is managed by key management personnel on a fair value basis in accordance with a documented risk management or investment strategy. Such assets are subsequently measured at fair value with changes in carrying value being included in profit or loss. (ii) Loans and receivables Loans and receivables are non-derivative financial assets with fixed or determinable payments that are not quoted in an active market and are subsequently measured at amortised cost. Loans and receivables are included in current assets, where they are expected to mature within 12 months after the end of the reporting period.
For
per
sona
l use
onl
y
70
NOTE 1 SUMMARY OF SIGNIFICANT ACCOUNTING POLICIES (continued) (f) Financial Instruments (continued)
(iii) Held-to-maturity investments Held-to-maturity investments are non-derivative financial assets that have fixed maturities and fixed or determinable payments, and it is the Consolidated Entity’s intention to hold these investments to maturity. They are subsequently measured at amortised cost. Held-to-maturity investments are included in non-current assets where they are expected to mature more than 12 months after the end of the reporting period. All other investments are classified as current assets. (iv) Available-for-sale financial assets Available-for-sale financial assets are non-derivative financial assets that are either not suitable to be classified into other categories of financial assets due to their nature, or they are designated as such by management. They comprise investments in the equity of other entities where there is neither a fixed maturity nor fixed or determinable payments. They are subsequently measured at fair value with changes in such fair value (ie gains or losses) recognised in other comprehensive income (except for impairment losses). When the financial asset is derecognised, the cumulative gain or loss pertaining to that asset previously recognised in other comprehensive income is reclassified into profit or loss. Available-for-sale financial assets are included in non-current assets where they are expected to be sold more than 12 months after the end of the reporting period. All other financial assets are classified as current assets. (v) Financial liabilities Non-derivative financial liabilities (excluding financial guarantees) are subsequently measured at amortised cost. Impairment At the end of each reporting period, the Consolidated Entity assesses whether there is objective evidence that a financial instrument has been impaired. In the case of available-for-sale financial instruments, a significant or prolonged decline in the value of the instrument is considered to determine whether an impairment has arisen. Impairment losses are recognised in profit or loss. Also, any cumulative decline in fair value previously recognised in other comprehensive income is reclassified to profit or loss at this point. Financial guarantees Where material, financial guarantees issued that require the issuer to make specified payments to reimburse the holder for a loss it incurs because a specified debtor fails to make payment when due are recognised as a financial liability at fair value on initial recognition. The guarantee is subsequently measured at the higher of the best estimate of the obligation and the amount initially recognised less, when appropriate, cumulative amortisation in accordance with AASB 118: Revenue. Where the entity gives guarantees in exchange for a fee, revenue is recognised under AASB 118. The fair value of financial guarantee contracts has been assessed using a probability-weighted discounted cash flow approach. The probability has been based on: – the likelihood of the guaranteed party defaulting in a year period; – the proportion of the exposure that is not expected to be recovered due to the guaranteed party defaulting; and – the maximum loss exposed if the guaranteed party were to default. Derecognition Financial assets are derecognised where the contractual rights to receipt of cash flows expire or the asset is transferred to another party whereby the entity no longer has any significant continuing involvement in the risks and benefits associated with the asset. Financial liabilities are derecognised where the related obligations are discharged, cancelled or expired. The difference between the carrying value of the financial liability extinguished or transferred to another party and the fair value of consideration paid, including the transfer of non-cash assets or liabilities assumed, is recognised in profit or loss.
For
per
sona
l use
onl
y

71
NOTE 1 SUMMARY OF SIGNIFICANT ACCOUNTING POLICIES (continued) (g) Impairment of Assets
At the end of each reporting period, the Consolidated Entity assesses whether there is any indication that an asset may be impaired. If such an indication exists, an impairment test is carried out on the asset by comparing the recoverable amount of the asset, being the higher of the asset’s fair value less costs to sell and value in use, to the asset’s carrying amount. Any excess of the asset’s carrying amount over its recoverable amount is recognised immediately in profit or loss, unless the asset is carried at a revalued amount in accordance with another Standard (e.g. in accordance with the revaluation model in AASB 116). Any impairment loss of a revalued asset is treated as a revaluation decrease in accordance with that other Standard. Where it is not possible to estimate the recoverable amount of an individual asset, the Consolidated Entity estimates the recoverable amount of the cash-generating unit to which the asset belongs. (h) Employee Entitlements
Provision is made for the Consolidated Entity’s liability for employee entitlements arising from services rendered by employees to the end of the reporting period. Employee entitlements that are expected to be settled within 1 year have been measured at the amounts expected to be paid when the liability is settled. Employee entitlements payable later than 1 year have been measured at the present value of the estimated future cash outflows to be made for those benefits. In determining the liability, consideration is given to employee wages increases and the probability that the employee may satisfy vesting requirements. Those cash flows are discounted using market yields on national government bonds with terms to maturity that match the expected timing of cash flows. Equity-settled compensation Share-based payments to employees are measured at the fair value of the instruments issued and amortised over the vesting periods. Share-based payments to non-employees are measured at the fair value of goods or services received or the fair value of the equity instruments issued, if it is determined the fair value of the goods or services cannot be reliably measured, and are recorded at the date the goods or services are received. In relation to options issued, the corresponding amount is recorded to the share based payment reserve. The fair value of share based payments is determined using the Black-Scholes pricing model. The volatility input in the pricing model is determined by the historical volatility of the Company’s share price over a similar period to the exercise period. The total amount to be expensed is determined by reference to the fair value of the equity instruments granted, which includes any market performance conditions and the impact of any non-vesting conditions but excludes the impact of any service and non-market performance vesting conditions. Non-market vesting conditions are included in assumptions about the number of equity instruments that are expected to vest. The total expense is recognised over the vesting period, which is the period over which all of the specified vesting conditions are to be satisfied. At the end of each period, the entity revises its estimates of the number of equity instruments that are expected to vest based on the non-market performance vesting conditions. It recognises the impact of the revision to original estimates, if any, in profit or loss, with a corresponding adjustment to equity. The number of shares and options expected to vest is reviewed and adjusted at the end of each reporting period such that the amount recognised for services received as consideration for the equity instruments granted is based on the number of equity instruments that eventually vest. (i) Cash and Cash Equivalents
Cash and cash equivalents include cash on hand, deposits available on demand with banks, other short-term highly liquid investments with original maturities of 3 months or less. (j) Revenue and Other Income
Revenue is measured at the fair value of the consideration received or receivable after taking into account any trade discounts and volume rebates allowed. Interest revenue is recognised using the effective interest rate method.
For
per
sona
l use
onl
y

72
NOTE 1 SUMMARY OF SIGNIFICANT ACCOUNTING POLICIES (continued) (k) Goods and Services Tax (GST)
Revenues, expenses and assets are recognised net of the amount of GST, except where the amount of GST incurred is not recoverable from the Australian Taxation Office (ATO). Receivables and payables are stated inclusive of the amount of GST receivable or payable. The net amount of GST recoverable from, or payable to, the ATO is included with other receivables or payables in the statement of financial position. Cash flows are presented on a gross basis. The GST components of cash flows arising from investing or financing activities which are recoverable from, or payable to, the ATO are presented as operating cash flows included in receipts from customers or payments to suppliers. (l) Share Capital Issued and paid up capital is recognised at the fair value of the consideration received by the Consolidated Entity. Any transaction costs arising on the issue of ordinary shares are recognised directly in equity as a reduction of the share proceeds received. (m) Earnings per Share
The Consolidated Entity presents basic and diluted earnings per share (EPS) data for its ordinary shares. Basic EPS is calculated by dividing the profit or loss attributable to ordinary shareholders by the weighted average number of ordinary shares outstanding during the period. Diluted EPS is determined by adjusting the profit or loss attributable to ordinary shareholders and the weighted average number of ordinary shares outstanding for the effects of all dilutive potential ordinary shares. (n) Comparative Figures
When required by accounting standards comparative figures have been adjusted to conform to changes in presentation for the current financial year. Comparative figures have also been changed where classifications of income and expenditure items have been altered from the prior year as a result of a review by Directors. The new classifications have been made to reflect a more accurate view of the Consolidated Entity’s operations. (o) Convertible notes
Convertible notes are recognised initially at fair value and attributable transaction costs are recognised in profit or loss when incurred. Subsequent to initial recognition any changes in fair value at each balance date are recognised in profit or loss. (p) Government grants
Grants from the government are recognised at their fair value where there is a reasonable assurance that the grant will be received and the group will comply with all attached conditions. Government grants relating to costs are deferred and recognised in the profit or loss over the period necessary to match them with the costs that they are intended to compensate. Government grants relating to exploration and evaluation assets that have been capitalised are recognised by deducting the grant received from the carrying amount of the exploration and evaluation asset recognised on the balance sheet. (q) Derivatives and hedging activities
Derivatives are initially recognised at fair value on the date a derivative contract is entered into and are subsequently remeasured to their fair value at the end of each reporting period. Trading derivatives are classified as a current asset or liability. (r) New Accounting Standards and Interpretations
The Consolidated Entity adopted all new Accounting Standards and Interpretations effective for the year ended 30 June 2015. There were no material impacts on the financial statements of the Consolidated Entity as a result of adopting these standards.
For
per
sona
l use
onl
y

73
NOTE 1 SUMMARY OF SIGNIFICANT ACCOUNTING POLICIES (continued) (s) New Standards and Interpretations Not Yet Adopted
Certain new accounting standards and interpretations have been published that are not mandatory for 30 June 2015 reporting periods. The Consolidated Entity has decided against early adoption of these standards. The Consolidated Entity's assessment of the impact of these new standards and interpretations is set out below: AASB 9 Financial Instruments This standard and its consequential amendments are currently applicable to annual reporting periods beginning on or after 1 January 2018. This standard introduces new classification and measurement models for financial assets, using a single approach to determine whether a financial asset is measured at amortised cost or fair value. To be classified and measured at amortised cost, assets must satisfy the business model test for managing the financial assets and have certain contractual cash flow characteristics. All other financial instrument assets are to be classified and measured at fair value. This standard allows an irrevocable election on initial recognition to present gains and losses on equity instruments (that are not held-for-trading) in other comprehensive income, with dividends as a return on these investments being recognised in profit or loss. In addition, those equity instruments measured at fair value through other comprehensive income would no longer have to apply any impairment requirements nor would there be any 'recycling' of gains or losses through profit or loss on disposal. The accounting for financial liabilities continues to be classified and measured in accordance with AASB 139, with one exception, being that the portion of a change of fair value relating to the entity's own credit risk is to be presented in other comprehensive income unless it would create an accounting mismatch. The Consolidated Entity has not yet evaluated the impact adoption of this standard will have. (t) Change in Accounting Policy for Refundable R&D Incentives
The Company previously accounted for refundable R&D tax incentives as an income tax benefit and drilling grant as other income. The entity has determined that these incentives are more akin to government grants because they are not conditional upon earning taxable income. The Company has therefore made a voluntary change in accounting policy during the reporting period. Refundable tax incentives and drilling grant are now accounted for as government grants under AASB 120 Accounting for Government Grants and Disclosure of Government Assistance because the directors consider this policy to provide more relevant information to meet the economic decision-making needs of users, and to make the financial statements more reliable. The impact of these changes in the Company’s accounting policy on individual line items in the prior year financial statements can be summarised as follows: Impact on Statement of Comprehensive Income
Previously
Reported
Adjustment Restated
2014 2014 2014 $ $ $ Research and development income tax concession 1,248,013 (1,248,013) -
Other revenue 171,725 (150,000) 21,725
Profit/(loss) after income tax expense (490,755) (1,398,013) (1,888,768)
Other comprehensive income 9,214 - 9,214
Total comprehensive income (481,541) (1,398,013) (1,879,554)
Cents Cents Cents
Earnings per share
Basic and diluted loss per share (0.5) (1.4) (1.9)
For
per
sona
l use
onl
y

74
NOTE 1 SUMMARY OF SIGNIFICANT ACCOUNTING POLICIES (continued) (t) Change in Accounting Policy for Refundable R&D Incentives (continued)
Impact on Balance Sheet Previously Reported Adjustment Restated 2014 2014 2014 $ $ $ Exploration and evaluation assets 7,145,114 (1,398,013) 5,747,101
TOTAL ASSETS 10,718,577 (1,398,013) 9,320,564
NET ASSETS 10,093,227 (1,398,013) 8,695,214
Retained Earnings (30,570,555) (1,398,013) (31,968,568)
Net Assets
TOTAL EQUITY 10,093,227 (1,398,013) 8,695,214 Impact on Statement of Cash Flows Previously Reported Adjustment Restated 2014 2014 2014 $ $ $ Receipts from drilling grant revenue 150,000 (150,000) - Research and development income tax concession received
1,248,013 (1,248,013)
-
Net cash used in operating activities
(438,536)
(1,398,013)
(1,836,549)
Government grants in relation to exploration assets
- 1,398,013
1,398,013
Net cash used in investing activities (4,188,724) 1,398,013 (2,790,711)
For
per
sona
l use
onl
y

75
2015 2014
$ $
NOTE 2 LOSS BEFORE INCOME TAX
Loss before income tax includes the following specific expenses / (income)
Defined contributions superannuation expense – related party 32,212 25,448
Rental expense relating to operating leases - Minimum lease payments 94,091 72,775
Foreign exchange (gains) / losses (a) 383,905 -
Depreciation and amortisation 48,965 15,009
Due diligence expenses (b) (1,012,545) -
Provision for non-recovery of Hengda Deposit (c) (2,593,362) - (a) Unrealised foreign exchange gain
During the year the company paid a US$2 million deposit in respect of the Hengda Transaction. This deposit was revalued at balance date at the relevant foreign exchange rate resulting in an unrealised foreign exchange gain. Refer (c) below for further details on the Hengda receivable. (b) Due diligence and recovery expenses
During the year the company incurred substantial costs associated with the due diligence and recovery process relating to the Hengda Transaction. (c) Provision for non-recovery of Hengda Deposit
In July 2015, Lamboo entered into a Framework Agreement for a proposed merger with China Sciences Hengda Graphite Co (“Hengda”) and Mr Wang Fengjun (Mr Wang), General Manager and major shareholder of Hengda, and paid a US$2 million deposit “Hengda Deposit”. Lamboo has subsequently terminated its contractual arrangements relating to its proposed merger with Hengda and does not intend to proceed with that transaction. Since then, Lamboo engaged lawyers in Hong Kong to send a letter of demand to Mr Wang and Hengda for repayment of the Hengda Deposit. Despite the agreement between Lamboo, Hengda and Wang, Hengda and Wang have failed to repay the Hengda Deposit within the time stipulated in Lamboo’s demand. Lamboo has therefore engaged Hong Kong and Chinese lawyers to advise Lamboo on its legal rights, regulatory requirements and procedures in relation to the termination of the merger transaction and specifically, its ability to recover the Hengda Deposit. This advice has not yet been finalised, as there are numerous regulatory issues that must be addressed first. At the same time, Lamboo is pursuing a negotiated settlement with the current management of Hengda, with a view to agreeing terms under which Hengda will repay the Hengda Deposit. Pending finalisation of Lamboo’s legal advice, the Directors cannot guarantee that Lamboo will successfully recover the Hengda Deposit by legal process, but its Directors are pursuing both legal advice and discussions with Hengda’s management, with that aim in mind. Consequently Lamboo has recorded a provision for non-recovery of the Hengda Deposit to the value of A$2,593,362 in the Financial Report to 30 June 2015.
For
per
sona
l use
onl
y
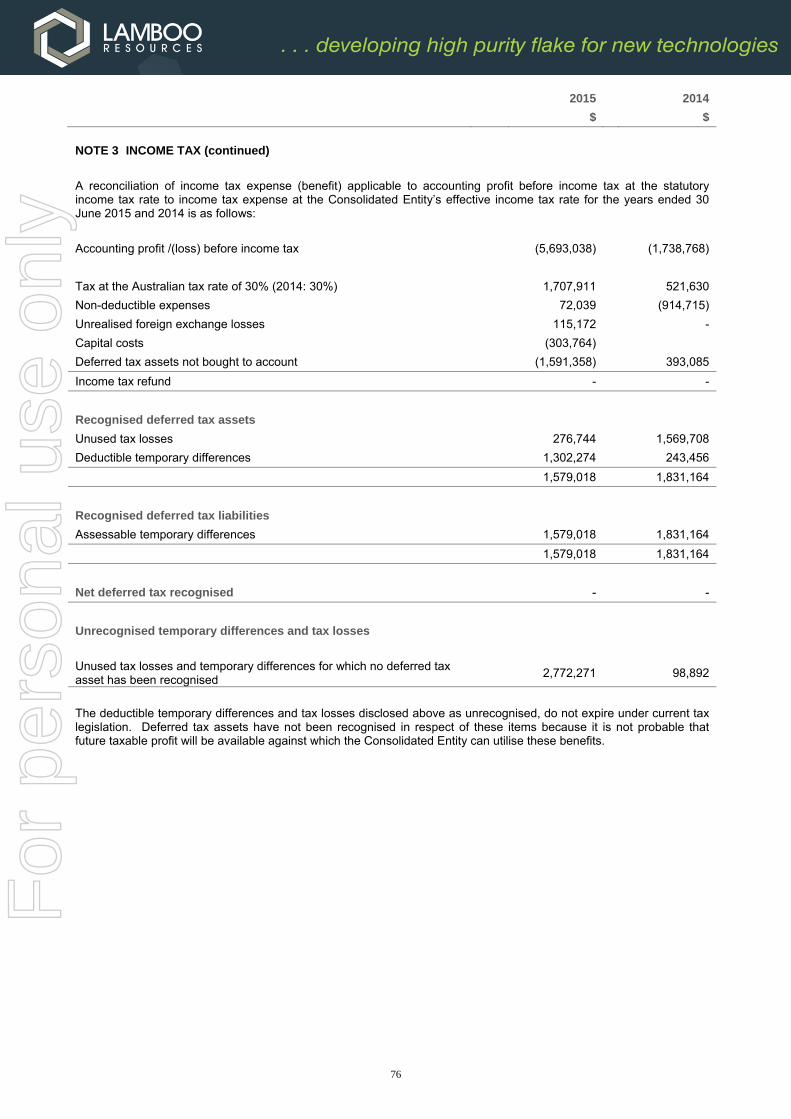
76
2015 2014
$ $
NOTE 3 INCOME TAX (continued)
A reconciliation of income tax expense (benefit) applicable to accounting profit before income tax at the statutory income tax rate to income tax expense at the Consolidated Entity’s effective income tax rate for the years ended 30 June 2015 and 2014 is as follows:
Accounting profit /(loss) before income tax (5,693,038) (1,738,768)
Tax at the Australian tax rate of 30% (2014: 30%) 1,707,911 521,630
Non-deductible expenses 72,039 (914,715)
Unrealised foreign exchange losses 115,172 -
Capital costs (303,764)
Deferred tax assets not bought to account (1,591,358) 393,085
Income tax refund - -
Recognised deferred tax assets
Unused tax losses 276,744 1,569,708
Deductible temporary differences 1,302,274 243,456
1,579,018 1,831,164
Recognised deferred tax liabilities
Assessable temporary differences 1,579,018 1,831,164
1,579,018 1,831,164
Net deferred tax recognised - -
Unrecognised temporary differences and tax losses
Unused tax losses and temporary differences for which no deferred tax asset has been recognised
2,772,271 98,892
The deductible temporary differences and tax losses disclosed above as unrecognised, do not expire under current tax legislation. Deferred tax assets have not been recognised in respect of these items because it is not probable that future taxable profit will be available against which the Consolidated Entity can utilise these benefits.
For
per
sona
l use
onl
y

77
2015 2014
$ $
NOTE 4 AUDITOR’S REMUNERATION
BDO Audit Pty Ltd
Remuneration paid or payable for:
- auditing and reviewing the financial reports 34,000 28,750
Non audit services:
- Independent Accountants Report for prospectus 20,000 -
- Technical advice 4,000 -
- Taxation services 36,468 16,622
94,468 45,372
Network firms of BDO Audit Pty Ltd
Non audit services:
- Due diligence 82,588 -
82,588 -
Total auditors’ remuneration 177,056 45,372
NOTE 5 LOSS PER SHARE
Loss used to calculate basic and dilutive LPS (5,693,038) (1,888,768) 2015 2014 # #
Weighted average number of ordinary shares outstanding during the year 138,944,913 100,176,874
Weighted average number of dilutive instruments - -
Weighted average number of ordinary shares outstanding during the year used in calculating LPS and dilutive LPS
138,944,913 100,176,874
Performance rights and options could potentially dilute earnings per share in the future but have not been included in the calculation of diluted earnings per share because they were anti-dilutive. Refer Note 23 for details of shares issues subsequent to year end. NOTE 6 DIVIDENDS & FRANKING CREDITS There were no dividends paid or recommended during the financial year. There are no franking credits available to the shareholders of the Company. NOTE 7 CASH & CASH EQUIVALENTS
Cash on hand and at bank 478,289 3,287,072 NOTE 8 TRADE & OTHER RECEIVABLES
Current
Other receivables 150,539 133,521
Hengda Deposit 2,593,362 -
Provision for non-recovery of Hengda Deposit (refer note 2 (c)) (2,593,362) -
Other receivables 150,539 133,521
Non-current
Other receivables 59,220 79,923
2015 2014
For
per
sona
l use
onl
y

78
2015 2014
$ $
NOTE 9 OTHER ASSETS
Prepaid expenditure 14,688 10,137
NOTE 10 PLANT AND EQUIPMENT
Plant and Equipment
At cost 108,162 54,587
Accumulated depreciation (62,895) (13,735)
45,267 40,852
Motor Vehicles
At cost 35,897 34,814
Accumulated depreciation (26,845) (12,856)
9,052 21,958
Total cost 144,059 89,401
Total accumulated depreciation (89,740) (26,591)
Total plant and equipment 54,319 62,810
Movements in carrying amounts
Plant and
equipment
Motor Vehicles
Total
$ $ $
Balance at 1 July 2013 26,843 28,956 55,799
Additions 18,011 - 18,011
Foreign exchange movements 3,713 296 4,009
Depreciation (7,715) (7,294) (15,009)
Balance at 30 June 2014 40,852 21,958 62,810
Balance at 1 July 2014 40,852 21,958 62,810
Additions 49,773 - 49,773
Foreign exchange movements (6,694) (2,605) (9,299)
Depreciation (38,664) (10,301) (48,965)
Balance at 30 June 2015 45,267 9,052 54,319
2015 2014
$ $
NOTE 11 EXPLORATION AND EVALUATION ASSETS
Exploration expenditure capitalised
Balance at the beginning of the year 5,747,101 2,737,052
Exploration expenditure during the year 2,795,410 4,408,062
Research and development grants relating to exploration expenditure (955,099) (1,398,013)
7,587,412 5,747,101
Recoverability of the carrying amount of exploration assets is dependent on the successful development and commercial exploitation of areas of interest, and the sale of minerals or the sale of the respective areas of interest.
For
per
sona
l use
onl
y
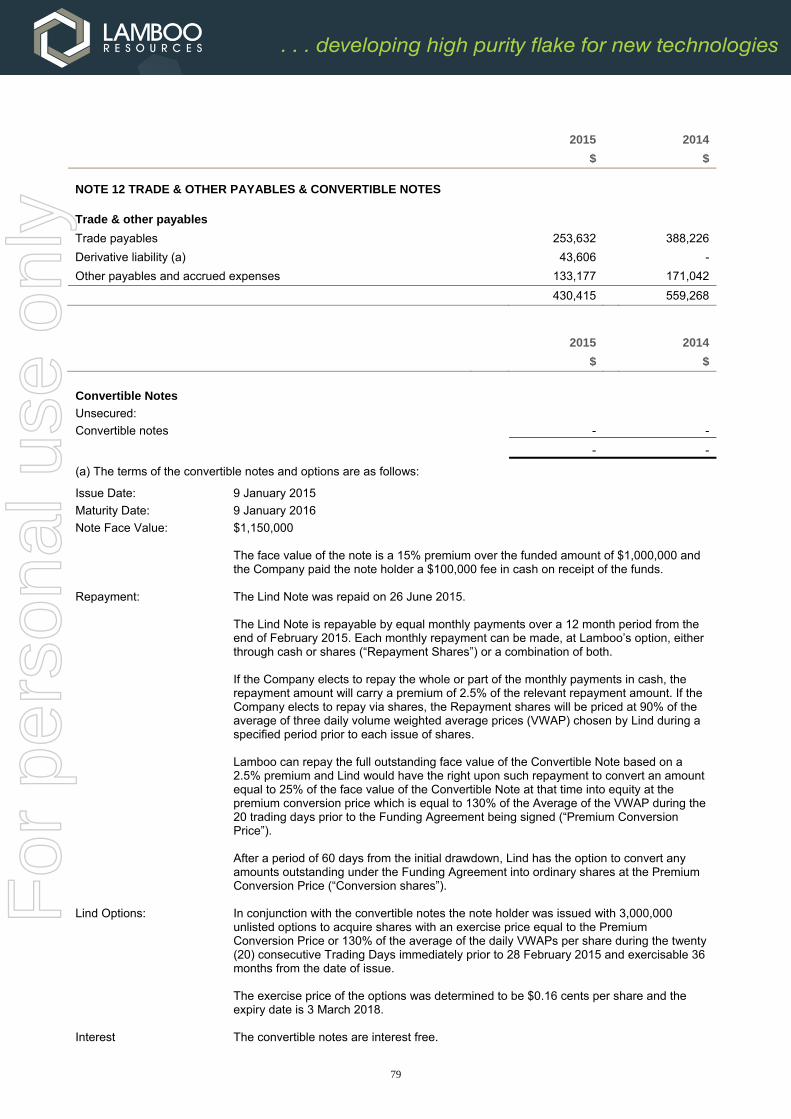
79
2015 2014
$ $
NOTE 12 TRADE & OTHER PAYABLES & CONVERTIBLE NOTES
Trade & other payables
Trade payables 253,632 388,226
Derivative liability (a) 43,606 -
Other payables and accrued expenses 133,177 171,042
430,415 559,268
2015 2014
$ $
Convertible Notes
Unsecured:
Convertible notes - -
- -
(a) The terms of the convertible notes and options are as follows:
Issue Date: 9 January 2015
Maturity Date: 9 January 2016
Note Face Value: $1,150,000 The face value of the note is a 15% premium over the funded amount of $1,000,000 and the Company paid the note holder a $100,000 fee in cash on receipt of the funds.
Repayment: The Lind Note was repaid on 26 June 2015. The Lind Note is repayable by equal monthly payments over a 12 month period from the end of February 2015. Each monthly repayment can be made, at Lamboo’s option, either through cash or shares (“Repayment Shares”) or a combination of both. If the Company elects to repay the whole or part of the monthly payments in cash, the repayment amount will carry a premium of 2.5% of the relevant repayment amount. If the Company elects to repay via shares, the Repayment shares will be priced at 90% of the average of three daily volume weighted average prices (VWAP) chosen by Lind during a specified period prior to each issue of shares. Lamboo can repay the full outstanding face value of the Convertible Note based on a 2.5% premium and Lind would have the right upon such repayment to convert an amount equal to 25% of the face value of the Convertible Note at that time into equity at the premium conversion price which is equal to 130% of the Average of the VWAP during the 20 trading days prior to the Funding Agreement being signed (“Premium Conversion Price”). After a period of 60 days from the initial drawdown, Lind has the option to convert any amounts outstanding under the Funding Agreement into ordinary shares at the Premium Conversion Price (“Conversion shares”).
Lind Options: In conjunction with the convertible notes the note holder was issued with 3,000,000 unlisted options to acquire shares with an exercise price equal to the Premium Conversion Price or 130% of the average of the daily VWAPs per share during the twenty (20) consecutive Trading Days immediately prior to 28 February 2015 and exercisable 36 months from the date of issue. The exercise price of the options was determined to be $0.16 cents per share and the expiry date is 3 March 2018.
Interest The convertible notes are interest free.
For
per
sona
l use
onl
y

80
NOTE 12 TRADE & OTHER PAYABLES & CONVERTIBLE NOTES (continued)
The convertible notes have been accounted for during the year as follows:
Proceeds received 900,000 -
Option derivative liability at fair value 1 (228,786)
Other equity securities – value of options issued (refer note 15) (62,143) -
609,071 -
Net changes in fair value of financial liabilities at fair value through profit or loss 591,875 -
Repayment of convertible note – shares (414,469) -
Repayment of convertible note – cash (786,477)
Convertible note liability – 30 June - - 1 The Lind Options were initially recognised at their fair value of $228,786 in accordance with the accounting policy in Note 1 (q). During the year a fair value gain on Lind options derivative liability of $185,180 has been recognised in profit or loss resulting in a closing value of $43,606 as at 30 June 2015. NOTE 13 PROVISIONS
Employee entitlements 37,341 66,082
NOTE 14 SHARE CAPITAL
Fully paid ordinary shares 44,556,723 38,592,557
Ordinary Shares 2015 2014 2015 2014
$ $ # #
At the beginning of the year 38,592,557 31,615,967 119,961,830 79,652,886
Share placement at $0.06 per share 1 - 1,000,000 - 16,666,667
Share placement at $0.28 per share 2 - 5,817,498 - 20,776,779
Shares issued for Panton North tenement 3 - 167,500 - 250,000
Exercise of options 4 199,500 392,325 1,330,000 2,615,498
Share placement at $0.90 per share 5 2,178,929 - 2,421,032 - Shares issued on conversion of Tranche 1 Performance Rights 6
1,171,875
-
12,500,000 -
Share issued as repayment of a convertible note 7 414,469 - 4,498,825 -
Share placement at $0.10 per share 8 1,050,000 - 10,500,000 -
Share placement at $0.06 per share 9 1,200,000 - 20,000,000 -
Share issue expenses (250,607) (400,733) - -
At reporting date 44,556,723 38,592,557 171,211,687 119,961,830 1 2014: 16,666,667 ordinary fully paid shares were issued at $0.06 per share through a share placement. One free option exercisable at $0.15 each
expiring on 15 August 2015 was issued for every two shares allotted in the share placement, refer below for further details. 2 2014: 20,776,779 ordinary fully paid shares were issued at $0.28 per share through a share placement.
3 2014: 250,000 ordinary fully paid shares were issued at $0.67 per share as part consideration for the Panton North tenement in prior year. 4 2015: 1,330,000 ordinary fully paid shares were issued at $0.15 on the exercise of options.
2014: 2,615,498 ordinary fully paid shares were issued at $0.15 on the exercise of options. 5 2015: 2,421,032 ordinary fully paid shares were issued at $0.90 per share through a share placement.
6 2015: 12,500,000 ordinary fully paid shares were issued on conversion of Tranche 1 Performance Rights. 7 2015: 4,498,825 ordinary fully paid shares were issued as part repayment of a convertible note.
8 2015: 10,500,000 ordinary fully paid shares were issued at $0.10 per share through a share placement. One free option exercisable at $0.20 each expiring on 30 June 2016 was issued for every two shares allotted in the share placement, refer below for further details.
9 2015: 20,000,000 ordinary fully paid shares were issued at $0.06 per share through a share placement.
For
per
sona
l use
onl
y
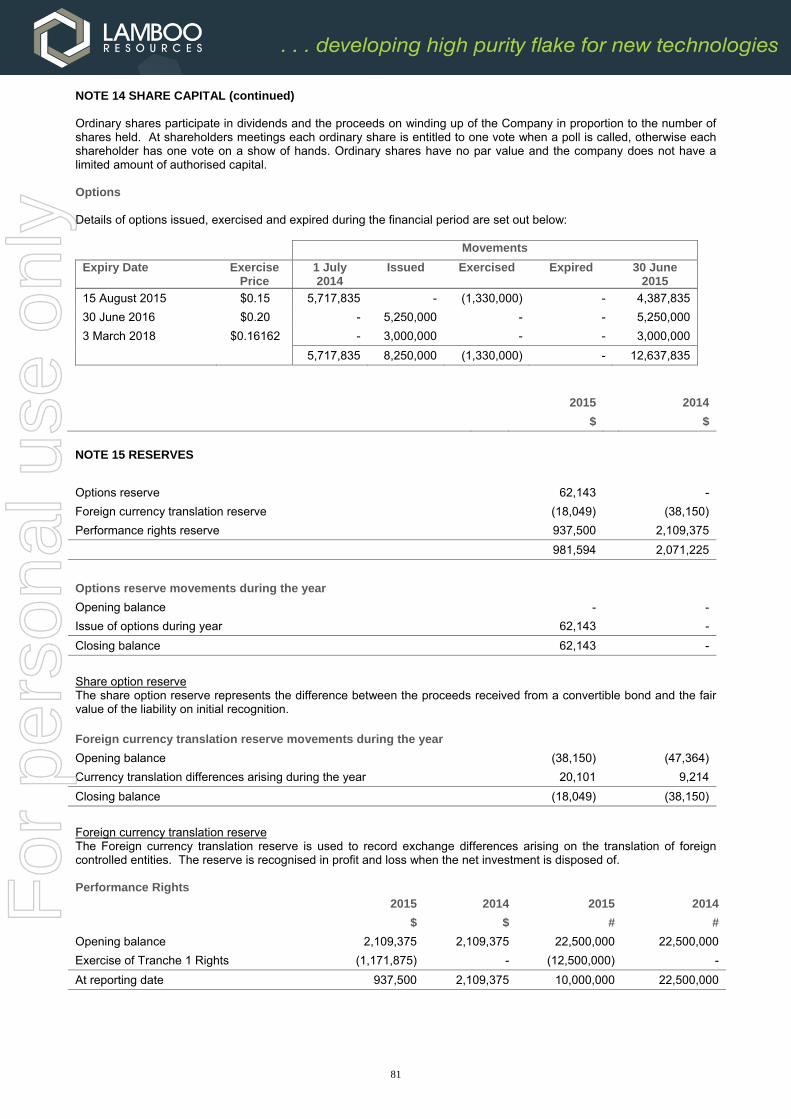
81
NOTE 14 SHARE CAPITAL (continued) Ordinary shares participate in dividends and the proceeds on winding up of the Company in proportion to the number of shares held. At shareholders meetings each ordinary share is entitled to one vote when a poll is called, otherwise each shareholder has one vote on a show of hands. Ordinary shares have no par value and the company does not have a limited amount of authorised capital. Options Details of options issued, exercised and expired during the financial period are set out below:
Movements
Expiry Date Exercise Price
1 July 2014
Issued Exercised Expired 30 June 2015
15 August 2015 $0.15 5,717,835 - (1,330,000) - 4,387,835
30 June 2016 $0.20 - 5,250,000 - - 5,250,000
3 March 2018 $0.16162 - 3,000,000 - - 3,000,000
5,717,835 8,250,000 (1,330,000) - 12,637,835
2015 2014
$ $
NOTE 15 RESERVES
Options reserve 62,143 -
Foreign currency translation reserve (18,049) (38,150)
Performance rights reserve 937,500 2,109,375
981,594 2,071,225
Options reserve movements during the year
Opening balance - -
Issue of options during year 62,143 -
Closing balance 62,143 -
Share option reserve The share option reserve represents the difference between the proceeds received from a convertible bond and the fair value of the liability on initial recognition. Foreign currency translation reserve movements during the year
Opening balance (38,150) (47,364)
Currency translation differences arising during the year 20,101 9,214
Closing balance (18,049) (38,150)
Foreign currency translation reserve The Foreign currency translation reserve is used to record exchange differences arising on the translation of foreign controlled entities. The reserve is recognised in profit and loss when the net investment is disposed of. Performance Rights 2015 2014 2015 2014
$ $ # #
Opening balance 2,109,375 2,109,375 22,500,000 22,500,000
Exercise of Tranche 1 Rights (1,171,875) - (12,500,000) -
At reporting date 937,500 2,109,375 10,000,000 22,500,000
For
per
sona
l use
onl
y

82
NOTE 15 RESERVES (continued)
Performance rights reserve The performance rights reserve is used to record the value of performance rights granted and exercised. During a prior period, the Company agreed to acquire 100% of the issued capital of Opirus Minerals Pty Ltd (Opirus), a company that holds, through its wholly owned subsidiary Won Kwang, a number of flake graphite exploration projects and certain exploration permit applications over potential flake graphite-bearing areas in South Korea. In consideration for the acquisition the Company issued, pro rata to Opirus shareholders:
a) 12,500,000 ordinary shares; and
b) 22,500,000 performance rights, which give the holder the right to acquire shares for no consideration, upon the achievement of the following milestones:
i. The first 12,500,000 performance rights (Tranche 1 Rights), within 36 months of completion of the acquisition agreement, the tenements or tenement applications achieve a JORC compliant inferred mineral resource of 100,000 tonnes or more of in situ carbon as graphite; and
ii. The second 10,000,000 Performance Rights (Tranche 2 Rights), within 36 months of completion of the acquisition agreement, a pre-feasibility study is completed that is commercially acceptable to the Company, acting reasonably, in respect of at least one of the projects represented by the tenements or tenement Applications.
The Company had agreed to invest, within 24 months of completion of the acquisition, at least $2,500,000 on direct exploration expenditure in South Korea, to develop the Tenements and the Tenement Applications, in accordance with good commercial practice and excluding head office or corporate costs and general staffing costs. The milestone attached to the Tranche 1 Rights was met during the year and they converted to ordinary shares (refer Note 14). Refer to note 24 for details regarding the conversion of the Tranche 2 Rights subsequent to year end.
For
per
sona
l use
onl
y

83
2015 2014
$ $
NOTE 16 CASH FLOW INFORMATION
Reconciliation of loss after income tax to net cash outflow fromoperating activities
Loss after income tax (5,693,038) (1,888,768)
Non-cash items in profit/(loss) after income tax
Depreciation 48,965 15,009
Unrealised FX gain on Hengda Deposit (383,906) -
Provision for non-recovery of Hengda Deposit 2,593,362 -
Fair value gain on Lind options derivative liability (185,180) -
Fair value loss on financial liability at fair value through profit or loss 591,875 -
Exploration expenses expensed 27,596 -
Change in operating assets and liabilities
(Increase)/Decrease in receivables 81,835 (67,234)
(Increase) in other assets (4,551) (42)
Increase/(Decrease) in trade payables and accruals 33,016 72,926
Increase/(Decrease) in employee entitlements (28,741) 31,560
Net cash outflow from operating activities (2,919,217) (1,836,549)
Non-cash investing and financing transactions 2015 During the year the Company issued 4,498,825 fully paid ordinary shares as part repayment of the Lind Convertible Note. Refer to note 14 for further details. 2014 250,000 ordinary fully paid ordinary shares were issued at $0.67 per share as part consideration for the Panton North tenement. NOTE 17 SHARE BASED PAYMENTS 2015 Nil 2014 During the prior year, the Company agreed to acquire the exploration rights of the Panton North tenement (E80/4733), from Uramin Pty Ltd for a total consideration of 250,000 ordinary LMB shares and $50,000 cash.
For
per
sona
l use
onl
y
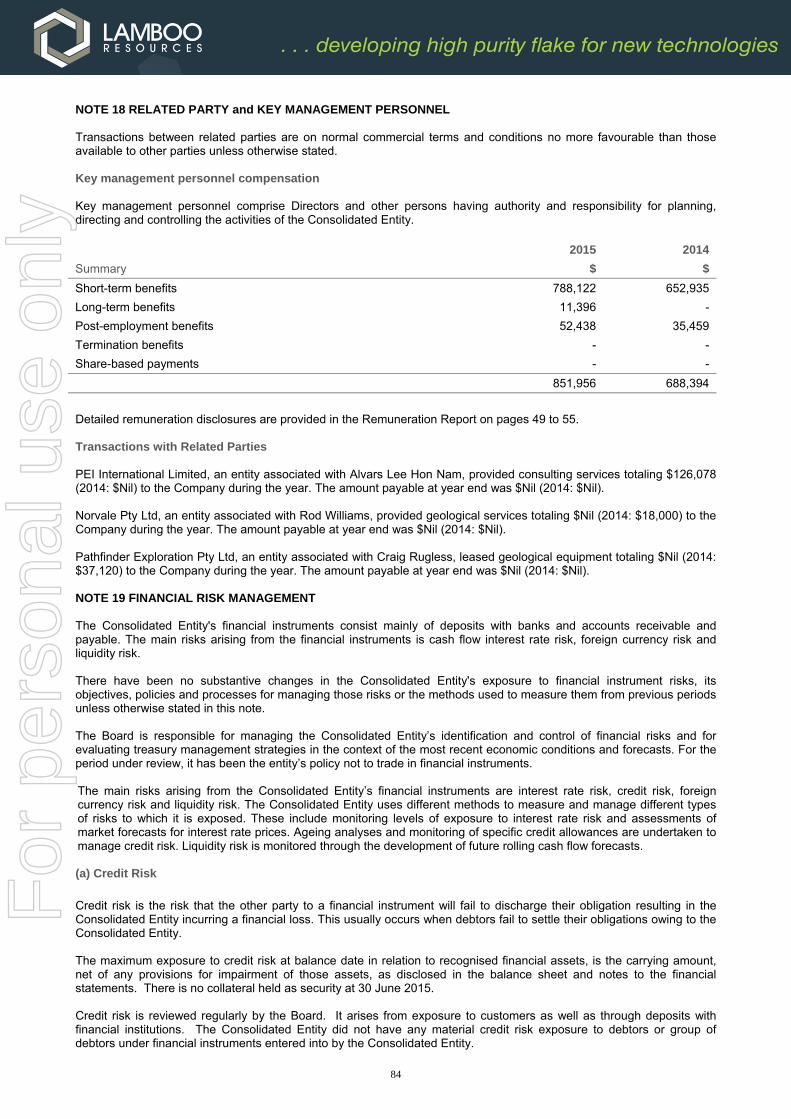
84
NOTE 18 RELATED PARTY and KEY MANAGEMENT PERSONNEL Transactions between related parties are on normal commercial terms and conditions no more favourable than those available to other parties unless otherwise stated. Key management personnel compensation Key management personnel comprise Directors and other persons having authority and responsibility for planning, directing and controlling the activities of the Consolidated Entity. 2015 2014
Summary $ $
Short-term benefits 788,122 652,935
Long-term benefits 11,396 -
Post-employment benefits 52,438 35,459
Termination benefits - -
Share-based payments - -
851,956 688,394
Detailed remuneration disclosures are provided in the Remuneration Report on pages 49 to 55. Transactions with Related Parties PEI International Limited, an entity associated with Alvars Lee Hon Nam, provided consulting services totaling $126,078 (2014: $Nil) to the Company during the year. The amount payable at year end was $Nil (2014: $Nil). Norvale Pty Ltd, an entity associated with Rod Williams, provided geological services totaling $Nil (2014: $18,000) to the Company during the year. The amount payable at year end was $Nil (2014: $Nil). Pathfinder Exploration Pty Ltd, an entity associated with Craig Rugless, leased geological equipment totaling $Nil (2014: $37,120) to the Company during the year. The amount payable at year end was $Nil (2014: $Nil). NOTE 19 FINANCIAL RISK MANAGEMENT The Consolidated Entity's financial instruments consist mainly of deposits with banks and accounts receivable and payable. The main risks arising from the financial instruments is cash flow interest rate risk, foreign currency risk and liquidity risk. There have been no substantive changes in the Consolidated Entity's exposure to financial instrument risks, its objectives, policies and processes for managing those risks or the methods used to measure them from previous periods unless otherwise stated in this note. The Board is responsible for managing the Consolidated Entity’s identification and control of financial risks and for evaluating treasury management strategies in the context of the most recent economic conditions and forecasts. For the period under review, it has been the entity’s policy not to trade in financial instruments.
The main risks arising from the Consolidated Entity’s financial instruments are interest rate risk, credit risk, foreign currency risk and liquidity risk. The Consolidated Entity uses different methods to measure and manage different types of risks to which it is exposed. These include monitoring levels of exposure to interest rate risk and assessments of market forecasts for interest rate prices. Ageing analyses and monitoring of specific credit allowances are undertaken to manage credit risk. Liquidity risk is monitored through the development of future rolling cash flow forecasts. (a) Credit Risk
Credit risk is the risk that the other party to a financial instrument will fail to discharge their obligation resulting in the Consolidated Entity incurring a financial loss. This usually occurs when debtors fail to settle their obligations owing to the Consolidated Entity. The maximum exposure to credit risk at balance date in relation to recognised financial assets, is the carrying amount, net of any provisions for impairment of those assets, as disclosed in the balance sheet and notes to the financial statements. There is no collateral held as security at 30 June 2015. Credit risk is reviewed regularly by the Board. It arises from exposure to customers as well as through deposits with financial institutions. The Consolidated Entity did not have any material credit risk exposure to debtors or group of debtors under financial instruments entered into by the Consolidated Entity.
For
per
sona
l use
onl
y

85
2015 2014
$ $
NOTE 19 FINANCIAL RISK MANAGEMENT (continued) Maximum exposure to credit risk Non-trade receivables 209,759 213,444
Hengda Deposit – fully impaired as at 30 June 2015 - -
Cash and cash equivalents 478,289 3,287,072
688,048 3,500,516
Due to the short-term nature of these receivables, their carrying amount is assumed to approximate their fair value. The maximum exposure to credit risk at the end of the reporting period is the carrying amount of each class of receivables mentioned above. Ageing of receivables Not past due 209,759 213,444
Past due 0-90 days - -
Past due >90 days 2,593,362 -
Impaired (2,593,362) -
209,759 213,444
Movements in the provision for impairment of receivables are as follows: At 1 July 2014 - -
Provision for impairment recognised during the year 2,593,362 -
Receivables written off during the year as uncollectible - -
Unused amount reversed - -
At 30 June 3015 2,593,362 -
The creation and release of the provision for impaired receivables has been included in ‘other expenses’ in profit or loss. Amounts charged to the allowance account are generally written off when there is no expectation of recovering additional cash. Credit risk - Cash and cash equivalents The credit quality of financial assets that are neither past due nor impaired is considered strong. The counterparty to these financial assets is Westpac Banking Corporation, National Australia Bank and Korea Exchange Bank; financial institutions with strong credit ratings. During the financial year the directors and management of the group has changed its strategy in respect of controlling credit risk. Any financial asset which is not cash or cash equivalent is subject to full board review prior to any payments being made or agreements or commitments being contracted for. A full assessment on the credit worthiness of the investment and voracity of security being offered in respect of the investment is undertaken by the board and supported by legal advice, both Australian and foreign as the case may be. (b) Liquidity risk Liquidity risk is the risk that the Consolidated Entity may encounter difficulties raising funds to meet financial obligations as they fall due. Liquidity risk is reviewed regularly by the Board. The Consolidated Entity manages liquidity risk by monitoring forecast cash flows and ensuring that adequate cash resources are maintained. The table below reflects the contractual maturity of fixed and floating rate financial liabilities. Cash flows for financial liabilities without fixed amount or timing are based on the conditions existing at 30 June 2015. The amounts disclosed represent undiscounted cash flows.
For
per
sona
l use
onl
y

86
NOTE 19 FINANCIAL RISK MANAGEMENT (continued) 2015 2014
$ $
The remaining contractual maturities of the financial liabilities are: Less than one year
Trade and other payables 430,415 559,268
Terms and conditions relating to the above financial instruments: Trade creditors are unsecured, non-interest bearing and are normally settled on 7 - 30 day terms Other creditors are unsecured and non-interest bearing (c) Market Risk Market risk arises from the use of interest bearing, tradable and foreign currency financial instruments. It is the risk that the fair value or future cash flows of a financial instrument will fluctuate because of changes in interest rates (interest rate risk), foreign exchange rates (currency risk) or other market factors (other price risk). Interest rate risk Interest rate risk is managed by constant monitoring of interest rates. The Consolidated Entity's interest rate exposure is limited to its variable rate cash and cash equivalent assets. Interest rates over the 12 month period were analysed and a sensitivity determined to show the effect on profit and equity after tax if the interest rates at reporting date had been 100 basis points higher or lower, with all other variables held constant. This level of sensitivity was considered reasonable given the current level of both short-term and long-term Australian interest rates. The following sensitivity analysis is based on the interest rate risk exposures in existence at the balance sheet date. At 30 June 2015, if interest rates had moved, as illustrated in the table below, with all other variables held constant, post tax profit and equity would have been affected as follows:
Judgments of reasonably possible movements:
Post Tax ProfitHigher/(Lower)
EquityHigher/(Lower)
2015$
2014$
2015 $
2014$
+1.00% (100 basis points) 4,783 7,204 4,783 7,204
-1.00% (100 basis points) (4,783) (7,204) (4,783) (7,204)
For
per
sona
l use
onl
y
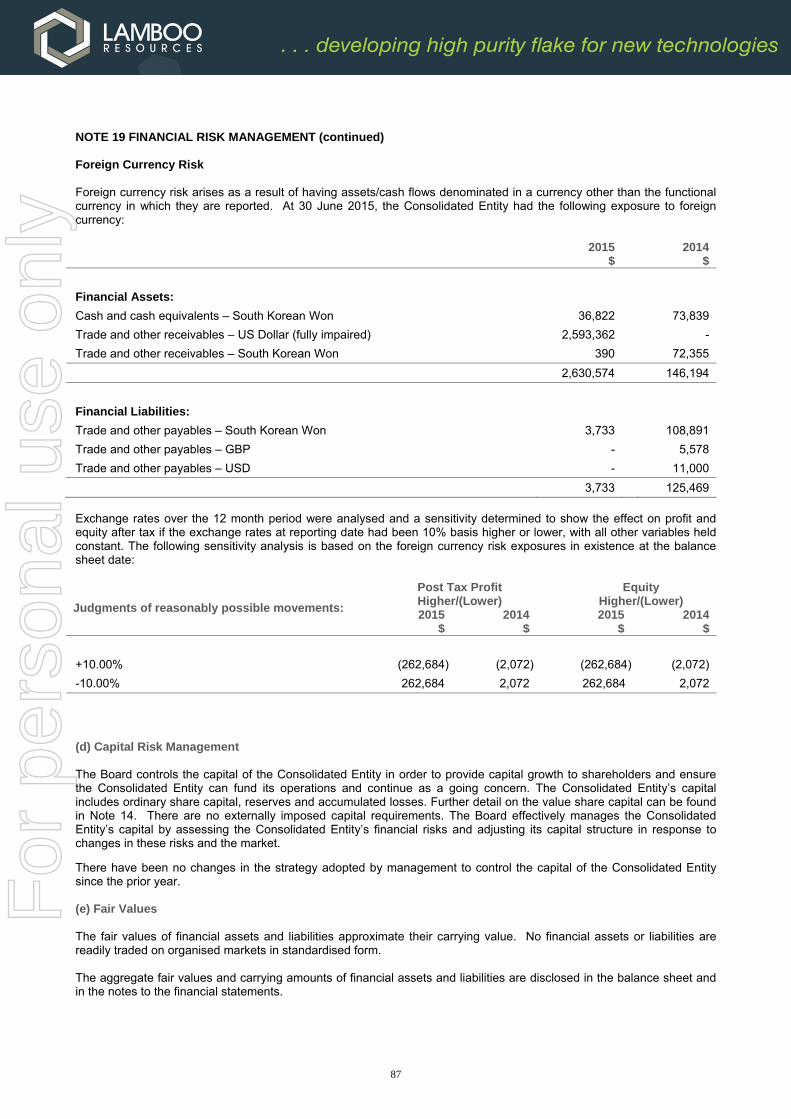
87
NOTE 19 FINANCIAL RISK MANAGEMENT (continued) Foreign Currency Risk Foreign currency risk arises as a result of having assets/cash flows denominated in a currency other than the functional currency in which they are reported. At 30 June 2015, the Consolidated Entity had the following exposure to foreign currency:
2015
$
2014$
Financial Assets:
Cash and cash equivalents – South Korean Won 36,822 73,839
Trade and other receivables – US Dollar (fully impaired) 2,593,362 -
Trade and other receivables – South Korean Won 390 72,355
2,630,574 146,194
Financial Liabilities:
Trade and other payables – South Korean Won 3,733 108,891
Trade and other payables – GBP - 5,578
Trade and other payables – USD - 11,000
3,733 125,469
Exchange rates over the 12 month period were analysed and a sensitivity determined to show the effect on profit and equity after tax if the exchange rates at reporting date had been 10% basis higher or lower, with all other variables held constant. The following sensitivity analysis is based on the foreign currency risk exposures in existence at the balance sheet date:
Judgments of reasonably possible movements:
Post Tax ProfitHigher/(Lower)
Equity
Higher/(Lower) 2015
$ 2014
$
2015 $
2014$
+10.00% (262,684) (2,072) (262,684) (2,072)
-10.00% 262,684 2,072 262,684 2,072
(d) Capital Risk Management The Board controls the capital of the Consolidated Entity in order to provide capital growth to shareholders and ensure the Consolidated Entity can fund its operations and continue as a going concern. The Consolidated Entity’s capital includes ordinary share capital, reserves and accumulated losses. Further detail on the value share capital can be found in Note 14. There are no externally imposed capital requirements. The Board effectively manages the Consolidated Entity’s capital by assessing the Consolidated Entity’s financial risks and adjusting its capital structure in response to changes in these risks and the market.
There have been no changes in the strategy adopted by management to control the capital of the Consolidated Entity since the prior year. (e) Fair Values The fair values of financial assets and liabilities approximate their carrying value. No financial assets or liabilities are readily traded on organised markets in standardised form. The aggregate fair values and carrying amounts of financial assets and liabilities are disclosed in the balance sheet and in the notes to the financial statements.
For
per
sona
l use
onl
y
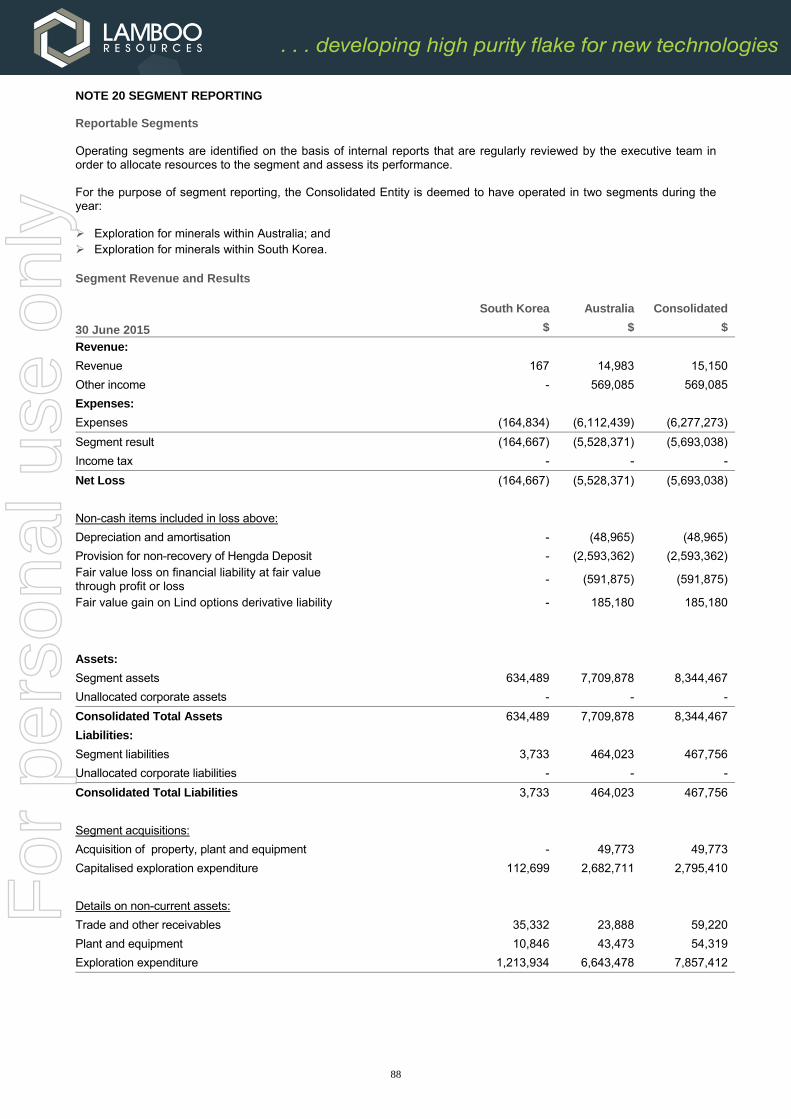
88
NOTE 20 SEGMENT REPORTING Reportable Segments Operating segments are identified on the basis of internal reports that are regularly reviewed by the executive team in order to allocate resources to the segment and assess its performance. For the purpose of segment reporting, the Consolidated Entity is deemed to have operated in two segments during the year: Exploration for minerals within Australia; and Exploration for minerals within South Korea.
Segment Revenue and Results South Korea Australia Consolidated
30 June 2015 $ $ $
Revenue:
Revenue 167 14,983 15,150
Other income - 569,085 569,085
Expenses:
Expenses (164,834) (6,112,439) (6,277,273)
Segment result (164,667) (5,528,371) (5,693,038)
Income tax - - -
Net Loss (164,667) (5,528,371) (5,693,038)
Non-cash items included in loss above:
Depreciation and amortisation - (48,965) (48,965)
Provision for non-recovery of Hengda Deposit - (2,593,362) (2,593,362) Fair value loss on financial liability at fair value through profit or loss
- (591,875) (591,875)
Fair value gain on Lind options derivative liability - 185,180 185,180
Assets:
Segment assets 634,489 7,709,878 8,344,467
Unallocated corporate assets - - -
Consolidated Total Assets 634,489 7,709,878 8,344,467
Liabilities:
Segment liabilities 3,733 464,023 467,756
Unallocated corporate liabilities - - -
Consolidated Total Liabilities 3,733 464,023 467,756
Segment acquisitions:
Acquisition of property, plant and equipment - 49,773 49,773
Capitalised exploration expenditure 112,699 2,682,711 2,795,410
Details on non-current assets:
Trade and other receivables 35,332 23,888 59,220
Plant and equipment 10,846 43,473 54,319
Exploration expenditure 1,213,934 6,643,478 7,857,412
For
per
sona
l use
onl
y

89
NOTE 20 SEGMENT REPORTING (continued) Segment Revenue and Results South Korea Australia Consolidated
30 June 2014 (restated) $ $ $
Revenue:
Revenue 365 76,834 77,199
Expenses:
Expenses (264,406) (1,701,561) (1,965,967)
Segment result (264,041) (1,624,727) (1,888,768)
Income tax - - -
Net Loss (264,041) (1,624,727) (1,888,768)
Non-cash items included in loss above:
Depreciation and amortisation 4,779 10,230 15,009
Assets:
Segment assets 2,839,603 6,480,961 9,320,564
Unallocated corporate assets - - -
Consolidated Total Assets 2,839,603 6,480,961 9,320,564
Liabilities:
Segment liabilities 108,891 516,459 625,350
Unallocated corporate liabilities - - -
Consolidated Total Liabilities 108,891 516,459 625,350
Segment acquisitions:
Acquisition of property, plant and equipment 13,333 4,678 18,011
Capitalised exploration expenditure 1,042,052 3,366,010 4,408,062
Details on non-current assets:
Trade and other receivables 63,395 16,528 79,923
Plant and equipment 36,744 26,066 62,810
Exploration expenditure 1,101,235 4,645,866 5,747,101
2015 2014
$ $
NOTE 21 COMMITMENTS Operating leases
Minimum lease payments:
Payable within one year 10,132 79,612
Payable within one year and five years - 5,240
Payable later than five years - -
Total contracted at balance date 10,132 84,852
Operating leases relate to various offices under non-cancellable operating leases.
For
per
sona
l use
onl
y

90
NOTE 21 COMMITMENTS (continued) Future exploration The Consolidated Entity has certain obligations to expend minimum amounts on exploration in tenement areas. These obligations may be varied from time to time and are expected to be fulfilled in the normal course of operations of the Consolidated Entity. 2015 2014
$ $
Exploration obligations to be undertaken:
Payable within one year 833,520 345,000
Payable between one year and five years 2,466,735 1,457,948
3,300,255 1,802,948
NOTE 22 CONTINGENT LIABILITIES AND CONTINGENT ASSETS There are no known contingent liabilities or contingent assets as at the date of this report. NOTE 23 EVENTS AFTER BALANCE SHEET DATE Capital Raising On 7 July 2015 the Company announced a non-renounceable rights issue which raised $2.05M through the issue of placement of 34.24 million shares at 6 cents per share. Performance Rights Since 30 June 2015 the Company issued 10 million fully paid ordinary shares following the vesting of Tranche 2 of the performance rights issued in 2012 in relation to the acquisition of Opirus Minerals Pty Ltd. At the date of this report there are no Performance Rights on Issue. Options On 15 August 2015 4,387,835 unlisted options expired unexercised.
For
per
sona
l use
onl
y

91
NOTE 24 PARENT ENTITY INFORMATION 2015 2014
$ $
The Parent Entity of the Consolidated Entity is Lamboo Resources Limited.
Parent Entity Financial Information
Current assets 597,657 3,243,960
Non-current assets 7,059,011 5,139,409
Total assets 7656,668 8,383,369
Current liabilities 464,023 516,457
Non-current liabilities - -
Total liabilities 464,023 516,457
Net assets 7,192,645 7,866,912
Issued capital 44,556,723 38,592,557
Reserves 999,643 2,109,375
Accumulated losses (38,363,721) (32,835,020)
Total equity 7,192,645 7,866,912
Loss after income tax (5,528,701) (2,619,726)
Other comprehensive income - -
Total comprehensive income (5,528,701) (2,619,726)
Commitments, Contingencies and Guarantees of the Parent Entity The Parent Entity has no contractual commitments for the acquisition of property, plant and equipment. The Parent Entity’s exposure to contingent liabilities is detailed in Note 22. The Parent Entity has no contingent assets or guarantees at balance date.
Controlled Entities of the Parent Entity
Percentage Owned
Country of Incorporation
2015 2014
% %
Lamboo Resources No.1 Pty Ltd 100% 100% Australia
McKintosh Resources Pty Ltd 100% 100% Australia
Gel Company Pty Ltd - 100% Australia
Advanced Particle Group Pty Ltd 100% 100% Australia
Opirus Minerals Pty Ltd 100% 100% Australia
Won Kwang Inc 100% 100% South Korea
Gel Company Pty Ltd was deregistered on 17 August 2014.
For
per
sona
l use
onl
y
92
DIRECTORS' DECLARATION
The directors of the company declare that:
1. The financial statements, comprising the statement of comprehensive income, balance sheet, statement of cash
flows, statement of changes in equity, accompanying notes, are in accordance with the Corporations Act 2001 and:
a. comply with Accounting Standards and the Corporations Regulations 2001; and
b. give a true and fair view of the consolidated entity’s financial position as at 30 June 2015 and of its
performance for the year ended on that date.
2. The company has included in the notes to the financial statements an explicit and unreserved statement of
compliance with International Financial Reporting Standards.
3. In the directors’ opinion, there are reasonable grounds to believe that the company will be able to pay its debts as
and when they become due and payable.
4. The remuneration disclosures included in paragraphs pages 49 to 55 of the directors’ report (as part of audited
Remuneration Report), for the year ended 30 June 2015, comply with section 300A of the Corporations Act 2001.
5. The directors have been given the declarations by the chief executive officer and chief financial officer required by
section 295A.
This declaration is made in accordance with a resolution of the Board of Directors and is signed for and on behalf of the
directors by:
Anthony Cormack Director 29 September 2015
For
per
sona
l use
onl
y

93
ADDITIONAL STOCK EXCHANGE INFORMATION DISTRIBUTION OF NUMBER OF HOLDERS OF EQUITY SECURITIES AS AT 18 SEPTEMBER 2015
Ordinary shares fully paid Number of Securities Held No. of holders 1 to 1,000 344 1,001 to 5,000 348 5,001 to 10,000 332 10,001 to 100,000 660 100,001 and over 259 1943 Number of shareholders holding less than a marketable parcel of shares 870
TWENTY LARGEST HOLDERS OF EACH QUOTED SECURITY
Rank Name Balance % Held
1 NATIONAL NOMINEES LIMITED 13,243,091 6.1
2 PATHFINDER EXPLORATION PTY LTD 8,648,697 4.0
3 J P MORGAN NOMINEES AUSTRALIA LIMITED 7,082,351 3.3
4 UBS NOMINEES PTY LTD 6,129,999 2.8
5 FORSYTH BARR CUSTODIANS LTD <FORSYTH BARR LTD-NOMINEE A/C> 5,866,585 2.7
6 CUSTODIAL SERVICES LIMITED <BENEFICIARIES HOLDING A/C> 5,778,648 2.7
7 MR ROBERT SIMEON LORD 5,600,000 2.6
8 INVESTORLINK GROUP LIMITED 5,252,698 2.4
9 HSBC CUSTODY NOMINEES (AUSTRALIA) LIMITED 5,195,808 2.4
10 HSBC CUSTODY NOMINEES (AUSTRALIA) LIMITED - A/C 3 4,867,841 2.3
11 NORVALE PTY LTD 4,040,918 1.9
12 MR ANTHONY LIONEL PATTERSON <PATTERSON FAMILY A/C> 3,366,666 1.6
13 ORBIT CAPITAL PTY LTD 2,800,552 1.3
14 ADCOCK PTY LTD 2,658,169 1.2
15 MR RICHARD HOPETOUN BITCON 2,600,000 1.2
16 ALLEGRO CAPITAL NOMINEES PTY LTD <ALLEGRO CAPITAL ACCOUNT> 2,534,064 1.2
17 MRS MIN YOUNG KANG 2,492,643 1.2
18 MR RICHARD IAN TREVILLION <TRADING ACCOUNT> 2,324,949 1.1
19 BT PORTFOLIO SERVICES LIMITED <WARRELL HOLDINGS S/F> 2,300,000 1.1
20 COLENEW PTY LIMITED <PAUL XIRADIS ACCOUNT> 2,280,000 1.1 VOTING RIGHTS All ordinary shares carry one vote per share without restriction. SUBSTANTIAL SHAREHOLDERS Substantial shareholders as shown in substantial shareholder notices received by the Company at 18 September 2015 are:
Name of Shareholder Ordinary Shares
OCH-ZIFF HOLDING CORPORATION AND RELATED ENTITIES 17,334,089
For
per
sona
l use
onl
y
Level 10, 12 Creek St Brisbane QLD 4000 GPO Box 457 Brisbane QLD 4001 Australia
Tel: +61 7 3237 5999 Fax: +61 7 3221 9227 www.bdo.com.au
BDO Audit Pty Ltd ABN 33 134 022 870 is a member of a national association of independent entities which are all members of BDO Australia Ltd ABN 77 050 110 275, an Australian company limited by guarantee. BDO Audit Pty Ltd and BDO Australia Ltd are members of BDO International Ltd, a UK company limited by guarantee, and form part of the international BDO network of independent member firms. Liability limited by a scheme approved under Professional Standards Legislation, other than for the acts or omissions of financial services licensees.
INDEPENDENT AUDITOR’S REPORT
To the members of Lamboo Resources Limited
Report on the Financial Report
We have audited the accompanying financial report of Lamboo Resources Limited, which comprises the
consolidated balance sheet as at 30 June 2015, the consolidated statement of comprehensive income,
the consolidated statement of changes in equity and the consolidated statement of cash flows for the
year then ended, notes comprising a summary of significant accounting policies and other explanatory
information, and the directors’ declaration of the consolidated entity comprising the company and the
entities it controlled at the year’s end or from time to time during the financial year.
Directors’ Responsibility for the Financial Report
The directors of the company are responsible for the preparation of the financial report that gives a
true and fair view in accordance with Australian Accounting Standards and the Corporations Act 2001
and for such internal control as the directors determine is necessary to enable the preparation of the
financial report that gives a true and fair view and is free from material misstatement, whether due to
fraud or error. In Note 1, the directors also state, in accordance with Accounting Standard AASB 101
Presentation of Financial Statements, that the financial statements comply with International
Financial Reporting Standards.
Auditor’s Responsibility
Our responsibility is to express an opinion on the financial report based on our audit. We conducted our
audit in accordance with Australian Auditing Standards. Those standards require that we comply with
relevant ethical requirements relating to audit engagements and plan and perform the audit to obtain
reasonable assurance about whether the financial report is free from material misstatement.
An audit involves performing procedures to obtain audit evidence about the amounts and disclosures in
the financial report. The procedures selected depend on the auditor’s judgement, including the
assessment of the risks of material misstatement of the financial report, whether due to fraud or error.
In making those risk assessments, the auditor considers internal control relevant to the company’s
preparation of the financial report that gives a true and fair view in order to design audit procedures
that are appropriate in the circumstances, but not for the purpose of expressing an opinion on the
effectiveness of the company’s internal control. An audit also includes evaluating the appropriateness
of accounting policies used and the reasonableness of accounting estimates made by the directors, as
well as evaluating the overall presentation of the financial report.
We believe that the audit evidence we have obtained is sufficient and appropriate to provide a basis
for our audit opinion.
Independence
In conducting our audit, we have complied with the independence requirements of the Corporations
Act 2001. We confirm that the independence declaration required by the Corporations Act 2001, which
has been given to the directors of Lamboo Resources Limited, would be in the same terms if given to
the directors as at the time of this auditor’s report.
94
For
per
sona
l use
onl
y

BDO Audit Pty Ltd ABN 33 134 022 870 is a member of a national association of independent entities which are all members of BDO Australia Ltd ABN 77 050 110 275, an Australian company limited by guarantee. BDO Audit Pty Ltd and BDO Australia Ltd are members of BDO International Ltd, a UK company limited by guarantee, and form part of the international BDO network of independent member firms. Liability limited by a scheme approved under Professional Standards Legislation, other than for the acts or omissions of financial services licensees.
Opinion
In our opinion:
(a) the financial report of Lamboo Resources Limited is in accordance with the Corporations Act 2001,
including:
(i) giving a true and fair view of the consolidated entity’s financial position as at 30 June 2015
and of its performance for the year ended on that date; and
(ii) complying with Australian Accounting Standards and the Corporations Regulations 2001; and
(b) the financial report also complies with International Financial Reporting Standards as disclosed in
Note 1.
Emphasis of matter
Without modifying our opinion, we draw attention to Note 1 in the financial report, which indicates
that the ability of the consolidated entity to continue as a going concern is dependent upon the future
successful raising of necessary funding through equity, successful exploration and subsequent
exploitation of the consolidated entity’s tenements, and/or sale of non-core assets. These conditions,
along with other matters as set out in Note 1, indicate the existence of a material uncertainty that
may cast significant doubt about the consolidated entity’s ability to continue as a going concern and
therefore, the consolidated entity may be unable to realise its assets and discharge its liabilities in the
normal course of business.
Report on the Remuneration Report
We have audited the Remuneration Report included in pages 49 to 55 of the directors’ report for the
year ended 30 June 2015. The directors of the company are responsible for the preparation and
presentation of the Remuneration Report in accordance with section 300A of the Corporations Act
2001. Our responsibility is to express an opinion on the Remuneration Report, based on our audit
conducted in accordance with Australian Auditing Standards.
Opinion
In our opinion, the Remuneration Report of Lamboo Resources Limited for the year ended 30 June 2015
complies with section 300A of the Corporations Act 2001.
BDO Audit Pty Ltd
Damian Wright
Director
Brisbane, 29 September 2015
95
For
per
sona
l use
onl
y