Embed Size (px)
Citation preview
Lam Research Corp. | 10.22.2014 1
Lam Research Corporation September Quarter 2014 Financial Results
October 22, 2014
Lam Research Corp. | 10.22.2014 2
Cautions Regarding Forward-Looking Statements
Statements made in this presentation that are not statements of historical fact are forward-looking statements and are subject to the safe harbor provisions created by the Private Securities Litigation Reform Act of 1995. Forward-looking statements relate, but are not limited, to the components and projections of our financial models; our expectations, strategies, vision, opportunities and underlying assumptions with respect to our performance compared to the semiconductor industry, which include the market expansion opportunities from, product portfolio market share at, and wafer fab equipment (“WFE”) spending focused on technology inflections such as 3D NAND, multi-patterning, advanced packaging and FinFET; the elements of our Industry Outlook for the remainder of 2014 and 2015, including the drivers, assumptions and expectations with respect to spending and growth (for each, both in terms of quantity and timing), trends and areas of investment related to WFE, memory (both NAND and DRAM), logic and foundry accounts and inflection technology opportunities; our plans for creating value for all stakeholders and any underlying strategies; our competitive position to capitalize on emerging trends and to grow relative to the WFE industry; our positioning and capabilities for future success at technology inflections; the anticipated revenue from our sales to Japanese customers; trends in the global economic environment and the semiconductor industry; factors that affect our tax rates and their potential impact; and forecasts for tax rates, shipments, revenues, gross margins, operating margins, share count and earnings per share on either a GAAP or a non-GAAP basis. Some important factors that may affect these forward-looking statements include but are not limited to: business conditions in the semiconductor industry and the overall economy; global political and economic conditions; electronics consumption; the financial performance and expectations of our existing and prospective customers; the introduction of new technologies; the occurrence and pace of technology transitions and conversions; actions of competitors, consumers, semiconductor companies and key suppliers and subcontractors; unanticipated challenges to our integration efforts; and the success of our R&D and sales and marketing programs. These forward-looking statements are based on current expectations and are subject to uncertainties and changes in condition, significance, value and effect, as well as other risks detailed in the oral presentation accompanying these slides, and documents filed with the Securities and Exchange Commission, including the report on Form 10-K for the year ended June 29, 2014. These important factors could cause actual results to differ materially from expectations. As a result, you should not place undue weight on such forward-looking statements. The Company undertakes no obligation to update the statements made in this presentation.
Lam Research Corp. | 10.22.2014 3
Business Review and Industry Outlook Martin Anstice
President & Chief Executive Officer
Lam Research Corp. | 10.22.2014 4
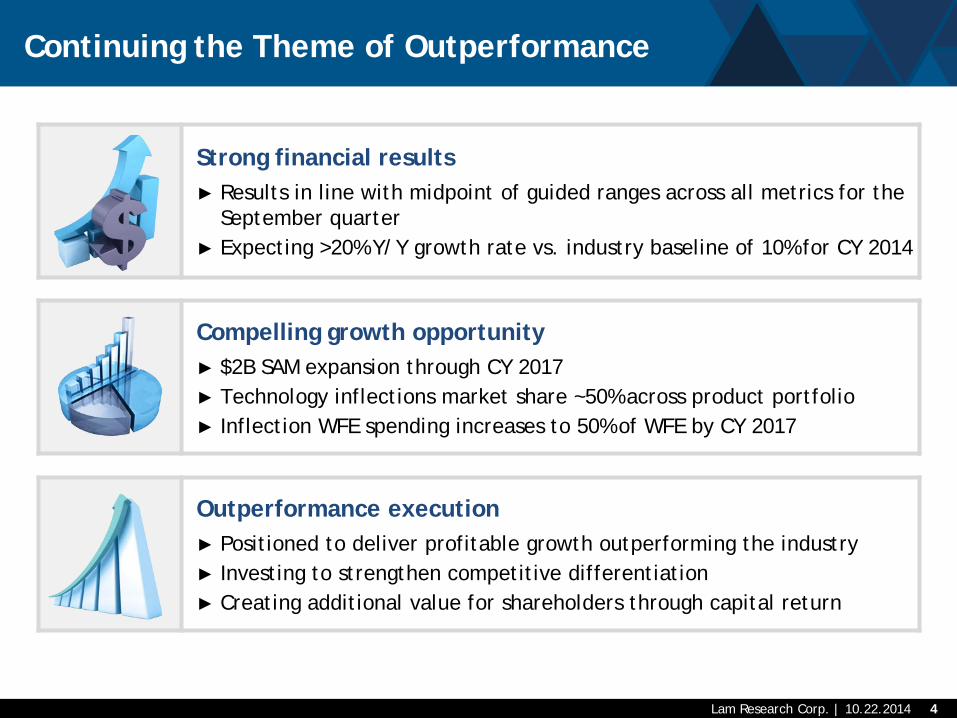
Compelling growth opportunity ► $2B SAM expansion through CY 2017 ► Technology inflections market share ~50% across product portfolio ► Inflection WFE spending increases to 50% of WFE by CY 2017
Continuing the Theme of Outperformance
Strong financial results ► Results in line with midpoint of guided ranges across all metrics for the
September quarter ► Expecting >20% Y/Y growth rate vs. industry baseline of 10% for CY 2014
Outperformance execution ► Positioned to deliver profitable growth outperforming the industry ► Investing to strengthen competitive differentiation ► Creating additional value for shareholders through capital return
Lam Research Corp. | 10.22.2014 5
► Spending by segment largely tracking our projections Memory slightly stronger in 1H, more broad based logic participation in 2H
NAND: — Investment primarily focused on planar conversion to below 20nm
DRAM: — Transition to mid 2x and below ongoing — Growth in mobile and enterprise DRAM
Foundry, Logic: — Broadening of participants — Early FinFET purchases and capacity for 28nm
► Maintaining 2014 WFE spend forecast of $32B ± $1B
► Biased to WFE growth year in 2015 Starting assumption of growth in the +5-10% range
Expecting deposition and etch to grow faster than WFE baseline
Industry Outlook
Lam positioned to continue outperforming WFE growth
Lam Research Corp. | 10.22.2014 6
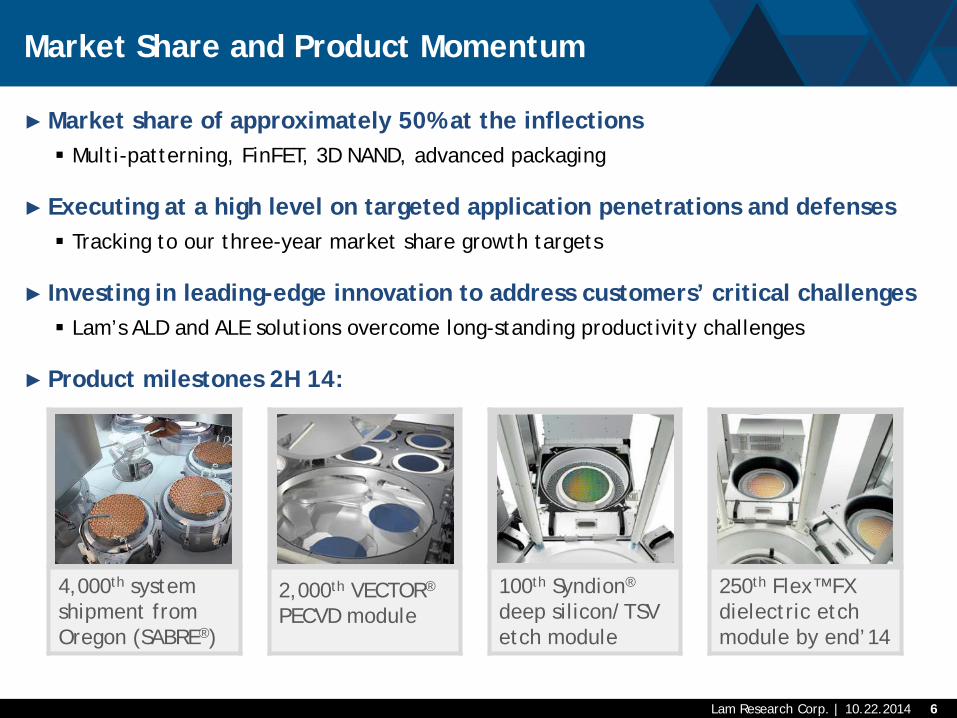
4,000th system shipment from Oregon (SABRE®)
2,000th VECTOR® PECVD module
100th Syndion®
deep silicon/TSV etch module
250th Flex™ FX dielectric etch module by end’14
► Market share of approximately 50% at the inflections Multi-patterning, FinFET, 3D NAND, advanced packaging
► Executing at a high level on targeted application penetrations and defenses Tracking to our three-year market share growth targets
► Investing in leading-edge innovation to address customers’ critical challenges Lam’s ALD and ALE solutions overcome long-standing productivity challenges
► Product milestones 2H 14:
Market Share and Product Momentum
Lam Research Corp. | 10.22.2014 7
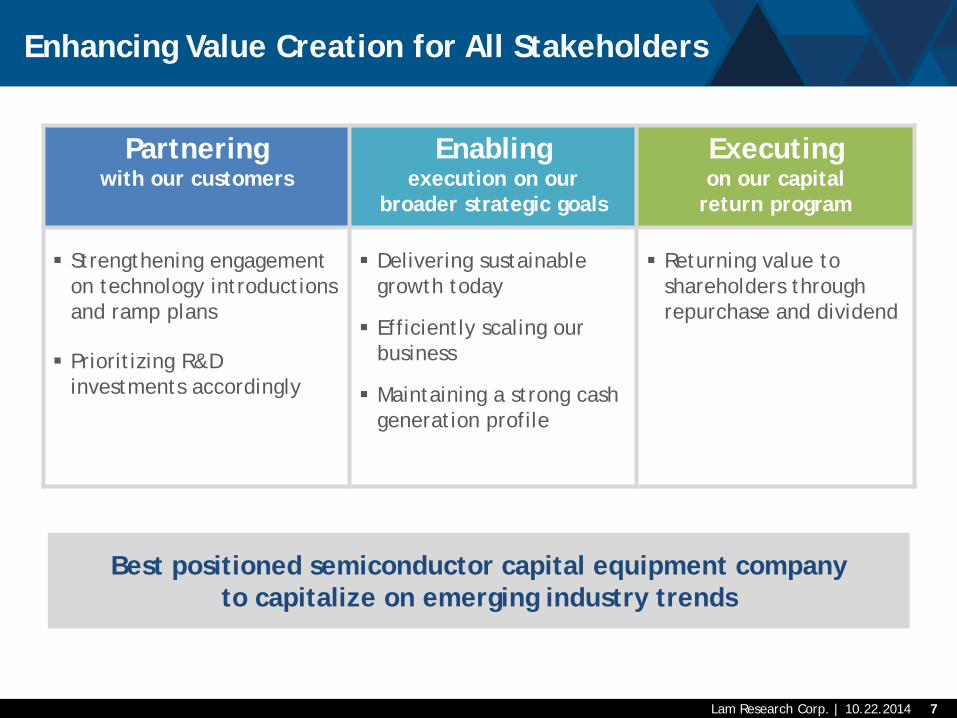
Enhancing Value Creation for All Stakeholders
Partnering with our customers
Enabling execution on our
broader strategic goals
Executing on our capital
return program
Strengthening engagement on technology introductions and ramp plans
Prioritizing R&D investments accordingly
Delivering sustainable growth today
Efficiently scaling our business
Maintaining a strong cash generation profile
Returning value to shareholders through repurchase and dividend
Best positioned semiconductor capital equipment company to capitalize on emerging industry trends

Lam Research Corp. | 10.22.2014 8
September Quarter 2014 Financial Results and December Quarter 2014 Outlook
Doug Bettinger Executive Vice President & Chief Financial Officer
Lam Research Corp. | 10.22.2014 9
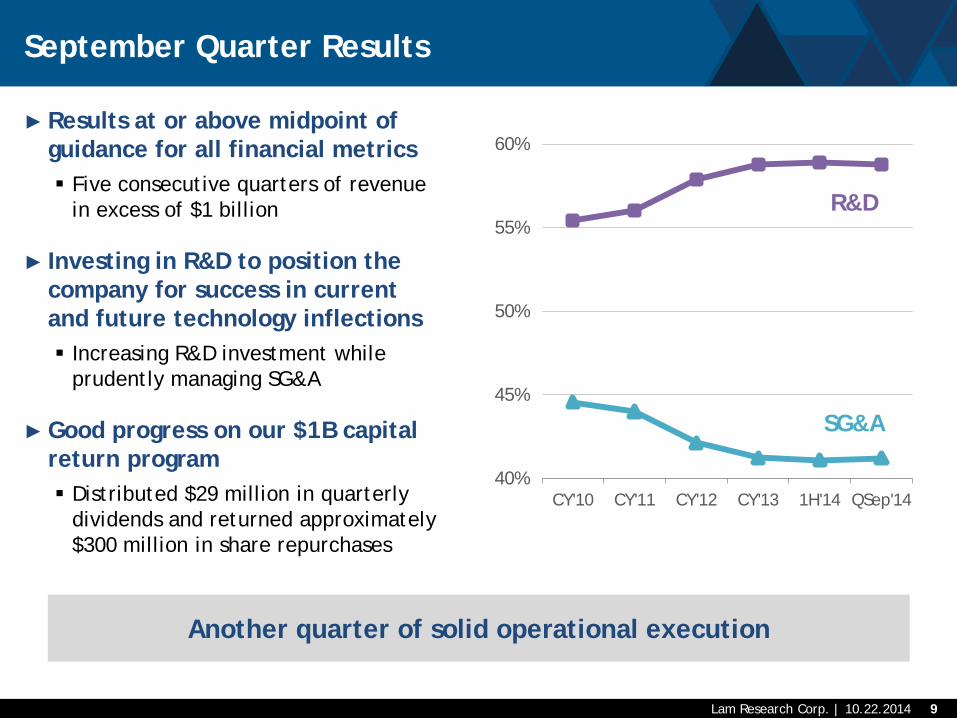
► Results at or above midpoint of guidance for all financial metrics Five consecutive quarters of revenue
in excess of $1 billion
► Investing in R&D to position the company for success in current and future technology inflections Increasing R&D investment while
prudently managing SG&A
► Good progress on our $1B capital return program Distributed $29 million in quarterly
dividends and returned approximately $300 million in share repurchases
September Quarter Results
Another quarter of solid operational execution
40%
45%
50%
55%
60%
CY'10 CY'11 CY'12 CY'13 1H'14 QSep'14
R&D
SG&A
Lam Research Corp. | 10.22.2014 10
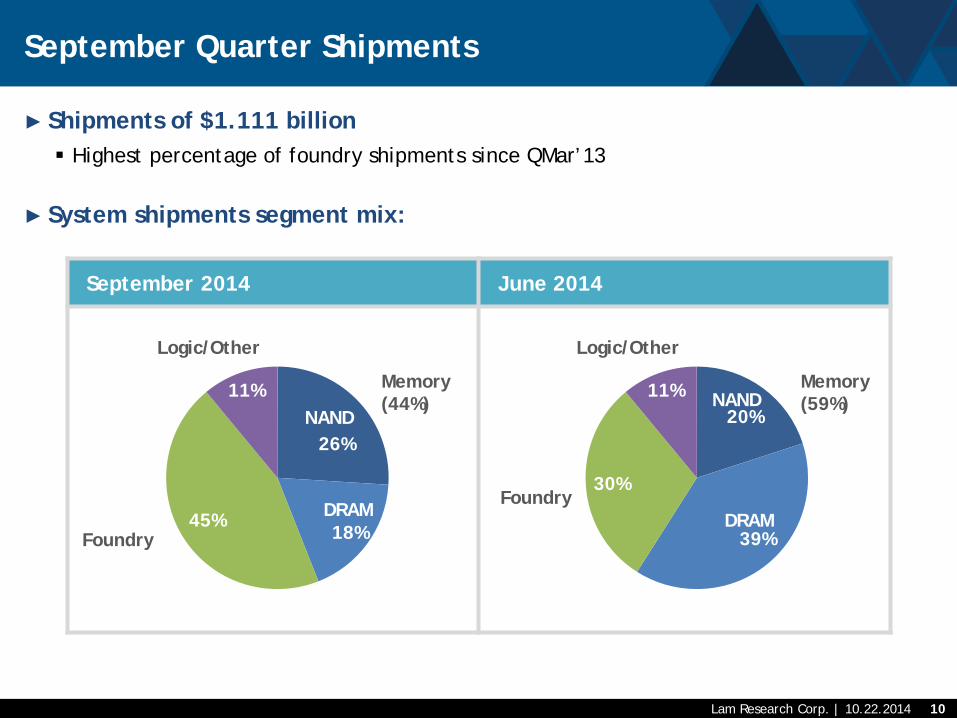
September 2014 June 2014
► Shipments of $1.111 billion Highest percentage of foundry shipments since QMar’13
► System shipments segment mix:
September Quarter Shipments
26%
18% 45%
11%
Foundry
Logic/Other
Memory (44%)
NAND
DRAM
20%
39%
30%
11%
Foundry
Logic/Other
Memory (59%) NAND
DRAM
Lam Research Corp. | 10.22.2014 11
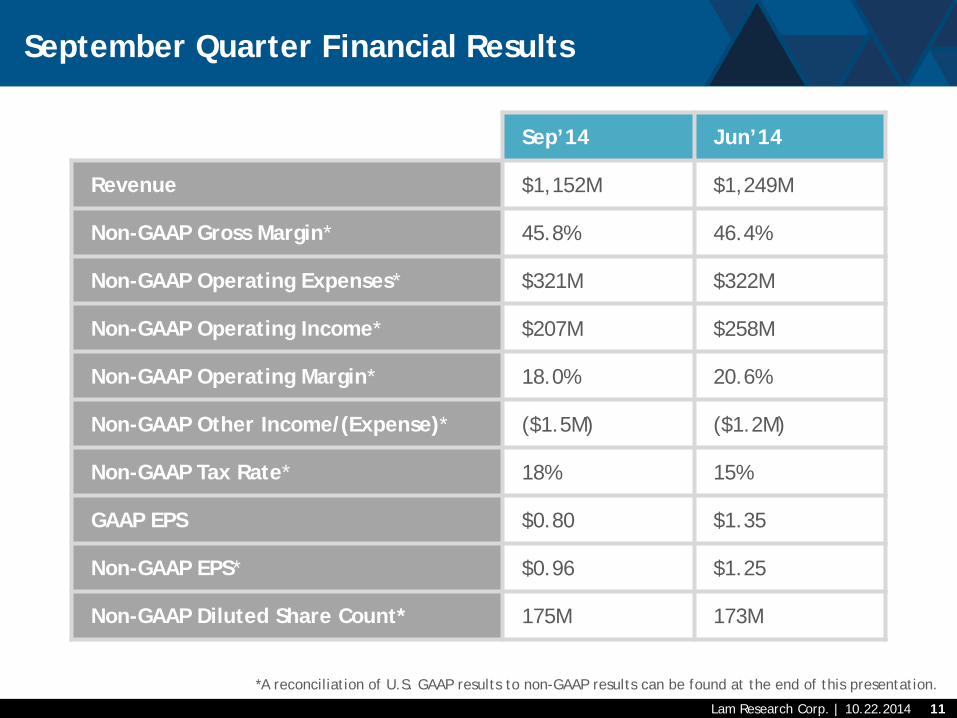
September Quarter Financial Results
Sep’14 Jun’14
Revenue $1,152M $1,249M
Non-GAAP Gross Margin* 45.8% 46.4%
Non-GAAP Operating Expenses* $321M $322M
Non-GAAP Operating Income* $207M $258M
Non-GAAP Operating Margin* 18.0% 20.6%
Non-GAAP Other Income/(Expense)* ($1.5M) ($1.2M)
Non-GAAP Tax Rate* 18% 15%
GAAP EPS $0.80 $1.35
Non-GAAP EPS* $0.96 $1.25
Non-GAAP Diluted Share Count* 175M 173M
*A reconciliation of U.S. GAAP results to non-GAAP results can be found at the end of this presentation.
Lam Research Corp. | 10.22.2014 12
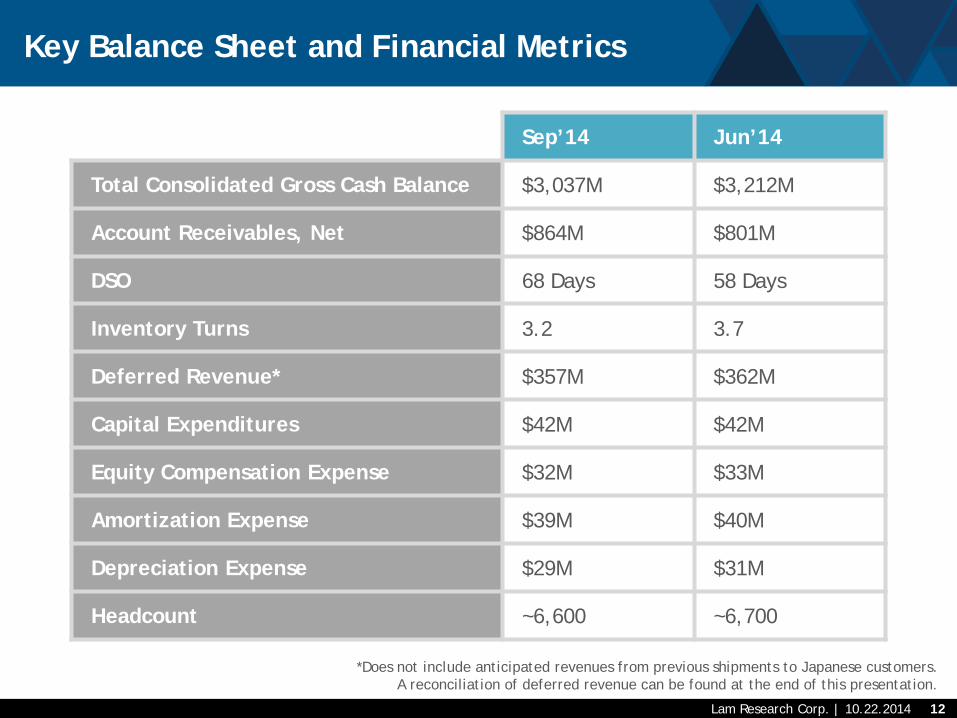
Key Balance Sheet and Financial Metrics
Sep’14 Jun’14
Total Consolidated Gross Cash Balance $3,037M $3,212M
Account Receivables, Net $864M $801M
DSO 68 Days 58 Days
Inventory Turns 3.2 3.7
Deferred Revenue* $357M $362M
Capital Expenditures $42M $42M
Equity Compensation Expense $32M $33M
Amortization Expense $39M $40M
Depreciation Expense $29M $31M
Headcount ~6,600 ~6,700
*Does not include anticipated revenues from previous shipments to Japanese customers. A reconciliation of deferred revenue can be found at the end of this presentation.

Lam Research Corp. | 10.22.2014 13
December 2014 Quarter Non-GAAP Guidance
Dec’14 Guidance
Shipments $1.240 billion ± $50 million
Revenue $1.230 billion ± $50 million
Non-GAAP Gross Margin 45.5% ± 1%
Non-GAAP Operating Margin 19.0% ± 1%
Non-GAAP Earnings per Share(1) $1.12 ± $0.07
(1) Based on a share count of ~173 million shares

Lam Research Corp. | 10.22.2014 14
Questions & Answers
Lam Research Corp. | 10.22.2014 16
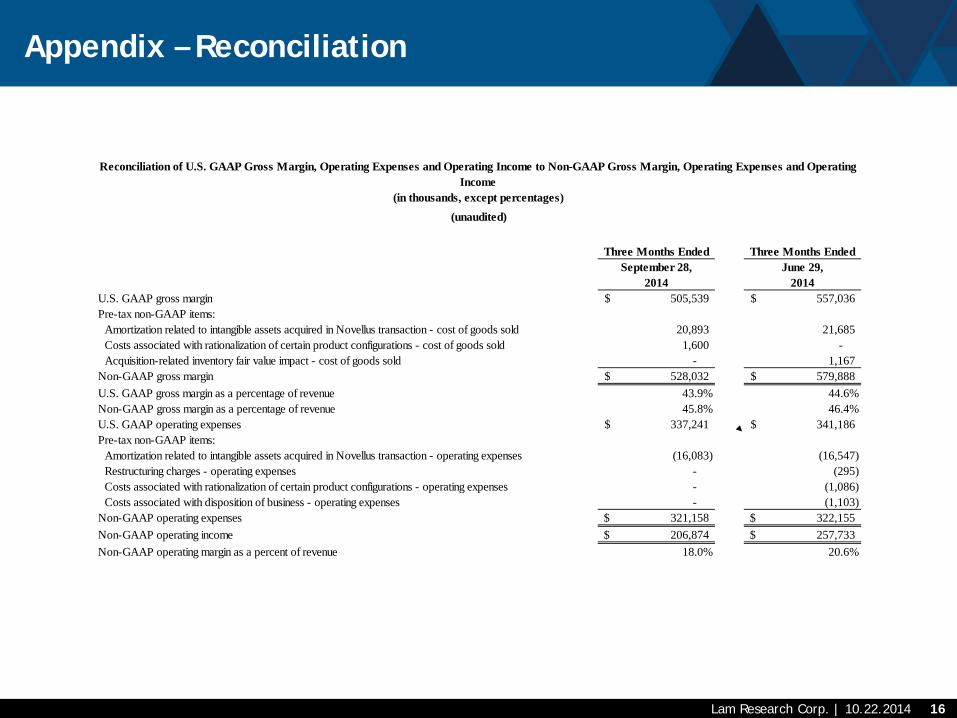
Appendix – Reconciliation
Three Months Ended Three Months EndedSeptember 28, June 29,
2014 2014U.S. GAAP gross margin 505,539$ 557,036$ Pre-tax non-GAAP items:
Amortization related to intangible assets acquired in Novellus transaction - cost of goods sold 20,893 21,685 Costs associated with rationalization of certain product configurations - cost of goods sold 1,600 - Acquisition-related inventory fair value impact - cost of goods sold - 1,167
Non-GAAP gross margin 528,032$ 579,888$ U.S. GAAP gross margin as a percentage of revenue 43.9% 44.6%Non-GAAP gross margin as a percentage of revenue 45.8% 46.4%U.S. GAAP operating expenses 337,241$ 341,186$ Pre-tax non-GAAP items:
Amortization related to intangible assets acquired in Novellus transaction - operating expenses (16,083) (16,547) Restructuring charges - operating expenses - (295) Costs associated with rationalization of certain product configurations - operating expenses - (1,086) Costs associated with disposition of business - operating expenses - (1,103)
Non-GAAP operating expenses 321,158$ 322,155$ Non-GAAP operating income 206,874$ 257,733$ Non-GAAP operating margin as a percent of revenue 18.0% 20.6%
Reconciliation of U.S. GAAP Gross Margin, Operating Expenses and Operating Income to Non-GAAP Gross Margin, Operating Expenses and Operating Income
(in thousands, except percentages)(unaudited)
Lam Research Corp. | 10.22.2014 17
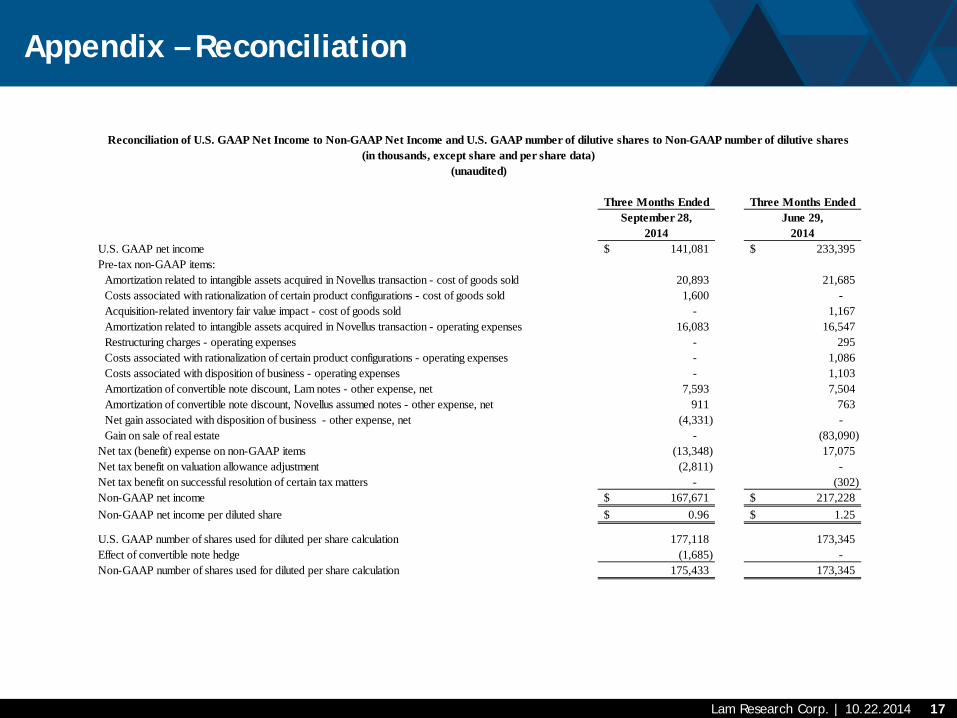
Appendix – Reconciliation
Three Months Ended Three Months EndedSeptember 28, June 29,
2014 2014U.S. GAAP net income 141,081$ 233,395$ Pre-tax non-GAAP items:
Amortization related to intangible assets acquired in Novellus transaction - cost of goods sold 20,893 21,685 Costs associated with rationalization of certain product configurations - cost of goods sold 1,600 - Acquisition-related inventory fair value impact - cost of goods sold - 1,167 Amortization related to intangible assets acquired in Novellus transaction - operating expenses 16,083 16,547 Restructuring charges - operating expenses - 295 Costs associated with rationalization of certain product configurations - operating expenses - 1,086 Costs associated with disposition of business - operating expenses - 1,103 Amortization of convertible note discount, Lam notes - other expense, net 7,593 7,504 Amortization of convertible note discount, Novellus assumed notes - other expense, net 911 763 Net gain associated with disposition of business - other expense, net (4,331) - Gain on sale of real estate - (83,090)
Net tax (benefit) expense on non-GAAP items (13,348) 17,075 Net tax benefit on valuation allowance adjustment (2,811) - Net tax benefit on successful resolution of certain tax matters - (302) Non-GAAP net income 167,671$ 217,228$ Non-GAAP net income per diluted share 0.96$ 1.25$
U.S. GAAP number of shares used for diluted per share calculation 177,118 173,345 Effect of convertible note hedge (1,685) - Non-GAAP number of shares used for diluted per share calculation 175,433 173,345
Reconciliation of U.S. GAAP Net Income to Non-GAAP Net Income and U.S. GAAP number of dilutive shares to Non-GAAP number of dilutive shares(in thousands, except share and per share data)
(unaudited)
Lam Research Corp. | 10.22.2014 18
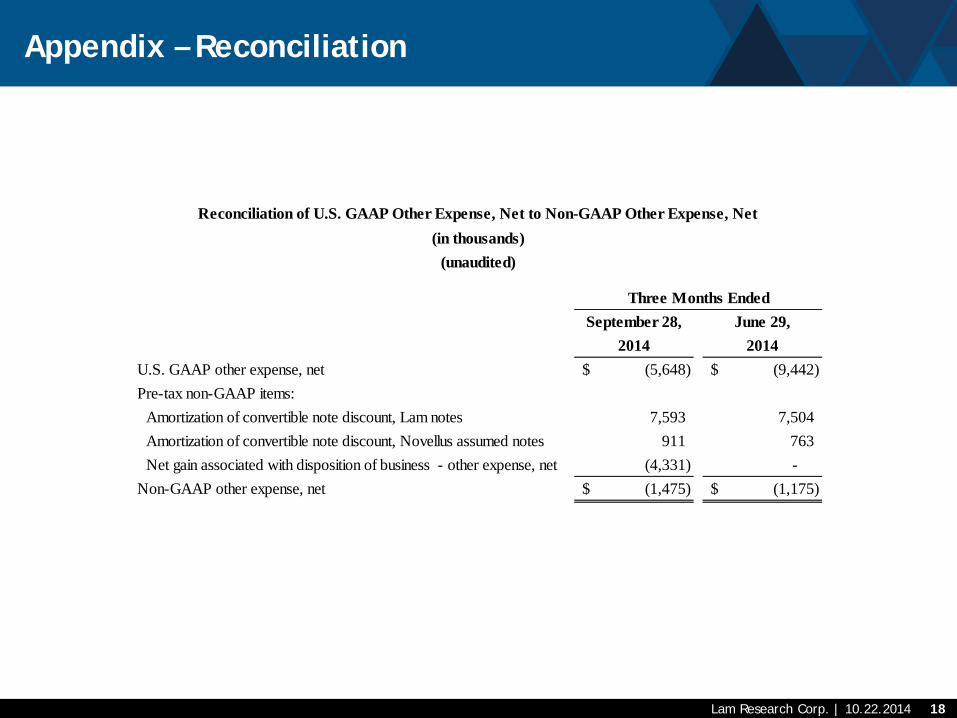
Appendix – Reconciliation
September 28, June 29,2014 2014
U.S. GAAP other expense, net (5,648)$ (9,442)$ Pre-tax non-GAAP items:
Amortization of convertible note discount, Lam notes 7,593 7,504 Amortization of convertible note discount, Novellus assumed notes 911 763 Net gain associated with disposition of business - other expense, net (4,331) -
Non-GAAP other expense, net (1,475)$ (1,175)$
Reconciliation of U.S. GAAP Other Expense, Net to Non-GAAP Other Expense, Net(in thousands)
(unaudited)
Three Months Ended
Lam Research Corp. | 10.22.2014 19
Appendix – Reconciliation
September 28, June 29,2014 2014
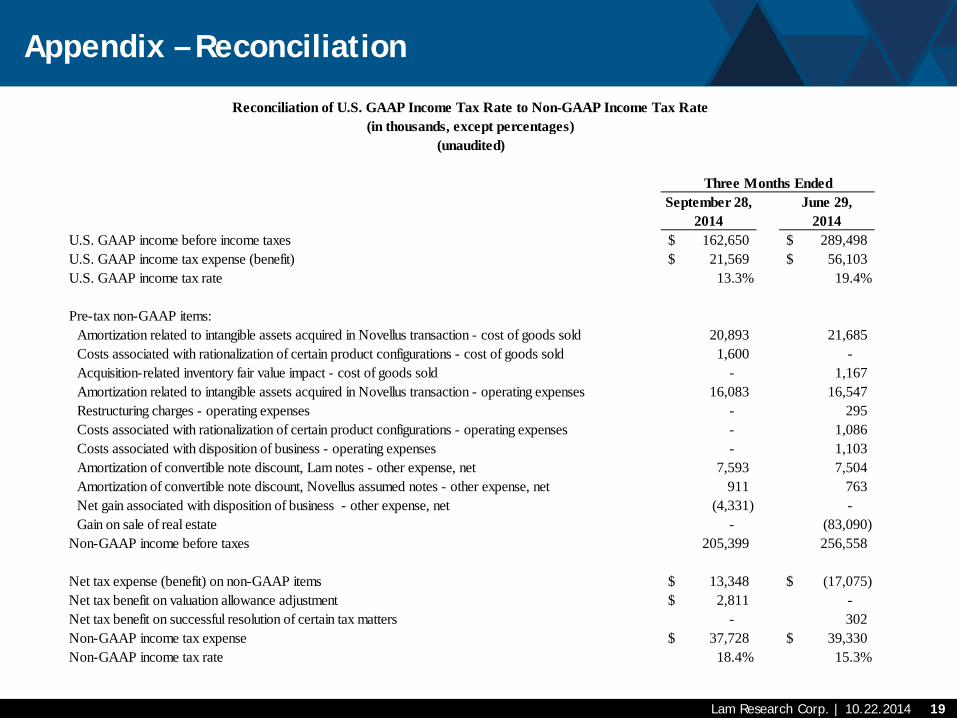
U.S. GAAP income before income taxes 162,650$ 289,498$ U.S. GAAP income tax expense (benefit) 21,569$ 56,103$ U.S. GAAP income tax rate 13.3% 19.4%
Pre-tax non-GAAP items:Amortization related to intangible assets acquired in Novellus transaction - cost of goods sold 20,893 21,685 Costs associated with rationalization of certain product configurations - cost of goods sold 1,600 - Acquisition-related inventory fair value impact - cost of goods sold - 1,167 Amortization related to intangible assets acquired in Novellus transaction - operating expenses 16,083 16,547 Restructuring charges - operating expenses - 295 Costs associated with rationalization of certain product configurations - operating expenses - 1,086 Costs associated with disposition of business - operating expenses - 1,103 Amortization of convertible note discount, Lam notes - other expense, net 7,593 7,504 Amortization of convertible note discount, Novellus assumed notes - other expense, net 911 763 Net gain associated with disposition of business - other expense, net (4,331) - Gain on sale of real estate - (83,090)
Non-GAAP income before taxes 205,399 256,558
Net tax expense (benefit) on non-GAAP items 13,348$ (17,075)$ Net tax benefit on valuation allowance adjustment 2,811$ - Net tax benefit on successful resolution of certain tax matters - 302 Non-GAAP income tax expense 37,728$ 39,330$ Non-GAAP income tax rate 18.4% 15.3%
Reconciliation of U.S. GAAP Income Tax Rate to Non-GAAP Income Tax Rate(in thousands, except percentages)
(unaudited)
Three Months Ended
Lam Research Corp. | 10.22.2014 20
Appendix – Reconciliation
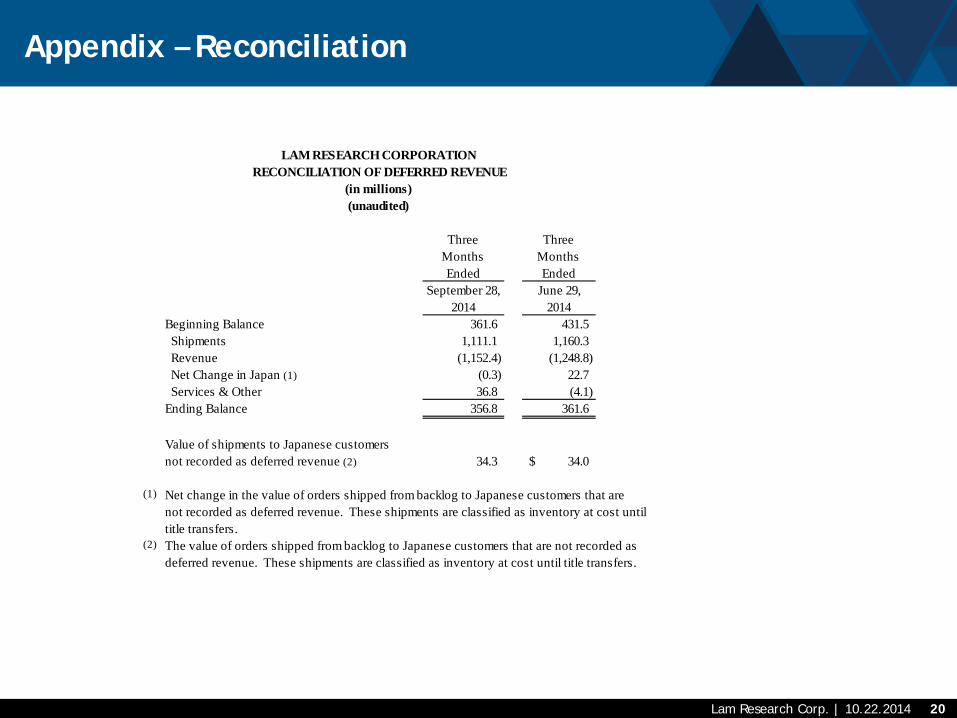
LAM RESEARCH CORPORATIONRECONCILIATION OF DEFERRED REVENUE
(in millions)(unaudited)
Three Months Ended
Three Months Ended
September 28, June 29,2014 2014
Beginning Balance 361.6 431.5 Shipments 1,111.1 1,160.3 Revenue (1,152.4) (1,248.8) Net Change in Japan (1) (0.3) 22.7 Services & Other 36.8 (4.1) Ending Balance 356.8 361.6
Value of shipments to Japanese customersnot recorded as deferred revenue (2) 34.3 34.0$
(1) Net change in the value of orders shipped from backlog to Japanese customers that are not recorded as deferred revenue. These shipments are classified as inventory at cost untiltitle transfers.
(2) The value of orders shipped from backlog to Japanese customers that are not recorded asdeferred revenue. These shipments are classified as inventory at cost until title transfers.
Lam Research Corp. | 10.22.2014 21
Appendix – Reconciliation
Reconciling Items
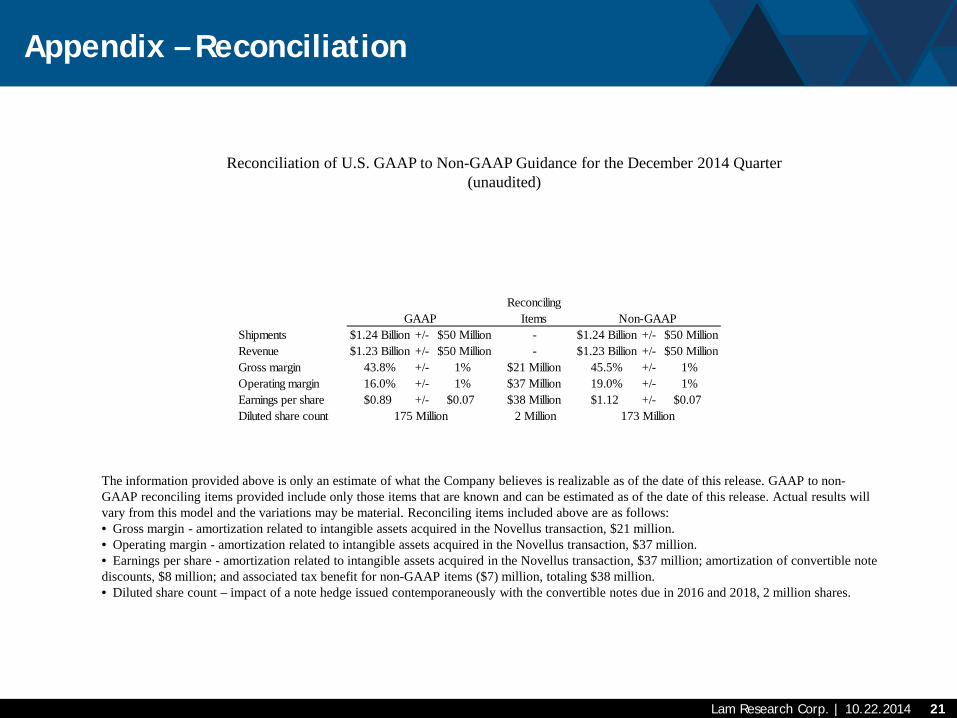
Shipments $1.24 Billion +/- $50 Million - $1.24 Billion +/- $50 MillionRevenue $1.23 Billion +/- $50 Million - $1.23 Billion +/- $50 MillionGross margin 43.8% +/- 1% $21 Million 45.5% +/- 1%Operating margin 16.0% +/- 1% $37 Million 19.0% +/- 1%Earnings per share $0.89 +/- $0.07 $38 Million $1.12 +/- $0.07Diluted share count 2 Million
GAAP Non-GAAP
175 Million 173 Million
The information provided above is only an estimate of what the Company believes is realizable as of the date of this release. GAAP to non-GAAP reconciling items provided include only those items that are known and can be estimated as of the date of this release. Actual results will vary from this model and the variations may be material. Reconciling items included above are as follows: • Gross margin - amortization related to intangible assets acquired in the Novellus transaction, $21 million. • Operating margin - amortization related to intangible assets acquired in the Novellus transaction, $37 million. • Earnings per share - amortization related to intangible assets acquired in the Novellus transaction, $37 million; amortization of convertible note discounts, $8 million; and associated tax benefit for non-GAAP items ($7) million, totaling $38 million. • Diluted share count – impact of a note hedge issued contemporaneously with the convertible notes due in 2016 and 2018, 2 million shares.
Reconciliation of U.S. GAAP to Non-GAAP Guidance for the December 2014 Quarter (unaudited)