Embed Size (px)
Citation preview
çñçñ
çñ
çñ
çñ
")
")
")
")
")
")
")
")
")")
")
")
")
")
")
")
")
")
")
!>
!>
!>
!>
!>
")
")
")
#I
ËË
Ë
Ë
Ë
Ë
Ë
Ë
Ë
F
F
å(
å
å
å
å
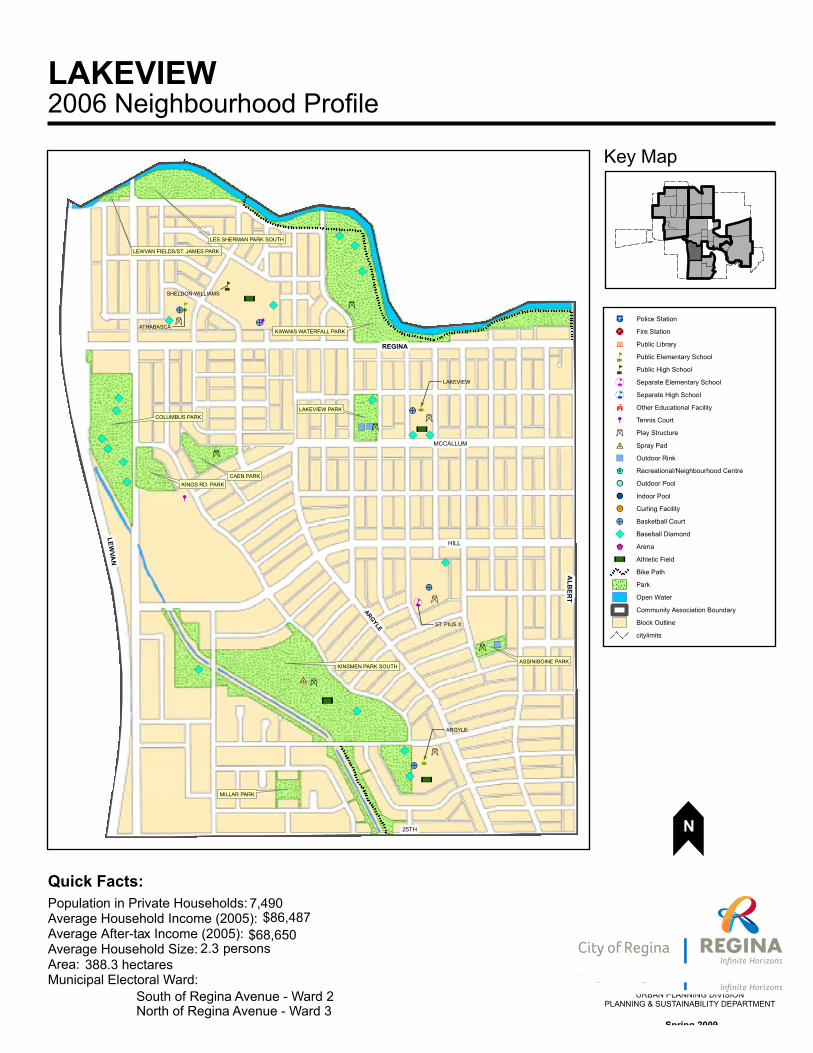
LEWVAN FIELDS/ST. JAMES PARK
LES SHERMAN PARK SOUTH
COLUMBUS PARK
KINGS RD. PARKCAEN PARK
LAKEVIEW PARK
KINSMEN PARK SOUTH
MILLAR PARK
ASSINIBOINE PARK
KIWANIS WATERFALL PARKATHABASCA
SHELDON-WILLIAMS
LAKEVIEW
ARGYLE
ST. PIUS X
LEWVA
N
25TH
HILL
ALB
ERT
MCCALLUM
REGINA
ARGYLE
2006 Neighbourhood ProfileLAKEVIEW
Key Map
a Police Station
¨ Fire Station
ñ Public Library
å Public Elementary School
å Public High School
å( Separate Elementary School
å( Separate High School
k Other Educational Facility
F Tennis Court
Ë Play Structure
#I Spray Pad
") Outdoor Rink
$$$ Recreational/Neighbourhood Centre
!! Outdoor Pool
!! Indoor Pool
!!! Curling Facility
!> Basketball Court
") Baseball Diamond
$$ Arena
çñ Athletic Field
Bike Path
Park
Open Water
Community Association Boundary
Block Outline
citylimits
7,490Population in Private Households:Average Household Income (2005):Average After-tax Income (2005):Average Household Size:Area:Municipal Electoral Ward:
$86,487$68,650
2.3388.3 hectares
persons
Spring 2009
URBAN PLANNING DIVISIONPLANNING & SUSTAINABILITY DEPARTMENT
Quick Facts:
N
South of Regina Avenue - Ward 2North of Regina Avenue - Ward 3
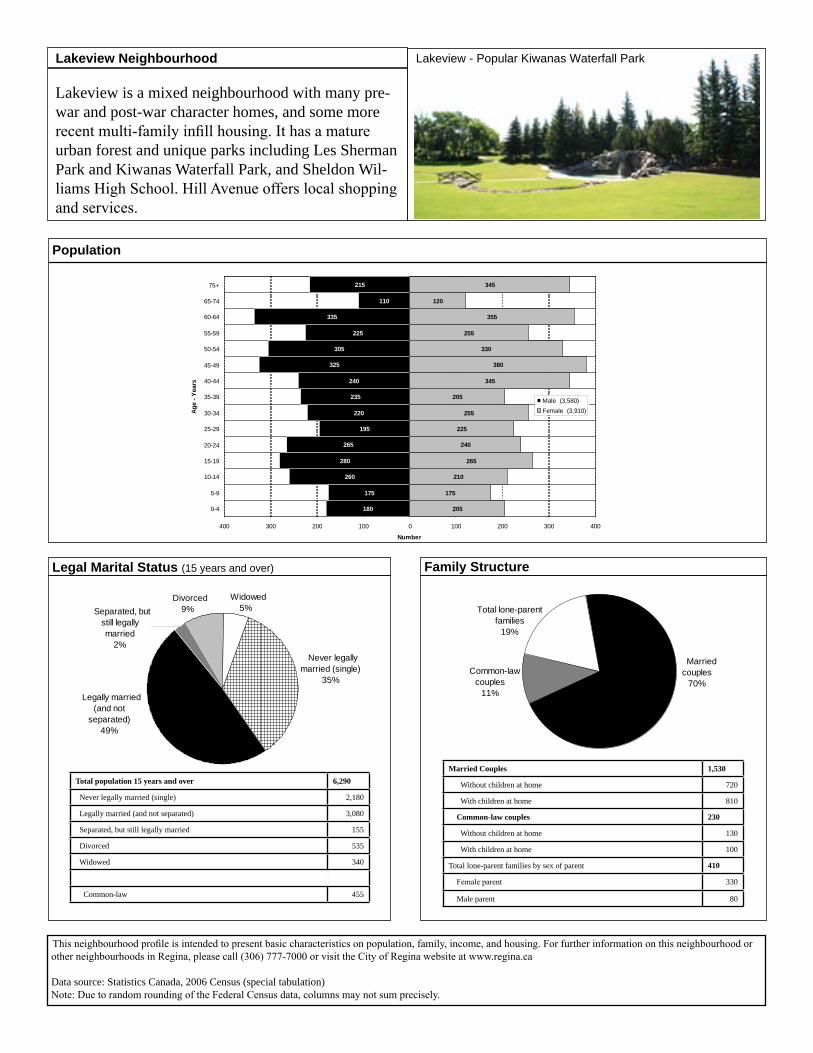
Population
Lakeview Neighbourhood
Lakeview is a mixed neighbourhood with many pre-war and post-war character homes, and some more recent multi-family infill housing. It has a mature urban forest and unique parks including Les Sherman Park and Kiwanas Waterfall Park, and Sheldon Wil-liams High School. Hill Avenue offers local shopping and services.
This neighbourhood profile is intended to present basic characteristics on population, family, income, and housing. For further information on this neighbourhood or other neighbourhoods in Regina, please call (306) 777-7000 or visit the City of Regina website at www.regina.ca
Data source: Statistics Canada, 2006 Census (special tabulation) Note: Due to random rounding of the Federal Census data, columns may not sum precisely.
Legal Marital Status (15 years and over) Family Structure
Total population 15 years and over 6,290
Never legally married (single) 2,180
Legally married (and not separated) 3,080
Separated, but still legally married 155
Divorced 535
Widowed 340
Common-law 455
Married Couples 1,530
Without children at home 720
With children at home 810
Common-law couples 230
Without children at home 130
With children at home 100
Total lone-parent families by sex of parent 410
Female parent 330
Male parent 80
Married couples
70% Common-law
couples11%
Total lone-parent families
19%
180
175
260
280
265
195
220
235
240
325
305
225
335
110
215
205
175
210
265
240
225
255
205
345
380
330
255
355
120
345
400 300 200 100 0 100 200 300 400
0-4
5-9
10-14
15-19
20-24
25-29
30-34
35-39
40-44
45-49
50-54
55-59
60-64
65-74
75+
Age
- Yea
rs
Number
Male (3,580)Female (3,910)
Never legally married (single)
35%
Legally married (and not
separated)49%
Separated, but still legally married
2%
Divorced9%
Widowed5%
Lakeview - Popular Kiwanas Waterfall Park
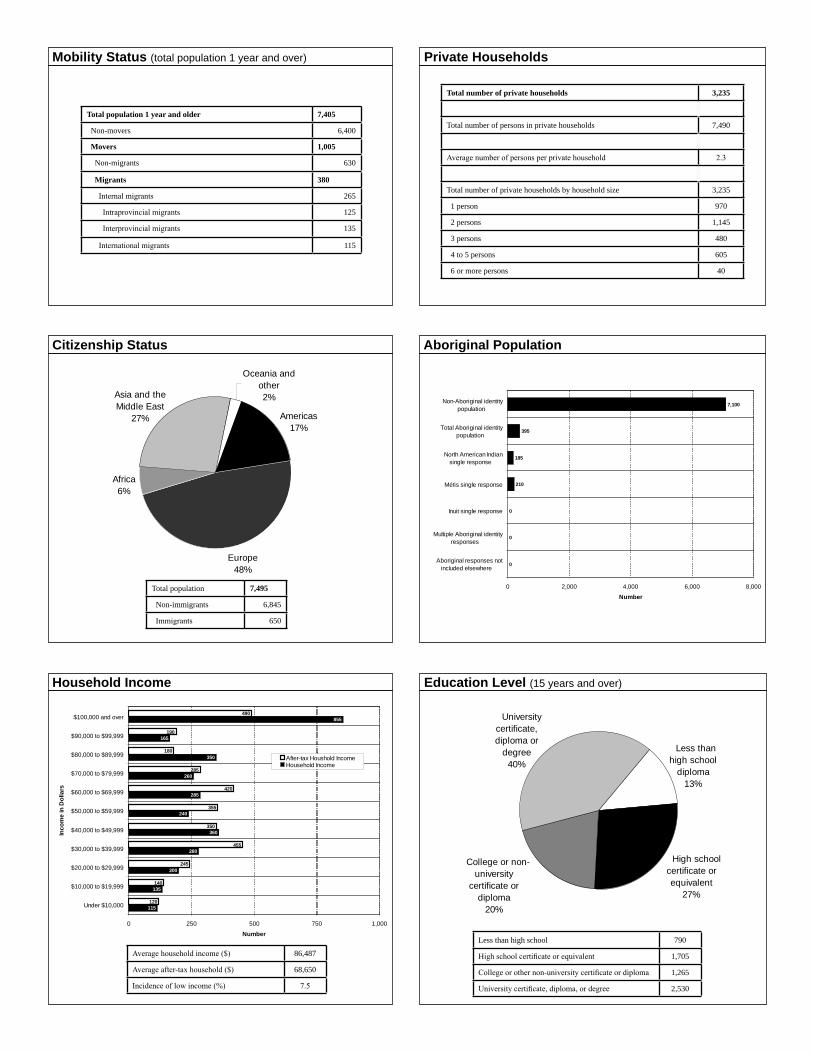
Total population 1 year and older 7,405
Non-movers 6,400
Movers 1,005
Non-migrants 630
Migrants 380
Internal migrants 265
Intraprovincial migrants 125
Interprovincial migrants 135
International migrants 115
Citizenship Status Aboriginal Population
Total population 7,495
Non-immigrants 6,845
Immigrants 650
Household Income
Average household income ($) 86,487
Average after-tax household ($) 68,650
Incidence of low income (%) 7.5
Education Level (15 years and over)
Less than high school 790
High school certificate or equivalent 1,705
College or other non-university certificate or diploma 1,265
University certificate, diploma, or degree 2,530
Mobility Status (total population 1 year and over) Private Households
Total number of private households 3,235
Total number of persons in private households 7,490
Average number of persons per private household 2.3
Total number of private households by household size 3,235
1 person 970
2 persons 1,145
3 persons 480
4 to 5 persons 605
6 or more persons 40
0
0
0
210
185
395
7,100
0 2,000 4,000 6,000 8,000
Aboriginal responses notincluded elsewhere
Multiple Aboriginal identityresponses
Inuit single response
Métis single response
North American Indiansingle response
Total Aboriginal identitypopulation
Non-Aboriginal identitypopulation
Number
University certificate, diploma or
degree40%
College or non-university
certificate or diploma
20%
Less than high school
diploma13%
High school certificate or equivalent
27%
280
855
350
285
240
200
165
260
360
135
115
490
180
190
285
420
355
350
455
245
140
120
0 250 500 750 1,000
Under $10,000
$10,000 to $19,999
$20,000 to $29,999
$30,000 to $39,999
$40,000 to $49,999
$50,000 to $59,999
$60,000 to $69,999
$70,000 to $79,999
$80,000 to $89,999
$90,000 to $99,999
$100,000 and over
Inco
me
in D
olla
rs
Number
After-tax Houshold IncomeHousehold Income
Asia and the Middle East
27%
Africa6%
Oceania and other2%
Europe48%
Americas17%
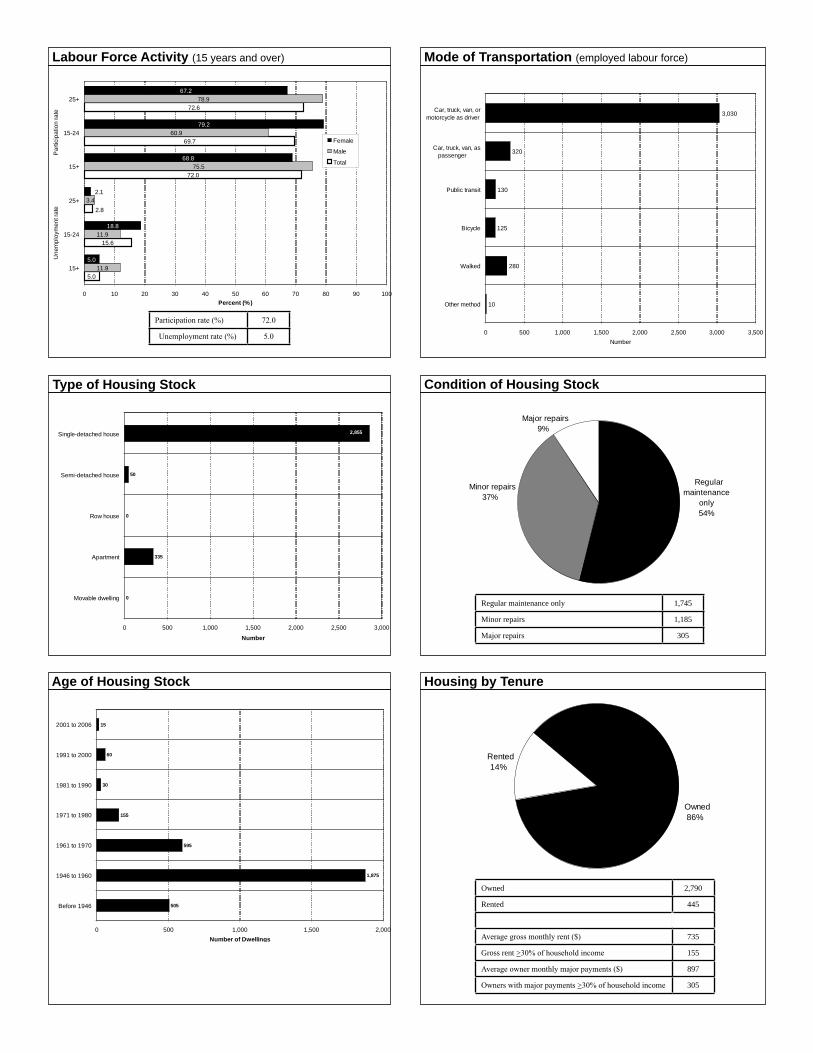
Type of Housing Stock
Age of Housing Stock Housing by Tenure
Condition of Housing Stock
Owned 2,790
Rented 445
Average gross monthly rent ($) 735
Gross rent >30% of household income 155
Average owner monthly major payments ($) 897
Owners with major payments >30% of household income 305
Regular maintenance only 1,745
Minor repairs 1,185
Major repairs 305
Labour Force Activity (15 years and over)
Participation rate (%) 72.0
Unemployment rate (%) 5.0
Mode of Transportation (employed labour force)
0
335
0
50
2,855
0 500 1,000 1,500 2,000 2,500 3,000
Movable dwelling
Apartment
Row house
Semi-detached house
Single-detached house
Number
Minor repairs37%
Major repairs9%
Regular maintenance
only54%
505
1,875
595
155
30
60
15
0 500 1,000 1,500 2,000
Before 1946
1946 to 1960
1961 to 1970
1971 to 1980
1981 to 1990
1991 to 2000
2001 to 2006
Number of Dwellings
Owned86%
Rented14%
5.0
72.0
69.7
72.6
11.9
3.4
75.5
60.9
78.9
68.8
79.2
67.2
2.8
15.611.9
2.1
5.0
18.8
0 10 20 30 40 50 60 70 80 90 100
15+
15-24
25+
15+
15-24
25+
Une
mpl
oym
ent r
ate
Par
ticip
atio
n ra
te
Percent (%)
Female
Male
Total
10
280
125
130
320
3,030
0 500 1,000 1,500 2,000 2,500 3,000 3,500
Other method
Walked
Bicycle
Public transit
Car, truck, van, aspassenger
Car, truck, van, ormotorcycle as driver
Number