Embed Size (px)
Citation preview
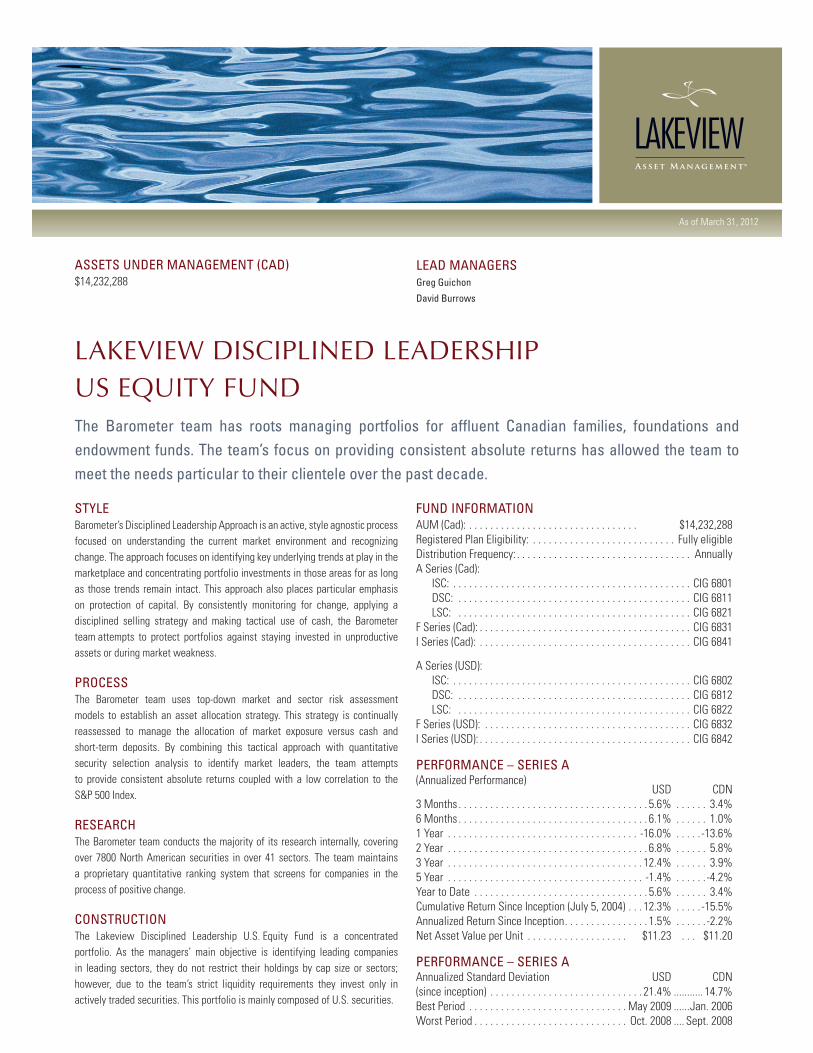
Lakeview DiscipLineD LeaDership us equity FunDThe Barometer team has roots managing portfolios for affluent Canadian families, foundations and endowment funds. The team’s focus on providing consistent absolute returns has allowed the team to meet the needs particular to their clientele over the past decade.
STyle Barometer’s Disciplined Leadership Approach is an active, style agnostic process focused on understanding the current market environment and recognizing change. The approach focuses on identifying key underlying trends at play in the marketplace and concentrating portfolio investments in those areas for as long as those trends remain intact. This approach also places particular emphasis on protection of capital. By consistently monitoring for change, applying a disciplined selling strategy and making tactical use of cash, the Barometer team attempts to protect portfolios against staying invested in unproductive assets or during market weakness.
ProCeSS The Barometer team uses top-down market and sector risk assessment models to establish an asset allocation strategy. This strategy is continually reassessed to manage the allocation of market exposure versus cash and short-term deposits. By combining this tactical approach with quantitative security selection analysis to identify market leaders, the team attempts to provide consistent absolute returns coupled with a low correlation to the S&P 500 Index.
reSearCh The Barometer team conducts the majority of its research internally, covering over 7800 North American securities in over 41 sectors. The team maintains a proprietary quantitative ranking system that screens for companies in the process of positive change.
ConSTruCTion The Lakeview Disciplined Leadership U.S. Equity Fund is a concentrated portfolio. As the managers’ main objective is identifying leading companies in leading sectors, they do not restrict their holdings by cap size or sectors; however, due to the team’s strict liquidity requirements they invest only in actively traded securities. This portfolio is mainly composed of U.S. securities.
Fund inFormaTionAUM (Cad): . . . . . . . . . . . . . . . . . . . . . . . . . . . . . . . . $14,232,288 Registered Plan Eligibility: . . . . . . . . . . . . . . . . . . . . . . . . . . . Fully eligibleDistribution Frequency: . . . . . . . . . . . . . . . . . . . . . . . . . . . . . . . . . AnnuallyA Series (Cad): ISC: . . . . . . . . . . . . . . . . . . . . . . . . . . . . . . . . . . . . . . . . . . . . . CIG 6801 DSC: . . . . . . . . . . . . . . . . . . . . . . . . . . . . . . . . . . . . . . . . . . . . CIG 6811 LSC: . . . . . . . . . . . . . . . . . . . . . . . . . . . . . . . . . . . . . . . . . . . . CIG 6821 F Series (Cad): . . . . . . . . . . . . . . . . . . . . . . . . . . . . . . . . . . . . . . . . CIG 6831I Series (Cad): . . . . . . . . . . . . . . . . . . . . . . . . . . . . . . . . . . . . . . . . CIG 6841
A Series (USD): ISC: . . . . . . . . . . . . . . . . . . . . . . . . . . . . . . . . . . . . . . . . . . . . . CIG 6802 DSC: . . . . . . . . . . . . . . . . . . . . . . . . . . . . . . . . . . . . . . . . . . . . CIG 6812 LSC: . . . . . . . . . . . . . . . . . . . . . . . . . . . . . . . . . . . . . . . . . . . . CIG 6822 F Series (USD): . . . . . . . . . . . . . . . . . . . . . . . . . . . . . . . . . . . . . . . CIG 6832I Series (USD): . . . . . . . . . . . . . . . . . . . . . . . . . . . . . . . . . . . . . . . . CIG 6842
PerFormanCe – SerieS a(Annualized Performance) USD CDN3 Months . . . . . . . . . . . . . . . . . . . . . . . . . . . . . . . . . . . . 5.6% . . . . . . 3.4%6 Months . . . . . . . . . . . . . . . . . . . . . . . . . . . . . . . . . . . . 6.1% . . . . . . 1.0%1 Year . . . . . . . . . . . . . . . . . . . . . . . . . . . . . . . . . . . . -16.0% . . . . . -13.6%2 Year . . . . . . . . . . . . . . . . . . . . . . . . . . . . . . . . . . . . . . 6.8% . . . . . . 5.8%3 Year . . . . . . . . . . . . . . . . . . . . . . . . . . . . . . . . . . . . . 12.4% . . . . . . 3.9%5 Year . . . . . . . . . . . . . . . . . . . . . . . . . . . . . . . . . . . . . -1.4% . . . . . . -4.2%Year to Date . . . . . . . . . . . . . . . . . . . . . . . . . . . . . . . . . 5.6% . . . . . . 3.4%Cumulative Return Since Inception (July 5, 2004) . . . 12.3% . . . . . -15.5%Annualized Return Since Inception . . . . . . . . . . . . . . . . 1.5% . . . . . . -2.2%Net Asset Value per Unit . . . . . . . . . . . . . . . . . . . $11.23 . . . $11.20
PerFormanCe – SerieS aAnnualized Standard Deviation USD CDN(since inception) . . . . . . . . . . . . . . . . . . . . . . . . . . . . . 21.4% ........... 14.7%Best Period . . . . . . . . . . . . . . . . . . . . . . . . . . . . . . May 2009 ......Jan. 2006Worst Period . . . . . . . . . . . . . . . . . . . . . . . . . . . . . Oct. 2008 .... Sept. 2008
aSSeTS under managemenT (Cad)$14,232,288
lead managerSgreg guichon
david Burrows
As of March 31, 2012

ToP 15 holdingS % of Net Assets
1. intel Corp 5.2% U.S. n Semiconductors2. Biogen idec inc 4.5% U.S. n Biomedics/Genetics3. microsoft Corp 4.4% U.S. n Software4. international Business machines Corp 4.3% U.S. n Computers5. Check Point Software Technologies 4.1% U.S. n Software6. Starbucks Corp 3.7% U.S. n Consumer7. Kraft Foods inc 3.7% U.S. n Foods & Beverages8. Pfizer inc 3.6% U.S. n Drugs9. merck & Co inc 3.5% U.S. n Drugs10. Teradata Corp 3.3% U.S. n Software11. Chipotle mexican grill inc 3.3% U.S. n Restaurants12. Wells Fargo & Company 3.2% U.S. n Financial13. Williams Companies inc 3.2% U.S. n Utilities & Pipeline14. duke realty Corp 3.2% U.S. n Real Estate15. abbott laboratories 3.2% U.S. n Drugs
greg guiChon, mBa, Cim –
Chairman, BaromeTer CaPiTal managemenT inC.Greg attended the University of Western Ontario, graduating with a Masters of Business Administration. Over a 20 year career in Private Client Management with Scotia McLeod, Greg assumed leadership positions of Director, Partner, and Vice-President, and was a frequent member of the Chairman’s Council. Greg co-founded the Disciplined Leadership Team™ in 2000. david BurroWS, BBa, Cim –
PreSidenT, BaromeTer CaPiTal managemenT inC. Co-founder of First Associates Investments Inc. in 1991, David graduated with a BBA in finance and marketing from Bishop’s University in 1986 and began his career with the Private Client Group at Scotia McLeod. In his role as Investment Strategist, David provides the Barometer team with top-down quantitative analysis on market and sector risk. David also sits on the firm’s investment policy committee and is a frequent guest as a market commentator on CTV, CBC and ROB-TV as well as in print through the National Post newspaper.
Software 13.8%
Utilities & Pipeline 11.3%
Drugs 10.2%
Computers 7.3%
Consumer 6.8%Internet 5.8%
Foods & Beverages 5.7%
Financial 5.6%
Semiconductors 5.2%
Auto & Parts 4.8%
Biomedics/Genetics 4.5%
Restaurants 3.3%
Cash 3.2%
Real Estate 3.2%Aerospace Airline 3.1%
Media 2.6%Building 2.1%
REITs 1.4%Energy 0.1%
Lakeview Disciplined LeadershipU.S. Equity FundSeries A (USD)
S&P 500Composite Total
Return Index (USD)
20
15
10
5
0
-5
-10
-15
-20
5.6%
12.6%
Commissions, trailing commissions, management fees and expenses all may be associated with mutual fund investments. Please read the prospectus before investing. The indicated rates of return are the historical compounded total returns including changes in unit value and reinvestment of all distributions and do not take into account sales, redemption, distribution or optional charges or income taxes payable by any securityholder that would have reduced returns. Mutual funds are not guaranteed, their values change frequently and past performance may not be repeated.
LAkEVIEW DISCIPLINED LEADERShIP US EqUITY FUND
SeCTor alloCaTion – inCluding CaSh
year To daTe reTurn vS. BenChmarK
$800,000
$1,000,000
$1,200,000
$1,400,000
$1,600,000
Lakeview Disciplined Leadership U.S. Equity Fund Series A (USD)
Benchmark (USD)
$1,123,000
$1,467,506
Dec-04
Jun-0
5
Dec-05
Jun-0
6
Dec-06
Jun-0
7
Dec-07
Jun-0
8
Dec-08
Jun-0
9
Dec-09
Jun-1
0
Dec-10
Dec-11
Jun-1
1
Mar-12
groWTh oF $1,000,000 SinCe inCePTion
LV_DL_US Equity 04/12
Calendar year PerFormanCe (uSd)
-50
-40
-30
-20
-10
0
10
20
30
40
50
2005 2006 2007 2008 2009 2010
7.7% 0.5% 23.2% -42.9% 17.6% 26.0% -16.3%
2011