Embed Size (px)
Citation preview

LAKESIDE GRILL REPORT
Prepared by
Alexa Gaudin
Destiny Johnson
Brooke Redding
Zach Zambrano
Juan Nolasco
Sample Characteristics
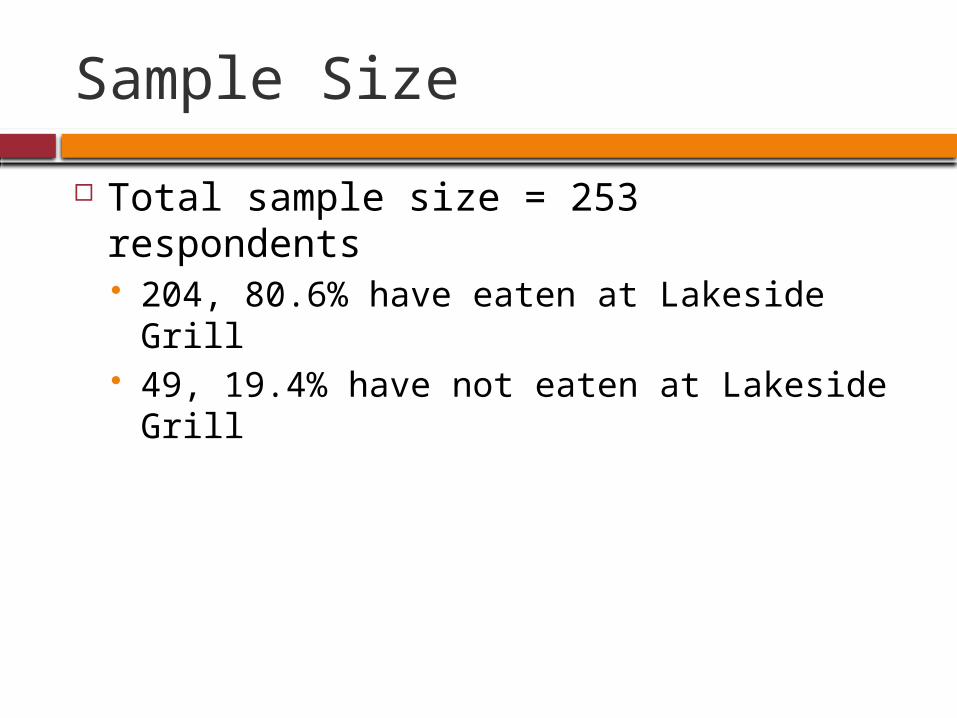
Sample Size
Total sample size = 253 respondents 204, 80.6% have eaten at Lakeside Grill 49, 19.4% have not eaten at Lakeside Grill
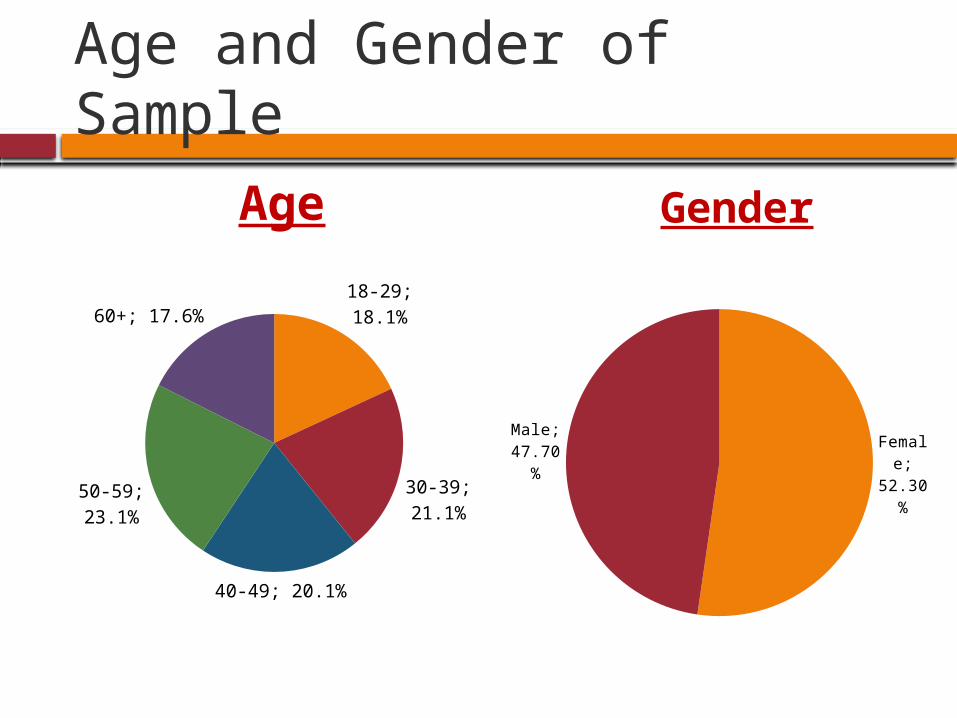
Age and Gender of Sample
18-29; 18.1%
30-39; 21.1%
40-49; 20.1%
50-59; 23.1%
60+; 17.6%
Female; 52.30%
Male; 47.70%
Age Gender

Household Income of Sample
Less than $25,000; 15.6%
$25,000-49,999; 21.6%
$50,000-74,999; 22.6%
$75,000-99,999; 24.1%
$100,000 or more; 16.1%
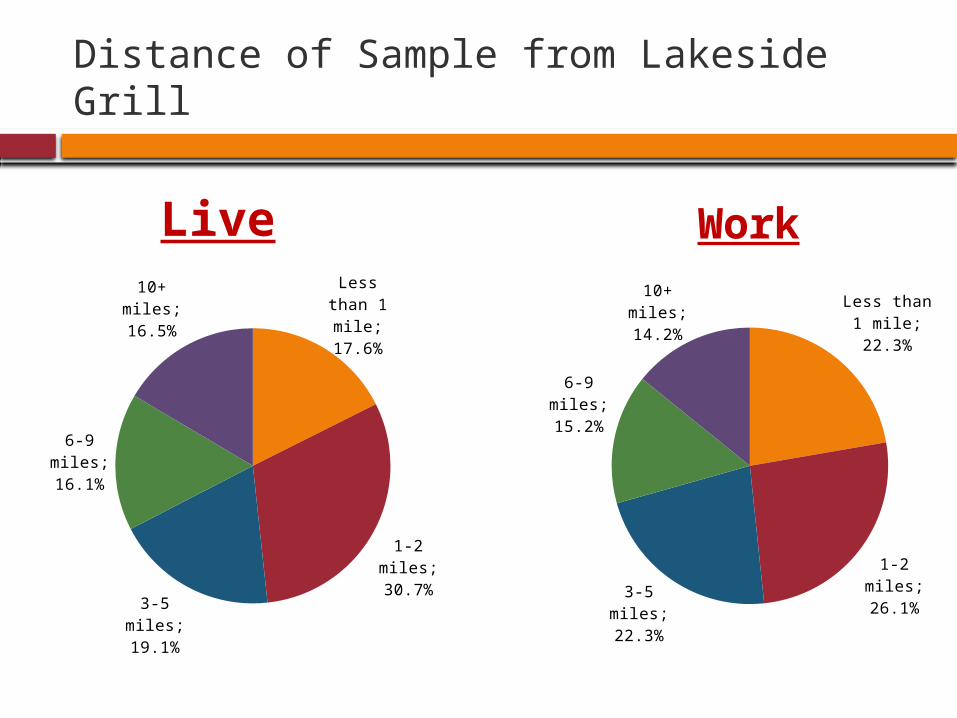
Distance of Sample from Lakeside Grill
Live WorkLess
than 1 mile;
17.6%
1-2 miles; 30.7%
3-5 miles; 19.1%
6-9 miles; 16.1%
10+ miles; 16.5%
Less than 1 mile; 22.3%
1-2 miles; 26.1%
3-5 miles; 22.3%
6-9 miles; 15.2%
10+ miles; 14.2%
New Variables
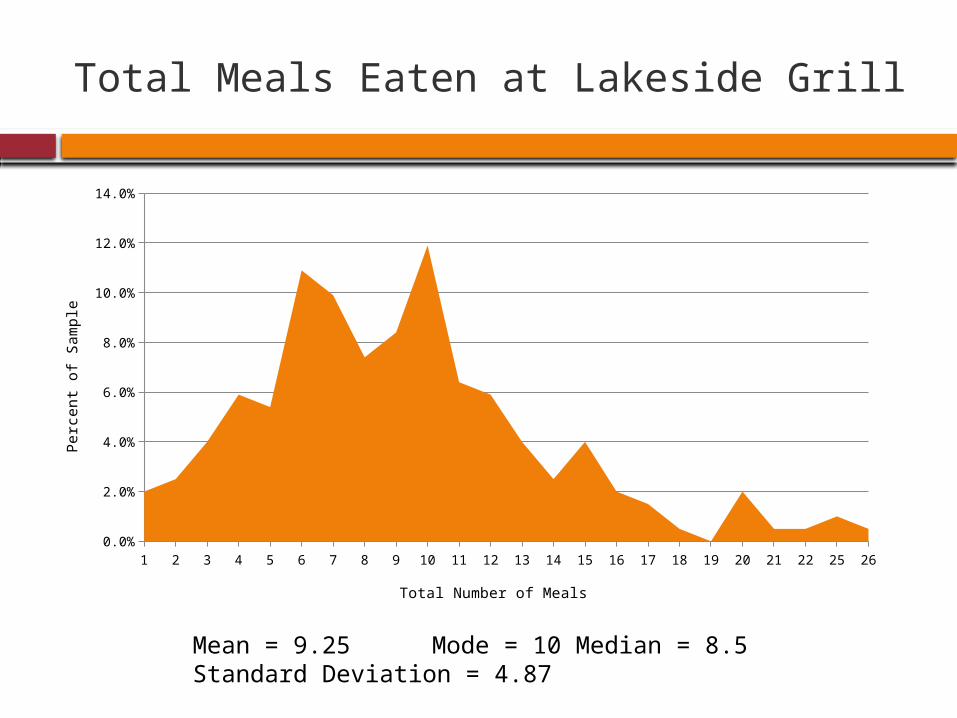
Total Meals Eaten at Lakeside Grill
1 2 3 4 5 6 7 8 9 10 11 12 13 14 15 16 17 18 19 20 21 22 25 260.0%
2.0%
4.0%
6.0%
8.0%
10.0%
12.0%
14.0%
Total Number of Meals
Perc
en
t of
Sam
ple
Mean = 9.25 Mode = 10 Median = 8.5Standard Deviation = 4.87
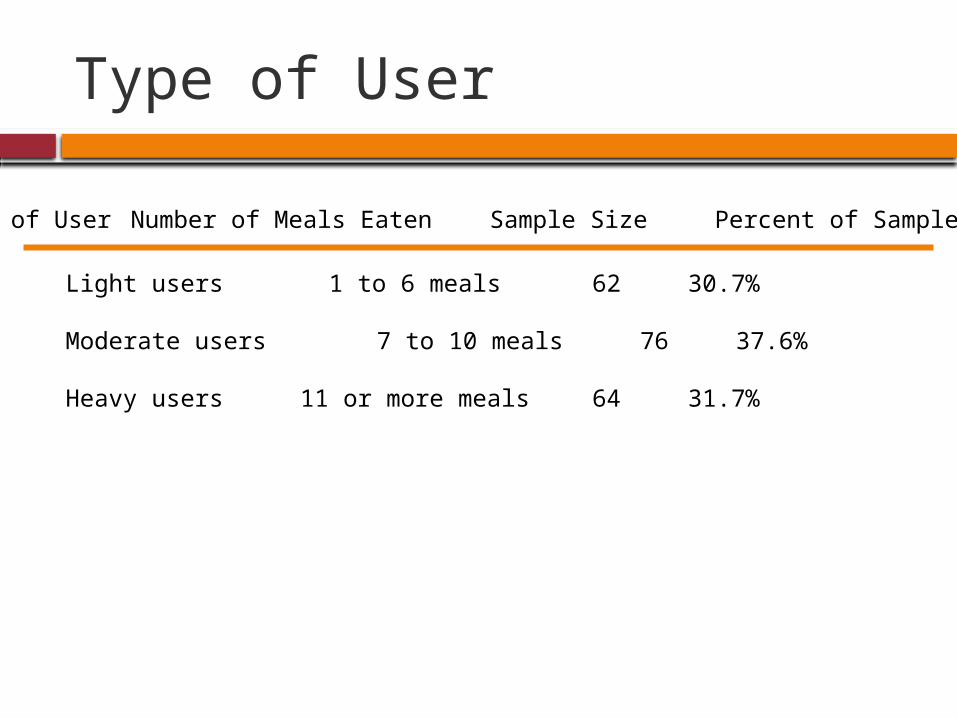
Type of User
Type of User Number of Meals Eaten Sample Size Percent of Sample
Light users 1 to 6 meals 62 30.7%
Moderate users 7 to 10 meals 76 37.6%
Heavy users 11 or more meals 64 31.7%

Type of Diner
Type of User Values for Group Sample Size Percent of Sample
Evening diner -18 to -2 64 31.7%
Both meals -1 to +1 77 38.1%
Lunch diner +2 to 25 61 30.2%
To determine the type of diner each person was a value was calculated for Number of Noon Meals – Number of Evening Meals
What is the current level of customer satisfaction and patronage with the various aspects of Lakeside Grill.
Research Objective One
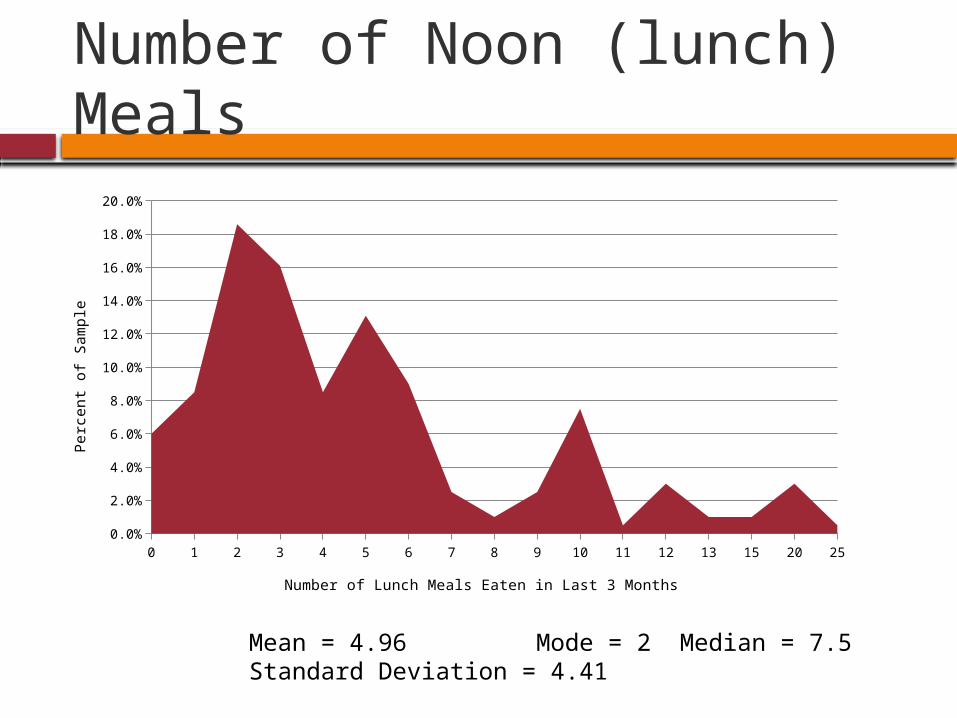
Number of Noon (lunch) Meals
0 1 2 3 4 5 6 7 8 9 10 11 12 13 15 20 250.0%
2.0%
4.0%
6.0%
8.0%
10.0%
12.0%
14.0%
16.0%
18.0%
20.0%
Number of Lunch Meals Eaten in Last 3 Months
Perc
en
t of
Sam
ple
Mean = 4.96 Mode = 2 Median = 7.5Standard Deviation = 4.41
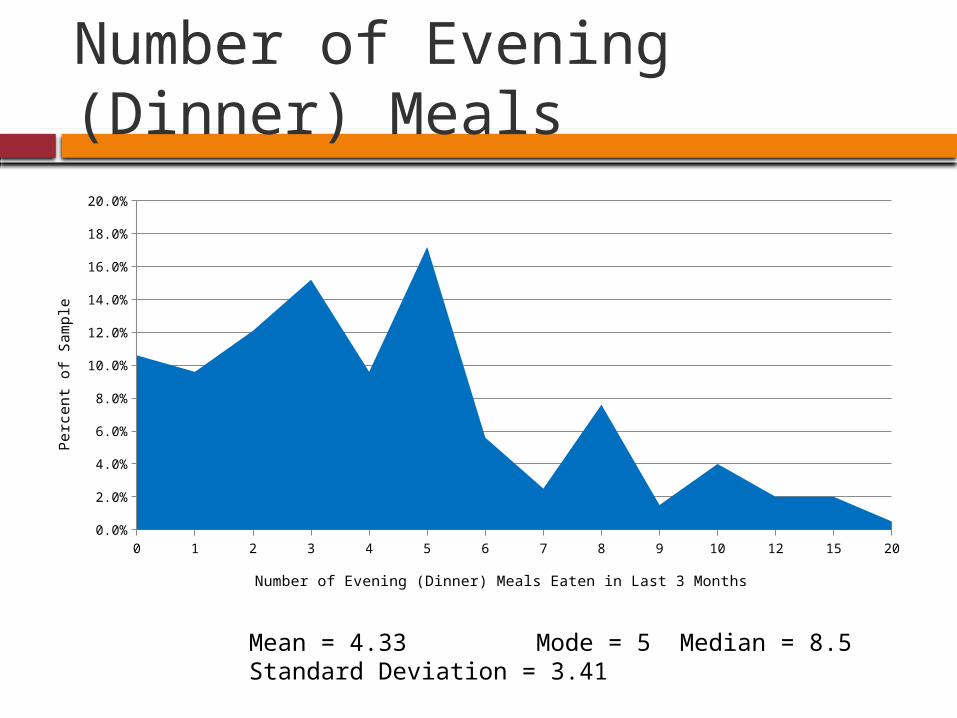
Number of Evening (Dinner) Meals
Mean = 4.33 Mode = 5 Median = 8.5Standard Deviation = 3.41
0 1 2 3 4 5 6 7 8 9 10 12 15 200.0%
2.0%
4.0%
6.0%
8.0%
10.0%
12.0%
14.0%
16.0%
18.0%
20.0%
Number of Evening (Dinner) Meals Eaten in Last 3 Months
Perc
en
t of
Sam
ple
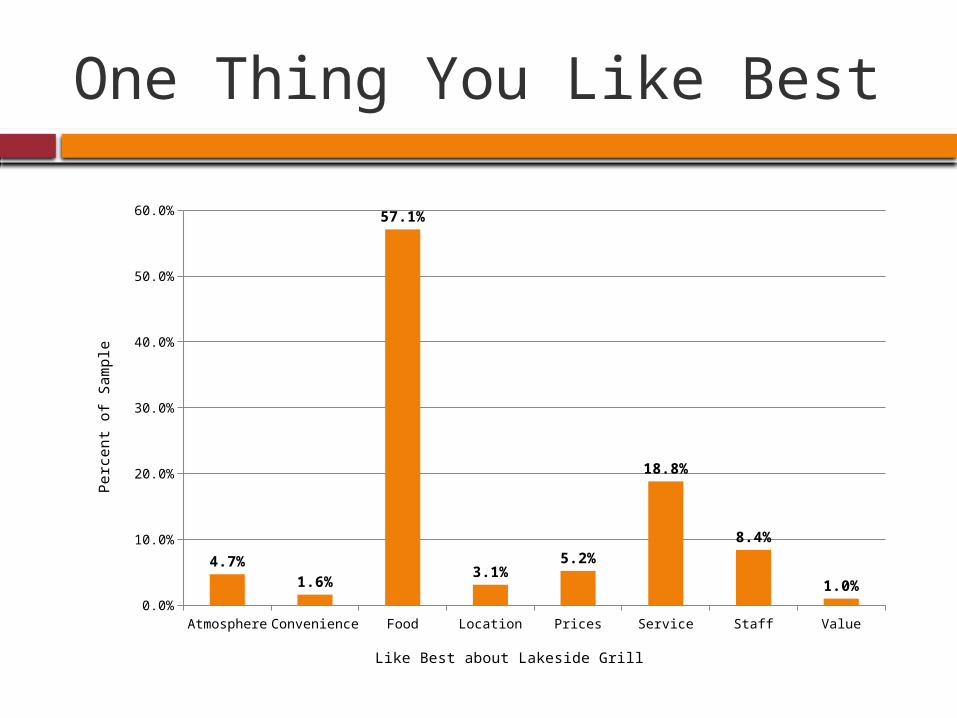
One Thing You Like Best
Atmosphere Convenience Food Location Prices Service Staff Value0.0%
10.0%
20.0%
30.0%
40.0%
50.0%
60.0%
4.7%1.6%
57.1%
3.1%5.2%
18.8%
8.4%
1.0%
Like Best about Lakeside Grill
Perc
en
t of
Sam
ple
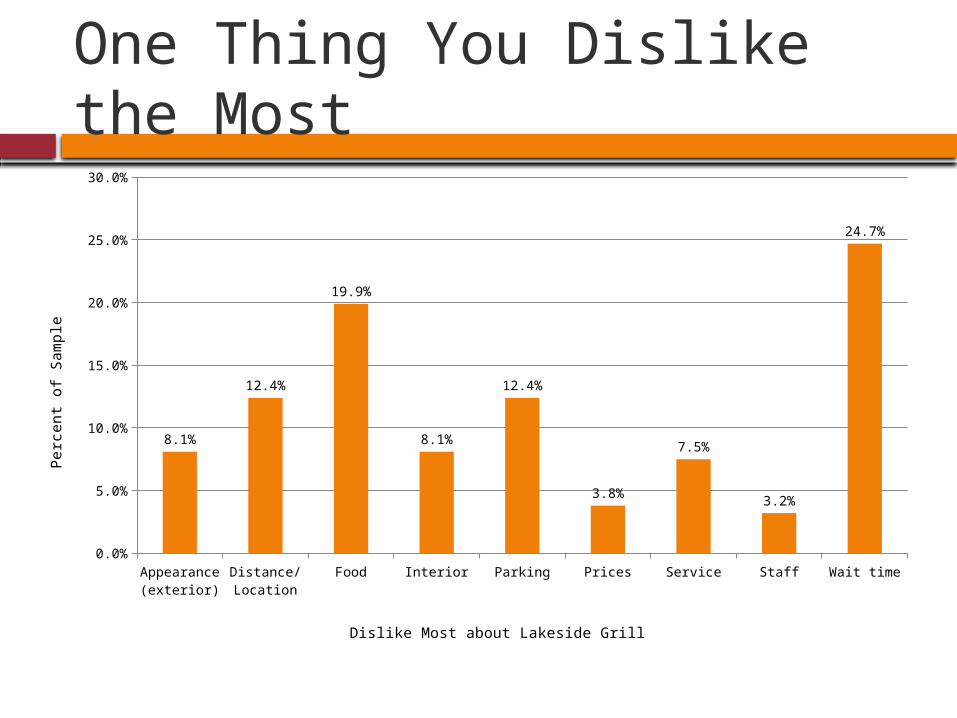
One Thing You Dislike the Most
Appearance (exterior)
Distance/Location
Food Interior Parking Prices Service Staff Wait time0.0%
5.0%
10.0%
15.0%
20.0%
25.0%
30.0%
8.1%
12.4%
19.9%
8.1%
12.4%
3.8%
7.5%
3.2%
24.7%
Dislike Most about Lakeside Grill
Perc
en
t of
Sam
ple
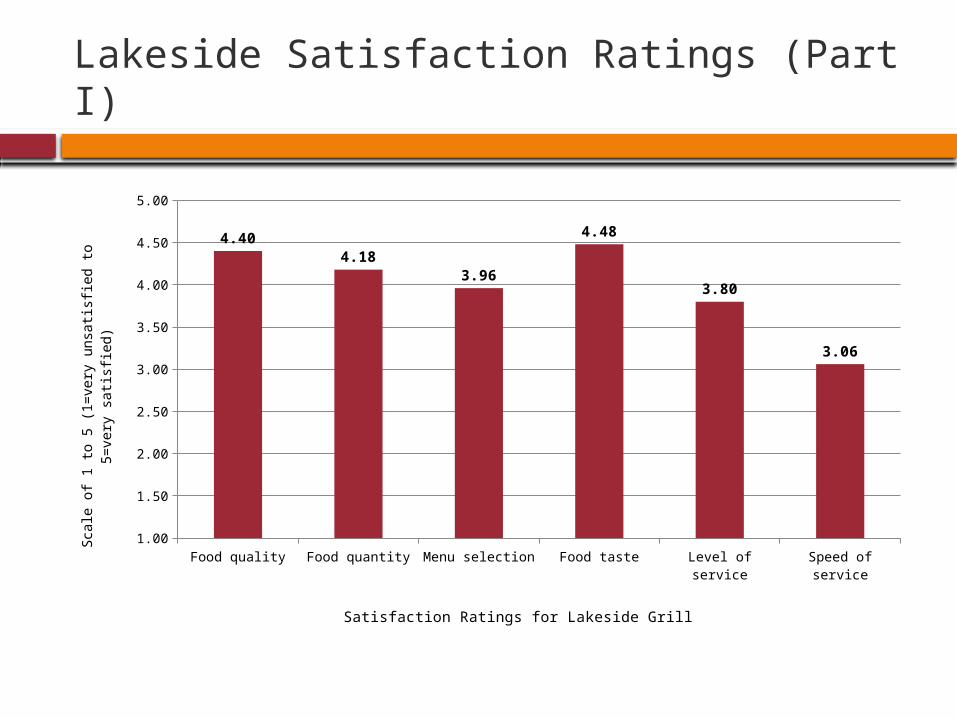
Lakeside Satisfaction Ratings (Part I)
Food quality Food quantity Menu selection Food taste Level of service Speed of service1.00
1.50
2.00
2.50
3.00
3.50
4.00
4.50
5.00
4.404.18
3.96
4.48
3.80
3.06
Satisfaction Ratings for Lakeside Grill
Sca
le o
f 1
to
5 (
1=
very
un
sati
sfie
d t
o 5
=ve
ry s
ati
s-fi
ed
)
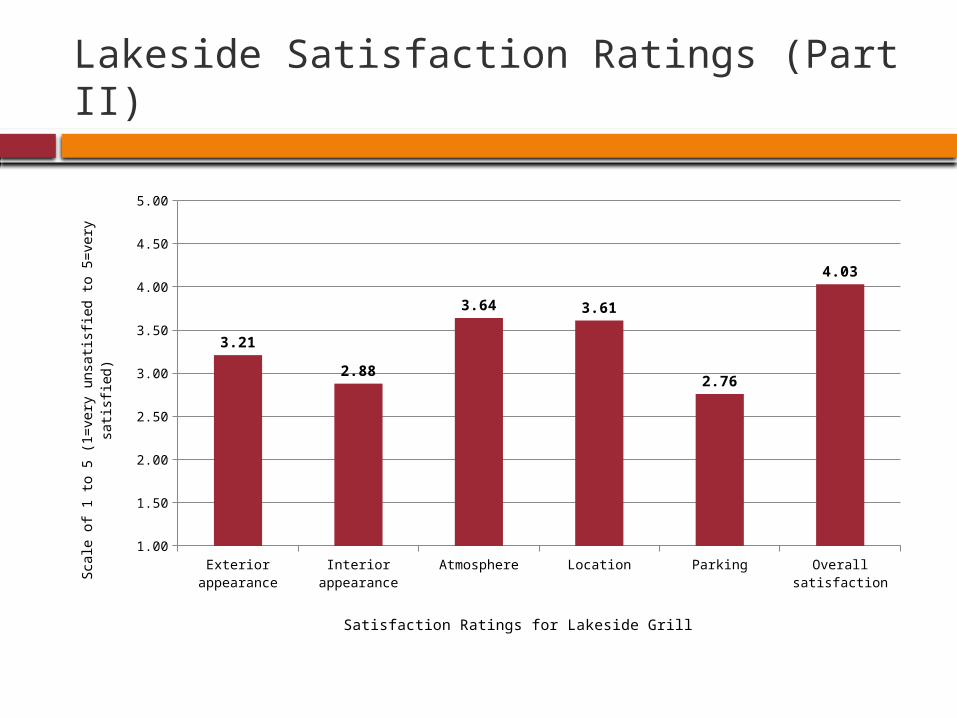
Lakeside Satisfaction Ratings (Part II)
Exte
rior a
ppea
ranc
e
Inte
rior a
ppea
ranc
e
Atmos
pher
e
Loca
tion
Park
ing
Overa
ll sa
tisfa
ctio
n1.00
1.50
2.00
2.50
3.00
3.50
4.00
4.50
5.00
3.21
2.88
3.64 3.61
2.76
4.03
Satisfaction Ratings for Lakeside Grill
Sca
le o
f 1
to
5 (
1=
very
un
sati
sfie
d t
o 5
=ve
ry s
ati
s-fi
ed
)
Satisfaction Ratings by Type of Diner
Location more important for noon diners (4.26) than evening diners (3.61)
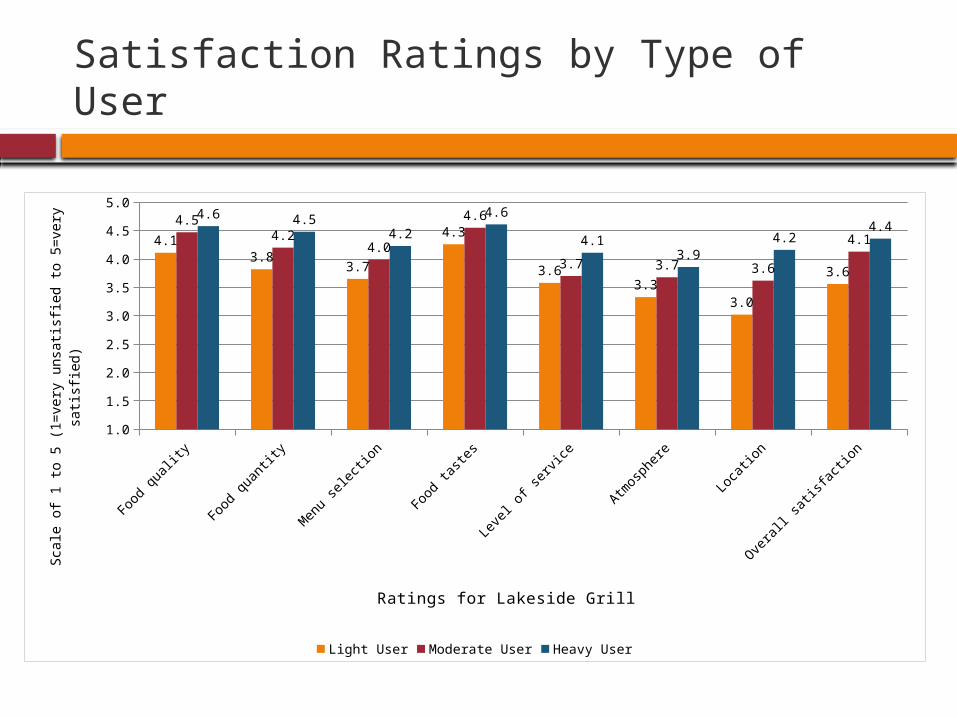
Satisfaction Ratings by Type of User
Food quality Food quantity Menu selection Food tastes Level of service Atmosphere Location Overall satisfaction1.0
1.5
2.0
2.5
3.0
3.5
4.0
4.5
5.0
4.1
3.83.7
4.3
3.6
3.3
3.0
3.6
4.5
4.24.0
4.6
3.7 3.7 3.6
4.1
4.64.5
4.2
4.6
4.1
3.9
4.24.4
Light User Moderate User Heavy User
Ratings for Lakeside Grill
Sca
le o
f 1
to
5 (
1=
very
un
sati
sfie
d t
o 5
=ve
ry s
ati
s-fi
ed
)
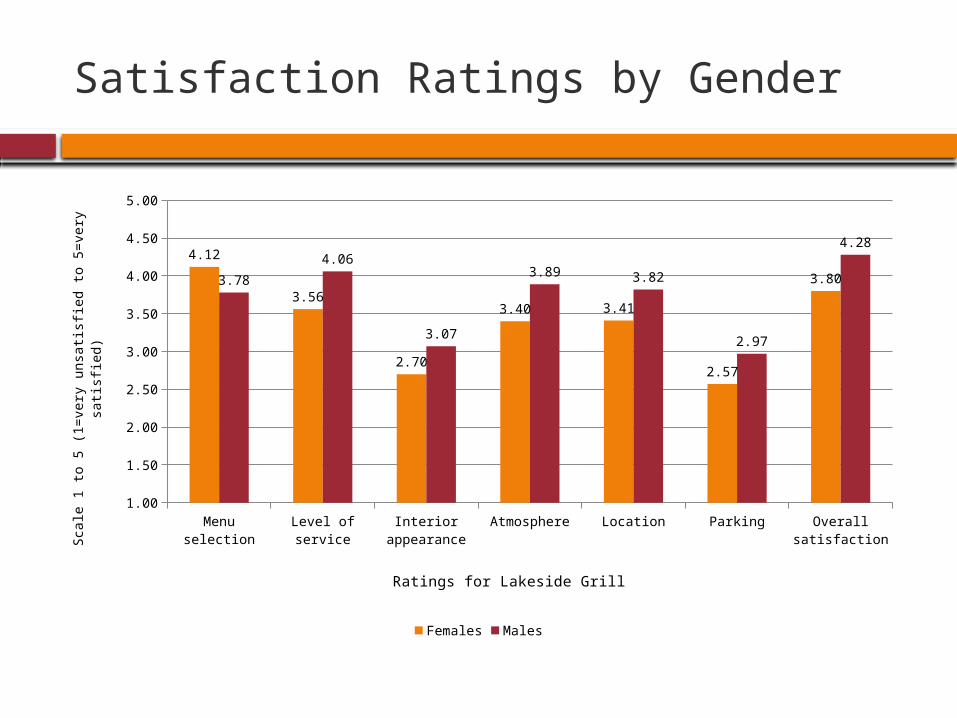
Satisfaction Ratings by Gender
Menu
sele
ctio
n
Leve
l of s
ervi
ce
Inte
rior a
ppea
ranc
e
Atmos
pher
e
Loca
tion
Park
ing
Overa
ll sa
tisfa
ctio
n1.00
1.50
2.00
2.50
3.00
3.50
4.00
4.50
5.00
4.12
3.56
2.70
3.40 3.41
2.57
3.803.784.06
3.07
3.89 3.82
2.97
4.28
Females Males
Ratings for Lakeside Grill
Sca
le 1
to 5
(1=
very
unsa
tisfi
ed t
o 5
=very
sati
sfied)
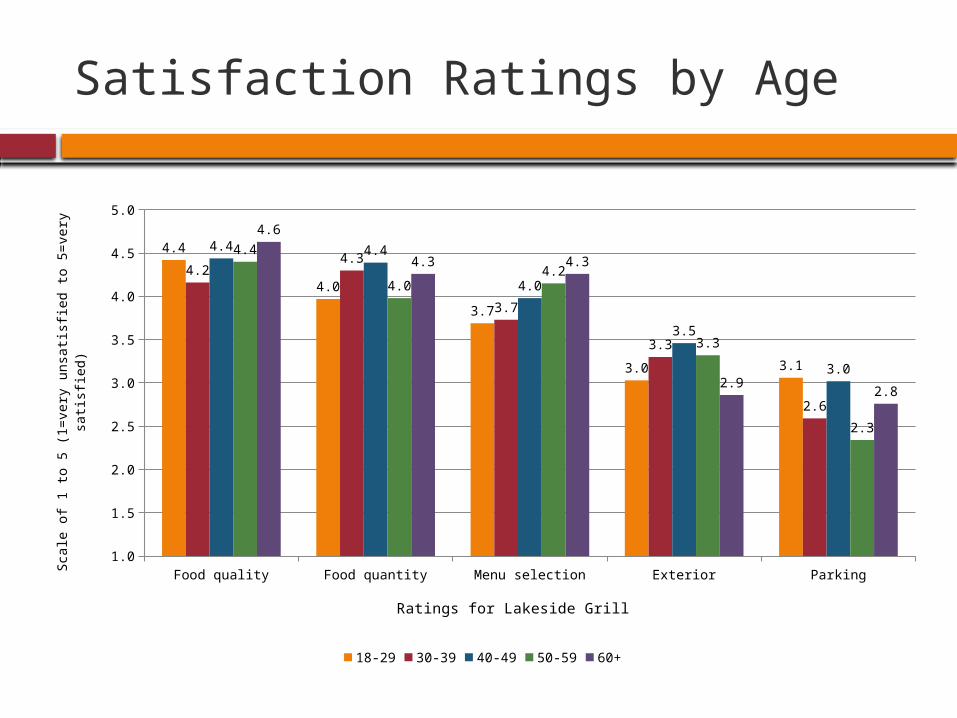
Satisfaction Ratings by Age
Food quality Food quantity Menu selection Exterior Parking1.0
1.5
2.0
2.5
3.0
3.5
4.0
4.5
5.0
4.4
4.0
3.7
3.0 3.1
4.24.3
3.7
3.3
2.6
4.4 4.4
4.0
3.5
3.0
4.4
4.04.2
3.3
2.3
4.6
4.3 4.3
2.92.8
18-29 30-39 40-49 50-59 60+
Ratings for Lakeside Grill
Sca
le o
f 1 t
o 5
(1=
very
unsa
tisfi
ed t
o 5
=very
sati
sfied)
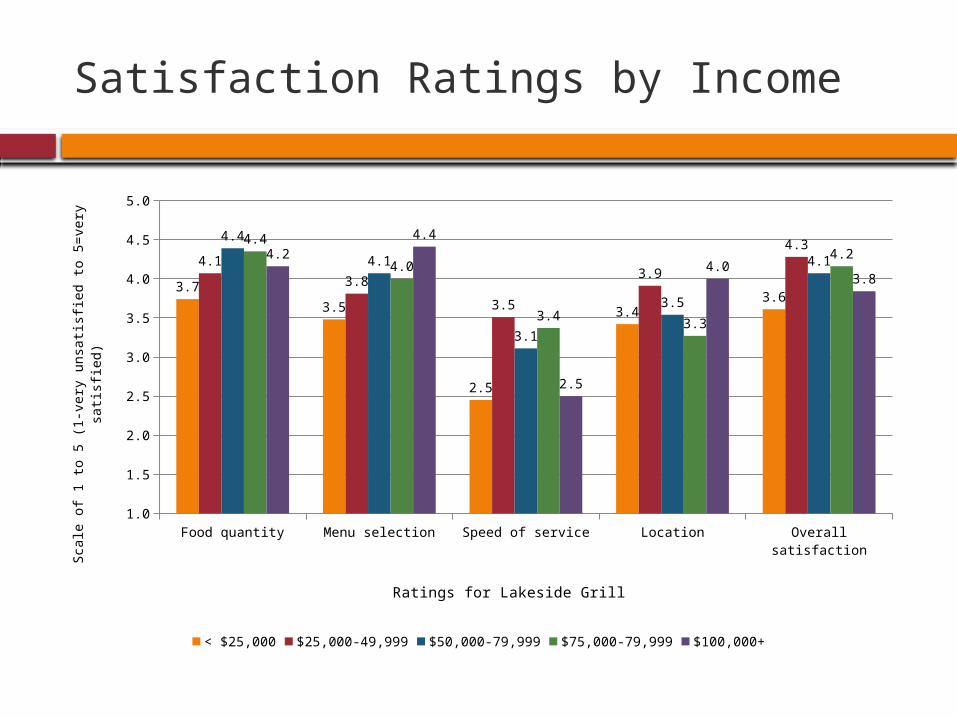
Satisfaction Ratings by Income
Food quantity Menu selection Speed of service Location Overall satisfaction1.0
1.5
2.0
2.5
3.0
3.5
4.0
4.5
5.0
3.7
3.5
2.5
3.43.6
4.1
3.8
3.5
3.9
4.34.4
4.1
3.1
3.5
4.1
4.4
4.0
3.43.3
4.24.2
4.4
2.5
4.03.8
< $25,000 $25,000-49,999 $50,000-79,999 $75,000-79,999 $100,000+
Ratings for Lakeside Grill
Sca
le o
f 1 t
o 5
(1-v
ery
unsa
tisfi
ed t
o 5
=very
sati
sfied)
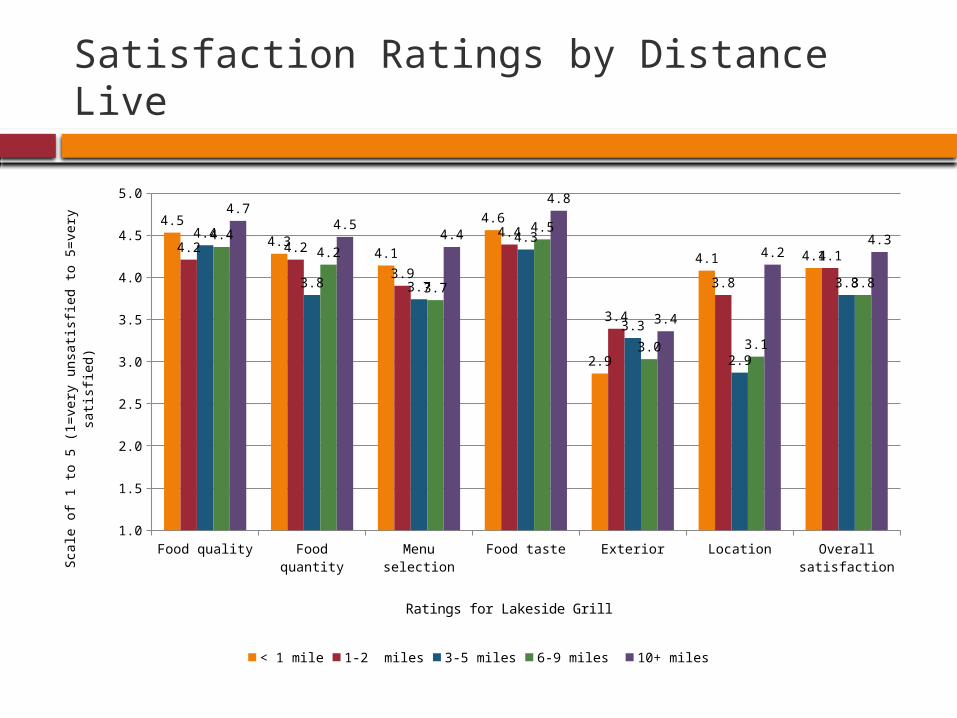
Satisfaction Ratings by Distance Live
Food quality Food quantity Menu selection Food taste Exterior Location Overall satisfaction1.0
1.5
2.0
2.5
3.0
3.5
4.0
4.5
5.0
4.5
4.34.1
4.6
2.9
4.1 4.14.2 4.2
3.9
4.4
3.4
3.8
4.1
4.4
3.8 3.7
4.3
3.3
2.9
3.8
4.44.2
3.7
4.5
3.0 3.1
3.8
4.74.5
4.4
4.8
3.4
4.24.3
< 1 mile 1-2 miles 3-5 miles 6-9 miles 10+ miles
Ratings for Lakeside Grill
Sca
le o
f 1 t
o 5
(1=
very
unsa
tisfi
ed t
o 5
=very
sati
sfied)
Conclusions
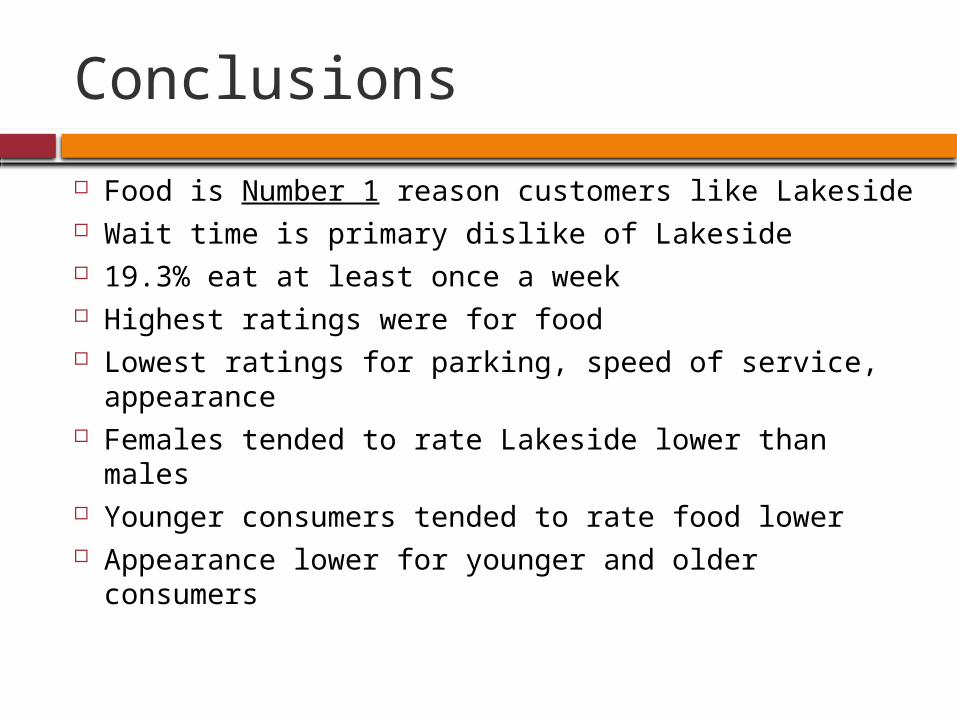
Food is Number 1 reason customers like Lakeside Wait time is primary dislike of Lakeside 19.3% eat at least once a week Highest ratings were for food Lowest ratings for parking, speed of service,
appearance Females tended to rate Lakeside lower than males Younger consumers tended to rate food lower Appearance lower for younger and older
consumers
Why Have Individuals Not Patronized the Lakeside Grill?
Research Objective Two
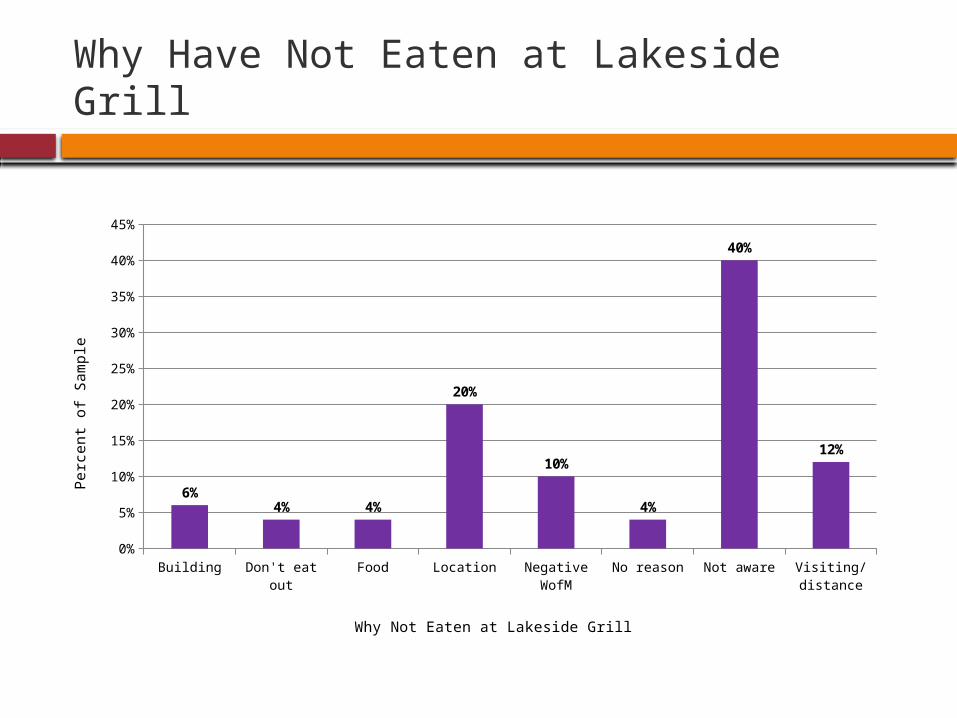
Why Have Not Eaten at Lakeside Grill
Building Don't eat out Food Location Negative WofM No reason Not aware Visiting/distance0%
5%
10%
15%
20%
25%
30%
35%
40%
45%
6%4% 4%
20%
10%
4%
40%
12%
Why Not Eaten at Lakeside Grill
Perc
en
t of
Sam
ple
Conclusions
Awareness Number 1 reason for not eating at Lakeside
How Has the Addition of a New Competitor Down the Street Impacted the Lakeside Grill’s Customer Base?
Research Objective Three
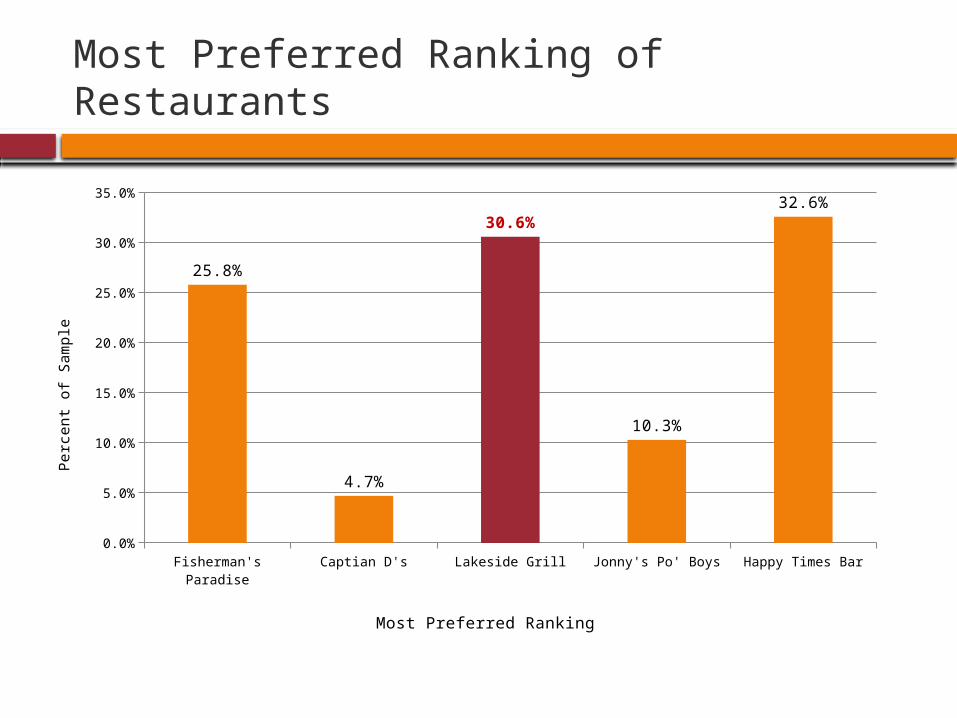
Most Preferred Ranking of Restaurants
Fisherman's Paradise Captian D's Lakeside Grill Jonny's Po' Boys Happy Times Bar0.0%
5.0%
10.0%
15.0%
20.0%
25.0%
30.0%
35.0%
25.8%
4.7%
30.6%
10.3%
32.6%
Most Preferred Ranking
Perc
en
t of
Sam
ple
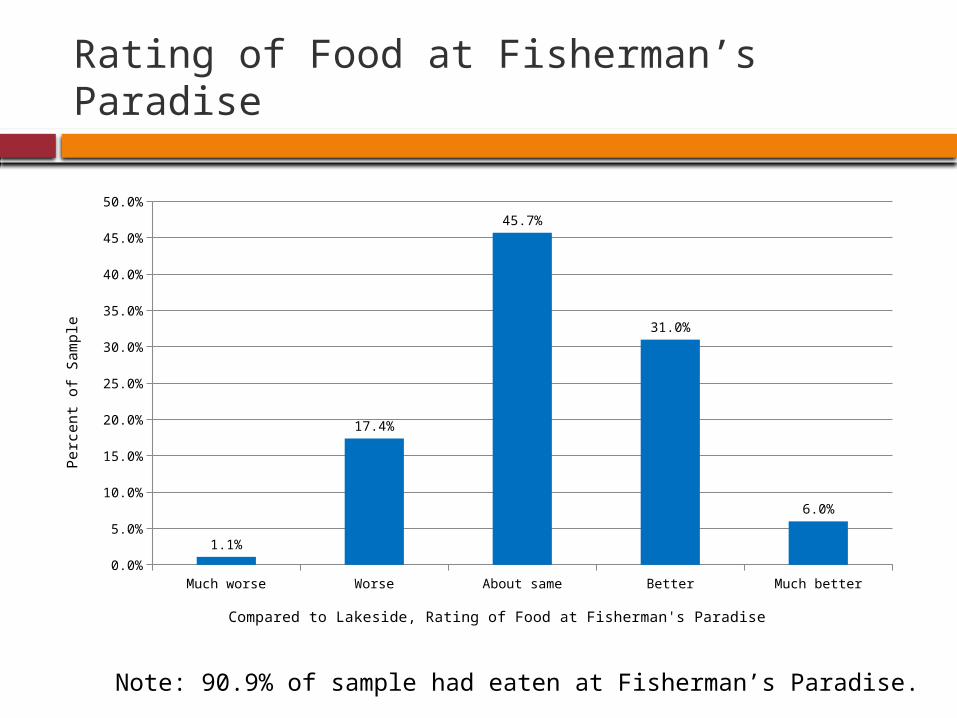
Rating of Food at Fisherman’s Paradise
Much worse Worse About same Better Much better0.0%
5.0%
10.0%
15.0%
20.0%
25.0%
30.0%
35.0%
40.0%
45.0%
50.0%
1.1%
17.4%
45.7%
31.0%
6.0%
Compared to Lakeside, Rating of Food at Fisherman's Paradise
Perc
en
t of
Sam
ple
Note: 90.9% of sample had eaten at Fisherman’s Paradise.
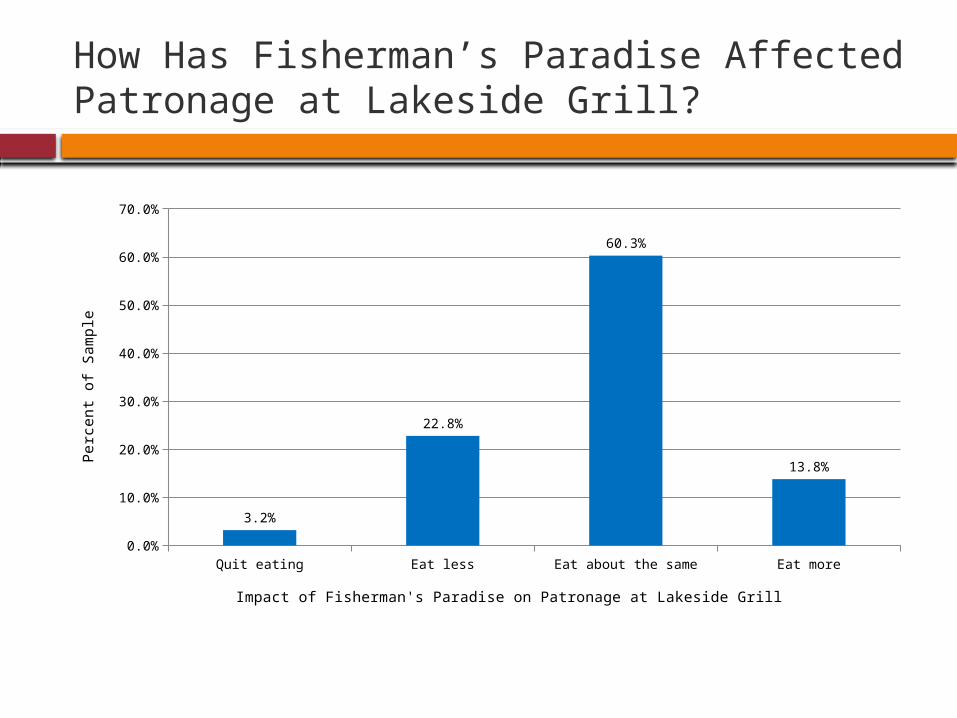
How Has Fisherman’s Paradise Affected Patronage at Lakeside Grill?
Quit eating Eat less Eat about the same Eat more0.0%
10.0%
20.0%
30.0%
40.0%
50.0%
60.0%
70.0%
3.2%
22.8%
60.3%
13.8%
Impact of Fisherman's Paradise on Patronage at Lakeside Grill
Perc
en
t of
Sam
ple
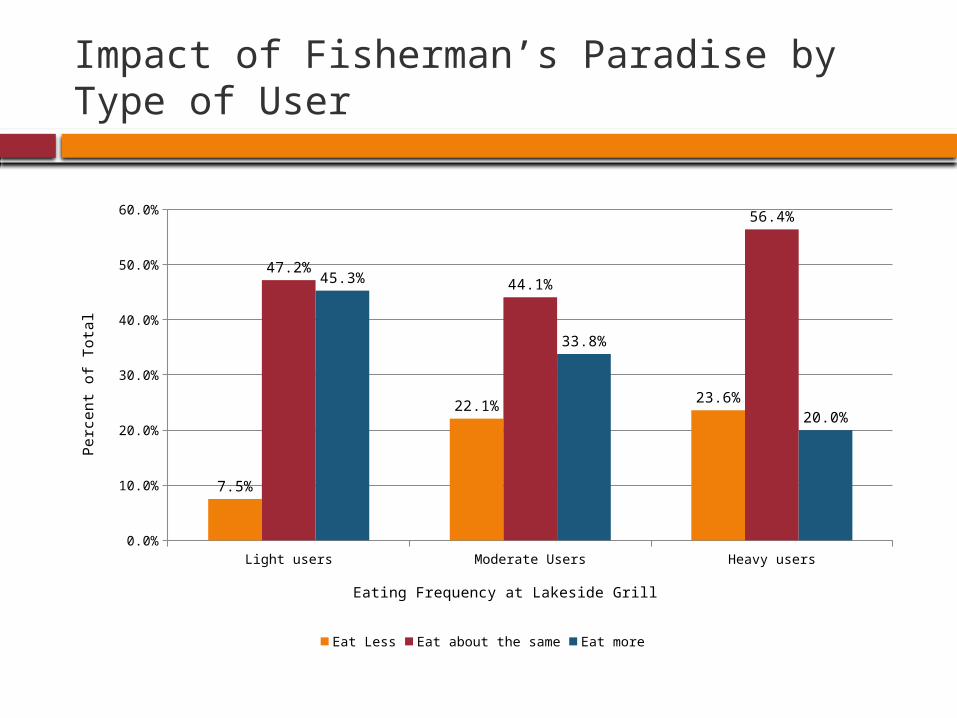
Impact of Fisherman’s Paradise by Type of User
Light users Moderate Users Heavy users0.0%
10.0%
20.0%
30.0%
40.0%
50.0%
60.0%
7.5%
22.1%23.6%
47.2%44.1%
56.4%
45.3%
33.8%
20.0%
Eat Less Eat about the same Eat more
Eating Frequency at Lakeside Grill
Perc
en
t of
Tota
l
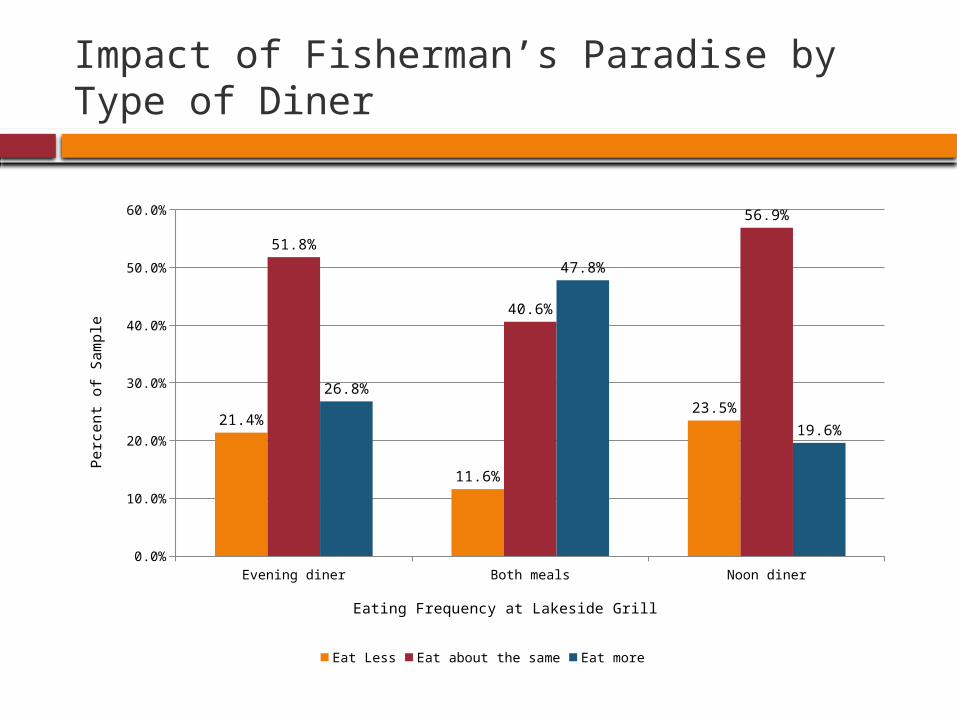
Impact of Fisherman’s Paradise by Type of Diner
Evening diner Both meals Noon diner0.0%
10.0%
20.0%
30.0%
40.0%
50.0%
60.0%
21.4%
11.6%
23.5%
51.8%
40.6%
56.9%
26.8%
47.8%
19.6%
Eat Less Eat about the same Eat more
Eating Frequency at Lakeside Grill
Perc
en
t of
Sam
ple
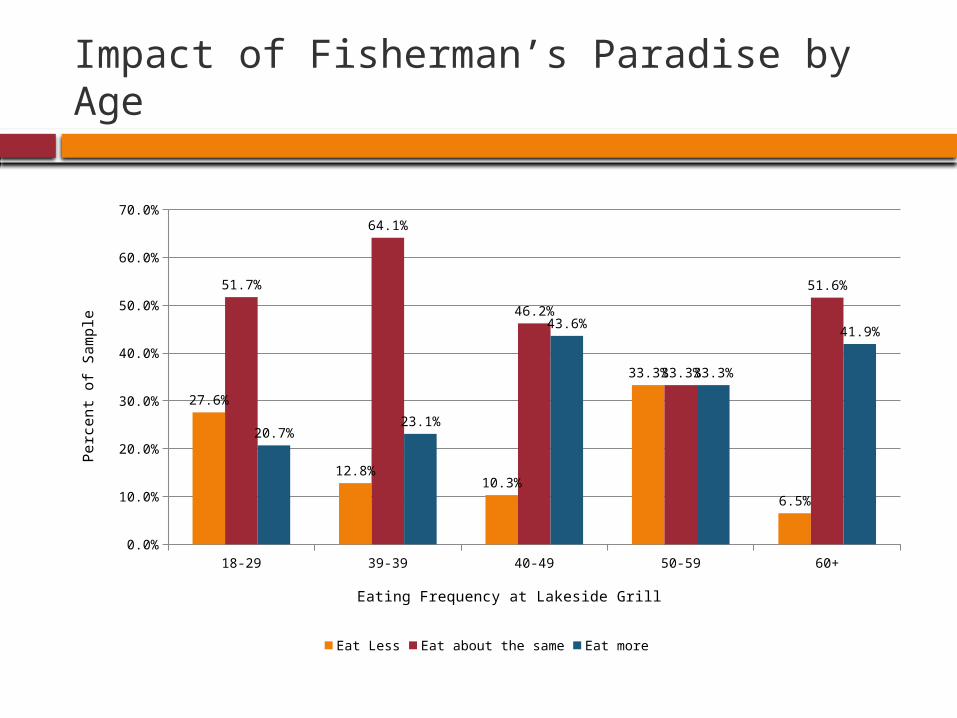
Impact of Fisherman’s Paradise by Age
18-29 39-39 40-49 50-59 60+0.0%
10.0%
20.0%
30.0%
40.0%
50.0%
60.0%
70.0%
27.6%
12.8%10.3%
33.3%
6.5%
51.7%
64.1%
46.2%
33.3%
51.6%
20.7%23.1%
43.6%
33.3%
41.9%
Eat Less Eat about the same Eat more
Eating Frequency at Lakeside Grill
Perc
en
t of
Sam
ple
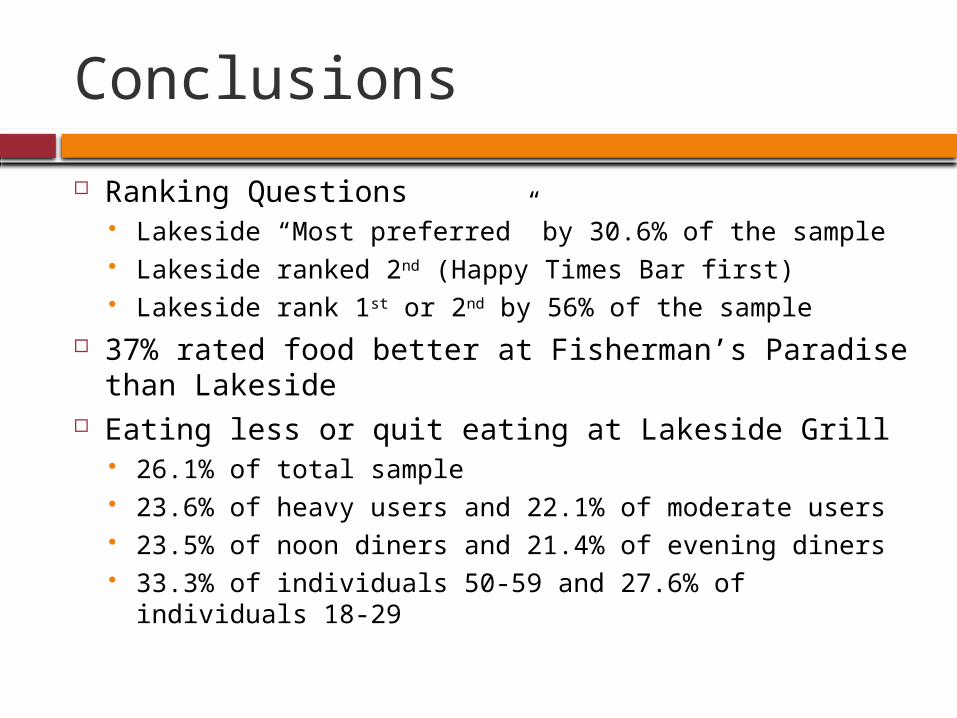
Conclusions
Ranking Questions Lakeside “Most preferred” by 30.6% of the sample Lakeside ranked 2nd (Happy Times Bar first) Lakeside rank 1st or 2nd by 56% of the sample
37% rated food better at Fisherman’s Paradise than Lakeside
Eating less or quit eating at Lakeside Grill 26.1% of total sample 23.6% of heavy users and 22.1% of moderate users 23.5% of noon diners and 21.4% of evening diners 33.3% of individuals 50-59 and 27.6% of individuals 18-
29

Would changing Lakeside Grill’s menu or amenities increase sales?
Research Objective Four (A)

Importance of New Items to Patronage
Mini-desert Bread Half-portions Healthier foods
Kid's menu Entertainment Lunch menu1.00
1.50
2.00
2.50
3.00
3.50
4.00
4.50
5.00
3.04
4.02
3.09
3.86
2.22
2.73
3.70
Importance of New Items in Patronage Decision
Sca
le o
f 1
to
5 (
1=
no
t ve
ry im
po
rta
nt
to 5
=ve
ry
imp
ort
an
t)
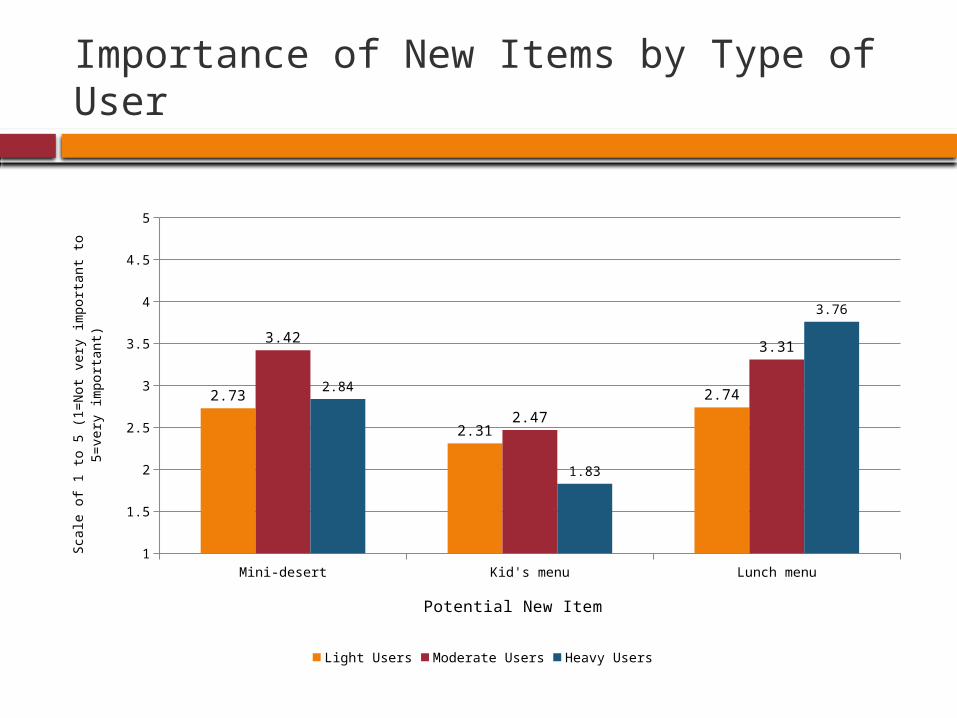
Importance of New Items by Type of User
Mini-desert Kid's menu Lunch menu1
1.5
2
2.5
3
3.5
4
4.5
5
2.73
2.31
2.74
3.42
2.47
3.31
2.84
1.83
3.76
Light Users Moderate Users Heavy Users
Potential New Item
Sca
le o
f 1 t
o 5
(1=
Not
very
im
port
ant
to 5
=very
im
por-
tant)
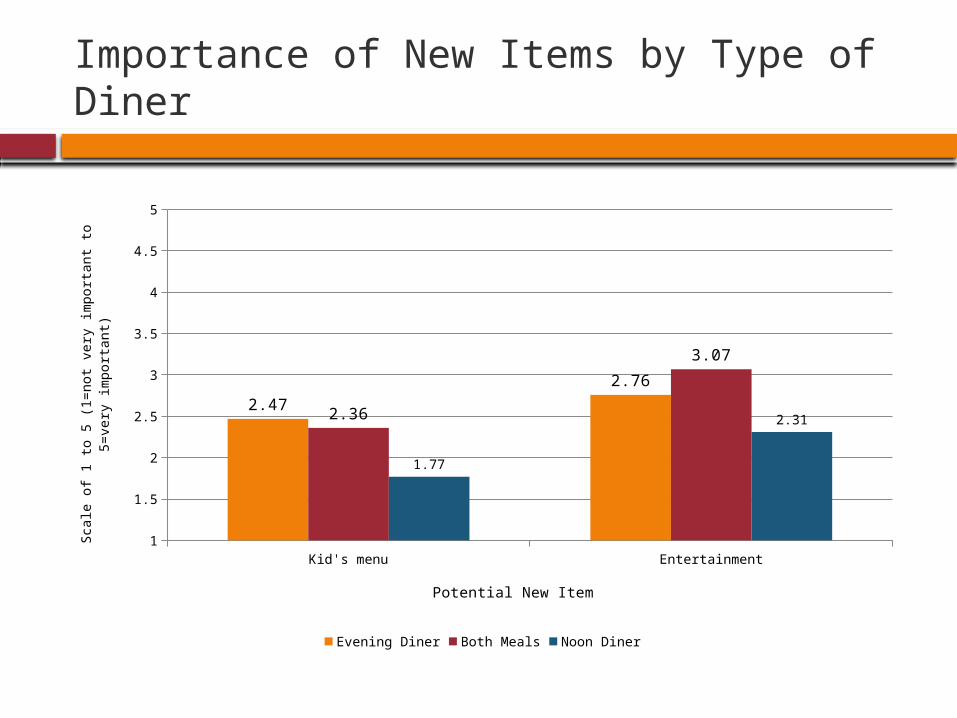
Importance of New Items by Type of Diner
Kid's menu Entertainment1
1.5
2
2.5
3
3.5
4
4.5
5
2.47
2.76
2.36
3.07
1.77
2.31
Evening Diner Both Meals Noon Diner
Potential New Item
Sca
le o
f 1 t
o 5
(1=
not
very
im
port
ant
to 5
=very
im
por-
tant)
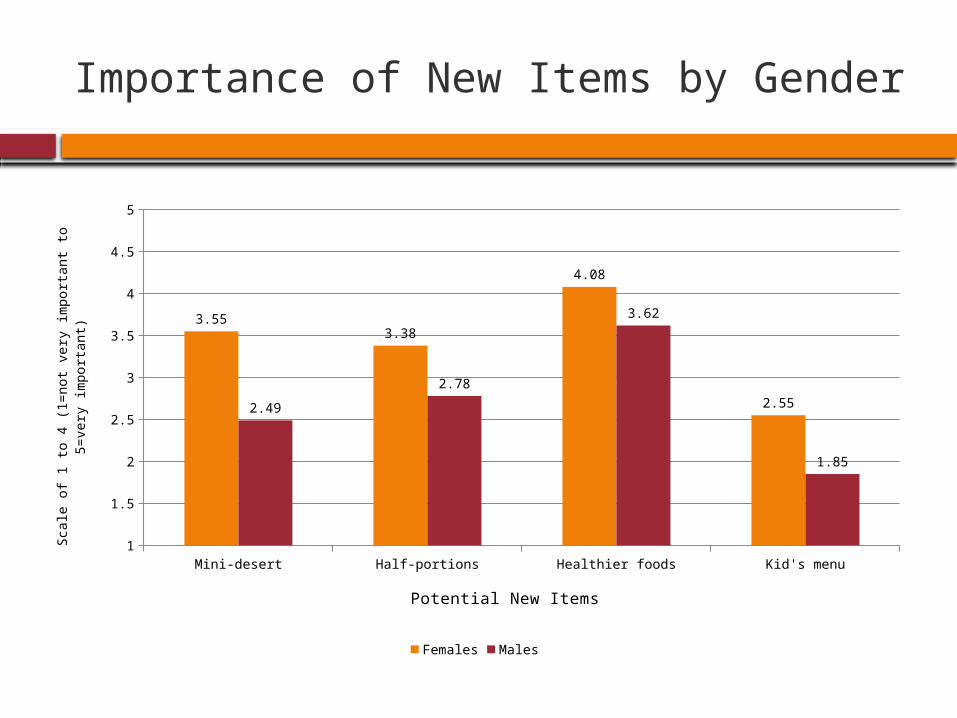
Importance of New Items by Gender
Mini-desert Half-portions Healthier foods Kid's menu1
1.5
2
2.5
3
3.5
4
4.5
5
3.553.38
4.08
2.552.49
2.78
3.62
1.85
Females Males
Potential New Items
Sca
le o
f 1 t
o 4
(1=
not
very
im
port
ant
to 5
=very
im
por-
tant)
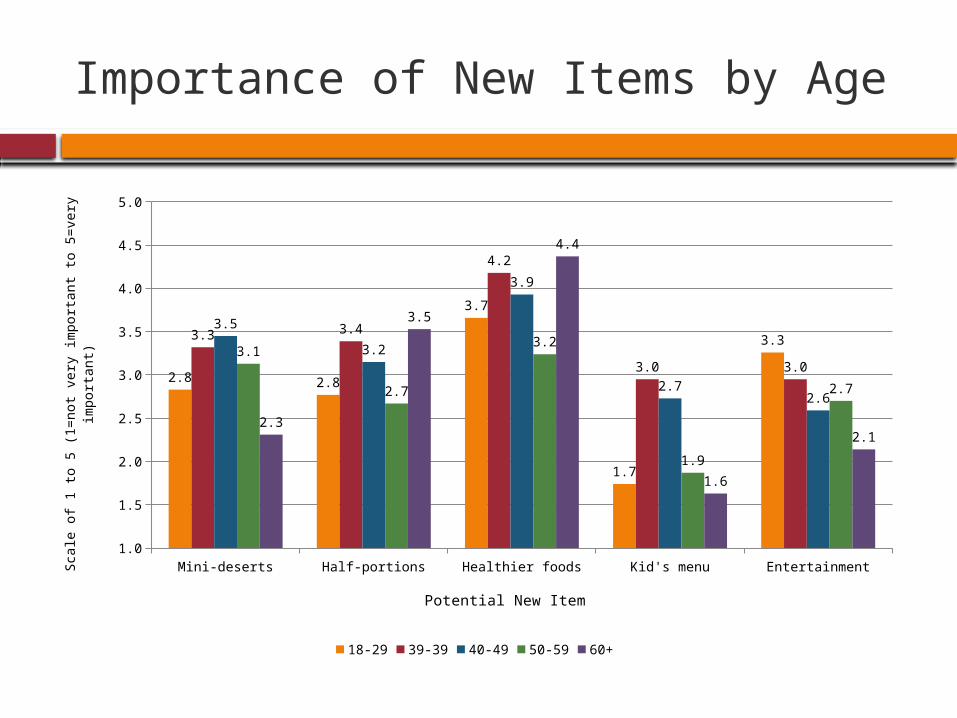
Importance of New Items by Age
Mini-deserts Half-portions Healthier foods Kid's menu Entertainment1.0
1.5
2.0
2.5
3.0
3.5
4.0
4.5
5.0
2.8 2.8
3.7
1.7
3.33.3 3.4
4.2
3.0 3.0
3.5
3.2
3.9
2.72.6
3.1
2.7
3.2
1.9
2.7
2.3
3.5
4.4
1.6
2.1
18-29 39-39 40-49 50-59 60+
Potential New Item
Sca
le o
f 1 t
o 5
(1=
not
very
im
port
ant
to 5
=very
im
por-
tant)
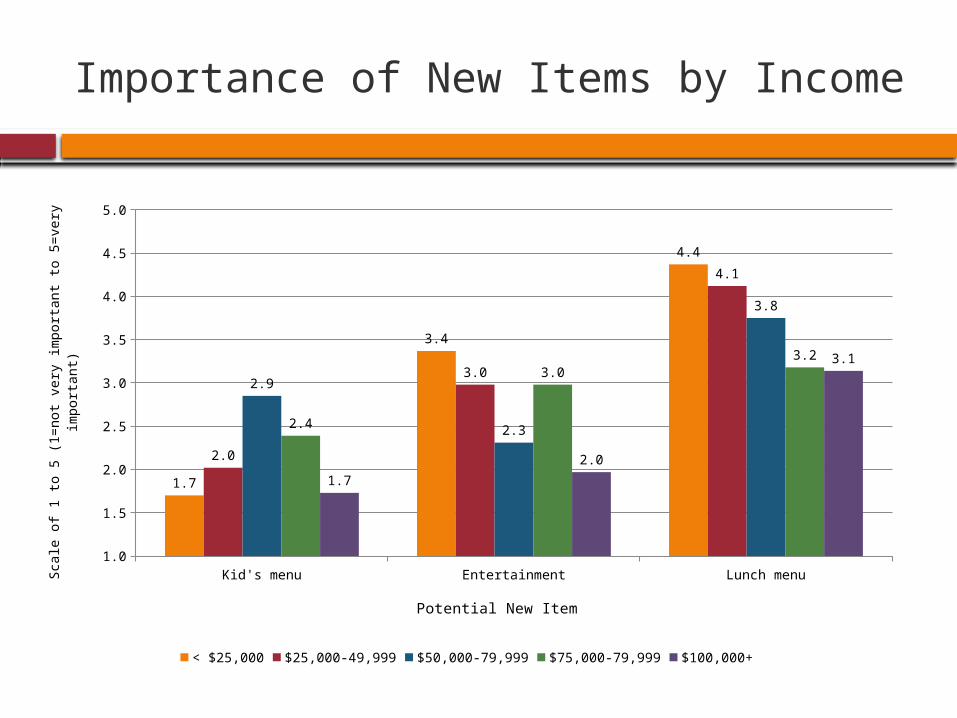
Importance of New Items by Income
Kid's menu Entertainment Lunch menu1.0
1.5
2.0
2.5
3.0
3.5
4.0
4.5
5.0
1.7
3.4
4.4
2.0
3.0
4.1
2.9
2.3
3.8
2.4
3.03.2
1.7
2.0
3.1
< $25,000 $25,000-49,999 $50,000-79,999 $75,000-79,999 $100,000+
Potential New Item
Sca
le o
f 1 t
o 5
(1=
not
very
im
port
ant
to 5
=very
im
por-
tant)
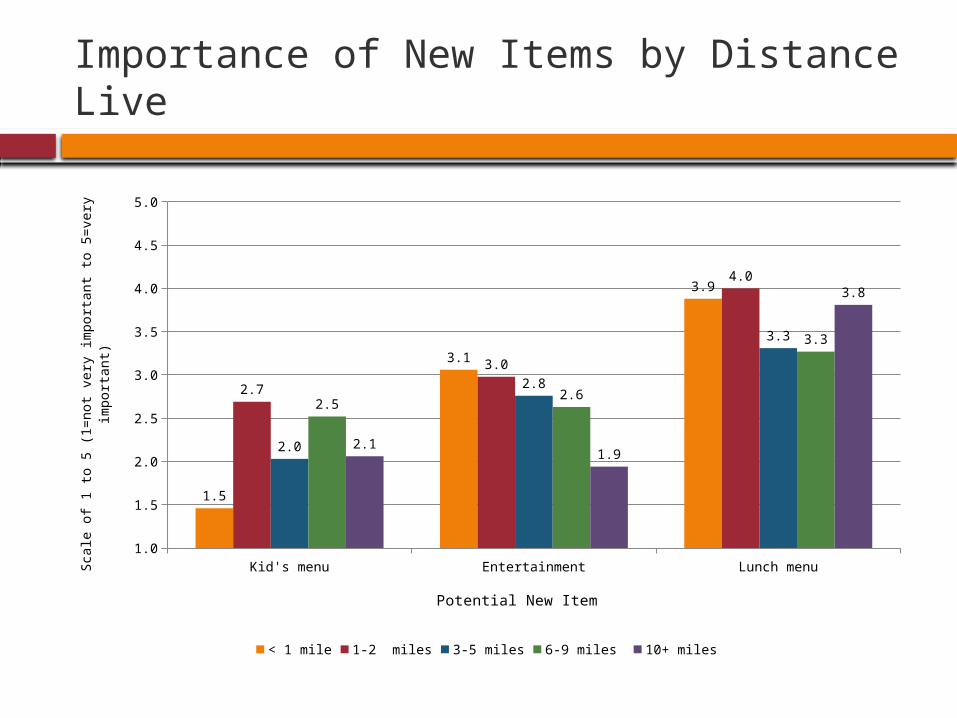
Importance of New Items by Distance Live
Kid's menu Entertainment Lunch menu1.0
1.5
2.0
2.5
3.0
3.5
4.0
4.5
5.0
1.5
3.1
3.9
2.7
3.0
4.0
2.0
2.8
3.3
2.52.6
3.3
2.11.9
3.8
< 1 mile 1-2 miles 3-5 miles 6-9 miles 10+ miles
Potential New Item
Sca
le o
f 1 t
o 5
(1=
not
very
im
port
ant
to 5
=very
im
por-
tant)
Conclusions
Most important in patronage decision are free bread, healthier meals, and lunch menu
Healthier meals Lunch menu
Positively related to usage Inversely related to income
Mini-deserts Desired by moderate users, middle income, and females
Important to females – mini-deserts, half-portions, healthier foods
Entertainment inversely related to age and income
Would changing the advertising, and/or promotional practices increase sales?
Research Objective Four (B)
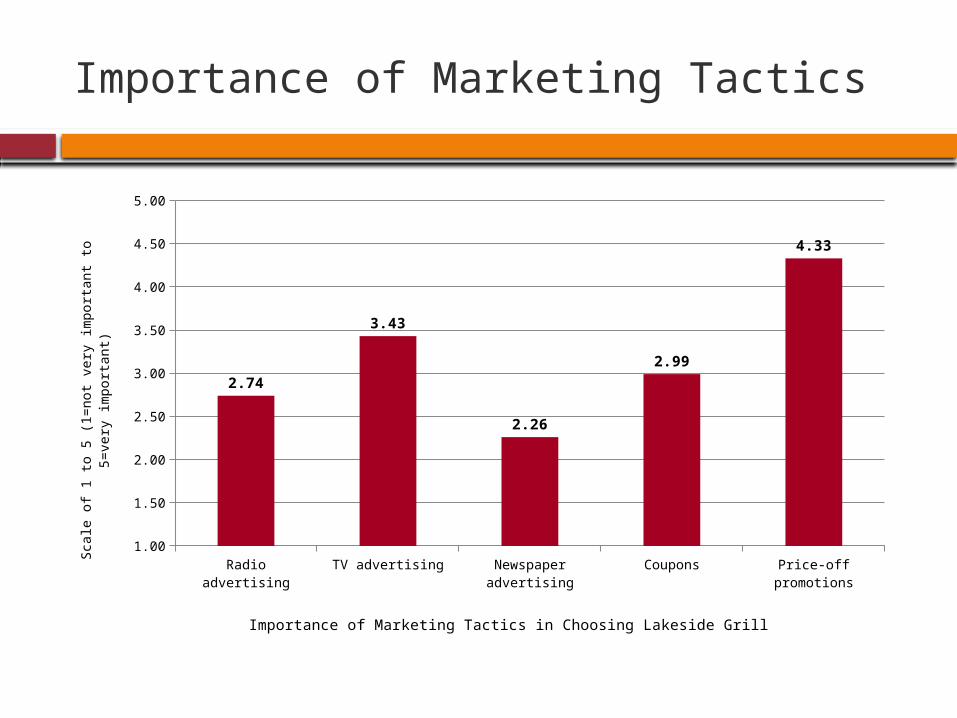
Importance of Marketing Tactics
Radio advertising TV advertising Newspaper advertising Coupons Price-off promotions1.00
1.50
2.00
2.50
3.00
3.50
4.00
4.50
5.00
2.74
3.43
2.26
2.99
4.33
Importance of Marketing Tactics in Choosing Lakeside Grill
Sca
le o
f 1 t
o 5
(1=
not
very
im
port
ant
to 5
=very
im
por-
tant)
Importance of Marketing Tactics by Type of Diner
Advertising in newspapers more important for evening diners (2.27) than noon diners (1.97)
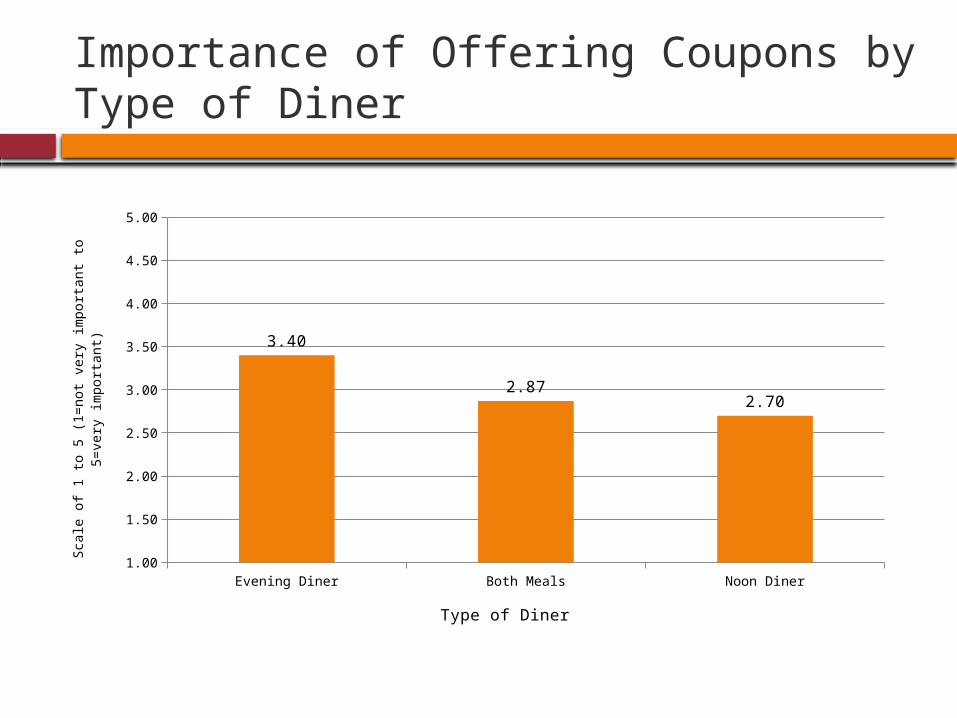
Importance of Offering Coupons by Type of Diner
Evening Diner Both Meals Noon Diner1.00
1.50
2.00
2.50
3.00
3.50
4.00
4.50
5.00
3.40
2.872.70
Type of Diner
Sca
le o
f 1 t
o 5
(1=
not
very
im
port
ant
to 5
=very
im
port
ant)
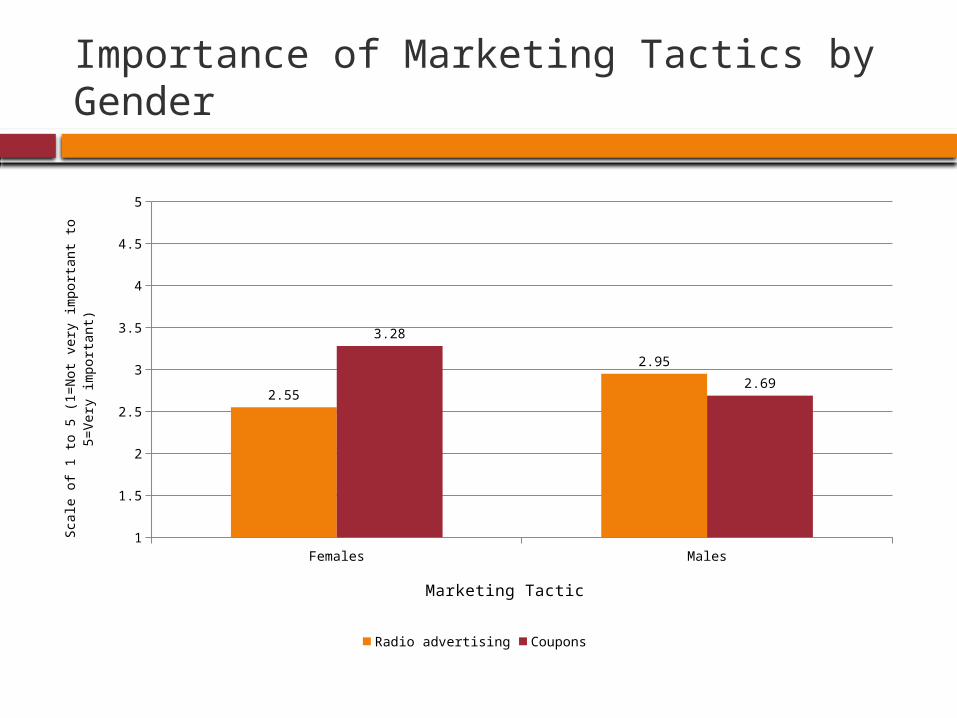
Importance of Marketing Tactics by Gender
Females Males1
1.5
2
2.5
3
3.5
4
4.5
5
2.55
2.95
3.28
2.69
Radio advertising Coupons
Marketing Tactic
Sca
le o
f 1 t
o 5
(1=
Not
very
im
port
ant
to 5
=V
ery
im
por-
tant)
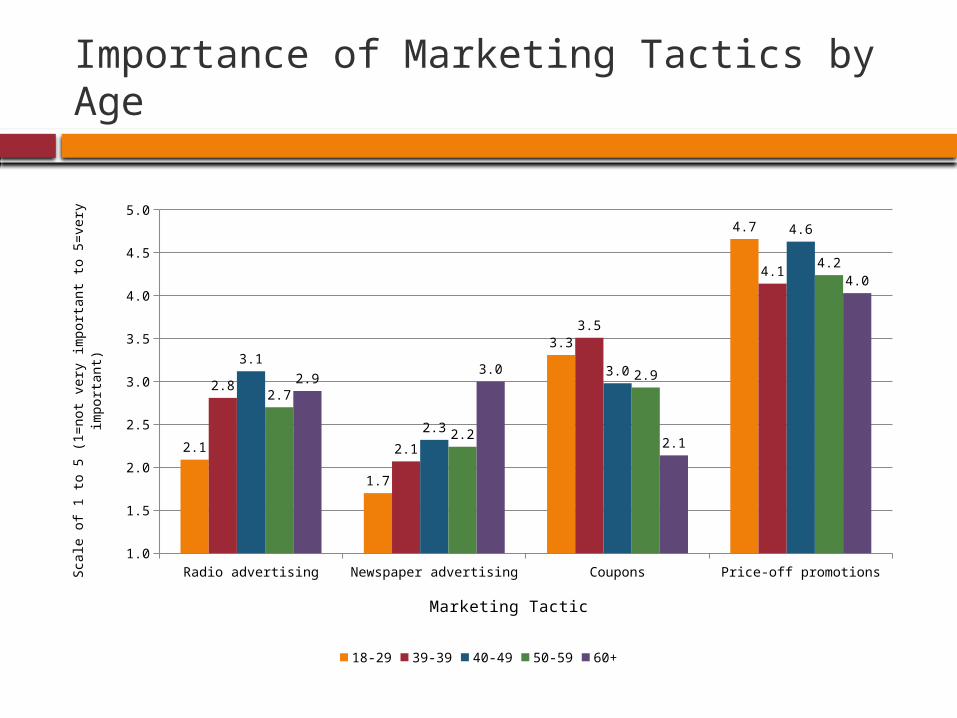
Importance of Marketing Tactics by Age
Radio advertising Newspaper advertising Coupons Price-off promotions1.0
1.5
2.0
2.5
3.0
3.5
4.0
4.5
5.0
2.1
1.7
3.3
4.7
2.8
2.1
3.5
4.1
3.1
2.3
3.0
4.6
2.7
2.2
2.9
4.2
2.93.0
2.1
4.0
18-29 39-39 40-49 50-59 60+
Marketing Tactic
Sca
le o
f 1 t
o 5
(1=
not
very
im
port
ant
to 5
=very
im
por-
tant)
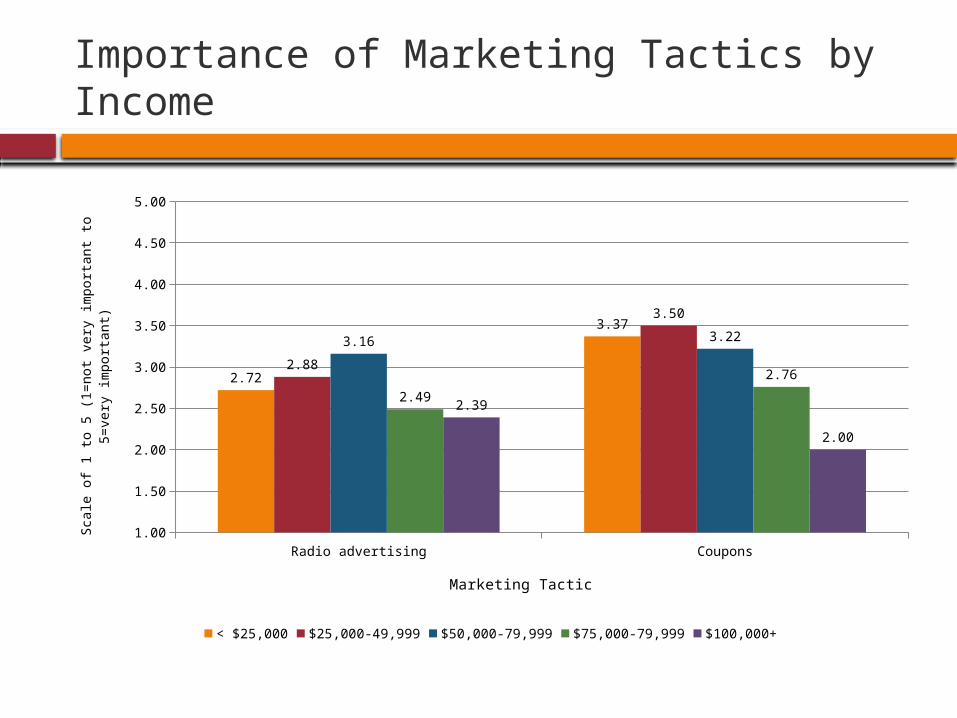
Importance of Marketing Tactics by Income
Radio advertising Coupons1.00
1.50
2.00
2.50
3.00
3.50
4.00
4.50
5.00
2.72
3.37
2.88
3.50
3.16 3.22
2.49
2.76
2.39
2.00
< $25,000 $25,000-49,999 $50,000-79,999 $75,000-79,999 $100,000+
Marketing Tactic
Sca
le o
f 1 t
o 5
(1=
not
very
im
port
ant
to 5
=very
im
por-
tant)

Importance of Radio Advertising by Distance Live
< 1 mile 1-2 miles 3-5 miles 6-9 miles 10+ miles1.00
1.50
2.00
2.50
3.00
3.50
4.00
4.50
5.00
1.85
3.022.82
2.64
3.15
Advertising on the Radio
Sca
le o
f 1 t
o 5
(1=
not
very
im
port
ant
to 5
=very
im
por-
tant)
Conclusions
Price-off promotions important Tends to decline with age
Advertising on TV somewhat important

Research Insights
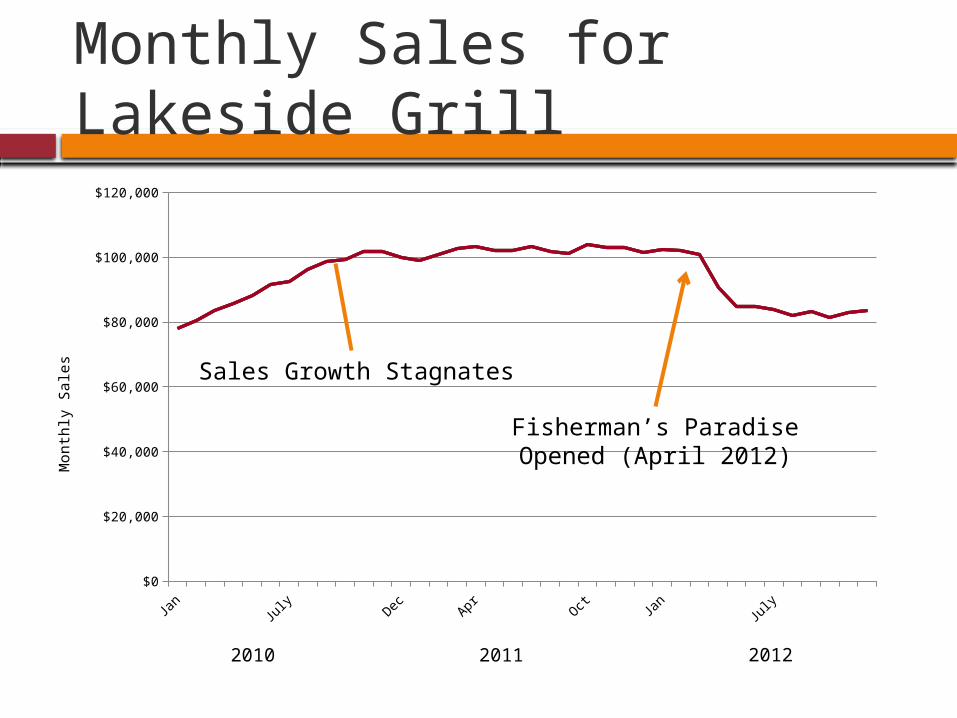
Monthly Sales for Lakeside Grill
Jan
July
Dec Apr Oct Jan
July
$0
$20,000
$40,000
$60,000
$80,000
$100,000
$120,000
Mon
thly
Sale
s
2010 2011 2012
Fisherman’s ParadiseOpened (April 2012)
Sales Growth Stagnates
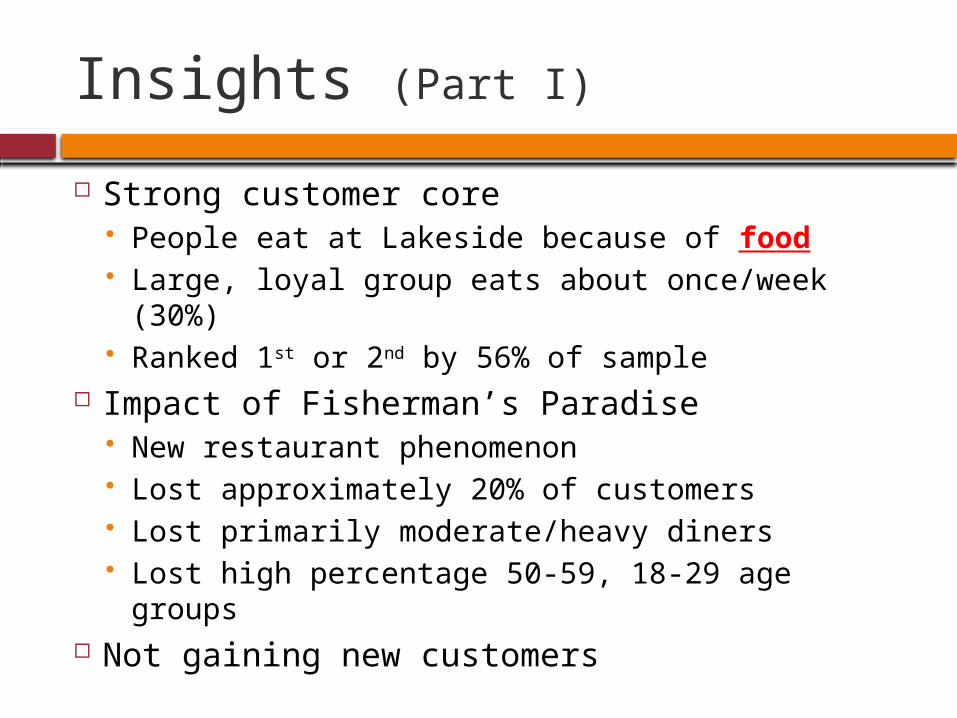
Insights (Part I)
Strong customer core People eat at Lakeside because of food Large, loyal group eats about once/week
(30%) Ranked 1st or 2nd by 56% of sample
Impact of Fisherman’s Paradise New restaurant phenomenon Lost approximately 20% of customers Lost primarily moderate/heavy diners Lost high percentage 50-59, 18-29 age groups
Not gaining new customers
Insights (Part II)
Reasons for customer loss Slow speed of service (not staff) Appearance of building (exterior and
interior) Lower level of satisfaction by females
Why long wait time?
Examined hourly labor costs Wait time due primarily to hourly staff
Sales/cost data examined Compare to gross sales Compare hour labor cost percent to gross
sales Compare hour labor cost percent to
industry average
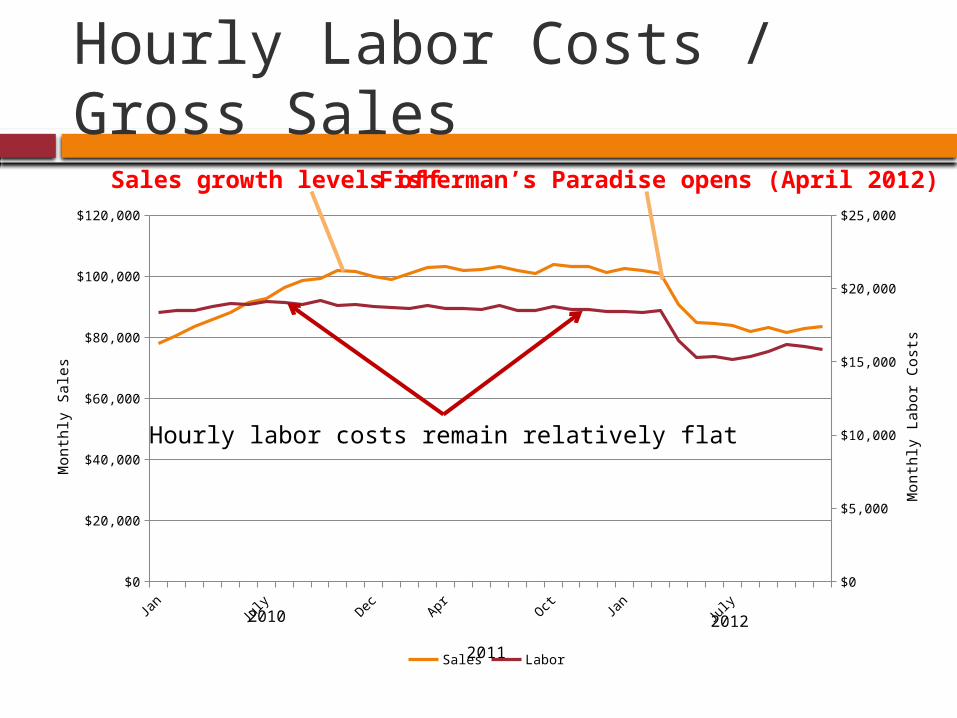
Hourly Labor Costs / Gross Sales
Jan
July
Dec Apr Oct Jan
July
$0
$20,000
$40,000
$60,000
$80,000
$100,000
$120,000
$0
$5,000
$10,000
$15,000
$20,000
$25,000
Sales Labor2011
Mon
thly
Sale
s
Mon
thly
Lab
or
Cost
s
Sales growth levels offFisherman’s Paradise opens (April 2012)
2010 2012
Hourly labor costs remain relatively flat
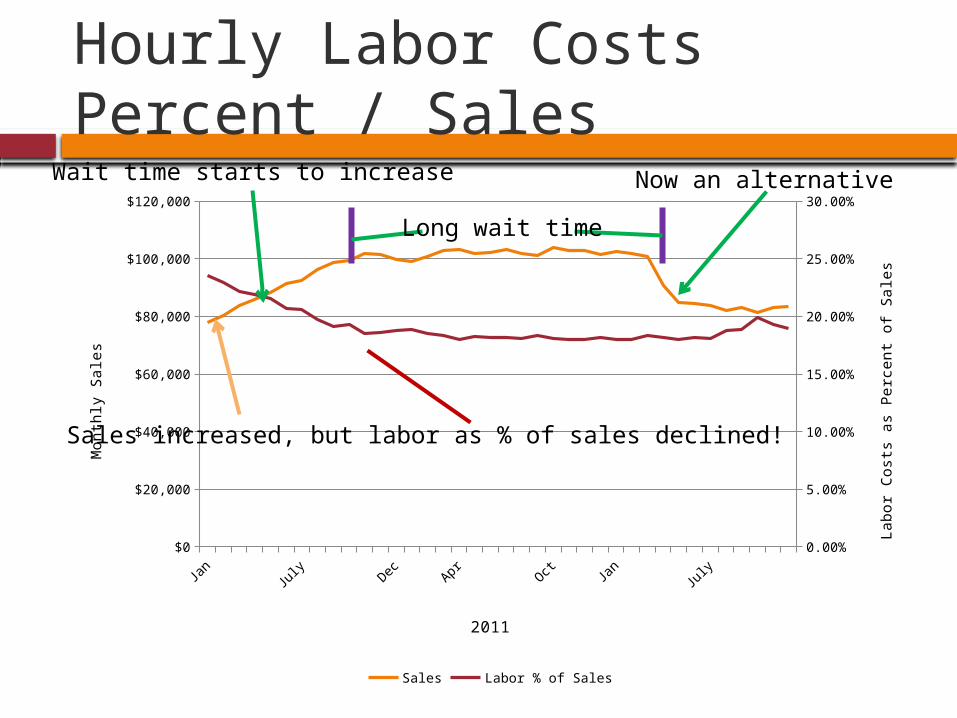
Hourly Labor Costs Percent / Sales
Jan
July
Dec Apr Oct Jan
July
$0
$20,000
$40,000
$60,000
$80,000
$100,000
$120,000
0.00%
5.00%
10.00%
15.00%
20.00%
25.00%
30.00%
Sales Labor % of Sales
2011
Mon
thly
Sale
s
Lab
or
Cost
s as
Perc
en
t of
Sale
s
Sales increased, but labor as % of sales declined!
Wait time starts to increase
Long wait time
Now an alternative
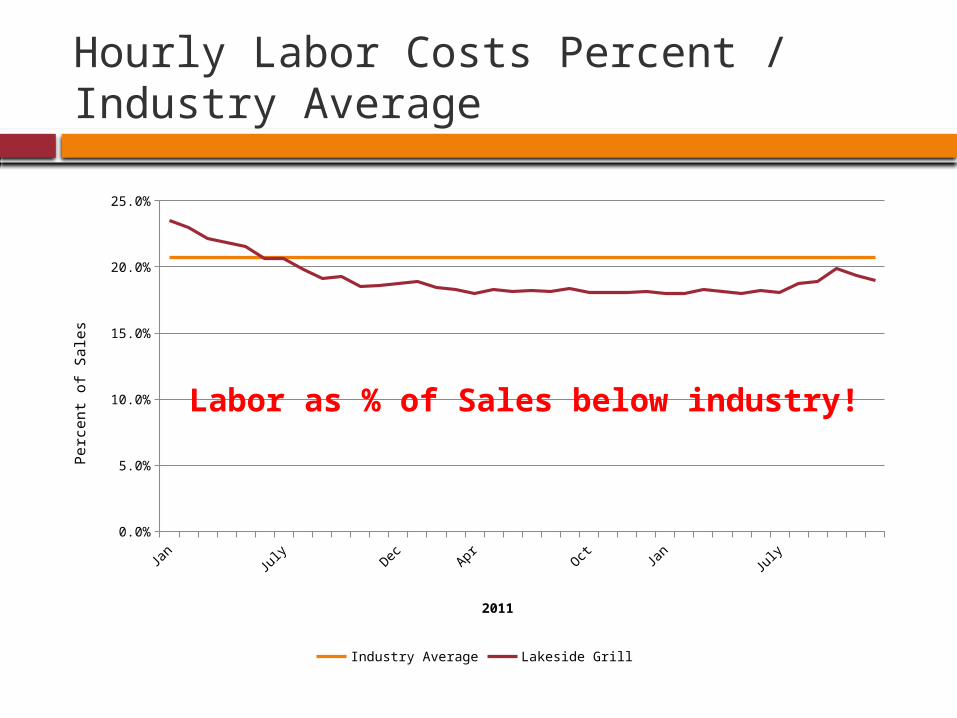
Hourly Labor Costs Percent / Industry Average
Jan
July
Dec Apr Oct Jan
July
0.0%
5.0%
10.0%
15.0%
20.0%
25.0%
Industry Average Lakeside Grill
2011
Perc
en
t of
Sale
s
Labor as % of Sales below industry!
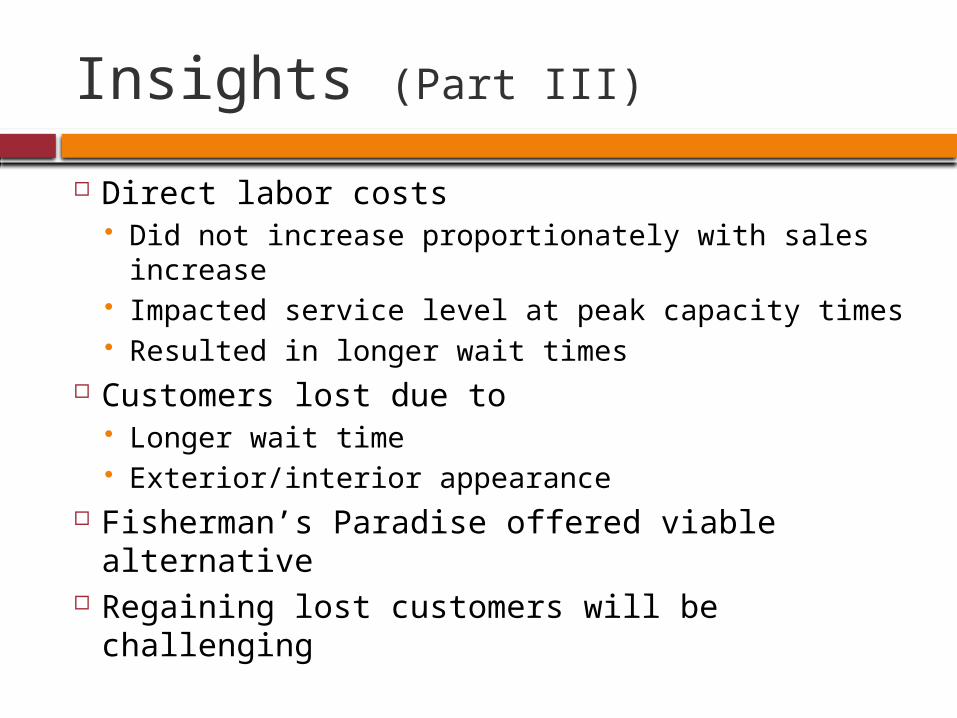
Insights (Part III)
Direct labor costs Did not increase proportionately with sales
increase Impacted service level at peak capacity times Resulted in longer wait times
Customers lost due to Longer wait time Exterior/interior appearance
Fisherman’s Paradise offered viable alternative
Regaining lost customers will be challenging

Recommendations
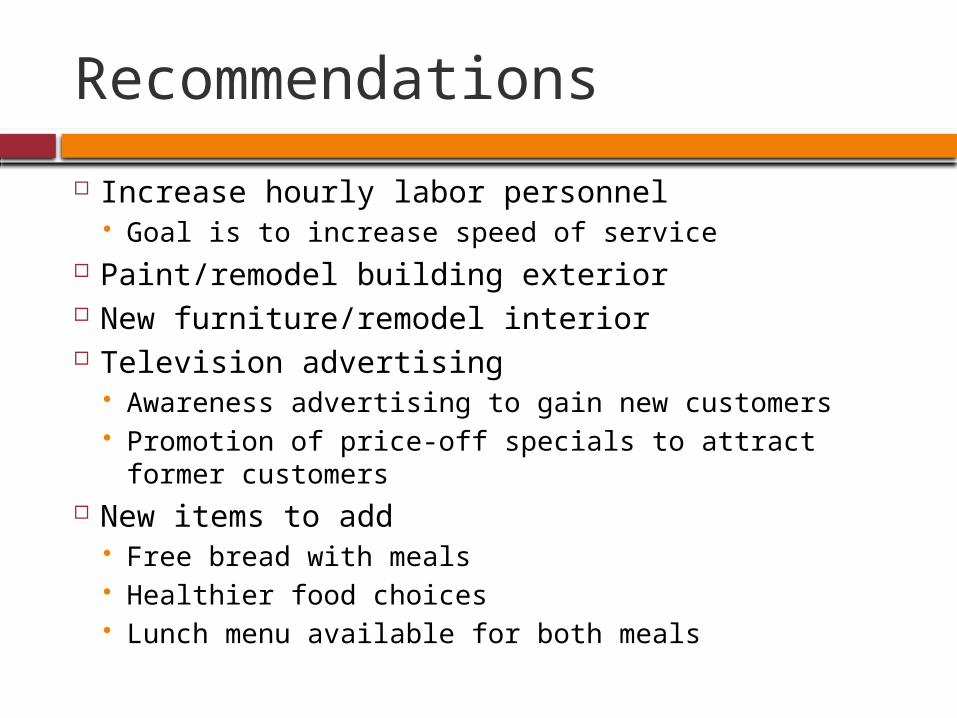
Recommendations
Increase hourly labor personnel Goal is to increase speed of service
Paint/remodel building exterior New furniture/remodel interior Television advertising
Awareness advertising to gain new customers Promotion of price-off specials to attract former
customers New items to add
Free bread with meals Healthier food choices Lunch menu available for both meals