Embed Size (px)
Citation preview
Appendix 5
Lake Winnipeg Regulation

MANITOBA HYDRO
INTEROFFICE MEMORANDUM
FROM P.G. Chanel, P.Eng. Hydraulic Licensing & Support Section Hydraulic Operations Department
TO B.W. Giesbrecht, P.Eng. Hydraulic Licensing & Sup Section Head Hydraulic Operations Department
DATE 2014 07 23
FILE 00199-07311-0020_00
SUBJECT LAKE WINNIPEG REGULATION - SHORELINE MONITORING AND EROSION PROTECTION DOWNSTREAM FROM LAKE WINNIPEG As part of the construction of Lake Winnipeg Regulation (LWR), multiple channels were constructed to increase the capacity of water that can flow out of Lake Winnipeg and into the downstream lakes. Manitoba Hydro has established various monitoring programs, shoreline erosion site investigations and has installed shoreline protection at various locations downstream from Lake Winnipeg. The following sections document the available shoreline information between the outlet of Lake Winnipeg and Gull Lake and the major shoreline protection works completed since 2005. Two-Mile Channel Following the construction of Two-Mile Channel, a monitoring program was established in 1978 to examine the extent of erosion along the channel. The Channel is surveyed at the same locations every two years. Based on the most recent survey assessment completed in 2011, the Two-Mile Channel bed has shown approximately 5 ft of scour since 1978, corresponding to an average rate of about 0.15 ft/yr per year. The areas that tend to be most susceptible to channel bank erosion are located near the inlet (at Lake Winnipeg) and outlet (at Playgreen Lake). Near the inlet of Two-Mile Channel, it is estimated that the channel bank has eroded more than 150 ft since 1978 as a result of wave action from Lake Winnipeg (Manitoba Hydro 1994a); while on the Playgreen Lake side of the channel, near the Two-Mile Channel outlet, the right channel bank near the water surface has eroded up to 0.8 ft/yr or 25 ft since 1978. The assessment concluded that areas that show erosion on the channel banks average 3 ft and that erosion rates near the surface appear to have increased over the past two years (Manitoba Hydro 2011). Eight-Mile Channel Following the construction of the Eight-Mile Channel, a monitoring program was established in 1978 (in conjunction with monitoring for Two-Mile Channel) to examine the extent of erosion along the channel. The Channel is surveyed at the same locations every two years. The most recent survey assessment completed in 2011, indicated that the Eight-Mile Channel bed has scoured (lowered) approximately 6.5 ft of erosion since 1978, corresponding to an average scour rate of about 0.2 ft/yr. The areas that tend to be susceptible to channel bank erosion include the right bank around
D1910
2014 07 23 Page 2 the inlet (at Playgreen Lake) and the banks near the outlet (at Kiskittogisu Lake). Near the inlet of the Eight-Mile Channel, the toe of the right bank has experienced up to 23 ft of erosion since the channel was completed, while up to 30 ft of deposition has occurred at the toe of the left bank. The right bank near the water surface has only eroded up to 3 ft, while up to 26 ft of deposition is observed at the top of the left bank. Near the outlet to Kiskittogisu Lake, the largest amount of erosion observed was 13 ft at the leading edge of the right bank. It was recommended that additional surveys be undertaken in future years since Eight Mile Channel continues to experience erosion and deposition (Manitoba Hydro 2011). Playgreen and Little Playgreen Lakes The average water level on Playgreen and Little Playgreen Lakes is similar to what it would have been without LWR and water levels have remained within their natural ranges (Manitoba Hydro 2014). As a result, shoreline erosion rates are not believed to be impacted by LWR. LWR has also reduced the range of water levels on these lakes, including the peak flood levels. Previous studies by MacLaren Plansearch Inc. and J.D. Mollard and Associates Ltd support this conclusion. In 1985, MacLaren Plansearch Inc. completed a comprehensive study of South Playgreen to assess concerns that LWR negatively impacted the commercial fishery on Playgreen Lake. As part of the study, the following conclusion regarding erosion processes were made: Erosion of southwestern shorelines within Playgreen Lake is an historic phenomenon, and is observed to contribute inorganic and organic autochthonous materials to Playgreen Lake prior to and since LWR; The rate of internal shoreline recession at a highly erosion susceptible shoreline in Playgreen Lake is virtually identical pre and post-regulation; Playgreen Lake shorelines are not dramatically different today than during the pre-LWR period. The shorelines have largely adjusted to the changed water levels due to LWR and equilibrium or dynamic equilibrium has been re-established (MacLaren Plansearch Inc. 1985). In 1994, J.D. Mollard and Associates Ltd. assessed whether there were any identifiable changes in air photos in the Norway House Reserve area before and after the regulation of Lake Winnipeg (J.D. Mollard and Associates Ltd 1994). Ten different sets of air photos were examined ranging in scale from 1:6,000 to 1:63,000, acquired between 1955 and 1990. No shore erosion could be identified along lakeshores or river channels near the Norway House settlement using air photos taken before and after LWR. The most visible shoreline changes were in land use, with an increase in the number of houses and docks observed from 1973 to 1990.
2014 07 23 Page 3
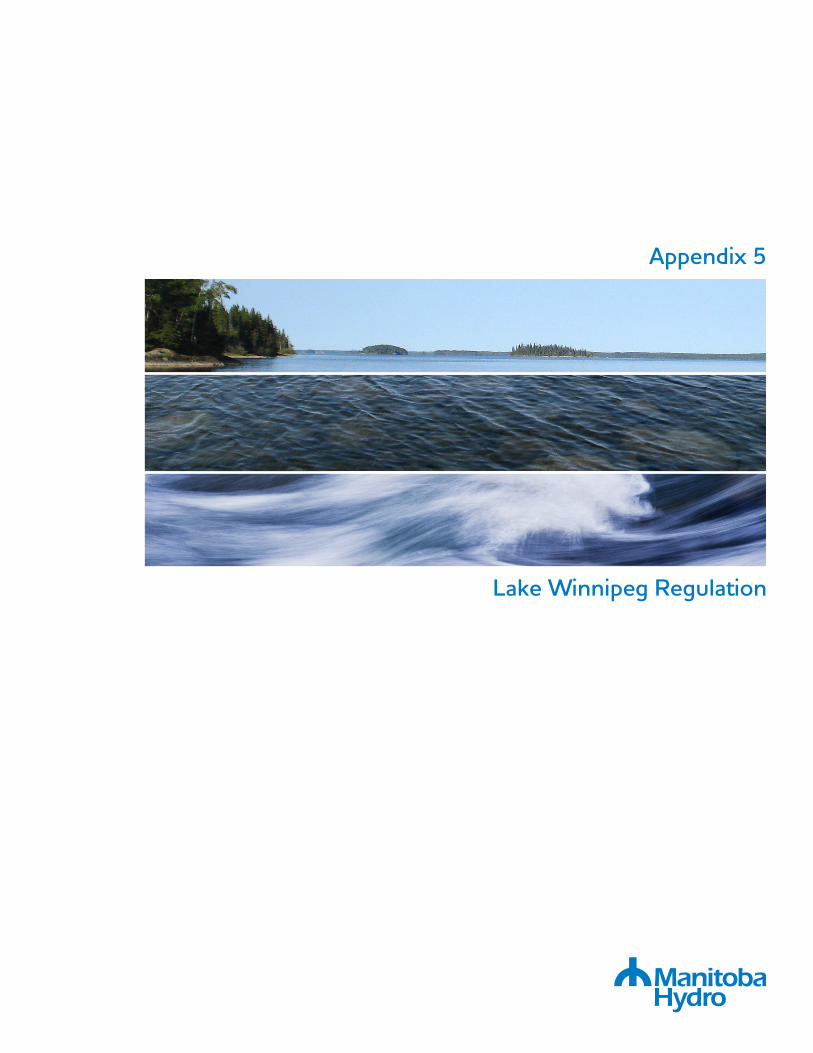
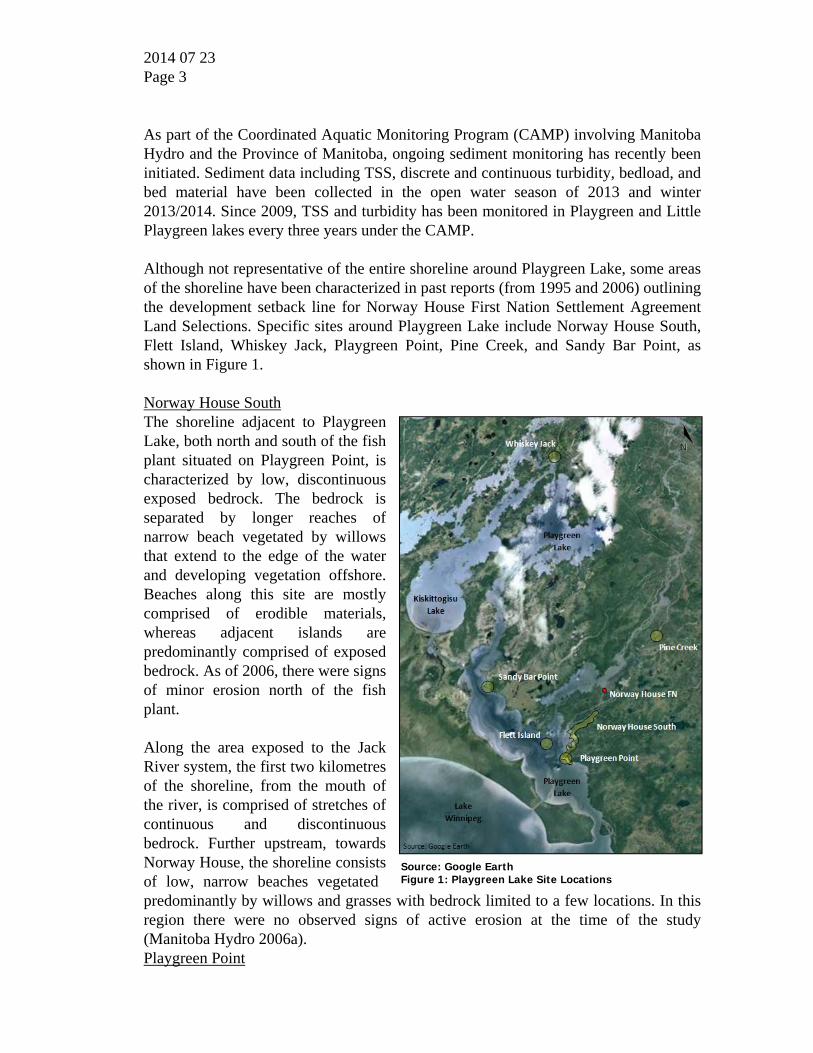
Source: Google Earth Figure 1: Playgreen Lake Site Locations
As part of the Coordinated Aquatic Monitoring Program (CAMP) involving Manitoba Hydro and the Province of Manitoba, ongoing sediment monitoring has recently been initiated. Sediment data including TSS, discrete and continuous turbidity, bedload, and bed material have been collected in the open water season of 2013 and winter 2013/2014. Since 2009, TSS and turbidity has been monitored in Playgreen and Little Playgreen lakes every three years under the CAMP. Although not representative of the entire shoreline around Playgreen Lake, some areas of the shoreline have been characterized in past reports (from 1995 and 2006) outlining the development setback line for Norway House First Nation Settlement Agreement Land Selections. Specific sites around Playgreen Lake include Norway House South, Flett Island, Whiskey Jack, Playgreen Point, Pine Creek, and Sandy Bar Point, as shown in Figure 1. Norway House South The shoreline adjacent to Playgreen Lake, both north and south of the fish plant situated on Playgreen Point, is characterized by low, discontinuous exposed bedrock. The bedrock is separated by longer reaches of narrow beach vegetated by willows that extend to the edge of the water and developing vegetation offshore. Beaches along this site are mostly comprised of erodible materials, whereas adjacent islands are predominantly comprised of exposed bedrock. As of 2006, there were signs of minor erosion north of the fish plant. Along the area exposed to the Jack River system, the first two kilometres of the shoreline, from the mouth of the river, is comprised of stretches of continuous and discontinuous bedrock. Further upstream, towards Norway House, the shoreline consists of low, narrow beaches vegetated predominantly by willows and grasses with bedrock limited to a few locations. In this region there were no observed signs of active erosion at the time of the study (Manitoba Hydro 2006a). Playgreen Point
2014 07 23 Page 4 The shoreline conditions at Playgreen Point are stable, with the presence of bedrock controlled shorelines along the north end. Vegetation generally extends to the water’s edge and water depth around this area is quite shallow, as evident by the significant growth of reed grasses along the shoreline. Based on site investigation carried out in 1993, there was no evidence of shoreline erosion along the neighbouring shorelines that are not bedrock controlled. Furthermore, these shorelines are typically well vegetated with significant offshore reed growth. The shoreline banks have an average height between 3 and 4.5 ft with the bordering land rising at a gentle slope. There is one exception however, where the shoreline height ranges from 5 to 6.5 ft near the fish plant (located on the south-west edge of the peninsula) (Manitoba Hydro 1995a). Flett Island The shoreline around Flett Island is predominantly an exposed beach likely comprised of sandy soil. However, there are some sporadic sections of exposed bedrock, especially in the south-east area. There are also some bays around the south-east area that are characterized by offshore developing vegetation and the presence of low willows along the backshore. Some sections of the south-west beach shoreline are exposed to relatively large wind events and as a result, showed signs of recent, minor erosion during a field investigation completed in 2006 (Manitoba Hydro 2006a). Sandy Bar Point Along the west side of this site, the shoreline is composed of clay with well established vegetative cover. The shoreline rises to a height of approximately 6.5 ft. At the time of the field inspection in 1993, there was some evidence of minor erosion. The central portion of the site is a sand esker with an approximate height of 33 ft. During the field inspection, there was evidence that the bank had been subject to erosion; however there was no indication of recent erosion, given the presence of vegetative cover. The eastern section of the site is characterised by a relative low clay bank 5 to 6.5 ft in height. The beach in this reach is relatively narrow having a width of 6.5 to 10 ft. At the time of the site investigation there was some evidence of shoreline erosion in this area; bank undercutting removed some supporting shoreline material and numerous trees were leaning towards the water (Manitoba Hydro 1995b). Pine Creek The creek banks at this site are mostly composed of clay soils with heights ranging from 6.5 to 10 ft and relatively flat slopes around 6:1 (H:V). However, the creek also has a meandering pattern with several bedrock controls and steeper bank slopes. The
2014 07 23 Page 5 flatter slopes along the creek are well vegetated, extending to the water’s edge. During the 1993 site investigation, there was no evidence of shoreline erosion or bank instability (Manitoba Hydro 1995c). Whiskey Jack The shoreline at this location is characterized by numerous bedrock controls that separate reaches of erodible clay shoreline. The bedrock dominated shorelines have higher relief and exhibit better drainage than the clay shorelines. Adjoining clay shorelines have lower relief, a relatively thick peat cover, and generally exhibit poor drainage. This material has been subject to erosion which has shifted the shoreline landward beyond existing rock controls. In 1995, minor active erosion was observed at only one site at this location (Manitoba Hydro 1995d). Kiskitto Lake and Kiskittogisu Lake Manitoba Hydro has not monitored rates of shoreline erosion on either Kiskitto of Kiskittogisu Lakes. Some areas of the Kiskittogisu Lake west shore have been characterized in a 2004 report outlining the easement line determination for Norway House Cree Nation treaty land entitlement selection (Manitoba Hydro 2004). Most of the shoreline showed signs of ongoing erosion, with the exception of bedrock controlled, sheltered or well-vegetated areas. Jenpeg Forebay As part of the Northern Flood Agreement (NFA), Manitoba Hydro and Cross Lake First Nation have been developing and implementing programs to remove and manage debris in the Jenpeg Forebay. To help understand the role of woody debris and how its removal would affect shoreline recession, bank recession has been monitored since 2003. About 65-70% of the forebay’s new shorelines are vulnerable to erosion from wave action, particularly at high water levels. Bank recession rates between 2003 and 2012 were found to vary depending on shoreline type with the greatest recession rates averaging 0.7 ft/yr for wave-cut banks (Kenora Resource Consultants Inc, and Straight Line North Inc. 2012). Cross Lake to Sipiwesk Lake As part of the LWR project, the outflow from the Jenpeg GS flows directly into Cross Lake and subsequently through Duck Lake and into Sipiwesk Lake, thus affecting the water levels and flows on the lakes. Erosion has been ongoing in the community of Cross Lake since before LWR. However, any pre-LWR erosion on Cross Lake would have only occurred during extreme events (flooding and flooding coupled with wind). Generally, much of the shoreline is bedrock controlled during low to average lake levels. However, any
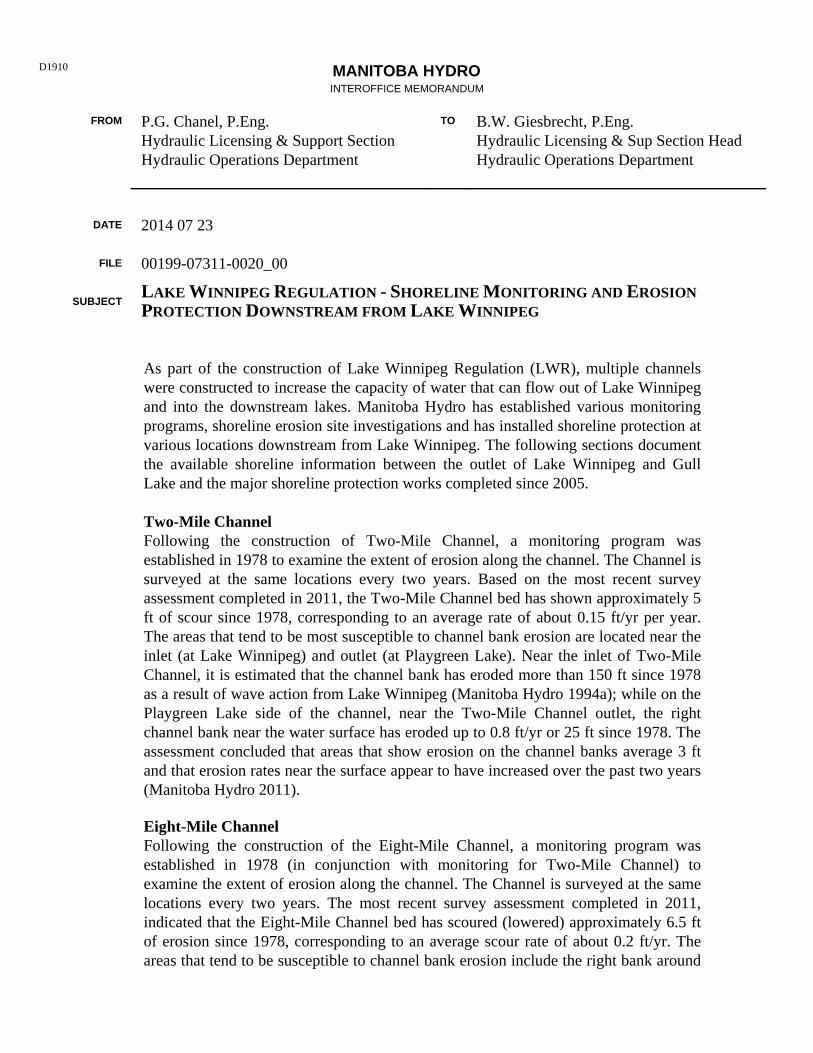
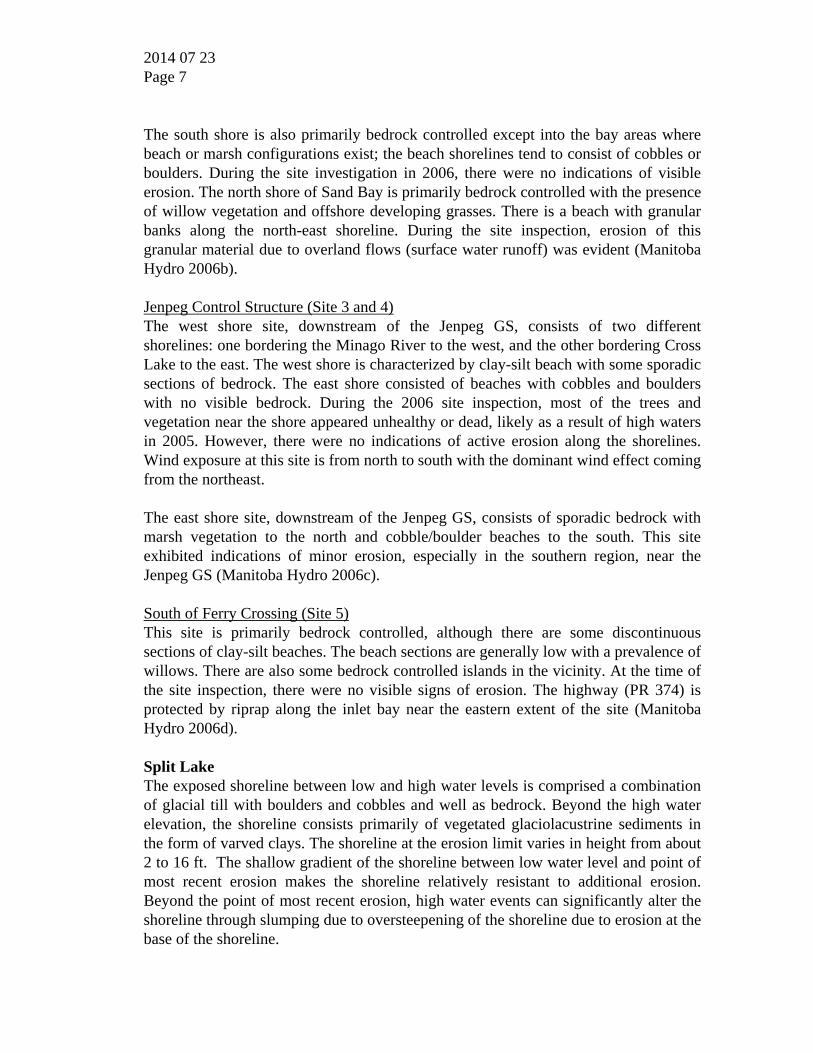
2014 07 23 Page 6 shoreline areas that are susceptible to erosion would have likely observed increased erosion rates because of the increase in average water level caused by the Cross Lake Weir. In 2011, inflows into Lake Winnipeg from western Manitoba/Canada resulted in record high water levels on Cross Lake and area. The resulting impact on Cross Lake and area from an erosion perspective was significant. In June 2011, as part of the NFA, Hydro began a shoreline protection program in the community of Cross Lake that would eventually protect approximately 14,400 ft of shoreline. This work was completed in the fall of 2012. The 2011 high water levels also dramatically altered the flows in the area of Duck Rapids where a new channel was incised into the erodible lacustrine sediments. This new channel will result in significant sediment/debris being introduced into the Sipiwesk Lake system. Erosion has also occurred on Sipiwesk Lake to a greater degree. Hydro has undertaken shoreline protection works at burial sites on Sipiwesk Lake as part of the NFA in an effort to ensure remains were not disturbed due to the high water levels. Although not representative of all shoreline types on Cross Lake, areas of the shoreline have been characterized in 2006 reports outlining the Development Setback Line for Cross Lake Community Council Settlement Agreement Land Selections. Specific sites around Cross Lake include Sand Bay, Jenpeg GS, and Ferry Crossing, as shown in Figure 2.
Source: Google Earth Figure 2: Cross Lake Site Locations
Sand Bay (Site 1 and 2)
2014 07 23 Page 7 The south shore is also primarily bedrock controlled except into the bay areas where beach or marsh configurations exist; the beach shorelines tend to consist of cobbles or boulders. During the site investigation in 2006, there were no indications of visible erosion. The north shore of Sand Bay is primarily bedrock controlled with the presence of willow vegetation and offshore developing grasses. There is a beach with granular banks along the north-east shoreline. During the site inspection, erosion of this granular material due to overland flows (surface water runoff) was evident (Manitoba Hydro 2006b). Jenpeg Control Structure (Site 3 and 4) The west shore site, downstream of the Jenpeg GS, consists of two different shorelines: one bordering the Minago River to the west, and the other bordering Cross Lake to the east. The west shore is characterized by clay-silt beach with some sporadic sections of bedrock. The east shore consisted of beaches with cobbles and boulders with no visible bedrock. During the 2006 site inspection, most of the trees and vegetation near the shore appeared unhealthy or dead, likely as a result of high waters in 2005. However, there were no indications of active erosion along the shorelines. Wind exposure at this site is from north to south with the dominant wind effect coming from the northeast. The east shore site, downstream of the Jenpeg GS, consists of sporadic bedrock with marsh vegetation to the north and cobble/boulder beaches to the south. This site exhibited indications of minor erosion, especially in the southern region, near the Jenpeg GS (Manitoba Hydro 2006c). South of Ferry Crossing (Site 5) This site is primarily bedrock controlled, although there are some discontinuous sections of clay-silt beaches. The beach sections are generally low with a prevalence of willows. There are also some bedrock controlled islands in the vicinity. At the time of the site inspection, there were no visible signs of erosion. The highway (PR 374) is protected by riprap along the inlet bay near the eastern extent of the site (Manitoba Hydro 2006d). Split Lake The exposed shoreline between low and high water levels is comprised a combination of glacial till with boulders and cobbles and well as bedrock. Beyond the high water elevation, the shoreline consists primarily of vegetated glaciolacustrine sediments in the form of varved clays. The shoreline at the erosion limit varies in height from about 2 to 16 ft. The shallow gradient of the shoreline between low water level and point of most recent erosion makes the shoreline relatively resistant to additional erosion. Beyond the point of most recent erosion, high water events can significantly alter the shoreline through slumping due to oversteepening of the shoreline due to erosion at the base of the shoreline.
2014 07 23 Page 8
Source: Manitoba Hydro, 2005 Figure 3: Scarp Failure at Split Lake
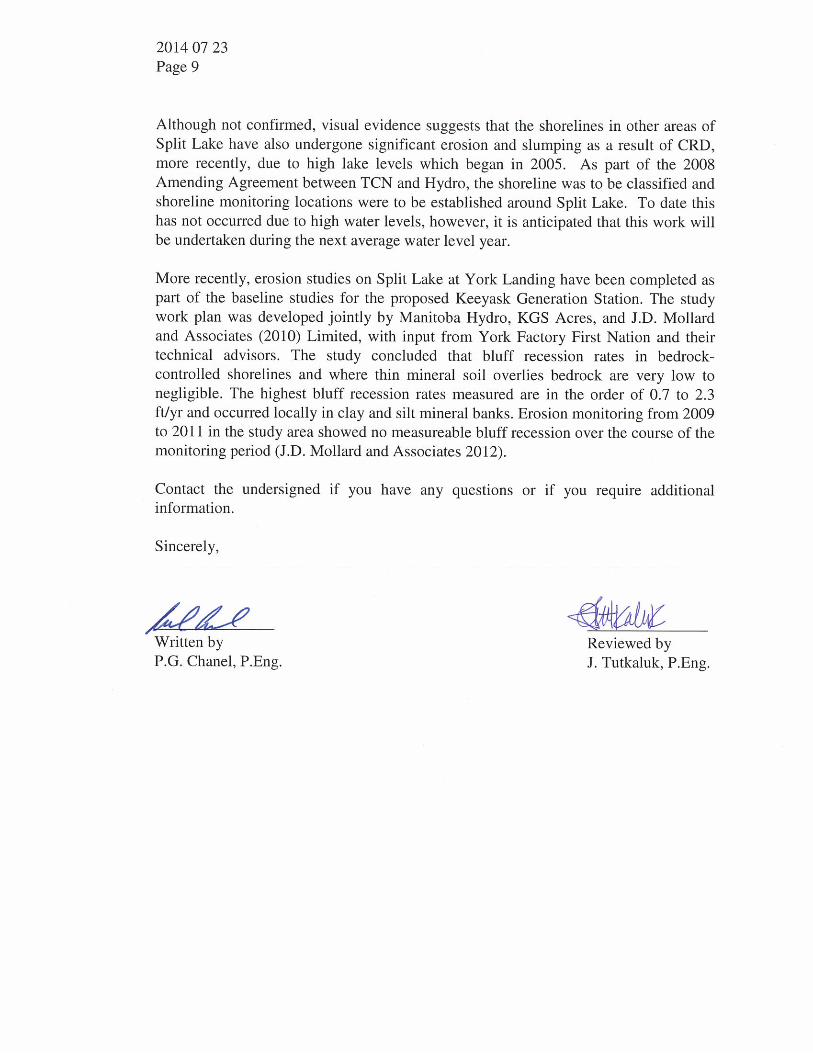
Between the 1981 and 1986 inspections, several areas experienced increased erosion resulting from the high water levels. However, these locations were very limited in shoreline extent, typically less than 50 ft. During these inspections, greater levels of erosion were observed at locations along the bank that had been cleared of trees and shrubs (Manitoba Hydro 1994b). As noted during the site inspection carried out in 2000, the Split Lake community completed clearing operations at the cemetery and the Senior Citizens Complex. At the time of the inspection, very little shoreline vegetation had re-grown at the cemetery, while only willows and small brush was beginning to re-grow at the Senior Citizens Complex. There was no evidence of accelerated erosion, at either site, due to the bush clearing. In addition, the 2000 inspection report noted that there was some minor erosion along the south shore, where the bank is not bedrock controlled (Manitoba Hydro 2001). At the time of the 2004 site inspection, a scarp failure was observed in front of a teacherage building, as shown in Figure 3. Also at that time, shoreline works were being completed at the Anglican cemetery (Manitoba Hydro 2005). In 2005, high flows and water levels resulted in significant erosion and emergency works were undertaken by Manitoba Hydro at two locations along the south shore. In 2008, an extensive program of shoreline protection works was undertaken as part of the 2008 Amending Agreement between Hydro and Tataskweyak Cree Nation (TCN). These works were required to address significant shoreline erosion issues and trespass beyond Hydro’s existing severance line. To date, approximately 19,000 ft of shoreline protection works have been completed addressing all areas where significant shoreline erosion had or was occurring. Any remaining shoreline protection work or maintenance of existing shoreline protection within the community is expected to be completed in 2014. In 2009, an extensive shoreline protection program was undertaken in the community of York Landing as part of the 1995 Comprehensive Implementation Agreement between Manitoba Hydro and York Factory First Nation. The shoreline protection work was required to address erosion concerns of the community and to protect the existing severance line from any erosion-related trespass. To date, approximately 7,900 ft of shoreline protection work has been completed. The remaining shoreline protection work and isolated severance line inundation work will be completed in either 2014 or 2015.
20140723Page 9
Although not confirmed, visual evidence suggests that the shorelines in other areas ofSplit Lake have also undergone significant erosion and slumping as a result of CRD,more recently, due to high lake levels which began in 2005. As part of the 2008Amending Agreement between TCN and Hydro, the shoreline was to be classified andshoreline monitoring locations were to be established around Split Lake. To date thishas not occurred due to high water levels, however, it is anticipated that this work willbe undertaken during the next average water level year.
More recently, erosion studies on Split Lake at York Landing have been completed aspart of the baseline studies for the proposed Keeyask Generation Station. The studywork plan was developed jointly by Manitoba Hydro, KGS Acres, and J.D. Mollardand Associates (2010) Limited, with input from York Factory First Nation and theirtechnical advisors. The study concluded that bluff recession rates in bedrock-controlled shorelines and where thin mineral soil overlies bedrock are very low tonegligible. The highest bluff recession rates measured are in the order of 0.7 to 2.3ft/yr and occurred locally in clay and silt mineral banks. Erosion monitoring from 2009to 2011 in the study area showed no measureable bluff recession over the course of themonitoring period (J.D. Mollard and Associates 2012).
Contact the undersigned if you have any questions or if you require additionalinformation.
Sincerely,
__ a
Written by Reviewed byP.G. Chanel, P.Eng. J. Tutkaluk, P.Eng.
2014 07 23 Page 10 References J.D. Mollard and Associates Limited 1994. An Office Airphoto Assessment of Changes in the Natural and Cultural Environment at Norway House Indian Reserve, Manitoba, Covering the Period 1955 to 1990. Report prepared for Manitoba Hydro. J.D. Mollard and Associates (2010) Limited 2012. Baseline Erosion Studies on Split Lake at York Landing – Draft Report Version 2. Kenora Resource Consultants Inc, and Straight Line North Inc. 2012. Monitoring of Bank Recession & Mobilization of Woody Debris as Potential Hazards to Navigation. Jenpeg Debris Management Program 2012. MacLaren Plansearch Inc. 1985. Ecological Study of Playgreen Lake, Manitoba. MacLaren Plansearch Inc., Winnipeg, MB. Manitoba Hydro 1994a. Lake Winnipeg Regulation, Assessment of 2 Mile Channel Surveys, March 1994. Manitoba Hydro, Winnipeg, MB. Manitoba Hydro 1994b. Review of Existing Shoreline Conditions within the Main Community Area – Split Lake. Manitoba Hydro, Winnipeg, MB. Manitoba Hydro 1995a. Proposed Development Setback Line Determination for Norway House First Nation Land Exchange – Playgreen Point. Manitoba Hydro, Winnipeg, MB. Manitoba Hydro 1995b. Proposed Development Setback Line Determination for Norway House First Nation Permit/Fee Simple Selection – Sand Bar Point. Manitoba Hydro, Winnipeg, MB. Manitoba Hydro 1995c. Proposed Development Setback Line Determination for Norway House First Nation Land Exchange – Reserve Extension (Pine Creek). Manitoba Hydro, Winnipeg, MB. Manitoba Hydro 1995d. Proposed Development Setback Line Determination for Norway House First Nation Land Exchange – Whiskey Jack. Manitoba Hydro, Winnipeg, MB. Manitoba Hydro 2001. Split Lake Settlement – Shoreline Inspection 2001. Manitoba Hydro, Winnipeg, MB. Manitoba Hydro 2002. Split Lake Settlement – Shoreline Inspection 2002. Manitoba Hydro, Winnipeg, MB.
2014 07 23 Page 11 Manitoba Hydro 2004. Hydro Easement Line Determination for Norway House Cree Nation Treaty Land Entitlement Selection Kiskittogisu Lake West Shore. Manitoba Hydro, Winnipeg, MB. Manitoba Hydro 2005. Split Lake Settlement – 2003 and 2004 Shoreline Inspection. Manitoba Hydro, Winnipeg, MB. Manitoba Hydro 2006a. Development Setback Line Determination for Norway House Community Council Settlement Agreement Land Selections on Playgreen Lake. Manitoba Hydro, Winnipeg, MB. Manitoba Hydro 2006b. Development Setback Line Determination for Cross Lake Community Council Settlement Agreement Land Selections – Sand Bay Residential and Sand Bay Recreational. Manitoba Hydro, Winnipeg, MB. Manitoba Hydro 2006c. Development Setback Line Determination for Cross Lake Community Council Settlement Agreement Land Selections – Downstream of Jenpeg. Manitoba Hydro, Winnipeg, MB. Manitoba Hydro 2006d. Development Setback Line Determination for Cross Lake Community Council Settlement Agreement Land Selections – South of Ferry Crossing. Manitoba Hydro, Winnipeg, MB. Manitoba Hydro 2011. Lake Winnipeg Regulation – Assessment of 2-Mile and 8-Mile Channel Surveys. Manitoba Hydro, Winnipeg, MB. Manitoba Hydro 2014. An Assessment of Lake Winnipeg Regulation Effects on Little Playgreen Lake. Manitoba Hydro, Winnipeg, MB. PGC/sl/ 00199-07311-0020_00