Embed Size (px)
Citation preview

1101 Connec t i cu t Avenue , NW Su i t e 750 1101 Connec t i cu t Avenue , NW Su i t e 750 1101 Connec t i cu t Avenue , NW Su i t e 750 1101 Connec t i cu t Avenue , NW Su i t e 750
Wash ington , DC 20036Wash ington , DC 20036Wash ington , DC 20036Wash ington , DC 20036
202 .496 .9870 FAX 202 .496 .9877 202 .496 .9870 FAX 202 .496 .9877 202 .496 .9870 FAX 202 .496 .9877 202 .496 .9870 FAX 202 .496 .9877 www.econr es . com www.econr es . com www.econr es . com www.econr es . com
L os Ange le s San F ranc i s co S an Di ego Los Ange le s San F ranc i s co S an Di ego Los Ange le s San F ranc i s co S an Di ego Los Ange le s San F ranc i s co S an Di ego
Ch i cago Wash i ngton DC London New YorkCh icago Wash i ngton DC London New YorkCh icago Wash i ngton DC London New YorkCh icago Wash i ngton DC London New York
Project Report
Lake Houston Park Master Plan
Opportunities Analysis
Prepared for
SWA Group
Houston, Texas
Submitted by
Economics Research AssociatesEconomics Research AssociatesEconomics Research AssociatesEconomics Research Associates
October 2008October 2008October 2008October 2008
ERA Project No. ERA Project No. ERA Project No. ERA Project No. 17810178101781017810

Economics Research AssociatesEconomics Research AssociatesEconomics Research AssociatesEconomics Research Associates Project No.17810Project No.17810Project No.17810Project No.17810 Page Page Page Page 1111
Table of Contents
I.I.I.I. IntroductionIntroductionIntroductionIntroduction ........................................................................................................................................................................................................................................................................................................................................................................................................................5555 II.II.II.II. Site AnalysisSite AnalysisSite AnalysisSite Analysis ........................................................................................................................................................................................................................................................................................................................................................................................................................6666
Climate Analysis ................................................................................................... 8 Current Operations ............................................................................................... 9
III.III.III.III. Evaluation of Available MarketsEvaluation of Available MarketsEvaluation of Available MarketsEvaluation of Available Markets....................................................................................................................................................................................................................................................................................................14141414 Resident Market.................................................................................................. 14 Tourist Market .................................................................................................... 17
IV.IV.IV.IV. Assessment of Complementary and Competitive AttractionsAssessment of Complementary and Competitive AttractionsAssessment of Complementary and Competitive AttractionsAssessment of Complementary and Competitive Attractions............................................................................................................................19191919 Regional Parks .................................................................................................... 20 RV Parks ............................................................................................................. 22 Equestrian Facilities ............................................................................................ 25
V.V.V.V. Identification of ComparablIdentification of ComparablIdentification of ComparablIdentification of Comparables/Development Modelses/Development Modelses/Development Modelses/Development Models ........................................................................................................................................................................26262626 Resort State Parks ............................................................................................... 26 Other Lodging .................................................................................................... 35 Equestrian .......................................................................................................... 36 Conference Facilities ........................................................................................... 37 Waterparks ......................................................................................................... 39
VI.VI.VI.VI. InitialInitialInitialInitial Development Program Development Program Development Program Development Program ................................................................................................................................................................................................................................................................................................................40404040 Preferred Uses .................................................................................................... 40 Development Program......................................................................................... 43 Phase I Financial Analysis .................................................................................... 43
VII.VII.VII.VII. AppendicesAppendicesAppendicesAppendices ....................................................................................................................................................................................................................................................................................................................................................................................................................48484848 Field Notes- Kick-Off Meeting and Stakeholder Interviews................................... 48 Supporting Tables............................................................................................... 57 Presentation- Opportunities Analysis .................................................................. 64
Economics Research AssociatesEconomics Research AssociatesEconomics Research AssociatesEconomics Research Associates Project No.17810Project No.17810Project No.17810Project No.17810 Page Page Page Page 2222
Index of Tables/Figures
Table 1: Average Morning and Afternoon Relative Humidity and Temperatures, Houston,
TX ........................................................................................................................ 8 Table 2: Average Cloud Coverage and Rainfall by Month, Houston, TX, 2003-2008...... 9 Table 3: Current Park Offerings ................................................................................. 10 Table 4: Average Monthly Visitation, Lake Houston State Park, 1997-2001................. 12 Table 5: Overnight Visitation, Lake Houston State Park, 1997-2001.......................... 12 Table 6: Total Revenue, Fiscal Years 2002-2005, Lake Houston State Park ................. 13 Table 7: Population Projections, 2000-2030 .............................................................. 15 Table 8: Age and Income Distribution, 2007 .............................................................. 16 Table 9: Resident Market, Outdoor Participation......................................................... 17 Table 10: Regional Park, 0-120 Miles ........................................................................ 21 Table 11: Comparable Park Characteristics, 0-60 Miles.............................................. 22 Table 12: RV Parks by Amenities, within 50 Miles....................................................... 24 Table 13: RV Campgrounds with Cabin Rentals .......................................................... 24 Table 14: Equestrian Facilities ................................................................................... 25 Table 15: General Operating Information, Comparable Resort State Parks,.................. 27 Table 16: Comparable Development Models .............................................................. 28 Table 17: Lodging ..................................................................................................... 29 Table 18: Park Operating Budgets.............................................................................. 29 Table 19: Financials................................................................................................... 37 Table 20: Rentals ...................................................................................................... 37 Table 21: Matrix Evaluation ....................................................................................... 42 Table 22: Summary Illustrative Economics ................................................................. 44 Table 23: Lake Houston Park, Core Operations, Phase I .............................................. 45 Table 24: Illustrative Economics, Lake Houston Park - Phase I RV Campground .......... 46 Table 25: Illustrative Economics, Lake Houston Park - Phase I Cabins......................... 47 Table 26: Algonkian Regional Park, Staffing ............................................................... 57 Table 27: Algonkian Regional Park, Annual Budget .................................................... 57 Table 28: Algonkian Operating Performance .............................................................. 58
Figure 1: Average Monthly Visitation, Lake Houston State Park, 1997-2001 ............... 11 Figure 2: Regional Parks ............................................................................................ 20 Figure 3: Regional RV Parks ....................................................................................... 23 Figure 4: Typical Cabin, Tims Ford State Park............................................................. 32 Figure 5: Tims Ford Conference Center, Floor Plan..................................................... 33
Economics Research AssociatesEconomics Research AssociatesEconomics Research AssociatesEconomics Research Associates Project No.17810Project No.17810Project No.17810Project No.17810 Page Page Page Page 3333
Figure 6: Algonkian Regional Park ............................................................................. 60 Figure 7: Tims Ford State Park ................................................................................... 61 Figure 8: Oak Mountain State Park ............................................................................. 63

Economics Research AssociatesEconomics Research AssociatesEconomics Research AssociatesEconomics Research Associates Project No.17810Project No.17810Project No.17810Project No.17810 Page Page Page Page 4444
General & Limiting Conditions
Every reasonable effort has been made to ensure that the data contained in this report are
accurate as of the date of this study; however, factors exist that are outside the control of
Economics Research Associates and that may affect the estimates and/or projections noted herein.
This study is based on estimates, assumptions and other information developed by Economics
Research Associates from its independent research effort, general knowledge of the industry, and
information provided by and consultations with the client and the client's representatives. No
responsibility is assumed for inaccuracies in reporting by the client, the client's agent and
representatives, or any other data source used in preparing or presenting this study.
This report is based on information that was current as of October 2008 and Economics Research
Associates has not undertaken any update of its research effort since such date.
Because future events and circumstances, many of which are not known as of the date of this
study, may affect the estimates contained therein, no warranty or representation is made by
Economics Research Associates that any of the projected values or results contained in this study
will actually be achieved.
Possession of this study does not carry with it the right of publication thereof or to use the name of
"Economics Research Associates" in any manner without first obtaining the prior written consent of
Economics Research Associates. No abstracting, excerpting or summarization of this study may be
made without first obtaining the prior written consent of Economics Research Associates. This
report is not to be used in conjunction with any public or private offering of securities, debt,
equity, or other similar purpose where it may be relied upon to any degree by any person other
than the client, nor is any third party entitled to rely upon this report, without first obtaining the
prior written consent of Economics Research Associates. This study may not be used for purposes
other than that for which it is prepared or for which prior written consent has first been obtained
from Economics Research Associates.
This study is qualified in its entirety by, and should be considered in light of, these limitations,
conditions and considerations.

Economics Research AssociatesEconomics Research AssociatesEconomics Research AssociatesEconomics Research Associates Project No.17810Project No.17810Project No.17810Project No.17810 Page Page Page Page 5555
I. Introduction
Lake Houston State Park was originally established in 1981 when the state of Texas purchased over
4,700 acres from Champion Paper Company and, in 1990, added an additional 200 acres from a
local Girl Scout Troop. The new property included the scouts’ campsites, lodges, and equestrian
facilities. The park was opened to the public for day use in 1992, with overnight camping
instituted in 1995. In 2006, the park was transferred to the Houston Parks and Recreation
Department. At that point in time, the name was changed to Lake Houston Park.
Lake Houston Park represents a unique opportunity for the City of Houston and Houston Parks and
Recreation Department. Given its size, physical characteristics, and location in an underserved
and growing part of the greater Houston region, the park has the potential to be a model for park
development. With this potential in mind, the objectives established for Lake Houston Park
include financial self sufficiency and sensitivity to the environment.
Economics Research Associates (ERA) was retained as a member of the consultant team led by SWA
Group to prepare a Master Plan for the future of Lake Houston Park. ERA’s primary role has been
to identify the uses that would enable the park to achieve financial self sufficiency. As part of its
work, ERA conducted a comprehensive analysis of recreational opportunities in the greater Houston
market and undertook research on best practice recreational development in parks around the
country. ERA also worked with the client, local stakeholders, and the SWA team to consider the
full range of possibilities for the park. This report presents the findings of ERA’s research and
analysis.
Economics Research AssociatesEconomics Research AssociatesEconomics Research AssociatesEconomics Research Associates Project No.17810Project No.17810Project No.17810Project No.17810 Page Page Page Page 6666
II. Site Analysis
Lake Houston Park is located in New Caney, Texas, approximately 30 minutes north of the Houston
city limits. The Park is within Houston’s extra-territorial jurisdiction, and overlaps the line
between Harris and Montgomery Counties. The Park’s 4,900 acres surround the intersection of
Caney Creek and the East Fork of the San Jacinto River. While the site’s proximity to the large
population base of metropolitan Houston is a strong asset, there are a number of site-related issues
to be considered in planning for the Park’s future use.
AccessAccessAccessAccess and Visibility and Visibility and Visibility and Visibility
Access to New Caney from the Greater Houston area is via U.S. Route 59, which Houstonians report
is one of the area’s least congested routes. Current construction will further ease highway access
and traffic. However, access to the Park off of U.S. Route 59 is difficult. Access from the highway
requires a number of turns to get to Route 1485, then a turn off to Baptist Encampment Road,
which is a narrow and winding rural road, surrounded by low to moderate income residential
development. The site is not visible from any major thoroughfares. In addition, signage to the
park from the highway and major roads is poor.
Proximity to Complementary AttractionsProximity to Complementary AttractionsProximity to Complementary AttractionsProximity to Complementary Attractions
The surrounding area offers few attractions for tourists or residents. However, a 150-acre mixed-
use development is planned for New Caney, along Caney Creek, just north of the intersection of
FM1485 and U.S. Route 59. Publicly, plans for EarthQuest call for a theme park, a $50 million
institute/museum, four hotels, a visitor center, retail, mixed use outlet shops, a waterpark, family
entertainment center, and town center residential developments. EarthQuest will be an entirely
green facility; the museum will have wind turbines on the roof and will generate its own
electricity. Total development is estimated to be $1.5 billion. County officials report that the
complex (not including the retail) is expecting between 2-2.5 million annual visitors, with an
average stay of two days.
Phase 1 of the project is scheduled to include the theme park and two hotels— a 400-room
boutique, Great Wolf style property and a 350 room-property, also themed. A 2012 grand opening
is expected.
Economics Research AssociatesEconomics Research AssociatesEconomics Research AssociatesEconomics Research Associates Project No.17810Project No.17810Project No.17810Project No.17810 Page Page Page Page 7777
Local and state government has shown strong support for EarthQuest. Texas legislature approved
funding to allow venue tax, admission, etc. The addition of a development of this magnitude to
the area could significantly alter the region and the market. New Caney could become a major
gateway for visitors to the attraction and other attractions and amenities could be created to
capitalize on EarthQuest traffic.
Proximity to Visitor ServicesProximity to Visitor ServicesProximity to Visitor ServicesProximity to Visitor Services and Characteristics of Adjacent Developmentand Characteristics of Adjacent Developmentand Characteristics of Adjacent Developmentand Characteristics of Adjacent Development
Visitor services near the park are currently limited. There is a gas station at the entrance to
Baptist Encampment Road, but most visitor services are located at the exit from U.S. Route 59.
These services are primarily limited to fast food and gas stations, with limited retail. Recent
legislation allowing the sales of alcoholic beverages in Montgomery County has led to an increase in
restaurants countywide, but the effects of this have not yet been seen in the property surrounding
the park. The proposed Earth Quest attraction could spur an increase in visitor amenities nearby.
The surrounding neighborhood is primarily residential, with low to moderate income families.
Some residences are poorly maintained. However, the area is changing, with new retail and
restaurant development occurring at many intersections along U.S. Route 59. Visitor services are
anticipated to improve with five hotels planned for the area. The larger area has seen significant
residential and industrial development, attracted by lower land values and proximity to Bush
Intercontinental Airport
Economics Research AssociatesEconomics Research AssociatesEconomics Research AssociatesEconomics Research Associates Project No.17810Project No.17810Project No.17810Project No.17810 Page Page Page Page 8888
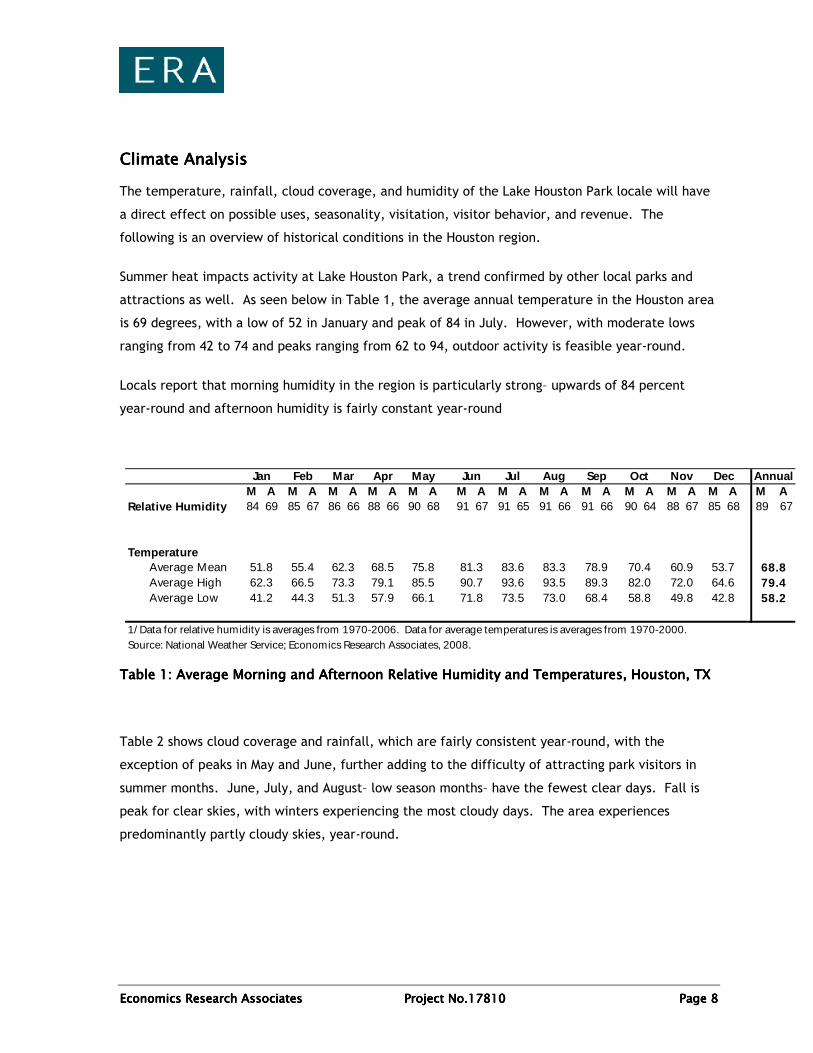
Climate AnalysisClimate AnalysisClimate AnalysisClimate Analysis
The temperature, rainfall, cloud coverage, and humidity of the Lake Houston Park locale will have
a direct effect on possible uses, seasonality, visitation, visitor behavior, and revenue. The
following is an overview of historical conditions in the Houston region.
Summer heat impacts activity at Lake Houston Park, a trend confirmed by other local parks and
attractions as well. As seen below in Table 1, the average annual temperature in the Houston area
is 69 degrees, with a low of 52 in January and peak of 84 in July. However, with moderate lows
ranging from 42 to 74 and peaks ranging from 62 to 94, outdoor activity is feasible year-round.
Locals report that morning humidity in the region is particularly strong– upwards of 84 percent
year-round and afternoon humidity is fairly constant year-round
Table Table Table Table 1111: : : : Average Morning and Afternoon Relative Humidity and Temperatures, Houston, TXAverage Morning and Afternoon Relative Humidity and Temperatures, Houston, TXAverage Morning and Afternoon Relative Humidity and Temperatures, Houston, TXAverage Morning and Afternoon Relative Humidity and Temperatures, Houston, TX
Table 2 shows cloud coverage and rainfall, which are fairly consistent year-round, with the
exception of peaks in May and June, further adding to the difficulty of attracting park visitors in
summer months. June, July, and August– low season months– have the fewest clear days. Fall is
peak for clear skies, with winters experiencing the most cloudy days. The area experiences
predominantly partly cloudy skies, year-round.
M A M A M A M A M A M A M A M A M A M A M A M A M ARelative Humidity 84 69 85 67 86 66 88 66 90 68 91 67 91 65 91 66 91 66 90 64 88 67 85 68 89 67
TemperatureAverage MeanAverage HighAverage Low
1/ Data for relative humidity is averages from 1970-2006. Data for average temperatures is averages from 1970-2000.Source: National Weather Service; Economics Research Associates, 2008.
AnnualSep Oct Nov DecMay Jun Jul AugJan Feb Mar Apr
51.862.341.2
55.466.544.3
62.373.351.3
68.579.157.9
75.885.566.1
81.390.771.8
83.693.673.5
83.393.573.0
78.989.368.4
70.482.058.8
68.879.458.2
60.972.049.8
53.764.642.8

Economics Research AssociatesEconomics Research AssociatesEconomics Research AssociatesEconomics Research Associates Project No.17810Project No.17810Project No.17810Project No.17810 Page Page Page Page 9999
Table Table Table Table 2222: : : : Average Cloud Coverage and Rainfall by Month, Houston, TX, 2003Average Cloud Coverage and Rainfall by Month, Houston, TX, 2003Average Cloud Coverage and Rainfall by Month, Houston, TX, 2003Average Cloud Coverage and Rainfall by Month, Houston, TX, 2003----2008200820082008
Current OperationsCurrent OperationsCurrent OperationsCurrent Operations
While Lake Houston State Park was originally opened to the public for day use in 1992, it has only
been operated by Houston Parks and Recreation since 2006, when the park was transferred to the
Department from Texas Parks and Wildlife, and its name was changed to Lake Houston Park. While
there has been a limited record-keeping regarding current operations, ERA received information via
historic records of the park’s operations, as well as interviews with park management and Houston
Parks and Recreation.
Park OfferingsPark OfferingsPark OfferingsPark Offerings
Table 3, below, offers a summary of amenities and offerings currently available at Lake Houston
Park. Limited changes have been made to the park since its takeover by Houston Parks and
Recreation. However, there are plans to replace the little-used equestrian campground with more
traditional camping. Campsites and the nature center have been improved.
Jan Feb Mar Apr May Jun Jul Aug Sep Oct Nov Dec AnnualClear Skies 6.4 5.6 4.8 5.6 4.8 3.8 2.2 1.6 6.8 11.2 8.6 7.0 68.4Partly Cloudy 8.4 8.2 13.8 14.2 15.8 19.6 22.4 25.8 16.8 13.8 12.4 13.0 184.2Cloudy 16.2 14.6 12.4 10.2 10.4 6.6 6.4 3.6 6.4 6.0 9.0 11.0 112.8Total (Days) 31.0 28.4 31.0 30.0 31.0 30.0 31.0 31.0 30.0 31.0 30.0 31.0 365.4
Average Rainfall (Inches) 3.7 3.0 3.4 3.6 5.2 5.4 3.2 3.8 4.3 4.5 4.2 3.7 47.8
Source: National Weather Service; Economics Research Associates, May 2008.

Economics Research AssociatesEconomics Research AssociatesEconomics Research AssociatesEconomics Research Associates Project No.17810Project No.17810Project No.17810Project No.17810 Page Page Page Page 10101010
Table Table Table Table 3333: Current Park Offerings: Current Park Offerings: Current Park Offerings: Current Park Offerings
VisitationVisitationVisitationVisitation
As discussed previously, extreme summer temperatures adversely affect summer visitation, with a
valley in visitation in summer months.
Campsites Lodges24 - Walk in campsites 2 - Group lodge facilit ies1 - Group tent campsite 1 - Day use dining hall facility2 - Primit ive sites2 - Overf low tent campsites1 - Primit ive equest rian campsite
Trails Restrooms10 - Miles of equestrian t rails 1 - Rest room with shower12 - Miles of hike and bike t rails 3 - Portable toilets1 - Mile nature t rail
Pavillions Other Facilities2 - Day use picnic pavillions 1 - Equest rian stable area4 - Campsite picnic pavillions 1 - Park staf f residence1 - Day use picnic area w ith playground 18 - Hunt Blinds (Wooden St ructures)
3 - Boardwalks

Economics Research AssociatesEconomics Research AssociatesEconomics Research AssociatesEconomics Research Associates Project No.17810Project No.17810Project No.17810Project No.17810 Page Page Page Page 11111111
Figure Figure Figure Figure 1111: Average Monthly Visitation, Lake Houston State Park, 1997: Average Monthly Visitation, Lake Houston State Park, 1997: Average Monthly Visitation, Lake Houston State Park, 1997: Average Monthly Visitation, Lake Houston State Park, 1997----2001200120012001
However, as seen below in Table 4, as an overall percentage of annual visitation, both day and
overnight visits have shown a trend towards reduced seasonality, with fewer peaks and valleys in
visitation, and year-round use increasing. From 1997-200, overall visitation ranged from 46,000 to
65,000. However, there is no discernable trend in visitation.
Average Monthly Visitation, Lake Houston State Park, 1997-2001
0
1,000
2,000
3,000
4,000
5,000
6,000
7,000
Jan
Mar
May Ju
lSep Nov
Month
Vis
ito
rs
Average MonthlyVisitation, LakeHouston State Park,1997-2001

Economics Research AssociatesEconomics Research AssociatesEconomics Research AssociatesEconomics Research Associates Project No.17810Project No.17810Project No.17810Project No.17810 Page Page Page Page 12121212
TablTablTablTable e e e 4444: Average Monthly Visitation, Lake Houston State Park, 1997: Average Monthly Visitation, Lake Houston State Park, 1997: Average Monthly Visitation, Lake Houston State Park, 1997: Average Monthly Visitation, Lake Houston State Park, 1997----2001200120012001
Table Table Table Table 5555: Overnight Visitation, Lake Houston State Park, 1997: Overnight Visitation, Lake Houston State Park, 1997: Overnight Visitation, Lake Houston State Park, 1997: Overnight Visitation, Lake Houston State Park, 1997----2001200120012001
Operating FinancialsOperating FinancialsOperating FinancialsOperating Financials
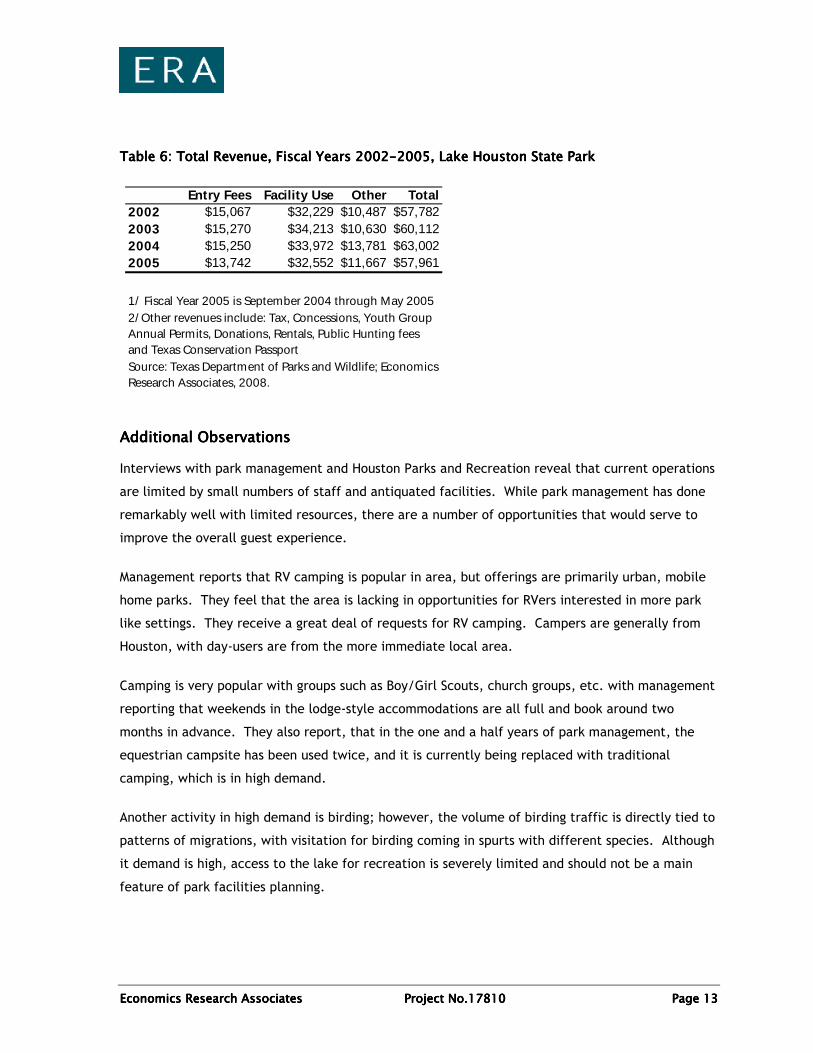
Table 6 presents the latest available operating revenues for Lake Houston Park. Facility use
typically represents around half of total earned revenues, indicating that proper operation and
continued upkeep of park facilities will be an important consideration in future planning and
budgeting.
1997 1998 1999 2000 2001 AverageJan 4,058 3,259 5,177 4,042 4,761 4,259Feb 3,405 3,441 6,441 4,927 4,853 4,613Mar 5,076 5,306 5,796 6,518 7,192 5,978Apr 1,661 4,876 5,796 8,993 6,486 5,562May 2,741 4,445 7,051 5,930 6,473 5,328Jun 2,007 3,861 5,810 4,902 4,527 4,221Jul 6,261 1,922 3,843 5,275 5,277 4,516Aug 5,035 2,359 4,382 4,859 3,149 3,957Sep 6,257 4,746 3,812 5,682 5,422 5,184Oct 3,345 5,173 3,640 6,035 5,549 4,748Nov 6,660 4,505 3,700 4,155 2,814 4,367Dec 4,694 2,244 3,689 3,895 3,303 3,565Annual 51,199 46,134 59,135 65,213 59,807 56,297Source: Texas Department of Parks and Wildlife
Overnight Visitation, Lake Houston State Park, 1997-2001
1997 1998 1999 2000 2001January 3% 0% 0% 5% 10%February 0% 9% 9% 8% 11%March 4% 0% 16% 11% 16%April 0% 0% 0% 13% 18%May 0% 0% 0% 5% 14%June 0% 0% 0% 7% 9%July 0% 0% 5% 3% 6%August 0% 0% 0% 2% 2%September 0% 0% 0% 17% 8%October 7% 0% 20% 24% 16%November 5% 0% 0% 23% 14%December 5% 1% 0% 17% 19%Annual 2% 1% 4% 12% 12%Source: Texas Department of Parks and Wildlife
Economics Research AssociatesEconomics Research AssociatesEconomics Research AssociatesEconomics Research Associates Project No.17810Project No.17810Project No.17810Project No.17810 Page Page Page Page 13131313
Table Table Table Table 6666: : : : Total Revenue, Fiscal Years 2002Total Revenue, Fiscal Years 2002Total Revenue, Fiscal Years 2002Total Revenue, Fiscal Years 2002----2005, Lake Houston State Park2005, Lake Houston State Park2005, Lake Houston State Park2005, Lake Houston State Park
Additional ObservationsAdditional ObservationsAdditional ObservationsAdditional Observations
Interviews with park management and Houston Parks and Recreation reveal that current operations
are limited by small numbers of staff and antiquated facilities. While park management has done
remarkably well with limited resources, there are a number of opportunities that would serve to
improve the overall guest experience.
Management reports that RV camping is popular in area, but offerings are primarily urban, mobile
home parks. They feel that the area is lacking in opportunities for RVers interested in more park
like settings. They receive a great deal of requests for RV camping. Campers are generally from
Houston, with day-users are from the more immediate local area.
Camping is very popular with groups such as Boy/Girl Scouts, church groups, etc. with management
reporting that weekends in the lodge-style accommodations are all full and book around two
months in advance. They also report, that in the one and a half years of park management, the
equestrian campsite has been used twice, and it is currently being replaced with traditional
camping, which is in high demand.
Another activity in high demand is birding; however, the volume of birding traffic is directly tied to
patterns of migrations, with visitation for birding coming in spurts with different species. Although
it demand is high, access to the lake for recreation is severely limited and should not be a main
feature of park facilities planning.
Entry Fees Facility Use Other Total2002 $15,067 $32,229 $10,487 $57,7822003 $15,270 $34,213 $10,630 $60,1122004 $15,250 $33,972 $13,781 $63,0022005 $13,742 $32,552 $11,667 $57,961
2/ Other revenues include: Tax, Concessions, Youth Group Annual Permits, Donations, Rentals, Public Hunting fees and Texas Conservation Passport
1/ Fiscal Year 2005 is September 2004 through May 2005
Source: Texas Department of Parks and Wildlife; Economics Research Associates, 2008.

Economics Research AssociatesEconomics Research AssociatesEconomics Research AssociatesEconomics Research Associates Project No.17810Project No.17810Project No.17810Project No.17810 Page Page Page Page 14141414
III. Evaluation of Available Markets
Attendance potential for a park is a function of numerous factors including the resident and tourist
market size and characteristics; the quality and scale of the proposed park; market proximity and
level of competition; and a number of other factors. Market factors define the basis from which
attendance potential is derived, while the scope and quality of the park determines the drawing
power of the facility.
Resident MaResident MaResident MaResident Marketrketrketrket
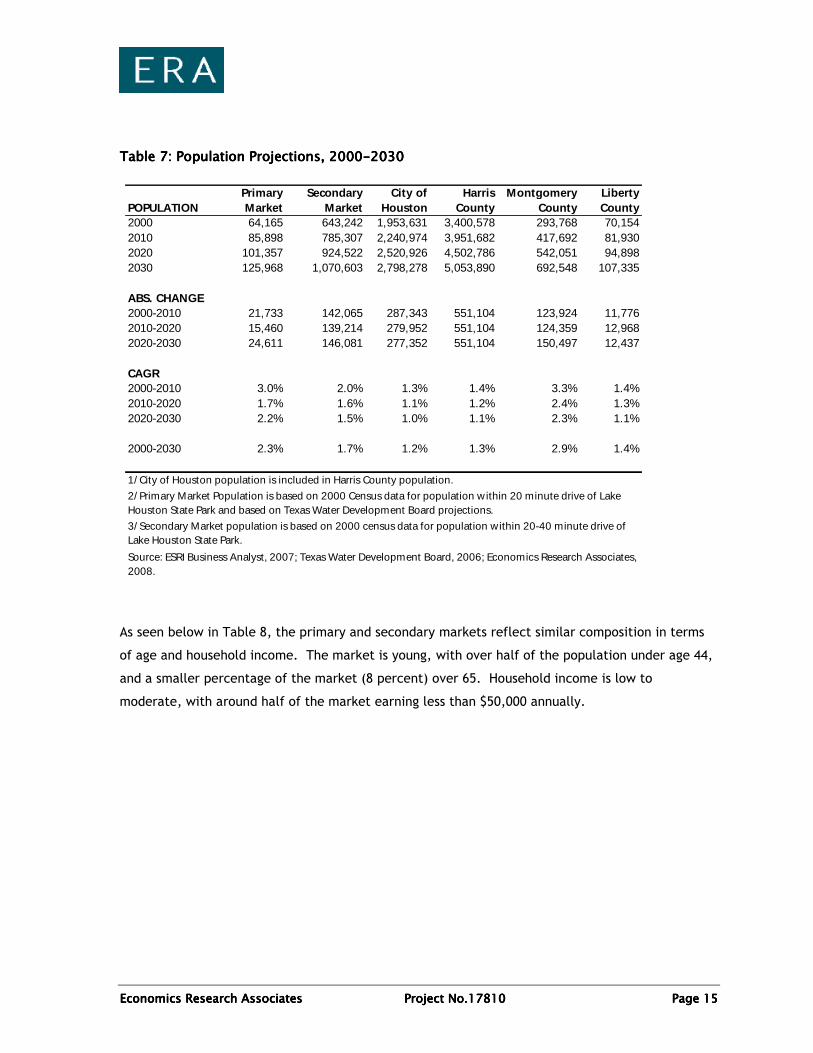
ERA determined the primary market for Lake Houston Park to be the residents within a 20 minute
drive time of the park. The secondary market is the population within a 20-40 minute drive.
Population estimates for the City of Houston, Harris County, Montgomery County, and Liberty
County are presented for comparison. The rate of growth in the primary market from 2000-2030
outpaces that of the region, with the largest increases seen from 2000-2010. Growth in the
remainder of Montgomery County is anticipated to remain strong from 2010-2030.
Economics Research AssociatesEconomics Research AssociatesEconomics Research AssociatesEconomics Research Associates Project No.17810Project No.17810Project No.17810Project No.17810 Page Page Page Page 15151515
Table Table Table Table 7777: Population Projections, 2000: Population Projections, 2000: Population Projections, 2000: Population Projections, 2000----2030203020302030
As seen below in Table 8, the primary and secondary markets reflect similar composition in terms
of age and household income. The market is young, with over half of the population under age 44,
and a smaller percentage of the market (8 percent) over 65. Household income is low to
moderate, with around half of the market earning less than $50,000 annually.
POPULATIONPrimary Market
Secondary Market
City of Houston
Harris County
Montgomery County
Liberty County
2000 64,165 643,242 1,953,631 3,400,578 293,768 70,1542010 85,898 785,307 2,240,974 3,951,682 417,692 81,9302020 101,357 924,522 2,520,926 4,502,786 542,051 94,8982030 125,968 1,070,603 2,798,278 5,053,890 692,548 107,335
ABS. CHANGE2000-2010 21,733 142,065 287,343 551,104 123,924 11,7762010-2020 15,460 139,214 279,952 551,104 124,359 12,9682020-2030 24,611 146,081 277,352 551,104 150,497 12,437
CAGR2000-2010 3.0% 2.0% 1.3% 1.4% 3.3% 1.4%2010-2020 1.7% 1.6% 1.1% 1.2% 2.4% 1.3%2020-2030 2.2% 1.5% 1.0% 1.1% 2.3% 1.1%
2000-2030 2.3% 1.7% 1.2% 1.3% 2.9% 1.4%
1/ City of Houston population is included in Harris County population.
Source: ESRI Business Analyst, 2007; Texas Water Development Board, 2006; Economics Research Associates, 2008.
2/ Primary Market Population is based on 2000 Census data for population w ithin 20 minute drive of Lake Houston State Park and based on Texas Water Development Board projections.
3/ Secondary Market population is based on 2000 census data for population within 20-40 minute drive of Lake Houston State Park.

Economics Research AssociatesEconomics Research AssociatesEconomics Research AssociatesEconomics Research Associates Project No.17810Project No.17810Project No.17810Project No.17810 Page Page Page Page 16161616
Table Table Table Table 8888: Age and Income Distribution, 2007: Age and Income Distribution, 2007: Age and Income Distribution, 2007: Age and Income Distribution, 2007
Table 9 below illustrates the rates of participation in outdoor sports among particular age cohorts,
as applied to the population in the Houston market. Based on these patterns of participation
fishing, hiking, bicycling, and camping are the most popular activities. However, strong growth is
being seen in trail running and canoeing, two possible areas of activity for the Park.
AGE BY MARKET Population % Population % Population % Population % TotalPrimary Market 30,826 39% 21,808 27% 20,244 26% 6,497 8% 79,375 Secondary Market 302,506 40% 224,394 30% 171,484 23% 57,285 8% 755,669
Total 333,332 40% 246,202 29% 191,728 23% 63,782 8% 835,044
INCOME BY MARKET Households % Households % Households % Households % TotalPrimary Market 12,398 45% 9,996 36% 3,815 14% 1,359 5% 27,568 Secondary Market 127,972 53% 73,221 30% 26,252 11% 14,480 6% 241,925
Total 140,370 52% 83,217 31% 30,067 11% 15,839 6% 269,493
1/ Primary Market is population w ithin 20 minute drive of Lake Houston State Park.2/ Secondary Market is population within 20-40 minute drive of Lake Houston State Park.Source: ESRI Business Analyst, 2007; Economics Research Associates, 2008.
0-24 25-44 45-64 65+
$50,000-99,999 $100,000-149,999 $150,000+$0-49,999

Economics Research AssociatesEconomics Research AssociatesEconomics Research AssociatesEconomics Research Associates Project No.17810Project No.17810Project No.17810Project No.17810 Page Page Page Page 17171717
Table Table Table Table 9999: Resident Market, Outdoor Pa: Resident Market, Outdoor Pa: Resident Market, Outdoor Pa: Resident Market, Outdoor Participationrticipationrticipationrticipation
Tourist MarketTourist MarketTourist MarketTourist Market
Tourism to the area surrounding Lake Houston Park is measured by the State of Texas Tourism
Office based on visitation to the Houston-Baytown-Sugar Land MSA, which contains the following
counties: Austin, Brazoria, Chambers, Fort Bend, Galveston, Harris, Liberty, Montgomery, San
Jacinto and Waller. The annual number of Person-Days to the Houston-Baytown-Sugarland MSA was
estimated at 34.4 million; and for the larger Gulf Coast Region at 77.9 million Person-Days
Of these, Texans generated almost two-thirds (62 percent) of total Person-Days. Leisure travel
represented 74 percent of travel Person-Days to the MSA—Non-Vacation produced 54 percent, while
Vacation accounted for 19 percent of Person-Days. Visiting Friends and Relatives was the single
most important reason for visiting the MSA, accounting for 34 percent of Person- Days.
Visitors to the Houston-Baytown-Sugarland MSA participated in the following activities: Touring (20
percent), Attractions (19 percent), Nature (14 percent), Culture (15 percent), and Outdoor Sports
(6 percent).
As evidenced by this, and interviews with Houston Tourism, outdoor recreation and camping are
not major hooks for Houston tourism. However, they report that European and Asian tourists are
Incidence of Houston Area ParticipationParticipation Participant Incidence %
Among Americans Population Change -16 and Older in 2004 (Millions) 2004 vs.1998
Fishing (Non-Fly) 34.5% 1,419,370 NA Hiking 33.9% 1,394,685 -1.2%Bicycling (Mountain Biking) 23.0% 946,246 -4.2%Car Camping 22.0% 905,105 -17.9%Trail Running 17.8% 732,312 20.3%Canoeing 10.0% 411,412 16.3%Fly Fishing 8.2% 337,357 NA Camping (Away f rom Car) 7.9% 325,015 8.2%Bird Watching 6.8% 279,760 NA Backpacking 6.0% 246,847 -23.1%Raft ing 4.3% 176,907 -6.5%Kayaking (Non-Whitewater) 4.3% 176,907 NA Kayaking - Recreat ion/Sit -on-Top 3.3% 135,766 NA Climbing - Natural Rock 2.1% 86,396 -12.5%Source: America Outdoors, ESRI, Economics Research Associates, June 2008.
Economics Research AssociatesEconomics Research AssociatesEconomics Research AssociatesEconomics Research Associates Project No.17810Project No.17810Project No.17810Project No.17810 Page Page Page Page 18181818
always interested in camping, and bargain facilities. They also felt that Canadians and visitors
from the Northern United States in RVs are a good market for the Park. They spend less, and
generally go to the Southern part of the state near Mexico, but could be enticed to the Houston
region if attractive facilities existed.
Houston tourism reports that Austin and West Texas (Big Bend) have done well capitalizing on
budget and outdoor travelers. While Houston has no ecotourism offering, the newly-renovated
Buffalo Bayou has been a draw, and they feel that this market could grow. There are currently no
campgrounds or accommodations that are promoted for hiking/biking and they feel that visitors
would be willing to take a one day trip to hike or bike (both casual and serious).
Winter TexansWinter TexansWinter TexansWinter Texans
Winter Texans, typically retirees from the rest of North America who come south for the winter
represent approximately 1.7 million annual visitors statewide. Galveston and McAllen are the
prominent Winter Texan communities, but the population is diversifying geographically. A study of
Winter Texan visits to the Rio Grande Valley by University of Texas- Pan American, the typical
Winter Texan is married, Caucasian, from the Midwest, has been retired for more than one year,
has a high school diploma or some college, has an annual median income of approximately $45,472,
and is 68.7 years old.
While in Texas, many live in an RV or motor home that they own, and stay an average of 4.1
months. Their reported top activities include flea markets, visiting sites in Mexico, the beach, and
festivals. Despite gas prices, local RV parks reported steady and strong business, and report that
the weak American dollar improves Canadian traffic. This is potentially a strong market for Lake
Houston Park, if facilities that catered to this crowd were to be developed.

Economics Research AssociatesEconomics Research AssociatesEconomics Research AssociatesEconomics Research Associates Project No.17810Project No.17810Project No.17810Project No.17810 Page Page Page Page 19191919
IV. Assessment of Complementary and Competitive
Attractions
Previously considered a predominantly rural area, East Montgomery County is experiencing rapid
development.
The Eastern Montgomery County Improvement District (EMCID) is a unique structure created by the
Texas Legislature in 1997, and has been instrumental in attracting development to the region. The
district has worked to recruit new business by offering incentives such as work force training,
infrastructure improvements, relocation allowances, and tax abatement incentives.
An industrial park in New Caney is home to a Wal-Mart distribution center and is attracting
additional industrial companies. Several new industrial companies, many related to the oil industry
have recently opened, begun construction, or finalized deals to relocate in the County.
Local officials report that in addition to the new industrial development, new residents are being
attracted by the area's quality of life, good schools, proximity to U.S. Route 59 and Bush
Intercontinental Airport.
According to Metrostudy, a Houston-based housing research firm, home sales in the County have
increased from 300 homes per year to 600 to 700 homes per year in the past three to four years.
Growth has also been fueled by the County’s 2004 conversion to a “wet area.” In 2004, residents
passed a measure allowing restaurants to sell liquor by the glass and grocery stores to sell beer and
wine, which has fueled an increase in restaurants, bars, and other amenities for residents and
visitor.
Developers report that the Eastern portion of Montgomery County still has many areas of
undeveloped land, which is rare in the Houston market. In addition, prices are relatively cheap
compared to land in other nearby Houston areas. In a recent newspaper article, Precinct 4
Commissioner Ed Rinehart reported that two years ago, property sold for 75 cents to $1.25 per
square foot, and it is now it's selling for $3 to $4 a square foot. He also reported that property on
FM 1314 has sold for as much as $16 a square foot.
In order to improve the flow of traffic from the County to Houston, U.S. Route 59 and FM 1314 are
being widened, and similar efforts will soon start on FM 1485. The planned Grand Parkway— an
outer beltway surrounding Houston—is expected to cut through east county and county
Economics Research AssociatesEconomics Research AssociatesEconomics Research AssociatesEconomics Research Associates Project No.17810Project No.17810Project No.17810Project No.17810 Page Page Page Page 20202020
commissioners are exploring the possibility of building a toll road that would extend from the
Harris County Toll Road to Texas 242.
New development of retail and restaurants are taking place at many of the intersections along U.S.
Route 59, with five new hotels having begun or slated to begin construction this spring.
Regional ParksRegional ParksRegional ParksRegional Parks
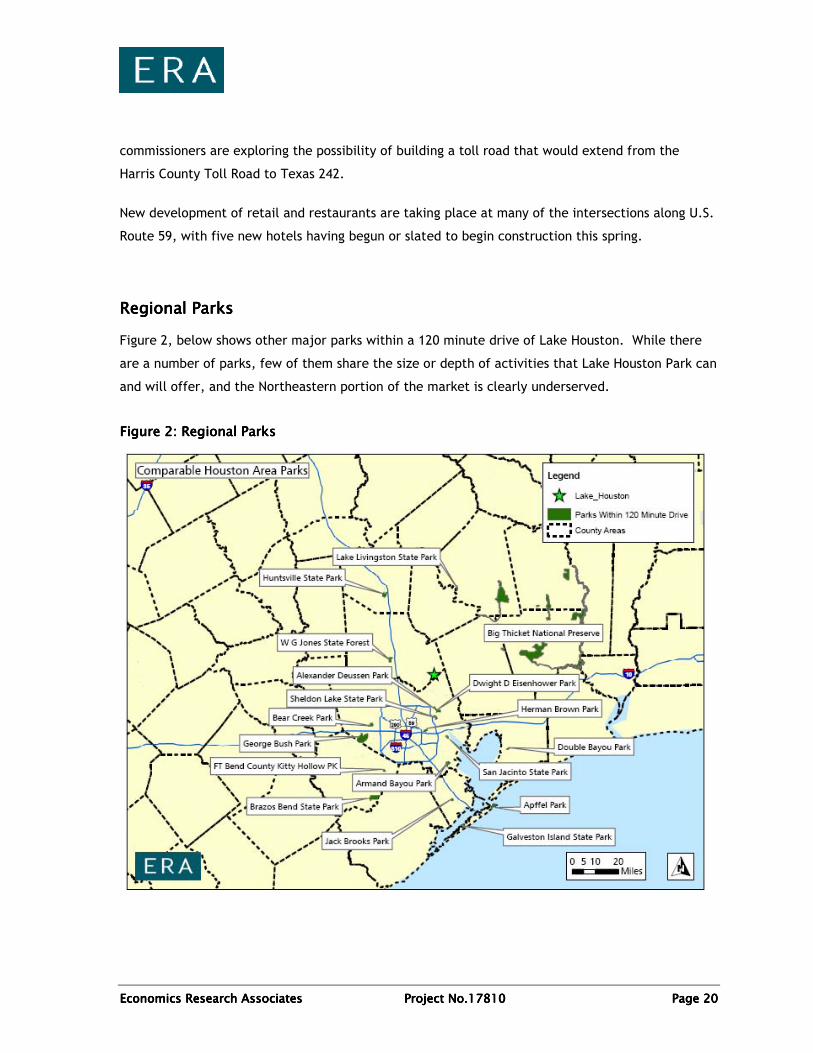
Figure 2, below shows other major parks within a 120 minute drive of Lake Houston. While there
are a number of parks, few of them share the size or depth of activities that Lake Houston Park can
and will offer, and the Northeastern portion of the market is clearly underserved.
Figure Figure Figure Figure 2222: Regional Parks: Regional Parks: Regional Parks: Regional Parks
Economics Research AssociatesEconomics Research AssociatesEconomics Research AssociatesEconomics Research Associates Project No.17810Project No.17810Project No.17810Project No.17810 Page Page Page Page 21212121
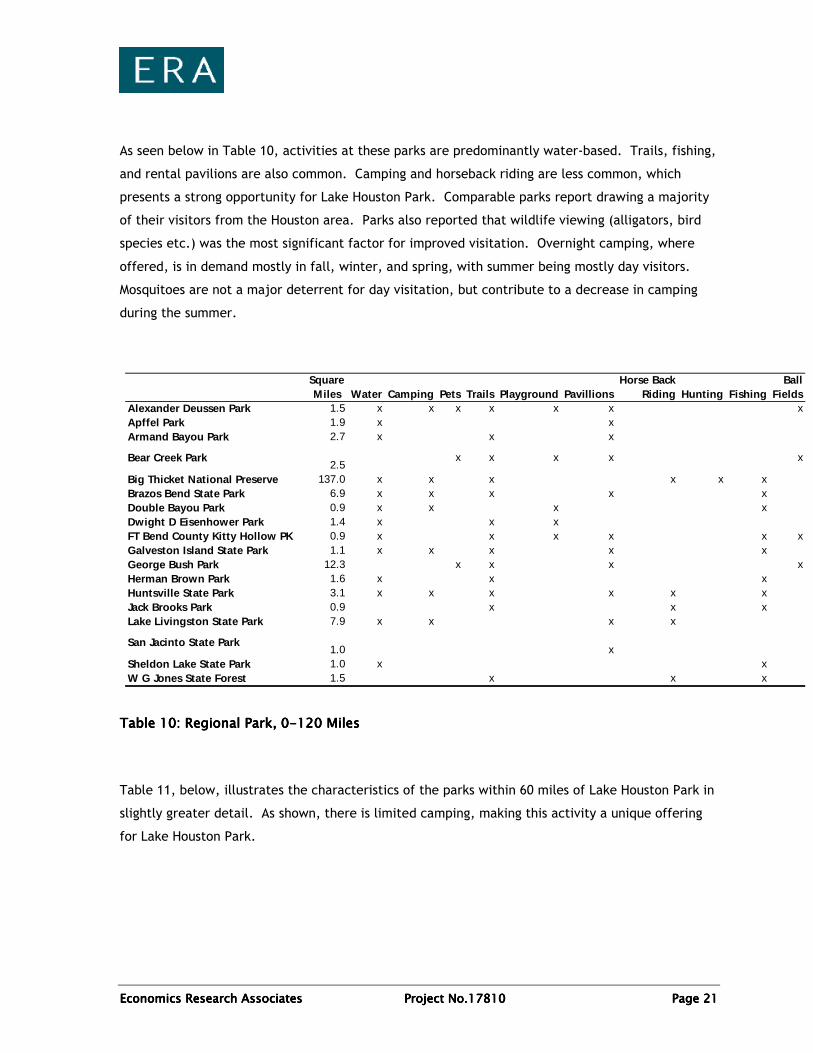
As seen below in Table 10, activities at these parks are predominantly water-based. Trails, fishing,
and rental pavilions are also common. Camping and horseback riding are less common, which
presents a strong opportunity for Lake Houston Park. Comparable parks report drawing a majority
of their visitors from the Houston area. Parks also reported that wildlife viewing (alligators, bird
species etc.) was the most significant factor for improved visitation. Overnight camping, where
offered, is in demand mostly in fall, winter, and spring, with summer being mostly day visitors.
Mosquitoes are not a major deterrent for day visitation, but contribute to a decrease in camping
during the summer.
Table Table Table Table 10101010: Regional Park, 0: Regional Park, 0: Regional Park, 0: Regional Park, 0----120 Miles120 Miles120 Miles120 Miles
Table 11, below, illustrates the characteristics of the parks within 60 miles of Lake Houston Park in
slightly greater detail. As shown, there is limited camping, making this activity a unique offering
for Lake Houston Park.
Square Miles Water Camping Pets Trails Playground Pavillions
Horse Back Riding Hunting Fishing
Ball Fields
Alexander Deussen Park 1.5 x x x x x x xApffel Park 1.9 x xArmand Bayou Park 2.7 x x x
Bear Creek Park2.5
x x x x x
Big Thicket National Preserve 137.0 x x x x x xBrazos Bend State Park 6.9 x x x x xDouble Bayou Park 0.9 x x x xDwight D Eisenhower Park 1.4 x x xFT Bend County Kitty Hollow PK 0.9 x x x x x xGalveston Island State Park 1.1 x x x x xGeorge Bush Park 12.3 x x x xHerman Brown Park 1.6 x x xHuntsville State Park 3.1 x x x x x xJack Brooks Park 0.9 x x xLake Livingston State Park 7.9 x x x x
San Jacinto State Park1.0 x
Sheldon Lake State Park 1.0 x xW G Jones State Forest 1.5 x x x

Economics Research AssociatesEconomics Research AssociatesEconomics Research AssociatesEconomics Research Associates Project No.17810Project No.17810Project No.17810Project No.17810 Page Page Page Page 22222222
Table Table Table Table 11111111: Comparable Park Characteristics, 0: Comparable Park Characteristics, 0: Comparable Park Characteristics, 0: Comparable Park Characteristics, 0----60 Miles60 Miles60 Miles60 Miles
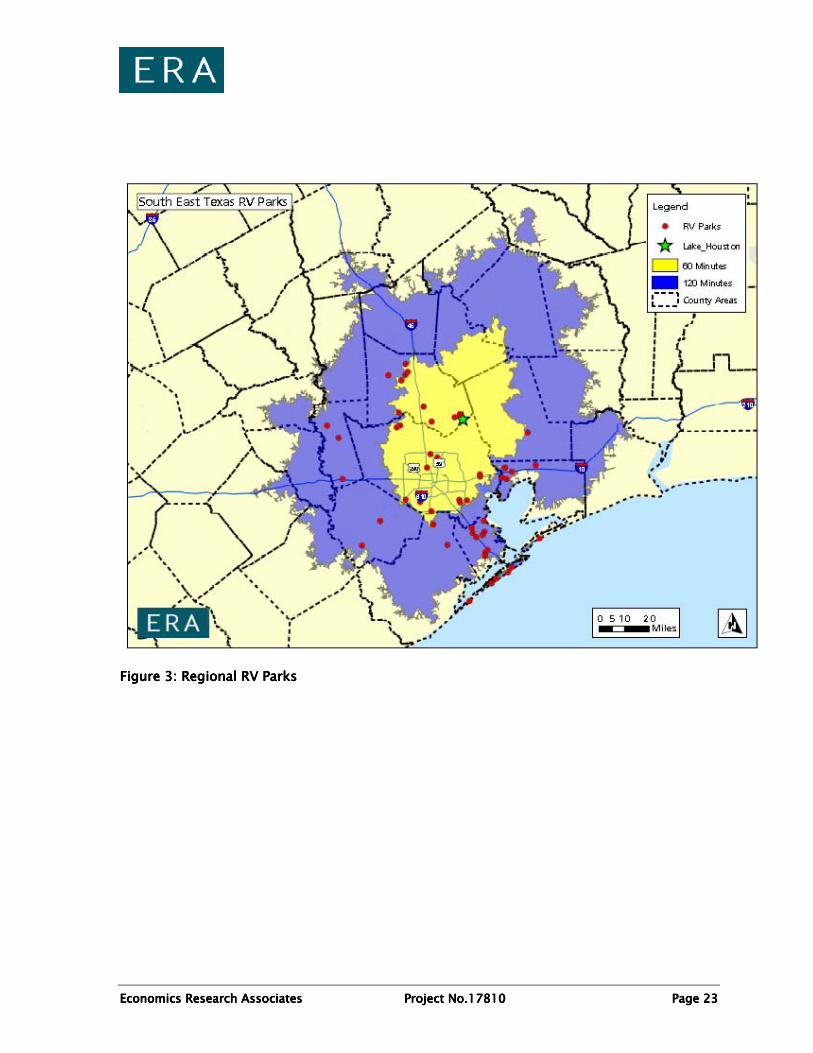
RV ParksRV ParksRV ParksRV Parks
As illustrated in the following discussion, regional RV parks are concentrated in the Southwestern
Houston market. There are few RV parks in the vicinity, and even fewer that offer cabins.
Name Major Attractions Water Camping
Alexander Deussen ParkWildlife Exhibit featuring a herd of Buf falo, Water Gazebo, Three Playgrounds
Located on Lake Houston and also features a duck pond and f ishing ponds
6 Rental Shelters
Bear Creek ParkWar Memorial, Rodeo Arena, Wildlife Habitat and Aviary, Equestrian Area
None None
Dwight D. Eisenhower Park .5 Miles of Grass Trails, Playground Fishing Pond None
Herman Brown Park 1.6 Miles of Bike t rails Fishing Pond None
San Jacinto State ParkBat t leground and Bat t leship Texas Tours, Historic Bat t leground Trail, Marsh Resorat ion and Boardwalk
None None
Sheldon Lake State ParkEnvironmental Learning Center, Canoeing Trails along Lake Sheldon
Sheldon Lake, Boats and Fishing Permit ted
None
WG Jones State ForestGame Sanctuary, Horse Back Riding, Biking, and Hiking Trails
Three Fishing Ponds and Creeks
None
1/ No comparable parks w ithin 30 minutes of Lake Houston State Park.Source: Economics Research Associates, 2008.
Economics Research AssociatesEconomics Research AssociatesEconomics Research AssociatesEconomics Research Associates Project No.17810Project No.17810Project No.17810Project No.17810 Page Page Page Page 23232323
Figure Figure Figure Figure 3333: Regional RV Parks: Regional RV Parks: Regional RV Parks: Regional RV Parks

Economics Research AssociatesEconomics Research AssociatesEconomics Research AssociatesEconomics Research Associates Project No.17810Project No.17810Project No.17810Project No.17810 Page Page Page Page 24242424
Table Table Table Table 12121212: RV Parks by Amenities, within 50 Miles: RV Parks by Amenities, within 50 Miles: RV Parks by Amenities, within 50 Miles: RV Parks by Amenities, within 50 Miles
Table Table Table Table 13131313: RV Campgr: RV Campgr: RV Campgr: RV Campgrounds with Cabin Rentalsounds with Cabin Rentalsounds with Cabin Rentalsounds with Cabin Rentals
Total PercentageBig Rig Accessible 44 72%Internet 47 77%Swimming 26 43%Pets Allowed 53 87%Cabins 9 15%
Total RV Parks 61 100%Source: Economics Research Associates, 2008.
Name CityLakeView RV Resort HoustonAll Star RV Resort HoustonRayford Crossing RV Resort The WoodlandsMarina Bay RV Resort KemahHouston East RV Resorts BaytownYogi Bear's Jellystone Park WallerSan Luis Pass County Park GalvestonCastaways RV Park WillisHavens Landing RV Park MontgomerySandy Beach River Front Houston
Economics Research AssociatesEconomics Research AssociatesEconomics Research AssociatesEconomics Research Associates Project No.17810Project No.17810Project No.17810Project No.17810 Page Page Page Page 25252525
Equestrian FacilitiesEquestrian FacilitiesEquestrian FacilitiesEquestrian Facilities
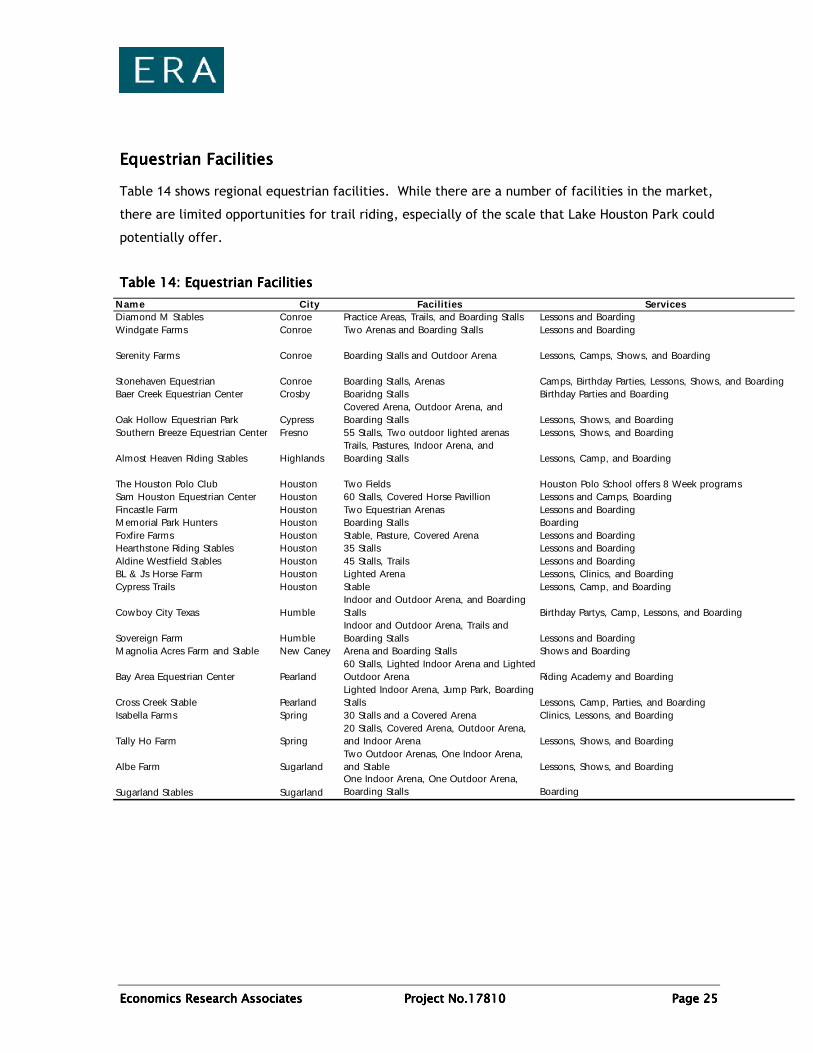
Table 14 shows regional equestrian facilities. While there are a number of facilities in the market,
there are limited opportunities for trail riding, especially of the scale that Lake Houston Park could
potentially offer.
Table Table Table Table 14141414: Equestrian Facilities: Equestrian Facilities: Equestrian Facilities: Equestrian Facilities
Name City Facilities ServicesDiamond M Stables Conroe Practice Areas, Trails, and Boarding Stalls Lessons and BoardingWindgate Farms Conroe Two Arenas and Boarding Stalls Lessons and Boarding
Serenity Farms Conroe Boarding Stalls and Outdoor Arena Lessons, Camps, Shows, and Boarding
Stonehaven Equestrian Conroe Boarding Stalls, Arenas Camps, Birthday Parties, Lessons, Shows, and BoardingBaer Creek Equestrian Center Crosby Boaridng Stalls Birthday Parties and Boarding
Oak Hollow Equestrian Park CypressCovered Arena, Outdoor Arena, and Boarding Stalls Lessons, Shows, and Boarding
Southern Breeze Equestrian Center Fresno 55 Stalls, Two outdoor lighted arenas Lessons, Shows, and Boarding
Almost Heaven Riding Stables HighlandsTrails, Pastures, Indoor Arena, and Boarding Stalls Lessons, Camp, and Boarding
The Houston Polo Club Houston Two Fields Houston Polo School offers 8 Week programsSam Houston Equestrian Center Houston 60 Stalls, Covered Horse Pavillion Lessons and Camps, BoardingFincastle Farm Houston Two Equestrian Arenas Lessons and BoardingM emorial Park Hunters Houston Boarding Stalls BoardingFoxfire Farms Houston Stable, Pasture, Covered Arena Lessons and BoardingHearthstone Riding Stables Houston 35 Stalls Lessons and BoardingAldine Westfield Stables Houston 45 Stalls, Trails Lessons and BoardingBL & J's Horse Farm Houston Lighted Arena Lessons, Clinics, and BoardingCypress Trails Houston Stable Lessons, Camp, and Boarding
Cowboy City Texas HumbleIndoor and Outdoor Arena, and Boarding Stalls Birthday Partys, Camp, Lessons, and Boarding
Sovereign Farm HumbleIndoor and Outdoor Arena, Trails and Boarding Stalls Lessons and Boarding
M agnolia Acres Farm and Stable New Caney Arena and Boarding Stalls Shows and Boarding
Bay Area Equestrian Center Pearland60 Stalls, Lighted Indoor Arena and Lighted Outdoor Arena Riding Academy and Boarding
Cross Creek Stable PearlandLighted Indoor Arena, Jump Park, Boarding Stalls Lessons, Camp, Parties, and Boarding
Isabella Farms Spring 30 Stalls and a Covered Arena Clinics, Lessons, and Boarding
Tally Ho Farm Spring20 Stalls, Covered Arena, Outdoor Arena, and Indoor Arena Lessons, Shows, and Boarding
Albe Farm SugarlandTwo Outdoor Arenas, One Indoor Arena, and Stable Lessons, Shows, and Boarding
Sugarland Stables SugarlandOne Indoor Arena, One Outdoor Arena, Boarding Stalls Boarding
Economics Research AssociatesEconomics Research AssociatesEconomics Research AssociatesEconomics Research Associates Project No.17810Project No.17810Project No.17810Project No.17810 Page Page Page Page 26262626
V. Identification of Comparables/Development Models
In order to determine successful models for resort state park developments, ERA researched
several successful resort state parks in other jurisdictions, predominantly located near a major
metropolitan area. The following reflects brief overviews of the parks, as well as trends in
characteristics. Profiles of parks reflecting successful operations of individual uses follow.
Resort State ParksResort State ParksResort State ParksResort State Parks
While the parks detailed below reflect a broad range of uses and facilities, the parks with unique
features tended to report that unique feature as the primary attraction. This illustrates the need
for the parks to provide a unique draw, in order to bring strong visitor numbers, as well as to draw
visitors from farther distances.
Park operators report that while golf and waterfront activities are key financial contributors,
lodging, especially well- maintained and unique camping experiences are strong financial
contributors. In many cases, these offerings offset losses in other activities, which are considered
to be operated as amenities for overnight users.
Economics Research AssociatesEconomics Research AssociatesEconomics Research AssociatesEconomics Research Associates Project No.17810Project No.17810Project No.17810Project No.17810 Page Page Page Page 27272727
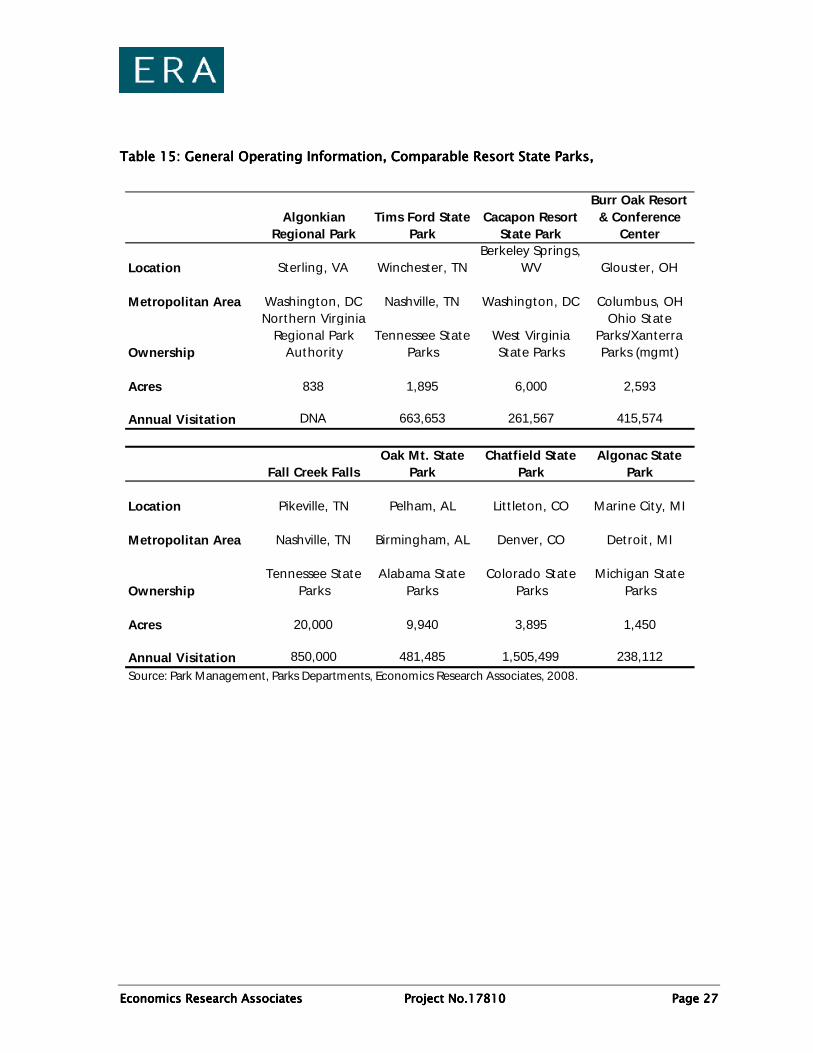
Table Table Table Table 15151515: General Operati: General Operati: General Operati: General Operating Information, Comparable Resort State Parks,ng Information, Comparable Resort State Parks,ng Information, Comparable Resort State Parks,ng Information, Comparable Resort State Parks,
Algonkian Regional Park
Tims Ford State Park
Cacapon Resort State Park
Burr Oak Resort & Conference
Center
Location Sterling, VA Winchester, TNBerkeley Springs,
WV Glouster, OH
Metropolitan Area Washington, DC Nashville, TN Washington, DC Columbus, OH
Ownership
Northern Virginia Regional Park
AuthorityTennessee State
ParksWest Virginia State Parks
Ohio State Parks/Xanterra Parks (mgmt)
Acres 838 1,895 6,000 2,593
Annual Visitation DNA 663,653 261,567 415,574
Fall Creek FallsOak Mt. State
ParkChatfield State
ParkAlgonac State
Park
Location Pikeville, TN Pelham, AL Lit t leton, CO Marine City, MI
Metropolitan Area Nashville, TN Birmingham, AL Denver, CO Detroit , MI
OwnershipTennessee State
ParksAlabama State
ParksColorado State
ParksMichigan State
Parks
Acres 20,000 9,940 3,895 1,450
Annual Visitation 850,000 481,485 1,505,499 238,112
Source: Park Management, Parks Departments, Economics Research Associates, 2008.
Economics Research AssociatesEconomics Research AssociatesEconomics Research AssociatesEconomics Research Associates Project No.17810Project No.17810Project No.17810Project No.17810 Page Page Page Page 28282828
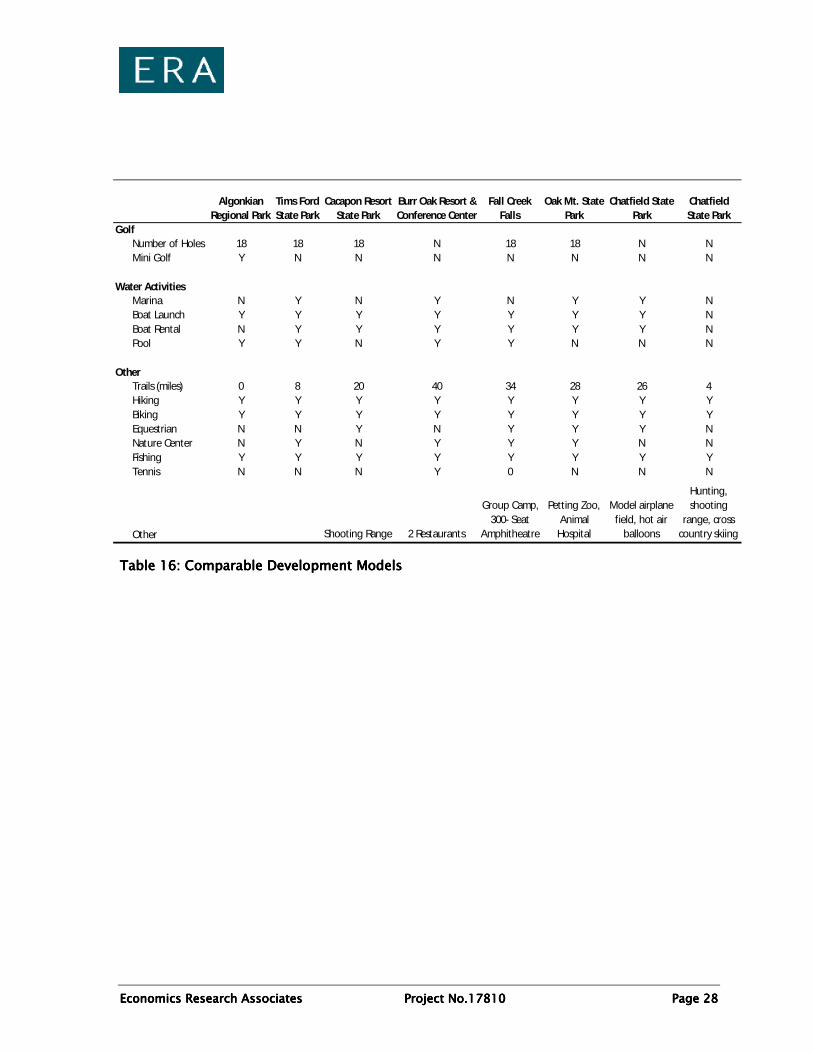
Table Table Table Table 16161616: Comparable Development Models: Comparable Development Models: Comparable Development Models: Comparable Development Models
Algonkian Regional Park
Tims Ford State Park
Cacapon Resort State Park
Burr Oak Resort & Conference Center
Fall Creek Falls
Oak Mt. State Park
Chatfield State Park
Chatfield State Park
GolfNumber of Holes 18 18 18 N 18 18 N NMini Golf Y N N N N N N N
Water ActivitiesMarina N Y N Y N Y Y NBoat Launch Y Y Y Y Y Y Y NBoat Rental N Y Y Y Y Y Y NPool Y Y N Y Y N N N
OtherTrails (miles) 0 8 20 40 34 28 26 4Hiking Y Y Y Y Y Y Y YBiking Y Y Y Y Y Y Y YEquestrian N N Y N Y Y Y NNature Center N Y N Y Y Y N NFishing Y Y Y Y Y Y Y YTennis N N N Y 0 N N N
Other Shooting Range 2 Restaurants
Group Camp, 300- Seat
Amphitheatre
Petting Zoo, Animal Hospital
Model airplane field, hot air
balloons
Hunting, shooting
range, cross country skiing

Economics Research AssociatesEconomics Research AssociatesEconomics Research AssociatesEconomics Research Associates Project No.17810Project No.17810Project No.17810Project No.17810 Page Page Page Page 29292929
Table Table Table Table 17171717: Lodging: Lodging: Lodging: Lodging
Table Table Table Table 18181818: Park Operating Budgets: Park Operating Budgets: Park Operating Budgets: Park Operating Budgets
Algonkian Regional Park
Tims Ford State Park
Cacapon Resort State Park
Burr Oak Resort & Conference Center
Fall Creek Falls
Oak Mt. State Park
Chatfield State Park
Cabins2 bedrooms 1 20 0 30 20 10 03 bedrooms 7 0 0 0 10 0 05 bedrooms 4 0 0 0 0 0 0Total 12 20 31 30 30 10 0
LodgeRooms N/A N/A 48 60 145 N/A N/A
CampingCampsites N 52 N 100 228 145 197
0 (Camp/RV) 0 0 (Camp/RV) 85 RV/60 Tent Plus 10 groupsitesWater/Electric? N/A Y N/A N Y Y Y
Picnic Shelters1- 200, 3-50, 1-
160 2- 50+1-100, 1-80, 1-36, 1-30, 4-20 1 5-75 0 2-125, 1-350, 1-75
Event Rental3 Rooms, up to
250 total 1- 40, 1-752- 75, 2-50, 1-
150 5-50, 1-3005, 400 people
total 2 Rooms N
1/ Tims Ford also operates a seasonal sattelite camping facility with 88 sites (20- water only, 38- water/electric, 30-water/electric/sewer)
Financial Performance - Comparable Resort State ParksAlgonkian
Regional ParkTims Ford State
Park Fall Creek FallsOak Mt. State
ParkChatfield State
ParkAlgonac State
Park
Operating Revenues $ 762,600 $ 226,400 $ 586,200 $ 2,426,800 $ 1,882,700 $ 467,000
Operating Expenses 720,700 500,000 464,400 2,091,900 1,461,400 376,200
Net Income $ 41,900 $ (273,600) $ 121,800 $ 334,900 $ 421,300 $ 90,800

Economics Research AssociatesEconomics Research AssociatesEconomics Research AssociatesEconomics Research Associates Project No.17810Project No.17810Project No.17810Project No.17810 Page Page Page Page 30303030
Algonkian Regional ParkAlgonkian Regional ParkAlgonkian Regional ParkAlgonkian Regional Park
Algonkian Regional Park in Sterling, Virginia is operated by the Northern Virginia Regional Park
Authority, a regional management body representing three counties and three cities. Algonkian
Regional Park is located in suburban Northern Virginia, approximately 30 miles from Washington,
DC.
The park features a small waterpark facility, Downpour at Algonkian; a golf course; picnic shelters
including tables and grills; 2, 3, 4, and 5 bedroom cottages; a Conference Center featuring three
rooms that can accommodate up to 200 people.
Algonkian Pool, built in 1979, is one of Loudoun County’s most visited summer recreational sites.
This entire facility underwent an upgrade. The water playground offers a large climbing water play
structure with slides, water jets, and a giant bucket that pours every 3 minutes. The main, free-
form pool has a large open expanse of water, shipwreck and log slides for younger children, and
two large flume slides. A splashpad was added in summer 2006. It offers interactive play features
including tumble buckets and water jets. Other amenities include a food concession and locker
rentals.
The waterpark receives around 28,000 annual visitors, mostly from within a 10 to 15 minute drive.
Operators report a predominantly family business on weekends. They also receive around 40-50
groups per week, and 5-10 business groups per year
The park’s newly-renovated conference facility sees almost 200 rentals per year, about 2/3 of
which are business-related. Since renovation, the conference center is breaking even in first years
of operation. The park’s cottages are the largest contributor of income, followed by golf, then the
pool.
Fall Creek FallsFall Creek FallsFall Creek FallsFall Creek Falls
Set on 20,000 acres, Fall Creek Falls is located around two hours from Nashville, Chattanooga, and
Knoxville, Tennessee. The Park includes 30 cabins, a 145-room lodge, 200+ campsites, a 300-seat
amphitheatre, three miles of paved bike trails and 15 miles of mountain bike trails, 34 miles of
hiking trails, fishing boat rental, paddleboat rental, canoe rental, golf, driving range and practice
green, stables with guided rides, nature center, five covered picnic pavilions, 12 picnic areas, four
playgrounds, and an Olympic-sized pool with a wading pool, modern bathhouses and a snack bar

Economics Research AssociatesEconomics Research AssociatesEconomics Research AssociatesEconomics Research Associates Project No.17810Project No.17810Project No.17810Project No.17810 Page Page Page Page 31313131
Although located equidistant from a number of metropolitan areas, Fall Creek Falls’ unique
landscape (waterfall) is a unique draw for visitors from farther distances; the park receives 37
percent out-of-state visitors. Group camping is a large draw with over 23,000 annual campers.
Cabins experience high occupancies (75 percent) while camping is much lower (30 percent).
Occupancy in peak season is near 90 percent, offset by low 20-30 percent in winter. Lodging
revenue offsets losses from restaurant and pool, considered guest amenities
The park hosts a number of successful annual events such as the Annual Wildflower Pilgrimage,
rock climbing workshops, the Mountaineer Folk Festival, Fall Colors Weekend, Wild Foods Day, and
Christmas on the Mountain.
Cacapon Resort State ParkCacapon Resort State ParkCacapon Resort State ParkCacapon Resort State Park
6,000 acre park with a 48-room lodge, a 12-room inn with meeting space, 30 cabins, picnic
shelters, 18-hole golf course, over 20 miles of trails, Clay (Trap) Shooting Range guided horseback
rides, nature center, row and paddleboat rental, tennis courts, paved basketball court or sand
volleyball court, and fishing
Lodge and cabin experience approximately 50 percent annual occupancy, with peak in summer
visitation reflected in both the lodge and cabins
Tims Ford State ParkTims Ford State ParkTims Ford State ParkTims Ford State Park
Tims Ford State Park is located on the Tims Ford Reservoir, approximately 75 miles from
metropolitan Nashville. The park features five miles of paved hiking and biking trails; a leased
marina operation that includes a boat ramp, dock, snack bar, bait shop and boat rental; an
additional leased full-service marina that offers slip rentals, pontoon rentals, gas pumps, and a
restaurant; 20 cabins overlooking the lake; a 52 site campground with water and electric; a
reception hall with two rooms hosting up to 45 and 70 people, respectively; a recreation hall for
group rentals; a 50-spot picnic area, two picnic shelters and a larger picnic pavilion; a large
swimming pool; and playgrounds and playfields. The 10,700-acre Tims Ford Lake is a top bass
fishing lake.
In 1999 the state opened a Jack Nicklaus-designed Bear Trace Golf Course. The park also offers
packages, combining cabin stays with rounds of golf.

Economics Research AssociatesEconomics Research AssociatesEconomics Research AssociatesEconomics Research Associates Project No.17810Project No.17810Project No.17810Project No.17810 Page Page Page Page 32323232
Camping is the park’s largest generator of income, offsetting losses from other services; however,
cabin rental is a break-even operation. Visitation is very seasonal, with summer months offsetting
lack of winter activity. Management reports that cabin rentals and camping reflect more
seasonality than day-use activities. They also report that the pool and waterfront are the primary
activities of visitors to the park. Golfer origin is primarily nearby metropolitan areas, while
interpretive programming draws primarily campers, not local visitors.
Figure Figure Figure Figure 4444: Typical Cabin, Tims Ford State Park: Typical Cabin, Tims Ford State Park: Typical Cabin, Tims Ford State Park: Typical Cabin, Tims Ford State Park
Economics Research AssociatesEconomics Research AssociatesEconomics Research AssociatesEconomics Research Associates Project No.17810Project No.17810Project No.17810Project No.17810 Page Page Page Page 33333333
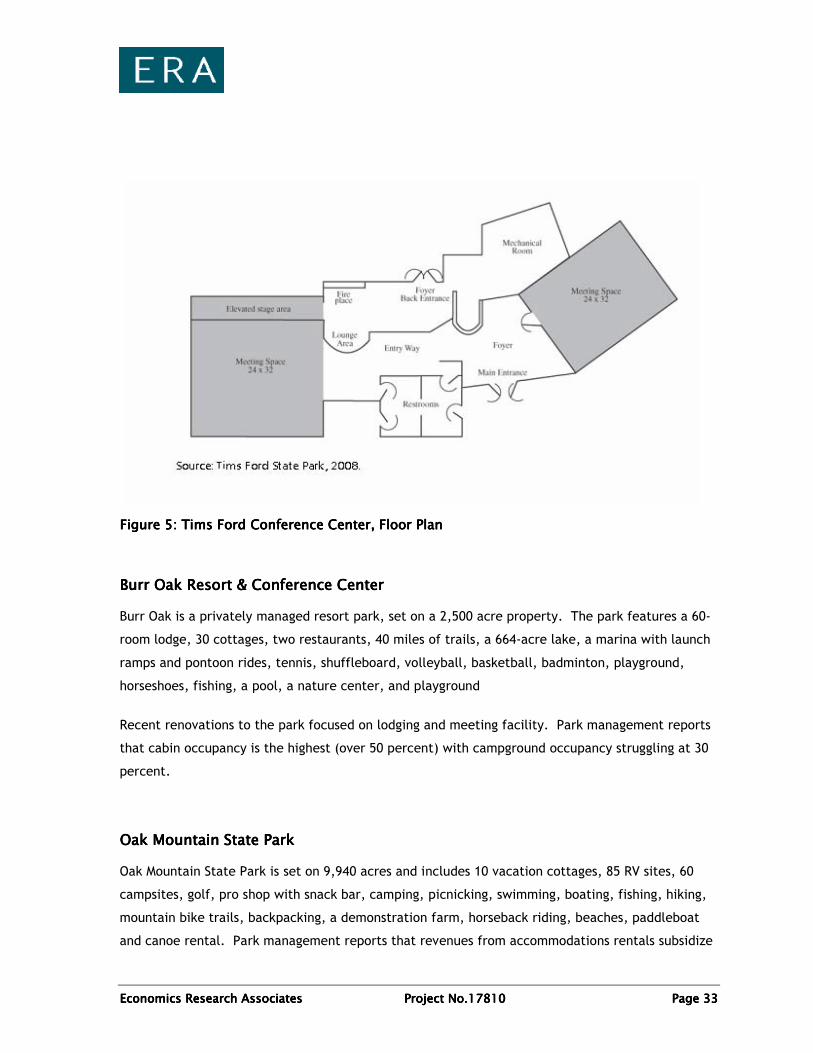
Figure Figure Figure Figure 5555: Tims Ford Conference Center, Floor Plan: Tims Ford Conference Center, Floor Plan: Tims Ford Conference Center, Floor Plan: Tims Ford Conference Center, Floor Plan
Burr OakBurr OakBurr OakBurr Oak Resort & Resort & Resort & Resort & ConferenceConferenceConferenceConference CenterCenterCenterCenter
Burr Oak is a privately managed resort park, set on a 2,500 acre property. The park features a 60-
room lodge, 30 cottages, two restaurants, 40 miles of trails, a 664-acre lake, a marina with launch
ramps and pontoon rides, tennis, shuffleboard, volleyball, basketball, badminton, playground,
horseshoes, fishing, a pool, a nature center, and playground
Recent renovations to the park focused on lodging and meeting facility. Park management reports
that cabin occupancy is the highest (over 50 percent) with campground occupancy struggling at 30
percent.
Oak Mountain State ParkOak Mountain State ParkOak Mountain State ParkOak Mountain State Park
Oak Mountain State Park is set on 9,940 acres and includes 10 vacation cottages, 85 RV sites, 60
campsites, golf, pro shop with snack bar, camping, picnicking, swimming, boating, fishing, hiking,
mountain bike trails, backpacking, a demonstration farm, horseback riding, beaches, paddleboat
and canoe rental. Park management reports that revenues from accommodations rentals subsidize

Economics Research AssociatesEconomics Research AssociatesEconomics Research AssociatesEconomics Research Associates Project No.17810Project No.17810Project No.17810Project No.17810 Page Page Page Page 34343434
losses on visitor amenities, although the golf and restaurant are also somewhat profitable. Cabins
experience higher occupancy and higher guests/unit than campgrounds.
Chatfield State ParkChatfield State ParkChatfield State ParkChatfield State Park
Chatfield State Park in Littleton, CO is 3,895 acre park including a 197 site campground, 139 picnic
sites, 26 miles of hiking and biking trails, horse stables, boating, fishing a full-service marina, hot
air balloon port, and a model airplane field. Management reports that boating and birding are
strong attractions (both seasonal) as well as general scenery viewing. It experiences large day-use
from the Denver market, inspired by its unique offerings.
Algonac State ParkAlgonac State ParkAlgonac State ParkAlgonac State Park
Algonac State Park in Marine City, MI is 1,450 acres on the St. Clair River featuring 300 campsites,
fishing, seasonal small and large game species hunting, metal detecting, shooting range, archery,
cross country ski trails. Boat enthusiasts come to watch large freight ships on the waterway.
Youth group camping and annual historic reenactments of Native American events are big draws.
The park reports 37 percent campers and 63 percent day-users. Around 25 percent of campers
come from the Detroit Metropolitan area. Management reports that almost half of all activity takes
place in summer months, but that seasonality is becoming less pronounced in recent years.

Economics Research AssociatesEconomics Research AssociatesEconomics Research AssociatesEconomics Research Associates Project No.17810Project No.17810Project No.17810Project No.17810 Page Page Page Page 35353535
Other LodgingOther LodgingOther LodgingOther Lodging
As lodging is such an important revenue generator for resort state parks, and a unique opportunity
for Lake Houston, the following present some background and potential ideas for the park.
Americans are gravitating towards more local eco-tourism retreats. Operators report that
consumers want value for their accommodations and appreciate the opportunity to stay in more
local, traditional, or unique accommodations. They are also willing to pay more for better viewing,
closer to activities, etc.
Operators report a lack of mid-priced, comfortable eco lodging– there are a larger numbers of high-
end or primitive experiences, with a lack of offerings in the middle. A recent trend in travel is that
tourists also prefer shorter, more frequent vacations, of which unique, fairly local parks can offer.
Alternative camping facilities also attract people, with limited or no camping experience, such as
seniors, urban population and new immigrant, which would be a wonderful opportunity to lure
people to Lake Houston Park, who might not otherwise be willing to try it.
Case Study: Case Study: Case Study: Case Study: Alternative Camping Alternative Camping Alternative Camping Alternative Camping
A number of states have tried to offer unique, alternative camping facilities, such as Yurts, to
tremendous success. Parks found that more people wanted to camp but want a 'convenient
camping' experience. Occupancy rates for alternative camping facilities in California State Parks
are triple that of standard campsites and extend the shoulder season by at least 5 percent. Ohio
has shown that yurts have the strongest ROI of all the rental properties.
Oregon State Parks found that 150 yurts generate 60 percent occupancy. Washington State Parks
operate 40 yurts currently, with plans to add 60 more. These generate 60 percent occupancy, and
have created a 20 percent increase in total camping in affected campgrounds.
The village of 10 yurts at Washington’s Kayak Point Regional Park is popular and booked more than
half the year, and rent for $40 to $70 per night, with the higher fees covering RV parking. The
county collected about $50,000 last year from yurt rentals. Despite doubling the number of yurts
from 1997 to 1998, the annual occupancy rate remained virtually unchanged, and there were
30,000 rentals.

Economics Research AssociatesEconomics Research AssociatesEconomics Research AssociatesEconomics Research Associates Project No.17810Project No.17810Project No.17810Project No.17810 Page Page Page Page 36363636
EquestrianEquestrianEquestrianEquestrian
Equestrian facilities such as trails and stalls are a draw, but the addition of equestrian camping
facilities can provide a unique draw for visitors from farther distances and for longer stays.
Case SCase SCase SCase Study: South Mountain State Parktudy: South Mountain State Parktudy: South Mountain State Parktudy: South Mountain State Park
Since the addition of equestrian camping facilities, South Mountain State Park in North Carolina has
seen increases in equestrian activity. The equestrian campground consists of 15 campsites, a 33-
stall barn, and a bathhouse with flush toilets and hot showers. Each campsite has a parking area,
picnic table, tent pad, and grill. Potable water spigots are located throughout the campground.
According to park staff, although total equestrian trail usage numbers have not been documented,
and would be difficult to document since equestrians have historically accessed the park lands from
other areas in addition to the main entry, it has anecdotally increased. In 2006, of the 205,814
park visitors, over 1,200 were equestrian campers, a number that has increased each year since the
addition of facilities in 2001. The most riding activity occurs in the spring and fall, though
equestrians do ride year round if the weather is favorable.

Economics Research AssociatesEconomics Research AssociatesEconomics Research AssociatesEconomics Research Associates Project No.17810Project No.17810Project No.17810Project No.17810 Page Page Page Page 37373737
Conference FacilitiesConference FacilitiesConference FacilitiesConference Facilities
For parks located near business activity and/or in places with limited offerings, conference and
event facilities can be a significant revenue generator.
Case Study: Algonkian Conference CenterCase Study: Algonkian Conference CenterCase Study: Algonkian Conference CenterCase Study: Algonkian Conference Center
Recent renovations to Algonkian Regional Park’s Conference Center have led to a significant
increase in business. Catering is the strongest revenue source, with catering and facility operations
as the facility’s largest expenses. The park reports predominantly business rentals. Rentals were
traditionally a break-even operation, and considered a driver for roomnights. However, recent
renovations have increased bookings and are anticipated to improve profitability.
Table Table Table Table 19191919: Financials: Financials: Financials: Financials
Table Table Table Table 20202020: Rentals: Rentals: Rentals: Rentals
ACTUAL FY2005
RevenuesCatering 82,684$ Conference Center Rental 72,850$
Total Revenues 155,534$
ExpensesPersonnel Services: Part -Time Salaries 27,260$ FICA 2,085$ Unemployment Tax 71$ Catering 78,509$ Equipment/Vehicle Maintenance 335$ Facility Op. & Maintenance 12,450$ Linen Service 5,464$ Ut ilit ies and Telephone 6,378$
Total Expenses 132,552$ Net Income (Loss) 22,982$
Source: NVRPA, Economics Research Associates, June 2008.
FY 2005ACTUAL
Number of Loudoun Room rentals 93Number of Fairfax Room rentals 53Number of Arlington Room rentals 43Number of social rentals (events) 64Number of business rentals (meet ings) 125Source: NVRPA, Economics Research Associates, June 2008.

Economics Research AssociatesEconomics Research AssociatesEconomics Research AssociatesEconomics Research Associates Project No.17810Project No.17810Project No.17810Project No.17810 Page Page Page Page 38383838
Environmental Education CenterEnvironmental Education CenterEnvironmental Education CenterEnvironmental Education Center
While Environmental Education Centers are not typically revenue-generating, they can serve as a
draw for groups who might use other facilities, and can provide unique opportunities for shared
facilities, special funding, and unique resources.
Case Study:Case Study:Case Study:Case Study: Pocono Environmental Education Center (PEEC)Pocono Environmental Education Center (PEEC)Pocono Environmental Education Center (PEEC)Pocono Environmental Education Center (PEEC)
PEEC is a private, non-profit organization operating a 38 acre campus in the middle of the
Delaware Water Gap National Recreation Area. The center serves approximately 25,000 visitors
annually
The property also offers fishing, cross-country skiing, ropes/challenge/orienteering courses, two
sensory trails, 12 miles of hiking trails, a log cabin, picnic areas, two campfire rings, outdoor
teaching venues, cabins, guest lodges, group tenting area, and a yurt village.
The green Visitor Activity Center is a 3,600 square-foot multi-purpose facility, seating 250 people
which hosts special events, and serves as the main food service venue for all PEEC guests and
visitors. The Main Education Building houses a large meeting area, two classrooms, administrative
offices, educational displays, indoor pool and book store. A Nature Lodge also features additional
classrooms for activities and indoor events.
The facility grosses approximately $1,000,000 annually in fees and program dues, and generates
approximately $1.3 million in total expenses, with the remaining $300,000 funded through friends
program and government grants.

Economics Research AssociatesEconomics Research AssociatesEconomics Research AssociatesEconomics Research Associates Project No.17810Project No.17810Project No.17810Project No.17810 Page Page Page Page 39393939
WaterparksWaterparksWaterparksWaterparks
Regional outdoor water parks can provide a unique draw, and offer a reason for visitors to come to
the park during summer months. Parks vary a great deal in terms of size and offerings. Operators
generally report strong visitation from families. The majority of visitation at outdoor water parks
is highly local, with visitors coming from less than a 30-minute drive. Admission generally accounts
for over half of total revenue.
Case Study: SplashdownCase Study: SplashdownCase Study: SplashdownCase Study: Splashdown
Splashdown is a 13-acre water park operated by the Prince William County Park Authority. The
park is approximately a two mile drive from the Interstate (66) with soccer fields in a residential
neighborhood.
The park features a 770-foot lazy river; a 25-meter lap pool; a children’s area with 4 slides,
bubblers and fountains; an activity pool; two fast cannonball slides; two four-story waterslides; a
tropical twister waterslide; a lily pad and log walk; Big Kahuna Beach featuring 250 tons of sand;
and multiple “funbrellas” and pavilions. Splashdown receives around 166,000 annual visitors. Of
these, 65 percent are individuals and 35 percent are groups. Visitation is predominantly leisure
with 40 percent of visitors coming from within the county
Economics Research AssociatesEconomics Research AssociatesEconomics Research AssociatesEconomics Research Associates Project No.17810Project No.17810Project No.17810Project No.17810 Page Page Page Page 40404040
VI. Initial Development Program
This final section of the report presents ERA recommendations regarding the initial development
program for Lake Houston Park. The program responds to market opportunities and meets the
principal development objectives of the Houston Department of Parks and Recreations, which are
financial sustainability and environmental sensitivity. The discussion first identifies preferred uses
for the park and then presents the development program.
Preferred UsesPreferred UsesPreferred UsesPreferred Uses
Based on the findings of market factors discussed in this report, ERA prepared recommendations on
the uses that it believes should be considered for inclusion in the master plan. The tool ERA used
in determining these recommended uses was a Matrix Analysis. The Matrix evaluated a number of
individual uses in terms of market, financial and operational characteristics that were appropriate
given the client’s objectives for the development of the park.
The results of the Matrix Analysis are presented in Table 21. As shown, the individual uses are
arrayed long the vertical axis on the left. They include various types of overnight accommodations,
visitor attractions and other, specialty uses that were identified through the market analysis, and
through client, stakeholder and master plan team input. Seven evaluation factors are arrayed
across the horizontal axis at the top of the matrix. These factors were weighted based on ERA’s
perception of their relative importance, again, based on the client’s development objectives. The
evaluation factors (weighting in parenthesis) included the following:
� Market Opportunity (3). Potential for attracting visitors/user based on market characteristics
and the nature of the supply/demand situation.
� Potential for Profitable Operations (3). Likelihood of generating an operating profit based on
type of use and strength of market opportunity
� Magnitude of Profitability (2). The level of potential profitability in absolute terms
� Fit with Site (2). Appropriateness of the use given the physical characteristics of the site and
goal of creating an environmental themed destination.
� Complementary to Existing Uses (1). Appropriateness of the use when considered in relation to
existing facilities and other regional park type uses.

Economics Research AssociatesEconomics Research AssociatesEconomics Research AssociatesEconomics Research Associates Project No.17810Project No.17810Project No.17810Project No.17810 Page Page Page Page 41414141
� Fit with Existing Management Expertise (1). Management skills required to successfully operate
the use, or ease of developing the necessary skills
� Availability of Development Partners (1). Availability of potential for-profit or not-for-profit
developer/operators to invest in and/or operate the use
The summary scores for individual uses are shown in the right hand column of the matrix and
summarized below:
Based on the scoring and weighting described above, Cabins and RV Camping achieve the highest,
overall scores in the accommodations category, while the Equestrian Camp and Lodge achieve
moderate scores. In the attractions category, the highest score was recorded by the smaller,
Splash Park, which would serve as a more locally oriented attraction as well as an amenity for
onsite accommodations. Site fit and the competitive environment curtailed the scoring of larger,
more destination oriented attractions. The specialty uses scored well, but their final scores
reflected the lack of a ready pool of potential development partners.
� .
AccommodationsRV campground 58Alternat ive accommodat ions (Yurts) 58Luxury cabins 57Rust ic cabins 54Equestrian camp 40Lodge 37
Visitor AttractionsSplash park 44Dest inat ion at t ract ion 36Aquat ic park 36
Specialty UsesConference/meet ing space 45Educat ional/research center 42

Economics Research AssociatesEconomics Research AssociatesEconomics Research AssociatesEconomics Research Associates Project No.17810Project No.17810Project No.17810Project No.17810 Page Page Page Page 42424242
Table Table Table Table 21212121: Matrix Evaluation: Matrix Evaluation: Matrix Evaluation: Matrix Evaluation
Market Opportunity
Potential for Profitable Ops
Magnitude of Profitability Fit with Site
Complementary to Existing Activity
Fit with Existing Management
Expertise
Availabilty of Development
Partners Weighted
Score1 = low5 = high
1 = low5 = high
1 = low5 = high
1 = high5 = low
1 = low5 = high
1 = low5 = high
1 = low5 = high
Relative Weighting 3 3 2 2 1 1 1
LodgingLodge 3 2 5 3 3 2 1 37Luxury Cabins (1) 5 5 5 4 4 4 1 57Rust ic Cabins (2) 5 4 3 5 5 5 1 54RV Campground 5 5 4 4 5 4 3 58Tent Campground 5 3 2 5 5 5 1 49Alternat ive Lodging (3) 5 5 3 5 5 5 2 58Equestrian Camp (4) 3 3 2 4 5 3 2 40
Visitor AttractionsDest inat ion At t ract ion (5) 4 3 5 1 1 1 1 36Aquat ic Park (6) 4 2 4 2 2 2 2 36Splash Park (7) 3 4 3 4 3 4 2 44
Other Specialty Conference/Meet ing Space 4 4 2 4 4 4 1 45Educat ion/Research Center 5 2 1 5 4 3 2 42
(1) Two to four bedroom unites w ith higher level of f inish, plus entertainment amenit ies such as TV and/or possible hot tub(2) Basic f inish and amenit ies(3) Yurts or plat form tents(4) Cabins plus paddocks, rings, and other equestrian facilit ies(5) Entertainment or cultural at t ract ion that would be if suf f icient scale of development to be a f reestanding dest inat ion(6) Full waterpark, w ith a wave pool, slides, and act ivity pools(7) Smaller aquat ic at t ract ion w ith act ivity pool and splash play area

Economics Research AssociatesEconomics Research AssociatesEconomics Research AssociatesEconomics Research Associates Project No.17810Project No.17810Project No.17810Project No.17810 Page Page Page Page 43434343
Development ProgramDevelopment ProgramDevelopment ProgramDevelopment Program
Building on the results of the Matrix Analysis, ERA prepared its market-based recommendations for
the Lake Houston Park development program. The uses flow from the Matrix scoring described
above. The sizing/quantity recommendations reflect the scale of development that ERA believes
responds to the level of market potential; which reflects an economically viable scale of
development, and, as appropriate, would provide the scale of development that might be
attractive to potential development partners
Cabins
� Luxury: 20 – 30, 2 - 4 bedroom
� Rustic: 10 - 15
� Alternative lodging: test with 5 -10 units
� Renovate existing facilities
Campground
� RV sites: 75 to 100 sites
� RV/Tent – with hook ups: 25 – 50 sites
� Dedicated amenities
Meeting/Event Center
� 5,000 sf
� Catering kitchen
� Suitable for weddings, business and social
events
Splash Park
� 3 -4 acres, lazy river, slides and pools
Equestrian Camp
� 30 - 50 Sites with hook ups and paddocks,
covered arena, group shelter
Rentals
� Canoes, kayaks, bikes
Trails
� Hiking, biking, equestrian
The program recommendations reflect a first tier of development. Collectively, the development
envisioned in these has the potential to achieve a self sufficient destination park. Development
beyond the recommended program is certainly a possibility; however ERA believes that additional
development should be considered in future iterations of the plan, after the success of the initial
program has been achieved.

Economics ReseEconomics ReseEconomics ReseEconomics Research Associatesarch Associatesarch Associatesarch Associates Project No.17810Project No.17810Project No.17810Project No.17810 Page Page Page Page 43434343
Phase I Financial AnalysisPhase I Financial AnalysisPhase I Financial AnalysisPhase I Financial Analysis
SWA Group has prepared a first phase program for Lake Houston Park that fits with funding
resources that are currently available for park development. The Phase I program calls for
improvements to the entry and roads; construction of additional trails, parking and picnic areas,
and development of 120 RV campsites and four cabins. Some of the Phase I improvements will be
funded by Montgomery County. The Houston Parks and Recreation contribution is estimated to be
some $4.2 million.
ERA has prepared an illustrative economic analysis to demonstrate the positive impact on the
financial performance of the park that should result from implementation of the Phase I
improvements. The analysis is based on certain assumptions that are documented in the analytical
tables that accompany this narrative. ERA has also assumed that the improvement will be
attractive enough to increase day visitation and to create a stronger, overnight destination. To
this end, it is assumed that the management structure of the park will be such that Lake Houston
Park will be operated under an enterprise philosophy i.e. management will have decision-making
flexibility and that the park will be able to retain income from revenue facilities.

Economics ReseEconomics ReseEconomics ReseEconomics Research Associatesarch Associatesarch Associatesarch Associates Project No.17810Project No.17810Project No.17810Project No.17810 Page Page Page Page 44444444
Summary of Financial PerformanceSummary of Financial PerformanceSummary of Financial PerformanceSummary of Financial Performance
Table 22 presents a summary of financial performance for Lake Houston Park with the
implementation of Phase I of the Master Plan. The table is divided into two sections, core
operations and new revenue elements. Core operations include the park’s day use activities and
the existing cabins and lodge facilities. The new revenue elements are the RV campground and
cabins.
Table Table Table Table 22222222: Summary Illustrative Economics: Summary Illustrative Economics: Summary Illustrative Economics: Summary Illustrative Economics
As shown in the table, the core operations, by themselves, are expected to operate at a deficit of
$340,000. This number represents an increase in the deficit from the current level which is
estimated to be roughly $235,000. However, the deficit operations of the traditional park
elements included under core operations are largely offset by the income from the revenue
elements. Overall, the total park’s financial performance is estimated to be slight deficit of
$32,000.
Core OperationsCurrent Revenues 65,000$ Incr. w ith Phase I 45,000 Phase I Revenues 110,000$
Current Budget 300,000$ Incr. w ith Phase I 150,000 Phase I Budget 450,000$
Phase I Surplus/(Deficit) (340,000)$
New Revenue ElementsSurplus f rom RV Camping 283,824$ Surplus f rom Cabins 24,090 Phase I Surplus 307,914$
Park Surplus/(Deficit) - Phase I (32,086)$ Source: Economics Research Associates

Economics ReseEconomics ReseEconomics ReseEconomics Research Associatesarch Associatesarch Associatesarch Associates Project No.17810Project No.17810Project No.17810Project No.17810 Page Page Page Page 45454545
Core OperationsCore OperationsCore OperationsCore Operations
As a first step in considering the financial impact of the Phase I improvements, ERA prepared its
own estimate of the parks current revenues and expenses. This estimate was based in available
financial statements from previous fiscal years, updated to reflect current staffing and operations.
Based on best available information, ERA estimated the current financial performance of the park
to be a deficit of $235,000. The next step was to anticipate increased revenues and increased
operating costs associated with Phase I improvements. As seen in Table 23, ERA estimated that
revenues from core operations would increase from $65,000 to $110,000 and that the operating
budget would increase from $300,000 to $450,000. The financial bottom line for the park
operations is an increase in the deficit for $235,000 to $340,000. (Note: trail maintenance and
similar operating costs are included under core operations when in fact the trails and other
features of the park are important is generating demand for the cabins and campground.)
Table Table Table Table 23232323: Lake Houston Park, Core Operations, Phase I: Lake Houston Park, Core Operations, Phase I: Lake Houston Park, Core Operations, Phase I: Lake Houston Park, Core Operations, Phase I
Increase w/Revenues Current Phase I Phase I
Entry Fees 15,000$ 300% 45,000$ Facility Rentals 35,000 100% 35,000 Other 15,000 200% 30,000
Surplus/(Def icit ) 65,000$ 110,000$
Salary 200,000 150% 300,000 O&M 100,000 150% 150,000
300,000$ 450,000
Surplus/(Def icit ) (235,000)$ (340,000)$ Source: Economics Research Associates

Economics ReseEconomics ReseEconomics ReseEconomics Research Associatesarch Associatesarch Associatesarch Associates Project No.17810Project No.17810Project No.17810Project No.17810 Page Page Page Page 46464646
RV CampgroundRV CampgroundRV CampgroundRV Campground
The illustrative financial performance of the 120-site RV campground is shown in Table 24. Rental
rates and occupancy assumptions reflect the Houston market and assumed positioning of the Lake
Houston Park RV camping facilities. Factors used for estimating miscellaneous revenues and
operating profit margin are based on the performance of similar facilities in other public parks. As
shown in the table, the lake Houston RV park is expected to generate some $710,000 in revenues
and operating income of $284,000.
Table Table Table Table 24242424: : : : Illustrative Economics, Illustrative Economics, Illustrative Economics, Illustrative Economics, Lake Houston Park Lake Houston Park Lake Houston Park Lake Houston Park ---- Phase I RV Campground Phase I RV Campground Phase I RV Campground Phase I RV Campground
Number of Sites 120
Annual Occupancy 40%
Occupied Site - Nights 17,520
Rental RevenueAverage Rate 37.50$ Amount 657,000$
Miscellaneous RevenuePer Site-Night 3.00$ Amount 52,560
Total Revenue 709,560$
Operating Income Margin 40%
Amount 283,824$ Source: Economics Research Associates
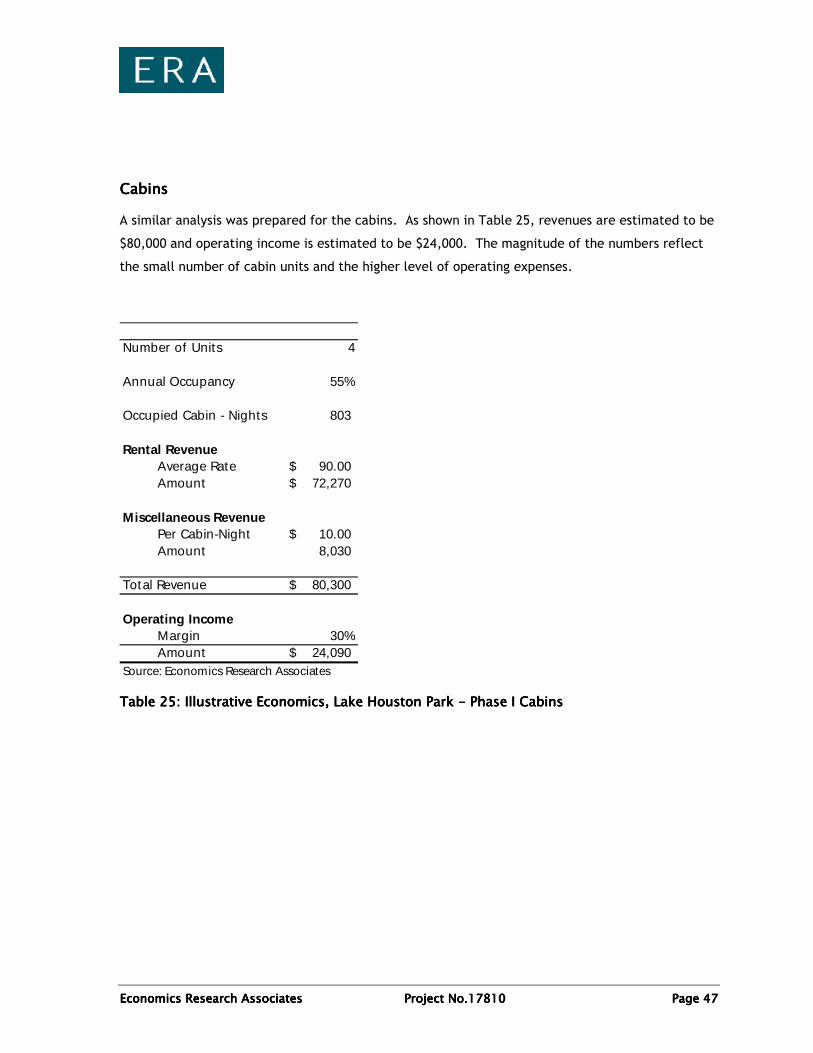
Economics ReseEconomics ReseEconomics ReseEconomics Research Associatesarch Associatesarch Associatesarch Associates Project No.17810Project No.17810Project No.17810Project No.17810 Page Page Page Page 47474747
CabinsCabinsCabinsCabins
A similar analysis was prepared for the cabins. As shown in Table 25, revenues are estimated to be
$80,000 and operating income is estimated to be $24,000. The magnitude of the numbers reflect
the small number of cabin units and the higher level of operating expenses.
Table Table Table Table 25252525: Illustrative Economics, : Illustrative Economics, : Illustrative Economics, : Illustrative Economics, Lake Houston Park Lake Houston Park Lake Houston Park Lake Houston Park ---- Phase I Phase I Phase I Phase I CabinsCabinsCabinsCabins
Number of Units 4
Annual Occupancy 55%
Occupied Cabin - Nights 803
Rental RevenueAverage Rate 90.00$ Amount 72,270$
Miscellaneous RevenuePer Cabin-Night 10.00$ Amount 8,030
Total Revenue 80,300$
Operating Income Margin 30%Amount 24,090$
Source: Economics Research Associates
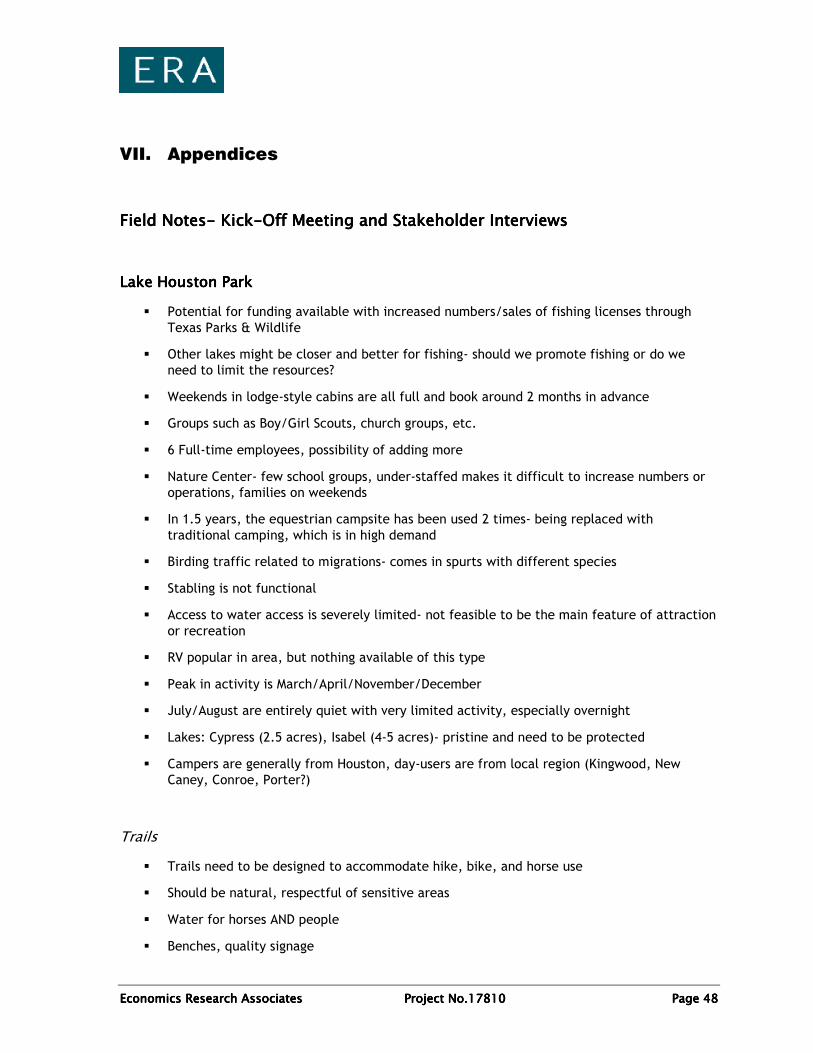
Economics ReseEconomics ReseEconomics ReseEconomics Research Associatesarch Associatesarch Associatesarch Associates Project No.17810Project No.17810Project No.17810Project No.17810 Page Page Page Page 48484848
VII. Appendices
Field NotesField NotesField NotesField Notes---- Kick Kick Kick Kick----Off MeOff MeOff MeOff Meeting and Stakeholder Interviewseting and Stakeholder Interviewseting and Stakeholder Interviewseting and Stakeholder Interviews
Lake Houston ParkLake Houston ParkLake Houston ParkLake Houston Park
� Potential for funding available with increased numbers/sales of fishing licenses through Texas Parks & Wildlife
� Other lakes might be closer and better for fishing- should we promote fishing or do we need to limit the resources?
� Weekends in lodge-style cabins are all full and book around 2 months in advance
� Groups such as Boy/Girl Scouts, church groups, etc.
� 6 Full-time employees, possibility of adding more
� Nature Center- few school groups, under-staffed makes it difficult to increase numbers or operations, families on weekends
� In 1.5 years, the equestrian campsite has been used 2 times- being replaced with traditional camping, which is in high demand
� Birding traffic related to migrations- comes in spurts with different species
� Stabling is not functional
� Access to water access is severely limited- not feasible to be the main feature of attraction or recreation
� RV popular in area, but nothing available of this type
� Peak in activity is March/April/November/December
� July/August are entirely quiet with very limited activity, especially overnight
� Lakes: Cypress (2.5 acres), Isabel (4-5 acres)- pristine and need to be protected
� Campers are generally from Houston, day-users are from local region (Kingwood, New Caney, Conroe, Porter?)
Trails
� Trails need to be designed to accommodate hike, bike, and horse use
� Should be natural, respectful of sensitive areas
� Water for horses AND people
� Benches, quality signage

Economics ReseEconomics ReseEconomics ReseEconomics Research Associatesarch Associatesarch Associatesarch Associates Project No.17810Project No.17810Project No.17810Project No.17810 Page Page Page Page 49494949
� Connectivity to surrounding neighborhoods needs to be considered and addressed
Water Sports
� Water access at Peach Creek is ok, not great
� San Jacinto boat ramp is good access point, but access to the ramp is difficult with poor roads
� Could there be shuttle service to 5-mile road?
Wading/Fishing
� Long distances to fishing at Lake Isabel and Caney Creek
� White bass spawn for about 3 weeks, making it ideal for fishing
� They would like a space for fish cleaning, and the ability to buy licenses on site
� Ideally, lighted piers and pier access would be welcomed, and if deemed appropriate, bait shop, etc.
� May be funding available through education programs related to Texas Parks & Wildlife teaching fishing, archery, and boat safety in schools
� Some sort of green transportation to and from the fishing sites
� Long distances to fishing at Lake Isabel and Caney Creek
Camping
� RV with electric, restrooms with showers
� Screened-in shelters
� Cabins with restrooms
� Car and tent camping
� An improved group area
Bird/Picnicking/Programming/Orienteering
� Potential to generate income
� Geocaching
� More bathrooms!
� Nature Center- only nature center in Montgomery County
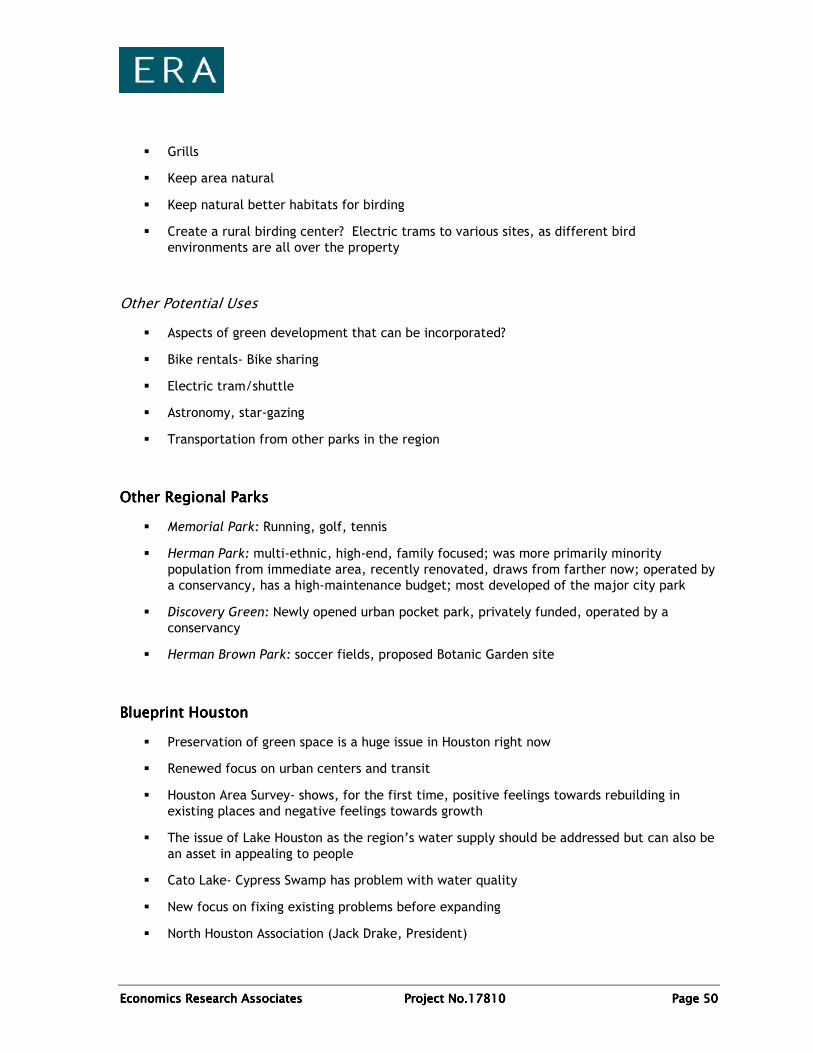
Economics ReseEconomics ReseEconomics ReseEconomics Research Associatesarch Associatesarch Associatesarch Associates Project No.17810Project No.17810Project No.17810Project No.17810 Page Page Page Page 50505050
� Grills
� Keep area natural
� Keep natural better habitats for birding
� Create a rural birding center? Electric trams to various sites, as different bird environments are all over the property
Other Potential Uses
� Aspects of green development that can be incorporated?
� Bike rentals- Bike sharing
� Electric tram/shuttle
� Astronomy, star-gazing
� Transportation from other parks in the region
Other Regional ParkOther Regional ParkOther Regional ParkOther Regional Parkssss
� Memorial Park: Running, golf, tennis
� Herman Park: multi-ethnic, high-end, family focused; was more primarily minority population from immediate area, recently renovated, draws from farther now; operated by a conservancy, has a high-maintenance budget; most developed of the major city park
� Discovery Green: Newly opened urban pocket park, privately funded, operated by a conservancy
� Herman Brown Park: soccer fields, proposed Botanic Garden site
Blueprint HoustonBlueprint HoustonBlueprint HoustonBlueprint Houston
� Preservation of green space is a huge issue in Houston right now
� Renewed focus on urban centers and transit
� Houston Area Survey- shows, for the first time, positive feelings towards rebuilding in existing places and negative feelings towards growth
� The issue of Lake Houston as the region’s water supply should be addressed but can also be an asset in appealing to people
� Cato Lake- Cypress Swamp has problem with water quality
� New focus on fixing existing problems before expanding
� North Houston Association (Jack Drake, President)

Economics ReseEconomics ReseEconomics ReseEconomics Research Associatesarch Associatesarch Associatesarch Associates Project No.17810Project No.17810Project No.17810Project No.17810 Page Page Page Page 51515151
� There are 144 municipalities in the County, therefore, building takes place outside of them where there are not laws or regulation
� Harris County has no zoning, no planning
� Suburban home prices have decreased while city properties increase (within versus outside of the loop)
� Of major metropolitan areas, Houston has the lowest housing costs, highest transportation costs, lowest home ownership
� Alvin and Waller Texas are doing strong planning and trying to get central developments
� Other Areas: Attax Reservoir, Terry Hershey Park (highly-utilized), Bear Creek Park, Sam Houston National Forest, Armand Bayou State Forest, Brazos Bend State Park
� Other vacation areas: Lake Conroe, Galveston, San Antonio, New Orleans, Lake Charles, Cusan (?) Indian Reservation
� Trains: North Rail line planned for airport end, the Cypress rail is planned to extend to Naracota
Grand ParkwayGrand ParkwayGrand ParkwayGrand Parkway
� Long term plan
� Katy Prairie Preservation has (probably) successfully fought it (Maria Piacintini- ED)
� Sierra Club is focusing on protecting the Northeast quadrant and fighting the parkway
East Montgomery CounEast Montgomery CounEast Montgomery CounEast Montgomery County Improvement District (EMCID)ty Improvement District (EMCID)ty Improvement District (EMCID)ty Improvement District (EMCID)
� Political subdivision of Texas state, a state organization
� Locally controlled, board of 8 local, elected officials
� Revenue derived from one percent sales tax in 158 square-miles
� Goals are economic development, grant funding to local non-profits and community organizations, and scholarship ($1,000 for each student graduating from the school district)
� Special purpose district, adds additional sales tax where the money is allocated to fire, police, etc.
� Recently targeting industrial areas: location near Dallas-Houston-Shreveport-Port of Houston, close to airport, expanding existing park between 70-250 acres
� Great deal of retail development (1,000,000 sf at Grand Parkway and 59), some Town Center developments, retail/town center @ 59 & Northpark
� Most development in the County is focused in the Southern part of the County
� People are moving to the County to escape the congestion of Houston

Economics ReseEconomics ReseEconomics ReseEconomics Research Associatesarch Associatesarch Associatesarch Associates Project No.17810Project No.17810Project No.17810Project No.17810 Page Page Page Page 52525252
� 74 people move to Montgomery County every day
� Transitioning population
� City government and services are in good financial shape
� County recently repealed ban on liquor, which has brought tremendous growth in restaurants, etc.
Earth QuestEarth QuestEarth QuestEarth Quest
� Planned $50 million museum
� Six Flags and Astroworld closed
� To include 4 hotels, museum, visitor center, retail, mixed use outlet, town center development, residential
� Expecting between 2-2.5 million annual visitors
� An average of 2-day stay, without retail, so perhaps 2.5 days
� $700 million on theme park
� Contour Entertainment is designing the amusement aspects
� $4.5 million funded by EMCID, $600,000 already reimbursed
� By June 2009, anticipate having $11-$12 million (developers) and $4-$4.5 million (EMCID)
� Educational institute to include institute for research, museums, IMAX
� Fundraising for the institute will begin in May, $15-$20 million in the first phase
� Include waterpark, family entertainment center (only one in region closed)
� RV market is saturated, not going to be in the park
� Park is a three year build out, a 2012 big open
� Hotel 1 & 2 in Phase I- 400 boutique, Great Wolf style and 350 room, also themed
� Government supports Earth Quest- legislature passed funding to allow venue tax, admission, etc.
Houston Convention & Visitors Bureau (CVB)Houston Convention & Visitors Bureau (CVB)Houston Convention & Visitors Bureau (CVB)Houston Convention & Visitors Bureau (CVB)
� State is increasing funding for Parks, historically underfunded
� Camping, outdoor rec not a huge priority for Houston visitors
� European and Asian tourists are always interested in camping, bargain facilities
� Austin and West Texas (Big Bend) capitalize on budget and outdoor travelers

Economics ReseEconomics ReseEconomics ReseEconomics Research Associatesarch Associatesarch Associatesarch Associates Project No.17810Project No.17810Project No.17810Project No.17810 Page Page Page Page 53535353
� Shuttle to airport
� Snowbirds would welcome place for long-term RV
� Winter Texans predominantly in Galveston, McAllen
� Birding is growing and is big in the area
� People would be willing to take a one day trip to hike or bike (both casual and serious)
� Locals are interested in outdoor recreation
� Would be willing to work with promotion
� Houston has decent trails, but not compared to other people
� Tour de Houston, recent biking event sold out
� Need nice facilities to attract people and to market
� Touring groups- groups love guided experiences
� Canadians and those from the Northern US in RVs area good market- they spend less, and generally go to McAllen
� Fishing, water activities are typically concentrated in the bay area
� Galveston and Freeport are huge personal boating markets
� Lake Conroe is big on boating, people from Houston daytrip there
� No place offers overnight camping or accommodations- would likely be a market for this
� Houston is so large (50-60 miles from East to West), that people need to stay overnight within the city
� Grand Parkway would give the Park immediate access to Space Center
� Big attractions in Houston market: Space Center Houston, Museum of Natural Science, MFA Houston, Children’s Museum of Houston, Health Museum, Houston Zoo, Downtown Aquarium, George Ranch Historical Park
� Hotel clusters: Downtown, Galleria, Airport, I-10, Space Center
� Lake Conroe is huge in development- resorts, etc. but Lake Houston is closer and could be a bigger draw
� Trains in the future will increase development opportunities
� Texas and Houston have a car culture- would love opportunity to get out in high end outdoor experience- botanical garden, restaurant in wooded setting
� Astroworld closed as a part of Six Flags restructuring- it was least profitable of Six Flags, but also poorly maintained and little investment, June-September was peak season, drew on the I-10 corridor from San Antonio to New Orleans, VFR
� NASA is entirely drawing from the Dallas market
� Needs better signage and infrastructure to draw

Economics ReseEconomics ReseEconomics ReseEconomics Research Associatesarch Associatesarch Associatesarch Associates Project No.17810Project No.17810Project No.17810Project No.17810 Page Page Page Page 54545454
� Houston Wilderness Society- trails around the city
� No ecotourism- Buffalo Bayou has been a draw
� Trader’s Village- well-developed RV park on 290, concerts, flea markets, camping, crawfish boils (GM Mike Baxter)
� State camping has some RV information
� Houston = 32 million visitors (State research)
� Houston CVB= 10 million roomnights/2.7 night average LOS, 80% corporate, 20% in state
Houston Parks BoardHouston Parks BoardHouston Parks BoardHouston Parks Board
� Acquires property, park land, bayou frontage
� Once fundraising requirements are more obvious, work with the city to assist
� Initial funds for LHP from Woodlands as $ to the city to prevent annexation
� Nature activities such as education, conference facilities, zip line
� Still looking at locations for Botanic Garden- not a good fit with LHP
� Destination education facility
� LHP has the perception of being far away
� Cullen Park- 10,000 acres, ballfields, golf, velodrome, active recreation
� George Bush Park- County owned, Corps/Engineers, passive recreation
� No destination resort parks in the region
� Angelina National Forest
� San Marcos is big water, but people would go somewhere else if the opportunity existed
� City recently opened first velodrome, skate park, and would like climbing wall, aqua/wave park
� Some sort of green and natural water park
� Need to consider mosquitoes
� Cabins should be conditioned for year-round use
� Eco cabins? Tents? Tree houses?
� A net covered pool?
� Northeast Houston has always been slow-developing, perceived as industrial, land values are much lower, though Kingwood is popular, off the radar, undiscovered
� Horseback riding and stabling are in high demand

Economics ReseEconomics ReseEconomics ReseEconomics Research Associatesarch Associatesarch Associatesarch Associates Project No.17810Project No.17810Project No.17810Project No.17810 Page Page Page Page 55555555
� An archery range is not well-utilized
� Velodrome is not immensely popular either, operated by a separate non-profit now
� Harris City built a mountain bike hill, not in use
� Trails growing
� Some sort of “green people mover”?
� Jumping, flying, other adventure?
Houston Parks and Recreation DeparHouston Parks and Recreation DeparHouston Parks and Recreation DeparHouston Parks and Recreation Department (HPARD)tment (HPARD)tment (HPARD)tment (HPARD)
� Would love to see a “green” research center of some sort with focus on water, reducing the cost of purification, etc. Could join with local (or non-local) University and have intern-style dorm housing
� Working on purchasing land on the watershed of Lake Houston
� Some sort of dorm facility could be used by schools, colleges (A&M, U of H, Stephen F. Austin), girl and boy scouts, camps, etc.
� Waterworks- Public Works planned water museum for on the Lake- would it be possible to connect attractions at the Park with the museum via pontoon or other low-bottomed boat?
� There is also a Harris County mitigation bank that could be included on an educational itinerary
� Possibility of relocating regional TPWD headquarters from LaPorte to the site
� Name is misleading- possibility to change and even offer naming rights with “XX Park in/at New Caney”
� Developer has purchased nearby property (3,200 acres to the East)
� Currently LHP is still on TPWD reservation system
� Since the City has taken over, they’ve had 2x the traffic and have doubled the budget
� It is only 35 minutes from Houston on the easiest highway (59) in the region
� The Mayor (and others) want it preserved as a wilderness park
� Observation tower? Fire tower?
� Some sort of pavilion for meetings, events, RVers to congregate, A/C, concessions, game rentals, etc.
� Would like to have a more hospitable check-in station, like at a resort or hotel
� Flooding is still a concern
� There are 33 (?) elementary schools near there, that are not even included in the Houston School District, so there is a large student base

Economics ReseEconomics ReseEconomics ReseEconomics Research Associatesarch Associatesarch Associatesarch Associates Project No.17810Project No.17810Project No.17810Project No.17810 Page Page Page Page 56565656
� Great Lodge? Cabins?
� Possibility of Toll Road in 2010-2011, would like to be able to enter toll road from 59 and exit to park without paying the toll
� There is a community college in Kingwood with around 50-60,000 students
� Huntsville State Park- driven by lake recreation, also college driving activity
� The Lake has 11 miles of waterfront, but limited access
� Potential to build lodge and bring in operator? Bring in outside developer to build and operate lodge? Lower investment, but more challenging to find someone willing to do that
� Horse access is unique in region, except Sam Rayburn Park, people want to rent and house horses
� Would like concessionaires to operate all services and rentals
� Event rental opportunities?
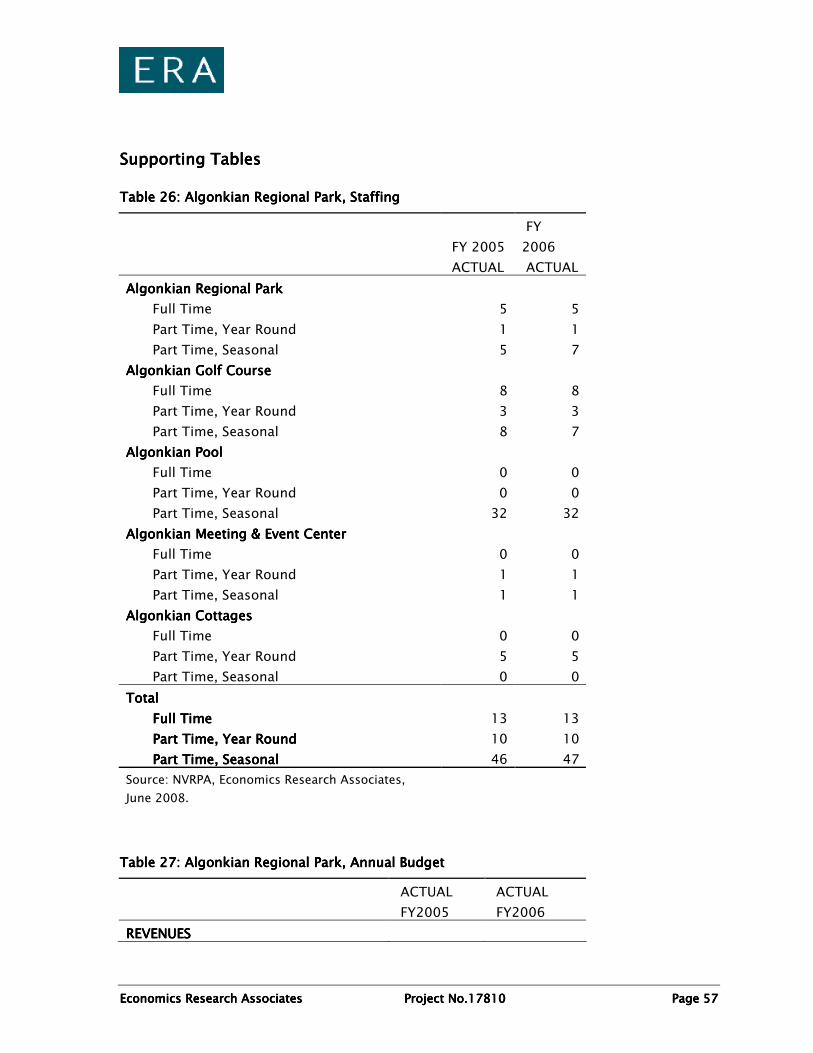
Economics ReseEconomics ReseEconomics ReseEconomics Research Associatesarch Associatesarch Associatesarch Associates Project No.17810Project No.17810Project No.17810Project No.17810 Page Page Page Page 57575757
Supporting TablesSupporting TablesSupporting TablesSupporting Tables
Table Table Table Table 26262626: Algonkian Regional Park, Staffing: Algonkian Regional Park, Staffing: Algonkian Regional Park, Staffing: Algonkian Regional Park, Staffing
FY 2005
FY
2006
ACTUAL ACTUAL
Algonkian Regional Park Algonkian Regional Park Algonkian Regional Park Algonkian Regional Park
Full Time 5 5
Part Time, Year Round 1 1
Part Time, Seasonal 5 7
Algonkian Golf Course Algonkian Golf Course Algonkian Golf Course Algonkian Golf Course
Full Time 8 8
Part Time, Year Round 3 3
Part Time, Seasonal 8 7
Algonkian Pool Algonkian Pool Algonkian Pool Algonkian Pool
Full Time 0 0
Part Time, Year Round 0 0
Part Time, Seasonal 32 32
Algonkian Meeting & Event Center Algonkian Meeting & Event Center Algonkian Meeting & Event Center Algonkian Meeting & Event Center
Full Time 0 0
Part Time, Year Round 1 1
Part Time, Seasonal 1 1
Algonkian Cottages Algonkian Cottages Algonkian Cottages Algonkian Cottages
Full Time 0 0
Part Time, Year Round 5 5
Part Time, Seasonal 0 0
TotalTotalTotalTotal
Full Time Full Time Full Time Full Time 13 13
Part Time, Year Round Part Time, Year Round Part Time, Year Round Part Time, Year Round 10 10
Part Time, Seasonal Part Time, Seasonal Part Time, Seasonal Part Time, Seasonal 46 47
Source: NVRPA, Economics Research Associates,
June 2008.
TTTTable able able able 27272727: Algonkian Regional Park, Annual Budget: Algonkian Regional Park, Annual Budget: Algonkian Regional Park, Annual Budget: Algonkian Regional Park, Annual Budget
ACTUAL ACTUAL
FY2005 FY2006
REVENUES REVENUES REVENUES REVENUES
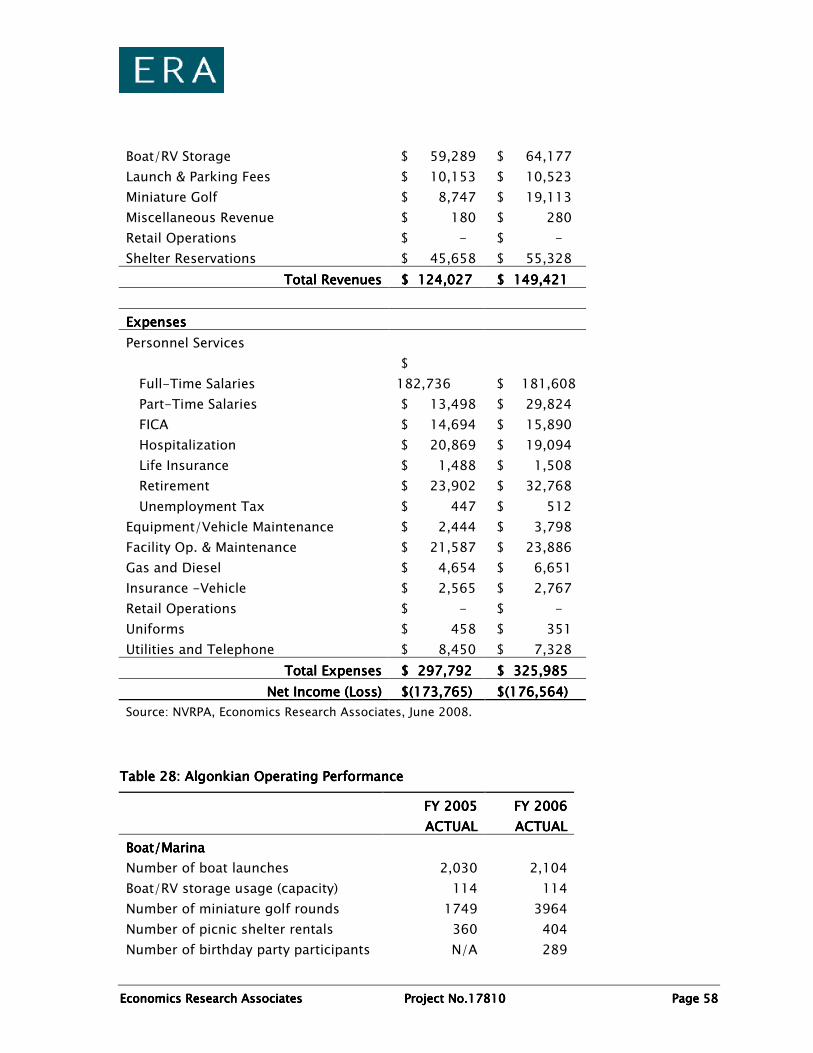
Economics ReseEconomics ReseEconomics ReseEconomics Research Associatesarch Associatesarch Associatesarch Associates Project No.17810Project No.17810Project No.17810Project No.17810 Page Page Page Page 58585858
Boat/RV Storage $ 59,289 $ 64,177
Launch & Parking Fees $ 10,153 $ 10,523
Miniature Golf $ 8,747 $ 19,113
Miscellaneous Revenue $ 180 $ 280
Retail Operations $ - $ -
Shelter Reservations $ 45,658 $ 55,328
Total RevenuesTotal RevenuesTotal RevenuesTotal Revenues $ 124,027 $ 124,027 $ 124,027 $ 124,027 $ 149,421 $ 149,421 $ 149,421 $ 149,421
ExpensesExpensesExpensesExpenses
Personnel Services
Full-Time Salaries
$
182,736 $ 181,608
Part-Time Salaries $ 13,498 $ 29,824
FICA $ 14,694 $ 15,890
Hospitalization $ 20,869 $ 19,094
Life Insurance $ 1,488 $ 1,508
Retirement $ 23,902 $ 32,768
Unemployment Tax $ 447 $ 512
Equipment/Vehicle Maintenance $ 2,444 $ 3,798
Facility Op. & Maintenance $ 21,587 $ 23,886
Gas and Diesel $ 4,654 $ 6,651
Insurance -Vehicle $ 2,565 $ 2,767
Retail Operations $ - $ -
Uniforms $ 458 $ 351
Utilities and Telephone $ 8,450 $ 7,328
Total ExpensesTotal ExpensesTotal ExpensesTotal Expenses $ 297,792 $ 297,792 $ 297,792 $ 297,792 $ 325,985 $ 325,985 $ 325,985 $ 325,985
Net Income (Loss)Net Income (Loss)Net Income (Loss)Net Income (Loss) $(173,765) $(173,765) $(173,765) $(173,765) $(176,564) $(176,564) $(176,564) $(176,564)
Source: NVRPA, Economics Research Associates, June 2008.
Table Table Table Table 28282828: Algonkian Operating Performance: Algonkian Operating Performance: Algonkian Operating Performance: Algonkian Operating Performance
FY 2005 FY 2005 FY 2005 FY 2005 FY 2006FY 2006FY 2006FY 2006
ACTUALACTUALACTUALACTUAL ACTUALACTUALACTUALACTUAL
Boat/MarinaBoat/MarinaBoat/MarinaBoat/Marina
Number of boat launches 2,030 2,104
Boat/RV storage usage (capacity) 114 114
Number of miniature golf rounds 1749 3964
Number of picnic shelter rentals 360 404
Number of birthday party participants N/A 289
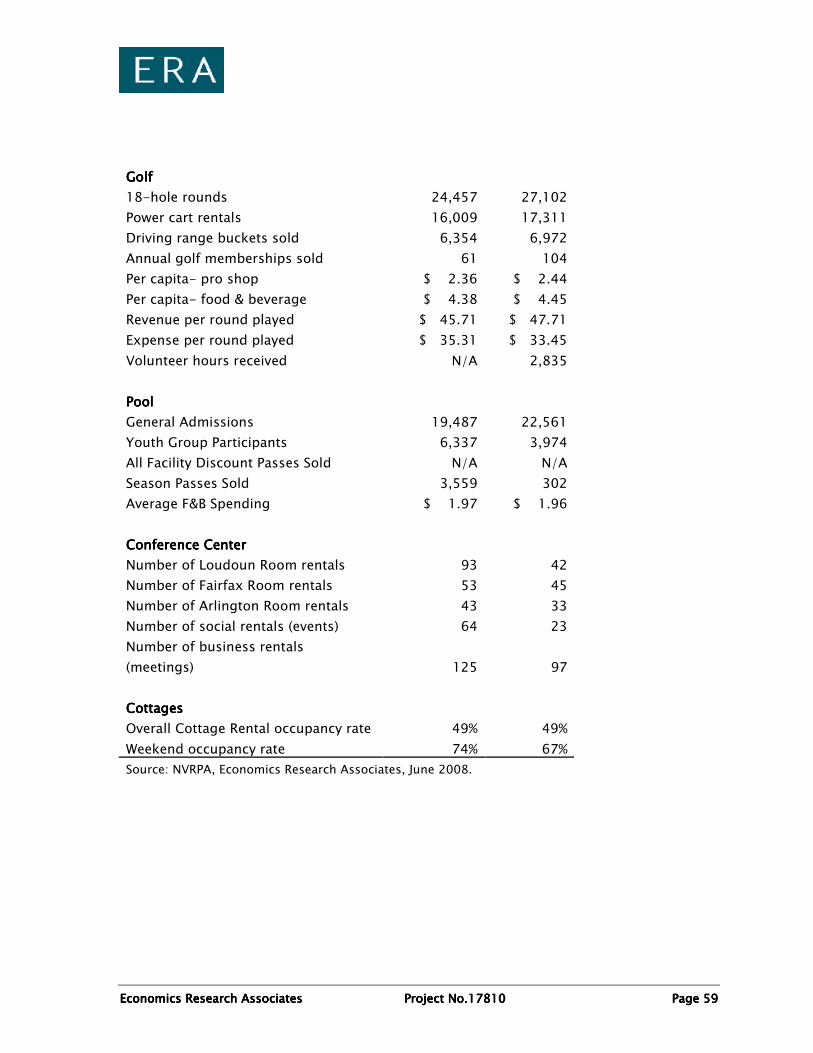
Economics ReseEconomics ReseEconomics ReseEconomics Research Associatesarch Associatesarch Associatesarch Associates Project No.17810Project No.17810Project No.17810Project No.17810 Page Page Page Page 59595959
GolfGolfGolfGolf
18-hole rounds 24,457 27,102
Power cart rentals 16,009 17,311
Driving range buckets sold 6,354 6,972
Annual golf memberships sold 61 104
Per capita- pro shop $ 2.36 $ 2.44
Per capita- food & beverage $ 4.38 $ 4.45
Revenue per round played $ 45.71 $ 47.71
Expense per round played $ 35.31 $ 33.45
Volunteer hours received N/A 2,835
PoolPoolPoolPool
General Admissions 19,487 22,561
Youth Group Participants 6,337 3,974
All Facility Discount Passes Sold N/A N/A
Season Passes Sold 3,559 302
Average F&B Spending $ 1.97 $ 1.96
Conference CenterConference CenterConference CenterConference Center
Number of Loudoun Room rentals 93 42
Number of Fairfax Room rentals 53 45
Number of Arlington Room rentals 43 33
Number of social rentals (events) 64 23
Number of business rentals
(meetings) 125 97
CottagesCottagesCottagesCottages
Overall Cottage Rental occupancy rate 49% 49%
Weekend occupancy rate 74% 67%
Source: NVRPA, Economics Research Associates, June 2008.

Economics ReseEconomics ReseEconomics ReseEconomics Research Associatesarch Associatesarch Associatesarch Associates Project No.17810Project No.17810Project No.17810Project No.17810 Page Page Page Page 60606060
Figure Figure Figure Figure 6666: Algonkian : Algonkian : Algonkian : Algonkian Regional ParkRegional ParkRegional ParkRegional Park

Economics ReseEconomics ReseEconomics ReseEconomics Research Associatesarch Associatesarch Associatesarch Associates Project No.17810Project No.17810Project No.17810Project No.17810 Page Page Page Page 61616161
Figure Figure Figure Figure 7777: Tims Ford State Park: Tims Ford State Park: Tims Ford State Park: Tims Ford State Park

Economics ReseEconomics ReseEconomics ReseEconomics Research Associatesarch Associatesarch Associatesarch Associates Project No.17810Project No.17810Project No.17810Project No.17810 Page Page Page Page 62626262
Source: Tims Ford State Park, 2008.
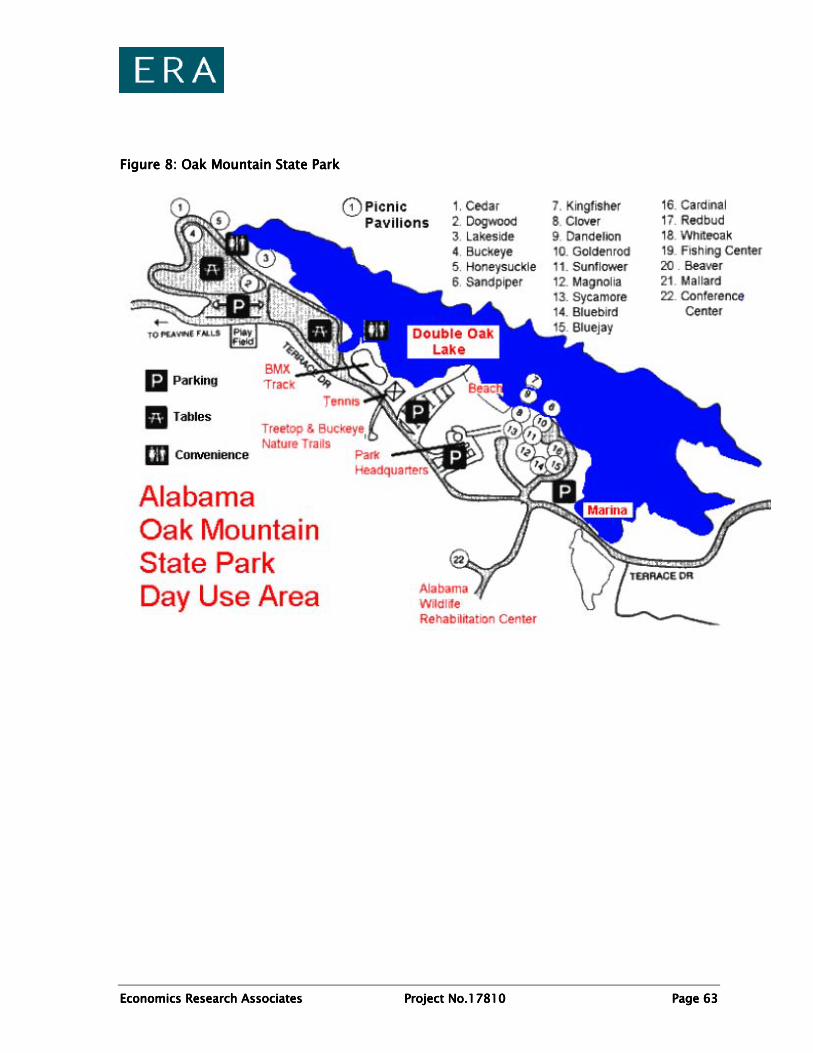
Economics ReseEconomics ReseEconomics ReseEconomics Research Associatesarch Associatesarch Associatesarch Associates Project No.17810Project No.17810Project No.17810Project No.17810 Page Page Page Page 63636363
Figure Figure Figure Figure 8888: Oak Mountain State Park: Oak Mountain State Park: Oak Mountain State Park: Oak Mountain State Park

Economics ReseEconomics ReseEconomics ReseEconomics Research Associatesarch Associatesarch Associatesarch Associates Project No.17810Project No.17810Project No.17810Project No.17810 Page Page Page Page 64646464
Presentation Presentation Presentation Presentation---- Opportunities Analysis Opportunities Analysis Opportunities Analysis Opportunities Analysis