Embed Size (px)
Citation preview
Lake Erie Connector National Energy Board Election Certificate Application
Annex 2
Lake Erie Connector Market Assessment Report

LakeMar
PREPAR
ITC L
PREPAR
Judy Ch
Johann
J. Micha
Akarsh S
May 20
e Erierket A
RED FOR
Lake Er
RED BY
hang
es Pfeifenb
ael Hagerty
Sheilendra
015
e ConAssess
rie Con
berger
y
nath
nnectosmen
nnecto
or nt Rep
or LLC
port

6389043 8
This repo
responsib
clients.
Copyright ©
ort was prep
bility of the
© 2015 The Brattle
pared for ITC
authors and
e Group, Inc.
C Lake Erie
d do not rep
Connector
present the o
LLC. All re
opinion of T
esults and an
The Brattle G
i | brattl
ny errors ar
Group, Inc.
e.com
re the
or its

1
Table of Content
Executive Summary .............................................................................................................................. 2
I. Purpose and Scope of Market Assessment Report ..................................................................... 4
II. Background on the IESO and PJM Markets and Merchant Transmission Development ....... 4
A. IESO and PJM Markets and the Lake Erie Connector ..................................................... 4
1. Ontario Electric Power System and its Interties ..................................................... 6
2. PJM Electric Power System and its Interties......................................................... 10
B. Merchant Transmission Project Development ............................................................... 12
1. Merchant Transmission Development in North America .................................... 13
2. Merchant Development of the Lake Erie Connector ........................................... 15
3. Operating the Bi-Directional HVDC Lake Erie Connector.................................. 16
III. Sources of Value for the Lake Erie Connector ......................................................................... 17
A. Value Through Energy Trades ........................................................................................ 17
1. Historical Wholesale Energy Price Patterns ......................................................... 18
2. Current Energy Trades Between Ontario and PJM and Associated
Transaction Costs .................................................................................................... 20
B. Potential Capacity Market Value .................................................................................... 22
1. Ontario Capacity Market Fundamentals and Potential Future Development .... 23
2. PJM Capacity Market ............................................................................................. 26
C. Renewable Energy Credits and Clean Energy ................................................................ 28
D. Carbon Pricing in Ontario and the U.S. Clean Power Plan ........................................... 30
IV. Open Solicitation Process ......................................................................................................... 31
2
Executive Summary
The Lake Erie Connector (or the “Project”) is a 1,000 MW, bi-directional high-voltage direct
current (“HVDC”) submarine transmission line proposed to be built between Nanticoke, Ontario
and Erie, Pennsylvania by ITC Lake Erie Connector LLC (“ITC Lake Erie”). The Project will be
the first direct connection between the wholesale electricity markets operated by the
Independent Electricity System Operator (“IESO”) in Ontario and the PJM Interconnection LLC
(“PJM”), which is one of the world’s largest power markets with a U.S. footprint spanning from
Virginia and New Jersey in the east reaching west to include Ohio and Illinois.
ITC Lake Erie is developing the Project on a merchant basis, which means that ITC Lake Erie
will bear the full costs and risks of the Project. ITC Lake Erie will need to attract sufficient
interest from transmission customers (“transmission customers”) to contract for capacity on the
line before initiating construction of the Project.
This Market Assessment Report provides an assessment of the market fundamentals of the
Ontario and PJM wholesale electricity markets, the sources of “merchant value” of the Project
and some of the future drivers likely to influence the value of the Project. The revenues that ITC
Lake Erie can expect from selling transmission capacity on the Project will be determined
through the open solicitation process expected to commence in 2015.
Based on our market assessment, we come to the following conclusions:
Since the Project is being developed on a merchant basis, ratepayers in Ontario will not
bear the costs of the Project through regulated transmission rates. Other merchant
transmission projects, including the Montana Alberta Tie-Line between Canada and the
U.S., have delivered value to customers and increased efficient trading between markets.
Just like other merchant transmission projects, potential transmission customers will offer
to reserve transmission capacity at prices based on the value they ascribe to the Project.
The transmission customers will be selected via an open solicitation to enter into
transmission service contracts that will provide the necessary revenues for ITC Lake Erie
to build and finance the Project.
Electricity trade between Ontario’s IESO-operated wholesale electricity market and U.S.
markets is currently constrained by limits of the existing transmission capability. The
Project, being the first direct connection between the IESO and PJM wholesale electricity
markets, will increase the import and export capability between Ontario and the U.S. and
thereby increase the magnitude and efficiency of trades that benefit market participants
on both sides of the border.
Currently, electricity trade between Ontario and PJM is limited by significant
transactional costs imposed on transmission customers due to lack of a direct connection
between the two markets and limited transmission capability on alternate paths. The ITC
3
Lake Erie Connector would provide a direct path for trade between Ontario and PJM and
would avoid some of the transmission, administrative, congestion, and loss charges
associated with existing paths.
Based on the differences in market fundamentals in Ontario and PJM, particularly the
resource diversity across the two markets, the Project provides opportunities to trade
energy (including ancillary services), capacity, and clean energy products across the two
markets with lower administrative and congestion charges.
Historically, the IESO and PJM markets have exhibited significant energy price
differentials. These price differentials are a source of market value to transmission
customers and the basis for energy (and ancillary services) trades that will benefit both
markets. While these price differential patterns could change in the future as market
conditions change, electricity consumers would continue to benefit from the Project as it
will facilitate a more competitive and efficient use of supply resources in both markets.
Ontario’s recent initiatives to allow trading of firm generating “capacity” (in addition to
energy on an as available basis) across its interties could provide transmission customers
with another significant source of value. Exporting excess generation capacity that may
exist in one market to the other offers long-term cost reductions to both markets.
Furthermore, Ontario’s nuclear facilities are scheduled for refurbishments or retirement
between 2017 and 2030, creating a potential capacity shortfall in Ontario. Ontario could
benefit from transmission customers exporting lower-cost generating capacity from PJM
to meet Ontario’s capacity needs. The Project, by providing a direct connection, will
enable firm generating capacity to be traded between the two markets.
Renewable Portfolio Standards (“RPS”) of various PJM states, environmental regulation of
greenhouse gases (GHG) in the U.S., and the emergence of carbon pricing policies in
Ontario, offer a potential additional source of value for transmission customers and ITC
Lake Erie. Clean energy sources can capture market value above and beyond what can be
realized through energy and capacity markets. The Project may enable sales of renewable
generation attributes, known as renewable energy credits (“RECs”), to the PJM market to
fulfill PJM states’ incremental RPS requirements; and, may likewise enable the sale of
renewable energy products into Ontario.
ITC Lake Erie is currently preparing to initiate the open solicitation process to invite potential
transmission customers to express their interest in contracting for transmission capacity on the
Project. The open solicitation will provide an initial level of interest and ITC Lake Erie will then
engage in negotiations with potential transmission customers.
4
I. Purpose and Scope of Market Assessment Report
ITC Lake Erie is pursuing the Project on a merchant basis. ITC Lake Erie will bear the costs and
risks of the Project and must attract sufficient interest from transmission customers to contract
for capacity on the line before initiating construction of the Project. This approach differs from
the process for approving and building regulated transmission, for which costs are recovered
from ratepayers based on regulated transmission rates.
The specific magnitude of the revenues that ITC Lake Erie can expect from selling the capacity
on the Project will be determined by the results of the open solicitation and the ensuing
negotiations with potential transmission customers.
The scope of this Market Assessment Report includes:
Explanation of how a merchant transmission project differs from regulated transmission
investments and examples of recent HVDC merchant transmission lines built or under
development in North America;
Description of the current IESO and PJM market fundamentals;
Identification of the sources of value in increasing trade between the two markets and
some of the most significant drivers of future value; and,
Outline of the next steps in the open solicitation process for engaging with parties
interested in contracting for transmission capacity on the Project.
II. Background on the IESO and PJM Markets and Merchant Transmission Development
The proposed Project will be the first direct connection between the IESO and PJM wholesale
electricity markets as well as the first merchant transmission line to interconnect Ontario with
an adjacent system. In this section, we provide a description of the fundamentals of the Ontario
and the PJM wholesale electricity markets, focusing on the relevant features of these markets
that may drive the value of the Project.
A. IESO AND PJM MARKETS AND THE LAKE ERIE CONNECTOR
North America’s electricity transmission system is made up of four interconnections with all of
the electric utilities within each interconnection electrically tied together during normal system
conditions and operated at a synchronized frequency. Figure 1 shows that the Eastern
Interconnection covers the majority of the area east of the Rocky Mountains (excluding most of
Texas and all of Québec), including Ontario (within Northeast Power Coordinating Council or
“NPCC”) and PJM (which coincides roughly with the “RFC” area which stands for
ReliabilityFirst Corporation). Figure 2 below shows the geographic coverage of the various

5
organized regional electric system and associated wholesale markets operated by independent
system operators.
Figure 1 North America Electric Reliability Corporation Interconnections and Regional Entities
Source: NERC, Key Players, accessed September 25, 2014, online at
http://www.nerc.com/AboutNERC/keyplayers/Pages/default.aspx

The exte
neighbor
being geo
PJM elec
for the m
economic
In this se
with neig
PJM, and
The Onta
2014, the
consisted
1 Intert
transf
2 IESO,
http://
Source: I
ent to which
ring systems
ographically
ctric power s
markets to b
c efficiency.
ection, we p
ghboring sys
d other neigh
1. Ont
ario electric
e total gene
d of nuclear
ties are singl
ferring energy
, Historical H
/www.ieso.ca
Org
ISO/RTC Counc
h each syste
s depends on
y located nea
systems curre
benefit from
rovide an ov
stems, and h
hboring mark
tario Electr
power syste
eration capac
(38%), natu
le tie lines o
y between tw
ourly Ontario
a/Pages/Powe
ganized Regi
cil accessed May
em within a
n the streng
ar each othe
ently do not
the resourc
verview of th
how the Pro
kets.
ric Power Sy
em in 2014 h
city in Onta
ural gas (29%
or groups of
o electric pow
o and Market
r-Data/Dema
6
Figure 2 onal Electric
y 18, 2015 onlin
an interconn
gth of the in
er (on oppos
t have any di
ces available
he Ontario a
oject will fac
ystem and
had a system
ario was 34
%), hydro (2
tie lines tha
wer systems.
Demands, 20
nd.aspx, acce
city Systems
ne at http://www
nection can
nterties betw
site sides of
irect connec
e in the othe
and PJM ma
cilitate incre
d its Intertie
m peak load o
,367 MW a25%) and an
at together p
002-2014, onli
ssed March 3
w.isorto.org/Abo
utilize reso
ween those s
Lake Erie),
ctions betwe
er to improv
arkets, their
eased trade b
es
of 22,800 MW
and the supp
n increasing
provide comb
ine at
30, 2015.
out/default
ources locate
systems.1 De
the Ontario
een them to a
ve reliability
existing int
between On
W.2 As of e
ply resource
amount of
bined capacit
ed in
espite
o and
allow
y and
erties
ntario,
end of
e mix
wind
ty for
generatin
output du
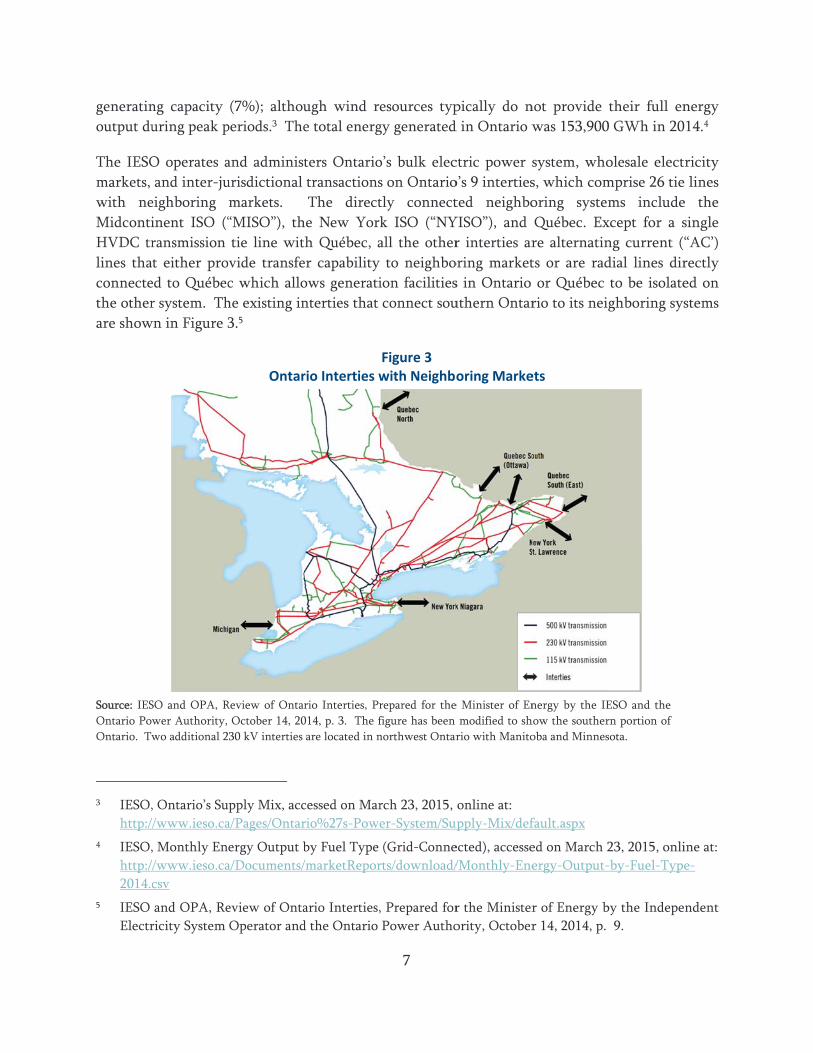
The IESO
markets,
with ne
Midconti
HVDC tr
lines tha
connecte
the other
are show
Source: IES
Ontario Pow
Ontario. Tw
3 IESO,
http://
4 IESO,
http://
2014.c
5 IESO
Electr
ng capacity
uring peak p
O operates a
and inter-ju
eighboring
inent ISO (“
ransmission
t either pro
ed to Québec
r system. Th
wn in Figure 3
SO and OPA, R
wer Authority,
wo additional 2
, Ontario’s Su
/www.ieso.ca
, Monthly En
/www.ieso.ca
csv
and OPA, Re
ricity System
(7%); althou
periods.3 The
and administ
urisdictional
markets.
“MISO”), th
tie line wit
ovide transfe
c which allo
he existing in
3.5
Ontar
Review of Ontar
October 14, 20
30 kV interties
upply Mix, acc
a/Pages/Ontar
ergy Output b
a/Documents/
eview of Onta
Operator and
ugh wind re
e total energ
ters Ontario
transactions
The direct
he New York
th Québec, a
er capability
ows generati
nterties that
rio Interties w
rio Interties, Pr
014, p. 3. The f
are located in n
cessed on Mar
rio%27s-Powe
by Fuel Type
/marketRepor
ario Interties,
d the Ontario
7
esources typ
gy generated
o’s bulk elec
s on Ontario
tly connect
k ISO (“NY
all the other
to neighbo
ion facilities
connect sou
Figure 3 with Neighbo
repared for the
figure has been
northwest Ontar
rch 23, 2015,
er-System/Sup
(Grid-Conne
rts/download/
, Prepared for
Power Autho
pically do n
d in Ontario w
ctric power s
o’s 9 interties
ted neighbo
YISO”), and
r interties ar
oring market
s in Ontario
uthern Ontar
oring Marke
e Minister of En
modified to sh
rio with Manito
online at:
upply-Mix/def
ected), accesse
/Monthly-Ene
r the Minister
ority, October
not provide
was 153,900
system, who
s, which com
oring system
Québec. Ex
re alternatin
ts or are rad
or Québec
rio to its neig
ets
nergy by the IE
how the souther
oba and Minnes
fault.aspx
ed on March 2
ergy-Output-
r of Energy b
r 14, 2014, p.
their full en
0 GWh in 20
olesale elect
mprise 26 tie
ms include
xcept for a s
ng current (“
dial lines dir
to be isolate
ghboring sys
ESO and the
rn portion of
sota.
23, 2015, onli
-by-Fuel-Type
by the Indepe
9.
nergy
14.4
ricity
lines
e the
single
“AC’)
rectly
ed on
stems
ine at:
e-
ndent
8
The IESO also operates a real-time wholesale electricity market for energy and operating reserve.
The IESO wholesale energy market clears at a uniform, province-wide market price to settle all
internal generation and loads. The hourly province-wide energy price is termed the “Hourly
Ontario Energy Price” (“HOEP”).
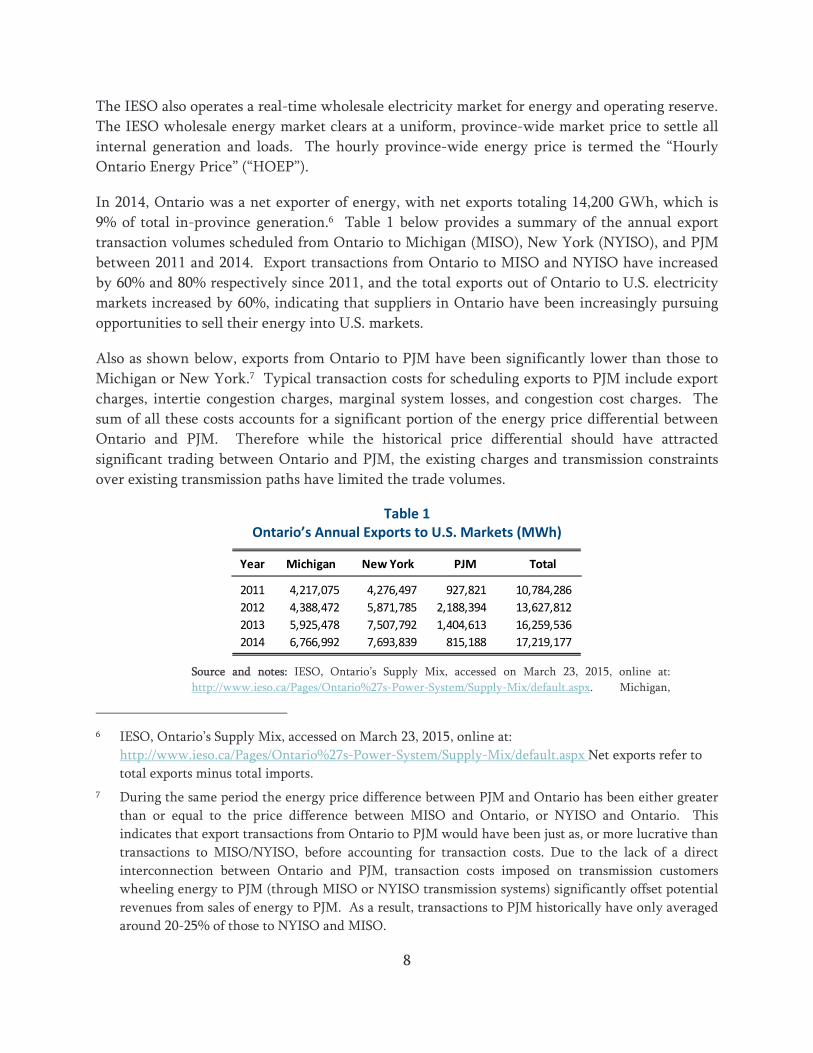
In 2014, Ontario was a net exporter of energy, with net exports totaling 14,200 GWh, which is
9% of total in-province generation.6 Table 1 below provides a summary of the annual export
transaction volumes scheduled from Ontario to Michigan (MISO), New York (NYISO), and PJM
between 2011 and 2014. Export transactions from Ontario to MISO and NYISO have increased
by 60% and 80% respectively since 2011, and the total exports out of Ontario to U.S. electricity
markets increased by 60%, indicating that suppliers in Ontario have been increasingly pursuing
opportunities to sell their energy into U.S. markets.
Also as shown below, exports from Ontario to PJM have been significantly lower than those to
Michigan or New York.7 Typical transaction costs for scheduling exports to PJM include export
charges, intertie congestion charges, marginal system losses, and congestion cost charges. The
sum of all these costs accounts for a significant portion of the energy price differential between
Ontario and PJM. Therefore while the historical price differential should have attracted
significant trading between Ontario and PJM, the existing charges and transmission constraints
over existing transmission paths have limited the trade volumes.
Table 1 Ontario’s Annual Exports to U.S. Markets (MWh)
Source and notes: IESO, Ontario’s Supply Mix, accessed on March 23, 2015, online at:
http://www.ieso.ca/Pages/Ontario%27s-Power-System/Supply-Mix/default.aspx. Michigan,
6 IESO, Ontario’s Supply Mix, accessed on March 23, 2015, online at:
http://www.ieso.ca/Pages/Ontario%27s-Power-System/Supply-Mix/default.aspx Net exports refer to
total exports minus total imports.
7 During the same period the energy price difference between PJM and Ontario has been either greater
than or equal to the price difference between MISO and Ontario, or NYISO and Ontario. This
indicates that export transactions from Ontario to PJM would have been just as, or more lucrative than
transactions to MISO/NYISO, before accounting for transaction costs. Due to the lack of a direct
interconnection between Ontario and PJM, transaction costs imposed on transmission customers
wheeling energy to PJM (through MISO or NYISO transmission systems) significantly offset potential
revenues from sales of energy to PJM. As a result, transactions to PJM historically have only averaged
around 20-25% of those to NYISO and MISO.
Year Michigan New York PJM Total
2011 4,217,075 4,276,497 927,821 10,784,286
2012 4,388,472 5,871,785 2,188,394 13,627,812
2013 5,925,478 7,507,792 1,404,613 16,259,536
2014 6,766,992 7,693,839 815,188 17,219,177
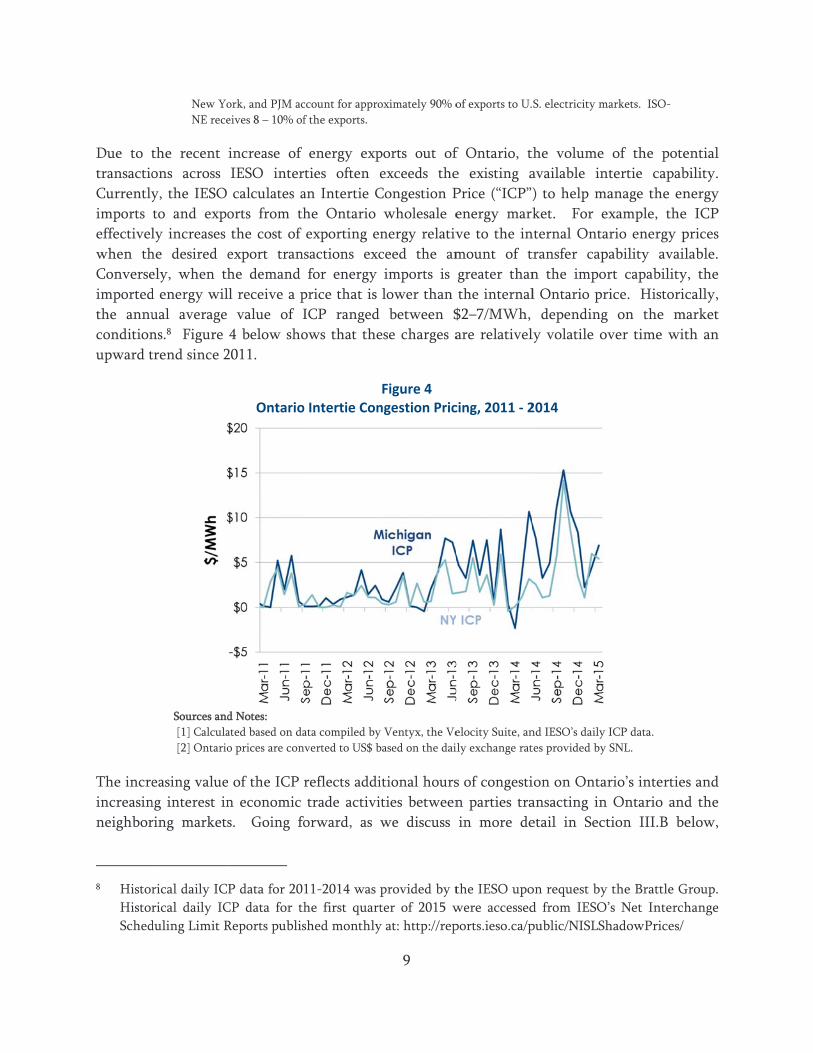
Due to t
transactio
Currently
imports
effectivel
when th
Converse
imported
the annu
condition
upward t
The incre
increasin
neighbor
8 Histor
Histor
Sched
New Yo
NE rece
the recent
ons across
y, the IESO
to and expo
ly increases
he desired e
ely, when th
d energy wil
ual average
ns.8 Figure
trend since 2
Sources and
[1] Calcula
[2] Ontario
easing value
ng interest in
ring markets
rical daily ICP
rical daily IC
duling Limit R
ork, and PJM ac
eives 8 – 10% of
increase of
IESO inter
calculates a
orts from th
the cost of
export tran
he demand
l receive a p
value of I
4 below sho
2011.
Ontario
d Notes:
ated based on da
o prices are con
of the ICP r
n economic
s. Going fo
P data for 201
CP data for th
Reports publis
ccount for appro
f the exports.
energy exp
rties often e
an Intertie C
he Ontario
exporting en
sactions exc
for energy
price that is
ICP ranged
ows that the
o Intertie Con
ata compiled by
verted to US$ b
reflects addi
trade activi
orward, as w
11-2014 was p
he first quart
shed monthly
9
oximately 90% o
ports out of
exceeds the
Congestion P
wholesale e
nergy relativ
ceed the am
imports is
lower than
between $
ese charges a
Figure 4 ngestion Pric
y Ventyx, the Ve
based on the dai
itional hours
ties between
we discuss
provided by t
ter of 2015 w
y at: http://rep
of exports to U.
f Ontario, t
e existing a
Price (“ICP”)
energy mark
ve to the in
mount of t
greater than
the internal
$2–7/MWh,
are relativel
cing, 2011 ‐ 2
elocity Suite, an
ily exchange rat
s of congesti
n parties tra
in more de
the IESO upo
were accessed
ports.ieso.ca/p
S. electricity m
the volume
available int
) to help ma
ket. For ex
nternal Onta
transfer cap
n the impor
l Ontario pr
depending
ly volatile ov
2014
nd IESO’s daily
tes provided by
ion on Ontar
ansacting in
etail in Sect
on request by
d from IESO’
public/NISLSh
arkets. ISO-
of the pote
tertie capab
anage the en
xample, the
ario energy p
ability avai
rt capability
rice. Histori
on the m
ver time wit
ICP data.
SNL.
rio’s intertie
Ontario an
tion III.B b
the Brattle G
’s Net Interch
hadowPrices/
ential
bility.
nergy
e ICP
prices
lable.
y, the
cally,
market
th an
es and
d the
elow,
Group.
hange
10
anticipated changes in the generation resource mix in the Ontario market, such as nuclear
generation facility refurbishments scheduled to begin 2016, could, for at least a period of time,
reverse the direction of the transactions toward increasing energy imports from the U.S. markets
into Ontario.
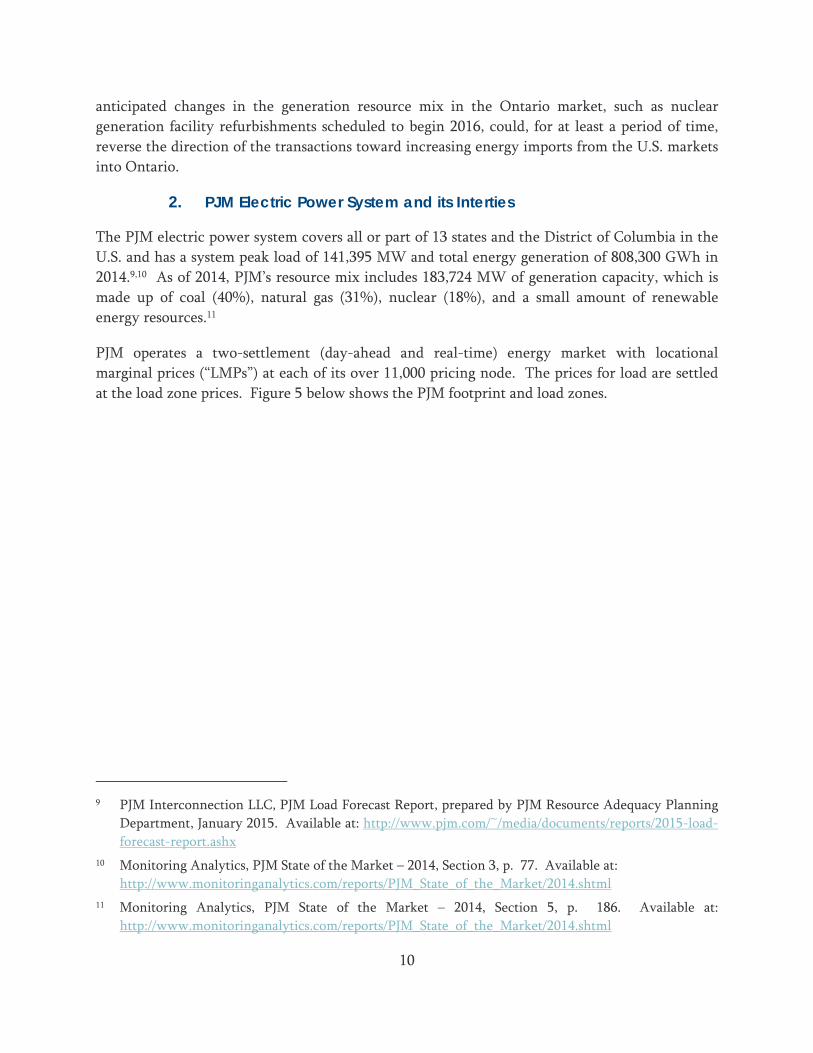
2. PJM Electric Power System and its Interties
The PJM electric power system covers all or part of 13 states and the District of Columbia in the
U.S. and has a system peak load of 141,395 MW and total energy generation of 808,300 GWh in
2014.9,10 As of 2014, PJM’s resource mix includes 183,724 MW of generation capacity, which is
made up of coal (40%), natural gas (31%), nuclear (18%), and a small amount of renewable
energy resources.11
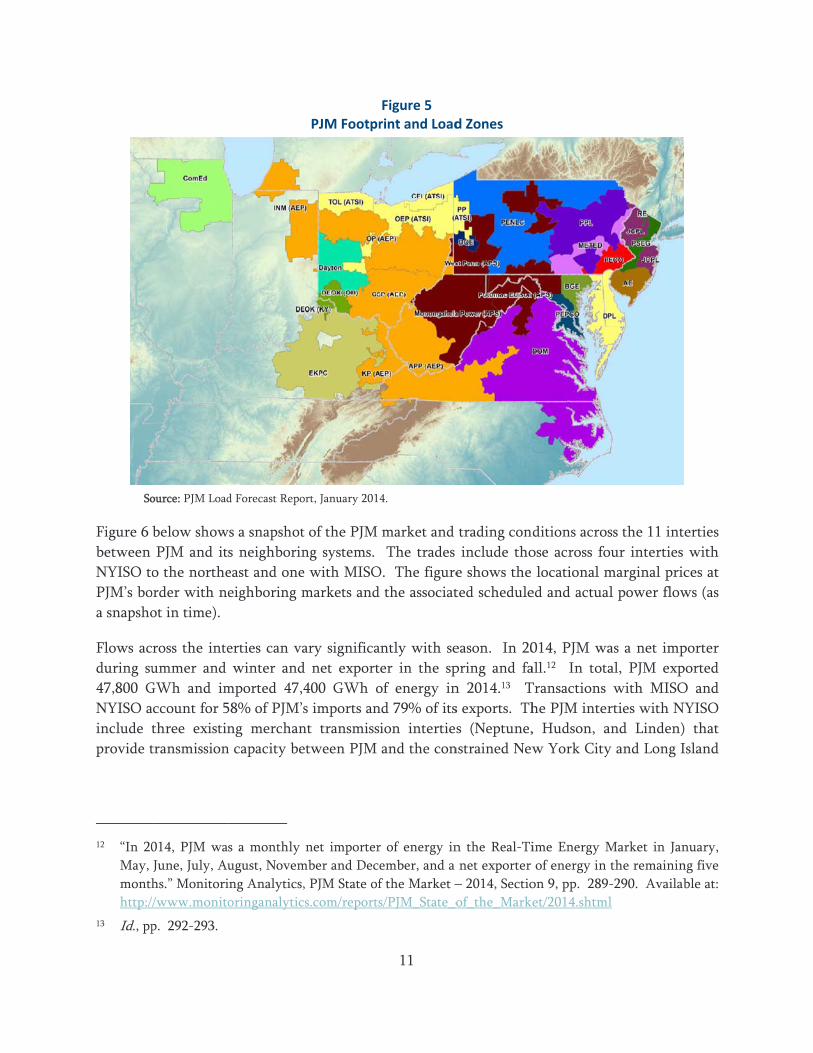
PJM operates a two-settlement (day-ahead and real-time) energy market with locational
marginal prices (“LMPs”) at each of its over 11,000 pricing node. The prices for load are settled
at the load zone prices. Figure 5 below shows the PJM footprint and load zones.
9 PJM Interconnection LLC, PJM Load Forecast Report, prepared by PJM Resource Adequacy Planning
Department, January 2015. Available at: http://www.pjm.com/~/media/documents/reports/2015-load-
forecast-report.ashx
10 Monitoring Analytics, PJM State of the Market – 2014, Section 3, p. 77. Available at:
http://www.monitoringanalytics.com/reports/PJM_State_of_the_Market/2014.shtml
11 Monitoring Analytics, PJM State of the Market – 2014, Section 5, p. 186. Available at:
http://www.monitoringanalytics.com/reports/PJM_State_of_the_Market/2014.shtml
So
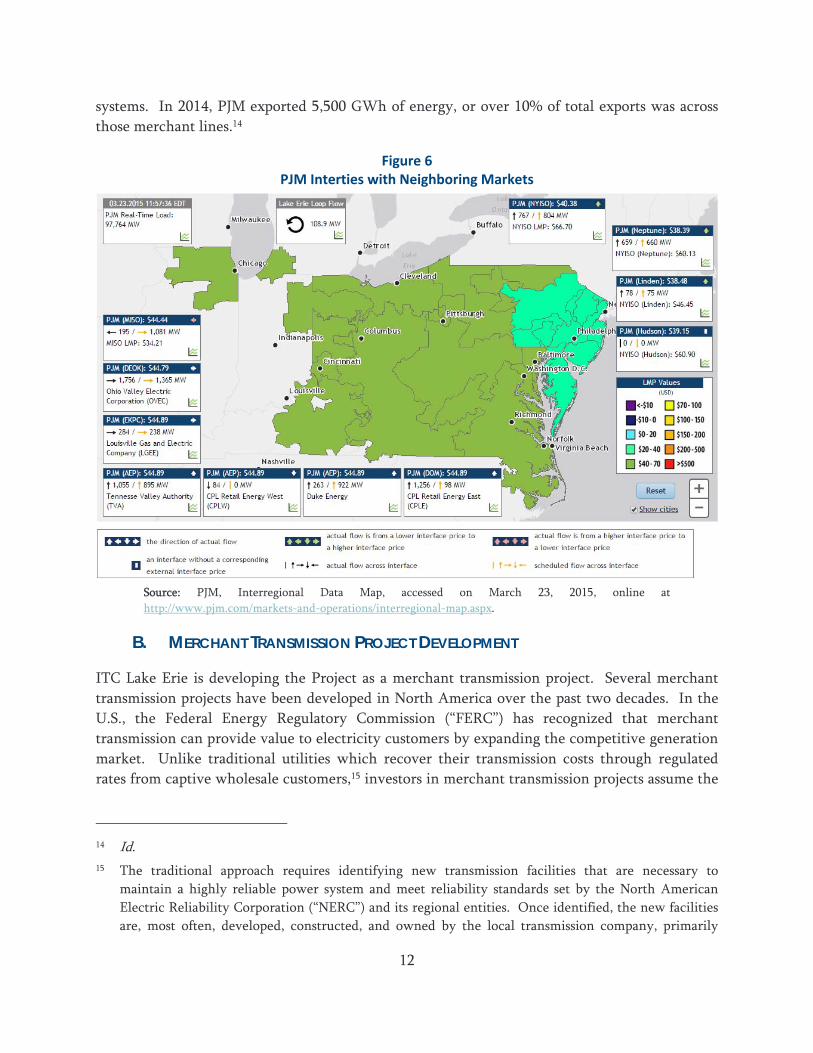
Figure 6
between
NYISO to
PJM’s bo
a snapsho
Flows ac
during su
47,800 G
NYISO a
include t
provide t
12 “In 20
May,
month
http://
13 Id., pp
ource: PJM Load
below show
PJM and it
o the northe
order with ne
ot in time).
ross the inte
ummer and
GWh and im
account for 5
three existin
transmission
014, PJM wa
June, July, Au
hs.” Monitori
/www.monito
p. 292-293.
d Forecast Repo
ws a snapshot
s neighborin
east and one
eighboring m
erties can va
winter and
mported 47,4
58% of PJM’s
ng merchan
n capacity be
s a monthly
ugust, Novem
ing Analytics,
oringanalytic
PJM Footpr
ort, January 2014
t of the PJM
ng systems.
e with MISO
markets and
ary significa
d net export
400 GWh o
s imports an
nt transmissi
etween PJM
net importer
mber and Dece
, PJM State of
s.com/reports
11
Figure 5 rint and Load
4.
market and
The trades
O. The figure
the associat
ntly with se
er in the sp
of energy in
nd 79% of its
ion interties
and the con
r of energy in
ember, and a
f the Market –
s/PJM_State_o
d Zones
trading con
include tho
e shows the
ted schedule
eason. In 20
pring and fa
n 2014.13 T
s exports. Th
s (Neptune,
nstrained New
n the Real-Ti
net exporter
– 2014, Sectio
of_the_Marke
ditions acros
ose across fo
locational m
ed and actua
014, PJM wa
all.12 In tota
Transactions
he PJM inter
, Hudson, a
w York City
ime Energy M
of energy in
on 9, pp. 289
et/2014.shtml
ss the 11 int
our interties
marginal pric
al power flow
as a net imp
al, PJM exp
with MISO
rties with NY
and Linden)
y and Long I
Market in Jan
the remainin
-290. Availab
l
erties
with
ces at
ws (as
porter
ported
O and
YISO
that
Island
nuary,
ng five
ble at:
12
systems. In 2014, PJM exported 5,500 GWh of energy, or over 10% of total exports was across
those merchant lines.14
Figure 6 PJM Interties with Neighboring Markets
Source: PJM, Interregional Data Map, accessed on March 23, 2015, online at
http://www.pjm.com/markets-and-operations/interregional-map.aspx.
B. MERCHANT TRANSMISSION PROJECT DEVELOPMENT
ITC Lake Erie is developing the Project as a merchant transmission project. Several merchant
transmission projects have been developed in North America over the past two decades. In the
U.S., the Federal Energy Regulatory Commission (“FERC”) has recognized that merchant
transmission can provide value to electricity customers by expanding the competitive generation
market. Unlike traditional utilities which recover their transmission costs through regulated
rates from captive wholesale customers,15 investors in merchant transmission projects assume the
14 Id.
15 The traditional approach requires identifying new transmission facilities that are necessary to
maintain a highly reliable power system and meet reliability standards set by the North American
Electric Reliability Corporation (“NERC”) and its regional entities. Once identified, the new facilities
are, most often, developed, constructed, and owned by the local transmission company, primarily
13
full market risks associated with the project. The economic foundation for merchant projects is
based on the value that the transmission customers can directly capture via contractual
commitments with the project developer for the use of the transmission capacity. Such
contractual commitments typically provide transmission developers adequate certainty to assist
in the financing of the transmission projects.
For the transmission contracts to be attractive to potential transmission customers, the
transmission customers must be able to monetize sufficient value in delivering electric energy (or
other products such as ancillary services, firm capacity, or RECs) between markets that are
interconnected by the lines. The markets in which merchant lines have been most active have
been organized wholesale electricity markets where the costs and prices of wholesale products
are transparent, or regions where certain types of generation can be built at a much lower cost
compared to where the generation is desired or needed (e.g., renewable or other low-emitting
generation from certain low-cost areas to be delivered to markets where the resources can be
sold at higher prices). The value of the transmission capacity on the merchant line, in turn, is
captured through the trading of energy (including ancillary services), capacity, and RECs
between market participants across the interconnected markets. The greater the price
differentials are for the various traded products, the greater the value of trade, and the greater
the value that transmission customers attribute to the line.
ITC Lake Erie identified an opportunity to facilitate and increase trade between the IESO and
PJM markets and the proposed Project addresses this opportunity. The precise value that
transmission customers will attribute to the Project and are willing to pay for transmission
capacity will be determined through the open solicitation process and contractual negotiations
between the transmission customers and ITC Lake Erie. In Section III, we analyze the potential
value of such trades based on historical prices of various products. Prior to presenting the
economic rationale for the project, we first describe the history of merchant transmission
projects in North America.
1. Merchant Transmission Development in North America
Over the last decade, interest in developing transmission lines on a merchant basis in North
America has increased. Table 2 provides a summary of a sample of merchant transmission
Continued from previous page
Hydro One in Ontario, and included in the rate base that is used to calculate ratepayers’ bills.
Recently, the Ontario Energy Board granted the rights for developing a major transmission upgrades
across Ontario, known as the East-West Intertie, to Upper Canada Transmission Inc. through a
competitive process. Although the line will be built by a different entity, the costs will still be
covered by the Ontario ratepayers. Source: Ontario Energy Board, East-West Tie Line Designation:
Phase 2 Decision and Order, EB-2011-0140, August 7, 2013. Available at:
http://www.ontarioenergyboard.ca/oeb/_Documents/EB-2011-0140/Dec_Order_Phase2_East-
WestTie_20130807.pdf
14
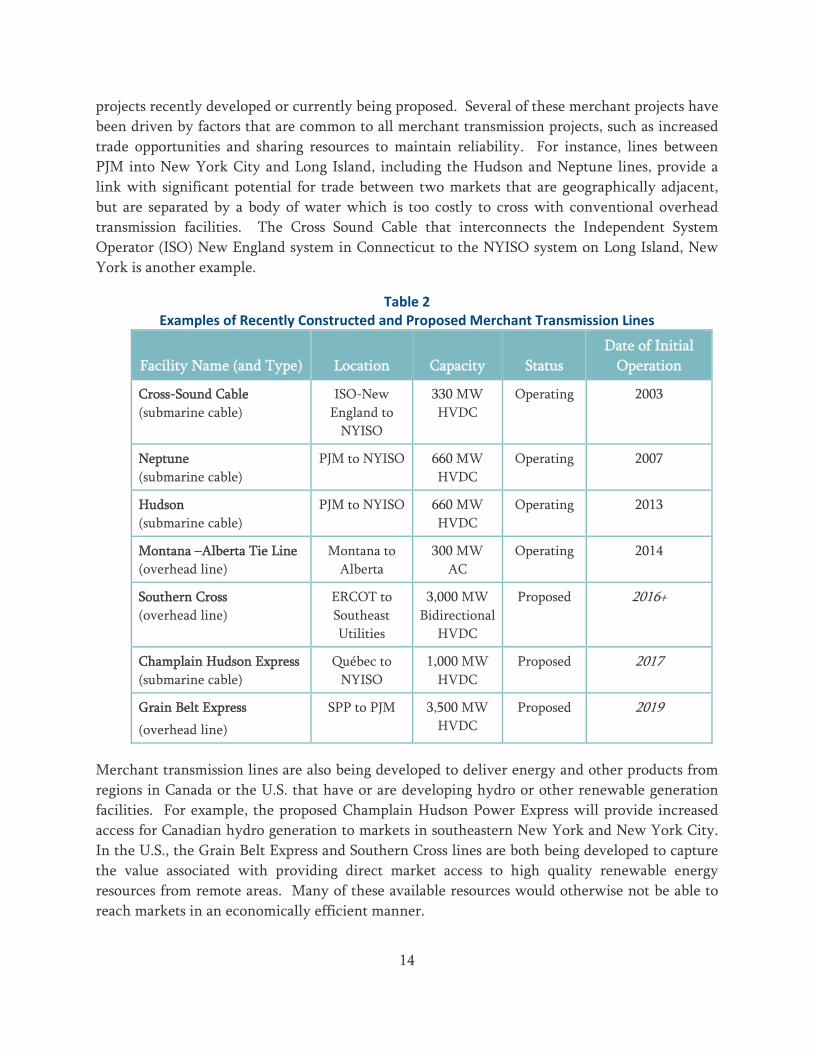
projects recently developed or currently being proposed. Several of these merchant projects have
been driven by factors that are common to all merchant transmission projects, such as increased
trade opportunities and sharing resources to maintain reliability. For instance, lines between
PJM into New York City and Long Island, including the Hudson and Neptune lines, provide a
link with significant potential for trade between two markets that are geographically adjacent,
but are separated by a body of water which is too costly to cross with conventional overhead
transmission facilities. The Cross Sound Cable that interconnects the Independent System
Operator (ISO) New England system in Connecticut to the NYISO system on Long Island, New
York is another example.
Table 2 Examples of Recently Constructed and Proposed Merchant Transmission Lines
Facility Name (and Type) Location Capacity Status
Date of Initial
Operation
Cross-Sound Cable
(submarine cable)
ISO-New
England to
NYISO
330 MW
HVDC
Operating 2003
Neptune
(submarine cable)
PJM to NYISO 660 MW
HVDC
Operating 2007
Hudson
(submarine cable)
PJM to NYISO 660 MW
HVDC
Operating 2013
Montana –Alberta Tie Line
(overhead line)
Montana to
Alberta
300 MW
AC
Operating 2014
Southern Cross
(overhead line)
ERCOT to
Southeast
Utilities
3,000 MW
Bidirectional
HVDC
Proposed 2016+
Champlain Hudson Express
(submarine cable)
Québec to
NYISO
1,000 MW
HVDC
Proposed 2017
Grain Belt Express
(overhead line)
SPP to PJM 3,500 MW
HVDC
Proposed 2019
Merchant transmission lines are also being developed to deliver energy and other products from
regions in Canada or the U.S. that have or are developing hydro or other renewable generation
facilities. For example, the proposed Champlain Hudson Power Express will provide increased
access for Canadian hydro generation to markets in southeastern New York and New York City.
In the U.S., the Grain Belt Express and Southern Cross lines are both being developed to capture
the value associated with providing direct market access to high quality renewable energy
resources from remote areas. Many of these available resources would otherwise not be able to
reach markets in an economically efficient manner.
15
2. Merchant Development of the Lake Erie Connector
Due to the differences in cost recovery between merchant and regulated transmission, the
process for developing merchant HVDC lines differs from traditional, regulated transmission
facilities. ITC Lake Erie will aim to sell the transmission capacity to transmission customers who
are willing to enter into contracts at the greatest value to help finance the project. The resulting
transmission service contracts can be short- or long-term and are effectively “take-or-pay”
contracts for the transmission capacity on the Project. Thus, regardless of the actual usage or the
amount of energy flow over the line, the committed transmission customers will pay for the
contracted transmission capacity. ITC Lake Erie plans to enter into negotiated contracts with
transmission customers, following an open solicitation. A brief description of the open
solicitation process is described in more detail in Section III.D below.
ITC Lake Erie received in September 2014 “negotiated rate authority” from FERC which allows it
to enter into contracts based on negotiated rates with potential customers.16 FERC’s approval is
conditional on ITC Lake Erie adequately completing the open solicitation process and associated
contracting processes outlined in FERC’s 2012 Policy Statement for identifying subscribers on
merchant transmission facilities.17 These same requirements were reiterated by FERC when
granting ITC Lake Erie’s application for negotiated rate authority. The requirements include:18
1. Issuing broad notice of the Project in a manner that ensures that all potential and
interested customers are informed of the proposed Project, such as by placing notice in
trade magazines or regional energy publications.19 The notice must inform interested
customers of the nature of the project and the criteria ITC Lake Erie plans to use to select
transmission customers.
16 FERC, Order Conditionally Authorizing Negotiated Rate Authority and Granting Waivers, Docket
No. ER14-2640-000, 148 FERC ¶ 61,236, Issued September 26, 2014.
17 FERC, Allocation of Capacity on New Merchant Transmission Projects and New Cost-Based,
Participant-Funded Transmission Projects: Priority Rights to New Participant-Funded Transmission,
Docket Nos. AD12-9-000 and AD11-11-000, 142 FERC ¶ 61,038, Issued January 17, 2013.
18 FERC, Order Conditionally Authorizing Negotiated Rate Authority and Granting Waivers, Docket
No. ER14-2640-000, 148 FERC ¶ 61,236, Issued September 26, 2014.
19 “Such notice should include developer points of contact, pertinent project dates, and sufficient
technical specifications and contract information to inform interested customers of the nature of the
project, including: (1) project size/capacity; (2) end points of the line; (3) projected construction and/or
in-service dates; (4) type of line; (5) precedent agreement (if developed); and (6) other capacity
allocation arrangements (including how the developer will address potential oversubscription of
capacity)…Finally, the Policy Statement states that the Commission expects the developer to update
its notice if there are any material changes to the nature of the project or the status of the capacity
allocation process, in particular to ensure that interested entities are informed of any remaining
available capacity.”

16
2. Disclosing the results of the capacity allocation process to demonstrate that the processes
that led to the identification of transmission customers and the execution of the relevant
contractual arrangements are consistent with FERC’s Policy Statement and FERC’s open
access principles, including the criteria used to select transmission customers, pricing
terms on the proposed contracts, and any risk-sharing terms and conditions.
Based on FERC’s requirements,20 ITC Lake Erie is planning to conduct the open solicitation
process to solicit interest from potential transmission customers to purchase the rights to use the
merchant transmission line. As explained earlier, the open solicitation process will efficiently
allocate the transmission capacity and those transmission customers who enter into transmission
contracts will have the rights to use the line to move energy and other products between the
Ontario and PJM markets.
3. Operating the Bi-Directional HVDC Lake Erie Connector
As a merchant transmission line, the protocols for scheduling and delivering energy across the
Project must recognize transmission customers’ rights to reserve firm capacity and to direct flow
between markets as necessary. While PJM has extensive experience with the scheduling and
operations of merchant lines, it is anticipated that the IESO will develop the needed protocols.
In fact, the IESO already agreed that, as a merchant transmission line, certain general principles
should guide the development of new scheduling protocols. In its letter to ITC Lake Erie, the
IESO expressed the following principles to guide the development of IESO’s market protocols for
the operations of the Project:21
IESO recognizes that transmission customers who make significant financial
commitments to subscribe for capacity on the merchant transmission line must have
access to their subscribed transmission capacity.
IESO agrees that appropriate protocols should ensure that export bids and import offers
over the Project have reservations of transmission capacity on the line similar to the
treatment of merchant transmission interties between other North American power
markets.
IESO expects that only limited modifications to existing market rule and manual
protocols (for non-merchant interties) will be needed to screen for transmission
reservations for imports and exports over the Project.
20 ITC has also agreed to maintain accounts with FERC, which will be independently audited, and ITC
will turn over control of the U.S. components of line to PJM once built.
21 Letter to Terry S. Harvill, Ph.D., Re: Lake Erie Connector Project, January 29, 2015.
17
IESO acknowledges that scheduling protocols will also have to be jointly developed
between PJM and the IESO.
IESO agrees that appropriate scheduling protocols should accommodate the release, sale,
or reassignment of unused transmission capacity on the Project in a manner that is
consistent with the approach taken in power markets subject to FERC regulation and
applicable FERC orders.
III. Sources of Value for the Lake Erie Connector
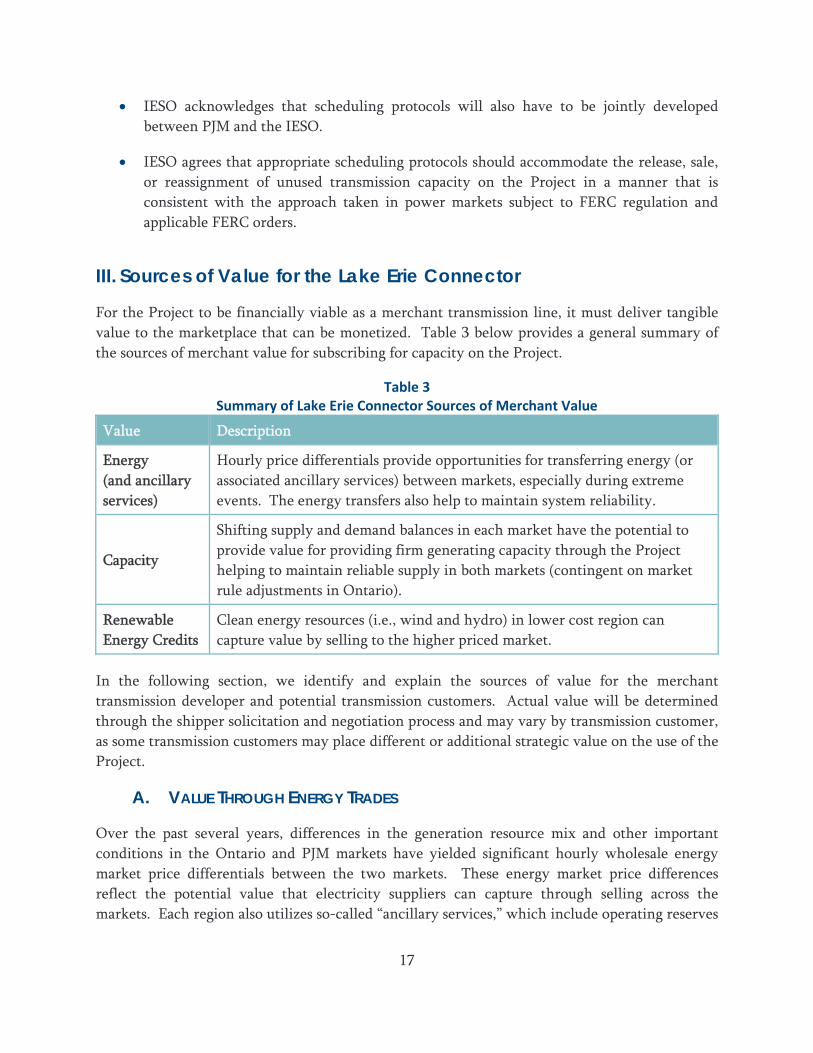
For the Project to be financially viable as a merchant transmission line, it must deliver tangible
value to the marketplace that can be monetized. Table 3 below provides a general summary of
the sources of merchant value for subscribing for capacity on the Project.
Table 3 Summary of Lake Erie Connector Sources of Merchant Value
Value Description
Energy
(and ancillary
services)
Hourly price differentials provide opportunities for transferring energy (or
associated ancillary services) between markets, especially during extreme
events. The energy transfers also help to maintain system reliability.
Capacity
Shifting supply and demand balances in each market have the potential to
provide value for providing firm generating capacity through the Project
helping to maintain reliable supply in both markets (contingent on market
rule adjustments in Ontario).
Renewable
Energy Credits
Clean energy resources (i.e., wind and hydro) in lower cost region can
capture value by selling to the higher priced market.
In the following section, we identify and explain the sources of value for the merchant
transmission developer and potential transmission customers. Actual value will be determined
through the shipper solicitation and negotiation process and may vary by transmission customer,
as some transmission customers may place different or additional strategic value on the use of the
Project.
A. VALUE THROUGH ENERGY TRADES
Over the past several years, differences in the generation resource mix and other important
conditions in the Ontario and PJM markets have yielded significant hourly wholesale energy
market price differentials between the two markets. These energy market price differences
reflect the potential value that electricity suppliers can capture through selling across the
markets. Each region also utilizes so-called “ancillary services,” which include operating reserves
18
used to balance the power system and provide supporting services under certain system
contingencies. The prices for such ancillary services are closely correlated with the prices for
energy that are discussed and summarized below. Looking forward, market conditions can
change the trade patterns and price differentials from those observed historically.
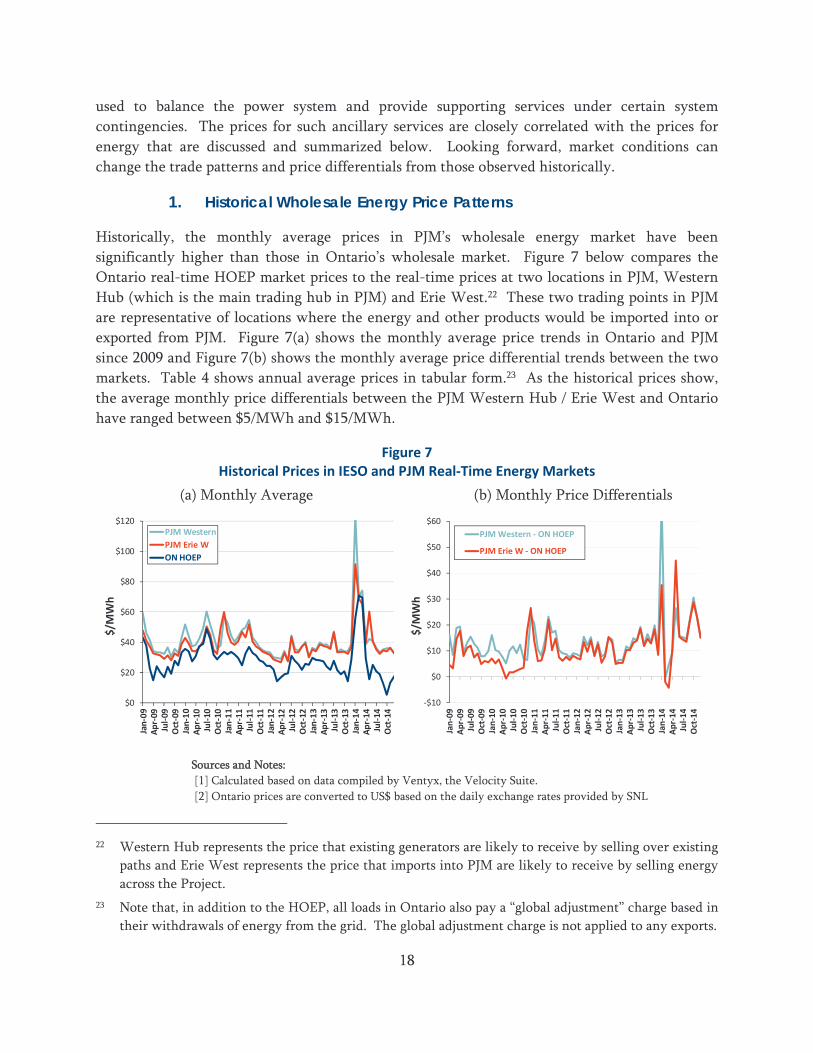
1. Historical Wholesale Energy Price Patterns
Historically, the monthly average prices in PJM’s wholesale energy market have been
significantly higher than those in Ontario’s wholesale market. Figure 7 below compares the
Ontario real-time HOEP market prices to the real-time prices at two locations in PJM, Western
Hub (which is the main trading hub in PJM) and Erie West.22 These two trading points in PJM
are representative of locations where the energy and other products would be imported into or
exported from PJM. Figure 7(a) shows the monthly average price trends in Ontario and PJM
since 2009 and Figure 7(b) shows the monthly average price differential trends between the two
markets. Table 4 shows annual average prices in tabular form.23 As the historical prices show,
the average monthly price differentials between the PJM Western Hub / Erie West and Ontario
have ranged between $5/MWh and $15/MWh.
Figure 7 Historical Prices in IESO and PJM Real‐Time Energy Markets
(a) Monthly Average (b) Monthly Price Differentials
Sources and Notes:
[1] Calculated based on data compiled by Ventyx, the Velocity Suite.
[2] Ontario prices are converted to US$ based on the daily exchange rates provided by SNL
22 Western Hub represents the price that existing generators are likely to receive by selling over existing
paths and Erie West represents the price that imports into PJM are likely to receive by selling energy
across the Project.
23 Note that, in addition to the HOEP, all loads in Ontario also pay a “global adjustment” charge based in
their withdrawals of energy from the grid. The global adjustment charge is not applied to any exports.
$0
$20
$40
$60
$80
$100
$120
Jan‐09
Apr‐09
Jul‐09
Oct‐09
Jan‐10
Apr‐10
Jul‐10
Oct‐10
Jan‐11
Apr‐11
Jul‐11
Oct‐11
Jan‐12
Apr‐12
Jul‐12
Oct‐12
Jan‐13
Apr‐13
Jul‐13
Oct‐13
Jan‐14
Apr‐14
Jul‐14
Oct‐14
$/MWh
PJM Western
PJM Erie W
ON HOEP
‐$10
$0
$10
$20
$30
$40
$50
$60
Jan‐09
Apr‐09
Jul‐09
Oct‐09
Jan‐10
Apr‐10
Jul‐10
Oct‐10
Jan‐11
Apr‐11
Jul‐11
Oct‐11
Jan‐12
Apr‐12
Jul‐12
Oct‐12
Jan‐13
Apr‐13
Jul‐13
Oct‐13
Jan‐14
Apr‐14
Jul‐14
Oct‐14
$/M
Wh
PJM Western ‐ ON HOEP
PJM Erie W ‐ ON HOEP
19
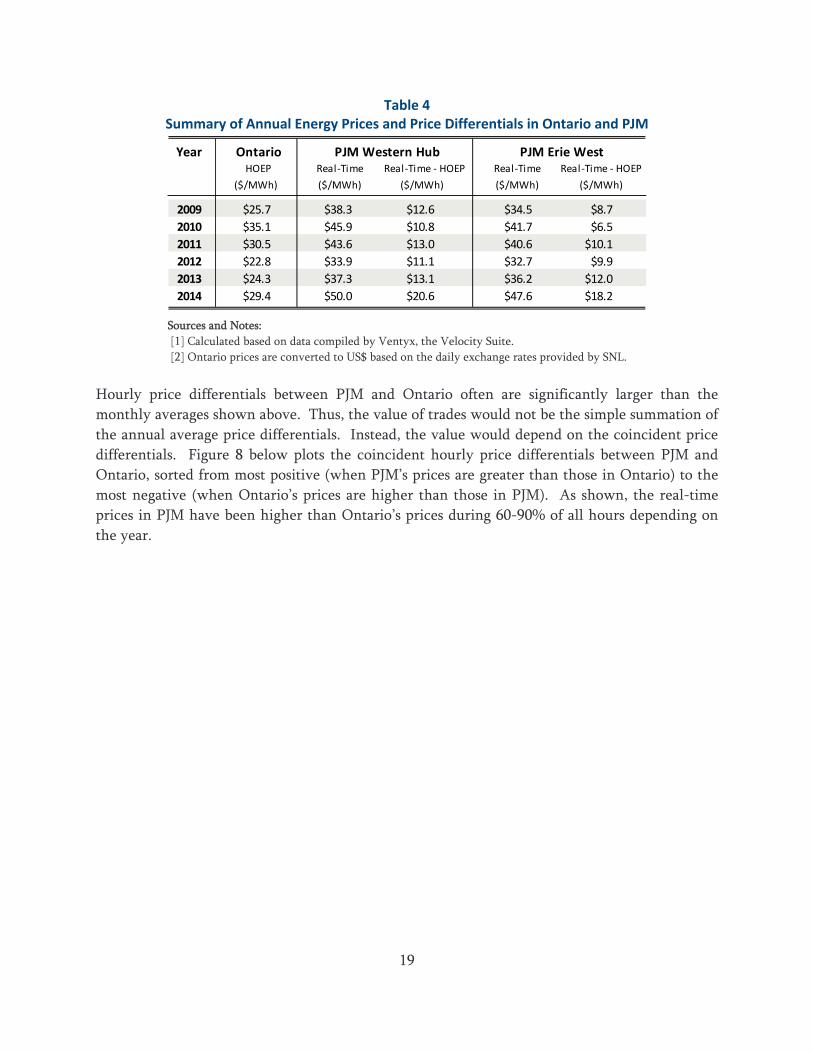
Table 4 Summary of Annual Energy Prices and Price Differentials in Ontario and PJM
Sources and Notes:
[1] Calculated based on data compiled by Ventyx, the Velocity Suite.
[2] Ontario prices are converted to US$ based on the daily exchange rates provided by SNL.
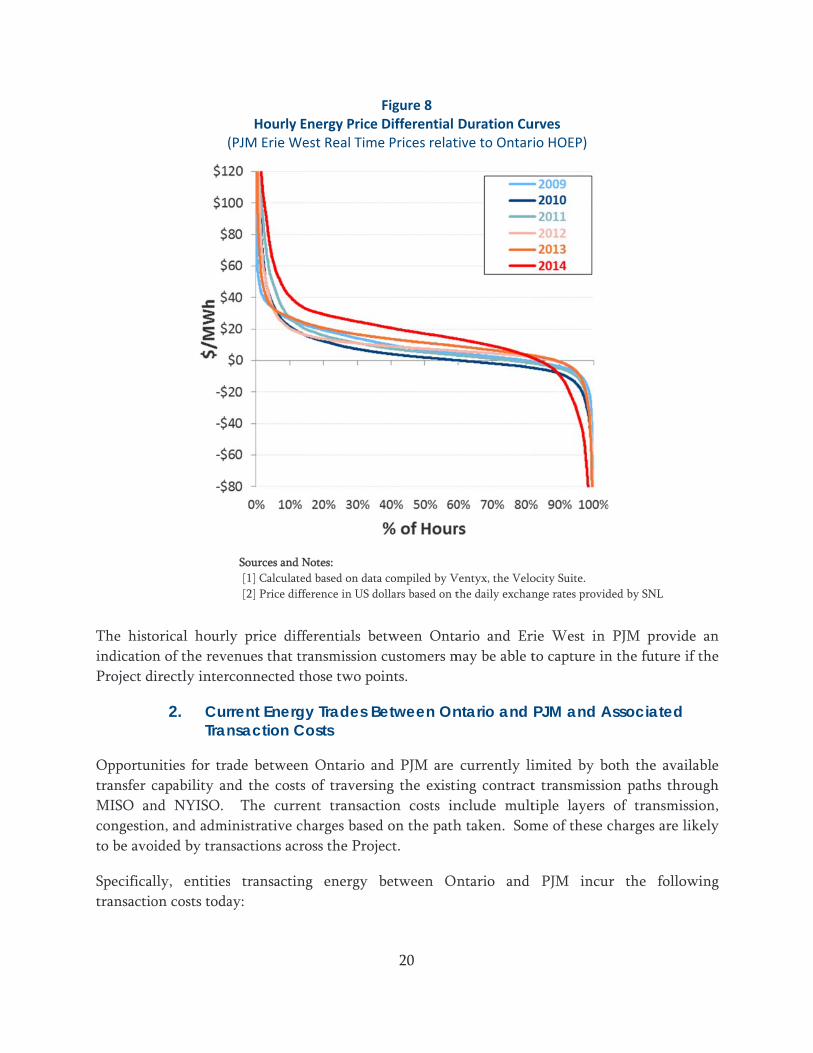
Hourly price differentials between PJM and Ontario often are significantly larger than the
monthly averages shown above. Thus, the value of trades would not be the simple summation of
the annual average price differentials. Instead, the value would depend on the coincident price
differentials. Figure 8 below plots the coincident hourly price differentials between PJM and
Ontario, sorted from most positive (when PJM’s prices are greater than those in Ontario) to the
most negative (when Ontario’s prices are higher than those in PJM). As shown, the real-time
prices in PJM have been higher than Ontario’s prices during 60-90% of all hours depending on
the year.
Year Ontario PJM Western Hub PJM Erie WestHOEP Real‐Time Real‐Time ‐ HOEP Real‐Time Real‐Time ‐ HOEP
($/MWh) ($/MWh) ($/MWh) ($/MWh) ($/MWh)
2009 $25.7 $38.3 $12.6 $34.5 $8.7
2010 $35.1 $45.9 $10.8 $41.7 $6.5
2011 $30.5 $43.6 $13.0 $40.6 $10.1
2012 $22.8 $33.9 $11.1 $32.7 $9.9
2013 $24.3 $37.3 $13.1 $36.2 $12.0
2014 $29.4 $50.0 $20.6 $47.6 $18.2
The hist
indicatio
Project d
Opportun
transfer c
MISO an
congestio
to be avo
Specifica
transactio
orical hourl
n of the reve
directly inter
2. CurTran
nities for tra
capability an
nd NYISO.
on, and admi
oided by tran
lly, entities
on costs toda
Hourly E(PJM Erie We
Sources and N
[1] Calculate
[2] Price diff
ly price diff
enues that tr
rconnected th
rrent Energnsaction C
ade between
nd the costs
The curre
inistrative ch
nsactions acr
s transactin
ay:
Energy Price est Real Time
Notes:
ed based on data
ference in US do
ferentials be
ransmission
hose two po
gy Trades BCosts
n Ontario an
s of traversin
ent transact
harges based
ross the Proje
ng energy b
20
Figure 8 Differential e Prices relat
a compiled by V
ollars based on t
etween Onta
customers m
oints.
etween On
nd PJM are
ng the existi
ion costs in
d on the path
ect.
between O
Duration Cutive to Ontar
Ventyx, the Velo
the daily exchan
ario and Er
may be able t
ntario and
currently li
ing contract
nclude mult
h taken. Som
ntario and
urves io HOEP)
ocity Suite.
nge rates provid
rie West in
to capture in
PJM and A
imited by b
t transmissio
tiple layers
me of these c
PJM incu
ded by SNL
PJM provid
n the future
Associated
oth the avai
on paths thr
of transmis
charges are l
r the follo
de an
if the
ilable
rough
ssion,
likely
owing
21
a. Ontario Variable Export Charges: These charges include Ontario’s Export
Transmission Service (ETS) charge, set at approximately $2/MWh, and uplift and
administrative charges levied on export transactions scheduled from Ontario.24 The
uplift and administrative charges have averaged around $3/MWh, bringing the total
variable export charges to approximately $5/MWh for entities scheduling exports out
of Ontario.
b. Intertie Congestion Charges (ICP): During hours in which reservation requests exceed
the available transfer capacity of the interties, the ICP represents the increased cost of
importing into or exporting energy from Ontario. The average ICP for exporting to
MISO over the past four years on an all-hours basis was $3.5/MWh (ranging from $1
– 7/MWh) and for NYISO was $2.2/MWh (ranging from $1 – 4/MWh).
c. Congestion and Marginal Loss Charges: These charges are incurred in moving energy
from Ontario across either the MISO or NYISO system as well as within PJM to the
load zone in which the Project will interconnect. These charges have averaged about
$6.0/MWh for the MISO path (ranging from $3–8/MWh) and $3.0/MWh on the
NYISO path (ranging from $2–4/MWh) since 2011.
d. Separately, NYISO also charges a wheel-through charge of approximately $5/MWh
for all energy transmitted across its system.
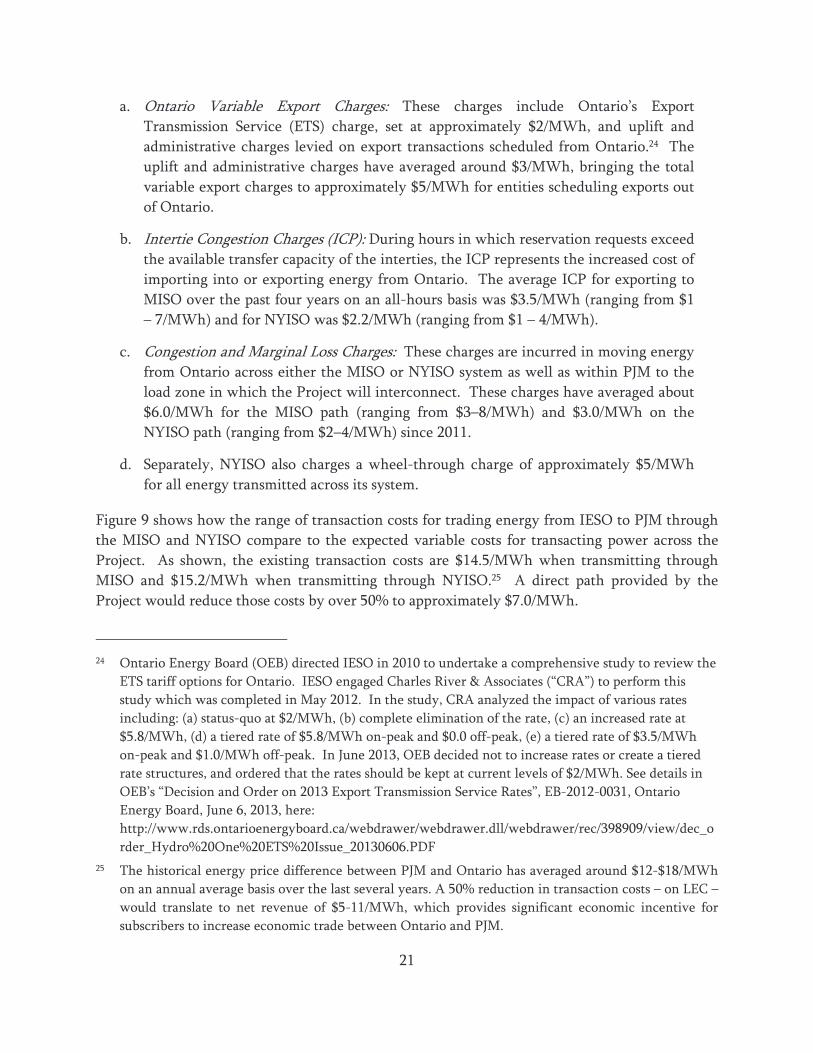
Figure 9 shows how the range of transaction costs for trading energy from IESO to PJM through
the MISO and NYISO compare to the expected variable costs for transacting power across the
Project. As shown, the existing transaction costs are $14.5/MWh when transmitting through
MISO and $15.2/MWh when transmitting through NYISO.25 A direct path provided by the
Project would reduce those costs by over 50% to approximately $7.0/MWh.
24 Ontario Energy Board (OEB) directed IESO in 2010 to undertake a comprehensive study to review the
ETS tariff options for Ontario. IESO engaged Charles River & Associates (“CRA”) to perform this
study which was completed in May 2012. In the study, CRA analyzed the impact of various rates
including: (a) status-quo at $2/MWh, (b) complete elimination of the rate, (c) an increased rate at
$5.8/MWh, (d) a tiered rate of $5.8/MWh on-peak and $0.0 off-peak, (e) a tiered rate of $3.5/MWh
on-peak and $1.0/MWh off-peak. In June 2013, OEB decided not to increase rates or create a tiered
rate structures, and ordered that the rates should be kept at current levels of $2/MWh. See details in
OEB’s “Decision and Order on 2013 Export Transmission Service Rates”, EB-2012-0031, Ontario
Energy Board, June 6, 2013, here:
http://www.rds.ontarioenergyboard.ca/webdrawer/webdrawer.dll/webdrawer/rec/398909/view/dec_o
rder_Hydro%20One%20ETS%20Issue_20130606.PDF
25 The historical energy price difference between PJM and Ontario has averaged around $12-$18/MWh
on an annual average basis over the last several years. A 50% reduction in transaction costs – on LEC –
would translate to net revenue of $5-11/MWh, which provides significant economic incentive for
subscribers to increase economic trade between Ontario and PJM.
Energy tr
of appro
currently
incremen
congestio
expected
B.
Differenc
of value
changes
interties
capacity
with ne
requirem
(a) modi
Province
frequent
26 Trans
transl
lower
rades across
oximately $5
y contempla
ntal ICP. Ju
on costs and
costs associa
POTENTIA
ces in the va
for the Pro
to IESO’s e
because Ont
across its int
ighboring m
ments. Based
ify market r
e’s needs to e
intertie sc
smission losse
late to $1–2.5
r based on the
IESO t
the Project
5/MWh, but
ated by the I
st as importa
costs associa
ated with lo
AL CAPACIT
alue of firm g
oject. Curre
existing ma
tario’s curre
terties. How
markets to
d on this effo
rules to allo
external juris
heduling an
es on the Proj
/MWh if the
e price level).
to PJM Trans
may be requ
t an update
IESO, would
antly, transa
ated with los
sses across th
TY MARKET V
generating ca
ently, the m
arket rules r
nt market ru
wever, Ontar
support th
ort, the IESO
ow Ontario
sdictions, (b
nd expanded
ject would be
market price
22
Figure 9 saction Costs
uired to pay
ed merchant
d likely avo
actions acros
sses on the e
he Project is
VALUE
apacity betw
magnitude o
related to t
ules do not p
rio is curren
he Province
O made a nu
generators
) enhance th
d provision
e 2–6% includ
es are at $40/M
s, 2011 – 201
some part o
t transmissio
id parts of t
ss the Projec
existing cont
s in the range
ween IESO an
of this value
transacting
permit mark
ntly evaluatin
e’s demand,
umber of rec
to sell cap
he benefits o
of ancillar
ding line and
MWh (but co
14
of the variab
on line sch
the variable
ct would like
tract transmi
e of $1.0 – 2
nd PJM is al
e is continge
capacity ov
ket participa
ng the futur
, reliability
commendati
pacity that i
of the interti
ry services
d convertor lo
ould be propo
ble export ch
heduling pro
charges an
ely also avoi
ission paths.
.5/MWh.26
lso a likely so
ent upon ce
ver the Ont
ants to buy o
e role of int
, and flexi
ions, includi
is surplus to
ies to allow
through in
osses, which w
ortionally high
harges
otocol
d the
id the
. The
ource
ertain
tario’s
or sell
erties
ibility
ing to
o the
more
tertie
would
her or

23
transactions, and (c) allow for capacity imports and exports in developing the design of the
Ontario capacity market.27
As such, Ontario is currently developing its own capacity market design proposal. If
implemented, the IESO market may allow capacity to be traded between PJM and the IESO. At
this time, however, IESO’s proposal reflects only a high-level design for Ontario’s capacity
market, and therefore the definition of the capacity product, associated qualification
requirements, and necessary market rule changes are still under development.
If Ontario were to allow capacity to be transacted on its interties, the capacity value provided by
the Project (to both Ontario and PJM) would depend on the relative supply/demand balance
between Ontario and PJM and the commitment required from the capacity resources procured.
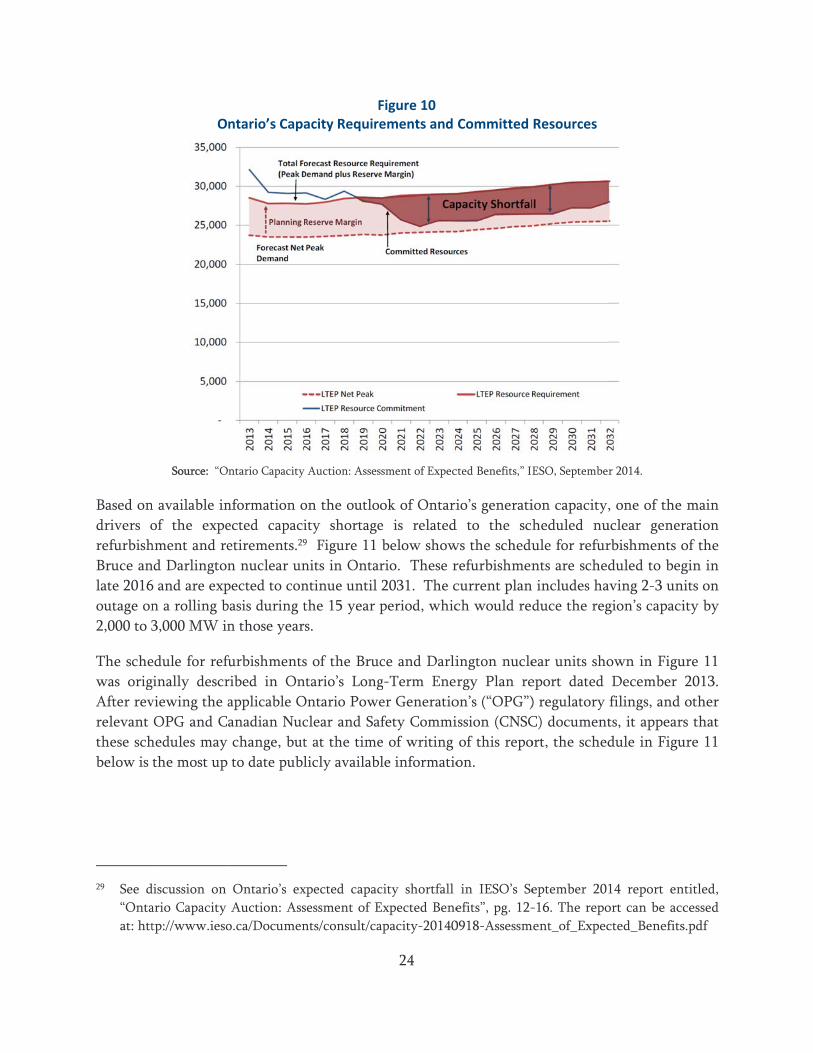
1. Ontario Capacity Market Fundamentals and Potential Future Development
Ontario currently has a surplus of capacity resources despite the forced early retirement of its
entire coal-fired generation fleet. However, the existing capacity surplus will decrease primarily
as a result of the planned refurbishment and retirement of certain nuclear generation facilities.
Figure 10 below compares the amount the committed generation resources (in the blue line)
with the forecast peak load (low part of the purple slice) with the necessary reserve margin added
(the top of the purple slice). This figure shows that the amount of Ontario’s generating capacity,
with the reserve margin, is projected to decrease between 2015 and 2022, falling below the
required reserve margin as early as 2019. Given this forecast, Ontario is expected face some
capacity shortfall starting in 2019, increasing to approximately 4,000 MW of capacity shortage by
2022.28
27 IESO and OPA, Review of Ontario Interties, Prepared for the Minister of Energy by the Independent
Electricity System Operator and the Ontario Power Authority, October 14, 2014.
28 These forecasts are based on the Ministry of Energy’s 2013 Long-Term Energy Plan for Ontario,
updated in December 2013. The 2013 Long-Term Energy Plan does not reflect changes in expectations
that may have occurred since 2013. Thus, the actual nuclear refurbishment schedules and/or expected
retirements may shift from the currently available information. For example, if the schedules for
nuclear refurbishment or retirement shift from the 2013 projection, the expected supply shortage will
not as significant as those presented here. These and other uncertainties will affect the perspective of
potential subscribers and therefore the actual value subscribers place on the Project will only be
revealed through the contract agreements that LEC can obtain through its open solicitation(s).
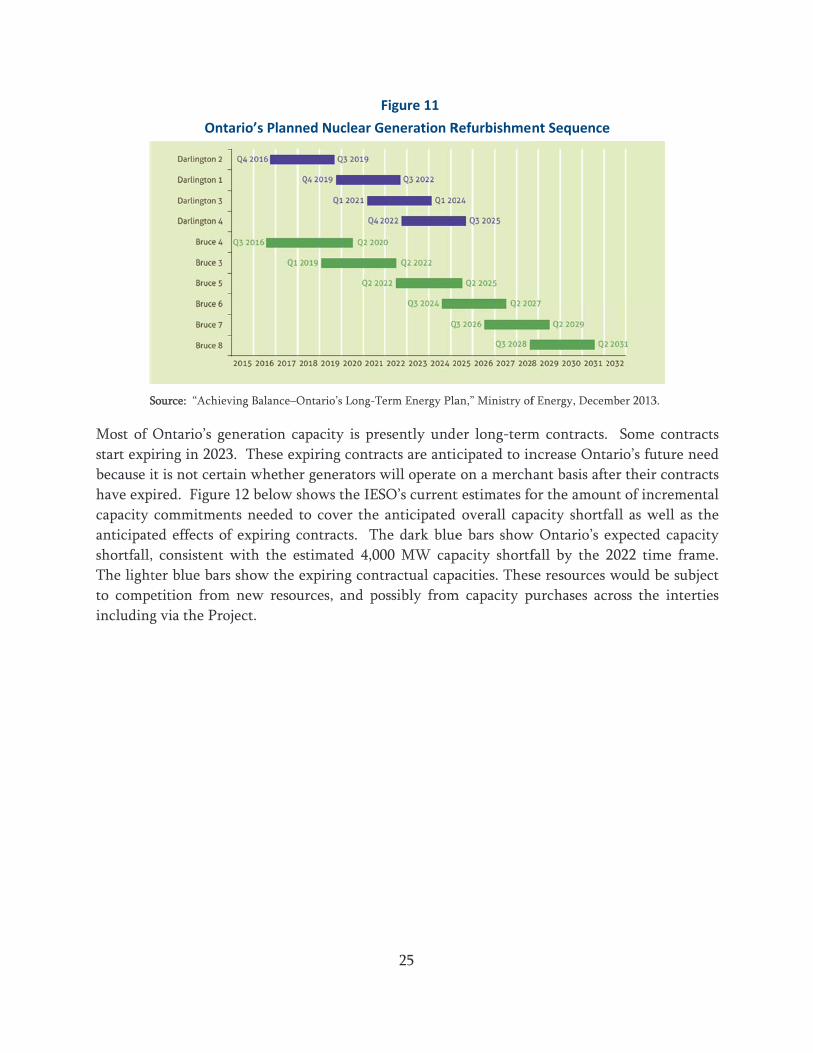
Based on
drivers o
refurbish
Bruce an
late 2016
outage on
2,000 to 3
The sche
was orig
After rev
relevant
these sch
below is
29 See d
“Onta
at: htt
O
Source: “O
n available in
of the expe
hment and re
nd Darlington
6 and are exp
n a rolling b
3,000 MW in
edule for refu
ginally descr
viewing the a
OPG and C
hedules may
the most up
discussion on
ario Capacity
tp://www.ieso
ntario’s Capa
ntario Capacity
nformation o
ected capaci
etirements.29
n nuclear un
pected to con
basis during t
n those year
furbishments
ribed in On
applicable O
anadian Nuc
change, but
to date publ
Ontario’s ex
Auction: Ass
o.ca/Documen
Facity Require
y Auction: Asses
on the outloo
ity shortage9 Figure 11
nits in Ontar
ntinue until
the 15 year p
rs.
s of the Bruc
ntario’s Long
Ontario Powe
clear and Sa
t at the time
licly availabl
xpected capac
sessment of E
nts/consult/ca
24
Figure 10 ements and
ssment of Expec
ok of Ontari
e is related
below show
rio. These r
2031. The c
period, whic
ce and Darli
g-Term Ene
er Generatio
fety Commi
e of writing
le informatio
city shortfall
Expected Bene
apacity-20140
Committed
cted Benefits,” IE
io’s generati
d to the sch
ws the schedu
refurbishmen
current plan
ch would red
ington nucle
rgy Plan re
on’s (“OPG”)
ission (CNSC
of this repo
on.
in IESO’s Se
efits”, pg. 12-
0918-Assessm
Resources
ESO, Septembe
ion capacity,
heduled nu
ule for refur
nts are sched
includes ha
duce the reg
ear units sho
eport dated
) regulatory
C) document
ort, the sched
eptember 201
-16. The repo
ment_of_Expec
r 2014.
, one of the
uclear gener
rbishments o
duled to beg
aving 2-3 uni
gion’s capaci
own in Figu
December
filings, and
ts, it appears
dule in Figu
14 report ent
ort can be acc
cted_Benefits
main
ration
of the
gin in
its on
ity by
ure 11
2013.
other
s that
ure 11
titled,
cessed
s.pdf
S
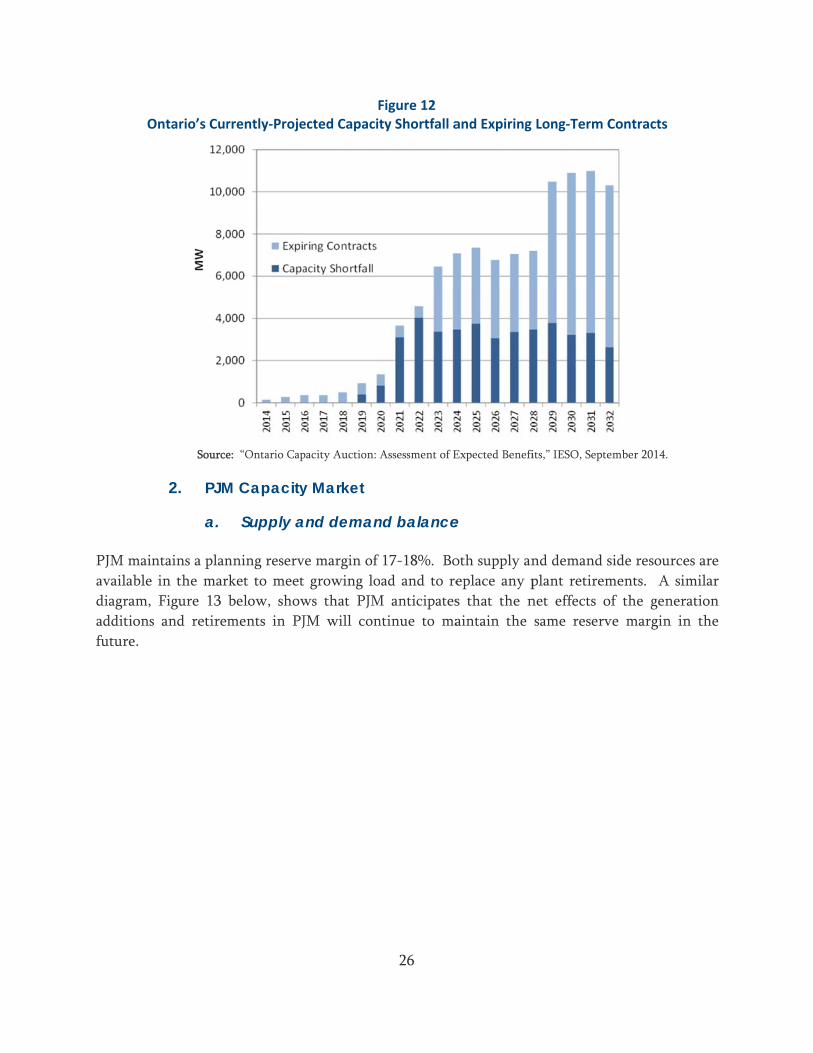
Most of
start expi
because i
have exp
capacity
anticipat
shortfall,
The light
to compe
including
Ont
Source: “Achiev
Ontario’s ge
iring in 2023
it is not certa
ired. Figure
commitmen
ed effects of
, consistent
ter blue bars
etition from
g via the Pro
ario’s Planne
ving Balance–O
eneration ca
3. These exp
ain whether
e 12 below sh
nts needed t
f expiring co
with the es
s show the e
m new resou
oject.
ed Nuclear G
Ontario’s Long-T
apacity is pre
piring contra
r generators w
hows the IES
o cover the
ontracts. Th
stimated 4,00
expiring cont
urces, and po
25
Figure 11
Generation R
Term Energy Pla
esently und
acts are anti
will operate
SO’s current
anticipated
he dark blue
00 MW cap
tractual capa
ossibly from
Refurbishmen
an,” Ministry of
er long-term
icipated to in
on a merch
t estimates fo
overall cap
e bars show
pacity shortf
acities. Thes
m capacity p
nt Sequence
f Energy, Decem
m contracts.
ncrease Onta
hant basis aft
or the amoun
pacity shortfa
w Ontario’s e
fall by the 2
se resources
purchases acr
e
mber 2013.
Some cont
ario’s future
ter their cont
nt of increm
fall as well a
expected cap
2022 time fr
would be su
ross the int
tracts
need
tracts
mental
as the
pacity
rame.
ubject
erties
O
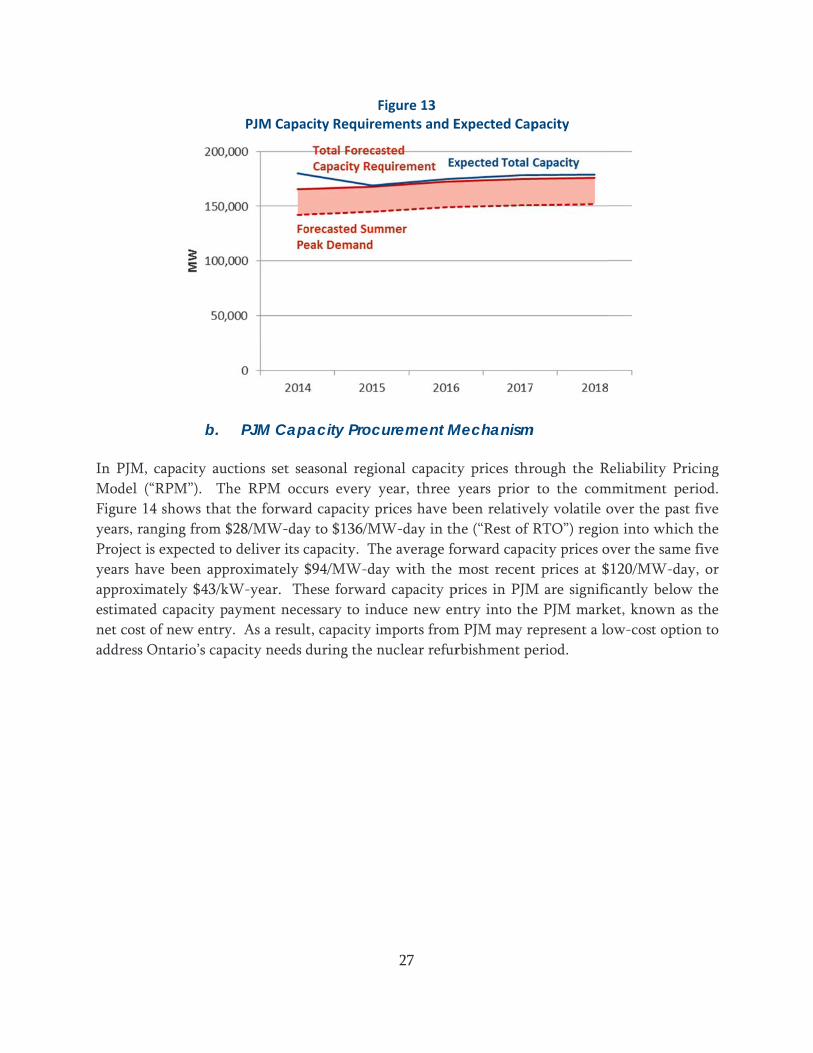
PJM main
available
diagram,
additions
future.
Ontario’s Cur
Source
2. PJM
a.
ntains a plan
in the mar
Figure 13
s and retirem
rrently‐Proje
e: “Ontario Cap
M Capacity
Supply a
nning reserv
rket to meet
below, show
ments in PJ
Fected Capacit
pacity Auction: A
y Market
and deman
ve margin of
growing lo
ws that PJM
JM will con
26
Figure 12 ty Shortfall a
Assessment of E
nd balance
17-18%. Bo
ad and to re
M anticipates
ntinue to ma
and Expiring
Expected Benefi
e
oth supply an
eplace any p
s that the n
aintain the
Long‐Term C
its,” IESO, Septe
nd demand s
plant retirem
net effects o
same reserv
Contracts
ember 2014.
side resource
ments. A si
of the gener
ve margin in
es are
imilar
ration
n the
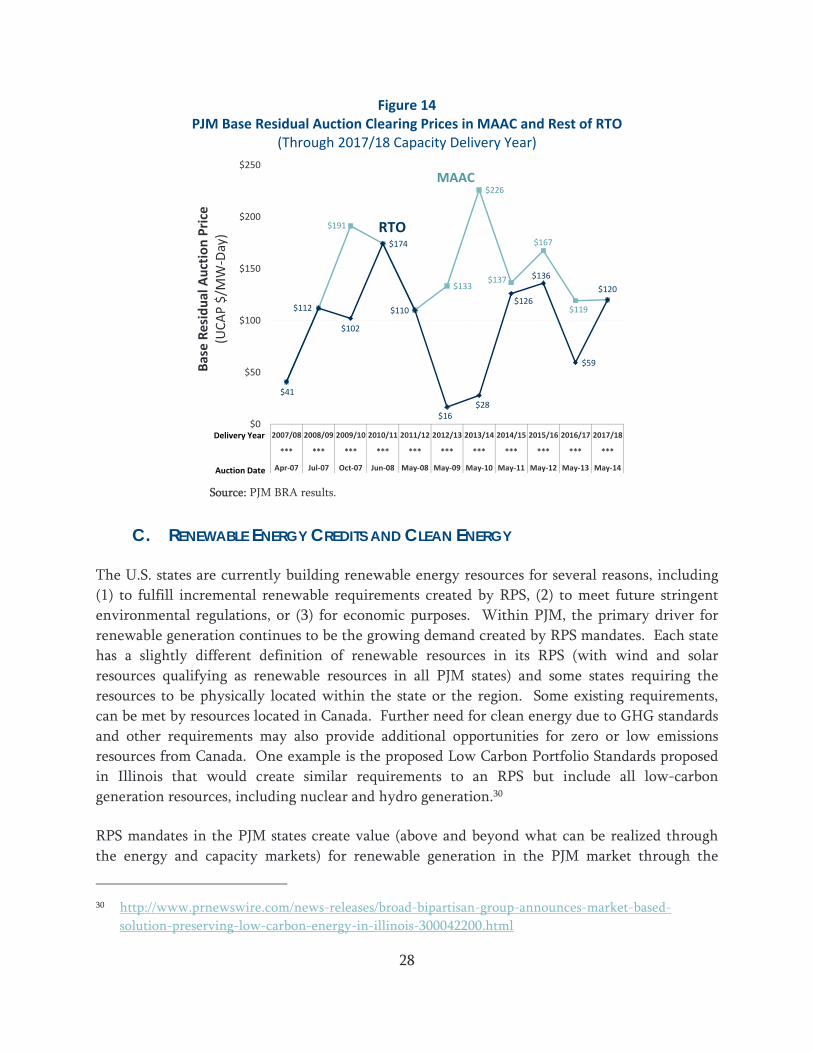
In PJM,
Model (“
Figure 14
years, ran
Project is
years hav
approxim
estimated
net cost o
address O
b.
capacity auc
“RPM”). Th
4 shows that
nging from $
s expected to
ve been app
mately $43/k
d capacity p
of new entry
Ontario’s cap
PJM Capa
PJM Cap
ctions set se
he RPM occ
t the forwar
$28/MW-day
o deliver its c
proximately
kW-year. Th
ayment nece
y. As a resul
pacity needs
Facity Require
pacity Proc
easonal regio
curs every y
rd capacity p
y to $136/M
capacity. Th
$94/MW-da
hese forward
essary to ind
lt, capacity im
during the n
27
Figure 13 ements and E
curement M
onal capacit
year, three
prices have b
MW-day in th
he average fo
ay with the
d capacity p
duce new en
mports from
nuclear refur
Expected Cap
Mechanism
ty prices thr
years prior
been relative
he (“Rest of
orward capa
most recent
prices in PJM
ntry into the
m PJM may r
rbishment p
pacity
m
rough the R
to the com
ely volatile o
RTO”) regio
city prices o
t prices at $
M are signifi
e PJM mark
represent a lo
eriod.
Reliability Pr
mmitment pe
over the pas
on into whic
over the same
$120/MW-da
icantly below
ket, known a
ow-cost opti
ricing
eriod.
st five
ch the
e five
ay, or
w the
as the
ion to
28
Figure 14 PJM Base Residual Auction Clearing Prices in MAAC and Rest of RTO
(Through 2017/18 Capacity Delivery Year)
Source: PJM BRA results.
C. RENEWABLE ENERGY CREDITS AND CLEAN ENERGY
The U.S. states are currently building renewable energy resources for several reasons, including
(1) to fulfill incremental renewable requirements created by RPS, (2) to meet future stringent
environmental regulations, or (3) for economic purposes. Within PJM, the primary driver for
renewable generation continues to be the growing demand created by RPS mandates. Each state
has a slightly different definition of renewable resources in its RPS (with wind and solar
resources qualifying as renewable resources in all PJM states) and some states requiring the
resources to be physically located within the state or the region. Some existing requirements,
can be met by resources located in Canada. Further need for clean energy due to GHG standards
and other requirements may also provide additional opportunities for zero or low emissions
resources from Canada. One example is the proposed Low Carbon Portfolio Standards proposed
in Illinois that would create similar requirements to an RPS but include all low-carbon
generation resources, including nuclear and hydro generation.30
RPS mandates in the PJM states create value (above and beyond what can be realized through
the energy and capacity markets) for renewable generation in the PJM market through the
30 http://www.prnewswire.com/news-releases/broad-bipartisan-group-announces-market-based-
solution-preserving-low-carbon-energy-in-illinois-300042200.html
$191
$133
$226
$137
$167
$119
$41
$112
$102
$174
$110
$16$28
$126
$136
$59
$120
$0
$50
$100
$150
$200
$250
2007/08 2008/09 2009/10 2010/11 2011/12 2012/13 2013/14 2014/15 2015/16 2016/17 2017/18
*** *** *** *** *** *** *** *** *** *** ***
Apr‐07 Jul‐07 Oct‐07 Jun‐08 May‐08 May‐09 May‐10 May‐11 May‐12 May‐13 May‐14
Base Residual Auction Price
(UCAP $/M
W‐Day)
Delivery Year
MAAC
RTO
Auction Date
29
production and sale of RECs. Owners and developers of renewable generation in Ontario can
capture some of this additional value by selling their generation over the Project into PJM and
selling associated RECs to states in PJM that allow for their RPS mandates to be met by out-of-
state and out-of-market resources. Currently, the PJM states whose RPS requirements would
accept renewable generation imports from Ontario include Ohio, Maryland, New Jersey, and
Delaware as well as the District of Columbia.
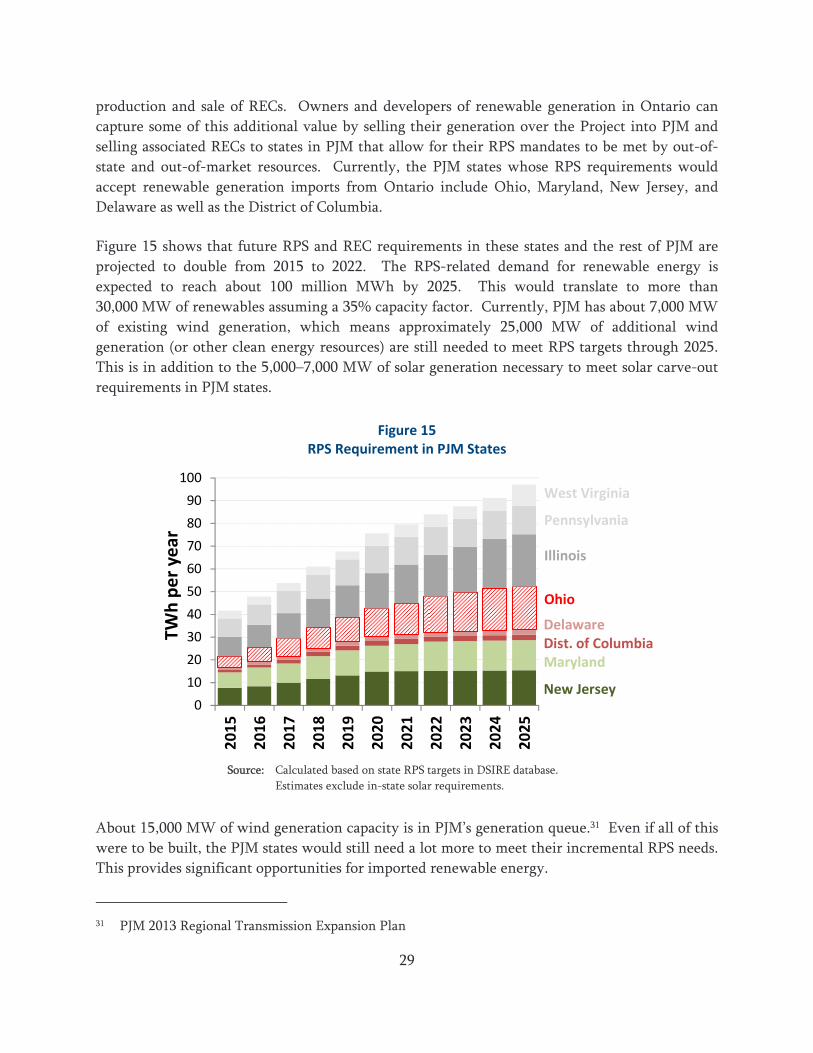
Figure 15 shows that future RPS and REC requirements in these states and the rest of PJM are
projected to double from 2015 to 2022. The RPS-related demand for renewable energy is
expected to reach about 100 million MWh by 2025. This would translate to more than
30,000 MW of renewables assuming a 35% capacity factor. Currently, PJM has about 7,000 MW
of existing wind generation, which means approximately 25,000 MW of additional wind
generation (or other clean energy resources) are still needed to meet RPS targets through 2025.
This is in addition to the 5,000–7,000 MW of solar generation necessary to meet solar carve-out
requirements in PJM states.
Figure 15 RPS Requirement in PJM States
Source: Calculated based on state RPS targets in DSIRE database.
Estimates exclude in-state solar requirements.
About 15,000 MW of wind generation capacity is in PJM’s generation queue.31 Even if all of this
were to be built, the PJM states would still need a lot more to meet their incremental RPS needs.
This provides significant opportunities for imported renewable energy.
31 PJM 2013 Regional Transmission Expansion Plan
0
10
20
30
40
50
60
70
80
90
100
2015
2016
2017
2018
2019
2020
2021
2022
2023
2024
2025
TWh per year
DelawareDist. of ColumbiaMaryland
New Jersey
West Virginia
Pennsylvania
Illinois
Ohio
30
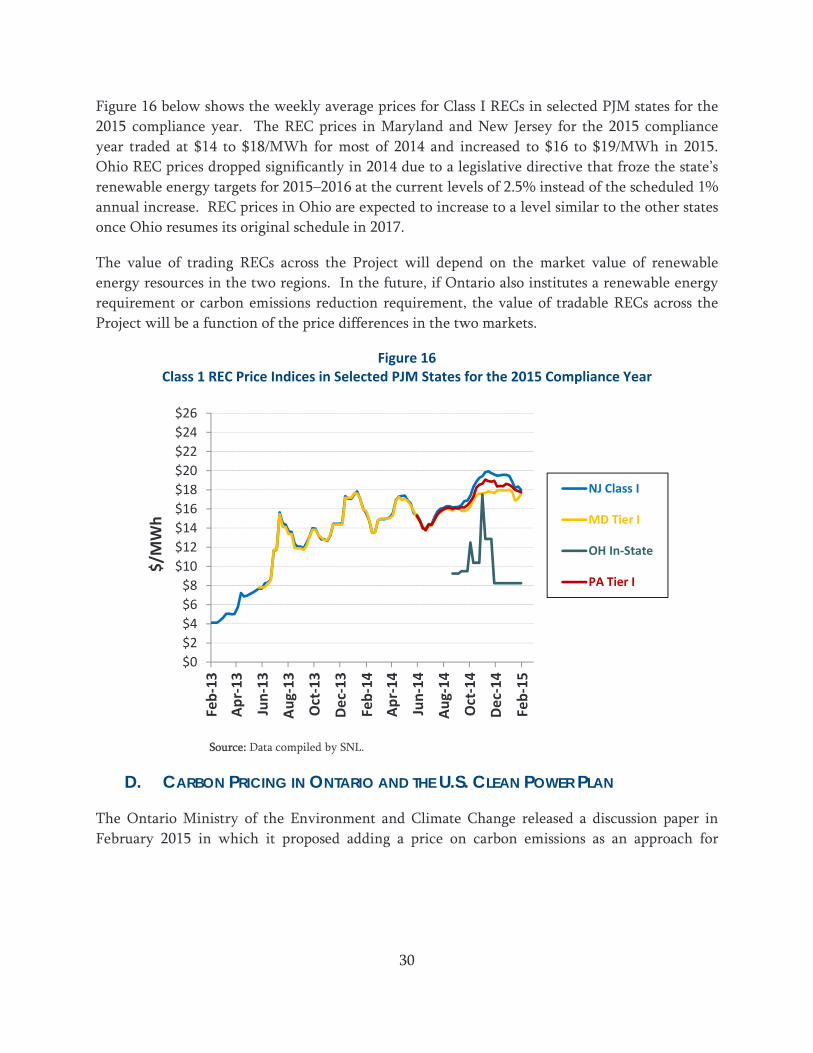
Figure 16 below shows the weekly average prices for Class I RECs in selected PJM states for the
2015 compliance year. The REC prices in Maryland and New Jersey for the 2015 compliance
year traded at $14 to $18/MWh for most of 2014 and increased to $16 to $19/MWh in 2015.
Ohio REC prices dropped significantly in 2014 due to a legislative directive that froze the state’s
renewable energy targets for 2015–2016 at the current levels of 2.5% instead of the scheduled 1%
annual increase. REC prices in Ohio are expected to increase to a level similar to the other states
once Ohio resumes its original schedule in 2017.
The value of trading RECs across the Project will depend on the market value of renewable
energy resources in the two regions. In the future, if Ontario also institutes a renewable energy
requirement or carbon emissions reduction requirement, the value of tradable RECs across the
Project will be a function of the price differences in the two markets.
Figure 16 Class 1 REC Price Indices in Selected PJM States for the 2015 Compliance Year
Source: Data compiled by SNL.
D. CARBON PRICING IN ONTARIO AND THE U.S. CLEAN POWER PLAN
The Ontario Ministry of the Environment and Climate Change released a discussion paper in
February 2015 in which it proposed adding a price on carbon emissions as an approach for
$0
$2
$4
$6
$8
$10
$12
$14
$16
$18
$20
$22
$24
$26
Feb‐13
Apr‐13
Jun‐13
Aug‐13
Oct‐13
Dec‐13
Feb‐14
Apr‐14
Jun‐14
Aug‐14
Oct‐14
Dec‐14
Feb‐15
$/M
Wh
NJ Class I
MD Tier I
OH In‐State
PA Tier I

31
reducing the Province’s greenhouse gas emissions.32 The Ministry requested public comment on
its proposals and aims to release a comprehensive strategy to adapt to climate change, although
the timing for doing so is currently unclear.
In April 2015, the premier of Ontario announced her intent to implement a cap-and-trade
system for greenhouse gas emissions as part of the Province’s strategy to combat climate
change.33 The cap-and-trade program may eventually link to the existing carbon program
between California and Québec.34 While the potential direction and impact of Ontario’s policies
are not yet clear, it appears that the Province is also moving toward using cleaner generation
resources.
In June of 2014, the U.S. Environmental Protection Agency proposed a plan to reduce carbon
emissions from existing sources of electricity generation, also known as the "Clean Power Plan."
Under the proposed rule, states are expected to develop plans to reduce carbon emissions for EPA
approval, either on an individual basis or as part of a region. Increased use of renewable
generation is one of the four "building blocks" that EPA expects will be used by states to achieve
required carbon emission reductions. This rule could further increase the value of access to clean
and renewable energy supplies. A final rule is expected this summer.
IV. Open Solicitation Process
As noted above, ITC Lake Erie was granted negotiated rate authority by FERC in 2014, subject to
carrying out an open solicitation process. ITC Lake Erie also has begun publicizing the
solicitation process, including by advertising the Project in trade publications.
ITC Lake Erie will initiate an open solicitation process later in 2015 to identify potential
subscribers of transmission capacity with whom to negotiate contracts for up to 1,000 MW of
transmission rights. Due to the bi-directional nature of the Project, transmission rights will be
available to be purchased separately in each direction.
In accordance with the requirements in FERC’s order granting ITC Lake Erie negotiated rate
authority, ITC Lake Erie will complete the open solicitation based on the following approach:
32 Ontario Ministry of the Environment and Climate Change, Ontario’s Climate Change Discussion
Paper 2015, February 2015. Available at:
http://www.downloads.ene.gov.on.ca/envision/env_reg/er/documents/2015/012-3452.pdf
33 The Globe and Mail, April 2, 2015, viewed at:
http://www.theglobeandmail.com/news/politics/ontario-plans-cap-and-trade-on-greenhouse-gas-
emissions/article23786538/
34 “Ontario joins cap-and-trade programme”, The Financial Times, April 13, 2015. Available online
here: http://www.ft.com/cms/s/0/bde76192-e1fd-11e4-9995-00144feab7de.html#axzz3XOJRprBr

32
1. ITC Lake Erie will initiate the open solicitation by posting information concerning the
Project to relevant publications and trade press, including the selection criteria ITC Lake
Erie will use to identify potential transmission customers, and requesting submittal of
Expressions of Interest.
2. Based on the Expressions of Interest, ITC Lake Erie will determine which interested
parties would qualify as potential transmission customers based on the following criteria:
a. Desired quantity of capacity on the Project;
b. Desired term of transmission service agreement;
c. Creditworthiness;
d. Financial strength (e.g., Tangible Net Worth); and
e. Desired start date of the transmission service
All Expressions of Interest will be assessed based on each of the criteria listed above, though
some criteria may carry a different (proprietary) weight than others. All of the criteria will be
applied in a non-discriminatory manner. ITC Lake Erie may conduct additional open solicitation
processes if the transmission capacity of the Project is not fully subscribed through the initial
round. ITC Lake Erie will consider negotiating only with those parties that are interested in
purchasing at least 50 MW of transmission capacity on the Project. Once prospective customers
have been identified, ITC Lake Erie will engage in negotiations with the interested parties, with
the goal of executing one or more transmission service agreements based on mutually agreed-
upon transmission rates, terms, and conditions. ITC Lake Erie also will reserve the right to offer
more favorable rates, terms, and conditions to certain customers, such as first-movers or those
willing to assume greater risk.
A website has been established to hold and share information related to the open solicitation and
to help facilitate communication between the Independent Manager of the solicitation and
interested parties.35 Communications with interested parties will take place through email and
the open solicitation website, and they will submit questions through the website, and the
answers will be posted on the website.36
Information sessions will be held to provide further detail regarding the Project, the value
proposition that it provides to potential subscribers, the details regarding the solicitation process,
and the requirements related to submitting Expressions of Interest.
35 See: http://www.lakeerieconnector-os.com
36 The website is divided into the following sections: overview of the open solicitation process;
registration form for parties interested in receiving updates regarding the open solicitation; Ask the
Manager page to submit questions directly to the Independent Manager; Frequently Asked Questions
(FAQs); calendar of key dates for the open solicitation process; details regarding information sessions;
public and confidential documents; and a portal for document submittal and registration.

33
Following agreement with transmission customers, ITC Lake Erie will submit a filing to FERC
disclosing the results of its capacity allocation process to demonstrate that the processes that led
to the identification of transmission customers and the execution of the relevant contractual
arrangements are consistent with the Policy Statement and FERC’s open access principles,
including the criteria used to select customers, any price terms, and any risk-sharing terms and
conditions.