Embed Size (px)
Citation preview
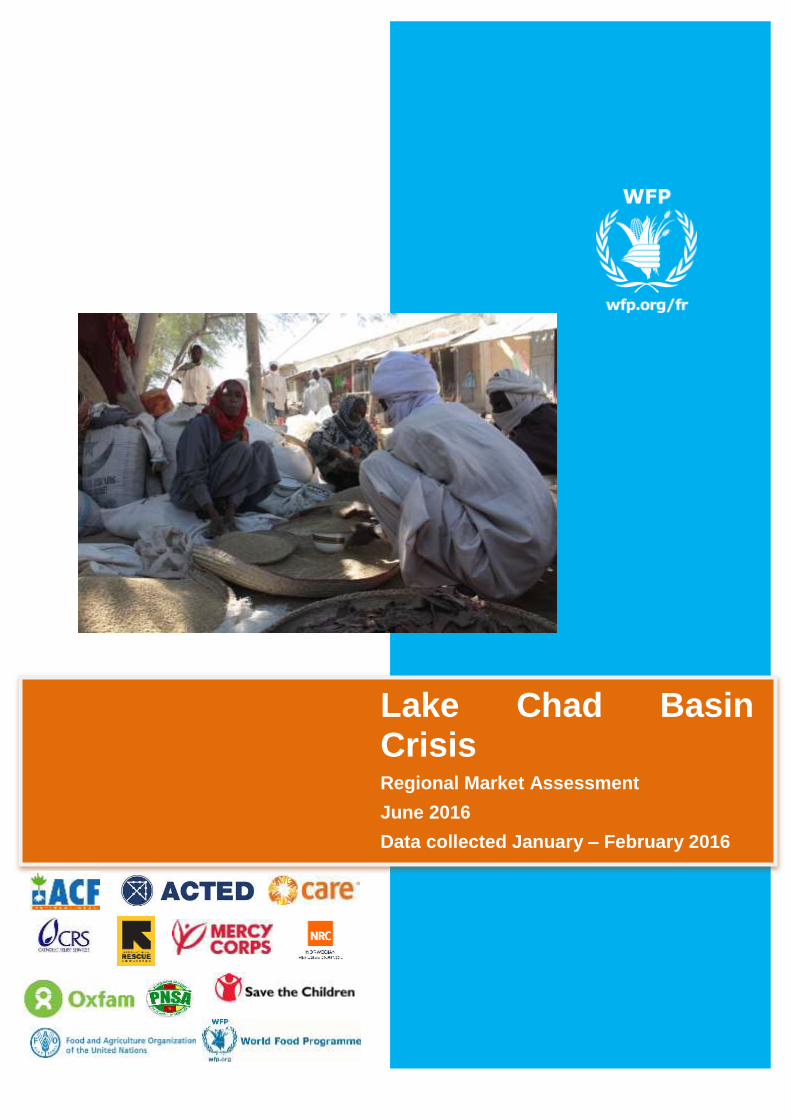
Lake Chad Basin Crisis Regional Market Assessment
June 2016
Data collected January – February 2016
2
Acknowledgments
This study was prepared by Stephanie Brunelin and Simon Renk. Primary data was collected
in collaboration with ACF and other partners, under the overall supervision of Simon Renk.
Acknowledgments go to Abdoulaye Ndiaye for the maps and to William Olander for cleaning
the survey data. The mission wishes to acknowledge valuable contributions made by various
colleagues in WFP country office Chad and WFP Regional Bureau Dakar. Special thanks to
Cecile Barriere, Yannick Pouchalan, Maggie Holmesheoran, Patrick David, Barbara
Frattaruolo, Ibrahim Laouali, Mohamed Sylla, Kewe Kane, Francis Njilie, Analee Pepper,
Matthieu Tockert for their detailed and useful comments on earlier versions of the report. The
report has also benefitted from the discussions with Marlies Lensink, Malick Ndiaye and
Salifou Sanda Ousmane. Finally, sincere appreciation goes to the enumerators, traders and
shop-owners for collecting and providing information during the survey.
Acronyms
ACF Action Contre la Faim
ACLED Armed Conflict Location and Event Data Project
FAO Food and Agriculture Organization
FEWS NET Famine Early Warning System Network
GDP Gross Domestic Product
GPI Gender Parity Index
IDP Internally Displaced People
IFC International Finance Corporation
IMF International Monetary Fund
IOM International Organization for Migration
MT Metric Ton
NAMIS Nigeria Agricultural Market Information Service
OHCHR Office of the United Nations High Commissioner for Human Rights
UNESCO United Nations Educational, Scientific and Cultural Organization
USDA U.S. Department of Agriculture
WFP World Food Programme
3
Table of Content
Acknowledgments ...................................................................................................................... 2
Acronyms ................................................................................................................................... 2
Table of Content ......................................................................................................................... 3
List of figures and tables ............................................................................................................ 4
Executive summary .................................................................................................................... 6
1. Introduction ......................................................................................................................... 8
2. Methodology and limits ...................................................................................................... 8
3. Context ................................................................................................................................ 9
4. Food availability ............................................................................................................... 13
5. Trader characteristics ........................................................................................................ 14
6. Trade flows and market access ......................................................................................... 18
7. Supply chain ...................................................................................................................... 22
7.1. Changes in supply sources ......................................................................................... 22
7.2. Strategies to cope with price increases or supply problems ...................................... 22
8. Price .................................................................................................................................. 23
8.1. Price level and price volatility ................................................................................... 23
8.2. Price seasonality ........................................................................................................ 28
9. Volumes ............................................................................................................................ 29
10. Response capacity ............................................................................................................. 30
11. Main constraints ................................................................................................................ 34
12. Stock strategy .................................................................................................................... 36
13. Source of funding and credit access .................................................................................. 38
14. Concluding remarks and suggestions ................................................................................ 40
Bibliographie ............................................................................................................................ 42
Annex A: Additional tables and figures ................................................................................... 43
Annex B: Decision making process ......................................................................................... 55
Annex C: Limits and suggestions for improving questionnaire design ................................... 58
4
List of figures and tables
Figure 1: Violent activity by type in North Nigeria (Yobe, Adawama and Borno) ................. 10
Map 1: Number of conflict related fatalities between 2010 and 2015 ..................................... 12
Figure 2: Calendar of a typical cereal marketing year in the Sahel ......................................... 13
Figure 3: Gender of customers ................................................................................................. 15
Figure 4: Traders’ age by gender ............................................................................................. 16
Figure 5: Traders’ age by type of traders ................................................................................. 16
Figure 6: Level of education among traders ............................................................................. 17
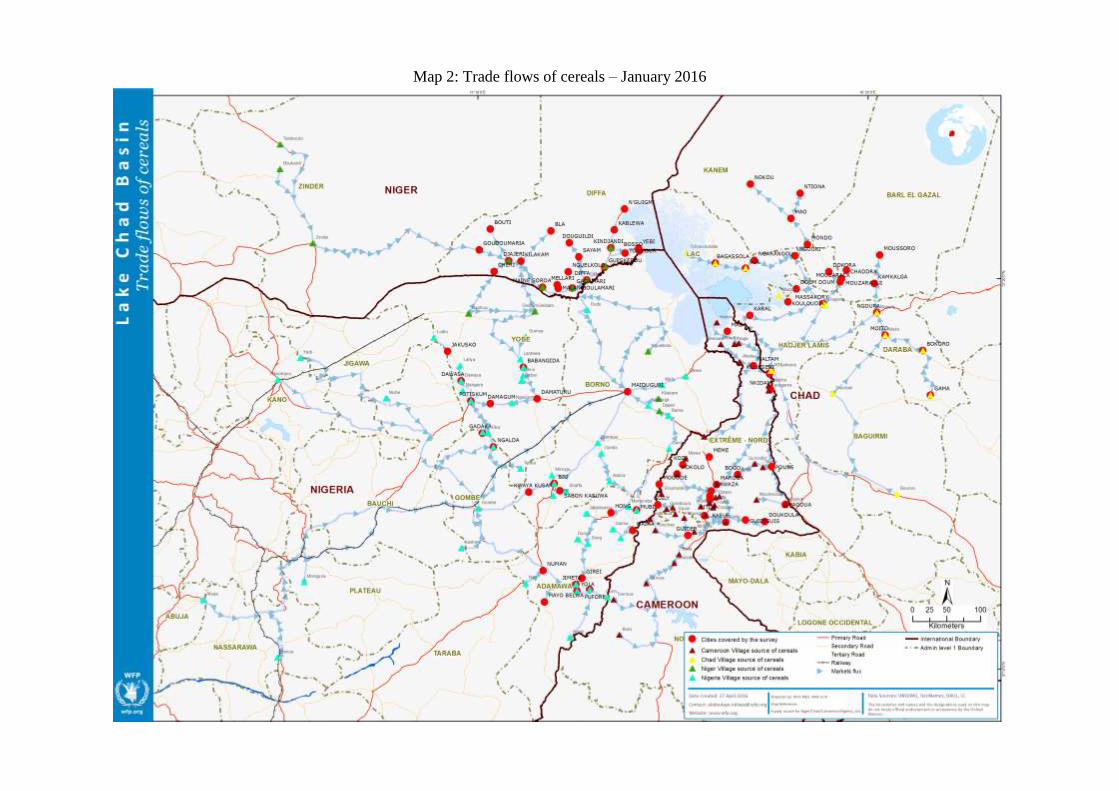
Map 2: Trade flows of cereals – January 2016 ........................................................................ 19
Figure 7: Share of traders who change the source of supply of their commodities since the start
of their activity ......................................................................................................................... 22
Figure 8: Average retail prices of millet in Chad, Niger and Nigeria (CFAF/kg) ................... 24
Figure 9: Millet price in CFAF/kg ........................................................................................... 24
Figure 10: Average retail prices of sorghum in Chad, Niger and Nigeria (CFAF/kg) ............ 25
Figure 11: Sorghum price in CFAF/kg .................................................................................... 25
Figure 12: Maize price in CFAF/kg ......................................................................................... 26
Figure 13: Average retail prices of maize in Chad, Niger, Cameroon and Nigeria (CFA/kg) 27
Figure 14: Average retail prices of rice in Chad, Niger, Cameroon and Nigeria (CFAF/kg) .. 27
Figure 15: Prices of imported rice in CFAF/kg ........................................................................ 28
Figure 16: Seasonal pattern of cereals (2008-2015, CFAF/KG) .............................................. 29
Figure 17: Response capacity to a 100 percent increase in demand ........................................ 31
Figure 18: Response capacity to a 100 percent increase in demand in Cameroon .................. 32
Figure 19: Response capacity to a 100 percent increase in demand in Chad ........................... 32
Figure 20: Response capacity to a 100 percent increase in demand in Niger .......................... 33
Figure 21: Response capacity to a 100 percent increase in demand in Nigeria ....................... 34
Figure 22: First constraint faced by transporters (%) ............................................................... 36
Figure 23: Time of the year when traders experience stockout ............................................... 37
Figure 24: Main source of funding for traders by gender ........................................................ 39
Figure A1: Number of reported fatalities by region ................................................................. 43
Figure A2a: Maize production (1000 MT) ............................................................................... 44
Figure A2b : Millet production (1000 MT) .............................................................................. 44
Figure A2c : Milled rice production (1000 MT) ...................................................................... 44
Figure A2d : Sorghum production (1000 MT) ......................................................................... 44
Figure A3a: Average number of customer per trader per week in Cameroon ......................... 45
Figure A3b: Average number of customer per trader per week in Chad ................................. 45
Figure A3c: Average number of customer per trader per week in Niger ................................. 46
Figure A3d: Average number of customer per trader per week in Nigeria .............................. 46
5
Figure A4a: Sum of weekly sale by market for respectively the main local and imported good
in Cameroon (MT) ................................................................................................................... 47
Figure A4b: Sum of weekly sale by market for respectively the main local and imported good
in Chad (MT) ............................................................................................................................ 47
Figure A4c: Sum of weekly sale by market for respectively the main local and imported good
in Niger (MT) ........................................................................................................................... 48
Figure A4d: Sum of weekly sale by market for respectively the main local and imported good
in Nigeria (MT) ........................................................................................................................ 48
Table 1: Number of actors interviewed by country and region .................................................. 9
Table 2: Traders’ type by selling point* .................................................................................. 14
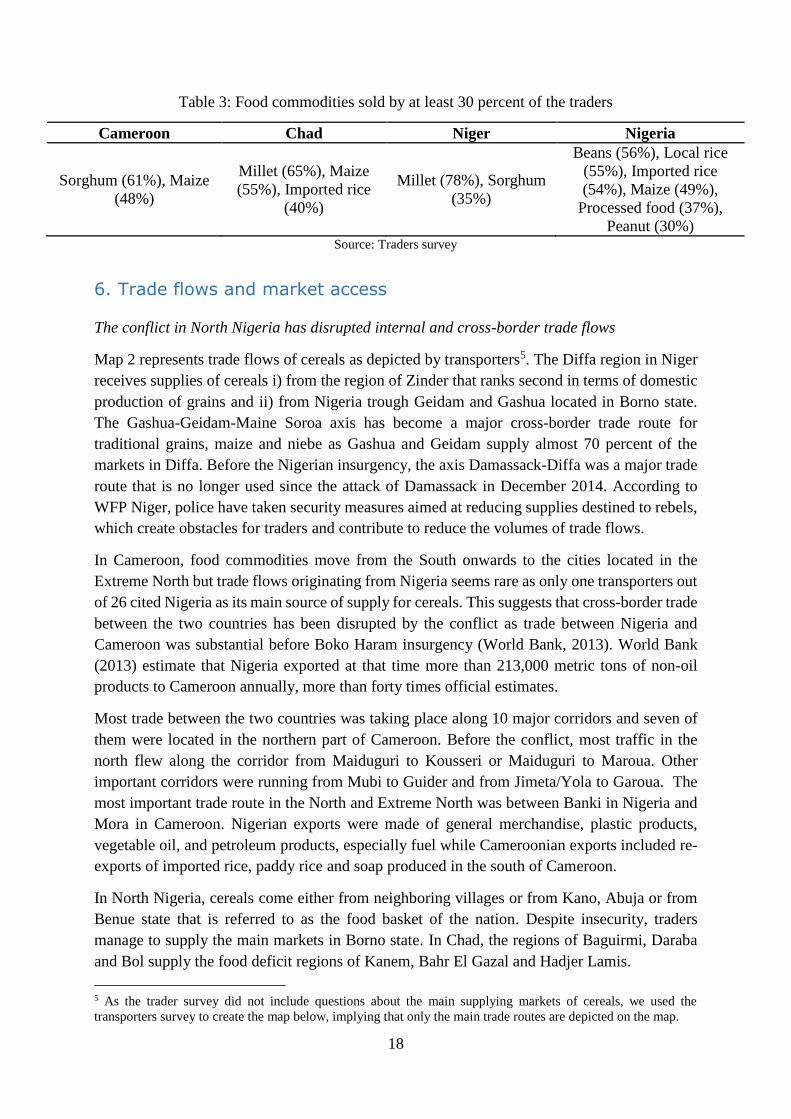
Table 3: Food commodities sold by at least 30 percent of the traders ..................................... 18
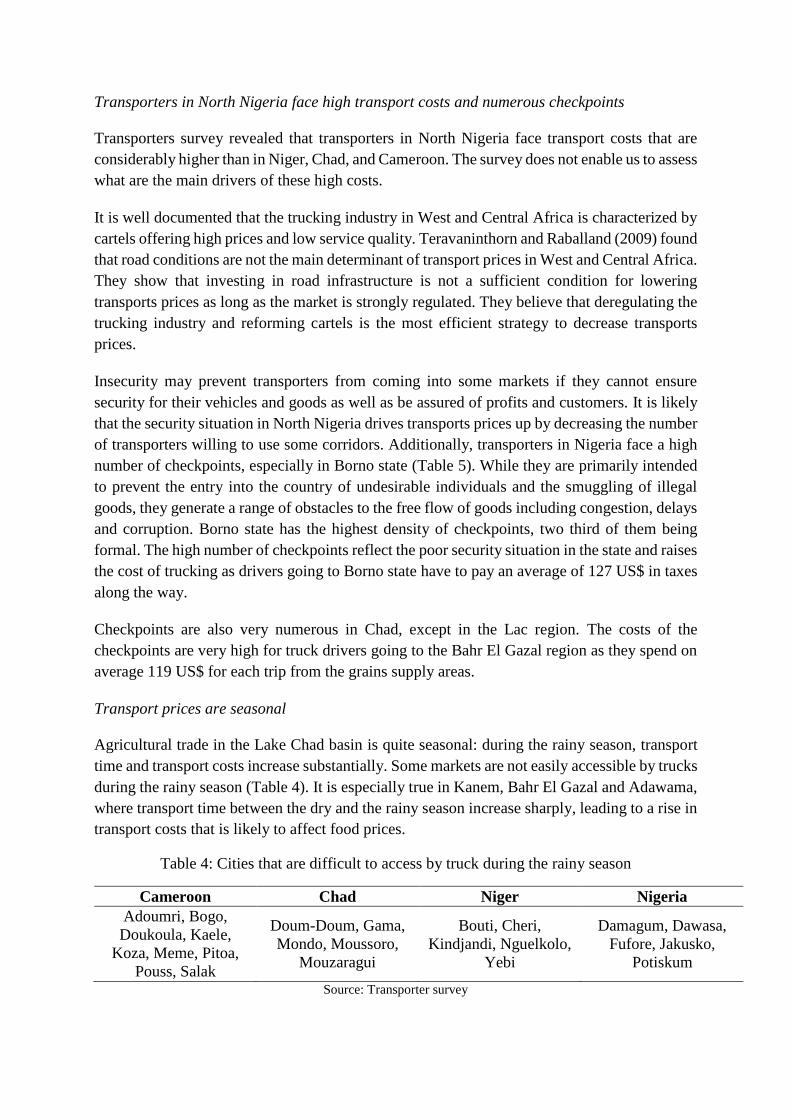
Table 4: Cities that are difficult to access by truck during the rainy season ............................ 20
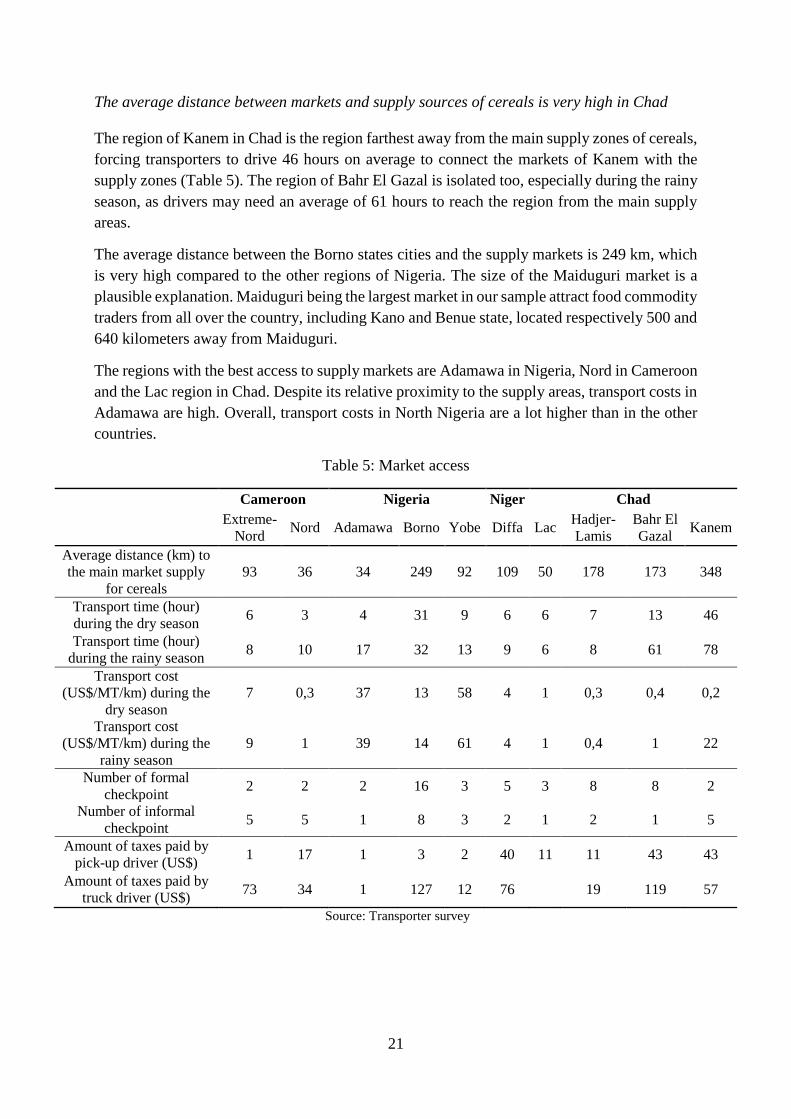
Table 5: Market access ............................................................................................................. 21
Table 6: Unusual strategies developed by traders to cope with price increase or supply problems
23
Table 7: Top 10 constraints faced by traders by gender (%).................................................... 35
Table 8: Top 10 constraints faced by traders by trader’s type (%) .......................................... 35
Table 9: Share of wholesalers storing products from the previous campaign for reselling them
later .......................................................................................................................................... 37
Table 10: Average duration of grain storage in months during the 2014/15 campaign ........... 38
Table 11: Share of traders selling products on credit (%) ........................................................ 40
Table A1: Number of traders by type of trade ......................................................................... 49
Table A2: Millet prices characteristics (01/2008-12/2015 in CFAF/kg) ................................. 51
Table A3: Sorghum prices characteristics (01/2008-12/2015 in CFAF/kg) ............................ 52
Table A4: Maize prices characteristics (01/2008-12/2015 in CFAF/kg) ................................. 53
Table A5: Rice prices characteristics (01/2008-12/2015 in CFAF/kg) .................................... 54
Table B1: Who decides whether you will take out credit to finance trade activities most of the
time? (%) .................................................................................................................................. 55
Table B2: Who decides how much of your generated income will be spent on food for your
household most of the time? ..................................................................................................... 55
Table B3: Who decides whether you will sell this product most of the time? (%) (For the main
local product) ............................................................................................................................ 56
Table B4: Who decides at what price you will sell this product most of the time? (%) (For the
main local product .................................................................................................................... 56
Table B5: Who decides from whom/where you will purchase this product most of the time? (%)
(For the main local product ...................................................................................................... 57
Table C1: Data quality issues when traders were asked to identify the main national product
and the main imported product ................................................................................................. 59
Table C2: Number of transporters interviewed by country ...................................................... 60
6
Executive summary
Since 2012, the security situation in North Nigeria has dramatically worsened leading to
massive displacement of population, not only within Nigeria but also in neighboring Cameroon,
Chad and Niger. The ongoing conflict strongly affect food security in the northeast as people
suffer from serious restrictions to their livelihood. Considering this situation, the WFP Regional
Bureau for West Africa, in collaboration with ACF and other partners, launched a regional
market assessment in the Lake Chad basin. This market assessment aims at addressing
information needs to support the national and regional humanitarian response, and strengthen
market baselines across the four countries.
The report relies on secondary data analysis, consultations with WFP, FAO, FEWS NET and
National Early Warning Systems and Markets Information Systems and a primary data
collection exercise through markets survey that covered 104 cities located in 10 regions and 4
countries around the Lake Chad Basin: Nigeria, Niger, Chad and Cameroon. The market
assessment was conducted in January and February 2016 and the survey was administered to
1619 traders and 620 transporters.
The Boko Haram-related conflict in Northeast Nigeria is persisting. According to IOM (April
2016), 1,856,616 IDPs have been displaced by the insurgency and 92 percent of them are in
Borno, Adamawa and Yobe, which are the three Nigerian states covered by the survey. In
addition to the security situation, Nigeria faces economics challenges due to the drop in global
oil prices and the depreciation of the naira that is likely to reduce the purchasing power of
Nigerian traders for imported goods and cash crops from the Sahel.
Primary data shows that the place of women in agricultural trade varies between countries.
Women account for almost half of the traders in Cameroon whereas female traders make up
less than 20 percent of traders in the other countries. Overall, women are more likely to be
retailers than wholesalers and are less likely to have employees.
The on-going conflict in North Nigeria has disrupted trade flows by forcing traders to change
trade routes. Cross-border trade between Nigeria and Niger has been affected as transporters
can no longer use the axis Damassack-Diffa because of security reasons. Cross-border flows
between the two countries have moved to the west and the Gashua-Geidam-Maine Soroa axis
has become a major cross-border trade route for traditional grains, maize and niebe.
Cross-border trade between Nigeria and Cameroon seems to have suffered from the conflict as
well. Before the conflict, most traffic in north Cameroon flew along the corridor from
Maiduguri to Kousseri or Maiduguri to Maroua. In the present survey, only one transporter out
of 26 in Cameroon reported Nigeria as its main supply source of cereals suggesting that
agricultural trade flows between Northeast Nigeria and North Cameroon have been reduced.
The transporters survey shows that transporters in North Nigeria face high transport costs and
numerous checkpoints, especially in Borno state. While they are primarily intended to prevent
the entry of undesirable individuals and the smuggling of illegal goods, they raise the cost of
trucking and are likely to generate delays.
7
Despite these difficulties, most traders in Diffa (Niger), Borno and Yobe (Nigeria) and in Bahr
El Gazal (Chad) estimate to have the capacity to respond quickly to a 100 percent increase in
demand, should such a significant increase in demand be triggered by a cash and voucher
programme. On the other hand, in the North region of Cameroon and in the Lac region of Chad,
a large share of traders reported being unable of doubling their sales to meet an important
increase in demand.
Most traders did not change their sources of supply since the start of their trading activities,
suggesting that they managed to keep the same supply source in spite of the security crisis in
North Nigeria. In Niger, traders seem reluctant to change suppliers even when they face supply
difficulties, which is likely to reflect the role played by trader networks in Niger. An important
share of traders rely on suppliers as their main sources of funding, confirming the role played
by social networks in agricultural trade in Niger.
Lack of own capital is massively reported by traders as their first constraint followed by
insecurity. Female traders seem to suffer more than male from the lack of capital and the lack
of credit. Indeed, 67 percent of female traders reported lack of own capital as their main
constraint compared to 44 percent of male traders, suggesting that women disproportionately
face financial access barriers that prevent them from participating in the agricultural trade.
At transporter level, insecurity, harassment and poor road infrastructure are the main constraints
reported on by transporters. In Chad and Nigeria, insecurity and harassment come first whereas
Cameroonian and Nigerien transporters are more concerned by poor road infrastructure.
8
1. Introduction
Considering the recent humanitarian crisis and the increased displacement in the region, the
Vulnerability Assessment and Mapping unit of the WFP Regional Bureau for West Africa, in
collaboration with ACF and other partners (including National Early Warning Systems and
Markets Information Systems), launched a regional market assessment in the Lake Chad basin.
The assessment was conducted in ten regions in Chad, Niger, Nigeria and Cameroon, in the
surrounding zones around the Lake Chad Basin.
The main objective is to address urgent information needs to support the national and regional
humanitarian response, and strengthen market baselines across the four countries. The study
assessed the market situation of the on-going crisis and subsequent market disruptions. The
main focus was on cereals.
2. Methodology and limits
This assessment relies on secondary data analysis and primary data collection. Secondary data
include price data collected by FEWS NET, National Early Warning Systems and Market
Information Systems as well as political violence and protest data gathered by ACLED (Armed
Conflict Location and Event Data Project). Primary data collection was undertaken from mid-
January 2016 to mid-February 2016 in ten regions surrounding the Lake Chad basin1 covering
a total of 104 towns and villages (Table 1). Data collection tools include a market
questionnaire, a trader questionnaire and a transporter questionnaire.
Enumerators collected data in 26 cities in Chad, 24 in Cameroon, 22 in Niger and 30 in Nigeria.
On average, the traders’ questionnaire was submitted to 14 traders by city in Chad and
Cameroon, 7 in Niger and 19 in Nigeria when Maiduguri is not considered2. The sample size
varies between countries with Nigeria being the most represented country in the sample with
734 traders interviewed out of 1620 (Table 1). The city of Maiduguri, which is the capital of
Borno state where the concentration of the armed opposition group is the highest, account for
10 percent of the overall sample and 23 percent of the Nigerian sample of traders.
The geographic choice for the primary data collection has been limited by the security situation
that is still very unstable in North Nigeria. The traders’ questionnaire was administered in only
four cities in Borno state: Biu, Kwaya Kusar, Maiduguti and Sabon Kasuwa (Table A1) due to
security reasons. The security situation in North Nigeria prevented enumerators to access many
villages in Borno states.
Men are overrepresented in the sample. The share of women in both samples (traders and
transporters) is low, with the exception of the sample in Cameroon where women accounts for
1 The survey covered four regions in Chad including a region named Lac, which can be confusing with the Lake
Chad basin. In the rest of the document, we refer to this specific region of Chad as the Lac region whereas we
refers to the Lake basin as the Lake Chad basin. 2 The traders’ questionnaire was submitted to 169 traders in Maiduguri. Maiduguri has a special place in the survey
as the city is the birthplace of Islamist group Boko Haram's insurgency.
9
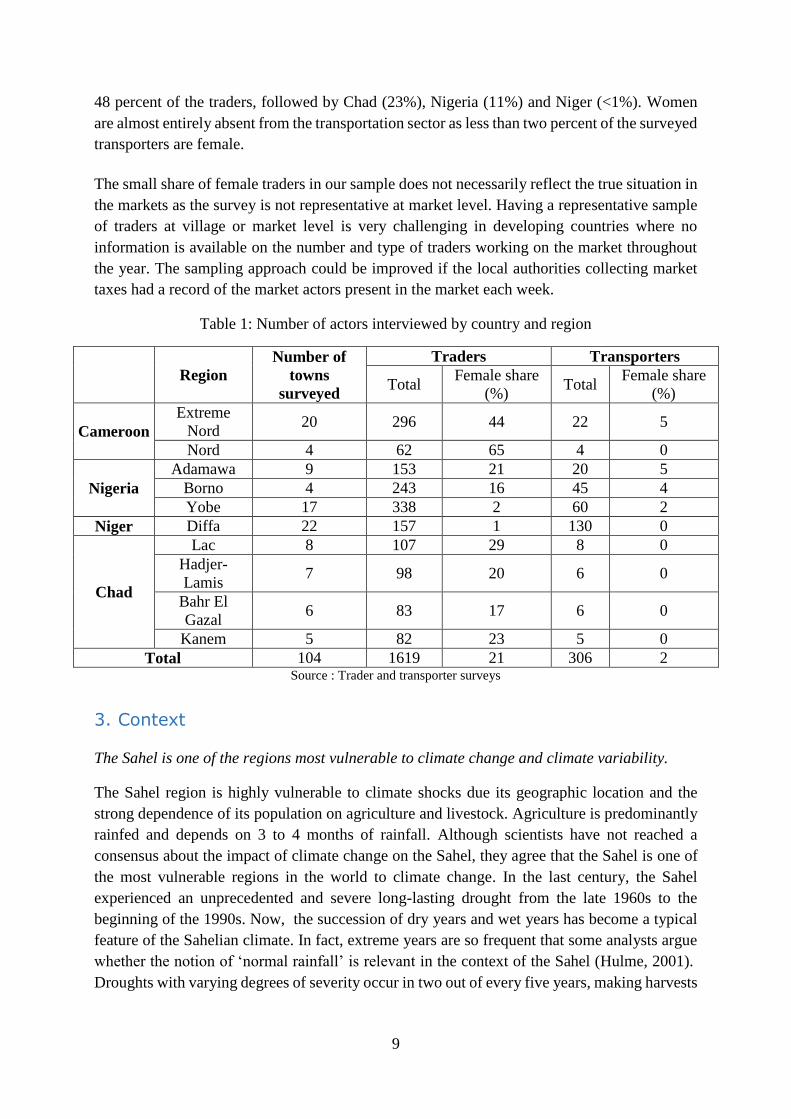
48 percent of the traders, followed by Chad (23%), Nigeria (11%) and Niger (<1%). Women
are almost entirely absent from the transportation sector as less than two percent of the surveyed
transporters are female.
The small share of female traders in our sample does not necessarily reflect the true situation in
the markets as the survey is not representative at market level. Having a representative sample
of traders at village or market level is very challenging in developing countries where no
information is available on the number and type of traders working on the market throughout
the year. The sampling approach could be improved if the local authorities collecting market
taxes had a record of the market actors present in the market each week.
Table 1: Number of actors interviewed by country and region
Region
Number of
towns
surveyed
Traders Transporters
Total Female share
(%) Total
Female share
(%)
Cameroon
Extreme
Nord 20 296 44 22 5
Nord 4 62 65 4 0
Nigeria
Adamawa 9 153 21 20 5
Borno 4 243 16 45 4
Yobe 17 338 2 60 2
Niger Diffa 22 157 1 130 0
Chad
Lac 8 107 29 8 0
Hadjer-
Lamis 7 98 20 6 0
Bahr El
Gazal 6 83 17 6 0
Kanem 5 82 23 5 0
Total 104 1619 21 306 2 Source : Trader and transporter surveys
3. Context
The Sahel is one of the regions most vulnerable to climate change and climate variability.
The Sahel region is highly vulnerable to climate shocks due its geographic location and the
strong dependence of its population on agriculture and livestock. Agriculture is predominantly
rainfed and depends on 3 to 4 months of rainfall. Although scientists have not reached a
consensus about the impact of climate change on the Sahel, they agree that the Sahel is one of
the most vulnerable regions in the world to climate change. In the last century, the Sahel
experienced an unprecedented and severe long-lasting drought from the late 1960s to the
beginning of the 1990s. Now, the succession of dry years and wet years has become a typical
feature of the Sahelian climate. In fact, extreme years are so frequent that some analysts argue
whether the notion of ‘normal rainfall’ is relevant in the context of the Sahel (Hulme, 2001).
Droughts with varying degrees of severity occur in two out of every five years, making harvests
10
of the major food and cash crops highly uncertain (Kandji et al, 2006). Climate variability
therefore poses one of the biggest obstacles to the achievement of food security in the region.
The security situation in the Lake Chad basin has deteriorated significantly since 2010 due to
the Boko Haram conflict
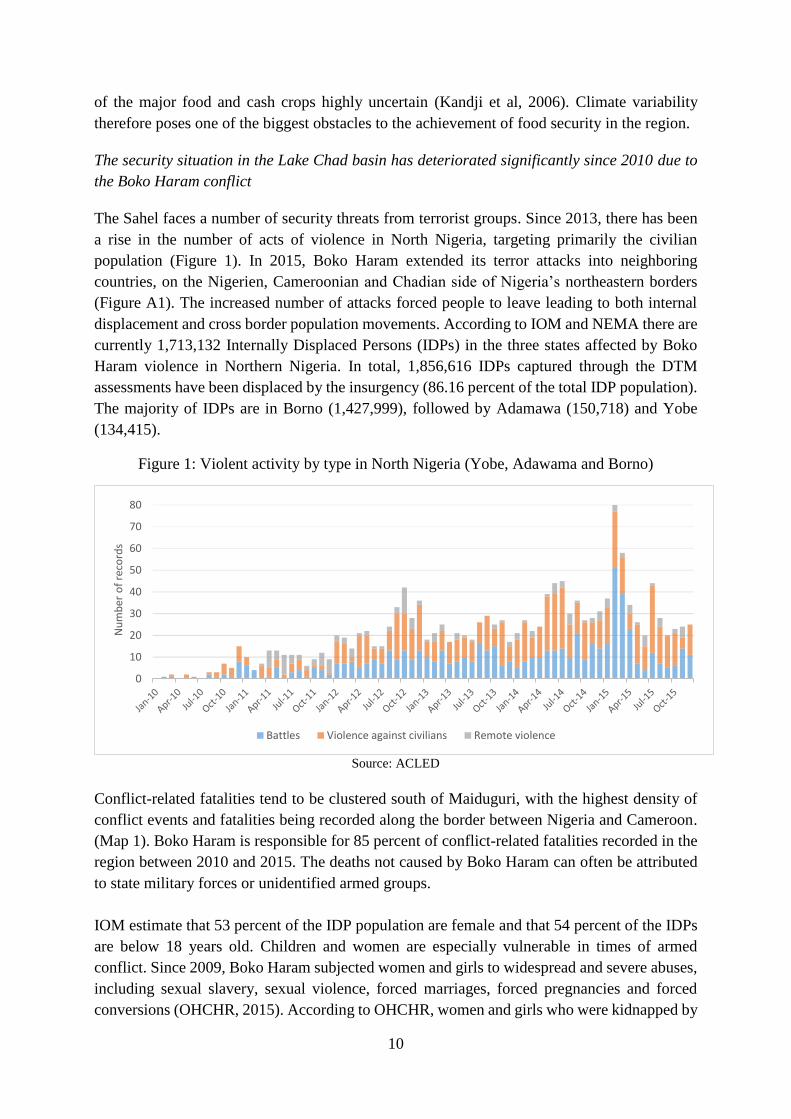
The Sahel faces a number of security threats from terrorist groups. Since 2013, there has been
a rise in the number of acts of violence in North Nigeria, targeting primarily the civilian
population (Figure 1). In 2015, Boko Haram extended its terror attacks into neighboring
countries, on the Nigerien, Cameroonian and Chadian side of Nigeria’s northeastern borders
(Figure A1). The increased number of attacks forced people to leave leading to both internal
displacement and cross border population movements. According to IOM and NEMA there are
currently 1,713,132 Internally Displaced Persons (IDPs) in the three states affected by Boko
Haram violence in Northern Nigeria. In total, 1,856,616 IDPs captured through the DTM
assessments have been displaced by the insurgency (86.16 percent of the total IDP population).
The majority of IDPs are in Borno (1,427,999), followed by Adamawa (150,718) and Yobe
(134,415).
Figure 1: Violent activity by type in North Nigeria (Yobe, Adawama and Borno)
Source: ACLED
Conflict-related fatalities tend to be clustered south of Maiduguri, with the highest density of
conflict events and fatalities being recorded along the border between Nigeria and Cameroon.
(Map 1). Boko Haram is responsible for 85 percent of conflict-related fatalities recorded in the
region between 2010 and 2015. The deaths not caused by Boko Haram can often be attributed
to state military forces or unidentified armed groups.
IOM estimate that 53 percent of the IDP population are female and that 54 percent of the IDPs
are below 18 years old. Children and women are especially vulnerable in times of armed
conflict. Since 2009, Boko Haram subjected women and girls to widespread and severe abuses,
including sexual slavery, sexual violence, forced marriages, forced pregnancies and forced
conversions (OHCHR, 2015). According to OHCHR, women and girls who were kidnapped by
0
10
20
30
40
50
60
70
80
Nu
mb
er o
f re
cord
s
Battles Violence against civilians Remote violence
11
Boko Haram generally faced worse stigmatization than men and boys. Pregnant women and
women who gave birth whilst in captivity or shortly after rescue, are particularly stigmatized,
together with their children.
Nigeria, which is the first economic power in the region, faces economic challenges
Nigeria is Africa’s most populous country, with more than 180 million people in 2014
according to World Bank estimates. The oil and gas sector accounts for the majority of
government revenues and export earnings, making the country highly vulnerable to swings in
global oil prices. Low global oil prices have a strong negative impact on Nigeria’s actual and
projected economic performance. The country faced a sharp decline in real GDP growth in 2015
(which dropped from 6.2% in late 2014 to 2.8% in late 2015) and a rise in the general
government deficit that doubled to about 3.3 percent of GDP in 2015 (IMF, 2016).
The value of the Nigerian naira has depreciated by more than 30 percent between December
2015 and February 2016 due primarily to reductions in oil sector revenues in 2015 (FEWS
NET, 2016). This depreciation will reduce the purchasing power of Nigerian traders for
imported goods, such as rice, wheat, and livestock and cash crops from the Sahel.
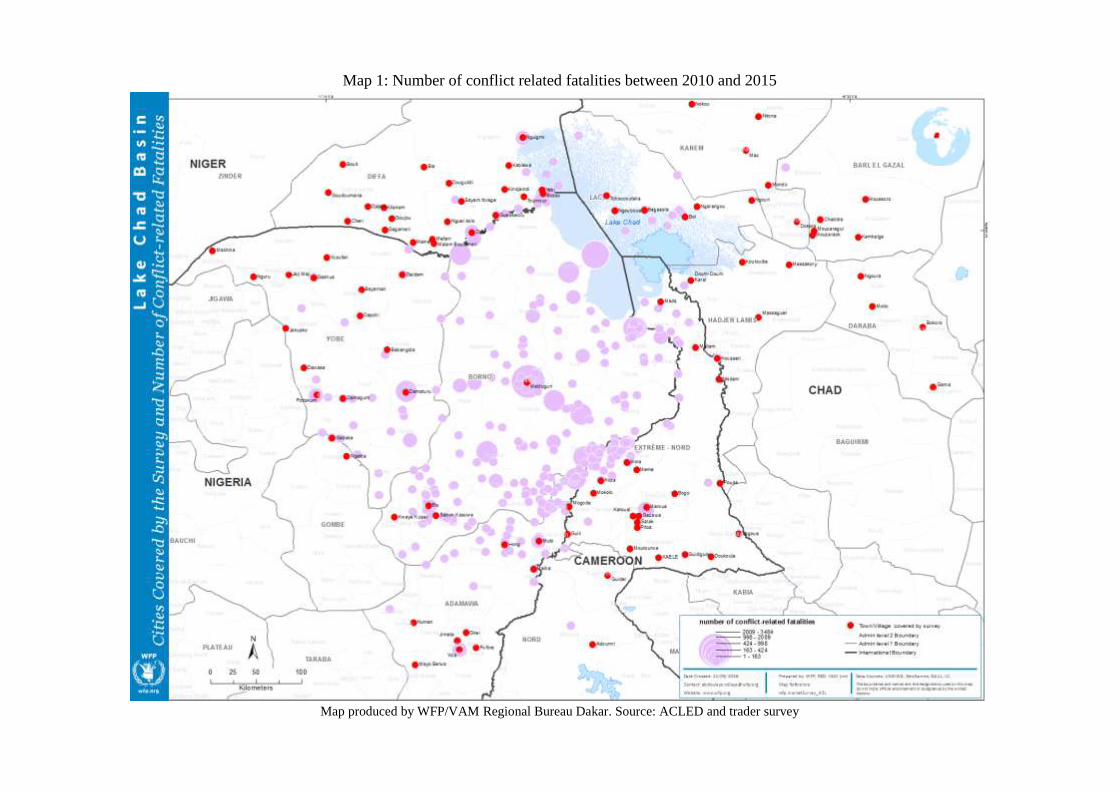
Map 1: Number of conflict related fatalities between 2010 and 2015
Map produced by WFP/VAM Regional Bureau Dakar. Source: ACLED and trader survey
4. Food availability
Millet and sorghum are the staple diet in Niger and Chad and to a lesser extent in Nigeria and
Cameroon. According to the latest available data (FAO, 2016), millet and sorghum are the main
source of calories in Niger and Chad where these two crops account for respectively 54 and 34
percent of the total energy consumption. In Cameroon, sorghum is the third source of calories
behind maize (13%) and cassava (11%). In Nigeria, rice, cassava, maize and sorghum account
for a similar share in the Nigerian diet (about 10%). We expect some differences to be found
by region but no disaggregated data were available.
North Cameroon, North Nigeria, Chad, Niger share a very similar cultural calendar
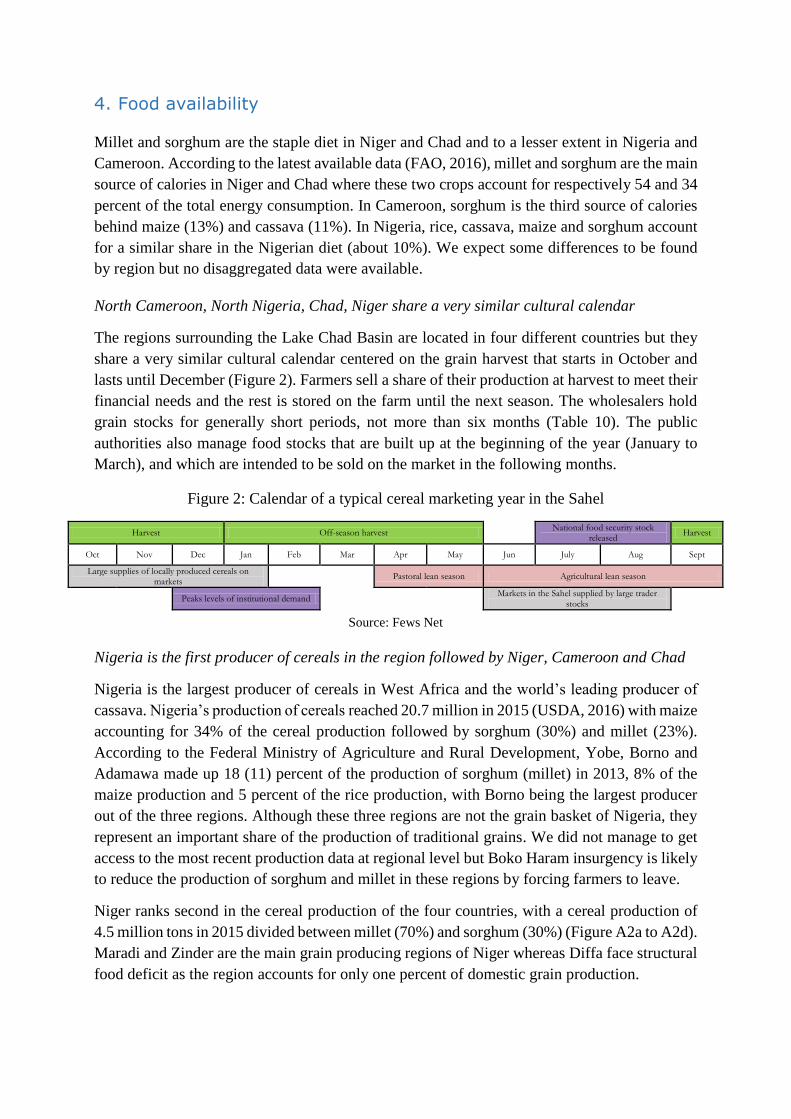
The regions surrounding the Lake Chad Basin are located in four different countries but they
share a very similar cultural calendar centered on the grain harvest that starts in October and
lasts until December (Figure 2). Farmers sell a share of their production at harvest to meet their
financial needs and the rest is stored on the farm until the next season. The wholesalers hold
grain stocks for generally short periods, not more than six months (Table 10). The public
authorities also manage food stocks that are built up at the beginning of the year (January to
March), and which are intended to be sold on the market in the following months.
Figure 2: Calendar of a typical cereal marketing year in the Sahel
Harvest Off-season harvest National food security stock
released Harvest
Oct Nov Dec Jan Feb Mar Apr May Jun July Aug Sept
Large supplies of locally produced cereals on markets Pastoral lean season Agricultural lean season
Peaks levels of institutional demand
Markets in the Sahel supplied by large trader stocks
Source: Fews Net
Nigeria is the first producer of cereals in the region followed by Niger, Cameroon and Chad
Nigeria is the largest producer of cereals in West Africa and the world’s leading producer of
cassava. Nigeria’s production of cereals reached 20.7 million in 2015 (USDA, 2016) with maize
accounting for 34% of the cereal production followed by sorghum (30%) and millet (23%).
According to the Federal Ministry of Agriculture and Rural Development, Yobe, Borno and
Adamawa made up 18 (11) percent of the production of sorghum (millet) in 2013, 8% of the
maize production and 5 percent of the rice production, with Borno being the largest producer
out of the three regions. Although these three regions are not the grain basket of Nigeria, they
represent an important share of the production of traditional grains. We did not manage to get
access to the most recent production data at regional level but Boko Haram insurgency is likely
to reduce the production of sorghum and millet in these regions by forcing farmers to leave.
Niger ranks second in the cereal production of the four countries, with a cereal production of
4.5 million tons in 2015 divided between millet (70%) and sorghum (30%) (Figure A2a to A2d).
Maradi and Zinder are the main grain producing regions of Niger whereas Diffa face structural
food deficit as the region accounts for only one percent of domestic grain production.
14
Maize is an important traditional food crop in Cameroon, ranking first - before sorghum and
rice - in terms of annual production. The production of cereal in Cameroon was about 3 million
tons in 2015, with 58 percent being maize followed by sorghum (38%).
Grain production in Chad in 2015 totaled an estimated 2.4 million tons, down 11 percent from
2014 (2,748,668 MT) and 9 percent from the past five years average (2,687,408 MT). Sorghum
is the main food crop contributing to more than 45 percent of grain production followed by
millet (33%) and maize (20%). Among the four Chadian regions considered in the survey, only
two provide more than one percent of cereal production: Hadjer Lamis and Lac. They
respectively contributed to 3 and 4.6 percent of domestic production of cereals in 2015. Hadjer
Lamis is a producing region of millet and sorghum while Lac is the first region for maize,
accounting for 30 percent of domestic production.
5. Trader characteristics
Female participation in agricultural trade appears to be low and women are more often found
to be retailers than wholesalers
As outlined earlier, women account for a small share of traders, especially in Niger where only
one female trader is included in the survey. Although we cannot draw conclusions about the
whole population based on this survey that is not representative at the market level, the data
still suggest that women take a more active part in agricultural trade in Cameroon than in the
other countries surrounding the Lake Chad basin. The timing of the survey may play a role in
the low participation of women in trade. Women have typically low access to finance (IFC,
2011) and then are more likely to sell agricultural commodities only seasonally, following the
harvest that typically start in September. Additionally, the role of women in trade is shaped by
social norms. In Niger, women typically sell condiments and meals to other women (De Sardan,
2011), as women are in charge of buying condiments. In North Nigeria, women role varies by
ethnic group but women are often involved in post-harvest activities such as cleaning and
sorting grains as it contains impurities.
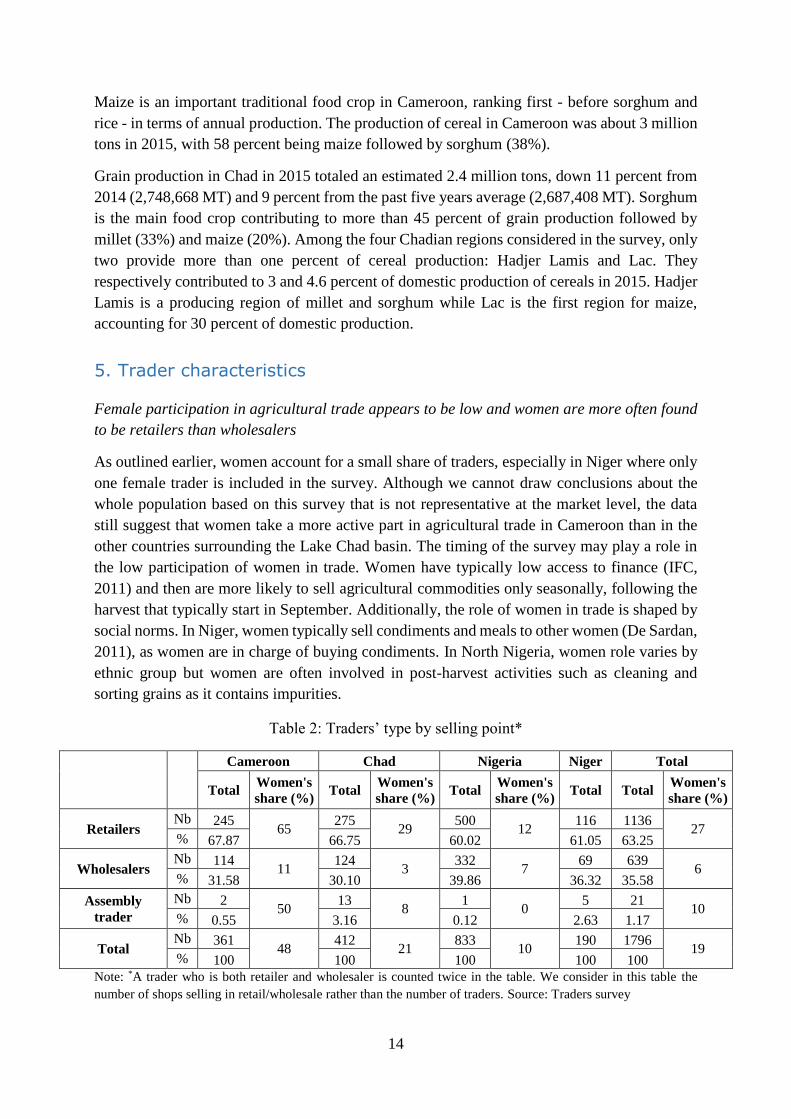
Table 2: Traders’ type by selling point*
Cameroon Chad Nigeria Niger Total
Total Women's
share (%) Total
Women's
share (%) Total
Women's
share (%) Total Total
Women's
share (%)
Retailers Nb 245
65 275
29 500
12 116 1136
27 % 67.87 66.75 60.02 61.05 63.25
Wholesalers Nb 114
11 124
3 332
7 69 639
6 % 31.58 30.10 39.86 36.32 35.58
Assembly
trader
Nb 2 50
13 8
1 0
5 21 10
% 0.55 3.16 0.12 2.63 1.17
Total Nb 361
48 412
21 833
10 190 1796
19 % 100 100 100 100 100
Note: *A trader who is both retailer and wholesaler is counted twice in the table. We consider in this table the
number of shops selling in retail/wholesale rather than the number of traders. Source: Traders survey
15
A strong gender imbalance is found between retailers and wholesalers (Table 2). Women
involved in agricultural trade are more likely to be retailers, even in Cameroon where women
make a large contribution to trade. Women account for only 11 percent of the wholesalers in
Cameroon whereas 65 percent of the surveyed retailers are female. The small number of
assembly traders on the markets is due to the period of the survey, which was conducted several
months after the grain harvest period.
Female traders are less likely to have employees and most employees are male
More than half of the traders employ people in their business but the differences between
countries are large. Nigeria is by far the country where the largest share of traders have
employees (79%) followed by Niger (53%), Chad (47%) and Cameroon (13%). Women are
less likely to have employees, which is consistent with the fact that most women are retailers.
Only 23% of female traders have employees compared to 63% of male traders. The gender gap
is the largest in Chad where 55 percent of male traders employ people compared to 19 percent
for women. Most of the traders’ employees are male. The share of female employees range
from 3 percent in Niger to 16 percent in Chad, reinforcing the idea than women do not take an
active part in the grain business in the regions surrounding the Lake Chad basin.
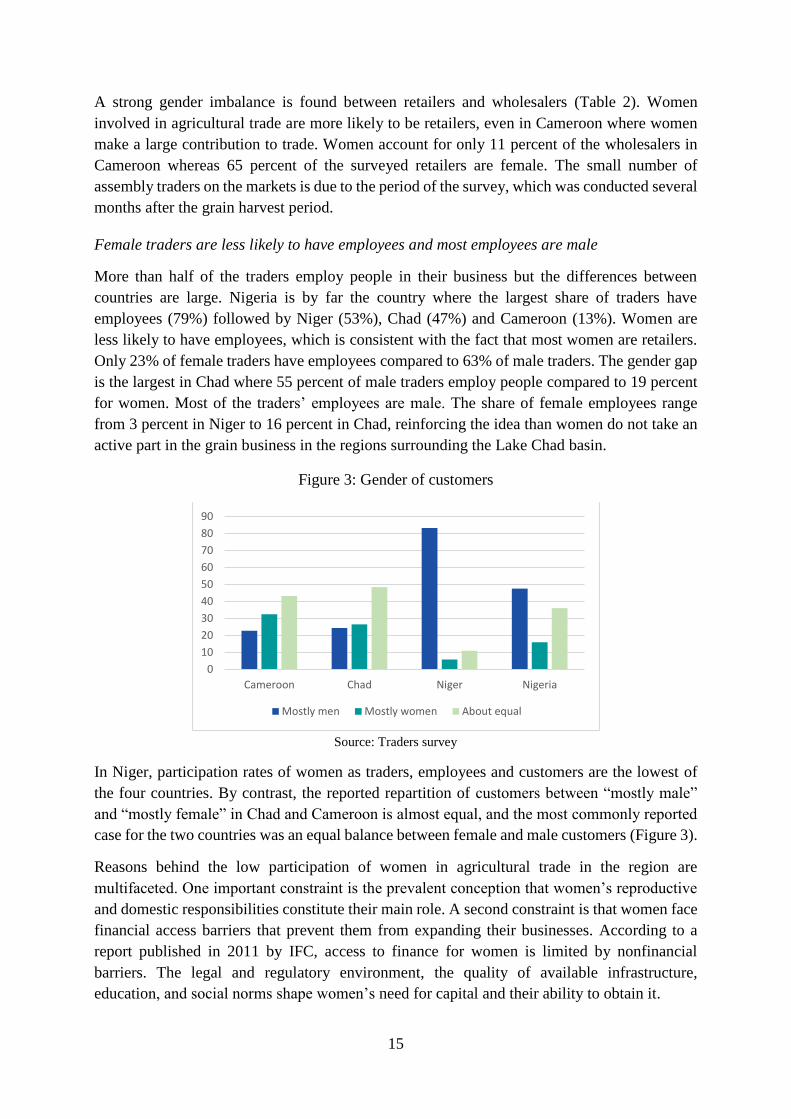
Figure 3: Gender of customers
Source: Traders survey
In Niger, participation rates of women as traders, employees and customers are the lowest of
the four countries. By contrast, the reported repartition of customers between “mostly male”
and “mostly female” in Chad and Cameroon is almost equal, and the most commonly reported
case for the two countries was an equal balance between female and male customers (Figure 3).
Reasons behind the low participation of women in agricultural trade in the region are
multifaceted. One important constraint is the prevalent conception that women’s reproductive
and domestic responsibilities constitute their main role. A second constraint is that women face
financial access barriers that prevent them from expanding their businesses. According to a
report published in 2011 by IFC, access to finance for women is limited by nonfinancial
barriers. The legal and regulatory environment, the quality of available infrastructure,
education, and social norms shape women’s need for capital and their ability to obtain it.
0
10
20
30
40
50
60
70
80
90
Cameroon Chad Niger Nigeria
Mostly men Mostly women About equal
16
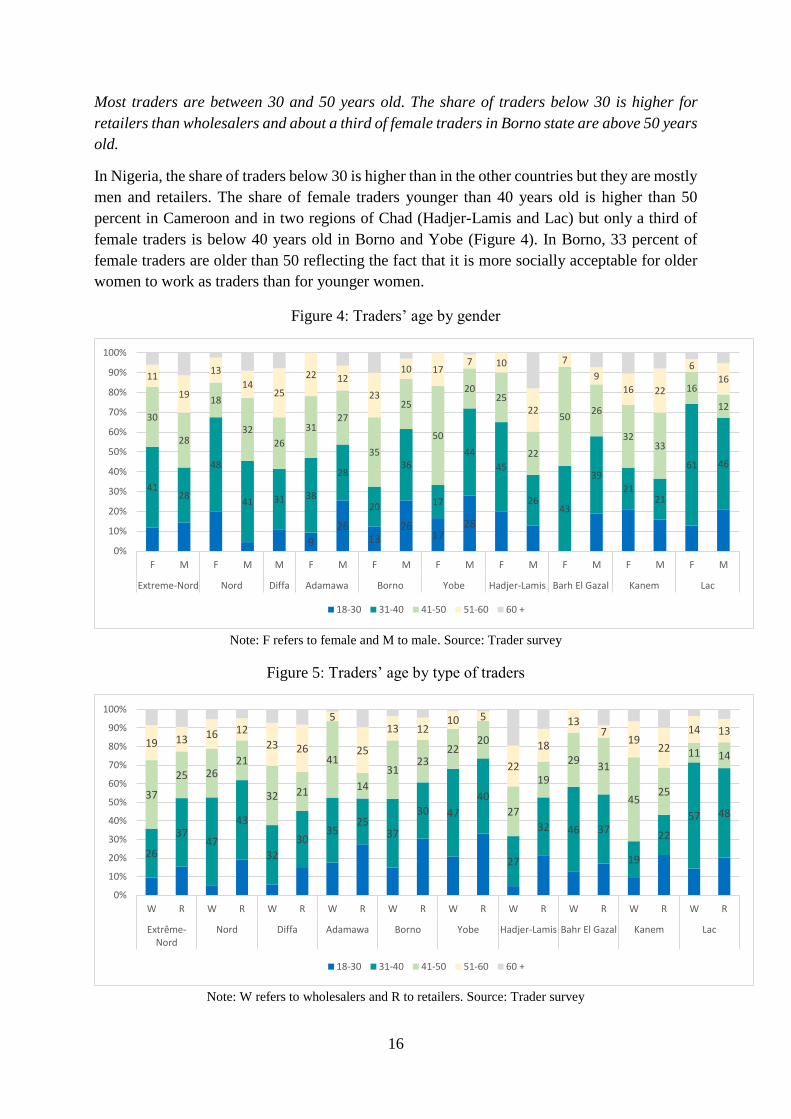
Most traders are between 30 and 50 years old. The share of traders below 30 is higher for
retailers than wholesalers and about a third of female traders in Borno state are above 50 years
old.
In Nigeria, the share of traders below 30 is higher than in the other countries but they are mostly
men and retailers. The share of female traders younger than 40 years old is higher than 50
percent in Cameroon and in two regions of Chad (Hadjer-Lamis and Lac) but only a third of
female traders is below 40 years old in Borno and Yobe (Figure 4). In Borno, 33 percent of
female traders are older than 50 reflecting the fact that it is more socially acceptable for older
women to work as traders than for younger women.
Figure 4: Traders’ age by gender
Note: F refers to female and M to male. Source: Trader survey
Figure 5: Traders’ age by type of traders
Note: W refers to wholesalers and R to retailers. Source: Trader survey
9
2613
2617
28
4128
48
41 31 38
28
20
36
17
44
45
2643
39
2121
61 46
30
28
18
32
26
3127
35
25
50
2025
22
5026
3233
16
12
11
19
13
1425
22 12
23
10 177 10
22
7
9
16 22
616
0%
10%
20%
30%
40%
50%
60%
70%
80%
90%
100%
F M F M M F M F M F M F M F M F M F M
Extreme-Nord Nord Diffa Adamawa Borno Yobe Hadjer-Lamis Barh El Gazal Kanem Lac
18-30 31-40 41-50 51-60 60 +
26
3747
43
32
3035
2537
30 47
40
27
32 46 37
19
22
57 48
37
25 2621
32 21
41
14
3123
2220
27
19
2931
4525
11 1419 13 16 12
23 26
5
25
13 1210 5
22
18
137
1922
14 13
0%
10%
20%
30%
40%
50%
60%
70%
80%
90%
100%
W R W R W R W R W R W R W R W R W R W R
Extrême-Nord
Nord Diffa Adamawa Borno Yobe Hadjer-Lamis Bahr El Gazal Kanem Lac
18-30 31-40 41-50 51-60 60 +
17
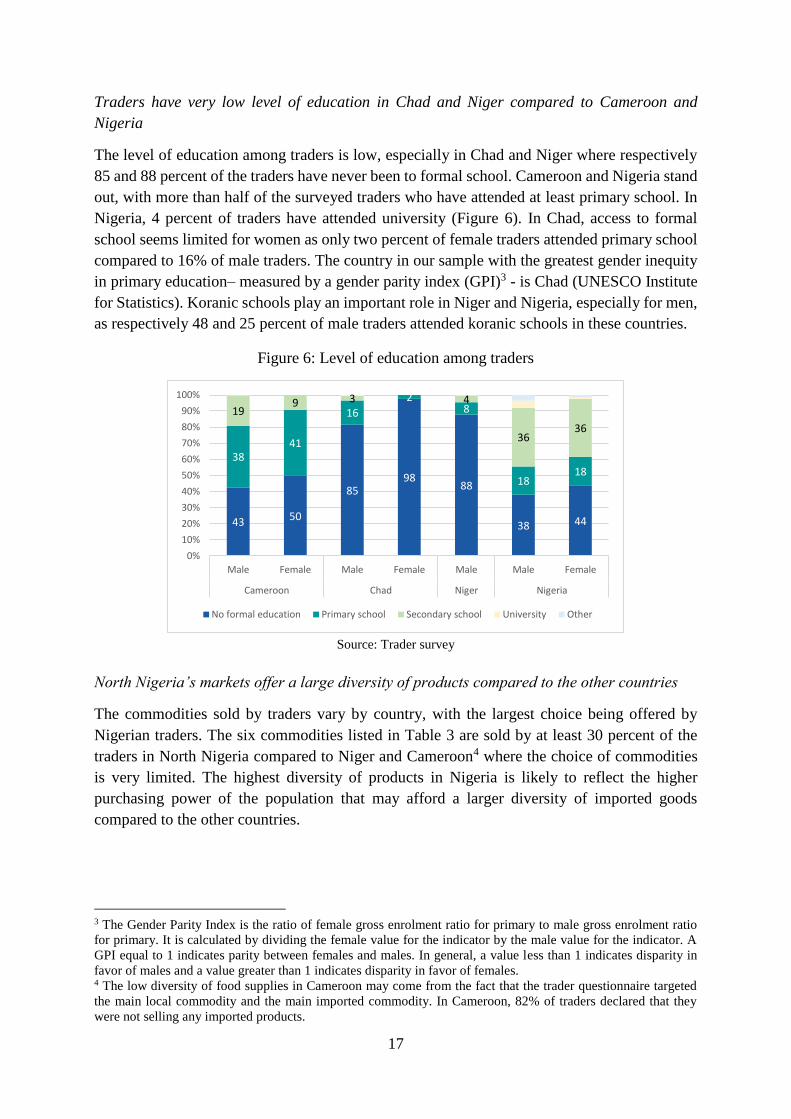
Traders have very low level of education in Chad and Niger compared to Cameroon and
Nigeria
The level of education among traders is low, especially in Chad and Niger where respectively
85 and 88 percent of the traders have never been to formal school. Cameroon and Nigeria stand
out, with more than half of the surveyed traders who have attended at least primary school. In
Nigeria, 4 percent of traders have attended university (Figure 6). In Chad, access to formal
school seems limited for women as only two percent of female traders attended primary school
compared to 16% of male traders. The country in our sample with the greatest gender inequity
in primary education– measured by a gender parity index (GPI)3 - is Chad (UNESCO Institute
for Statistics). Koranic schools play an important role in Niger and Nigeria, especially for men,
as respectively 48 and 25 percent of male traders attended koranic schools in these countries.
Figure 6: Level of education among traders
Source: Trader survey
North Nigeria’s markets offer a large diversity of products compared to the other countries
The commodities sold by traders vary by country, with the largest choice being offered by
Nigerian traders. The six commodities listed in Table 3 are sold by at least 30 percent of the
traders in North Nigeria compared to Niger and Cameroon4 where the choice of commodities
is very limited. The highest diversity of products in Nigeria is likely to reflect the higher
purchasing power of the population that may afford a larger diversity of imported goods
compared to the other countries.
3 The Gender Parity Index is the ratio of female gross enrolment ratio for primary to male gross enrolment ratio
for primary. It is calculated by dividing the female value for the indicator by the male value for the indicator. A
GPI equal to 1 indicates parity between females and males. In general, a value less than 1 indicates disparity in
favor of males and a value greater than 1 indicates disparity in favor of females. 4 The low diversity of food supplies in Cameroon may come from the fact that the trader questionnaire targeted
the main local commodity and the main imported commodity. In Cameroon, 82% of traders declared that they
were not selling any imported products.
43 50
8598
88
38 44
3841
16
28
1818
199 3 4
3636
0%
10%
20%
30%
40%
50%
60%
70%
80%
90%
100%
Male Female Male Female Male Male Female
Cameroon Chad Niger Nigeria
No formal education Primary school Secondary school University Other
18
Table 3: Food commodities sold by at least 30 percent of the traders
Cameroon Chad Niger Nigeria
Sorghum (61%), Maize
(48%)
Millet (65%), Maize
(55%), Imported rice
(40%)
Millet (78%), Sorghum
(35%)
Beans (56%), Local rice
(55%), Imported rice
(54%), Maize (49%),
Processed food (37%),
Peanut (30%) Source: Traders survey
6. Trade flows and market access
The conflict in North Nigeria has disrupted internal and cross-border trade flows
Map 2 represents trade flows of cereals as depicted by transporters5. The Diffa region in Niger
receives supplies of cereals i) from the region of Zinder that ranks second in terms of domestic
production of grains and ii) from Nigeria trough Geidam and Gashua located in Borno state.
The Gashua-Geidam-Maine Soroa axis has become a major cross-border trade route for
traditional grains, maize and niebe as Gashua and Geidam supply almost 70 percent of the
markets in Diffa. Before the Nigerian insurgency, the axis Damassack-Diffa was a major trade
route that is no longer used since the attack of Damassack in December 2014. According to
WFP Niger, police have taken security measures aimed at reducing supplies destined to rebels,
which create obstacles for traders and contribute to reduce the volumes of trade flows.
In Cameroon, food commodities move from the South onwards to the cities located in the
Extreme North but trade flows originating from Nigeria seems rare as only one transporters out
of 26 cited Nigeria as its main source of supply for cereals. This suggests that cross-border trade
between the two countries has been disrupted by the conflict as trade between Nigeria and
Cameroon was substantial before Boko Haram insurgency (World Bank, 2013). World Bank
(2013) estimate that Nigeria exported at that time more than 213,000 metric tons of non-oil
products to Cameroon annually, more than forty times official estimates.
Most trade between the two countries was taking place along 10 major corridors and seven of
them were located in the northern part of Cameroon. Before the conflict, most traffic in the
north flew along the corridor from Maiduguri to Kousseri or Maiduguri to Maroua. Other
important corridors were running from Mubi to Guider and from Jimeta/Yola to Garoua. The
most important trade route in the North and Extreme North was between Banki in Nigeria and
Mora in Cameroon. Nigerian exports were made of general merchandise, plastic products,
vegetable oil, and petroleum products, especially fuel while Cameroonian exports included re-
exports of imported rice, paddy rice and soap produced in the south of Cameroon.
In North Nigeria, cereals come either from neighboring villages or from Kano, Abuja or from
Benue state that is referred to as the food basket of the nation. Despite insecurity, traders
manage to supply the main markets in Borno state. In Chad, the regions of Baguirmi, Daraba
and Bol supply the food deficit regions of Kanem, Bahr El Gazal and Hadjer Lamis.
5 As the trader survey did not include questions about the main supplying markets of cereals, we used the
transporters survey to create the map below, implying that only the main trade routes are depicted on the map.
Map 2: Trade flows of cereals – January 2016
Transporters in North Nigeria face high transport costs and numerous checkpoints
Transporters survey revealed that transporters in North Nigeria face transport costs that are
considerably higher than in Niger, Chad, and Cameroon. The survey does not enable us to assess
what are the main drivers of these high costs.
It is well documented that the trucking industry in West and Central Africa is characterized by
cartels offering high prices and low service quality. Teravaninthorn and Raballand (2009) found
that road conditions are not the main determinant of transport prices in West and Central Africa.
They show that investing in road infrastructure is not a sufficient condition for lowering
transports prices as long as the market is strongly regulated. They believe that deregulating the
trucking industry and reforming cartels is the most efficient strategy to decrease transports
prices.
Insecurity may prevent transporters from coming into some markets if they cannot ensure
security for their vehicles and goods as well as be assured of profits and customers. It is likely
that the security situation in North Nigeria drives transports prices up by decreasing the number
of transporters willing to use some corridors. Additionally, transporters in Nigeria face a high
number of checkpoints, especially in Borno state (Table 5). While they are primarily intended
to prevent the entry into the country of undesirable individuals and the smuggling of illegal
goods, they generate a range of obstacles to the free flow of goods including congestion, delays
and corruption. Borno state has the highest density of checkpoints, two third of them being
formal. The high number of checkpoints reflect the poor security situation in the state and raises
the cost of trucking as drivers going to Borno state have to pay an average of 127 US$ in taxes
along the way.
Checkpoints are also very numerous in Chad, except in the Lac region. The costs of the
checkpoints are very high for truck drivers going to the Bahr El Gazal region as they spend on
average 119 US$ for each trip from the grains supply areas.
Transport prices are seasonal
Agricultural trade in the Lake Chad basin is quite seasonal: during the rainy season, transport
time and transport costs increase substantially. Some markets are not easily accessible by trucks
during the rainy season (Table 4). It is especially true in Kanem, Bahr El Gazal and Adawama,
where transport time between the dry and the rainy season increase sharply, leading to a rise in
transport costs that is likely to affect food prices.
Table 4: Cities that are difficult to access by truck during the rainy season
Cameroon Chad Niger Nigeria
Adoumri, Bogo,
Doukoula, Kaele,
Koza, Meme, Pitoa,
Pouss, Salak
Doum-Doum, Gama,
Mondo, Moussoro,
Mouzaragui
Bouti, Cheri,
Kindjandi, Nguelkolo,
Yebi
Damagum, Dawasa,
Fufore, Jakusko,
Potiskum
Source: Transporter survey
21
The average distance between markets and supply sources of cereals is very high in Chad
The region of Kanem in Chad is the region farthest away from the main supply zones of cereals,
forcing transporters to drive 46 hours on average to connect the markets of Kanem with the
supply zones (Table 5). The region of Bahr El Gazal is isolated too, especially during the rainy
season, as drivers may need an average of 61 hours to reach the region from the main supply
areas.
The average distance between the Borno states cities and the supply markets is 249 km, which
is very high compared to the other regions of Nigeria. The size of the Maiduguri market is a
plausible explanation. Maiduguri being the largest market in our sample attract food commodity
traders from all over the country, including Kano and Benue state, located respectively 500 and
640 kilometers away from Maiduguri.
The regions with the best access to supply markets are Adamawa in Nigeria, Nord in Cameroon
and the Lac region in Chad. Despite its relative proximity to the supply areas, transport costs in
Adamawa are high. Overall, transport costs in North Nigeria are a lot higher than in the other
countries.
Table 5: Market access
Cameroon Nigeria Niger Chad
Extreme-
Nord Nord Adamawa Borno Yobe Diffa Lac
Hadjer-
Lamis
Bahr El
Gazal Kanem
Average distance (km) to
the main market supply
for cereals
93 36 34 249 92 109 50 178 173 348
Transport time (hour)
during the dry season 6 3 4 31 9 6 6 7 13 46
Transport time (hour)
during the rainy season 8 10 17 32 13 9 6 8 61 78
Transport cost
(US$/MT/km) during the
dry season
7 0,3 37 13 58 4 1 0,3 0,4 0,2
Transport cost
(US$/MT/km) during the
rainy season
9 1 39 14 61 4 1 0,4 1 22
Number of formal
checkpoint 2 2 2 16 3 5 3 8 8 2
Number of informal
checkpoint 5 5 1 8 3 2 1 2 1 5
Amount of taxes paid by
pick-up driver (US$) 1 17 1 3 2 40 11 11 43 43
Amount of taxes paid by
truck driver (US$) 73 34 1 127 12 76 19 119 57
Source: Transporter survey
22
7. Supply chain
7.1. Changes in supply sources
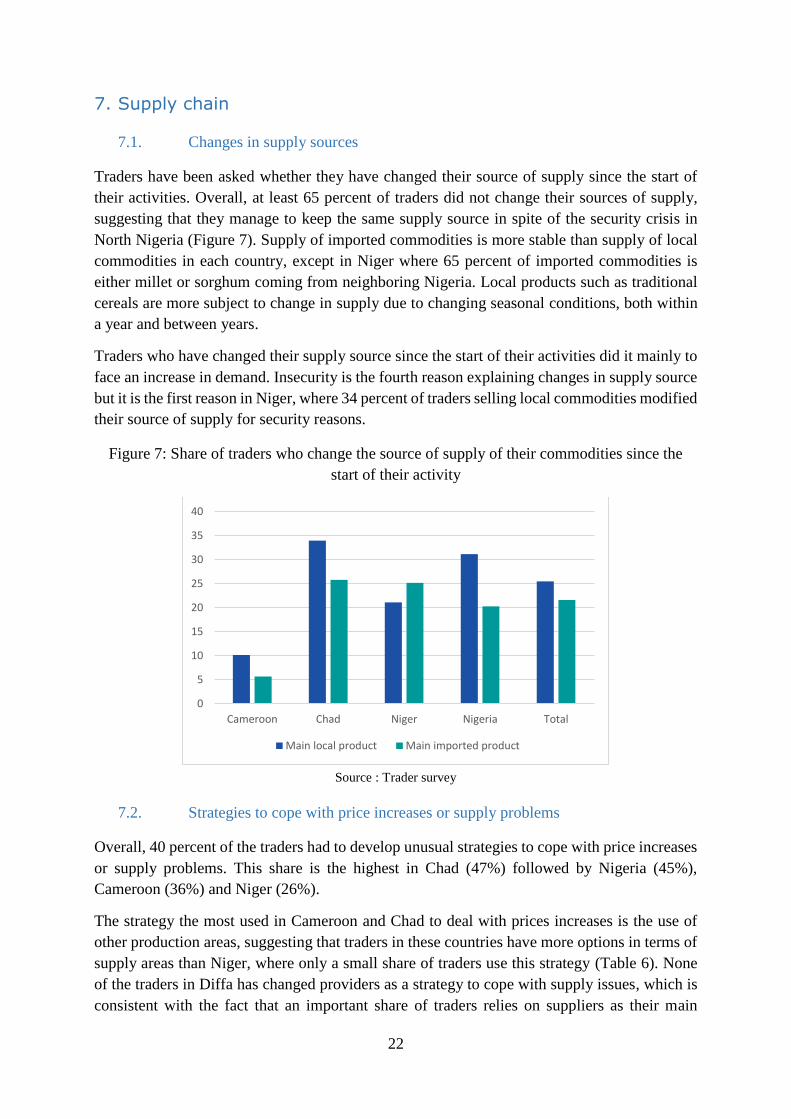
Traders have been asked whether they have changed their source of supply since the start of
their activities. Overall, at least 65 percent of traders did not change their sources of supply,
suggesting that they manage to keep the same supply source in spite of the security crisis in
North Nigeria (Figure 7). Supply of imported commodities is more stable than supply of local
commodities in each country, except in Niger where 65 percent of imported commodities is
either millet or sorghum coming from neighboring Nigeria. Local products such as traditional
cereals are more subject to change in supply due to changing seasonal conditions, both within
a year and between years.
Traders who have changed their supply source since the start of their activities did it mainly to
face an increase in demand. Insecurity is the fourth reason explaining changes in supply source
but it is the first reason in Niger, where 34 percent of traders selling local commodities modified
their source of supply for security reasons.
Figure 7: Share of traders who change the source of supply of their commodities since the
start of their activity
Source : Trader survey
7.2. Strategies to cope with price increases or supply problems
Overall, 40 percent of the traders had to develop unusual strategies to cope with price increases
or supply problems. This share is the highest in Chad (47%) followed by Nigeria (45%),
Cameroon (36%) and Niger (26%).
The strategy the most used in Cameroon and Chad to deal with prices increases is the use of
other production areas, suggesting that traders in these countries have more options in terms of
supply areas than Niger, where only a small share of traders use this strategy (Table 6). None
of the traders in Diffa has changed providers as a strategy to cope with supply issues, which is
consistent with the fact that an important share of traders relies on suppliers as their main
0
5
10
15
20
25
30
35
40
Cameroon Chad Niger Nigeria Total
Main local product Main imported product
23
sources of funding (Figure 9). Traders in Nigeria use various options, the more common being
storage and the use of other production areas. It is surprising to see that 14 percent of traders in
Chad choose to decrease margins. This percentage reaches 39 percent in the region of Kanem,
implying that traders there have no other options as we can assume that decreasing margins is
one of the least preferred strategies.
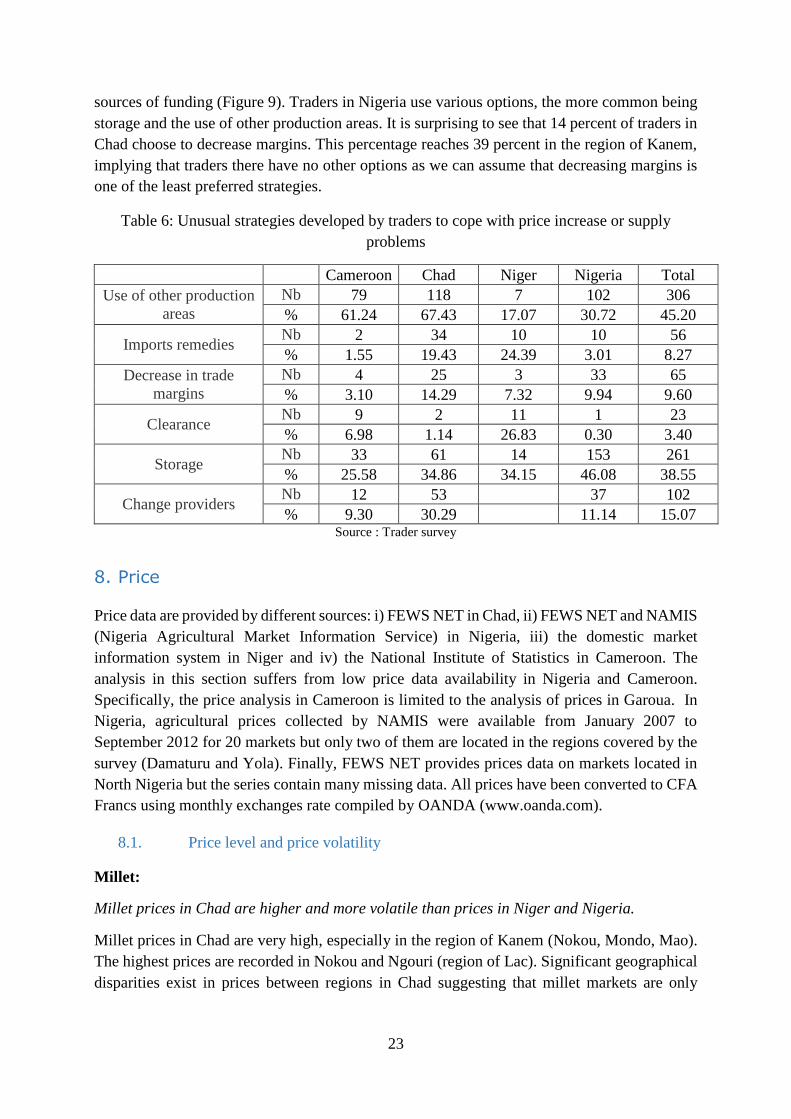
Table 6: Unusual strategies developed by traders to cope with price increase or supply
problems
Cameroon Chad Niger Nigeria Total
Use of other production
areas
Nb 79 118 7 102 306
% 61.24 67.43 17.07 30.72 45.20
Imports remedies Nb 2 34 10 10 56
% 1.55 19.43 24.39 3.01 8.27
Decrease in trade
margins
Nb 4 25 3 33 65
% 3.10 14.29 7.32 9.94 9.60
Clearance Nb 9 2 11 1 23
% 6.98 1.14 26.83 0.30 3.40
Storage Nb 33 61 14 153 261
% 25.58 34.86 34.15 46.08 38.55
Change providers Nb 12 53 37 102
% 9.30 30.29 11.14 15.07 Source : Trader survey
8. Price
Price data are provided by different sources: i) FEWS NET in Chad, ii) FEWS NET and NAMIS
(Nigeria Agricultural Market Information Service) in Nigeria, iii) the domestic market
information system in Niger and iv) the National Institute of Statistics in Cameroon. The
analysis in this section suffers from low price data availability in Nigeria and Cameroon.
Specifically, the price analysis in Cameroon is limited to the analysis of prices in Garoua. In
Nigeria, agricultural prices collected by NAMIS were available from January 2007 to
September 2012 for 20 markets but only two of them are located in the regions covered by the
survey (Damaturu and Yola). Finally, FEWS NET provides prices data on markets located in
North Nigeria but the series contain many missing data. All prices have been converted to CFA
Francs using monthly exchanges rate compiled by OANDA (www.oanda.com).
8.1. Price level and price volatility
Millet:
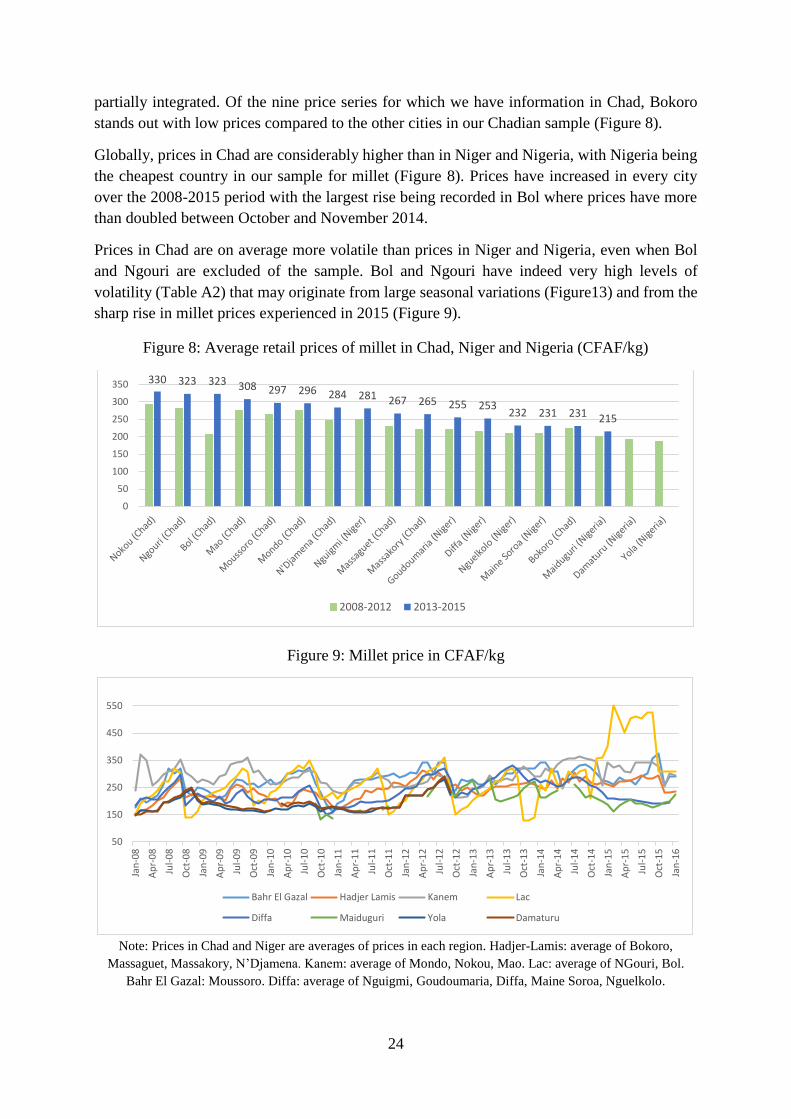
Millet prices in Chad are higher and more volatile than prices in Niger and Nigeria.
Millet prices in Chad are very high, especially in the region of Kanem (Nokou, Mondo, Mao).
The highest prices are recorded in Nokou and Ngouri (region of Lac). Significant geographical
disparities exist in prices between regions in Chad suggesting that millet markets are only
24
partially integrated. Of the nine price series for which we have information in Chad, Bokoro
stands out with low prices compared to the other cities in our Chadian sample (Figure 8).
Globally, prices in Chad are considerably higher than in Niger and Nigeria, with Nigeria being
the cheapest country in our sample for millet (Figure 8). Prices have increased in every city
over the 2008-2015 period with the largest rise being recorded in Bol where prices have more
than doubled between October and November 2014.
Prices in Chad are on average more volatile than prices in Niger and Nigeria, even when Bol
and Ngouri are excluded of the sample. Bol and Ngouri have indeed very high levels of
volatility (Table A2) that may originate from large seasonal variations (Figure13) and from the
sharp rise in millet prices experienced in 2015 (Figure 9).
Figure 8: Average retail prices of millet in Chad, Niger and Nigeria (CFAF/kg)
Figure 9: Millet price in CFAF/kg
Note: Prices in Chad and Niger are averages of prices in each region. Hadjer-Lamis: average of Bokoro,
Massaguet, Massakory, N’Djamena. Kanem: average of Mondo, Nokou, Mao. Lac: average of NGouri, Bol.
Bahr El Gazal: Moussoro. Diffa: average of Nguigmi, Goudoumaria, Diffa, Maine Soroa, Nguelkolo.
330 323 323 308 297 296 284 281 267 265 255 253232 231 231 215
0
50
100
150
200
250
300
350
2008-2012 2013-2015
50
150
250
350
450
550
Jan
-08
Ap
r-0
8
Jul-
08
Oct
-08
Jan
-09
Ap
r-0
9
Jul-
09
Oct
-09
Jan
-10
Ap
r-1
0
Jul-
10
Oct
-10
Jan
-11
Ap
r-1
1
Jul-
11
Oct
-11
Jan
-12
Ap
r-1
2
Jul-
12
Oct
-12
Jan
-13
Ap
r-1
3
Jul-
13
Oct
-13
Jan
-14
Ap
r-1
4
Jul-
14
Oct
-14
Jan
-15
Ap
r-1
5
Jul-
15
Oct
-15
Jan
-16
Bahr El Gazal Hadjer Lamis Kanem Lac
Diffa Maiduguri Yola Damaturu
25
Sorghum:
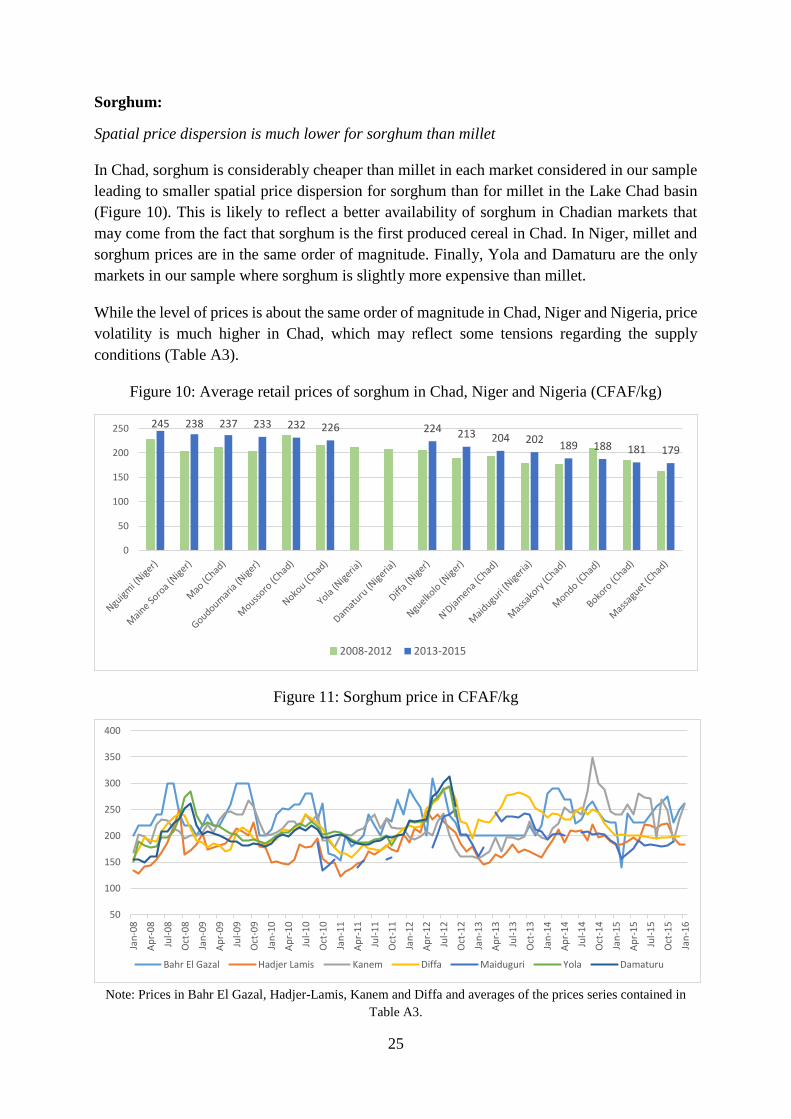
Spatial price dispersion is much lower for sorghum than millet
In Chad, sorghum is considerably cheaper than millet in each market considered in our sample
leading to smaller spatial price dispersion for sorghum than for millet in the Lake Chad basin
(Figure 10). This is likely to reflect a better availability of sorghum in Chadian markets that
may come from the fact that sorghum is the first produced cereal in Chad. In Niger, millet and
sorghum prices are in the same order of magnitude. Finally, Yola and Damaturu are the only
markets in our sample where sorghum is slightly more expensive than millet.
While the level of prices is about the same order of magnitude in Chad, Niger and Nigeria, price
volatility is much higher in Chad, which may reflect some tensions regarding the supply
conditions (Table A3).
Figure 10: Average retail prices of sorghum in Chad, Niger and Nigeria (CFAF/kg)
Figure 11: Sorghum price in CFAF/kg
Note: Prices in Bahr El Gazal, Hadjer-Lamis, Kanem and Diffa and averages of the prices series contained in
Table A3.
245 238 237 233 232 226 224 213 204 202189 188 181 179
0
50
100
150
200
250
2008-2012 2013-2015
50
100
150
200
250
300
350
400
Jan
-08
Ap
r-0
8
Jul-
08
Oct
-08
Jan
-09
Ap
r-0
9
Jul-
09
Oct
-09
Jan
-10
Ap
r-1
0
Jul-
10
Oct
-10
Jan
-11
Ap
r-1
1
Jul-
11
Oct
-11
Jan
-12
Ap
r-1
2
Jul-
12
Oct
-12
Jan
-13
Ap
r-1
3
Jul-
13
Oct
-13
Jan
-14
Ap
r-1
4
Jul-
14
Oct
-14
Jan
-15
Ap
r-1
5
Jul-
15
Oct
-15
Jan
-16
Bahr El Gazal Hadjer Lamis Kanem Diffa Maiduguri Yola Damaturu
26
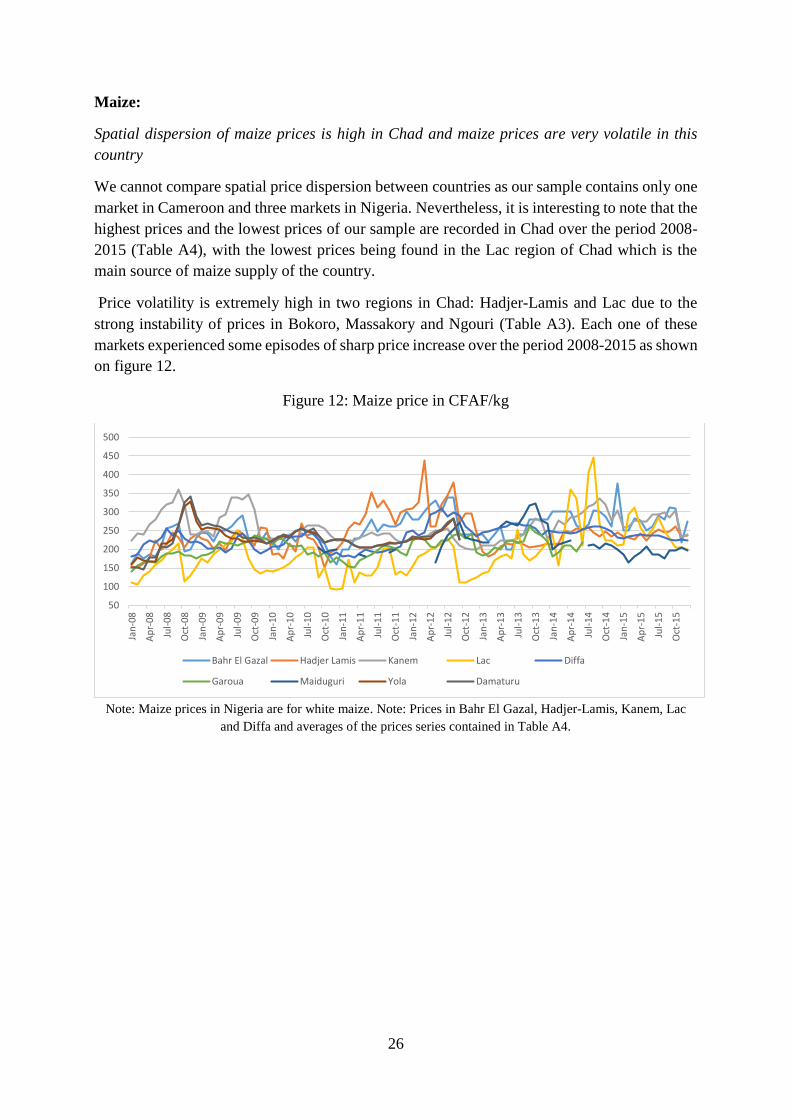
Maize:
Spatial dispersion of maize prices is high in Chad and maize prices are very volatile in this
country
We cannot compare spatial price dispersion between countries as our sample contains only one
market in Cameroon and three markets in Nigeria. Nevertheless, it is interesting to note that the
highest prices and the lowest prices of our sample are recorded in Chad over the period 2008-
2015 (Table A4), with the lowest prices being found in the Lac region of Chad which is the
main source of maize supply of the country.
Price volatility is extremely high in two regions in Chad: Hadjer-Lamis and Lac due to the
strong instability of prices in Bokoro, Massakory and Ngouri (Table A3). Each one of these
markets experienced some episodes of sharp price increase over the period 2008-2015 as shown
on figure 12.
Figure 12: Maize price in CFAF/kg
Note: Maize prices in Nigeria are for white maize. Note: Prices in Bahr El Gazal, Hadjer-Lamis, Kanem, Lac
and Diffa and averages of the prices series contained in Table A4.
50
100
150
200
250
300
350
400
450
500
Jan
-08
Ap
r-0
8
Jul-
08
Oct
-08
Jan
-09
Ap
r-0
9
Jul-
09
Oct
-09
Jan
-10
Ap
r-1
0
Jul-
10
Oct
-10
Jan
-11
Ap
r-1
1
Jul-
11
Oct
-11
Jan
-12
Ap
r-1
2
Jul-
12
Oct
-12
Jan
-13
Ap
r-1
3
Jul-
13
Oct
-13
Jan
-14
Ap
r-1
4
Jul-
14
Oct
-14
Jan
-15
Ap
r-1
5
Jul-
15
Oct
-15
Bahr El Gazal Hadjer Lamis Kanem Lac Diffa
Garoua Maiduguri Yola Damaturu
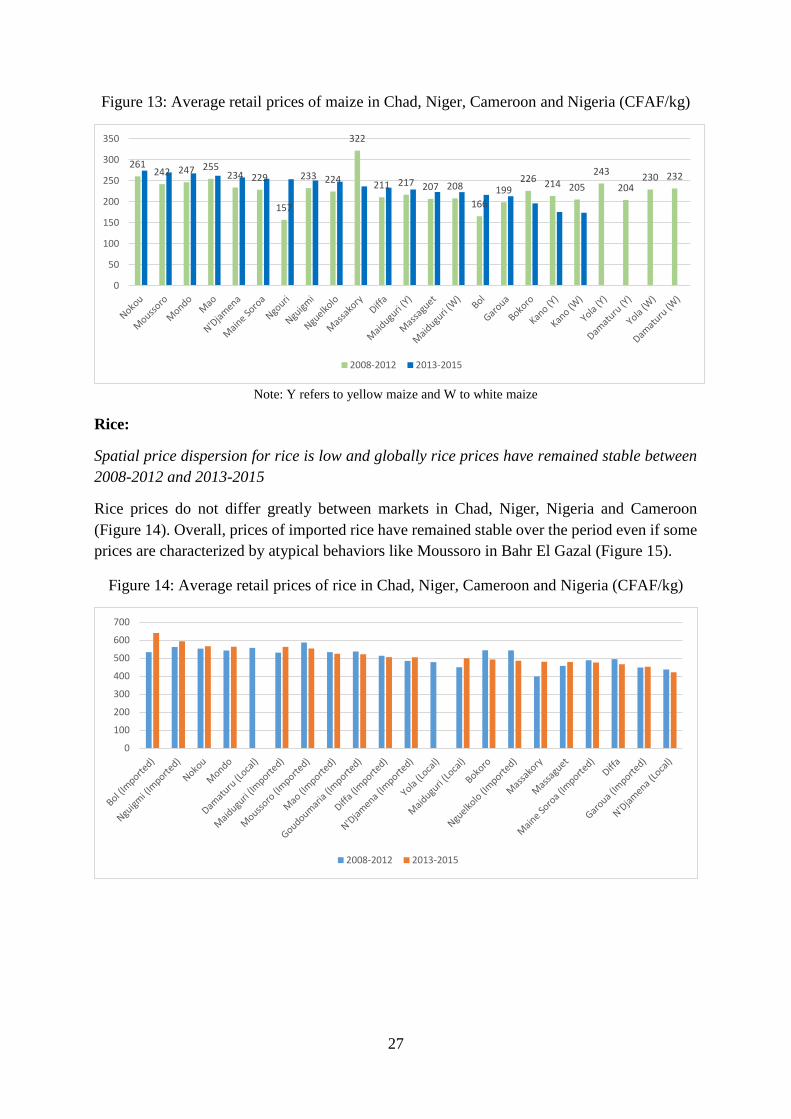
27
Figure 13: Average retail prices of maize in Chad, Niger, Cameroon and Nigeria (CFAF/kg)
Note: Y refers to yellow maize and W to white maize
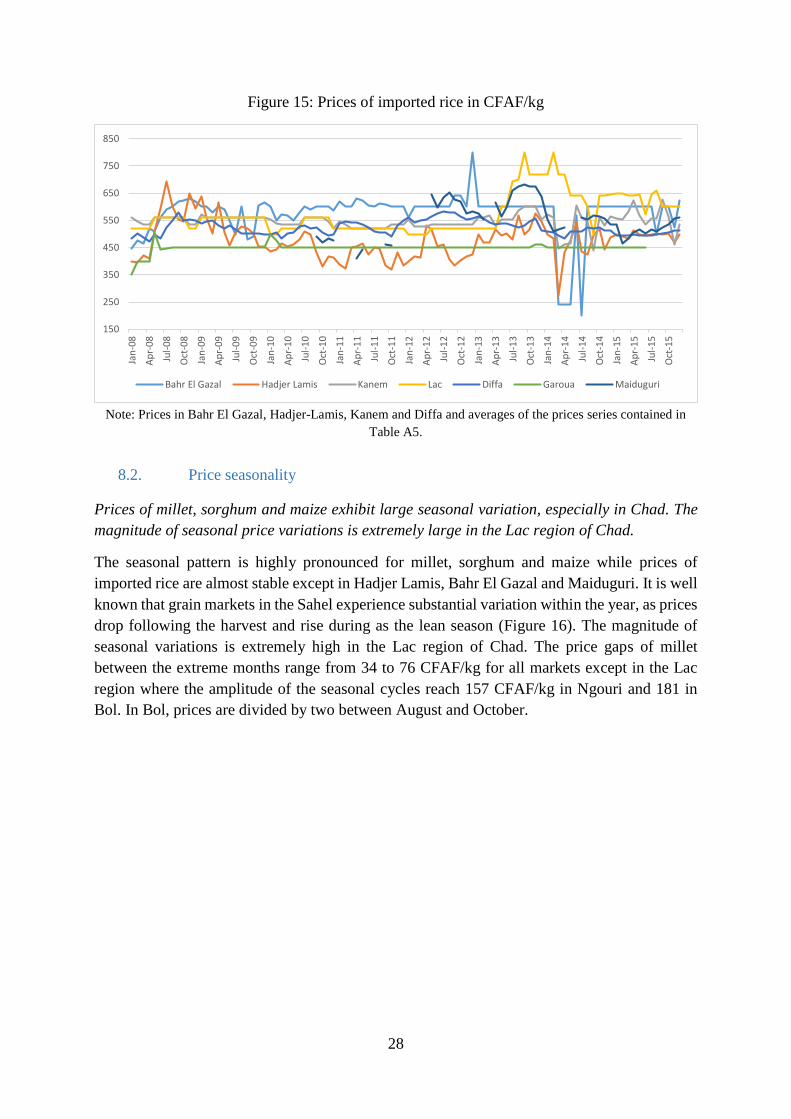
Rice:
Spatial price dispersion for rice is low and globally rice prices have remained stable between
2008-2012 and 2013-2015
Rice prices do not differ greatly between markets in Chad, Niger, Nigeria and Cameroon
(Figure 14). Overall, prices of imported rice have remained stable over the period even if some
prices are characterized by atypical behaviors like Moussoro in Bahr El Gazal (Figure 15).
Figure 14: Average retail prices of rice in Chad, Niger, Cameroon and Nigeria (CFAF/kg)
261242 247 255
234 229
157
233 224
322
211 217 207 208
166
199226 214 205
243
204230 232
0
50
100
150
200
250
300
350
2008-2012 2013-2015
0
100
200
300
400
500
600
700
2008-2012 2013-2015
28
Figure 15: Prices of imported rice in CFAF/kg
Note: Prices in Bahr El Gazal, Hadjer-Lamis, Kanem and Diffa and averages of the prices series contained in
Table A5.
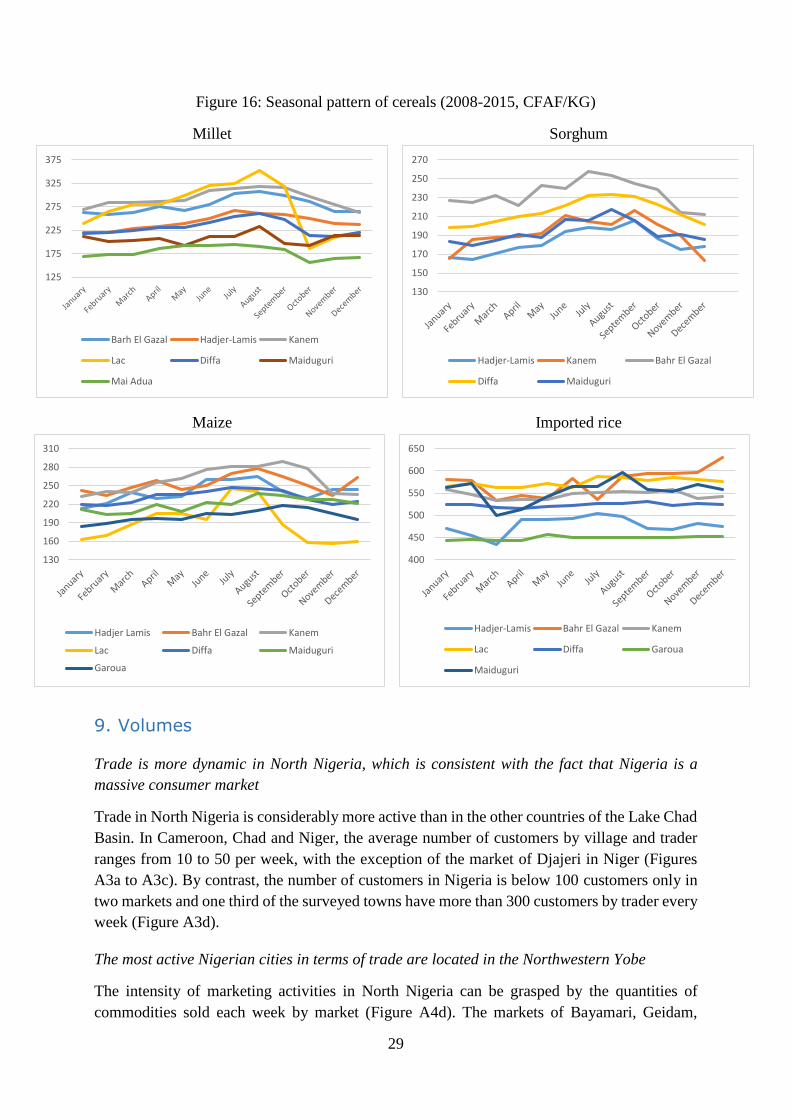
8.2. Price seasonality
Prices of millet, sorghum and maize exhibit large seasonal variation, especially in Chad. The
magnitude of seasonal price variations is extremely large in the Lac region of Chad.
The seasonal pattern is highly pronounced for millet, sorghum and maize while prices of
imported rice are almost stable except in Hadjer Lamis, Bahr El Gazal and Maiduguri. It is well
known that grain markets in the Sahel experience substantial variation within the year, as prices
drop following the harvest and rise during as the lean season (Figure 16). The magnitude of
seasonal variations is extremely high in the Lac region of Chad. The price gaps of millet
between the extreme months range from 34 to 76 CFAF/kg for all markets except in the Lac
region where the amplitude of the seasonal cycles reach 157 CFAF/kg in Ngouri and 181 in
Bol. In Bol, prices are divided by two between August and October.
150
250
350
450
550
650
750
850Ja
n-0
8
Ap
r-0
8
Jul-
08
Oct
-08
Jan
-09
Ap
r-0
9
Jul-
09
Oct
-09
Jan
-10
Ap
r-1
0
Jul-
10
Oct
-10
Jan
-11
Ap
r-1
1
Jul-
11
Oct
-11
Jan
-12
Ap
r-1
2
Jul-
12
Oct
-12
Jan
-13
Ap
r-1
3
Jul-
13
Oct
-13
Jan
-14
Ap
r-1
4
Jul-
14
Oct
-14
Jan
-15
Ap
r-1
5
Jul-
15
Oct
-15
Bahr El Gazal Hadjer Lamis Kanem Lac Diffa Garoua Maiduguri
29
Figure 16: Seasonal pattern of cereals (2008-2015, CFAF/KG)
Millet
Sorghum
Maize
Imported rice
9. Volumes
Trade is more dynamic in North Nigeria, which is consistent with the fact that Nigeria is a
massive consumer market
Trade in North Nigeria is considerably more active than in the other countries of the Lake Chad
Basin. In Cameroon, Chad and Niger, the average number of customers by village and trader
ranges from 10 to 50 per week, with the exception of the market of Djajeri in Niger (Figures
A3a to A3c). By contrast, the number of customers in Nigeria is below 100 customers only in
two markets and one third of the surveyed towns have more than 300 customers by trader every
week (Figure A3d).
The most active Nigerian cities in terms of trade are located in the Northwestern Yobe
The intensity of marketing activities in North Nigeria can be grasped by the quantities of
commodities sold each week by market (Figure A4d). The markets of Bayamari, Geidam,
125
175
225
275
325
375
Barh El Gazal Hadjer-Lamis Kanem
Lac Diffa Maiduguri
Mai Adua
130
150
170
190
210
230
250
270
Hadjer-Lamis Kanem Bahr El Gazal
Diffa Maiduguri
130
160
190
220
250
280
310
Hadjer Lamis Bahr El Gazal Kanem
Lac Diffa Maiduguri
Garoua
400
450
500
550
600
650
Hadjer-Lamis Bahr El Gazal Kanem
Lac Diffa Garoua
Maiduguri
30
Geishua and Jajusko are the four markets with the highest weekly sales, with Jajusko and
Gashua being more active in the trade of local goods whereas Bayamari and Gashua are
providers of imported commodities. It is interesting to note that the four more active markets
of North Nigeria are located in the Northwestern Yobe, a region less exposed to Boko Haram’s
acts of violence than Borno (Figure A1).
Maiduguri, which is located at the center of Borno’s state, appear as relatively small market in
terms of the sum of weekly sales of local and imported commodities, ranking only 16th out of
the 29th surveyed villages, while Maiduguri accounts for 22% of the surveyed traders in the
Nigerian sample. Reasons behind can be that the market of Mona Garage – which is the largest
wholesale market in Maiduguri – accounts for less than 10 percent of the sample in the city.
Weekly sales of food commodities are considerably smaller in Chad compared to Niger and
Cameroon
The quantities of commodities sold each week in Chad, Niger and Cameroon are considerably
smaller than in Nigeria. In Chad, Massakory, Moussoro, Gama and Mao are the most active
cities in terms of weekly sales, while in Niger, Diffa and Djajeri stand out with weekly sales
that are respectively 6 and 5 times larger than the third city in the sample (Kilakam). In
Cameroon, Guili, Kousseri, Doukoula and Pouss are the cities recording the largest sales of
food commodities (Figure A4a).
The sum of weekly sales of food commodities in Massakory – which ranks first in terms of
sales in our Chadian sample – are less than 200 MT whereas the first city in Cameroon reach
more than 500 MT and the first city in Niger records sales that are above 3000 MT per week.
10. Response capacity
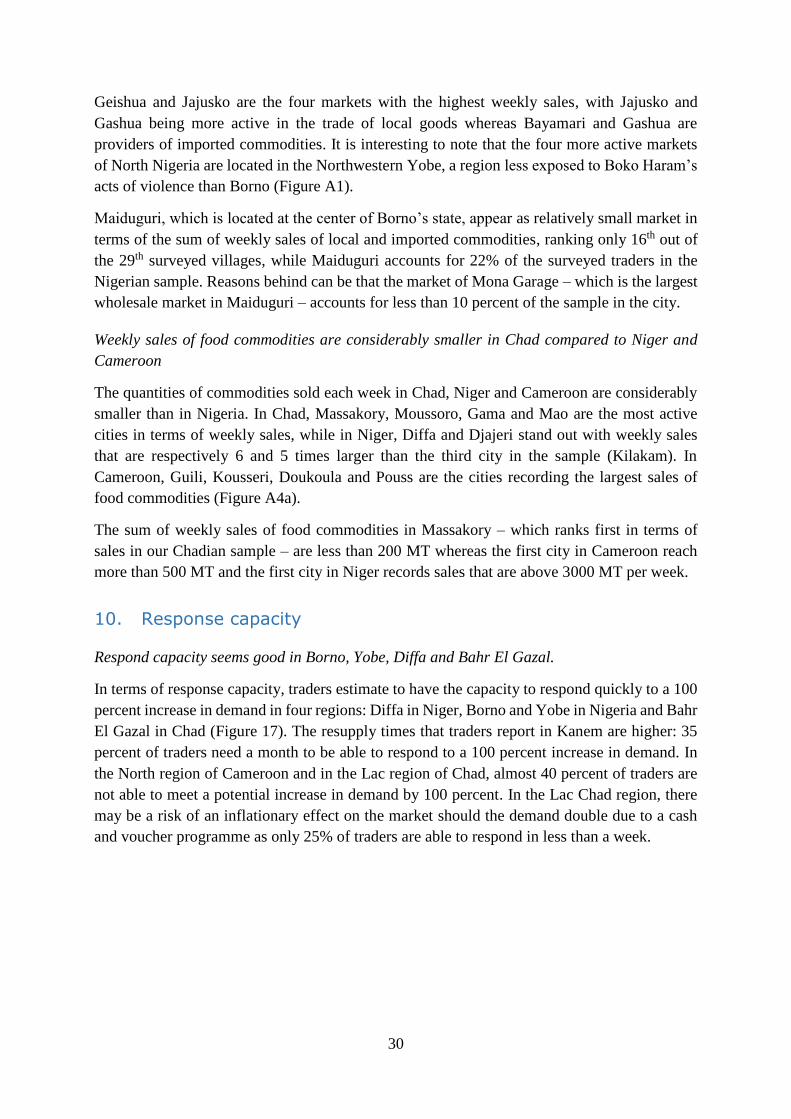
Respond capacity seems good in Borno, Yobe, Diffa and Bahr El Gazal.
In terms of response capacity, traders estimate to have the capacity to respond quickly to a 100
percent increase in demand in four regions: Diffa in Niger, Borno and Yobe in Nigeria and Bahr
El Gazal in Chad (Figure 17). The resupply times that traders report in Kanem are higher: 35
percent of traders need a month to be able to respond to a 100 percent increase in demand. In
the North region of Cameroon and in the Lac region of Chad, almost 40 percent of traders are
not able to meet a potential increase in demand by 100 percent. In the Lac Chad region, there
may be a risk of an inflationary effect on the market should the demand double due to a cash
and voucher programme as only 25% of traders are able to respond in less than a week.
31
Figure 17: Response capacity to a 100 percent increase in demand
Source: Traders survey
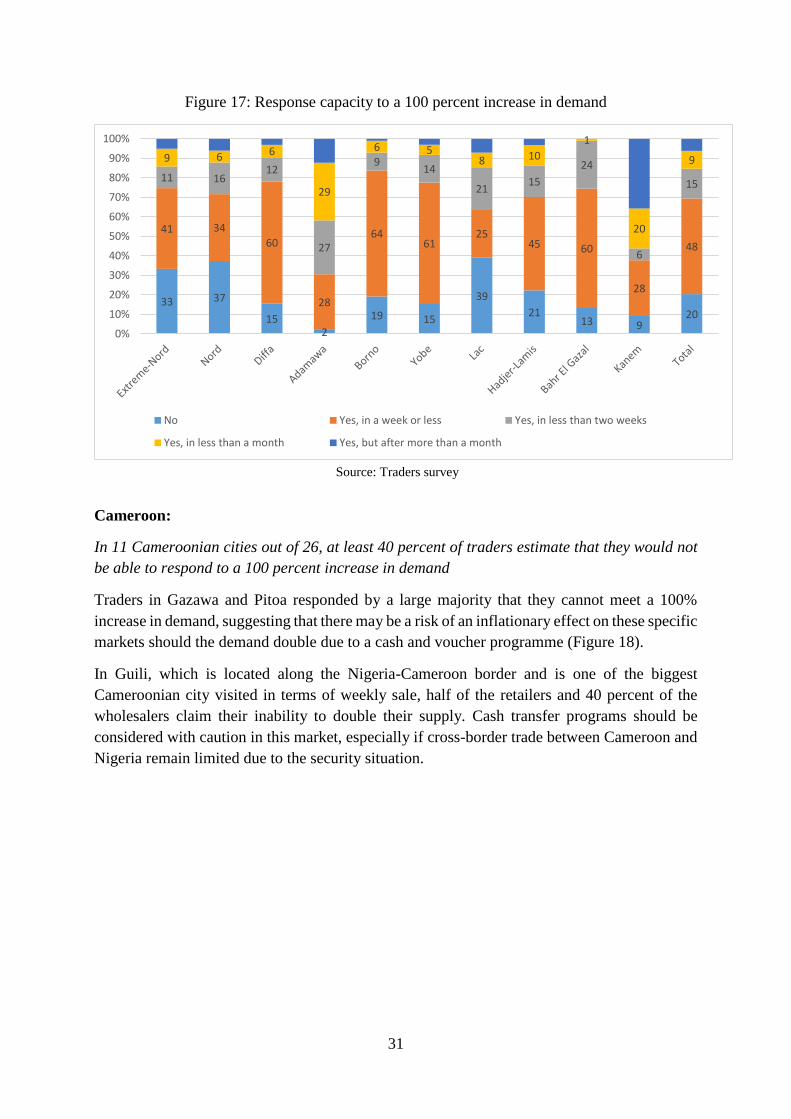
Cameroon:
In 11 Cameroonian cities out of 26, at least 40 percent of traders estimate that they would not
be able to respond to a 100 percent increase in demand
Traders in Gazawa and Pitoa responded by a large majority that they cannot meet a 100%
increase in demand, suggesting that there may be a risk of an inflationary effect on these specific
markets should the demand double due to a cash and voucher programme (Figure 18).
In Guili, which is located along the Nigeria-Cameroon border and is one of the biggest
Cameroonian city visited in terms of weekly sale, half of the retailers and 40 percent of the
wholesalers claim their inability to double their supply. Cash transfer programs should be
considered with caution in this market, especially if cross-border trade between Cameroon and
Nigeria remain limited due to the security situation.
33 37
152
19 15
39
2113 9
20
41 34
60
28
6461
2545 60
28
48
11 1612
27
914
2115
24
6
15
9 6 6
29
6 58 10
1
20
9
0%
10%
20%
30%
40%
50%
60%
70%
80%
90%
100%
No Yes, in a week or less Yes, in less than two weeks
Yes, in less than a month Yes, but after more than a month
32
Figure 18: Response capacity to a 100 percent increase in demand in Cameroon
Source: Trader survey. Note: The number of traders surveyed in each city is in parentheses.
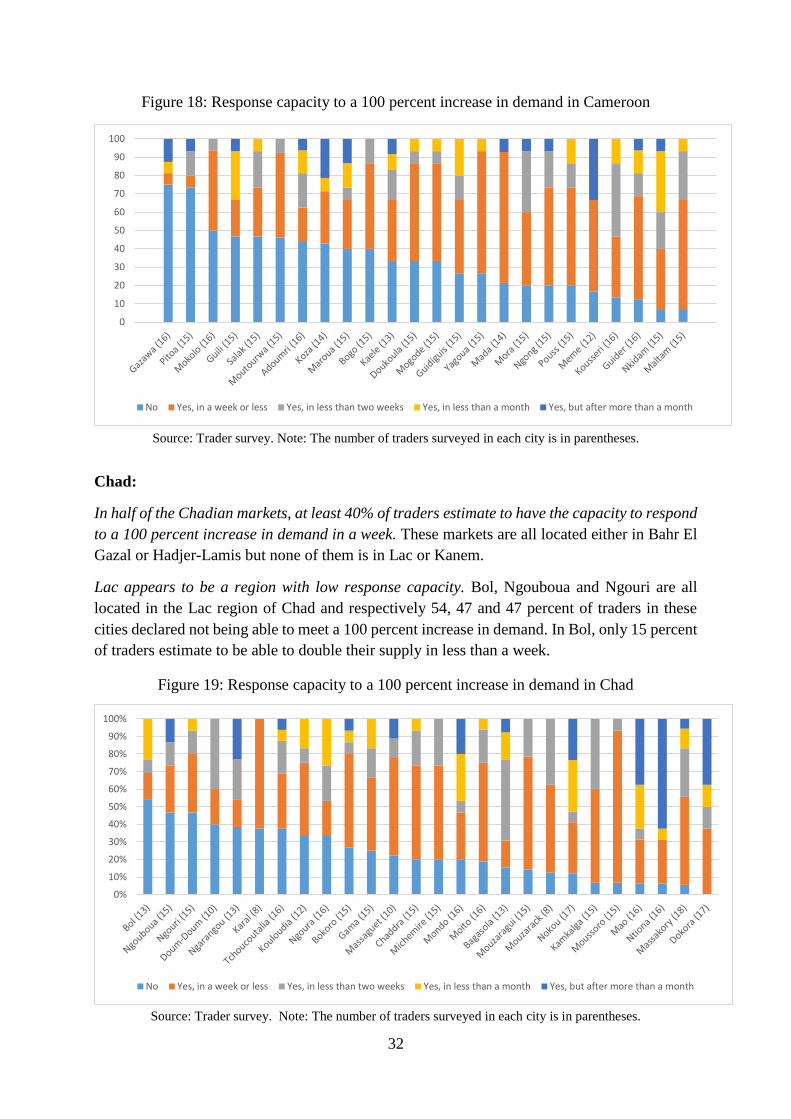
Chad:
In half of the Chadian markets, at least 40% of traders estimate to have the capacity to respond
to a 100 percent increase in demand in a week. These markets are all located either in Bahr El
Gazal or Hadjer-Lamis but none of them is in Lac or Kanem.
Lac appears to be a region with low response capacity. Bol, Ngouboua and Ngouri are all
located in the Lac region of Chad and respectively 54, 47 and 47 percent of traders in these
cities declared not being able to meet a 100 percent increase in demand. In Bol, only 15 percent
of traders estimate to be able to double their supply in less than a week.
Figure 19: Response capacity to a 100 percent increase in demand in Chad
Source: Trader survey. Note: The number of traders surveyed in each city is in parentheses.
0
10
20
30
40
50
60
70
80
90
100
No Yes, in a week or less Yes, in less than two weeks Yes, in less than a month Yes, but after more than a month
0%
10%
20%
30%
40%
50%
60%
70%
80%
90%
100%
No Yes, in a week or less Yes, in less than two weeks Yes, in less than a month Yes, but after more than a month
33
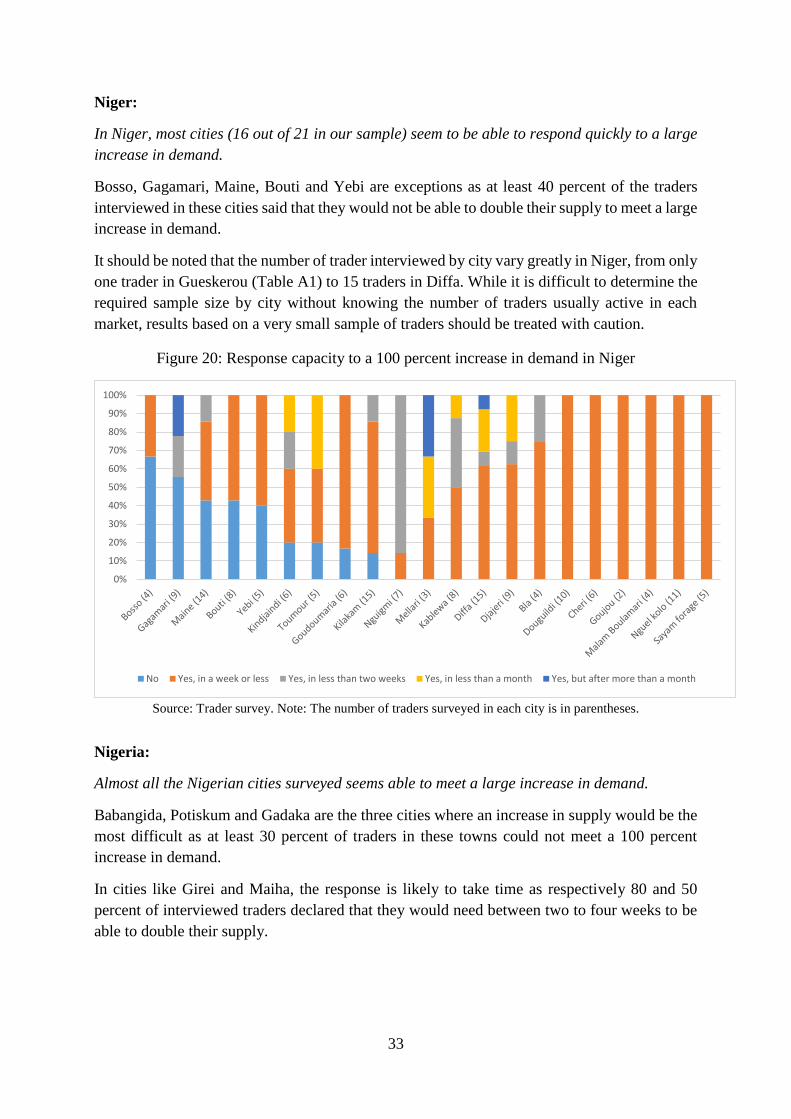
Niger:
In Niger, most cities (16 out of 21 in our sample) seem to be able to respond quickly to a large
increase in demand.
Bosso, Gagamari, Maine, Bouti and Yebi are exceptions as at least 40 percent of the traders
interviewed in these cities said that they would not be able to double their supply to meet a large
increase in demand.
It should be noted that the number of trader interviewed by city vary greatly in Niger, from only
one trader in Gueskerou (Table A1) to 15 traders in Diffa. While it is difficult to determine the
required sample size by city without knowing the number of traders usually active in each
market, results based on a very small sample of traders should be treated with caution.
Figure 20: Response capacity to a 100 percent increase in demand in Niger
Source: Trader survey. Note: The number of traders surveyed in each city is in parentheses.
Nigeria:
Almost all the Nigerian cities surveyed seems able to meet a large increase in demand.
Babangida, Potiskum and Gadaka are the three cities where an increase in supply would be the
most difficult as at least 30 percent of traders in these towns could not meet a 100 percent
increase in demand.
In cities like Girei and Maiha, the response is likely to take time as respectively 80 and 50
percent of interviewed traders declared that they would need between two to four weeks to be
able to double their supply.
0%
10%
20%
30%
40%
50%
60%
70%
80%
90%
100%
No Yes, in a week or less Yes, in less than two weeks Yes, in less than a month Yes, but after more than a month
34
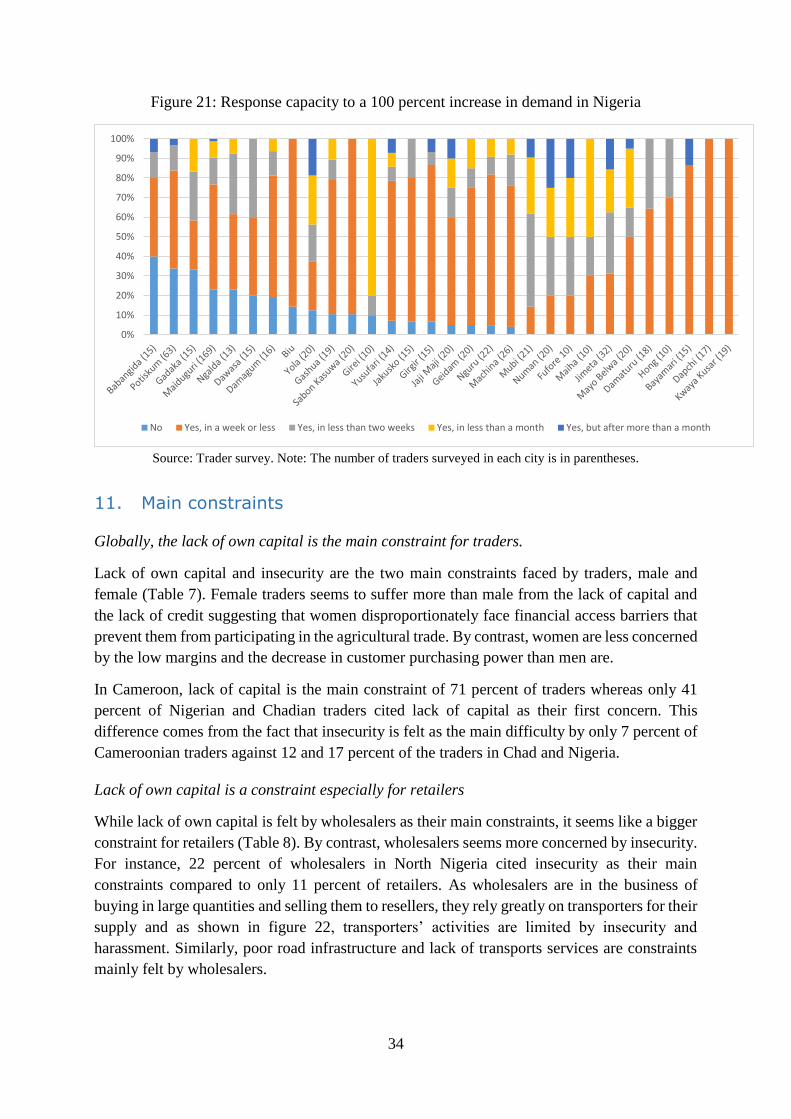
Figure 21: Response capacity to a 100 percent increase in demand in Nigeria
Source: Trader survey. Note: The number of traders surveyed in each city is in parentheses.
11. Main constraints
Globally, the lack of own capital is the main constraint for traders.
Lack of own capital and insecurity are the two main constraints faced by traders, male and
female (Table 7). Female traders seems to suffer more than male from the lack of capital and
the lack of credit suggesting that women disproportionately face financial access barriers that
prevent them from participating in the agricultural trade. By contrast, women are less concerned
by the low margins and the decrease in customer purchasing power than men are.
In Cameroon, lack of capital is the main constraint of 71 percent of traders whereas only 41
percent of Nigerian and Chadian traders cited lack of capital as their first concern. This
difference comes from the fact that insecurity is felt as the main difficulty by only 7 percent of
Cameroonian traders against 12 and 17 percent of the traders in Chad and Nigeria.
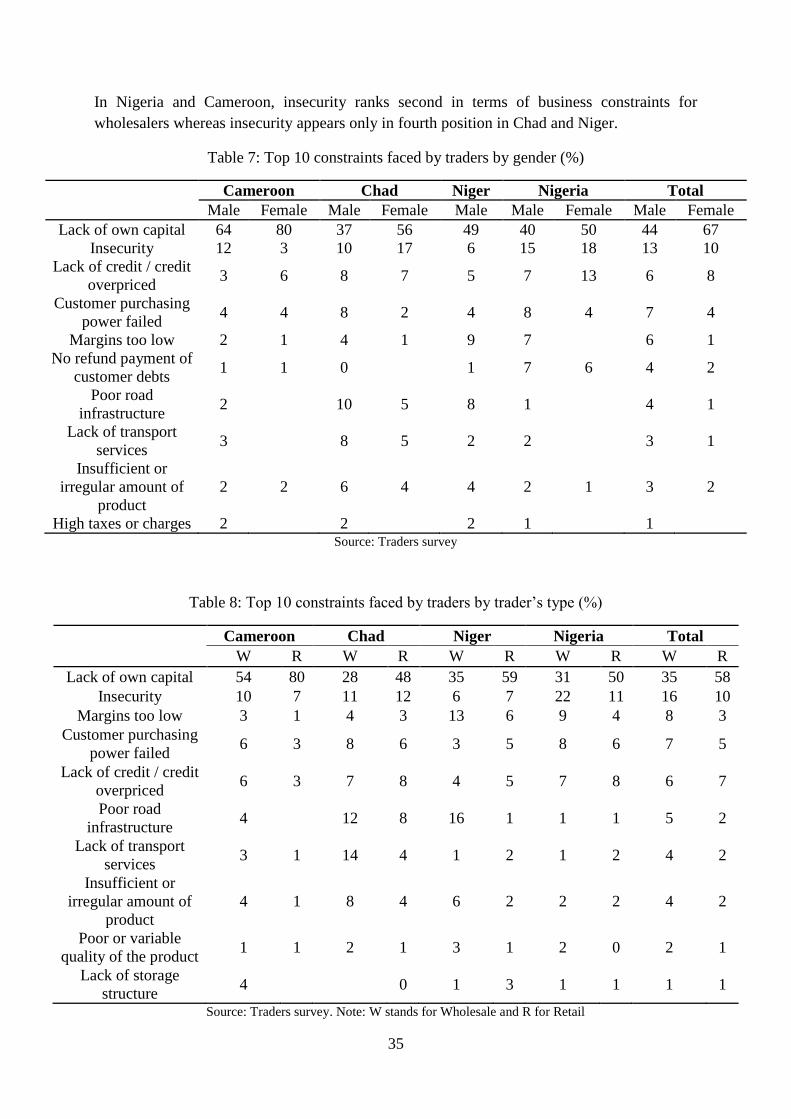
Lack of own capital is a constraint especially for retailers
While lack of own capital is felt by wholesalers as their main constraints, it seems like a bigger
constraint for retailers (Table 8). By contrast, wholesalers seems more concerned by insecurity.
For instance, 22 percent of wholesalers in North Nigeria cited insecurity as their main
constraints compared to only 11 percent of retailers. As wholesalers are in the business of
buying in large quantities and selling them to resellers, they rely greatly on transporters for their
supply and as shown in figure 22, transporters’ activities are limited by insecurity and
harassment. Similarly, poor road infrastructure and lack of transports services are constraints
mainly felt by wholesalers.
0%
10%
20%
30%
40%
50%
60%
70%
80%
90%
100%
No Yes, in a week or less Yes, in less than two weeks Yes, in less than a month Yes, but after more than a month
35
In Nigeria and Cameroon, insecurity ranks second in terms of business constraints for
wholesalers whereas insecurity appears only in fourth position in Chad and Niger.
Table 7: Top 10 constraints faced by traders by gender (%)
Cameroon Chad Niger Nigeria Total
Male Female Male Female Male Male Female Male Female
Lack of own capital 64 80 37 56 49 40 50 44 67
Insecurity 12 3 10 17 6 15 18 13 10
Lack of credit / credit
overpriced 3 6 8 7 5 7 13 6 8
Customer purchasing
power failed 4 4 8 2 4 8 4 7 4
Margins too low 2 1 4 1 9 7 6 1
No refund payment of
customer debts 1 1 0 1 7 6 4 2
Poor road
infrastructure 2 10 5 8 1 4 1
Lack of transport
services 3 8 5 2 2 3 1
Insufficient or
irregular amount of
product
2 2 6 4 4 2 1 3 2
High taxes or charges 2 2 2 1 1 Source: Traders survey
Table 8: Top 10 constraints faced by traders by trader’s type (%)
Cameroon Chad Niger Nigeria Total
W R W R W R W R W R
Lack of own capital 54 80 28 48 35 59 31 50 35 58
Insecurity 10 7 11 12 6 7 22 11 16 10
Margins too low 3 1 4 3 13 6 9 4 8 3
Customer purchasing
power failed 6 3 8 6 3 5 8 6 7 5
Lack of credit / credit
overpriced 6 3 7 8 4 5 7 8 6 7
Poor road
infrastructure 4 12 8 16 1 1 1 5 2
Lack of transport
services 3 1 14 4 1 2 1 2 4 2
Insufficient or
irregular amount of
product
4 1 8 4 6 2 2 2 4 2
Poor or variable
quality of the product 1 1 2 1 3 1 2 0 2 1
Lack of storage
structure 4 0 1 3 1 1 1 1
Source: Traders survey. Note: W stands for Wholesale and R for Retail
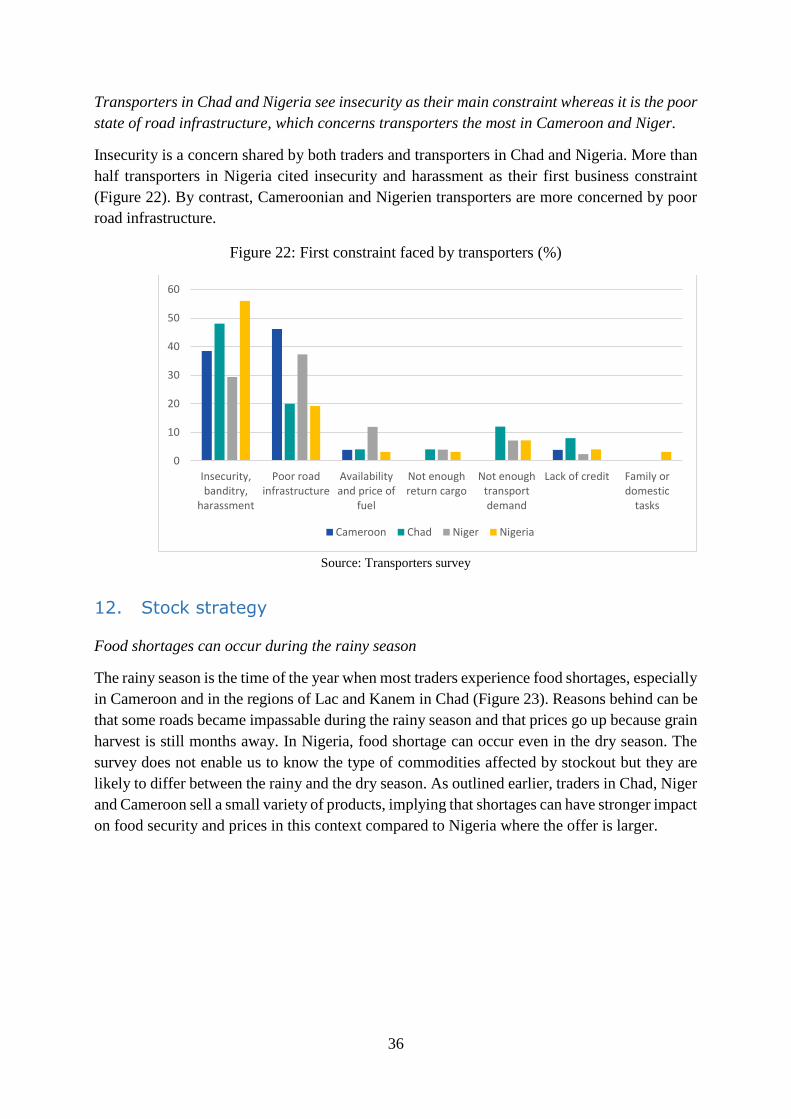
36
Transporters in Chad and Nigeria see insecurity as their main constraint whereas it is the poor
state of road infrastructure, which concerns transporters the most in Cameroon and Niger.
Insecurity is a concern shared by both traders and transporters in Chad and Nigeria. More than
half transporters in Nigeria cited insecurity and harassment as their first business constraint
(Figure 22). By contrast, Cameroonian and Nigerien transporters are more concerned by poor
road infrastructure.
Figure 22: First constraint faced by transporters (%)
Source: Transporters survey
12. Stock strategy
Food shortages can occur during the rainy season
The rainy season is the time of the year when most traders experience food shortages, especially
in Cameroon and in the regions of Lac and Kanem in Chad (Figure 23). Reasons behind can be
that some roads became impassable during the rainy season and that prices go up because grain
harvest is still months away. In Nigeria, food shortage can occur even in the dry season. The
survey does not enable us to know the type of commodities affected by stockout but they are
likely to differ between the rainy and the dry season. As outlined earlier, traders in Chad, Niger
and Cameroon sell a small variety of products, implying that shortages can have stronger impact
on food security and prices in this context compared to Nigeria where the offer is larger.
0
10
20
30
40
50
60
Insecurity,banditry,
harassment
Poor roadinfrastructure
Availabilityand price of
fuel
Not enoughreturn cargo
Not enoughtransportdemand
Lack of credit Family ordomestic
tasks
Cameroon Chad Niger Nigeria
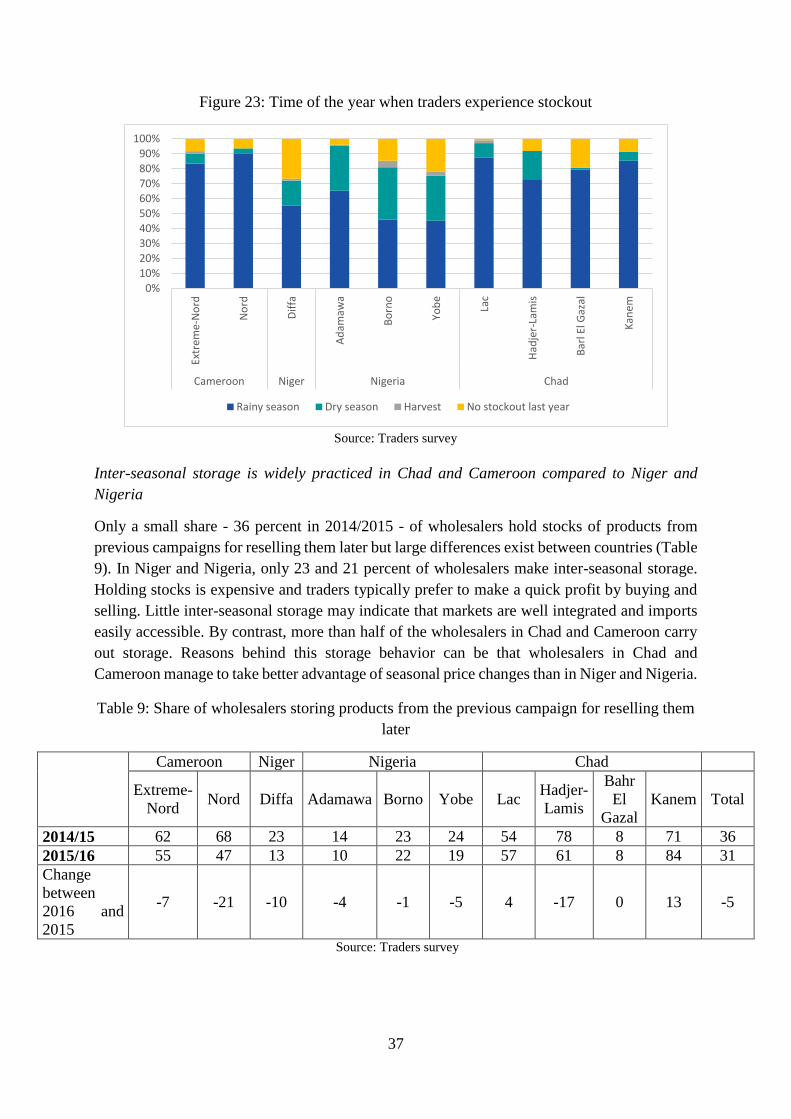
37
Figure 23: Time of the year when traders experience stockout
Source: Traders survey
Inter-seasonal storage is widely practiced in Chad and Cameroon compared to Niger and
Nigeria
Only a small share - 36 percent in 2014/2015 - of wholesalers hold stocks of products from
previous campaigns for reselling them later but large differences exist between countries (Table
9). In Niger and Nigeria, only 23 and 21 percent of wholesalers make inter-seasonal storage.
Holding stocks is expensive and traders typically prefer to make a quick profit by buying and
selling. Little inter-seasonal storage may indicate that markets are well integrated and imports
easily accessible. By contrast, more than half of the wholesalers in Chad and Cameroon carry
out storage. Reasons behind this storage behavior can be that wholesalers in Chad and
Cameroon manage to take better advantage of seasonal price changes than in Niger and Nigeria.
Table 9: Share of wholesalers storing products from the previous campaign for reselling them
later
Cameroon Niger Nigeria Chad
Extreme-
Nord Nord Diffa Adamawa Borno Yobe Lac
Hadjer-
Lamis
Bahr
El
Gazal
Kanem Total
2014/15 62 68 23 14 23 24 54 78 8 71 36
2015/16 55 47 13 10 22 19 57 61 8 84 31
Change
between
2016 and
2015
-7 -21 -10 -4 -1 -5 4 -17 0 13 -5
Source: Traders survey
0%
10%20%30%40%50%
60%70%
80%90%
100%
Extr
em
e-N
ord
No
rd
Dif
fa
Ad
amaw
a
Bo
rno
Yob
e
Lac
Had
jer-
Lam
is
Bar
l El G
azal
Kan
em
Cameroon Niger Nigeria Chad
Rainy season Dry season Harvest No stockout last year
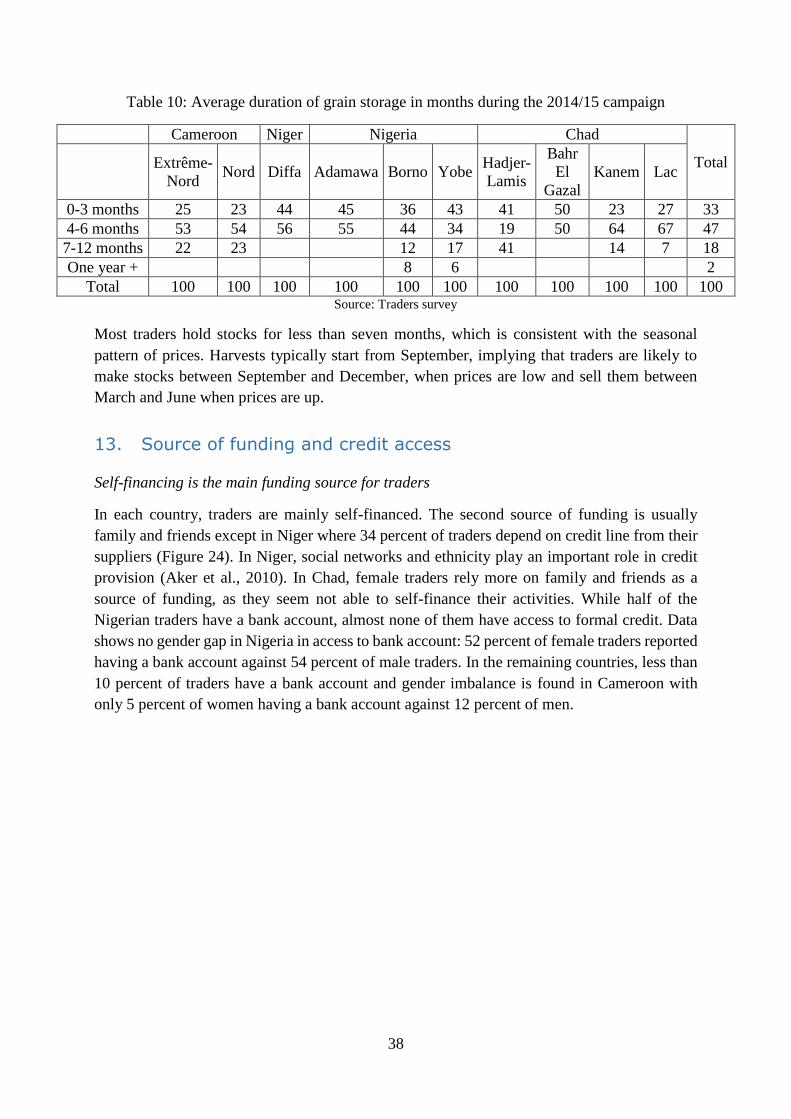
38
Table 10: Average duration of grain storage in months during the 2014/15 campaign
Cameroon Niger Nigeria Chad
Total
Extrême-
Nord Nord Diffa Adamawa Borno Yobe
Hadjer-
Lamis
Bahr
El
Gazal
Kanem Lac
0-3 months 25 23 44 45 36 43 41 50 23 27 33
4-6 months 53 54 56 55 44 34 19 50 64 67 47
7-12 months 22 23 12 17 41 14 7 18
One year + 8 6 2
Total 100 100 100 100 100 100 100 100 100 100 100 Source: Traders survey
Most traders hold stocks for less than seven months, which is consistent with the seasonal
pattern of prices. Harvests typically start from September, implying that traders are likely to
make stocks between September and December, when prices are low and sell them between
March and June when prices are up.
13. Source of funding and credit access
Self-financing is the main funding source for traders
In each country, traders are mainly self-financed. The second source of funding is usually
family and friends except in Niger where 34 percent of traders depend on credit line from their
suppliers (Figure 24). In Niger, social networks and ethnicity play an important role in credit
provision (Aker et al., 2010). In Chad, female traders rely more on family and friends as a
source of funding, as they seem not able to self-finance their activities. While half of the
Nigerian traders have a bank account, almost none of them have access to formal credit. Data
shows no gender gap in Nigeria in access to bank account: 52 percent of female traders reported
having a bank account against 54 percent of male traders. In the remaining countries, less than
10 percent of traders have a bank account and gender imbalance is found in Cameroon with
only 5 percent of women having a bank account against 12 percent of men.
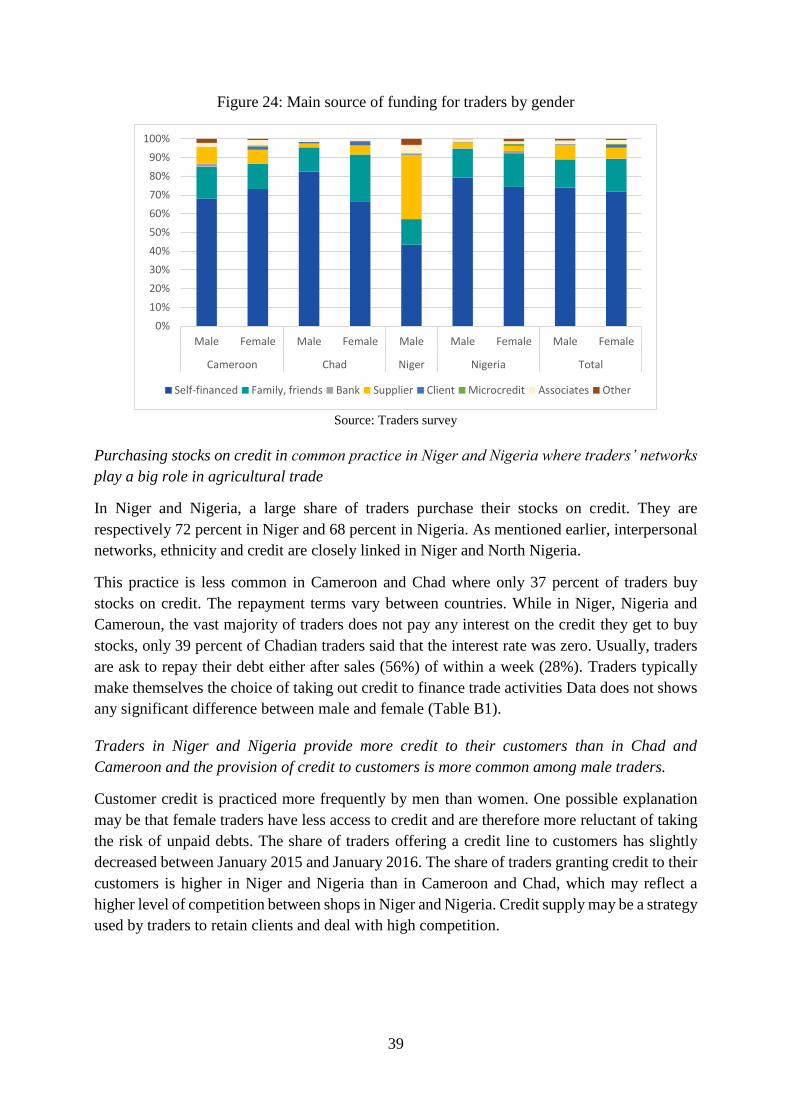
39
Figure 24: Main source of funding for traders by gender
Source: Traders survey
Purchasing stocks on credit in common practice in Niger and Nigeria where traders’ networks
play a big role in agricultural trade
In Niger and Nigeria, a large share of traders purchase their stocks on credit. They are
respectively 72 percent in Niger and 68 percent in Nigeria. As mentioned earlier, interpersonal
networks, ethnicity and credit are closely linked in Niger and North Nigeria.
This practice is less common in Cameroon and Chad where only 37 percent of traders buy
stocks on credit. The repayment terms vary between countries. While in Niger, Nigeria and
Cameroun, the vast majority of traders does not pay any interest on the credit they get to buy
stocks, only 39 percent of Chadian traders said that the interest rate was zero. Usually, traders
are ask to repay their debt either after sales (56%) of within a week (28%). Traders typically
make themselves the choice of taking out credit to finance trade activities Data does not shows
any significant difference between male and female (Table B1).
Traders in Niger and Nigeria provide more credit to their customers than in Chad and
Cameroon and the provision of credit to customers is more common among male traders.
Customer credit is practiced more frequently by men than women. One possible explanation
may be that female traders have less access to credit and are therefore more reluctant of taking
the risk of unpaid debts. The share of traders offering a credit line to customers has slightly
decreased between January 2015 and January 2016. The share of traders granting credit to their
customers is higher in Niger and Nigeria than in Cameroon and Chad, which may reflect a
higher level of competition between shops in Niger and Nigeria. Credit supply may be a strategy
used by traders to retain clients and deal with high competition.
0%
10%
20%
30%
40%
50%
60%
70%
80%
90%
100%
Male Female Male Female Male Male Female Male Female
Cameroon Chad Niger Nigeria Total
Self-financed Family, friends Bank Supplier Client Microcredit Associates Other
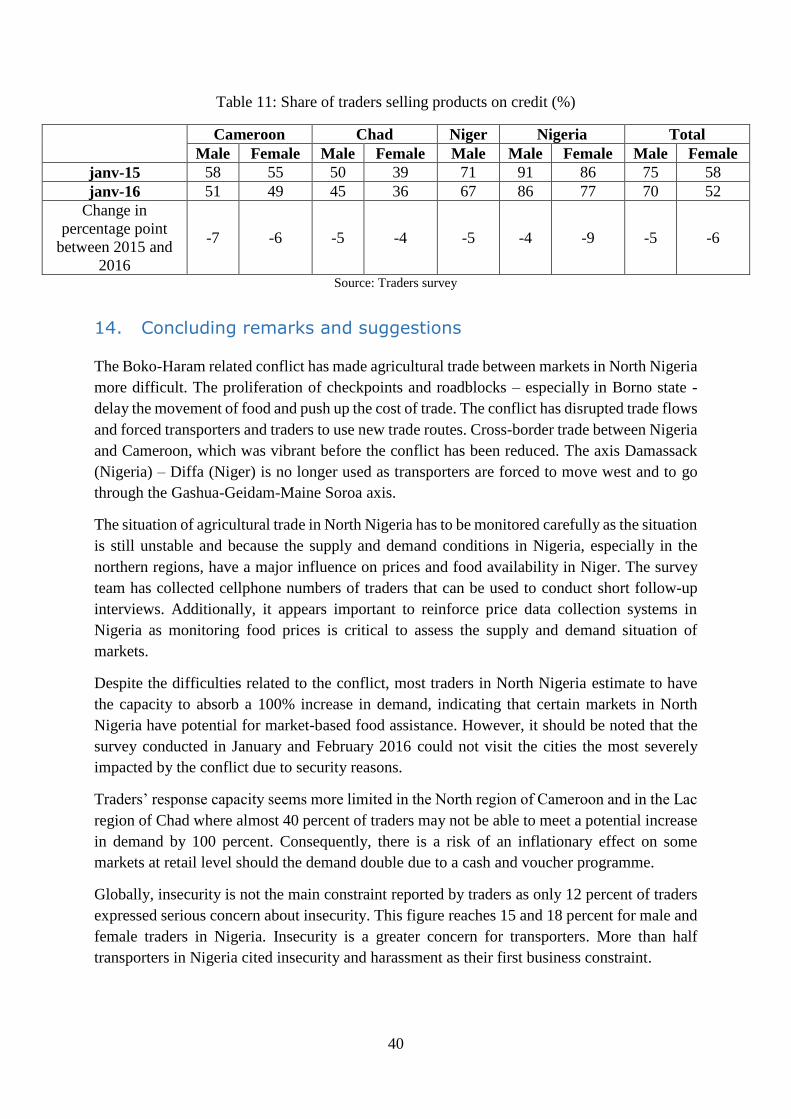
40
Table 11: Share of traders selling products on credit (%)
Cameroon Chad Niger Nigeria Total
Male Female Male Female Male Male Female Male Female
janv-15 58 55 50 39 71 91 86 75 58
janv-16 51 49 45 36 67 86 77 70 52
Change in
percentage point
between 2015 and
2016
-7 -6 -5 -4 -5 -4 -9 -5 -6
Source: Traders survey
14. Concluding remarks and suggestions
The Boko-Haram related conflict has made agricultural trade between markets in North Nigeria
more difficult. The proliferation of checkpoints and roadblocks – especially in Borno state -
delay the movement of food and push up the cost of trade. The conflict has disrupted trade flows
and forced transporters and traders to use new trade routes. Cross-border trade between Nigeria
and Cameroon, which was vibrant before the conflict has been reduced. The axis Damassack
(Nigeria) – Diffa (Niger) is no longer used as transporters are forced to move west and to go
through the Gashua-Geidam-Maine Soroa axis.
The situation of agricultural trade in North Nigeria has to be monitored carefully as the situation
is still unstable and because the supply and demand conditions in Nigeria, especially in the
northern regions, have a major influence on prices and food availability in Niger. The survey
team has collected cellphone numbers of traders that can be used to conduct short follow-up
interviews. Additionally, it appears important to reinforce price data collection systems in
Nigeria as monitoring food prices is critical to assess the supply and demand situation of
markets.
Despite the difficulties related to the conflict, most traders in North Nigeria estimate to have
the capacity to absorb a 100% increase in demand, indicating that certain markets in North
Nigeria have potential for market-based food assistance. However, it should be noted that the
survey conducted in January and February 2016 could not visit the cities the most severely
impacted by the conflict due to security reasons.
Traders’ response capacity seems more limited in the North region of Cameroon and in the Lac
region of Chad where almost 40 percent of traders may not be able to meet a potential increase
in demand by 100 percent. Consequently, there is a risk of an inflationary effect on some
markets at retail level should the demand double due to a cash and voucher programme.
Globally, insecurity is not the main constraint reported by traders as only 12 percent of traders
expressed serious concern about insecurity. This figure reaches 15 and 18 percent for male and
female traders in Nigeria. Insecurity is a greater concern for transporters. More than half
transporters in Nigeria cited insecurity and harassment as their first business constraint.
41
Lack of own capital is cited by 49 percent of traders as their main business constraint. Overall,
women suffer disproportionately from lack of capital as 67 percent of female traders reported
it as their main business obstacle compared to 44 percent of male traders.
One of the objective of this report is to contribute to the regional gender and markets agenda
by putting a special emphasis on gender dimension. Data suggests that women play a marginal
role in the trade of cereals around the Lake Chad Basin, especially in North Nigeria and in the
Diffa region of Niger. Most women engaged in agricultural trade are small-scale retailers with
no employees, whose main constraint is the lack of capital. The discussions with WFP partners
revealed that women play different roles than men in agricultural value chains in Nigeria and
Niger. Women in Nigeria often participate in post-harvest processing activities such as milling,
parboiling, pounding, peeling, threshing and grinding cereals (Ejembi et al., 2006) while in the
Diffa region of Niger, women are involved in the trade of condiments as the trade of grains is
often seen as a traditional male activity.
Retail prices of millet, sorghum and maize exhibit large seasonal variation, especially in the
Lac region of Chad where the magnitude of seasonal variations is extremely high. In addition
to seasonal variations, the report shows that the marketing situation can vary greatly within the
same country indicating that WFP operations should take into account seasonal and
geographical factors influencing market functionality. For instance, markets in Chad are
characterized by high prices, large spatial price variations and high distances from supply
markets that can affect market based operations.
While this survey has enabled us to collect useful information about market functioning in the
Lake Chad Basin, it does not provide information about pastoralists and how livestock trade
has been affected by the Lake Chad Basin crisis. Kimenyi et al. (2014) indicate that livestock
markets in North Nigeria have been severely disrupted, with a high rise in cattle prices coupled
with a decrease in profit from slaughtering. To the best of our knowledge, very few studies have
been conducted on livestock trade around the Lake Chad Basin although livestock rearing
constitutes an important livelihood in the region. An analysis of livestock trade dynamics would
be useful to understand how are pastoralists affected by the crisis and what are their coping
mechanisms.
Suggestions for improving questionnaire design are included in Annex C.
42
Bibliographie
Aker. J. C., et al. (2010). “Are Borders Barriers? The Impact of International and Internal Ethnic
Borders on Agricultural Markets in West Africa.” CGD Working Paper 208. Washington, D.C.:
Center for Global Development.
Ejembi, E. P., S. A. Ejembi, and O. N. Abgulu. 2006. Food chain activities of women in an
agrarian community in Central Nigeria: implications for rural development. Journal of
Human Ecology 19 (1):63-67.
FAOSTAT (2016). Rome, Italy: Food and Agriculture Organization. Available from
http://faostat.fao.org.
FEWS NET (2016). NIGERIA Food Security Outlook. February to September 2016.
Hulme, M., (2001). Climate perspectives on Sahelian dessiccation: 1973–1998. Global
Environmental Change 11: 19–29
IFC (2011). Strengthening Access to Finance for Women-Owned SMEs in Developing
Countries
IMF, (2016). IMF Staff Completes 2016 Article IV Mission to Nigeria. Press Release No. 16/72
IOM (2016). Displacement Tracking Matrix (DTM) Round IX Report - April, 2016.
Kandji, S. T., Verchot, L., Mackensen, J. (2006). Climate Change and Variability in the Sahel
Region: Impacts and Adaptation Strategies in the Agricultural Sector. Word Agroforestry
Centre (ICRAF), United Nations Environment Programme (UNEP)
Kimenyi, M., Adibe, J., Djiré, M., Jirgi, A.J., Kergna, A., Deressa, T.T., Westbury, A., (2014).
The Impact of Conflict and Political Instability on Agricultural Investments in Mali and Nigeria.
Brook. Afr. Growth Initiat. Work. Pap. 17.
Olivier de Sardan J-P., (2011). Aide humanitaire ou aide au développement ? La « famine » de
2005 au Niger. Ethnologie française 3/2011 (Vol. 41), p. 415-429
OHCHR, (2015) Report of the United Nations High Commissioner for Human Rights on
violations and abuses committed by Boko Haram and the impact on human rights in the affected
countries
Teravaninthorn, S., & Raballand, G. (2009). Transport Prices and Costs in Africa: A Review
of the International Corridors. Washington, DC: The World Bank.
UNESCO Institute for Statistic (2016). Available from http://data.uis.unesco.org/Index.aspx
USDA statistics (2016). Available from http://www.fas.usda.gov/psdonline/
World Bank (2013). Cross-Border Trade Between Nigeria and CEMAC Countries. World
Bank, Washington, DC.
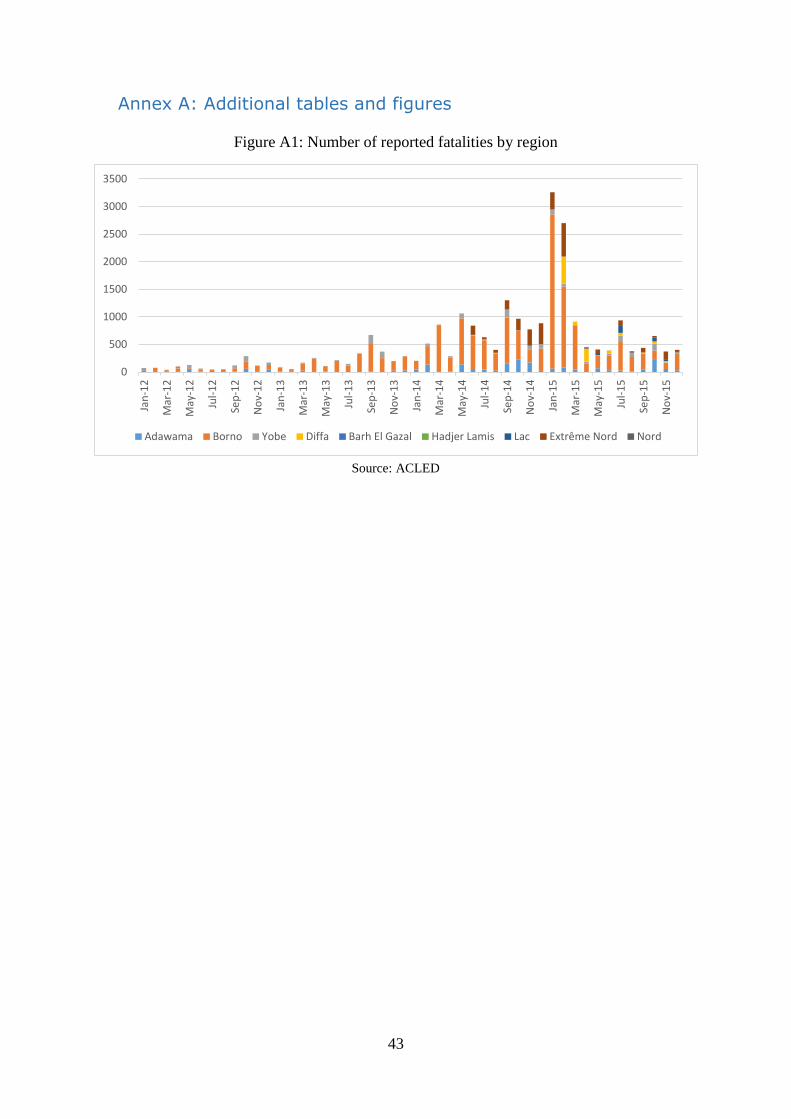
43
Annex A: Additional tables and figures
Figure A1: Number of reported fatalities by region
Source: ACLED
0
500
1000
1500
2000
2500
3000
3500
Jan
-12
Mar
-12
May
-12
Jul-
12
Sep
-12
No
v-1
2
Jan
-13
Mar
-13
May
-13
Jul-
13
Sep
-13
No
v-1
3
Jan
-14
Mar
-14
May
-14
Jul-
14
Sep
-14
No
v-1
4
Jan
-15
Mar
-15
May
-15
Jul-
15
Sep
-15
No
v-1
5
Adawama Borno Yobe Diffa Barh El Gazal Hadjer Lamis Lac Extrême Nord Nord
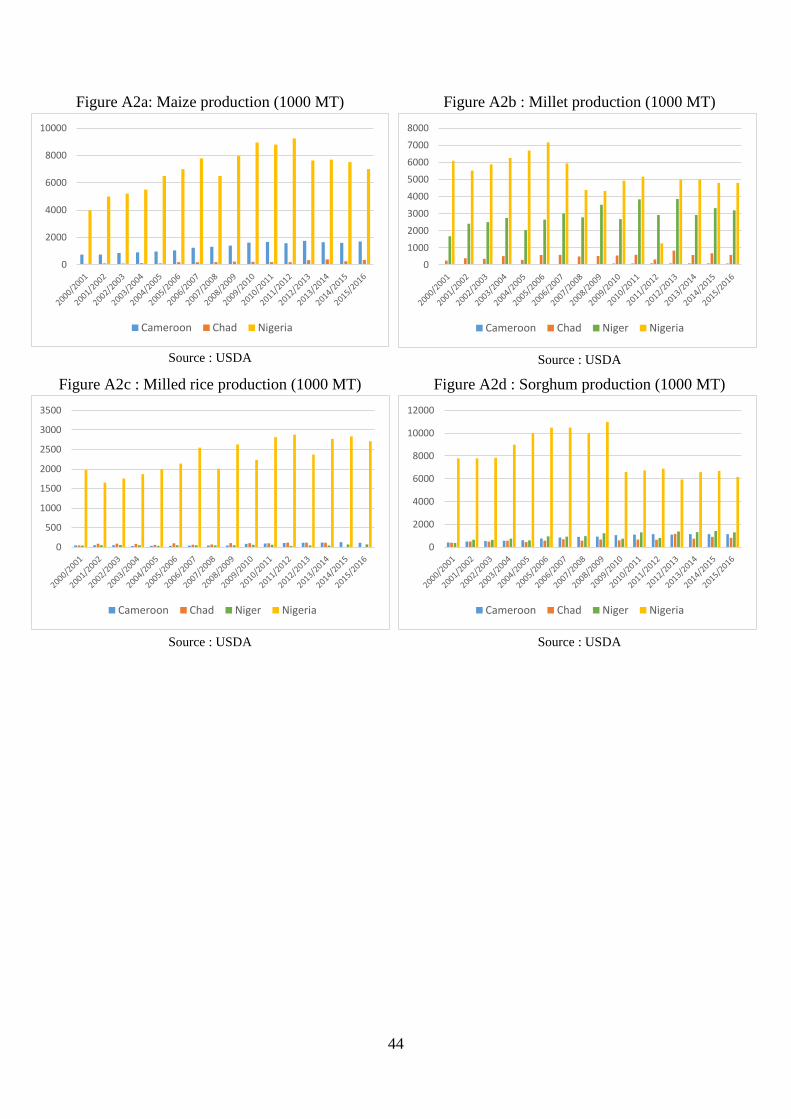
44
Figure A2a: Maize production (1000 MT)
Source : USDA
Figure A2b : Millet production (1000 MT)
Source : USDA
Figure A2c : Milled rice production (1000 MT)
Source : USDA
Figure A2d : Sorghum production (1000 MT)
Source : USDA
0
2000
4000
6000
8000
10000
Cameroon Chad Nigeria
0
1000
2000
3000
4000
5000
6000
7000
8000
Cameroon Chad Niger Nigeria
0
500
1000
1500
2000
2500
3000
3500
Cameroon Chad Niger Nigeria
0
2000
4000
6000
8000
10000
12000
Cameroon Chad Niger Nigeria
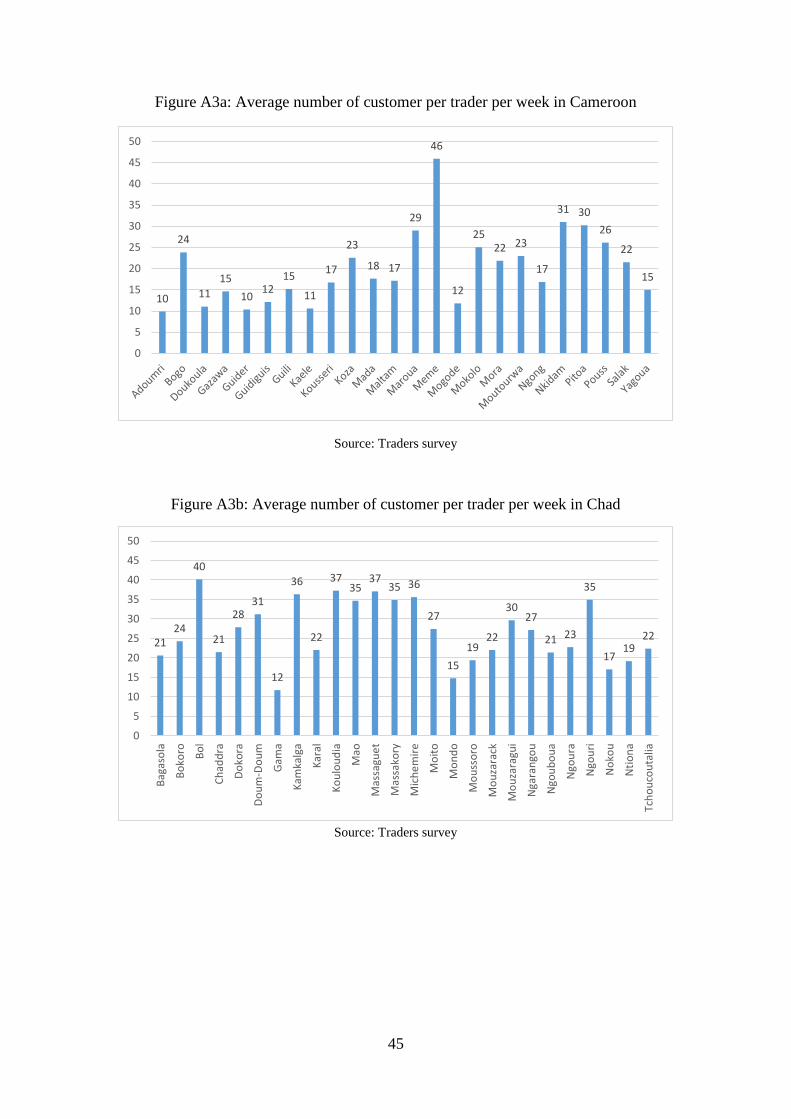
45
Figure A3a: Average number of customer per trader per week in Cameroon
Source: Traders survey
Figure A3b: Average number of customer per trader per week in Chad
Source: Traders survey
10
24
11
15
1012
15
11
17
23
18 17
29
46
12
2522 23
17
31 30
26
22
15
0
5
10
15
20
25
30
35
40
45
50
2124
40
21
2831
12
36
22
3735
3735 36
27
15
1922
3027
21 23
35
1719
22
0
5
10
15
20
25
30
35
40
45
50
Bag
aso
la
Bo
koro Bo
l
Ch
add
ra
Do
kora
Do
um
-Do
um
Gam
a
Kam
kalg
a
Kar
al
Ko
ulo
ud
ia
Mao
Mas
sagu
et
Mas
sako
ry
Mic
he
mir
e
Mo
ito
Mo
nd
o
Mo
uss
oro
Mo
uza
rack
Mo
uza
ragu
i
Nga
ran
gou
Ngo
ub
ou
a
Ngo
ura
Ngo
uri
No
kou
Nti
on
a
Tch
ou
cou
talia
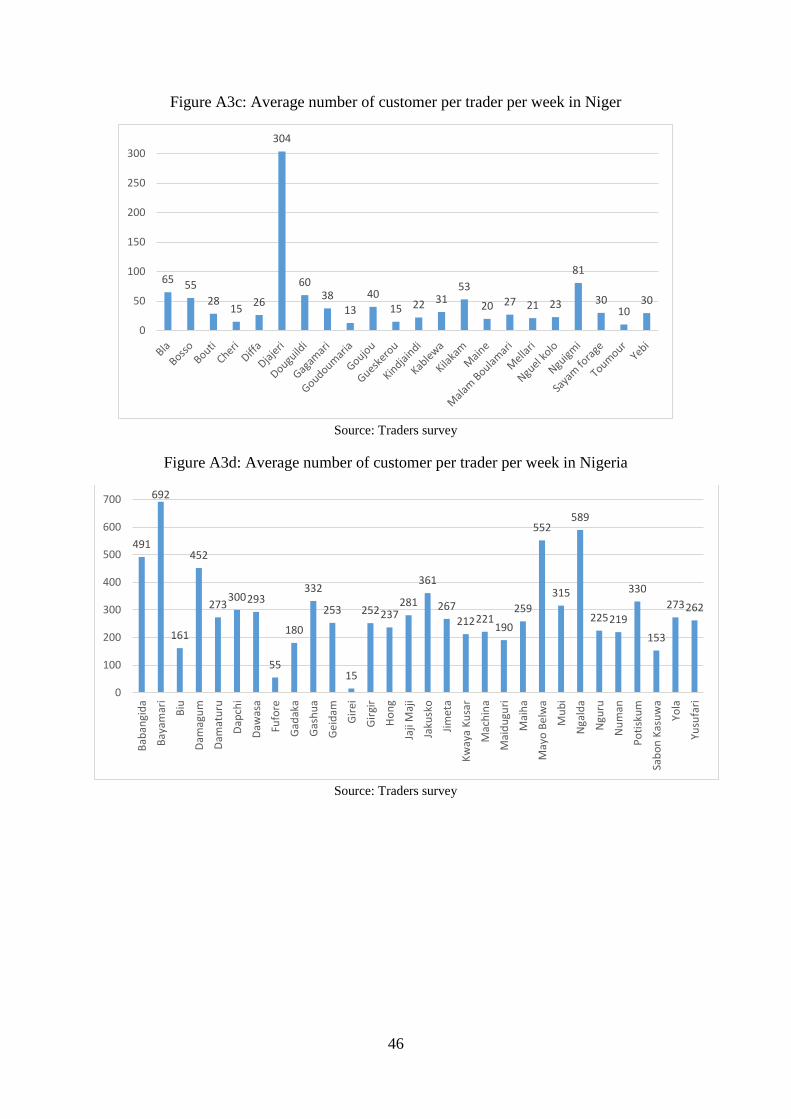
46
Figure A3c: Average number of customer per trader per week in Niger
Source: Traders survey
Figure A3d: Average number of customer per trader per week in Nigeria
Source: Traders survey
65 55
2815
26
304
6038
13
4015 22 31
53
20 27 21 23
81
3010
30
0
50
100
150
200
250
300
491
692
161
452
273300293
55
180
332
253
15
252237281
361
267
212221190
259
552
315
589
225219
330
153
273262
0
100
200
300
400
500
600
700
Bab
angi
da
Bay
amar
i
Biu
Dam
agu
m
Dam
atu
ru
Dap
chi
Daw
asa
Fufo
re
Gad
aka
Gas
hu
a
Ge
idam
Gir
ei
Gir
gir
Ho
ng
Jaji
Maj
i
Jaku
sko
Jim
eta
Kw
aya
Ku
sar
Mac
hin
a
Mai
du
guri
Mai
ha
May
o B
elw
a
Mu
bi
Nga
lda
Ngu
ru
Nu
man
Po
tisk
um
Sab
on
Kas
uw
a
Yola
Yusu
fari
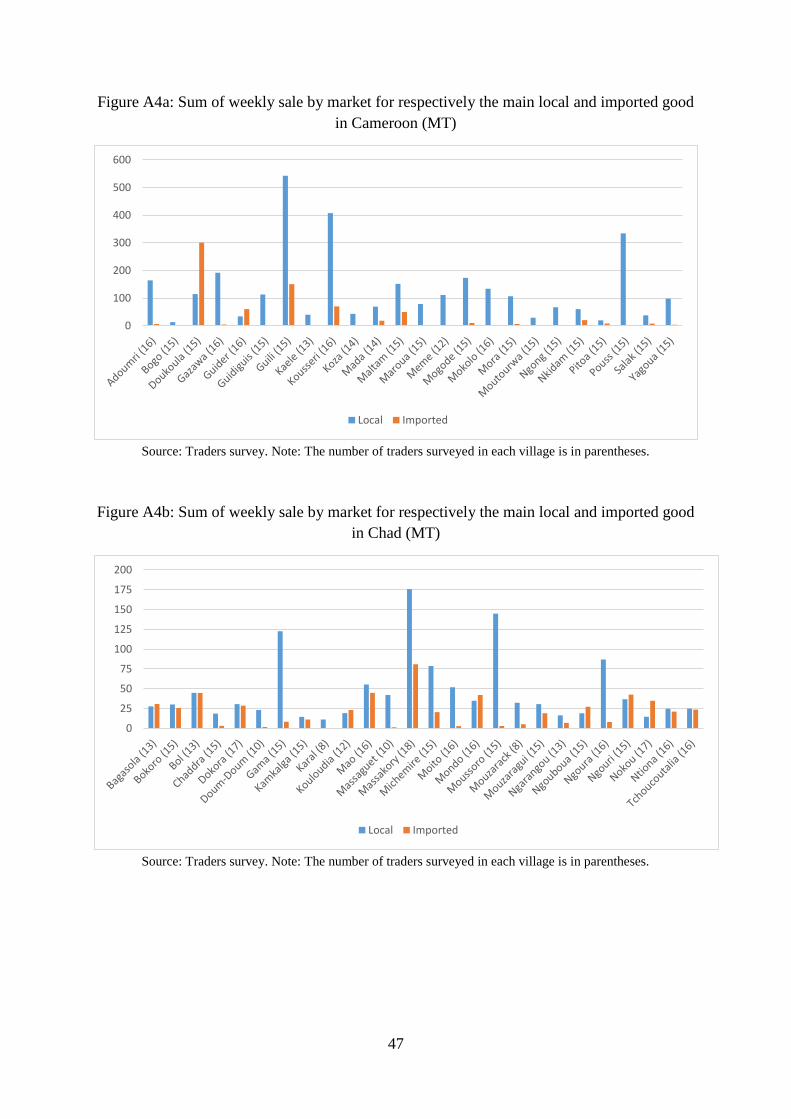
47
Figure A4a: Sum of weekly sale by market for respectively the main local and imported good
in Cameroon (MT)
Source: Traders survey. Note: The number of traders surveyed in each village is in parentheses.
Figure A4b: Sum of weekly sale by market for respectively the main local and imported good
in Chad (MT)
Source: Traders survey. Note: The number of traders surveyed in each village is in parentheses.
0
100
200
300
400
500
600
Local Imported
0
25
50
75
100
125
150
175
200
Local Imported
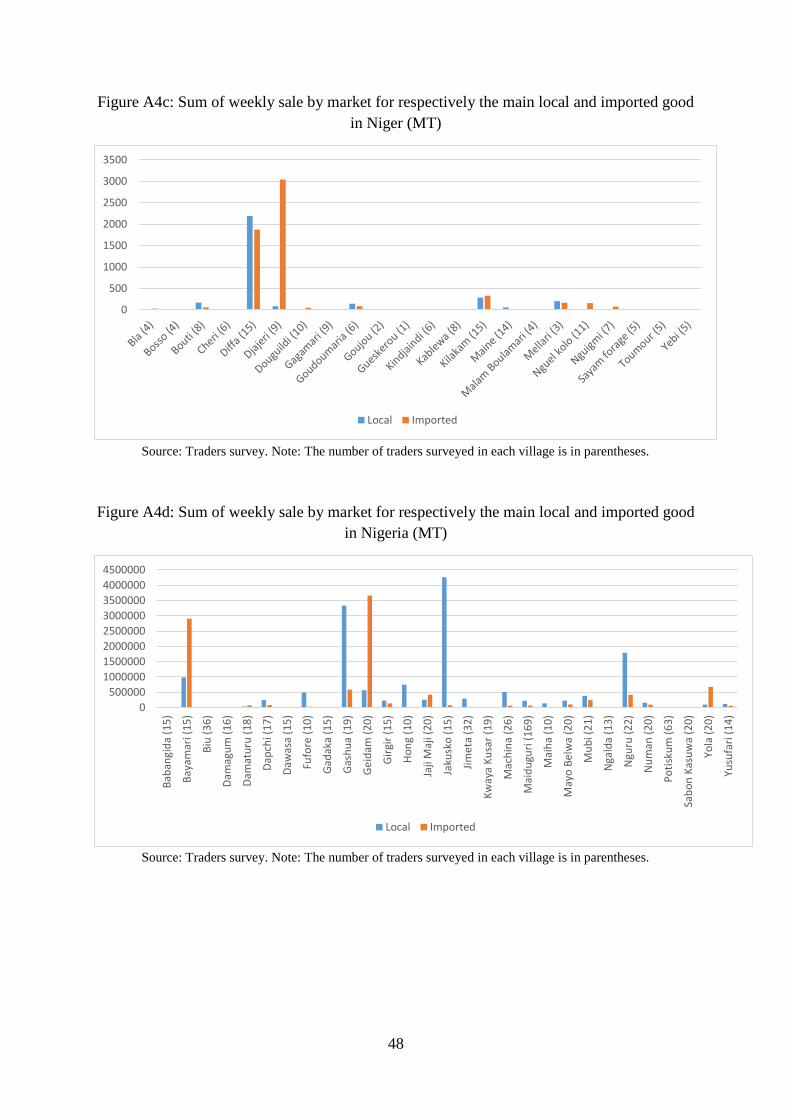
48
Figure A4c: Sum of weekly sale by market for respectively the main local and imported good
in Niger (MT)
Source: Traders survey. Note: The number of traders surveyed in each village is in parentheses.
Figure A4d: Sum of weekly sale by market for respectively the main local and imported good
in Nigeria (MT)
Source: Traders survey. Note: The number of traders surveyed in each village is in parentheses.
0
500
1000
1500
2000
2500
3000
3500
Local Imported
0
500000
1000000
1500000
2000000
2500000
3000000
3500000
4000000
4500000
Bab
angi
da
(15
)
Bay
amar
i (1
5)
Biu
(3
6)
Dam
agu
m (
16
)
Dam
atu
ru (
18
)
Dap
chi (
17
)
Daw
asa
(15
)
Fufo
re (
10
)
Gad
aka
(15
)
Gas
hu
a (1
9)
Ge
idam
(2
0)
Gir
gir
(15
)
Ho
ng
(10
)
Jaji
Maj
i (2
0)
Jaku
sko
(1
5)
Jim
eta
(32
)
Kw
aya
Ku
sar
(19
)
Mac
hin
a (2
6)
Mai
du
guri
(1
69
)
Mai
ha
(10
)
May
o B
elw
a (2
0)
Mu
bi (
21
)
Nga
lda
(13
)
Ngu
ru (
22
)
Nu
man
(2
0)
Po
tisk
um
(6
3)
Sab
on
Kas
uw
a (2
0)
Yola
(2
0)
Yusu
fari
(1
4)
Local Imported
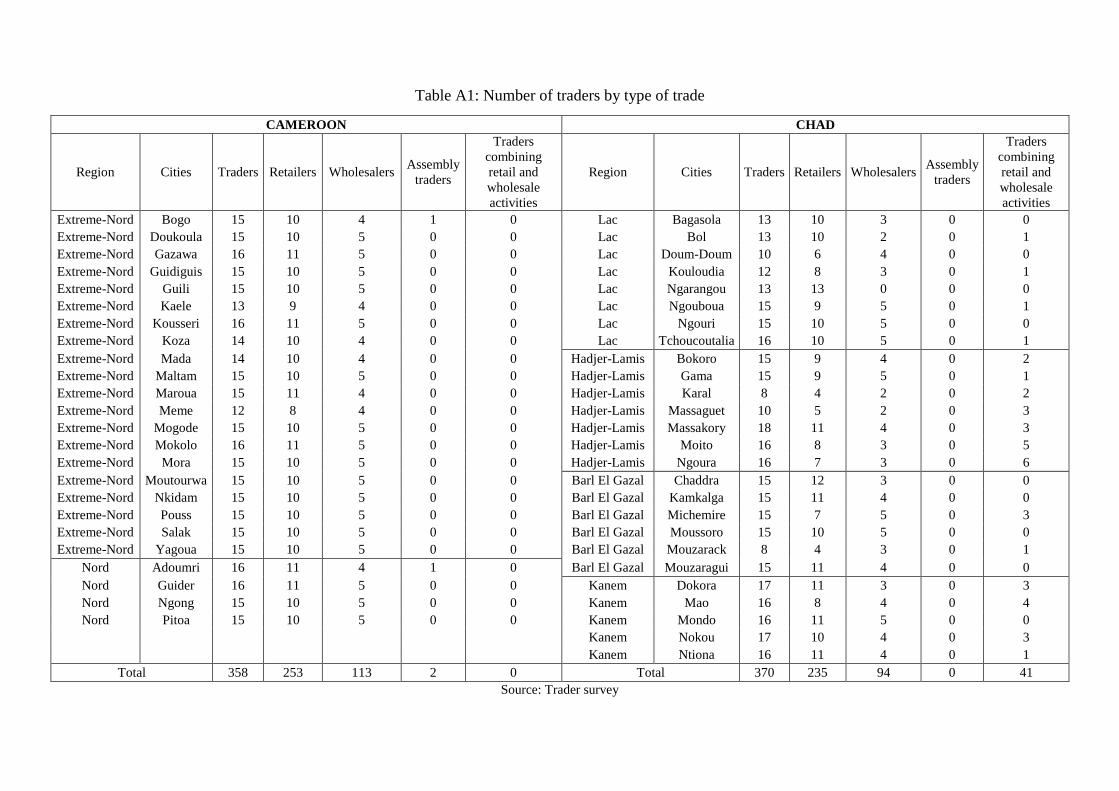
Table A1: Number of traders by type of trade
CAMEROON CHAD
Region Cities Traders Retailers Wholesalers Assembly
traders
Traders
combining
retail and
wholesale
activities
Region Cities Traders Retailers Wholesalers Assembly
traders
Traders
combining
retail and
wholesale
activities
Extreme-Nord Bogo 15 10 4 1 0 Lac Bagasola 13 10 3 0 0
Extreme-Nord Doukoula 15 10 5 0 0 Lac Bol 13 10 2 0 1
Extreme-Nord Gazawa 16 11 5 0 0 Lac Doum-Doum 10 6 4 0 0
Extreme-Nord Guidiguis 15 10 5 0 0 Lac Kouloudia 12 8 3 0 1
Extreme-Nord Guili 15 10 5 0 0 Lac Ngarangou 13 13 0 0 0
Extreme-Nord Kaele 13 9 4 0 0 Lac Ngouboua 15 9 5 0 1
Extreme-Nord Kousseri 16 11 5 0 0 Lac Ngouri 15 10 5 0 0
Extreme-Nord Koza 14 10 4 0 0 Lac Tchoucoutalia 16 10 5 0 1
Extreme-Nord Mada 14 10 4 0 0 Hadjer-Lamis Bokoro 15 9 4 0 2
Extreme-Nord Maltam 15 10 5 0 0 Hadjer-Lamis Gama 15 9 5 0 1
Extreme-Nord Maroua 15 11 4 0 0 Hadjer-Lamis Karal 8 4 2 0 2
Extreme-Nord Meme 12 8 4 0 0 Hadjer-Lamis Massaguet 10 5 2 0 3
Extreme-Nord Mogode 15 10 5 0 0 Hadjer-Lamis Massakory 18 11 4 0 3
Extreme-Nord Mokolo 16 11 5 0 0 Hadjer-Lamis Moito 16 8 3 0 5
Extreme-Nord Mora 15 10 5 0 0 Hadjer-Lamis Ngoura 16 7 3 0 6
Extreme-Nord Moutourwa 15 10 5 0 0 Barl El Gazal Chaddra 15 12 3 0 0
Extreme-Nord Nkidam 15 10 5 0 0 Barl El Gazal Kamkalga 15 11 4 0 0
Extreme-Nord Pouss 15 10 5 0 0 Barl El Gazal Michemire 15 7 5 0 3
Extreme-Nord Salak 15 10 5 0 0 Barl El Gazal Moussoro 15 10 5 0 0
Extreme-Nord Yagoua 15 10 5 0 0 Barl El Gazal Mouzarack 8 4 3 0 1
Nord Adoumri 16 11 4 1 0 Barl El Gazal Mouzaragui 15 11 4 0 0
Nord Guider 16 11 5 0 0 Kanem Dokora 17 11 3 0 3
Nord Ngong 15 10 5 0 0 Kanem Mao 16 8 4 0 4
Nord Pitoa 15 10 5 0 0 Kanem Mondo 16 11 5 0 0
Kanem Nokou 17 10 4 0 3
Kanem Ntiona 16 11 4 0 1
Total 358 253 113 2 0 Total 370 235 94 0 41
Source: Trader survey
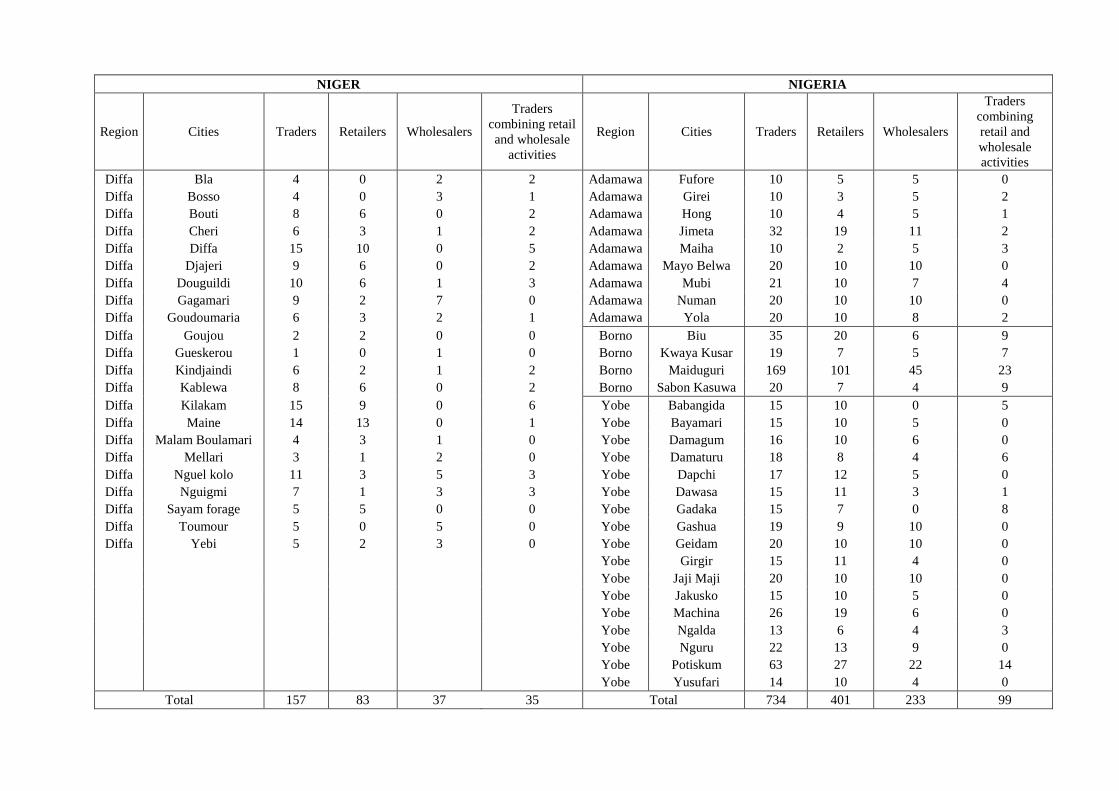
NIGER NIGERIA
Region Cities Traders Retailers Wholesalers
Traders
combining retail
and wholesale
activities
Region Cities Traders Retailers Wholesalers
Traders
combining
retail and
wholesale
activities
Diffa Bla 4 0 2 2 Adamawa Fufore 10 5 5 0
Diffa Bosso 4 0 3 1 Adamawa Girei 10 3 5 2
Diffa Bouti 8 6 0 2 Adamawa Hong 10 4 5 1
Diffa Cheri 6 3 1 2 Adamawa Jimeta 32 19 11 2
Diffa Diffa 15 10 0 5 Adamawa Maiha 10 2 5 3
Diffa Djajeri 9 6 0 2 Adamawa Mayo Belwa 20 10 10 0
Diffa Douguildi 10 6 1 3 Adamawa Mubi 21 10 7 4
Diffa Gagamari 9 2 7 0 Adamawa Numan 20 10 10 0
Diffa Goudoumaria 6 3 2 1 Adamawa Yola 20 10 8 2
Diffa Goujou 2 2 0 0 Borno Biu 35 20 6 9
Diffa Gueskerou 1 0 1 0 Borno Kwaya Kusar 19 7 5 7
Diffa Kindjaindi 6 2 1 2 Borno Maiduguri 169 101 45 23
Diffa Kablewa 8 6 0 2 Borno Sabon Kasuwa 20 7 4 9
Diffa Kilakam 15 9 0 6 Yobe Babangida 15 10 0 5
Diffa Maine 14 13 0 1 Yobe Bayamari 15 10 5 0
Diffa Malam Boulamari 4 3 1 0 Yobe Damagum 16 10 6 0
Diffa Mellari 3 1 2 0 Yobe Damaturu 18 8 4 6
Diffa Nguel kolo 11 3 5 3 Yobe Dapchi 17 12 5 0
Diffa Nguigmi 7 1 3 3 Yobe Dawasa 15 11 3 1
Diffa Sayam forage 5 5 0 0 Yobe Gadaka 15 7 0 8
Diffa Toumour 5 0 5 0 Yobe Gashua 19 9 10 0
Diffa Yebi 5 2 3 0 Yobe Geidam 20 10 10 0
Yobe Girgir 15 11 4 0
Yobe Jaji Maji 20 10 10 0
Yobe Jakusko 15 10 5 0
Yobe Machina 26 19 6 0
Yobe Ngalda 13 6 4 3
Yobe Nguru 22 13 9 0
Yobe Potiskum 63 27 22 14
Yobe Yusufari 14 10 4 0
Total 157 83 37 35 Total 734 401 233 99
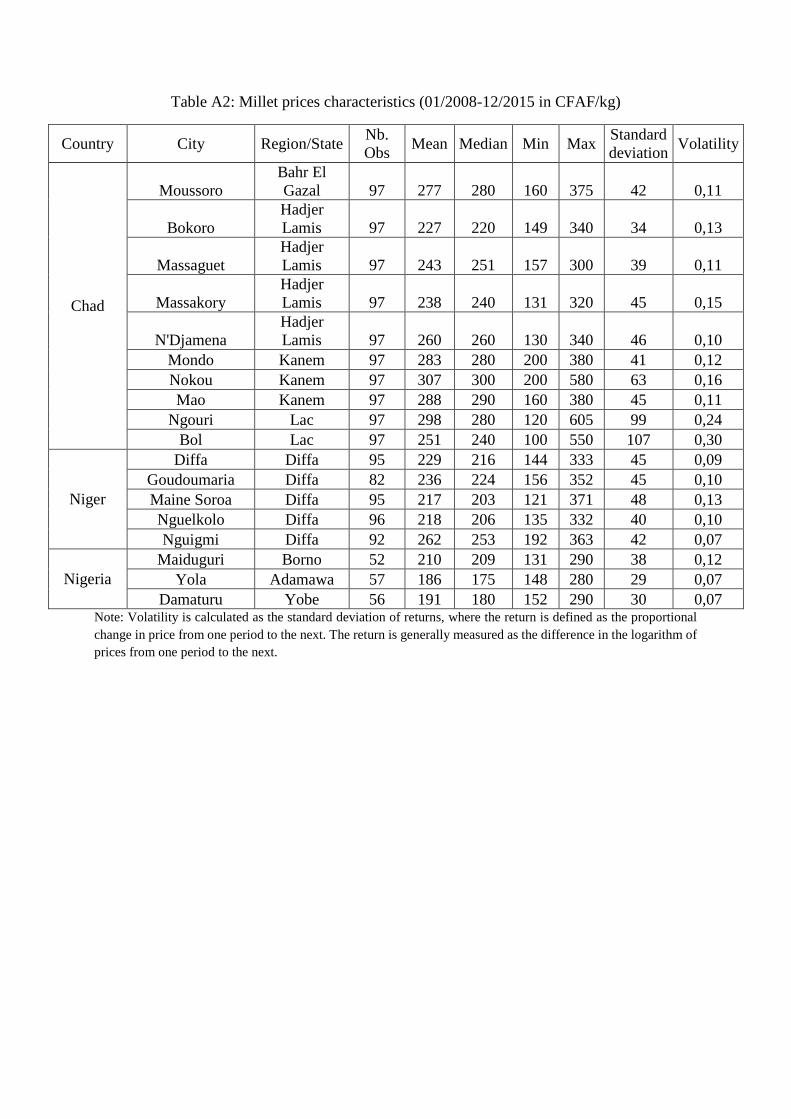
Table A2: Millet prices characteristics (01/2008-12/2015 in CFAF/kg)
Country City Region/State Nb.
Obs Mean Median Min Max
Standard
deviation Volatility
Chad
Moussoro
Bahr El
Gazal 97 277 280 160 375 42 0,11
Bokoro
Hadjer
Lamis 97 227 220 149 340 34 0,13
Massaguet
Hadjer
Lamis 97 243 251 157 300 39 0,11
Massakory
Hadjer
Lamis 97 238 240 131 320 45 0,15
N'Djamena
Hadjer
Lamis 97 260 260 130 340 46 0,10
Mondo Kanem 97 283 280 200 380 41 0,12
Nokou Kanem 97 307 300 200 580 63 0,16
Mao Kanem 97 288 290 160 380 45 0,11
Ngouri Lac 97 298 280 120 605 99 0,24
Bol Lac 97 251 240 100 550 107 0,30
Niger
Diffa Diffa 95 229 216 144 333 45 0,09
Goudoumaria Diffa 82 236 224 156 352 45 0,10
Maine Soroa Diffa 95 217 203 121 371 48 0,13
Nguelkolo Diffa 96 218 206 135 332 40 0,10
Nguigmi Diffa 92 262 253 192 363 42 0,07
Nigeria
Maiduguri Borno 52 210 209 131 290 38 0,12
Yola Adamawa 57 186 175 148 280 29 0,07
Damaturu Yobe 56 191 180 152 290 30 0,07 Note: Volatility is calculated as the standard deviation of returns, where the return is defined as the proportional
change in price from one period to the next. The return is generally measured as the difference in the logarithm of
prices from one period to the next.
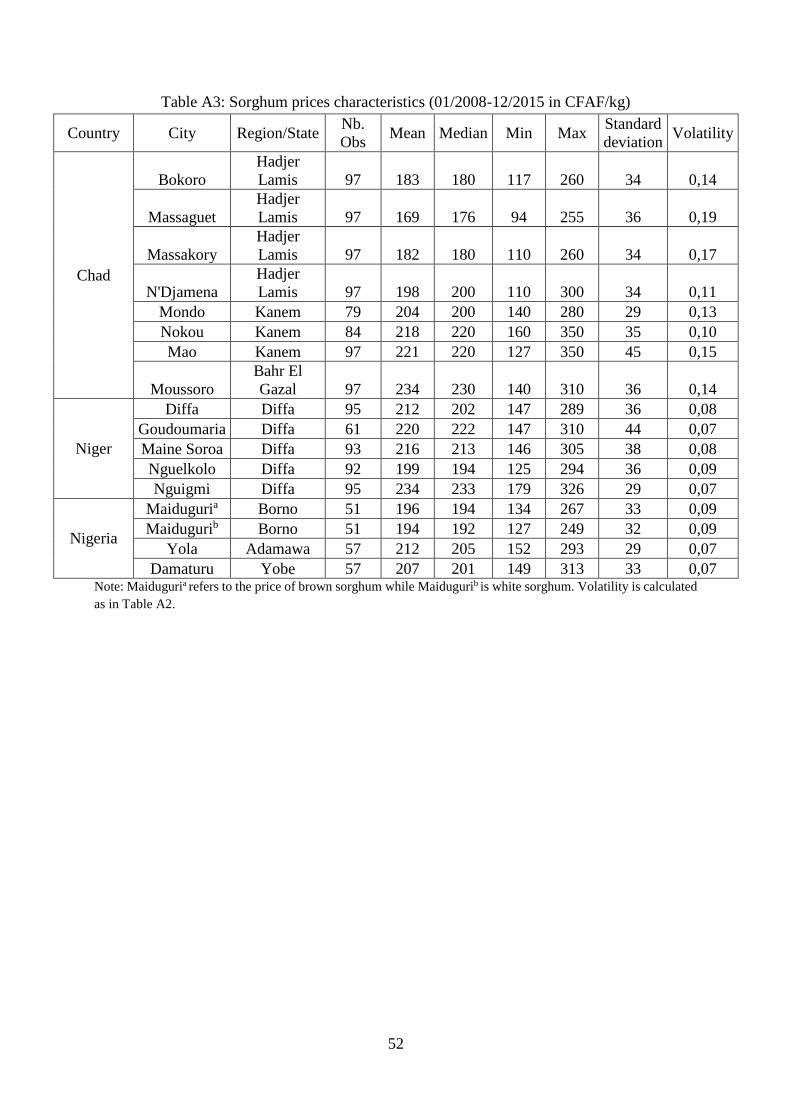
52
Table A3: Sorghum prices characteristics (01/2008-12/2015 in CFAF/kg)
Country City Region/State Nb.
Obs Mean Median Min Max
Standard
deviation Volatility
Chad
Bokoro
Hadjer
Lamis 97 183 180 117 260 34 0,14
Massaguet
Hadjer
Lamis 97 169 176 94 255 36 0,19
Massakory
Hadjer
Lamis 97 182 180 110 260 34 0,17
N'Djamena
Hadjer
Lamis 97 198 200 110 300 34 0,11
Mondo Kanem 79 204 200 140 280 29 0,13
Nokou Kanem 84 218 220 160 350 35 0,10
Mao Kanem 97 221 220 127 350 45 0,15
Moussoro
Bahr El
Gazal 97 234 230 140 310 36 0,14
Niger
Diffa Diffa 95 212 202 147 289 36 0,08
Goudoumaria Diffa 61 220 222 147 310 44 0,07
Maine Soroa Diffa 93 216 213 146 305 38 0,08
Nguelkolo Diffa 92 199 194 125 294 36 0,09
Nguigmi Diffa 95 234 233 179 326 29 0,07
Nigeria
Maiduguria Borno 51 196 194 134 267 33 0,09
Maidugurib Borno 51 194 192 127 249 32 0,09
Yola Adamawa 57 212 205 152 293 29 0,07
Damaturu Yobe 57 207 201 149 313 33 0,07 Note: Maiduguria refers to the price of brown sorghum while Maidugurib is white sorghum. Volatility is calculated
as in Table A2.
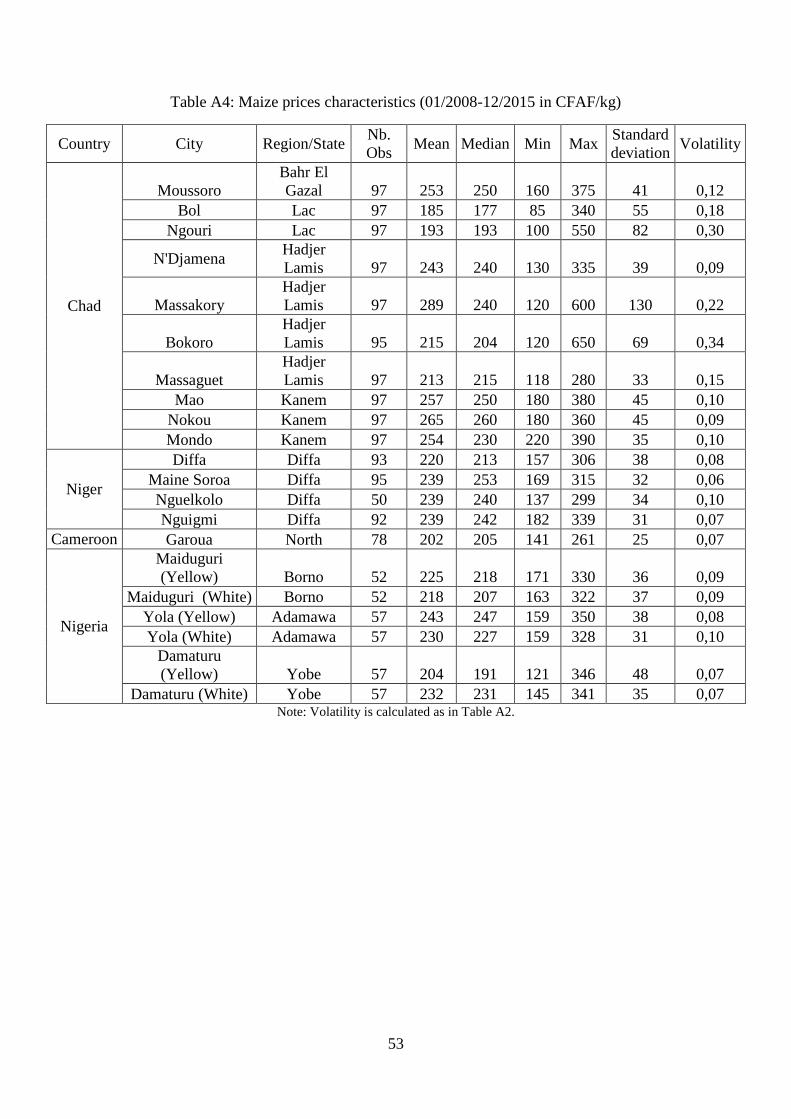
53
Table A4: Maize prices characteristics (01/2008-12/2015 in CFAF/kg)
Country City Region/State Nb.
Obs Mean Median Min Max
Standard
deviation Volatility
Chad
Moussoro
Bahr El
Gazal 97 253 250 160 375 41 0,12
Bol Lac 97 185 177 85 340 55 0,18
Ngouri Lac 97 193 193 100 550 82 0,30
N'Djamena Hadjer
Lamis 97 243 240 130 335 39 0,09
Massakory
Hadjer
Lamis 97 289 240 120 600 130 0,22
Bokoro
Hadjer
Lamis 95 215 204 120 650 69 0,34
Massaguet
Hadjer
Lamis 97 213 215 118 280 33 0,15
Mao Kanem 97 257 250 180 380 45 0,10
Nokou Kanem 97 265 260 180 360 45 0,09
Mondo Kanem 97 254 230 220 390 35 0,10
Niger
Diffa Diffa 93 220 213 157 306 38 0,08
Maine Soroa Diffa 95 239 253 169 315 32 0,06
Nguelkolo Diffa 50 239 240 137 299 34 0,10
Nguigmi Diffa 92 239 242 182 339 31 0,07
Cameroon Garoua North 78 202 205 141 261 25 0,07
Nigeria
Maiduguri
(Yellow) Borno 52 225 218 171 330 36 0,09
Maiduguri (White) Borno 52 218 207 163 322 37 0,09
Yola (Yellow) Adamawa 57 243 247 159 350 38 0,08
Yola (White) Adamawa 57 230 227 159 328 31 0,10
Damaturu
(Yellow) Yobe 57 204 191 121 346 48 0,07
Damaturu (White) Yobe 57 232 231 145 341 35 0,07 Note: Volatility is calculated as in Table A2.
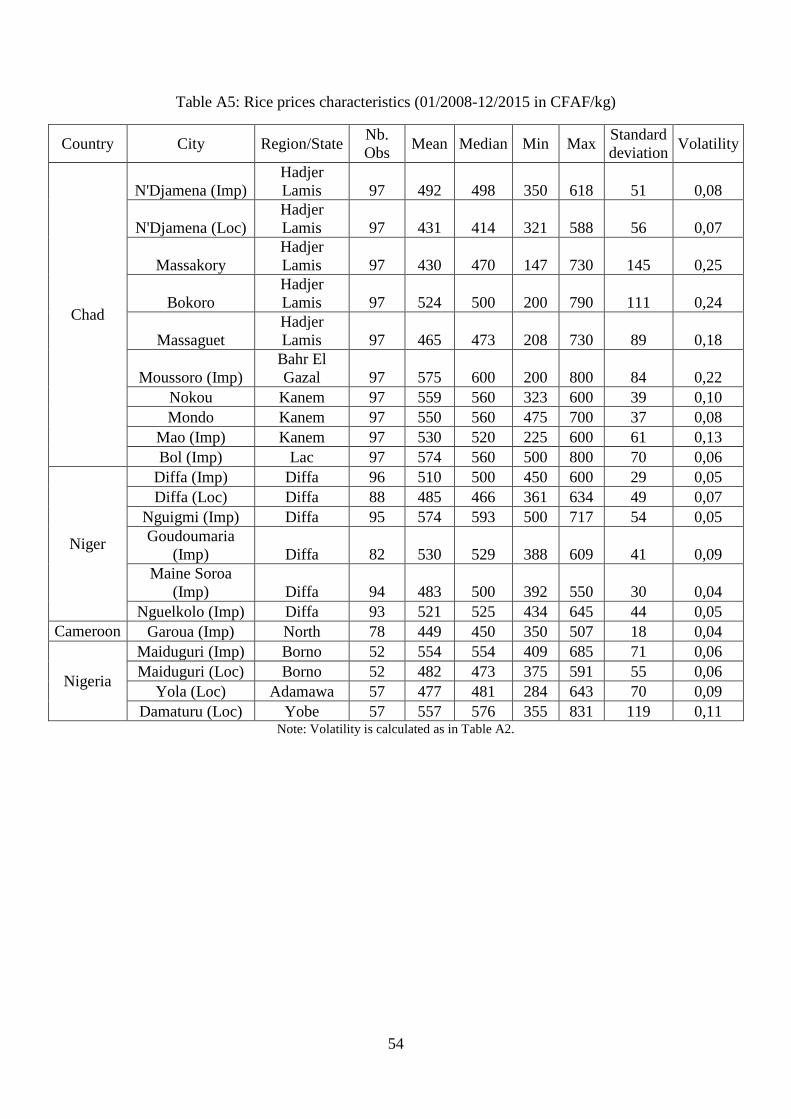
54
Table A5: Rice prices characteristics (01/2008-12/2015 in CFAF/kg)
Country City Region/State Nb.
Obs Mean Median Min Max
Standard
deviation Volatility
Chad
N'Djamena (Imp)
Hadjer
Lamis 97 492 498 350 618 51 0,08
N'Djamena (Loc)
Hadjer
Lamis 97 431 414 321 588 56 0,07
Massakory
Hadjer
Lamis 97 430 470 147 730 145 0,25
Bokoro
Hadjer
Lamis 97 524 500 200 790 111 0,24
Massaguet
Hadjer
Lamis 97 465 473 208 730 89 0,18
Moussoro (Imp)
Bahr El
Gazal 97 575 600 200 800 84 0,22
Nokou Kanem 97 559 560 323 600 39 0,10
Mondo Kanem 97 550 560 475 700 37 0,08
Mao (Imp) Kanem 97 530 520 225 600 61 0,13
Bol (Imp) Lac 97 574 560 500 800 70 0,06
Niger
Diffa (Imp) Diffa 96 510 500 450 600 29 0,05
Diffa (Loc) Diffa 88 485 466 361 634 49 0,07
Nguigmi (Imp) Diffa 95 574 593 500 717 54 0,05
Goudoumaria
(Imp) Diffa 82 530 529 388 609 41 0,09
Maine Soroa
(Imp) Diffa 94 483 500 392 550 30 0,04
Nguelkolo (Imp) Diffa 93 521 525 434 645 44 0,05
Cameroon Garoua (Imp) North 78 449 450 350 507 18 0,04
Nigeria
Maiduguri (Imp) Borno 52 554 554 409 685 71 0,06
Maiduguri (Loc) Borno 52 482 473 375 591 55 0,06
Yola (Loc) Adamawa 57 477 481 284 643 70 0,09
Damaturu (Loc) Yobe 57 557 576 355 831 119 0,11 Note: Volatility is calculated as in Table A2.
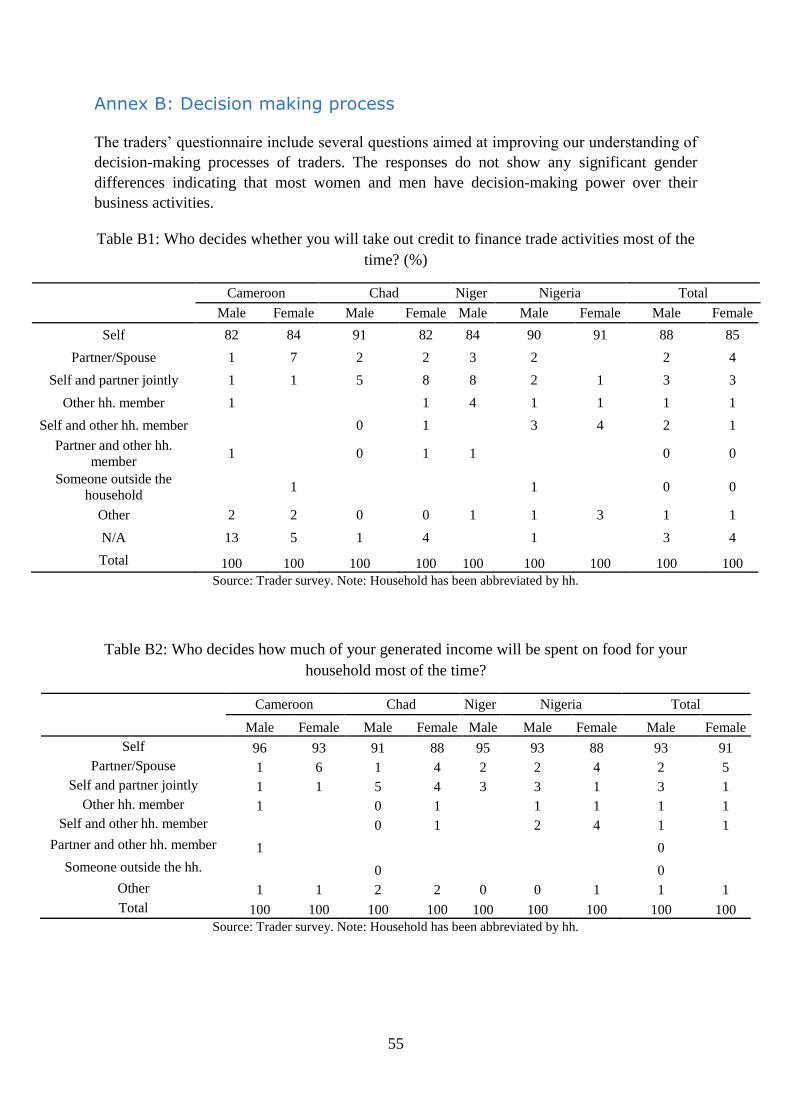
55
Annex B: Decision making process
The traders’ questionnaire include several questions aimed at improving our understanding of
decision-making processes of traders. The responses do not show any significant gender
differences indicating that most women and men have decision-making power over their
business activities.
Table B1: Who decides whether you will take out credit to finance trade activities most of the
time? (%)
Cameroon Chad Niger Nigeria Total
Male Female Male Female Male Male Female Male Female
Self 82 84 91 82 84 90 91 88 85
Partner/Spouse 1 7 2 2 3 2 2 4
Self and partner jointly 1 1 5 8 8 2 1 3 3
Other hh. member 1 1 4 1 1 1 1
Self and other hh. member 0 1 3 4 2 1
Partner and other hh.
member 1 0 1 1 0 0
Someone outside the
household 1 1 0 0
Other 2 2 0 0 1 1 3 1 1
N/A 13 5 1 4 1 3 4
Total 100 100 100 100 100 100 100 100 100
Source: Trader survey. Note: Household has been abbreviated by hh.
Table B2: Who decides how much of your generated income will be spent on food for your
household most of the time?
Cameroon Chad Niger Nigeria Total
Male Female Male Female Male Male Female Male Female
Self 96 93 91 88 95 93 88 93 91
Partner/Spouse 1 6 1 4 2 2 4 2 5
Self and partner jointly 1 1 5 4 3 3 1 3 1
Other hh. member 1 0 1 1 1 1 1
Self and other hh. member 0 1 2 4 1 1
Partner and other hh. member 1 0
Someone outside the hh. 0 0
Other 1 1 2 2 0 0 1 1 1
Total 100 100 100 100 100 100 100 100 100
Source: Trader survey. Note: Household has been abbreviated by hh.
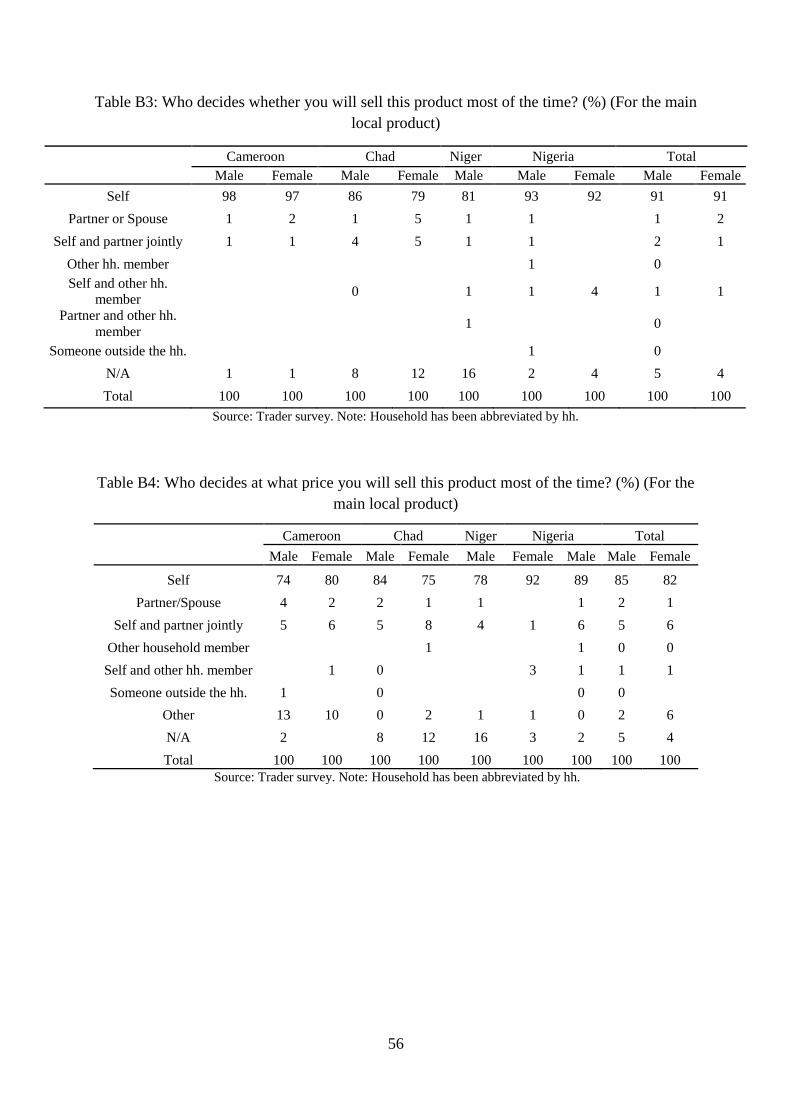
56
Table B3: Who decides whether you will sell this product most of the time? (%) (For the main
local product)
Cameroon Chad Niger Nigeria Total
Male Female Male Female Male Male Female Male Female
Self 98 97 86 79 81 93 92 91 91
Partner or Spouse 1 2 1 5 1 1 1 2
Self and partner jointly 1 1 4 5 1 1 2 1
Other hh. member 1 0
Self and other hh.
member 0 1 1 4 1 1
Partner and other hh.
member 1 0
Someone outside the hh. 1 0
N/A 1 1 8 12 16 2 4 5 4
Total 100 100 100 100 100 100 100 100 100
Source: Trader survey. Note: Household has been abbreviated by hh.
Table B4: Who decides at what price you will sell this product most of the time? (%) (For the
main local product)
Cameroon Chad Niger Nigeria Total
Male Female Male Female Male Female Male Male Female
Self 74 80 84 75 78 92 89 85 82
Partner/Spouse 4 2 2 1 1 1 2 1
Self and partner jointly 5 6 5 8 4 1 6 5 6
Other household member 1 1 0 0
Self and other hh. member 1 0 3 1 1 1
Someone outside the hh. 1 0 0 0
Other 13 10 0 2 1 1 0 2 6
N/A 2 8 12 16 3 2 5 4
Total 100 100 100 100 100 100 100 100 100
Source: Trader survey. Note: Household has been abbreviated by hh.
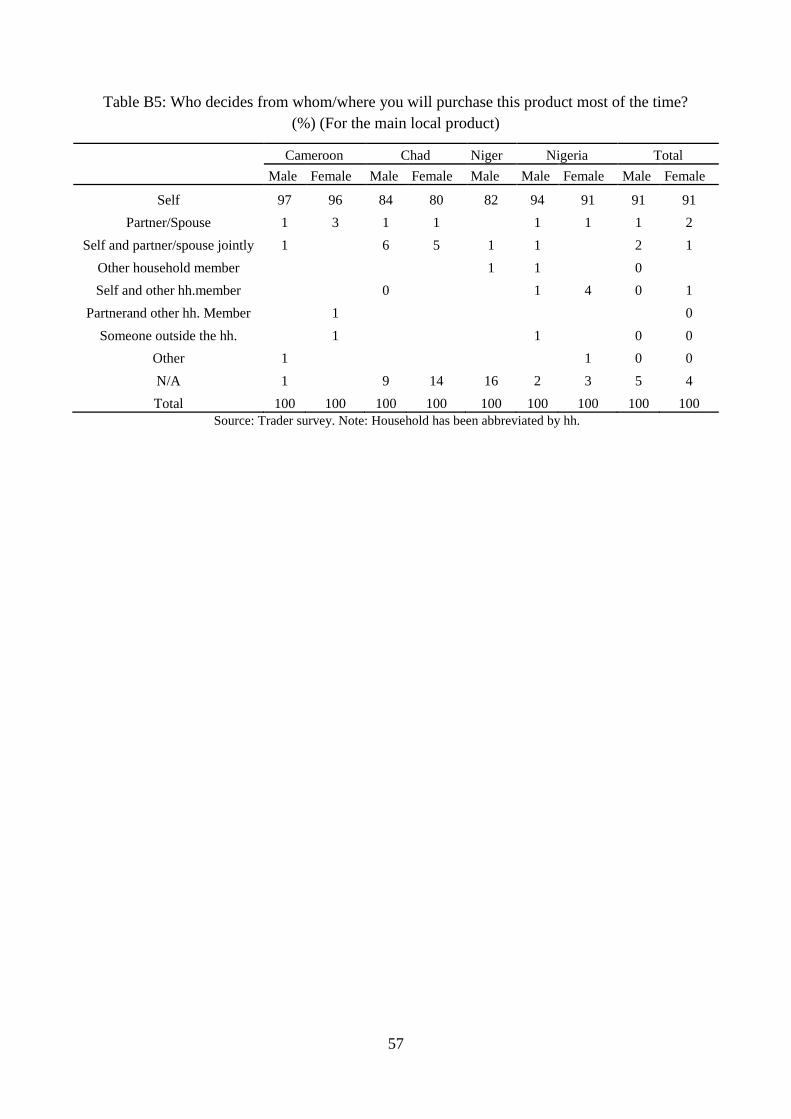
57
Table B5: Who decides from whom/where you will purchase this product most of the time?
(%) (For the main local product)
Cameroon Chad Niger Nigeria Total
Male Female Male Female Male Male Female Male Female
Self 97 96 84 80 82 94 91 91 91
Partner/Spouse 1 3 1 1 1 1 1 2
Self and partner/spouse jointly 1 6 5 1 1 2 1
Other household member 1 1 0
Self and other hh.member 0 1 4 0 1
Partnerand other hh. Member 1 0
Someone outside the hh. 1 1 0 0
Other 1 1 0 0
N/A 1 9 14 16 2 3 5 4
Total 100 100 100 100 100 100 100 100 100
Source: Trader survey. Note: Household has been abbreviated by hh.
58
Annex C: Limits and suggestions for improving questionnaire
design
Three different questionnaires were used for assessing the agricultural trade situation around
the Lake Chad basin: a trader questionnaire, a market questionnaire and a transporter
questionnaire. In theory, the trader questionnaire is divided in four modules: 1) General trader
characteristics, 2) Constraint and response, 3) Storage, credit and financing and 4) Volume and
supply. In practice, some questions are not in the right module, creating some confusion and
leading to redundancies. For example, the first module contains questions related to storage
while module 2 has two questions about supply.
In the module 2 entitled “constraints and response”, two questions are related to supply. The
first one is about the time of year when traders experience stockouts and the second one is about
the strategies developed by traders to cope with the price increase and / or supply problems.
The difficulty is that we do not even know if traders had already experience stockout or supply
problems, which lead to a high level of no response. The question related to the strategies has
been let blank by the enumerators one time out of five6.
The questions of the last module have been asked twice: a first time for the main national
product and the second time for the main imported product. The first difficulty comes from the
fact that the same response modalities have been included each time, which created confusion
for the enumerators: then 6 percent of the traders cited “importer rice” as their main local
product and one percent said that local rice was the main imported product (Table B1). While
these percentages of error does not seem very high, they cast doubt about the reliability of the
data.
Asking the questions related to volume and supply for the two main commodities – without
distinguishing between local and imported - would have been easier. In fact, trader survey
usually include questions about the supply source of the commodities, which enable the analyst
to determine if the product is local or imported. In the present survey, 14 percent of traders
reported their main local and imported products to be the same. It is now impossible to assess
the reliability of these response but having 4 percent of the traders whose main local and
imported goods is millet is not useful in terms of analysis.
Finally, targeting the main local and imported commodities has considerably reduced the scope
of the survey, as many traders do not sell imported commodities. In Cameroon, 82 percent of
traders did not answer the questions related to their main imported commodities (Table B1). By
contrast, in Niger 28 percent of the traders did not sell any local product as a large share of the
traditional grains comes from Nigeria and is therefore considered imported.
6 In Niger, the level of no response to this question reach 30 percent.
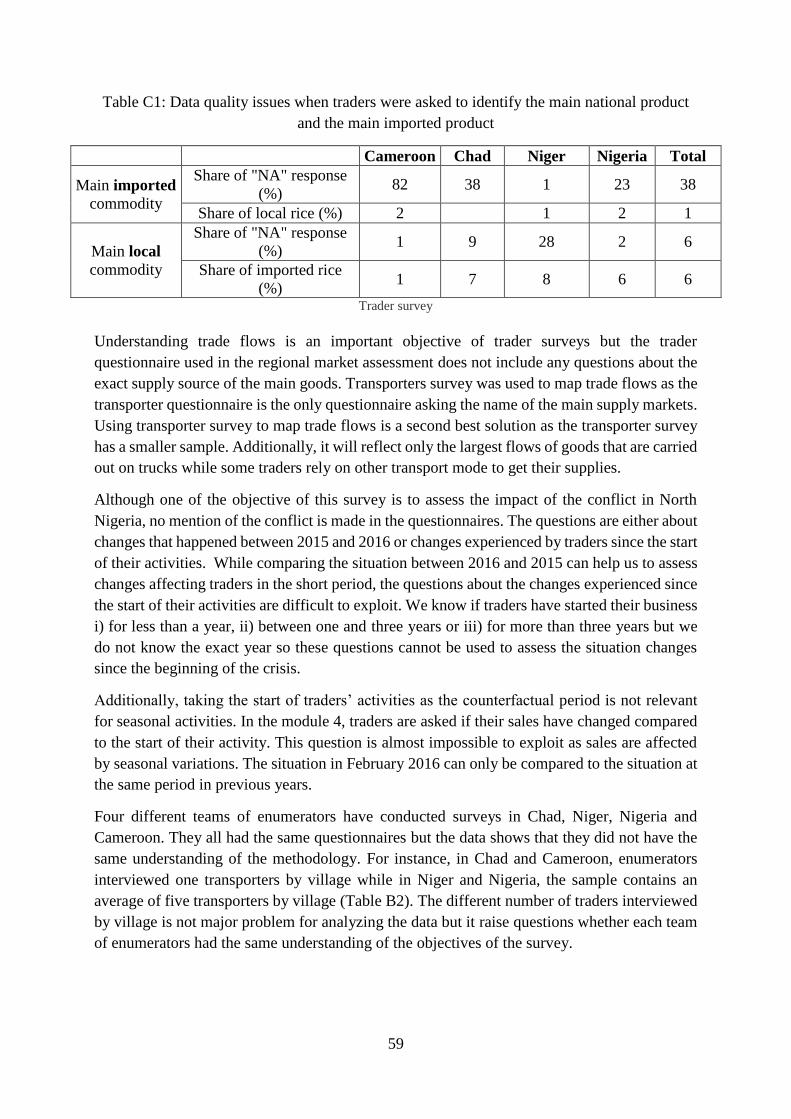
59
Table C1: Data quality issues when traders were asked to identify the main national product
and the main imported product
Cameroon Chad Niger Nigeria Total
Main imported
commodity
Share of "NA" response
(%) 82 38 1 23 38
Share of local rice (%) 2 1 2 1
Main local
commodity
Share of "NA" response
(%) 1 9 28 2 6
Share of imported rice
(%) 1 7 8 6 6
Trader survey
Understanding trade flows is an important objective of trader surveys but the trader
questionnaire used in the regional market assessment does not include any questions about the
exact supply source of the main goods. Transporters survey was used to map trade flows as the
transporter questionnaire is the only questionnaire asking the name of the main supply markets.
Using transporter survey to map trade flows is a second best solution as the transporter survey
has a smaller sample. Additionally, it will reflect only the largest flows of goods that are carried
out on trucks while some traders rely on other transport mode to get their supplies.
Although one of the objective of this survey is to assess the impact of the conflict in North
Nigeria, no mention of the conflict is made in the questionnaires. The questions are either about
changes that happened between 2015 and 2016 or changes experienced by traders since the start
of their activities. While comparing the situation between 2016 and 2015 can help us to assess
changes affecting traders in the short period, the questions about the changes experienced since
the start of their activities are difficult to exploit. We know if traders have started their business
i) for less than a year, ii) between one and three years or iii) for more than three years but we
do not know the exact year so these questions cannot be used to assess the situation changes
since the beginning of the crisis.
Additionally, taking the start of traders’ activities as the counterfactual period is not relevant
for seasonal activities. In the module 4, traders are asked if their sales have changed compared
to the start of their activity. This question is almost impossible to exploit as sales are affected
by seasonal variations. The situation in February 2016 can only be compared to the situation at
the same period in previous years.
Four different teams of enumerators have conducted surveys in Chad, Niger, Nigeria and
Cameroon. They all had the same questionnaires but the data shows that they did not have the
same understanding of the methodology. For instance, in Chad and Cameroon, enumerators
interviewed one transporters by village while in Niger and Nigeria, the sample contains an
average of five transporters by village (Table B2). The different number of traders interviewed
by village is not major problem for analyzing the data but it raise questions whether each team
of enumerators had the same understanding of the objectives of the survey.
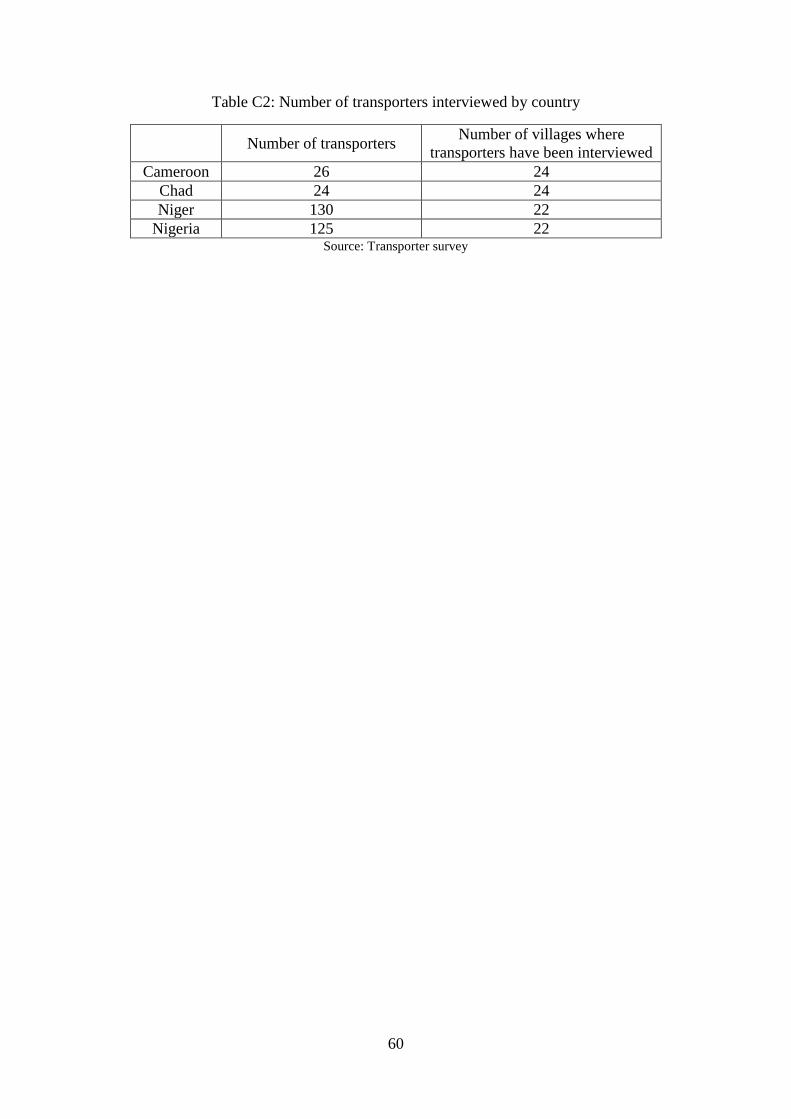
60
Table C2: Number of transporters interviewed by country
Number of transporters Number of villages where
transporters have been interviewed
Cameroon 26 24
Chad 24 24
Niger 130 22
Nigeria 125 22 Source: Transporter survey
61
All rights reserved. Reproduction and dissemination of material in this information product for
educational or other non-commercial uses are authorized without any prior written permission
from the copyright holders provided the source is fully acknowledged. Reproduction of
material in this information product for resale or other commercial purposes is prohibited
without written permission. Applications for such permission should be addressed to
The designations employed and the presentation of material in the map(s) do not imply the
expression of any opinion whatsoever of WFP concerning the legal or constitutional status of
any country, territory or sea area, or concerning the delimitation of frontiers.
© WFP 2016
Photo credits
Front cover: WFP/Alexis Masciarelli ;
All food security assessment reports are available online: vam.wfp.org
Contact: West African VAM team
For further information: [email protected]
Website: http://www.wfp.org/food-security
Twitter: @wfpvam