Embed Size (px)
Citation preview

Page 1 Florida Center for Community Design and Research, University of South Florida
Lake Assessment Report for Lake Williams
in Hillsborough County, Florida
Date Assessed: July 5, 2013 Assessed by: David Eilers Reviewed by: Jim Griffin
INTRODUCTION
This assessment was conducted to update existing physical and ecological data for Lake Wil-liams on the Hillsborough County & City of Tampa Water Atlas. The project is a collaborative ef-fort between the University of South Florida’s Center for Community Design and Research and Hillsborough County Stormwater Management Section. The project is funded by Hillsborough County and the Southwest Florida Water Management District. The project has, as its primary goal, the rapid assessing of up to 150 lakes in Hillsborough County during a five-year period. The product of these investigations will provide the County, lake property owners and the general pub-lic a better understanding of the general health of Hillsborough County lakes, in terms of shoreline development, water quality, lake morphology (bottom contour, volume, area, etc.) and the plant biomass and species diversity. These data are intended to assist the County and its citizens to better manage lakes and lake-centered watersheds.
Figure 1. General Photograph of Lake Williams.

Page 2 Florida Center for Community Design and Research, University of South Florida
The first section of the report provides the results of the overall morphological assessment of the lake. Primary data products include: a contour (bathymetric) map of the lake, area, volume and depth statistics, and the water level at the time of assessment. These data are useful for evaluating trends and for developing management actions such as plant management where depth and lake volume are needed.
The second section provides the results of the vegetation assessment conducted on the lake. These results can be used to better understand and manage vegetation in the lake. A list is pro-vided with the different plant species found at various sites around the lake. Potentially invasive, exotic (non-native) species are identified in a plant list and the percent of exotics is presented in a summary table. Watershed values provide a means of reference.
The third section provides the results of the water quality sampling of the lake. Both field data and laboratory data are presented. The trophic state index (TSI)
i is used to develop a general
lake health statement, which is calculated for both the water column with vegetation and the wa-ter column if vegetation were removed. These data are derived from the water chemistry and vegetative submerged biomass assessments and are useful in understanding the results of cer-tain lake vegetation management practices.
The intent of this assessment is to provide a starting point from which to track changes in the lake, and where previous comprehensive assessment data is available, to track changes in the lake’s general health. These data can provide the information needed to determine changes and to monitor trends in physical condition and ecological health of the lake.
Section 1: Lake Morphology
Bathymetric Mapii.
i The trophic state index is used by the Water Atlas to provide the public with an estimate of their lake resource quality. For more information, see end note 1. ii A bathymetric map is a map that accurately depicts all of the various depths of a water body. An
accurate bathymetric map is important for effective herbicide application and can be an important tool when deciding which form of management is most appropriate for a water body. Lake vol-umes, hydraulic retention time and carrying capacity are important parts of lake management that require the use of a bathymetric map.

Page 3 Florida Center for Community Design and Research, University of South Florida
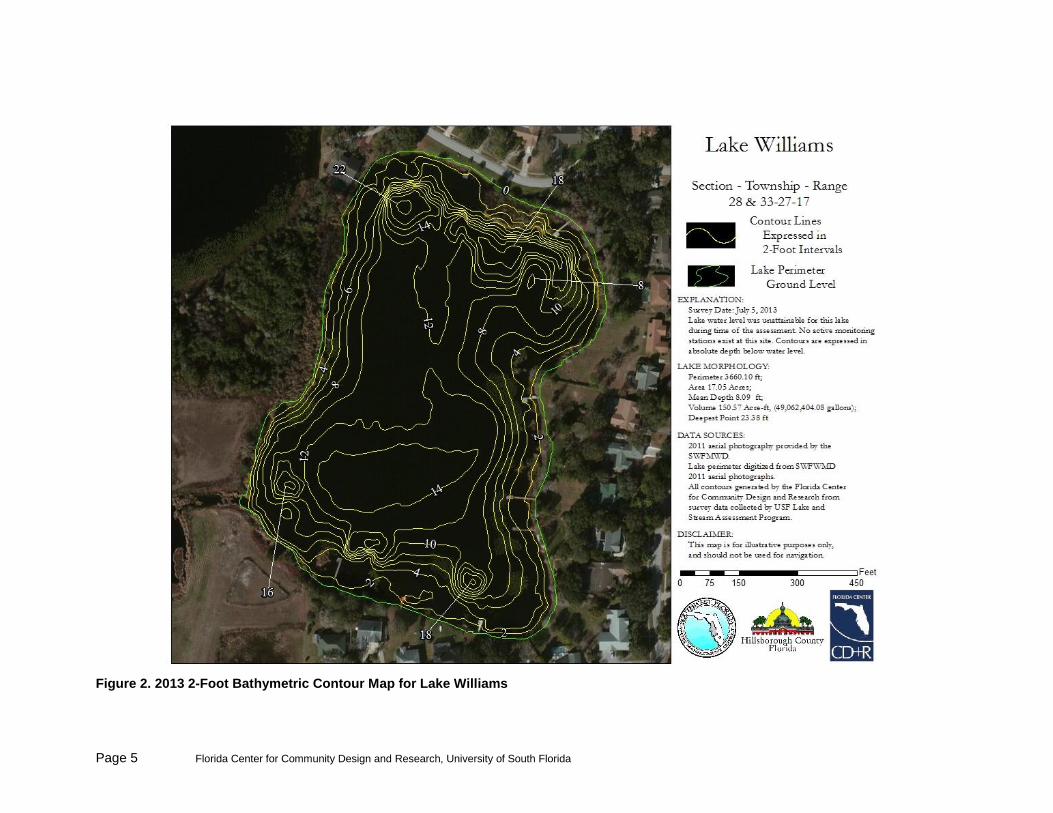
Table 1 provides the lake’s morphologic parameters in various units. The bottom of the lake was mapped using a Lowrance LCX 28C HD or Lowrance HDS 5 Wide Area Augmentation System (WAAS)
iii enabled Global Positioning System (GPS) with fathometer (bottom sounder) to deter-
mine the boat’s position, and bottom depth in a single measurement. The result is an estimate of the lake’s area, mean and maximum depths, and volume and the creation of a bottom contour map (Figure 2). Besides pointing out the deeper fishing holes in the lake, the morphologic data derived from this part of the assessment can be valuable to overall management of the lake vege-tation as well as providing flood storage data for flood models.
iii WAAS is a form of differential GPS (DGPS) where data from 25 ground reference stations lo-
cated in the United States receive GPS signals form GPS satellites in view and retransmit these data to a master control site and then to geostationary satellites. For more information, see end note 2.

Page 4 Florida Center for Community Design and Research, University of South Florida
Table 1. Lake Morphologic Data (Area, Depth and Volume)
Parameter Feet Meters Acres Acre-Ft Gallons
Surface Area (sq) 670,824 62,322 15.40 0 0
Mean Depth 8.09 2.47 0 0 0
Maximum Depth 23.38 7.13 0 0 0
Volume (cubic) 6,558,689 185,721 0 150.60 49,062,404
Gauge (relative) Unavailable 0 0 0 0
Page 5 Florida Center for Community Design and Research, University of South Florida
Figure 2. 2013 2-Foot Bathymetric Contour Map for Lake Williams
Page 6 Florida Center for Community Design and Research, University of South Florida
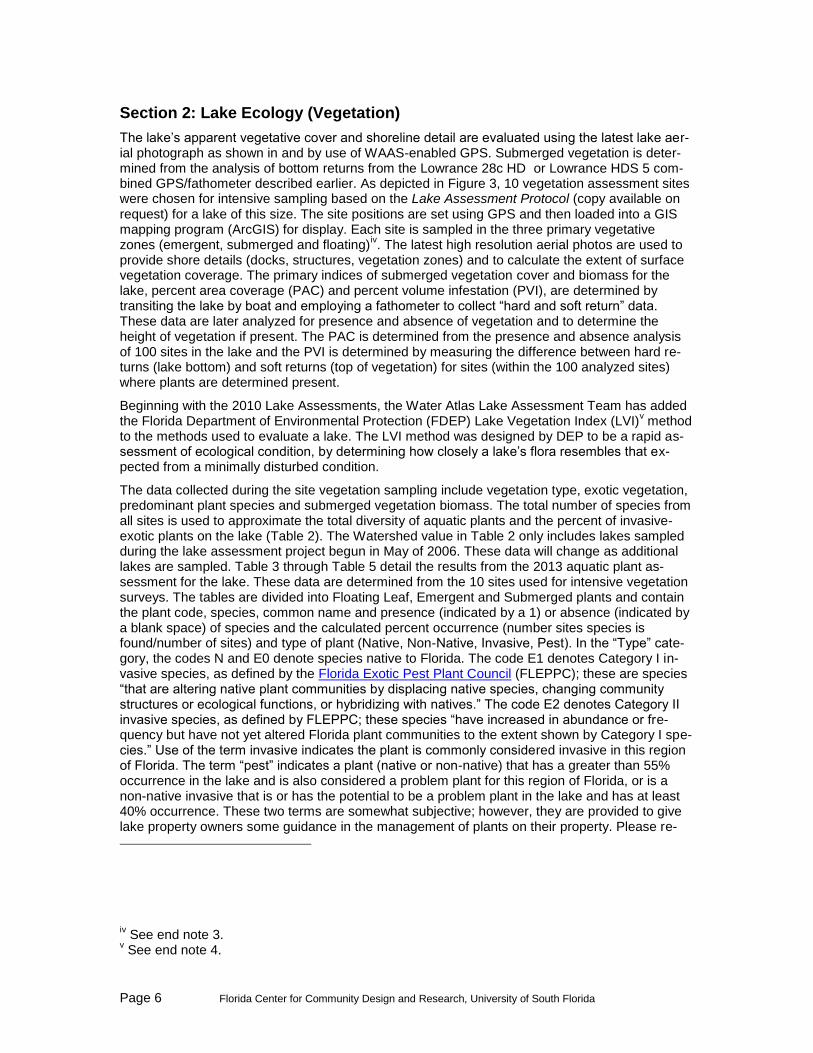
Section 2: Lake Ecology (Vegetation)
The lake’s apparent vegetative cover and shoreline detail are evaluated using the latest lake aer-ial photograph as shown in and by use of WAAS-enabled GPS. Submerged vegetation is deter-mined from the analysis of bottom returns from the Lowrance 28c HD or Lowrance HDS 5 com-bined GPS/fathometer described earlier. As depicted in Figure 3, 10 vegetation assessment sites were chosen for intensive sampling based on the Lake Assessment Protocol (copy available on request) for a lake of this size. The site positions are set using GPS and then loaded into a GIS mapping program (ArcGIS) for display. Each site is sampled in the three primary vegetative zones (emergent, submerged and floating)
iv. The latest high resolution aerial photos are used to
provide shore details (docks, structures, vegetation zones) and to calculate the extent of surface vegetation coverage. The primary indices of submerged vegetation cover and biomass for the lake, percent area coverage (PAC) and percent volume infestation (PVI), are determined by transiting the lake by boat and employing a fathometer to collect “hard and soft return” data. These data are later analyzed for presence and absence of vegetation and to determine the height of vegetation if present. The PAC is determined from the presence and absence analysis of 100 sites in the lake and the PVI is determined by measuring the difference between hard re-turns (lake bottom) and soft returns (top of vegetation) for sites (within the 100 analyzed sites) where plants are determined present.
Beginning with the 2010 Lake Assessments, the Water Atlas Lake Assessment Team has added the Florida Department of Environmental Protection (FDEP) Lake Vegetation Index (LVI)
v method
to the methods used to evaluate a lake. The LVI method was designed by DEP to be a rapid as-sessment of ecological condition, by determining how closely a lake’s flora resembles that ex-pected from a minimally disturbed condition.
The data collected during the site vegetation sampling include vegetation type, exotic vegetation, predominant plant species and submerged vegetation biomass. The total number of species from all sites is used to approximate the total diversity of aquatic plants and the percent of invasive-exotic plants on the lake (Table 2). The Watershed value in Table 2 only includes lakes sampled during the lake assessment project begun in May of 2006. These data will change as additional lakes are sampled. Table 3 through Table 5 detail the results from the 2013 aquatic plant as-sessment for the lake. These data are determined from the 10 sites used for intensive vegetation surveys. The tables are divided into Floating Leaf, Emergent and Submerged plants and contain the plant code, species, common name and presence (indicated by a 1) or absence (indicated by a blank space) of species and the calculated percent occurrence (number sites species is found/number of sites) and type of plant (Native, Non-Native, Invasive, Pest). In the “Type” cate-gory, the codes N and E0 denote species native to Florida. The code E1 denotes Category I in-vasive species, as defined by the Florida Exotic Pest Plant Council (FLEPPC); these are species “that are altering native plant communities by displacing native species, changing community structures or ecological functions, or hybridizing with natives.” The code E2 denotes Category II invasive species, as defined by FLEPPC; these species “have increased in abundance or fre-quency but have not yet altered Florida plant communities to the extent shown by Category I spe-cies.” Use of the term invasive indicates the plant is commonly considered invasive in this region of Florida. The term “pest” indicates a plant (native or non-native) that has a greater than 55% occurrence in the lake and is also considered a problem plant for this region of Florida, or is a non-native invasive that is or has the potential to be a problem plant in the lake and has at least 40% occurrence. These two terms are somewhat subjective; however, they are provided to give lake property owners some guidance in the management of plants on their property. Please re-
iv See end note 3.
v See end note 4.

Page 7 Florida Center for Community Design and Research, University of South Florida
member that to remove or control plants in a wetland (lake shoreline) in Hillsborough County the property owner must secure an Application To Perform Miscellaneous Activities In Wetlands permit from the Environmental Protection Commission of Hillsborough County and for management of in-lake vegetation outside the wetland fringe (for lakes with an area greater than ten acres), the property owner must secure a Florida Department of Environmental Protection Aquatic Plant Re-moval Permit.
Table 2. Total Diversity, Percent Exotics, and Number of Pest Plant Species
Parameter Lake Watershed
Number of Vegetation Assessment Sites 10 72
Total Plant Diversity (# of Taxa) 52 102
% Non-Native Plants 30 17
Total Pest Plant Species 3 6

Page 8 Florida Center for Community Design and Research, University of South Florida
Figure 3. 2013 Vegetation Assessment Site Map for Lake Williams

Page 9 Florida Center for Community Design and Research, University of South Florida
Table 3. List of Floating Leaf Zone Aquatic Plants Found
Plant Species Code Scientific Name Common Name Percent Occurrence Type
NLM Nuphar advena Spatterdock, Yellow Pondlily 90% N, E0
ECS Eichhornia crassipes Water Hyacinth 70% E1, P
SMA Salvinia minima Water Spangles, Water Fern 40% E1
LSA Limnobium spongia American Spongeplant, Frog's Bit 10% N, E0

Page 10 Florida Center for Community Design and Research, University of South Florida
Figure 4. Spatterdock, nuphar advena, was a common floating leaved vegetation on Lake Williams

Page 11 Florida Center for Community Design and Research, University of South Florida
Table 4. List of Emergent Zone Aquatic Plants Found
Plant Species Code Scientific Name Common Name Percent Occurrence Type
TYP Typha spp. Cattails 90% N, E0
MSS Mikania scandens Climbing Hempvine 80% N, E0
LPA Ludwigia peruviana Peruvian Primrosewillow 80% E1
APS Alternanthera philoxeroides Alligator Weed 80% E2, P
PRS Panicum repens Torpedo Grass 80% E1, P
HYE Hydrocotyle umbellata Manyflower Marshpennywort, Water Pennywort 60% N, E0
SCS Oxycaryum cubense Burhead Sedge, Cuban Scirpus, Cuban Bulrush 60% E0
QLA Quercus laurifolia Laurel Oak; Diamond Oak 50% N, E0
LRS Ludwigia repens Creeping Primrosewillow, Red Ludwigia 40% N, E0
WAX Myrica cerifera Southern Bayberry; Wax Myrtle 40% N, E0
CCA Cinnamomum camphora Camphor-tree 30% E1
COM Commelina spp. Dayflower 30% N, E0
EUP Eupatorium capillifolium Dog Fennel 30% N, E0
VRA Vitis rotundifolia Muscadine Grape 30% N, E0
SCA Salix caroliniana Carolina Willow 30% N, E0
PCA Pontederia cordata Pickerel Weed 30% N, E0
PQA Parthenocissus quinquefolia Virginia Creeper, Woodbine 20% N, E0
TAS Taxodium acendens Pond Cypress 20% N, E0
CYO Cyperus odoratus Fragrant Flatsedge 20% N, E0
LOA Ludwigia arcuata Piedmont Primrosewillow 20% N, E0
AAA Ampelopsis arborea Peppervine 10% N, E0
IVA Iris virginica Southern Blue Flag 10% N, E0
JES Juncus effusus subsp. Solutus Soft Rush 10% N, E0
JUM Juncus marginatus Shore Rush, Grassleaf Rush 10% N, E0
LLA Ludwigia leptocarpa Anglestem Primrosewillow 10% N, E0
CYP Cyperus spp. Sedge 10% E0
ERH Erechtites hieraciifolia Fireweed 10% N, E0
COS Cephalanthus occidentalis Buttonbush 10% N, E0
FCA Fraxinus caroliniana Carolina Ash, Water Ash, Pop Ash 10% N, E0
GTM Galium tinctorium Marsh Bedstraw 10% N, E0
HRS Habenaria repens Waterspider False Reinorchid 10% N, E0
QNA Quercus nigra Water Oak 10% N, E0
SAM Sambucus nigra subsp. Canadensis Elderberry 10% N, E0
SMI Smilax spp. Catbriar, Greenbriar 10% N, E0
SPO Sabal palmetto Sabal Palm, Cabbage Palm 10% N, E0

Page 12 Florida Center for Community Design and Research, University of South Florida
Plant Species Code Scientific Name Common Name Percent Occurrence Type
PRA Pluchea baccharis Rosy Camphorweed 10% N, E0
MUS Musa spp. Banana Tree 10% E0
MVA Magnolia virginiana Sweetbay Magnolia 10% N, E0
PHN Panicum hemitomon Maidencane 10% N, E0
PHS Polygonum hydropiperoides Mild Waterpepper; Swamp Smartweed 10% N, E0
PIN Pinus spp. Pine Tree 10% N, E0
WTA Sphagneticola trilobata Creeping Oxeye; Wedelia 10% E2

Page 13 Florida Center for Community Design and Research, University of South Florida
Figure 5. Cattails, Typha spp., was the dominant species in the emergent vegetation zone.

Page 14 Florida Center for Community Design and Research, University of South Florida
Table 5. List of Submerged Zone Aquatic Plants Found.
Plant Species Code Scientific Name Common Name Percent Occurrence Type
NGS Najas guadalupensis Southern Naiad 80% N, E0
BMI Bacopa monnieri Common Bacopa 60% N, E0
CHA Chara spp. Muskgrass 60% N, E0
EBI Eleocharis baldwinii Baldwin's Spikerush, Roadgrass 30% N, E0
HVA Hydrilla verticillata Hydrilla, waterthyme 20% E1
UFS Utricularia foliosa Leafy Bladderwort 10% N, E0

Page 15 Florida Center for Community Design and Research, University of South Florida
Figure 6. Hydrilla, a submerged non-native invasive species, was found on Lake Williams

Page 16 Florida Center for Community Design and Research, University of South Florida
Table 6. List of All Plants and Sample Sites
Plant Common Name Found at Sample Sites Percent Occurrence
Growth Type
Cattails 1,2,3,4,5,6,7,8,9 90 Emergent
Spatterdock, Yellow Pondlily 1,2,3,4,5,6,7,8,10 90 Floating
Alligator Weed 1,2,3,4,5,6,7,10 80 Emergent
Climbing Hempvine 1,2,3,4,5,7,9,10 80 Emergent
Peruvian Primrosewillow 1,2,3,4,5,7,9,10 80 Emergent
Southern Naiad 1,2,3,4,6,7,8,9 80 Submersed
Torpedo Grass 1,2,3,4,5,6,7,8 80 Emergent
Water Hyacinth 1,2,3,4,7,8,9 70 Floating
Burhead Sedge, Cuban Scirpus, Cuban Bulrush 1,2,4,5,7,9 60 Emergent
Common Bacopa 1,3,4,6,7,10 60 Submersed
Manyflower Marshpennywort, Water Pennywort 1,2,3,4,5,6 60 Emergent
Muskgrass 1,3,4,5,6,10 60 Submersed
Laurel Oak; Diamond Oak 1,3,4,7,8 50 Emergent
Creeping Primrosewillow, Red Ludwigia 1,2,3,10 40 Emergent
Southern Bayberry; Wax Myrtle 1,7,8,9 40 Emergent
Water Spangles, Water Fern 1,2,4,5 40 Floating
Baldwin's Spikerush, Roadgrass 1,2,3 30 Submersed
Camphor-tree 2,3,7 30 Emergent
Carolina Willow 1,6,9 30 Emergent
Dayflower 1,2,3 30 Emergent
Dog Fennel 1,4,10 30 Emergent
Muscadine Grape 4,8,9 30 Emergent
Pickerel Weed 1,5,6 30 Emergent
Fragrant Flatsedge 1,2 20 Emergent
Hydrilla, waterthyme 6,10 20 Submersed
Piedmont Primrosewillow 2,6 20 Emergent
Pond Cypress 2,4 20 Emergent
Virginia Creeper, Woodbine 2,4 20 Emergent
American Spongeplant, Frog's Bit 7 10 Floating
Anglestem Primrosewillow 1 10 Emergent
Banana Tree 2 10 Emergent
Buttonbush 9 10 Emergent

Page 17 Florida Center for Community Design and Research, University of South Florida
Plant Common Name Found at Sample Sites Percent Occurrence
Growth Type
Carolina Ash, Water Ash, Pop Ash 4 10 Emergent
Catbriar, Greenbriar 3 10 Emergent
Creeping Oxeye; Wedelia 4 10 Emergent
Elderberry 7 10 Emergent
Fireweed 1 10 Terrestrial
Leafy Bladderwort 8 10 Submersed
Maidencane 5 10 Emergent
Marsh Bedstraw 2 10 Emergent
Mild Waterpepper; Swamp Smartweed 2 10 Emergent
Peppervine 2 10 Emergent
Pine Tree 1 10 Emergent
Rosy Camphorweed 1 10 Emergent
Sabal Palm, Cabbage Palm 8 10 Terrestrial
Sedge 3 10 Emergent
Shore Rush, Grassleaf Rush 1 10 Emergent
Soft Rush 4 10 Emergent
Southern Blue Flag 4 10 Emergent
Sweetbay Magnolia 2 10 Emergent
Water Oak 4 10 Emergent
Waterspider False Reinorchid 2 10 Emergent

Page 18 Florida Center for Community Design and Research, University of South Florida
Section 3: Long-term Ambient Water Chemistry
A critical element in any lake assessment is the long-term water chemistry data set. These data are obtained from several data sources that are available to the Water Atlas and are managed in the Water Atlas Data Download and graphically presented on the water quality page for lakes in Hillsborough County. The Lake Williams Water Quality Page can be viewed at
http://www.hillsborough.wateratlas.usf.edu/lake/waterquality.asp?wbodyid=5152&wbod
yatlas=lake).
Beginning with the 2012 Assessment Report, the long term Ambient Water Chemistry section of the report will include evaluations based on both the Trophic State Index (TSI) and the new Nu-
meric Nutrient Criteria (NNC) for lakes. See the April 2013 report on the Implementation of
Florida’s NNC and other documents concerning the NNC rule in the Water Atlas Digital Li-
brary (hint: use key word “62-302”, the rule Florida Administrative Code number). The long-term
water chemistry will be first evaluated based on factors that go into the determination of the TSI and then based on the NNC. A primary source of lake water chemistry in Hillsborough County is
the Florida LAKEWATCH volunteer lake monitor and the Florida LAKEWATCH laboratory at
the University of Florida. Lake Williams has never had a LAKEWATCH volunteer, which makes trend analysis impossible. Other source data are used as available; however these data can only indicate conditions at time of sampling.
Evaluation of Lake Long Term Water Chemistry Based on Trophic State Index
These data are displayed and analyzed on the Water Atlas as shown in Figure 7, Figure 8, and Figure 9 for Lake Williams. The figures are graphs of: (1) the overall trophic state index (TSI)i, which is a method commonly used to characterize the productivity of a lake, and may be thought of as a lake’s ability to support plant growth and a healthy food source for aquatic life; (2) the chlorophyll a concentration, which indicates the lake’s algal concentration, and (3) the lake’s Sec-chi Disk depth which is a measure of water visibility and depth of light penetration. These data are used to evaluate a lake’s ecological health and to provide a method of ranking lakes and are indi-cators used by the US Environmental Protection Agency (USEPA) and the Florida Department of Environmental Protection (FDEP) to determine a lake’s level of impairment. The chlorophyll a and Secchi Disk depth graphs include benchmarks which indicate the median values for the various parameters for a large number of Lakes in Florida expressed as percentiles.
Based on best available data and using the TSI methodology, Lake Williams has a color value determined as a platinum cobalt unit (pcu) value of 19 and is considered a Clear lake (has a mean color in pcu greater than 40). The FDEP and USEPA may classify a lake as impaired if the lake is a dark lake (has a mean color in pcu greater than 40) and has a TSI greater than 60, or is a clear lake and has a TSI greater than 40. Lake Williams is a clear water lake and has a TSI of 45 and meets the FDEP Impaired Waters Rule (IWR) criteria and could be classified as impaired. Under this methodology it would be classified as impaired (clear and TSI greater than 40). See also Table 7.

Page 19 Florida Center for Community Design and Research, University of South Florida
Figure 7. Recent Trophic State Index (TSI) graph for Lake Williams
vi
vi Graph source: Hillsborough County Water Atlas. For an explanation of the Good, Fair and Poor
benchmarks, please see the notes at the end of this report. For the latest data go to: http://www.hillsborough.wateratlas.usf.edu/graphs20/graph_it.aspx?wbodyid=5152&data=TSI&datatype=WQ&waterbodyatlas=lake&ny=10&bench=1

Page 20 Florida Center for Community Design and Research, University of South Florida
Figure 8. Recent Chlorophyll a graph for Lake Williams
vii
vii
Graph Source: Hillsborough County Water Atlas. For the latest data go to http://www.hillsborough.wateratlas.usf.edu/graphs20/graph_it.aspx?wbodyid=5152&data=Chla_ugl&datatype=WQ&waterbodyatlas=lake&ny=10&bench=1

Page 21 Florida Center for Community Design and Research, University of South Florida
Figure 9. Recent Secchi Disk graph for Lake Williams
viii
As part of the lake assessment the physical water quality and chemical water chemistry of a lake are measured. These data only indicate a snapshot of the lake’s water quality; however they are useful when compared to the trend data available from LAKEWATCH or other sources.
Table 7 contains the summary water quality data and index values and adjusted values calculat-ed from these data. The total phosphorus (TP), total nitrogen (TN) and chlorophyll a water chem-istry sample data are the results of chemical analysis of samples taken during the assessment and analyzed by the Hillsborough County Environmental Protection Commission laboratory.
The growth of plants (planktonic algae, macrophytic algae and rooted plants) is directly depend-ent on the available nutrients within the water column of a lake and to some extent the nutrients which are held in the sediment and the vegetation biomass of a lake. Additionally, algae and oth-
er plant growth are limited by the nutrient in lowest concentration relative to that needed by a
plant. Plant biomass contains less phosphorus by weight than nitrogen so phosphorus is many times the limiting nutrient. When both nutrients are present at a concentration in the lake so that either or both may restrict plant growth, the limiting factor is called “balanced”. The ratio of total nitrogen to total phosphorous, the “N to P” ratio (N/P), is used to determine the limiting factor. If
viii
Graph Source: Hillsborough County Water Atlas. For the latest data go to http://www.hillsborough.wateratlas.usf.edu/graphs20/graph_it.aspx?wbodyid=5152&data=secchi_ft&datatype=WQ&waterbodyatlas=lake&ny=10&bench=1

Page 22 Florida Center for Community Design and Research, University of South Florida
N/P is greater than or equal to 30, the lake is considered phosphorus limited, when this ratio is less than or equal to 10, the lake is considered nitrogen limited and if between 10 and 30 it is considered balanced.
Table 7. Water Quality Parameters (Laboratory) for Lake Williams – TSI Critera Value column provides the data based on lake assessment sampling. Mean Value is based on long-term sample values for the lake.
The color of a lake is also important to the growth of algae. Dark, tannic lakes tend to suppress algal growth and can tolerate a higher amount of nutrient in their water column; while clear lakes tend to support higher algal growth with the same amount of nutrients. The color of a lake, which is measured in a unit called the “cobalt platinum unit (PCU)” because of the standard used to de-termine color, is important because it is used by the State of Florida to determine lake impairment as explained earlier. A new rule which is being developed by USEPA and FDEP, will use alkalini-ty in addition to color to determine a second set of “clear-alkaline lakes” which will be allowed a higher TSI than a “clear-acid” lake. This is because alkaline lakes have been found to exhibit higher nutrient and algal concentrations than acid lakes. Additionally, lakes connected to a river or other “flow through” systems tend to support lower algal growth for the same amount of nutri-ent concentration. All these factors are important to the understanding of your lake’s overall con-dition. Table 7 includes many of the factors that are typically used to determine the actual state of plant growth in your lake. These data should be understood and reviewed when establishing a management plan for a lake; however, as stated above other factors must be considered when developing such a plan. Please contact the Water Atlas Program if you have questions about this part or any other part of this report.
Lake Williams has few water quality samples in the past 3 years and only 12 sampling events since 1996. Based on the available data from the sample taken during the assessment and the period of record, Lake Williams is classified as impaired by the TSI standards. According to the newer numeric nutrient criteria method, Lake Williams is not considered impaired for chlorophyll, nitrogen or phosphorous.
Parameter Assessment Value Long Term Mean Value
Lake Area (Acres) 15.40
Lake Area (m2) 62,322.00
Lake Volume (m3) 185,721.00
Number of Vegetation Sites 10
Average Station SAV Weight 0.09
Wet Weight of Vegetation (g) 942,925.64
Dry Weight of Vegetation (g) 75,434.05
Total Phosphorus (ug/L) 30.00 16.00
Total Nitrogen (ug/L) 715.00 785.18
Chlorophyll a (ug/L) 6.80 5.67
TN/TP 23.8 49.1
Limiting Nutrient Balanced Phosphorus
Chlorophyll TSI 44 41
Phosphorus TSI 44 41
Nitrogen TSI 49 51
TSI 45 41
Color (PCU) 19.00 23.50
Secchi disk depth (ft) 9.00 6.63
Impaired TSI for Lake 40 40
Lake Status (Water Column) Impaired Impaired

Page 23 Florida Center for Community Design and Research, University of South Florida
Table 88 provides data derived from the vegetation assessment which is used to determine an adjusted TSI. This is accomplished by calculating the amount of phosphorus and nitrogen that could be released by existing submerged vegetation (Adjusted Nutrient) if this vegetation were treated with an herbicide or managed by the addition of Triploid Grass Carp (Ctenopharyngodon idella). The table also shows the result of a model that calculates the potential algae, as chloro-phyll a (Adjusted Chlorophyll), which could develop due to the additional nutrients held within the plant biomass. While it would not be expected that all the vegetation would be turned into availa-ble phosphorus by these management methods, the data is useful when planning various man-agement activities. Approximately 17.00 % of the lake has submerged vegetation present (PAC) and this vegetation represents about 9.00 % of the available lake volume (PVI). Please see addi-tional parameters for adjusted values where appropriate in Table 8. The vegetation holds enough
nutrients to add about 0.57 g/L of phosphorus and 7.72 g/L of nitrogen to the water column and increase the algal growth potential within the lake.
Lake Williams is a balanced lake, in terms of limiting nutrient, and an increase in either phospho-rus or nitrogen could change the TSI and increase the potential for algal growth.
Table 8. Field parameters and calculations used to determine nutrients held in Submerged Aquatic Vegetation (SAV) biomass. TSI Criteria
Parameter Value Mean Value
% Area Covered (PAC) 17.0 %
PVI 9.0 %
Lake Vegetation Index 30
Total Phosphorus - Adjusted (ug/L) 0.57
Total Phosphorus - Combined (ug/L) 30.57
Total Nitrogen - Adjusted (ug/L) 7.72
Total Nitrogen - Combined (ug/L) 722.72
Chlorophyll - Adjusted from Total Nutrients (ug/L) 0.09
Chlorophyll - Combined (ug/L) 6.89
Adjusted Chlorophyll TSI 44
Adjusted Phosphorus TSI 45
Adjusted Nitrogen TSI 49
Adjusted TSI (for N, P, and CHLA) 45
Impaired TSI for Lake 40 40

Page 24 Florida Center for Community Design and Research, University of South Florida
Table 9 contains the field data taken in the center of the lake using a multi-probe. We use either a YSI 6000 or a Eureka Manta probe which have the ability to directly measure the temperature, pH, dissolved oxygen (DO), percent DO (calculated from DO, temperature and conductivity. These data are listed for three levels in the lake and twice for the surface measurement. The du-plicate surface measurement is taken as a quality assurance check on measured data.
The geometric mean of percent DO for this sample event is 73.44 % and for the DO is 5.81 mg/L, which is in the acceptable range for oxygen. The pH is within normal lake values for acidity. Conductivity indicates an slightly alkaline lake (>.100 mS/cm3). Based on the field collected data, Lake Williams is mixed with similar dissolved oxygen concentrations at the surface and bottom.

Page 25 Florida Center for Community Design and Research, University of South Florida
Table 9. Water Chemistry Data Based on Manta Water Chemistry Probe for Lake Williams
Sample Location
Sample Depth (m)
Time Temp (deg C)
Conductivity (mS/cm3)
Dissolved Oxygen (%)
Dissolved Oxygen (mg/L)
pH
Surface 0.43 7/29/2013 10:17:12 AM
30.53 0.172 84.80 6.67 6.67
Middle 1.52 7/29/2013 10:18:16 AM
30.05 0.172 78.70 6.24 6.65
Bottom 3.38 7/29/2013 10:19:24 AM
29.87 0.173 65.00 5.17 6.54
Middle-1 1.33 7/29/2013 10:20:09 AM
30.06 0.172 65.50 5.19 6.60
Surface-1 0.73 7/29/2013 10:21:34 AM
30.20 0.172 75.20 5.95 6.68
Geometric Mean Val-ue
1.16 7/29/2013 10:23:00 AM
30.14 0.173 73.44 5.81 6.63
To better understand many of the terms used in this report, we recommend that the reader visit
the Hillsborough County Water Atlas and explore the “Learn More” areas which are found on
the resource pages. Additional information can also be found using the Digital Library on the
Water Atlas website.

Page 26 Florida Center for Community Design and Research, University of South Florida
Evaluation of Lake Long Term Water Chemistry Based on Numeric Nutrient Criteria
On September 26, 2013, the Florida Department of Environmental Protection (FDEP) announced that the US Environmental Protection Agency (USEPA) confirmed that the state had completed its obligations to USEPA related to the establishment of the Numeric Nutrient Criteria (NNC) for estuaries, lakes, and springs and flowing freshwater streams. These criteria are now required for use in the determination of a water body impairment, that is to determine if a waterbody such as a lake meets designated use or habitat health in terms of nutrients (phosphorus and nitrogen) and response variables (chlorophyll a and dissolved oxygen). Prior to this, the Trophic State Index (TSI) was the primary indicator of lake health as this health related to nutrients and the responses by lake biota (algae, emergent, floating and submerged plants, fish and other flora and fauna liv-ing within a lake). In 2012, the Water Atlas Lake Assessment program began using TSI and the NNC rule to help determine the assessed health of a lake, we will continue with this approach but it should be realized that the only official index of nutrient related impairment for a lake is the NNC. The NNC rule is found in chapter 62-302, Surface Water Quality Standards of the Florida Admin-istrative Code (FAC). In paragraph 62-302.531 of that rule the specific nutrient criteria as they relate to lakes, springs and streams is stated. A lake is defined by the rule as a lentic (still fresh-water system) waterbody with a relatively long water residence time (time that a unit of water re-mains within the waterbody) and an open water area that is free from emergent vegetation under typical hydrologic and climate conditions. For lakes the applicable numeric interpretation of the NNC is shown in Table 10 below. There are several important aspects to the rule which are re-flected important to understand this report. First, the NNC is calculated annually based on data collected over a twelve month period. The date the sample is taken must be distributed over the twelve month period so that at least one sample is taken between May 1 and September 30 and at least one other sample is taken during the rest of the year. A total of four samples are required for an NNC to be calculated and to count, samples must be separated by a minimum of one week. There are other important data related elements of the rule that must also be met for lakes. Lakes are classified as “dark” or “clear” based on the amount of color measured as “true color”. True color is measured based on a relationship to a platinum-cobalt dye and given a measure of platinum-cobalt unit or PCU. A dark lake has a true color greater than 40 PCU. Color must be recorded as “long term” true color which means that at least 10 samples have been tak-en over at least three years with at least one sample each year. The other type classification for lakes is a measure of the lakes “alkalinity”. An alkaline lake has a high concentration of calcium carbonate which acts as a buffer to prevent changes in pH. Alkalinity is determined by measuring calcium carbonate (CaCO3) concentrations which is expressed as CaCO3 Alkalinity in milligrams per liter (mg/L). Alkalinity has the same time related rule as color and an alkaline lake is one with a CaCO3 Alkalinity greater than 20 mg/L. The NNC rule then provides an acceptable concentration limit for chlorophyll a (response varia-ble) and related nutrient concentrations. If a lake has adequate data to determine chlorophyll a concentration based on a statistic called the geometric mean. The geometric mean is similar to an average but based on the square root of the product of values instead of the sum of values divided by the number of values. If the chlorophyll a criteria in the table are met for a year then the NNC is based on the maximum value in the table. If it is not met, then the minimum table val-ue must be used. A lake’s annual mean for TN or TP cannot exceed the limit more than one time in a 3 year period. One final criterion is applied for lake and stream phosphorus concentration maximum for the West Central region which includes Hillsborough County (Figure 11) except for the Odessa lake region. Dark lakes in this region have a phosphorus maximum of 0.49 mg/L.

Page 27 Florida Center for Community Design and Research, University of South Florida
Table 10 . Lakes chlorophyll a, TN, and TP criteria.
1 For lakes with color > 40 PCU in the West Central Nutrient Watershed Region, the maximum TP
limit is 0.49 mg/L, which is the TP streams threshold for the region. Table 11 below provides an assessment based on the NNC rule. To have sufficient nutrient and chlorophyll samples to calculate a geometric mean the lake required 4 samples annually with at least one sample taken between May and September of the year and one or more samples in the other months with at least one week between samples. To determine if a lake is clear or dark “true color” must be used and a long term geometric mean calculated. At least 10 lake samples must be available which represent at least a 3 year period and at least one sample must be from each of the three years. To determine if a lake is alkaline or acid, the same numeric requirements are required as for color. Alkalinity must be expressed as CaCO3 alkalinity; however if these data are not available, then conductivity can be used until adequate alkalinity is available. A conduc-tivity of a value of <100 micromhos/cm used to estimate the 20 mg/L CaCO3 alkalinity concentra-tion until such time that alkalinity data are available. A primary data source for lakes in Hillsborough County is LAKEWATCH and since the LAKE-WATCH laboratory does not determine corrected chlorophyll a this parameter does not meet NNC requirements. Since this will be the case for the majority of Hillsborough County Lakes, we are using modified criteria where uncorrected chlorophyll a is used. We also use data even when the number of sample criteria is not met, and indicate the actual number expected based on the long term geomean of parameters. The assessment NNC is not an official value, but does assist in understanding both the data needs and the expected NNC related evaluation.

Page 28 Florida Center for Community Design and Research, University of South Florida
Table 11. Estimate of potential impairment based on last 3 years of data and the
NNC Rule
Lake Lake Williams
Geometric Mean (Geomean) Color (pcu) 25.58
Number of Samples 10 (need 10)
Geometric Mean Specific Conductance umhos 213.7
Number of Samples 10 (need 10)
Lake Type Clear Alkaline
Chlorophyll a Criteria (ug/L) ≤ 20 µg/l
Sufficient for Geomean & Geomean Chla meets Chla Criteria then P
mg/L 0.03 – 0.09 mg/l
Insuffcient for Geomean or Geomean Chla does not meet Chla Crite-
ria then P mg/L ≤ 0.03 mg/l
Sufficient for Geomean & Geomean Chla meets Chla Criteria then N
mg/L 1.05 – 1.91 mg/l
Insuffcient for Geomean or Geomean Chla does not meet Chla Crite-
ria then N mg/L ≤ 1.05 mg/l
Geomean Chla ug/L 5.40
Geomean TP mg/L 0.015
Geomean TN mg/L 0.665
Number of Samples 11
Potential Impaired Chlorophyll a Not Impaired
Potential Impaired TP Not Impaired
Potential Impaired TN Not Impaired
The sample results given in Table 11 indicate that Lake Williams would be classified as a clear alkaline lake with a chlorophyll a value below the NNC requirement for this type lake. By the rule criteria for nutrients (Table 10), the geometric mean of TP must be below 0.09 mg/L (or if insuffi-cient data exists below or equal to 0.03 mg/L) and by Table 11, this criteria is not exceeded and the lake would be expected to pass the NNC for phosphorus. For nitrogen, the criteria is 1.91 mg/L (or if insufficient data exists below or equal to 1.05 mg/L) and the data in Table 11 this crite-ria is not exceeded and the lake would be expected to pass the NNC for nitrogen. However this is based on the use of specific conductance as a substitute for alkalinity. There are 6 alkalinity sam-ples available for Lake Williams. These samples indicate that Lake Williams is acidic with a geo-metric mean of 16.34 mg/L CaCO3. If there were sufficient alkalinity data available for the lake to classify it as a clear acidic lake, then a new set of criteria would need to be used. A clear acidic lake would have a chlorophyll criteria of ≤ 6 µg/l, nitrogen ≤ 0.51 mg/l and phosphorous ≤ 0.01 mg/l. under these conditions Lake Williams would exceed the phosphorous and nitrogen criteria. We must emphasis that this assessment only suggests that an impairment exists or does not, based on the NNC rule.

Page 29 Florida Center for Community Design and Research, University of South Florida
Section 4: Conclusion
Lake Williams is a medium area (15.4-acre) lake that would be considered in the Eutrophic category of lakes based on water chemistry. It has a plant diversity of 52 species relative to the total watershed plant diversity of 102 species with about 17.00 % percent of the open water areas containing submerged aquatic vegetation. Vegetation helps to maintain the nutrient balance in the lake as well as provide good fish habitat. The lake has many open water areas to support various types of recreation and has a fair diversity of plant species. The primary pest plants in the lake include eichhornia crassipes, alternanthera philoxeroides and panicum repens.
The lake vegetative assessment also was used to calculate a Lake Vegetative Index (LVI) for the lake (See Note 4). The LVI can be used to help determine if a lake is impaired in terms of types and quantities of vegetation found in and along the lake shore. An LVI threshold of 37 is used by FDEP to establish a point below which the lake could be considered heavily disturbed and possibly impaired. This threshold is intended to assist the analyst in classifying a lake as impaired when used with water quality data. For ex-ample, a clear water lake may have a TSI of 42 but have an LVI of 70. Since the LVI is significantly above the threshold and indicates low human disturbance, the analyst might declare the lake unimpaired even with a TSI slightly above the water quality threshold for a clear lake. Your lake has an LVI of 30 and would be considered impaired based on LVI alone.
By the lake nutrient impairment standards in place prior to November 2012 a clear water lake would re-quire a TSI of 40 or below to not be considered impaired and if a dark water lake it would require a TSI of 60 or below to not be considered impaired. This lake is a clear lake and has a TSI of 45 and is considered impaired based on analysis of the single sample from the assessment. By the new numeric nutrient standards if the lake is clear and acid then it must have chlorophyll a concentration of less than or equal to 6 μg/L and meet certain nitrogen and phosphorous concentration limitations and if it is a dark lake or a clear alkaline lake then it must have a chlorophyll a concentration below 20 μg/L and meet certain nitro-gen and phosphorous concentration limitations. Based on the limited data, this lake is a clear alkaline wa-ter lake and would not be considered impaired by these criteria. The major difference for the two ap-proaches is that alkalinity was not considered in determining lake type and lake criteria for the TSI ap-proach as it was in the NNC approach. Using all metrics (TSI, NNC and LVI) for determining impairment for this lake, we would consider this lake to be possibly impaired. This determination relies on the low LVI, high TSI and the data that indicates that the lake may be acid based on CaCO3 alkalinity.
This assessment was accomplished to assist lake property owners to better understand and manage their lakes. Hillsborough County supports this effort as part of their Lake Management Program (LaMP) and has developed guidelines for lake property owner groups to join the LaMP and receive specific assistance from the County in the management of their lake. For additional information and recent updates please visit the Hillsborough County & City of Tampa Water Atlas website.

Page 30 Florida Center for Community Design and Research, University of South Florida
Lake Assessment Notes
1. The trophic state index is used by the Water Atlas to provide the public with an estimate of their lake resource quality. A "Good" quality lake is one that meets all lake use criteria (swimmable, fishable and supports healthy habitat). Based on the discussion above, lakes that are in the oligotrophic through low eutrophic range, for the most part, meet these criteria. A trophic state below 60 indicates lakes in this range and these lakes are given the "Good" descriptor. A trophic state above 60 but be-low 70 can be considered highly productive and a reasonable lake for fishing and most water sports. This lake is considered "Fair", while a lake in the Hypereutrophic range with a TSI greater than 70 will probably not meet the lake use criteria and these lakes are considered to be poor. Please see Table 12 below.
Table 12. Comparison of Classification Schemes
Trophic State Index Trophic State Classi-
fication Water Quality
0 – 59 Oligotrophic through Mid-Eutrophic
Good
60 – 69 Mid-Eutrophic through Eutrophic
Fair
70 – 100 Hypereutrophic Poor
Also see the Florida LAKEWATCH publication, "Trophic State: A Waterbody's Ability to Support Plants Fish and Wildlife" and the Trophic State Index Learn More page on the Hillsborough County Water Atlas.
In recent years FDEP staff have encountered problems interpreting Secchi depth data in many tannic (tea or coffee-colored) waterbodies where transparency is often reduced due to naturally-occurring dissolved organic matter in the water. As a result, Secchi depth has been dropped as an indicator in FDEP's recent TSI calculations (1996 Water-Quality Assessment for The State of Florida Section 305(b) Main Report). This modification for black water TSI calculation has also been adopted by the Water Atlas.
Also, according to Florida LAKEWATCH use of the TSI is often misinterpreted and/or misused from its original purpose, which is simply to describe biological productivity. It is not meant to rate a lake's water quality. For example, higher TSI values represent lakes that support an abundance of algae, plants and wildlife. If you love to fish, this type of lake would not be considered to have "poor" water quality. However, if you are a swimmer or water skier, you might prefer a lake with lower TSI values.
The trophic state index is one of several methods used to describe the biological productivity of a wa-terbody. Two scientists, Forsberg and Ryding, 1980, developed another method that is widely used. It's known as the Trophic State Classification System. Using this method, waterbodies can be grouped into one of four categories, called trophic states:
Oligotrophic (oh-lig-oh-TROH-fik) where waterbodies have the lowest level of productivity;
Mesotrophic (mees-oh-TROH-fik) where waterbodies have a moderate level of biological productivi-ty;
Eutrophic (you-TROH-fik) where waterbodies have a high level of biological productivity;
Hypereutrophic (HI-per-you-TROH-fik) where waterbodies have the highest level of biological productivity. The trophic state of a waterbody can also affect its use or perceived utility. Figure 10 il-lustrates this concept.

Page 31 Florida Center for Community Design and Research, University of South Florida
Figure 10. Tropic States
2. Rule for Lake Nutrient Impairment prior to November 30, 2012: “For the purposes of evaluating nutrient enrichment in lakes, TSIs shall be calculated based on the procedures outlined on pages 86 and 87 of the State’s 1996 305(b) report, which are incorporated by reference. Lakes or lake seg-ments shall be included on the planning list for nutrients if:(1) For lakes with a mean color greater than 40 platinum cobalt units, the annual mean TSI for the lake exceeds 60, unless paleolimnological information indicates the lake was naturally greater than 60, or (2) For lakes with a mean color less than or equal to 40 platinum cobalt units, the annual mean TSI for the lake exceeds 40, unless paleo-limnological information indicates the lake was naturally greater than 40, or (3) For any lake, data in-dicate that annual mean TSIs have increased over the assessment period, as indicated by a positive slope in the means plotted versus time, or the annual mean TSI has increased by more than 10 units over historical values. When evaluating the slope of mean TSIs over time, the Department shall re-quire at least a 5 unit increase in TSI over the assessment period and use a Mann’s one-sided, up-per-tail test for trend, as described in Nonparametric Statistical Methods by M. Hollander and D. Wolfe (1999 ed.), pages 376 and 724 (which are incorporated by reference), with a 95% confidence level.”
3. References: 62-303.352 F.A.C —Nutrients in Lakes. Specific Authority 403.061, 403.067 FS. Law Implemented 403.062, 403.067 FS. History - New 6- 10-02, Amended 12-11-06. Please see page 12 of the Impaired Waters Rule. Updated activity regarding impaired waters may be tracked at: http://www.dep.state.fl.us/water/tmdl/
4. New Numeric Nutrient Criteria in effect after November 30, 2012: The following excerpt from the Florida Administrative Code (F.A.C.) Surface Water Quality Standard (62-302.531(b)-1) is provided as reference for the numeric nutrient criteria that will be used in all Lake Reports.
“For lakes, the applicable numeric interpretations of the narrative nutrient criterion in paragraph 62-302.530(47)(b), F.A.C., for chlorophyll a are shown in the table below. The applicable interpretations for TN and TP will vary on an annual basis, depending on the availability of chlorophyll a data and the concentrations of nutrients and chlorophyll a in the lake, as described below. The applicable numeric interpretations for TN, TP, and chlorophyll a shall not be exceeded more than once in any consecu-tive three year period.
a. If there are sufficient data to calculate the annual geometric mean chlorophyll a and the mean does not exceed the chlorophyll a value for the lake type in the table below, then the TN and TP numeric interpretations for that calendar year shall be the annual geometric means of lake TN and TP samples, subject to the minimum and maximum limits in the table below. However, for lakes with color > 40 PCU in the West Central Nutrient Watershed Region, the maximum TP limit shall be the 0.49 mg/L TP streams threshold for the region; or
Page 32 Florida Center for Community Design and Research, University of South Florida
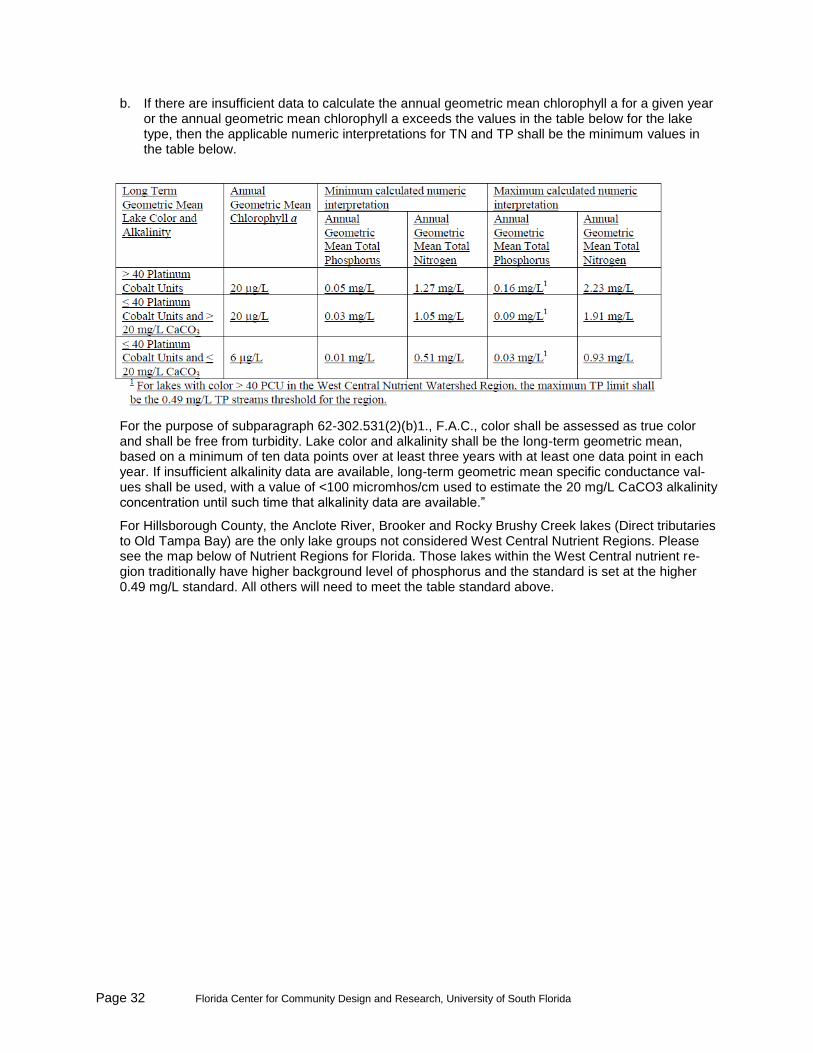
b. If there are insufficient data to calculate the annual geometric mean chlorophyll a for a given year or the annual geometric mean chlorophyll a exceeds the values in the table below for the lake type, then the applicable numeric interpretations for TN and TP shall be the minimum values in the table below.
For the purpose of subparagraph 62-302.531(2)(b)1., F.A.C., color shall be assessed as true color and shall be free from turbidity. Lake color and alkalinity shall be the long-term geometric mean, based on a minimum of ten data points over at least three years with at least one data point in each year. If insufficient alkalinity data are available, long-term geometric mean specific conductance val-ues shall be used, with a value of <100 micromhos/cm used to estimate the 20 mg/L CaCO3 alkalinity concentration until such time that alkalinity data are available.”
For Hillsborough County, the Anclote River, Brooker and Rocky Brushy Creek lakes (Direct tributaries to Old Tampa Bay) are the only lake groups not considered West Central Nutrient Regions. Please see the map below of Nutrient Regions for Florida. Those lakes within the West Central nutrient re-gion traditionally have higher background level of phosphorus and the standard is set at the higher 0.49 mg/L standard. All others will need to meet the table standard above.

Page 33 Florida Center for Community Design and Research, University of South Florida
Figure 11 NNC Nutrient Regions

Page 34 Florida Center for Community Design and Research, University of South Florida
Table 13. NNC for Lakes based on Lake Type and new rule (November 2012)
Numeric Nutrient Criteria (NNC) for Lakes Clear_Alk Clear Colored
Chlorophyll a Criteria (µg/L) LTE 20 LTE 6 LTE 20
Sufficient for Geomean & Geomean Chla meets Chla
Criteria then P (mg/L) 0.03-0.09 0.01-0.03 0.05-0.16
Insuffcient for Geomean or Geomean Chla does not
meet Chla Criteria then P (mg/L) LTE 0.03 LTE 0.01 LTE 0.05
Sufficient for Geomean & Geomean Chla meets Chla
Criteria then N (mg/L) 1.05-1.91 0.51-0.93 1.27-2.23
Insufficient for Geomean or Geomean Chla does not
meet Chla Criteria then N (mg/L) LTE 1.05 LTE 0.51 LTE 1.27
Lake Type:
Lake Type Clear-Alk: (Alk .20 mg/L or >100µSiemens/cm or µmhos/cm , Color > 40 pcu)
Lake Type Clear (Alk LTE 20 mg/L or 100µSiemens/cm or µmhos/cm, Color LTE 40 pcu)
Lake Type Colored (Color > 40 pcu)
Notes
1: LTE = Less than or equal to
2: 1 μmho (micromho) is equal to 1 μSI (microsiemens); both are measures of conductance.
5. Additional Notes that apply to the NNC from FAC 62-302-Final November 2012.
(3) Except for data used to establish historical chlorophyll a levels, chlorophyll a data assessed under this Chapter shall be measured according to the DEP document titled “Applicability of Chlorophyll a Methods” (DEP-SAS-002/10), dated October 24, 2011, which is incorporated by reference herein. Copies of the chlorophyll a document may be obtained from the Department’s internet site at http://www.dep.state.fl.us/water/wqssp/swq-docs.htm or by writing to the Florida Department of Envi-ronmental Protection, Standards and Assessment Section, 2600 Blair Stone Road, MS 6511, Talla-hassee, FL 32399-2400. Chlorophyll a data collected after [effective date] shall be corrected for or free from the interference of phaeophytin.
(4) The loading of nutrients from a waterbody shall be limited as necessary to provide for the attain-ment and maintenance of water quality standards in downstream waters.
(5) To qualify as temporally independent samples, each SCI shall be conducted at least three months apart. SCIs collected at the same location less than three months apart shall be considered one sam-ple, with the mean value used to represent the sampling period.
(6) To calculate an annual geometric mean for TN, TP, or chlorophyll a, there shall be at least four temporally-independent samples per year with at least one sample taken between May 1 and Sep-tember 30 and at least one sample taken during the other months of the calendar year. To be treated as temporally-independent, samples must be taken at least one week apart.
(7) The numeric interpretation of the narrative nutrient criterion shall be applied over a spatial area consistent with its derivation.
(a) For numeric interpretations based on paragraph 62-302.531(2)(a), F.A.C., the spatial applica-tion of the numeric interpretation is as defined in the associated order or rule.
(b) For lakes covered under subparagraph 62-302.531(2)(b)1., F.A.C., the numeric interpretation shall be applied as a lake-wide or lake segment-wide average. 8
(c) For spring vents covered under subparagraph 62-302.531(2)(b)2., F.A.C., the numeric inter-pretation shall be applied in the surface water at or above the spring vent.

Page 35 Florida Center for Community Design and Research, University of South Florida
(d) For streams covered under paragraph 62-302.531(2)(c), F.A.C., the spatial application of the numeric interpretation shall be determined by relative stream homogeneity and shall be applied to waterbody segments or aggregations of segments as determined by the site-specific considera-tions.
(8) Load-based or percent reduction-based nutrient TMDLs or Level II Water Quality Based Effluent Limitations (WQBELs) pursuant to Chapter 62-650, F.A.C., do not need to be converted into concen-tration-based nutrient TMDLs or WQBELs to be used as the basis for the numeric interpretation of the narrative criterion. For percent reduction-based nutrient TMDLs, the associated allowable load or concentration is the numeric interpretation of the narrative criterion for the waterbody.
(9) The Commission adopts rules 62-302.200(4), .200(16)-(17), .200(22)-(25), .200(35)-(37), .200(39), 62-302.531, and 62-302.532(3), F.A.C., to ensure, as a matter of policy, that nutrient pollu-tion is addressed in Florida in an integrated, comprehensive and consistent manner. Accordingly, these rules shall be effective only if EPA approves these rules in their entirety, concludes rulemaking that removes federal numeric nutrient criteria in response to the approval, and determines, in accord-ance with 33 U.S.C. § 1313(c)(3), that these rules sufficiently address EPA’s January 14, 2009 de-termination. If any provision of these rules is determined to be invalid by EPA or in any administrative or judicial proceeding, then the entirety of these rules shall not be implemented.
Rulemaking Authority 403.061, 403.062, 403.087, 403.504, 403.704, 403.804 FS. Law Implemented 403.021, 403.061, 403.067, 403.087, 403.088, 403.141, 403.161, 403.182, 403.502, 403.702, 403.708 FS. History – New - -11.
6. Lake Vegetation: The three primary aquatic vegetation zones are shown below:
The Lake Vegetation Index (LVI) is a rapid assessment protocol in which selected sections of a lake are assessed for the presence or absence of vegetation through visual observation and through the use of a submerged vegetation sampling tool called a Frodus. The assessment results provide a list of species presents and the dominant and where appropriate co-dominant species that are found in each segment. These results are then entered into a scoring table and a final LVI score is deter-mined. LVI scores provide an estimate of the vegetative health of a lake. Our assessment team was trained and qualified by FDEP to conduct these assessment as an independent team and must prequalify each year prior to conducting additional assessments. The LVI method consists of dividing the lake into twelve pie-shaped segments (see diagram below) and selecting a set of four segments from the twelve to include in the LVI. The assessment team then travels across the segment and identifies all unique species of aquatic plant present in the segment. Additionally, a Frodus is thrown at several points on a single five-meter belt transect that is established in the center of the segment from a point along the shore to a point beyond the submerged vegetation zone. For scoring, the

Page 36 Florida Center for Community Design and Research, University of South Florida
threshold score for impairment is 37. Below is a table of LVI scores recorded in Hillsborough County for comparison:
Lake Name Sample
Date LVI
Score
Lake Magdalene 5/26/2005 64
Lake Magdalene 10/20/2005 38
Burrell Lake, off Nebraska in Lutz area. Ambient Monitoring Program 8/4/2005 16
Silver lake just south of Waters between Habana and Himes Avenues, Tampa. Ambient Monitoring Program
7/29/2005 36
Unnamed lake on Forest Hills Drive south of Fletcher Avenue. Ambient Moni-toring Program
8/3/2005 34
Hanna Pond, off Hanna Rd in Lutz. Ambient Monitoring Program 7/25/2005 38
Small lake, Lutz, just east pf Livingston. Ambient Monitoring Program 7/22/2005 39
Small lake, Lutz, adj to Lake Keene. Ambient Monitoring Program 8/5/2005 28
Unnamed small lake, Tampa, off Fowler behind University Square Mall. Ambi-ent Monitoring Program
7/19/2005 16
Tiffany Lake, Lutz, north of Whittaker. Ambient Monitoring Program 7/25/2005 40
Cedar Lake, south of Fletcher, Forest Hills. Ambient Monitoring Program 7/22/2005 37
Unnamed small lake behind Natives Nursery, Lutz. Ambient Monitoring Pro-gram
8/5/2005 20
Unnamed lake on Curry Road off Livingston, Lutz. Ambient Monitoring Pro-gram
7/19/2005 46
Unnamed lake in Lutz. Ambient Monitoring Program 7/20/2005 45
Lake Josephine - HIL538UL 10/12/2006 40
Lake Magdalene - HIL546UL 10/18/2006 40
Starvation Lake - HIL540NL 9/28/2006 48
Egypt Lake - HIL556UL 10/31/2006 34
Unnamed Lake - HIL544UL 9/25/2008 58
Lake Rogers - L63P 7/22/2009 65
Lake Alice/Odessa, profundal zone 8/6/2009 71
Lake Carroll (Center) 7/15/2009 64
Unnamed Small Lake - Z4-SL-3011 7/21/2009 24
Unnamed Small Lake - Z4-SL-3020 7/21/2009 40
Lake Ruth - Z4-SL-3031 7/16/2009 71
Lake Juanita - Z4-SL-3036 7/20/2009 72
Chapman Lake 6/8/2009 42
Island Ford Lake 8/10/2010 50
Lake Magdalene 7/29/2010 56
Lake Stemper 7/13/2010 38
Lake Carroll 7/20/2010 57
Lake Virginia 5/17/2011 51
Lake Harvey 5/20/2011 48
Pretty Lake 5/24/2011 33
Cypress Lake 8/17/2011 66
Lake Armistead 6/3/2011 13
Little Lake Wilson 5/31/2011 48
Mill Lake 5/11/2011 37
Lake Taylor 6/24/2011 67
Lake Valrico 7/19/2011 25
Rogers Lake 7/22/2011 73
Lake Raleigh 7/29/2011 54

Page 37 Florida Center for Community Design and Research, University of South Florida
Lake Name Sample
Date LVI
Score
Lake Juanita 6/21/2011 63
Crescent Lake 7/26/2011 45
Lake Behnke 11/18/2011 41
Lake Alice 5/9/2012 68
Hog Island Lake 5/24/2012 55
East Lake 5/17/2012 46
Lake Weeks 5/15/2012 33
Lake Lipsey 5/22/2012 31
Lake Hanna 7/10/2012 41
Lake Wilson/ Thomas 7/5/2012 65
Lake Carroll 7/26/2012 57
Lake Estes 8/9/2012 44
Long Pond 8/15/2012 37
Sunset Lake 8/2/2012 50
White Trout Lake 7/1/2012 43
Lake George 11/7/2012 39
Horse Lake 11/16/2012 43
Lake Allen 5/24/2013 25
Church Lake 6/13/2013 64
Echo Lake 6/14/2013 49
Lake Thonotosassa 5/13/2013 38
Medard Reservoir 5/23/2013 29
Lake Williams 7/5/2013 30
Lake Thorpe 7/11/2013 43
Lake Carlton 7/25/2013 18
Bay Lake 7/26/2013 32
Platt Lake 8/1/2013 45
Lake Heather 10/24/2013 38
Egypt Lake 10/11/2013 40
Lake Helen 12/18/2013 38
Lake Zelma 12/18/2013 41
Lake Barbara 12/18/2013 31
Silver Lake 12/17/2013 22
Reference: “Assessing the Biological Condition of Florida Lakes: Development of the Lake Vegetation Index (LVI) Final Report”, December, 2007, page 7. Prepared for: Florida Department of Environmental Protection, Twin Towers Office Building, 2600 Blair Stone Road, Tallahassee, FL 32399-2400, Authors: Leska S. Fore*, Russel Frydenborg**, Nijole Wellendorf**, Julie Espy**, Tom Frick**, David Whiting**, Joy Jackson**, and Jessica Patronis**
* Statistical Design
** Florida Department of Environmental Protection

Page 38 Florida Center for Community Design and Research, University of South Florida
Diagram showing the method used to divide a typical lake into 12 sections for replicate sampling:
7. Estimating nutrients held in submerged plants
An adjusted chlorophyll a value (μg/L) was calculated by modifying the methods of Canfield et al (1983). The total wet weight of plants in the lake (kg) was calculated by multiplying lake surface area (m
2) by PAC (percent area coverage of macrophytes) and multiplying the product by the biomass of
submersed plants (kg wet weight m2) and then by 0.25, the conversion for the 1/4 meter sample cube.
The dry weight (kg) of plant material was calculated by multiplying the wet weight of plant material (kg) by 0.08, a factor that represents the average percent dry weight of submersed plants (Canfield and Hoyer, 1992) and then converting to grams. The potential phosphorus concentration (mg/m
3) was
calculated by multiplying dry weight (g) by 1.41 mg TP g-1 dry weight, a number that represents the mean phosphorus (mg) content of dried plant material measured in 750 samples from 60 Florida lakes (University of Florida, unpublished data), and then dividing by lake volume (m
3) and then con-
verting to μg/L (1000/1000). From the potential phosphorus concentration, a predicted chlorophyll a concentration was determined from the total phosphorus and chlorophyll a relationship reported by Brown (1997) for 209 Florida lakes. Adjusted chlorophyll a concentrations were then calculated by adding each lake’s measured chlorophyll a concentration to the predicted chlorophyll a concentration.