Embed Size (px)
Citation preview

LAKE ASSESSMENT REPORT FOR LAKE WHITE TROUT IN HILLSBOROUGH COUNTY FLORIDA
Date Assessed: June 22, 2006 Assessed by: Sarah Koenig and David Eilers Reviewed by: Jim Griffin INTRODUCTION This assessment was conducted to update existing physical and ecological data for Lake White Trout on the Hillsborough County Watershed Atlas (http://www.hillsborough.wateratlas.usf.edu/. The project is a collaborative effort between the University of South Florida’s Center for Community Design and Research and Hillsborough County Stormwater Management Section. The project is funded by Hillsborough County and the Southwest Florida Water Management District’s Northwest Hillsborough, Hillsborough River and Alafia River Basin Boards. The project has, as its primary goal, the rapid assessing of up to 150 lakes in Hillsborough County during a five year period. The product of these investigations will provide the County, lake property owners, and the general public a better understanding of the general health of Hillsborough County lakes, in terms of shoreline development, water quality, lake morphology (bottom contour, volume, area etc.) and the plant biomass and species diversity. These data are intended to assist the County and its citizens to better manage lakes and lake centered watersheds. Figure 1. General photo of Lake White Trout (6/22/06).
1

The first section of the report provides the results of the overall morphological assessment of the lake. Primary data products include: a contour (bathymetric) map of the lake, area, volume and depth statistics, and the water level at the time of assessment. These data are useful for evaluating trends and for the development of management actions such as plant management where depth and lake volume are needed. The second section provides the results of the vegetation assessment conducted on the lake. These results can be used to better understand and manage vegetation in your lake. A list is provided with the different plant species found at various sites around the lake. Potentially invasive, exotic (non-native) species are identified in a plant list and the total non-native is presented in a summary table. Watershed values provide a means of reference and are derived from the lakes assessed during the 2006 lake assessment project in that watershed. The third section provides the results of the water quality sampling of the lake. Both field data and laboratory data are presented. The trophic state index (TSI) i is used to develop a general lake health statement, which is calculated for both the water column with vegetation and the water column if vegetation were removed (adjusted TSI – Adj_TSI). These data are a combination of the water chemistry and vegetative submerged biomass assessments and are useful in understanding the results of certain lake vegetation management practices. The intent of this assessment is to provide a starting point from which to track changes in your lake, and where previous comprehensive assessment data is available, to track changes in the lake’s general health. These data can provide the information needed to determine changes and to monitor trends in physical condition and ecological health of the lake. Section 1: Lake Morphology Bathymetric Mapii. The bottom of the lake was mapped using a Lowrance LCX 26C HD Wide Area Augmentation System (WAAS)iii enabled Global Positioning System (WAAS-GPS) with fathometer (bottom sounder) to determine the boat’s position, and bottom depth in a single measurement. The result is an estimate of the lake’s area, mean and maximum depths, and volume and the creation of a bottom contour map (Figure 1). Besides pointing out the deeper fishing holes in the lake, the morphologic data derived from this part of the assessment can be valuable to overall management of the lake vegetation as well as providing flood storage data for flood models. Table 1 provides the lake’s morphologic parameters in various units. Table 1. Lake Area Depth and Volume
Parameter Feet Meters Acres Acre-Ft Gallons Surface Area (sq) 3,303,154.8 306,863.1 75.8 Median Depth 10.8 3.3 Maximum Depth 29.0 8.8 Volume (cubic) 35,719,361.5 1,011,064.6 820.0 267,189,217Gage Reading (feet above datum) 35.78
2

Figure 2. Contour map for Lake White Trout. The lake was not remapped in 2006 because the map shown here (2003) was constructed within the last 5 years. A differential global positioning system and fathometer combination instrument was used to obtain simultaneous horizontal and vertical measurements.
3

Section 2: Lake Ecology (vegetation) The lake’s apparent vegetative cover and shoreline detail are evaluated using the aerial shown in Figure 3 and by use of GPS. Submerged vegetation is determined from evenly spaced contours sampled using a Lowrance 26c HD, combined DGPS/fathometer described earlier. Ten vegetation assessment sites were used for Lake White Trout (Figure 3) as dictated by the Lake Assessment Protocol (copy available on request) for a lake of this size. The site positions are set using a DGPS and then loaded into a GIS mapping program (ArcGIS) for display. Each site is field sampled in the three primary vegetative zones (emergent, submerged and floating). The latest aerials (2005, 6 inch resolution, SWFWMD aerials) are used to provide shore details (docks, structures, vegetation zones) and to calculate the extent of surface vegetation coverage. The primary indices of submerged vegetation cover and biomass for the lake, percent area coverage (PAC) and percent volume infestation (PVI), are determined by transiting the lake by boat and employing a fathometer to collect “hard and soft return” data. These data are later analyzed for presence and absence of vegetation and to determine the height of vegetation if present. The PAC index is determined from the presence and absence analysis of 100 sites in the lake and the PVI index is determined by measuring the difference between hard returns (lake bottom) and soft returns (top of vegetation) for sites (within the 100 analyzed sites) where plants are determined present. The data collected during the site vegetation sampling include vegetation type, exotic vegetation, predominant plant species and submerged vegetation biomass. The total number of species from all sites is used to approximate the total diversity of aquatic plants and the total non-native plants on the lake (Table 2). The Watershed value in Table 2 only includes lakes sampled during the lake assessment project begun in May of 2006. These data will change as additional lakes are sampled. Tables 3 through 5 detail the results from the 2006 aquatic plant assessment for you lake. These data are determined from the 10 sites used for intensive vegetation surveys. The tables are divided into Floating Leaf, Emergent and Submerged plants and contain the plant code, species, common name and presence (1) or absence (blank) of species and the calculated percent occurrence (number sites species is found/number of sites) and type of plant (Native, Non-Native, Invasive, Pest). In the “Type” category, the term invasive indicates the plant is commonly considered invasive in this region of Florida and the term “Pest” indicates that the plant has a greater than 55% occurrence in your lake and is also considered a problem plant for this region of Florida, or in a non-native invasive that is or has the potential to be a problem plant in your lake and has at least 40% occurrence. These two terms are somewhat subjective; however, they are provided to give lake property owners some guidance in the management of plants on their property. Please remember that to remove or control plants in a wetland (lake shoreline) in Hillsborough County the property owner must secure an Application To Perform Miscellaneous Activities In Wetlands (http://www.epchc.org/forms_documents.htm) permit from the Environmental Protection Commission of Hillsborough and for management of in-lake vegetation outside the wetland fringe (for lakes with an area greater than 10 acres), the property owner must secure a Florida Department of Environmental Protection permit (http://www.dep.state.fl.us/lands/invaspec/ ). Table 2 Total diversity, Total Non-Native, and number of EPPC pest plants Parameter Lake Watershed Total Plant Diversity (# of Taxa) 61 98 Total Non-Native Plants 9 17 Total Pest Plant Species 8 11
4

5

Table 3. List of Floating Leaf Zone Aquatic Plants Found in Lake White Trout
Code Plant Species Common Name 1 2 3 4 5 6 7 8 9 10% Occurrence
Native (N), Non-Native (NN), Invasive(I), Pest (P)
NOA Nymphaea odorata American White Water lily, Fragrant Water Lily 1 1 1 1 1 1 1 1 1 1 100% Native
HYE Hydrocotyl umbellata Manyflower Marshpennywort, Water Pennywort 1 1 1 11 1 1 1 1 90% Native
SMA Salvinia minima Water Spangles, Water Fern 1 1 20% NN-I
NLM Nuphar lutea var. advena Spatterdock, Yellow Pondlily 1 1 20% Native
NYM Nymphaea spp. Exotic Water Lilies 1 10% NN
Figure 5. Water Spangles (Salvinia minima) is a non-native invasive species.
Figure 4. An exotic water lily (Nymphaea spp) on Lake White Trout.
6

Table 4 List of Emergent Zone Aquatic Plants Found in Lake White Trout
Code Plant Species Common Name 1 2 3 4 5 6 7 8 9 10% Occurrence
Native (N), Non-Native (NN), Invasive(I), Pest (P)
LOP Ludwigia spp. Water Primroses, Primrosewillow 1 1 11 1 1 11 1 90% Native
APS Alternanthera philoxeroides Alligator Weed 1 1 1 1 1 1 1 1 80% NN-I-P
PRS Panicum repens Torpedo Grass 1 1 1 1 1 1 1 1 80% NN-I-P TYP Typha spp. Cattails 1 1 1 1 1 1 1 70% N-I-P ACE Acer rubrum var. trilobum Southern Red Maple 1 1 1 1 1 1 60% Native BMI Bacopa monnieri Common Bacopa, Herb-Of-Grace 1 1 1 1 1 1 60% Native CAA Centella asiatica Asian Pennywort, Coinwort, Spadeleaf 1 1 1 1 1 1 60% Native FSC Fuirena spp. Rush Fuirena 1 1 1 1 1 1 60% Native PCA Pontederia cordata Pickerel Weed 1 1 1 1 1 1 60% Native CCA Cinnamomum camphora Camphor-tree 1 1 1 1 1 50% NN-I-P MEL Melaleuca quinquenervia Punk Tree, Melaleuca 1 1 1 1 1 50% NN-I-P EAA Eclipta alba (prostrata) False Daisy, Yerba De Tajo 1 1 1 1 1 50% Native COM Commelina spp. Dayflower 1 1 1 1 40% Native EBI Eleocharis baldwinii Baldwin's Spikerush, Roadgrass 1 1 1 1 40% Native MSS Mikania scandens Climbing Hempvine 1 1 1 1 40% Native PIN Pinus spp. Pine Tree 1 1 1 1 40% Native POL Polygonum spp. Smartweed, Knotweed 1 1 1 1 40% Native BLS Blechnum serrulatum Swamp Fern 1 1 1 30% Native CYP Cyperus spp. Sedge 1 1 1 30% Native PHN Panicum hemitomon Maidencane 1 1 1 30% Native SLA Sagittaria lancifolia Bulltongue Arrowhead, Duck Potato 1 1 1 30% Native TAS Taxodium ascendens Pond Cypress 1 1 1 30% Native BMA Urochloa mutica Para Grass 1 1 20% NN-I CAN Canna spp. Canna (exotic) 1 1 20% Native CYO Cyperus odoratus Fragrant Flatsedge 1 1 20% Native ELE Eleocharis spp. Roadgrass, Spikerushes 1 1 20% Native ICE Ilex cassine Dahoon Holly 1 1 20% Native
7

MVA Magnolia virginiana Sweetbay Magnolia 1 1 20% Native RF Osmunda regalis Royal Fern 1 1 20% Native
PNA Phyla nodiflora Frog-fruit, Carpetweed, Turkey Tangle Fogfruit 1 1 20% Native
TGA Thalia geniculata Fireflag, Arrowroot 1 1 20% Native PGA Psidium guajava Guava 1 10% NN-I STS Schinus terebinthifolius Brazilian Pepper 1 10% NN-I AST Aster spp. Aster spp., Elliot's Aster 1 10% Native BOC Boehmeria cylindrica Bog Hemp, False Nettle 1 10% Native DMI Desmodium incanum Creeping Beggarweed 1 10% Native DVA Diodia virginiana Buttonweed 1 10% Native IRI Iris spp. Flag 1 10% Native NSS Nephrolepsis spp. Sword Fern 1 10% Native OCA Osmunda cinnamomea Cinnamon Fern 1 10% Native PAN Panicum spp. Panic grasses 1 10% Native RHE Rhexia spp. Meadow Beauties 1 10% Native SAL Salix spp. Willow 1 10% Native SCI Scirpus spp. Sedge 1 10% Native SSP Scirpus validus Soft-stem Bulrush 1 10% Native WAX Myrica cerifera Wax Myrtle 1 10% Native
Figure 6. Duck Potato (Sagittaria lancifolia) is a native wetland species shown here on Lake White Trout.
8

Table 5 List of Submerged Zone Aquatic Plants Found in Lake White Trout.
Code Plant Species Common Name 1 2 3 4 5 6 7 8 9 10% Occurrence
Native (N), Non-Native (NN), Invasive(I), Pest (P)
HVA Hydrilla verticillata Hydrilla, water thyme 1 1 1 1 1 1 1 1 1 90% NN-I-P EDA Egeria densa Common Waterweed 1 1 1 1 1 1 1 1 1 90% Native VAA Vallisneria americana Tapegrass 1 1 1 1 1 1 1 1 1 90% Native ALG Algal Spp. Algal Mats, Floating 1 1 1 1 1 1 1 1 80% N-I-P
MGM Micranthemum glomeratum
Manatee Mudflower, Baby's Tears 1 1 1 1 1 1 60% Native
PIS Potamogeton illinoesis Pond Weed 1 1 1 1 1 1 60% N-I-P CHA Chara spp. Muskgrass 1 1 1 1 40% Native MUM Micranthemum umbrosum Shade Mudflower, Baby's Tears 1 1 1 1 40% Native NGS Najas guadelupensis Southern Waternymph 1 1 20% Native NIT Nitella spp. Nitella 1 10% N-I
Figure 7. Floating algal mats are a native species that becomes a pest species when densities become high as in this image from Lake White Trout.
9

Section 3: Lake Water Chemistry A critical element in any lake assessment is the long-term water chemistry data set. The primary source of water quality trend data for Florida lakes is the Florida LAKEWATCH volunteer and the Florida LAKEWATCH water chemistry dataset. Hillsborough County is fortunate to have a large cadre of volunteers who have collected lake water samples for significant time period. The volunteer(s) on White Trout have monitored that lake for over 8 years and have amassed an excellent long-term dataset. These data are displayed and analyzed on the Water Atlas as shown in Figure 8 for Lake White Trout. Additional data, when available, is also included on the Water Atlas; however, the LAKEWATCH data remains the primary source. By the trend data shown in Figure 8, the lake may be considered a healthy lake in terms of the trophic state index. Lake White Trout is a clear water lake and as such it must maintain a TSI of below 40 to not be considered impaired by the State of Florida guidelinesiv. White Trout’s long term water quality data indicates enough violations of these criteria to be classified by Florida DEP as impaired. Figure 8. Recent Trophic State Index graph from Hillsborough Watershed Atlas.
10
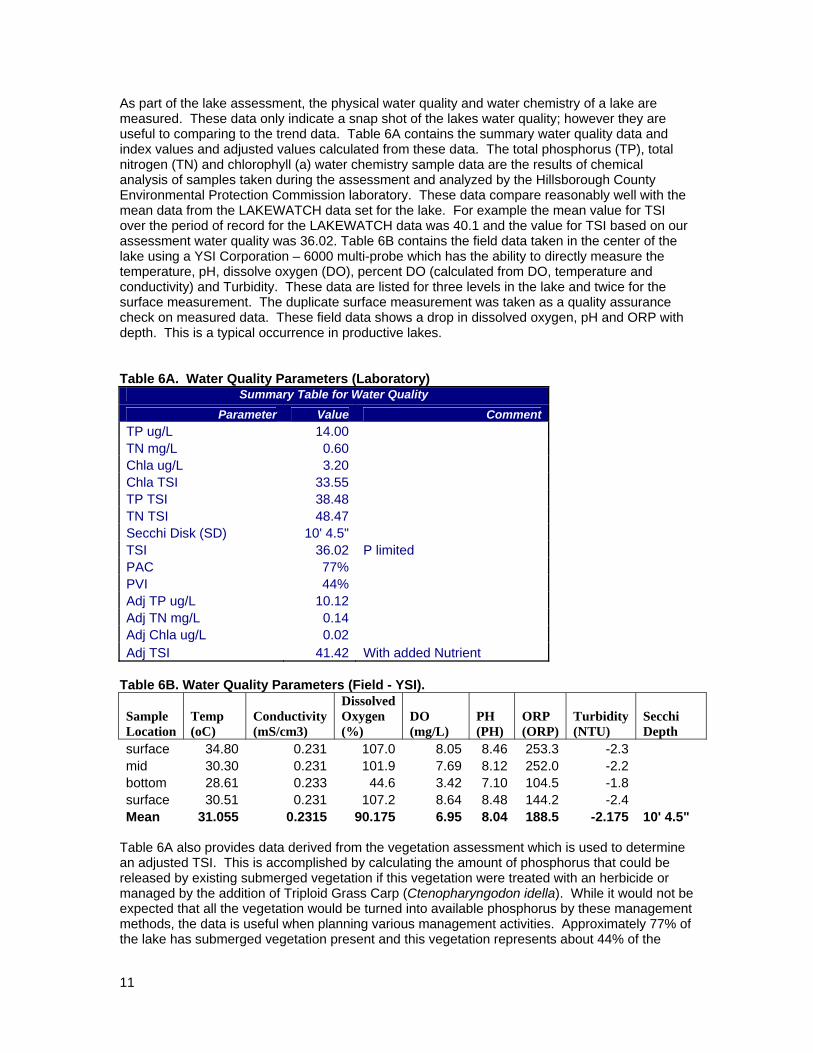
As part of the lake assessment, the physical water quality and water chemistry of a lake are measured. These data only indicate a snap shot of the lakes water quality; however they are useful to comparing to the trend data. Table 6A contains the summary water quality data and index values and adjusted values calculated from these data. The total phosphorus (TP), total nitrogen (TN) and chlorophyll (a) water chemistry sample data are the results of chemical analysis of samples taken during the assessment and analyzed by the Hillsborough County Environmental Protection Commission laboratory. These data compare reasonably well with the mean data from the LAKEWATCH data set for the lake. For example the mean value for TSI over the period of record for the LAKEWATCH data was 40.1 and the value for TSI based on our assessment water quality was 36.02. Table 6B contains the field data taken in the center of the lake using a YSI Corporation – 6000 multi-probe which has the ability to directly measure the temperature, pH, dissolve oxygen (DO), percent DO (calculated from DO, temperature and conductivity) and Turbidity. These data are listed for three levels in the lake and twice for the surface measurement. The duplicate surface measurement was taken as a quality assurance check on measured data. These field data shows a drop in dissolved oxygen, pH and ORP with depth. This is a typical occurrence in productive lakes. Table 6A. Water Quality Parameters (Laboratory)
Summary Table for Water Quality Parameter Value Comment
TP ug/L 14.00 TN mg/L 0.60 Chla ug/L 3.20 Chla TSI 33.55 TP TSI 38.48 TN TSI 48.47 Secchi Disk (SD) 10' 4.5" TSI 36.02 P limited PAC 77% PVI 44% Adj TP ug/L 10.12 Adj TN mg/L 0.14 Adj Chla ug/L 0.02 Adj TSI 41.42 With added Nutrient
Table 6B. Water Quality Parameters (Field - YSI).
Sample Location
Temp (oC)
Conductivity (mS/cm3)
Dissolved Oxygen (%)
DO (mg/L)
PH (PH)
ORP (ORP)
Turbidity (NTU)
Secchi Depth
surface 34.80 0.231 107.0 8.05 8.46 253.3 -2.3 mid 30.30 0.231 101.9 7.69 8.12 252.0 -2.2 bottom 28.61 0.233 44.6 3.42 7.10 104.5 -1.8 surface 30.51 0.231 107.2 8.64 8.48 144.2 -2.4 Mean 31.055 0.2315 90.175 6.95 8.04 188.5 -2.175 10' 4.5"
Table 6A also provides data derived from the vegetation assessment which is used to determine an adjusted TSI. This is accomplished by calculating the amount of phosphorus that could be released by existing submerged vegetation if this vegetation were treated with an herbicide or managed by the addition of Triploid Grass Carp (Ctenopharyngodon idella). While it would not be expected that all the vegetation would be turned into available phosphorus by these management methods, the data is useful when planning various management activities. Approximately 77% of the lake has submerged vegetation present and this vegetation represents about 44% of the
11

available lake volume. The vegetation holds enough phosphorus to add about 10.12 µg/L of the nutrient to the water column. Because the growth of algae in the water is regulated by the availability of phosphorus (the lake is phosphorus limited), the release of this phosphorus would stimulate algal growth. These changes in the water chemistry and biology would be indicated by an increased TSI from 36 to about 41.4. This significant potential increase in TSI should be considered before any vegetation maintenance is carried out on the lake. The vegetation in White Trout seems to be maintaining nutrient balance. The lake water clarity which is indicated by the Secchi Disk (SD) value at 10’ 4.5” feet would be reduced under these conditions. Section 4: Conclusion White Trout is a medium (76 acre) lake that would be considered in the mesotrophic (good) category of lakes based on water chemistry. It has a higher than normal concentration of submerged aquatic vegetation (we estimate a coverage of 77%). This submerged vegeation helps to maintain fish habitat and control nutrient balance. The lake has adequate open water areas to support various types of recreation and has a good diversity of plant species. The primary pest plants in the lake include Primrosewillow (Ludwigia spp), Hydrilla (Hydrilla verticillata) and Pond Weed (Potamogeton illinoesis). We found hydrilla in nine of ten sites surveyed which is a cause for concern and the spread of this highly invasive species should be monitored. The lake association stocked 195 Grass carp in 1989 and 175 in 1999. This stocking volume seems reasonable (2.3-2.6/acre) and additional stocking of between 175 and 195 carp might be considered in the next few years. For more information and recent updates please see the Hillsborough Watershed Atlas (water atlas) website at: http://www.hillsborough.wateratlas.usf.edu/lake/waterquality.asp?wbodyid=5196&wbodyatlas=lake
12

i"Trophic" means "relating to nutrition." The Trophic State Index (TSI) takes into account chlorophyll, nitrogen, and phosphorus, which are nutrients required by plant life. For more information please see learn more at: http://www.hillsborough.wateratlas.usf.edu/lake/default.asp?wbodyid=5196&wbodyatlas=lake ii A bathymetric map is a map that accurately depicts all of the various depths of a water body. An accurate bathymetric map is important for effective herbicide application and can be an important tool when deciding which form of management is most appropriate for a water body. Lake volumes, hydrolic retention time and carrying capacity are important parts of lake management that require the use of a bathymetric map. iii WAAS is a form of differential GPS (DGPS) where data from 25 ground reference stations located in the United States receive GPS signals form GPS satellites in view and retransmit these data to a master control site and then to geostationary satellites. The geostationary satellites broadcast the information to all WAAS-capable GPS receivers. The receiver decodes the signal to provide real time correction of raw GPS satellite signals also received by the unit. WAAS enabled GPS is not as accurate as standard DGPS which employs close by ground stations for correction, however; it was shown to be a good substitute when used for this type of mapping application. Data comparisons were conducted with both types of DGPS employed simultaneously and the positional difference was determined to be well within the tolerance established for the project. iv The three primary aquatic vegetation zones are shown below:
v A lake is impaired if “ (2) For lakes with a mean color less than or equal to 40 platinum cobalt units, the annual mean TSI for the lake exceeds 40, unless paleolimnological information indicates the lake was naturally greater than 40, or For any lake, data indicate that annual mean TSIs have increased over the assessment period, as indicated by a positive slope in the means plotted versus time, or the annual mean TSI has increased by more than10 units over historical values. When evaluating the slope of mean TSIs over time, the Department shall use a Mann’s one-sided, upper-tail test for trend, as described in Nonparametric Statistical Methods by M. Hollander and D. Wolfe (1999 ed.), pages 376 and 724 (which are incorporated by reference), with a 95% confidence level.” Excerpt from Impaired Water Rule (IWR). Please see: http://www.dep.state.fl.us/water/tmdl/docs/AmendedIWR.pdf
13