Embed Size (px)
Citation preview
Tel (512) 694-8150
3712 Goodnight Trail Leander, TX 78641
LaCostaEnvironmental.com [email protected]
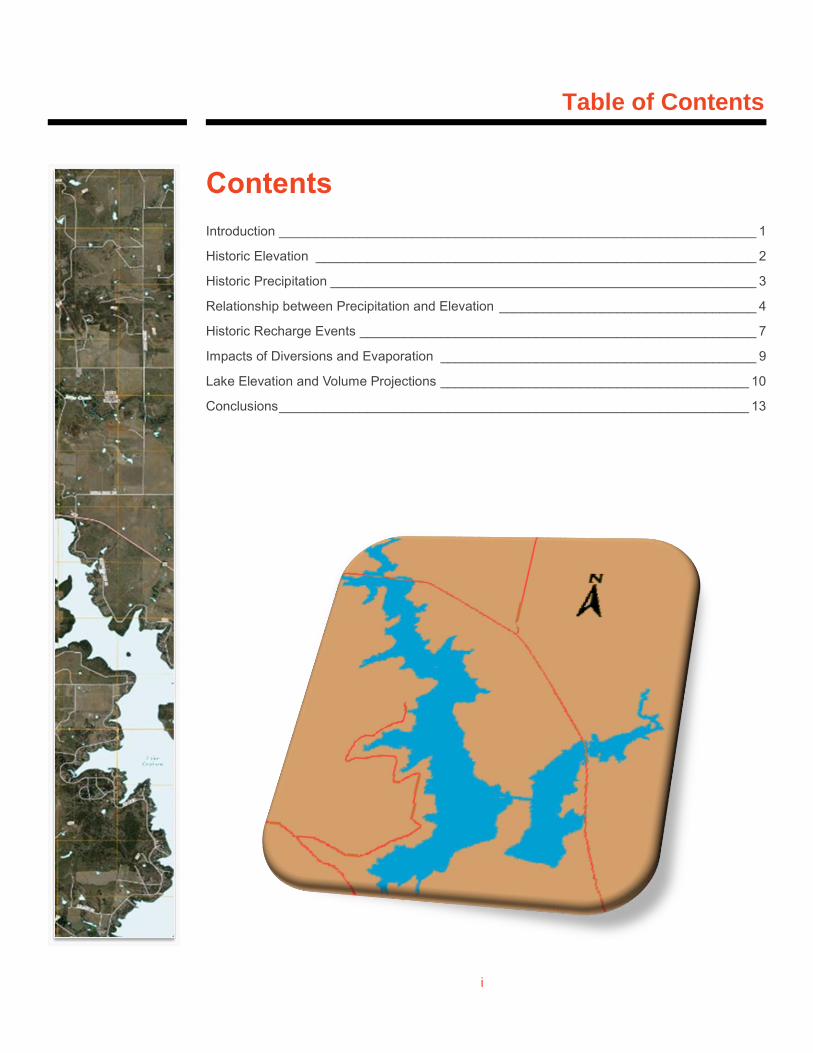
Table of Contents
i
Contents
Introduction _________________________________________________________________ 1
Historic Elevation ____________________________________________________________ 2
Historic Precipitation __________________________________________________________ 3
Relationship between Precipitation and Elevation ___________________________________ 4
Historic Recharge Events ______________________________________________________ 7
Impacts of Diversions and Evaporation ___________________________________________ 9
Lake Elevation and Volume Projections __________________________________________ 10
Conclusions ________________________________________________________________ 13
Pg. 01
Lake Graham-Eddleman Elevation Study
1
Introduction
History
Located 2 miles northwest of the City of Graham in Young County, Lake Graham-Eddleman consists of two lakes
connected by a canal. Eddleman Dam was constructed on Flint Creek in 1929 and Graham Dam was constructed
on Salt Creek in 1958. The two lakes were connected in 1959.
Climate
Lake Graham is located in the Northern Plains climatic region of Texas. The average annual precipitation,
measured at Graham airport, is 29.2 inches with the wettest months typically being April and May. The average
number of days annually with precipitation is 56. In 2011, 12.08 inches of precipitation was measured, the lowest
in recorded history. Temperature ranges from an average of 84.1 degrees Fahrenheit in August to an average of
42.7 degrees Fahrenheit in January.
Watershed
The drainage area for Lake Graham is approximately 221 square miles. The reservoir is located in the Brazos River
Basin. The watershed is characterized by tall and mid grasses, live oak and post oak, juniper, and mesquite with
numerous domestic and livestock impoundments associated with agricultural operations.
Reservoir
Originally, the surface area was estimated to be 2,550 acres and the storage capacity was estimated to be 53,680
acre-feet. The Texas Water Development Board conducted a hydrographic survey in April of 1998 and published
a report in March of 2003. The report concluded that the conservation pool capacity at 1075.0 feet is 45,302 acre-
feet and the surface areas is 2,444 acres.
Pg. 02
Lake Graham-Eddleman Elevation Study
2
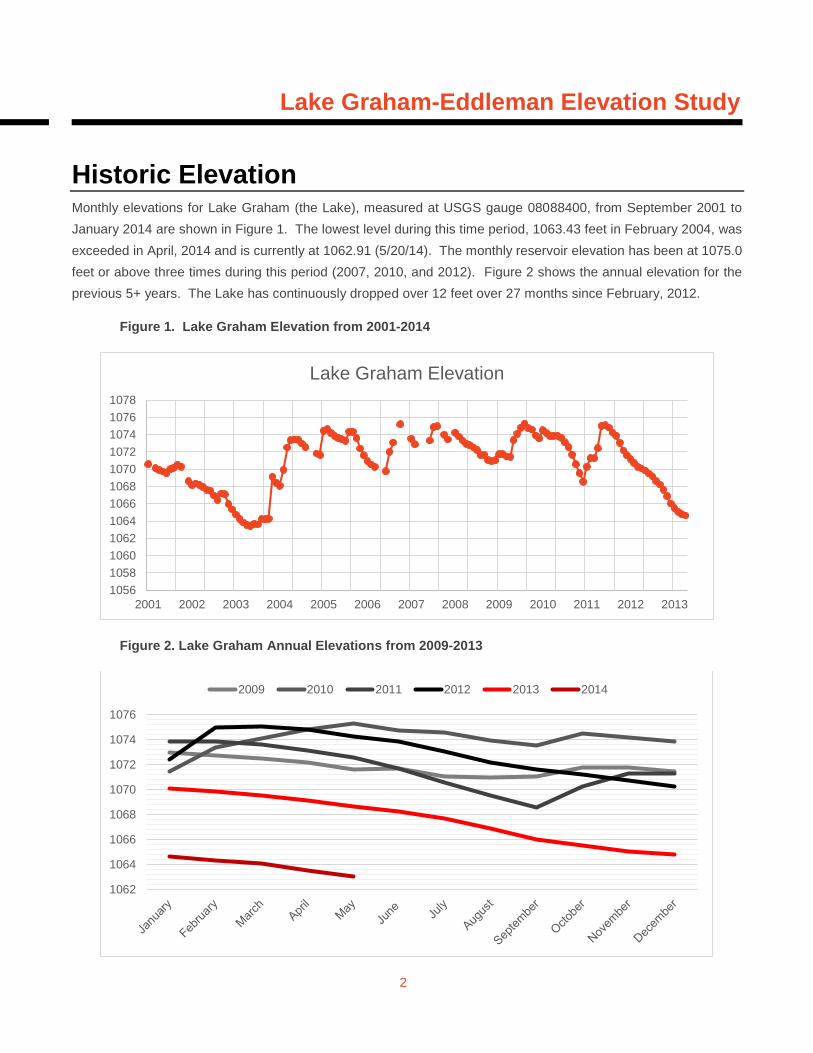
Historic Elevation Monthly elevations for Lake Graham (the Lake), measured at USGS gauge 08088400, from September 2001 to
January 2014 are shown in Figure 1. The lowest level during this time period, 1063.43 feet in February 2004, was
exceeded in April, 2014 and is currently at 1062.91 (5/20/14). The monthly reservoir elevation has been at 1075.0
feet or above three times during this period (2007, 2010, and 2012). Figure 2 shows the annual elevation for the
previous 5+ years. The Lake has continuously dropped over 12 feet over 27 months since February, 2012.
Figure 1. Lake Graham Elevation from 2001-2014
Figure 2. Lake Graham Annual Elevations from 2009-2013
1056
1058
1060
1062
1064
1066
1068
1070
1072
1074
1076
1078
2001 2002 2003 2004 2005 2006 2007 2008 2009 2010 2011 2012 2013
Lake Graham Elevation
1062
1064
1066
1068
1070
1072
1074
1076
2009 2010 2011 2012 2013 2014
Pg. 03
Lake Graham-Eddleman Elevation Study
3
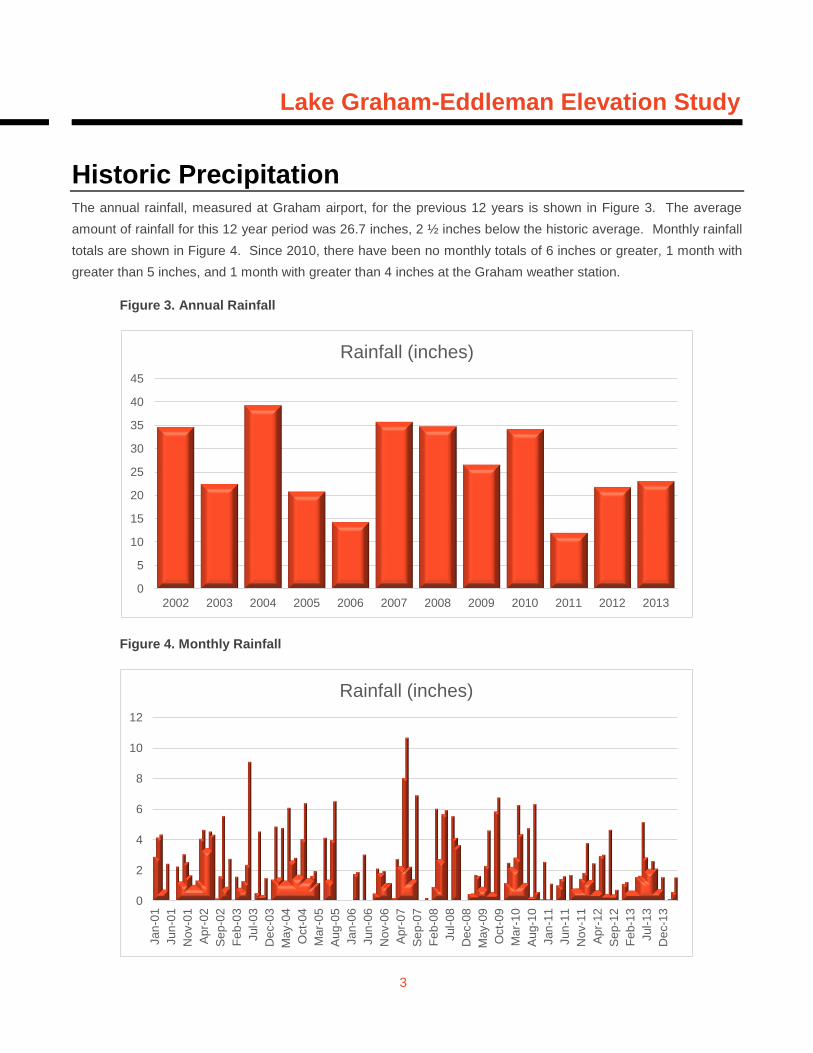
Historic Precipitation The annual rainfall, measured at Graham airport, for the previous 12 years is shown in Figure 3. The average
amount of rainfall for this 12 year period was 26.7 inches, 2 ½ inches below the historic average. Monthly rainfall
totals are shown in Figure 4. Since 2010, there have been no monthly totals of 6 inches or greater, 1 month with
greater than 5 inches, and 1 month with greater than 4 inches at the Graham weather station.
Figure 3. Annual Rainfall
Figure 4. Monthly Rainfall
0
5
10
15
20
25
30
35
40
45
2002 2003 2004 2005 2006 2007 2008 2009 2010 2011 2012 2013
Rainfall (inches)
0
2
4
6
8
10
12
Jan
-01
Jun
-01
Nov-0
1
Ap
r-02
Se
p-0
2
Fe
b-0
3
Jul-
03
Dec-0
3
Ma
y-0
4
Oct-
04
Ma
r-0
5
Au
g-0
5
Jan
-06
Jun
-06
Nov-0
6
Ap
r-07
Se
p-0
7
Fe
b-0
8
Jul-
08
Dec-0
8
Ma
y-0
9
Oct-
09
Ma
r-1
0
Au
g-1
0
Jan
-11
Jun
-11
Nov-1
1
Ap
r-12
Se
p-1
2
Fe
b-1
3
Jul-
13
Dec-1
3
Rainfall (inches)
Pg. 04
Lake Graham-Eddleman Elevation Study
4
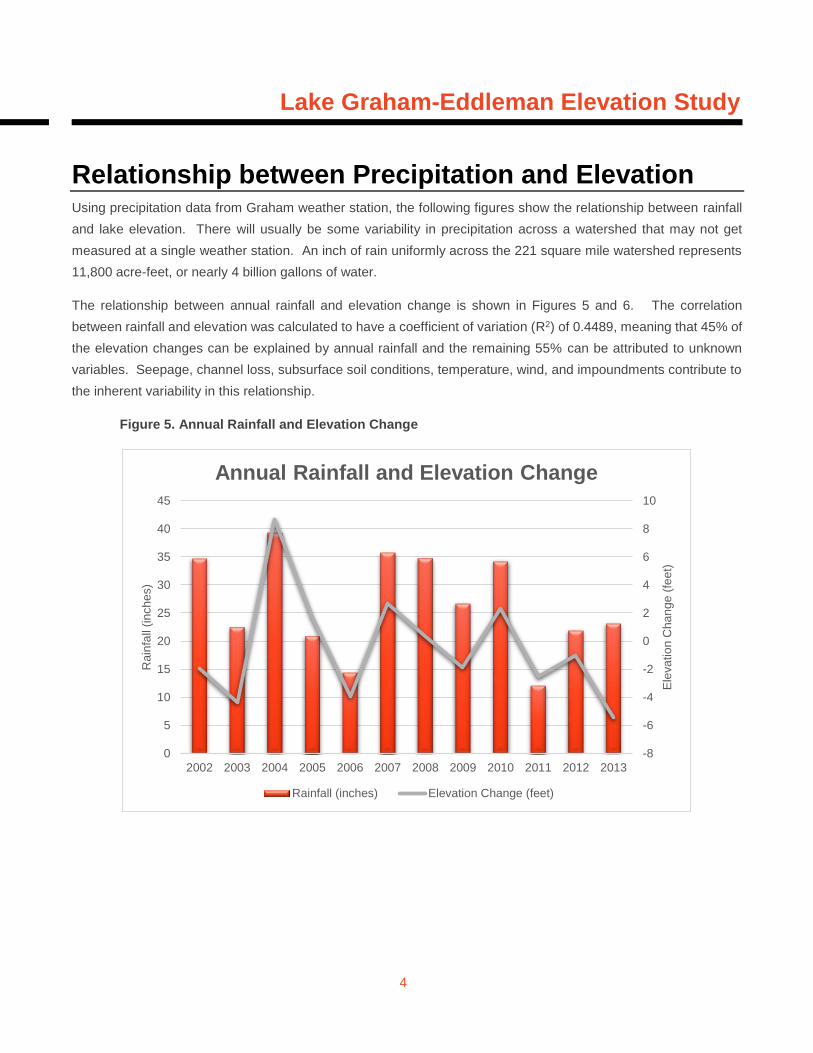
Relationship between Precipitation and Elevation Using precipitation data from Graham weather station, the following figures show the relationship between rainfall
and lake elevation. There will usually be some variability in precipitation across a watershed that may not get
measured at a single weather station. An inch of rain uniformly across the 221 square mile watershed represents
11,800 acre-feet, or nearly 4 billion gallons of water.
The relationship between annual rainfall and elevation change is shown in Figures 5 and 6. The correlation
between rainfall and elevation was calculated to have a coefficient of variation (R2) of 0.4489, meaning that 45% of
the elevation changes can be explained by annual rainfall and the remaining 55% can be attributed to unknown
variables. Seepage, channel loss, subsurface soil conditions, temperature, wind, and impoundments contribute to
the inherent variability in this relationship.
Figure 5. Annual Rainfall and Elevation Change
-8
-6
-4
-2
0
2
4
6
8
10
0
5
10
15
20
25
30
35
40
45
2002 2003 2004 2005 2006 2007 2008 2009 2010 2011 2012 2013
Ele
va
tio
n C
ha
ng
e (
fee
t)
Rain
fall
(in
ch
es)
Annual Rainfall and Elevation Change
Rainfall (inches) Elevation Change (feet)
Pg. 05
Lake Graham-Eddleman Elevation Study
5
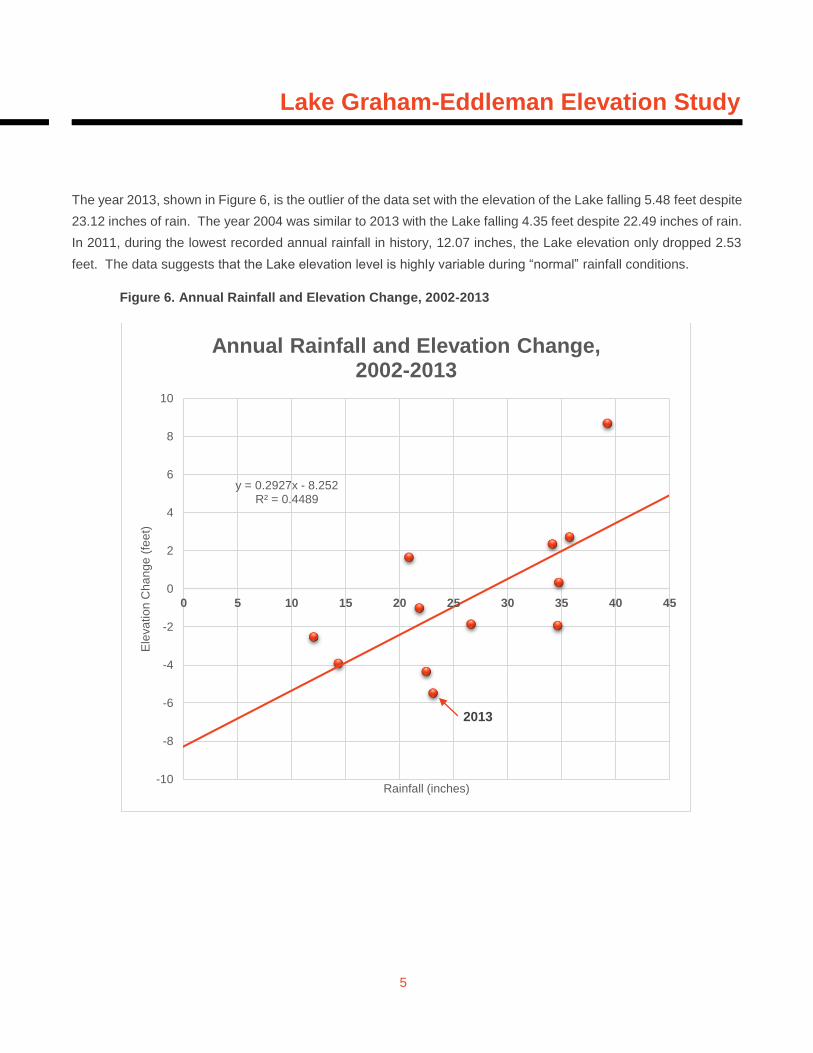
The year 2013, shown in Figure 6, is the outlier of the data set with the elevation of the Lake falling 5.48 feet despite
23.12 inches of rain. The year 2004 was similar to 2013 with the Lake falling 4.35 feet despite 22.49 inches of rain.
In 2011, during the lowest recorded annual rainfall in history, 12.07 inches, the Lake elevation only dropped 2.53
feet. The data suggests that the Lake elevation level is highly variable during “normal” rainfall conditions.
Figure 6. Annual Rainfall and Elevation Change, 2002-2013
y = 0.2927x - 8.252R² = 0.4489
-10
-8
-6
-4
-2
0
2
4
6
8
10
0 5 10 15 20 25 30 35 40 45
Ele
va
tio
n C
ha
ng
e (
fee
t)
Rainfall (inches)
Annual Rainfall and Elevation Change, 2002-2013
2013
Pg. 06
Lake Graham-Eddleman Elevation Study
6
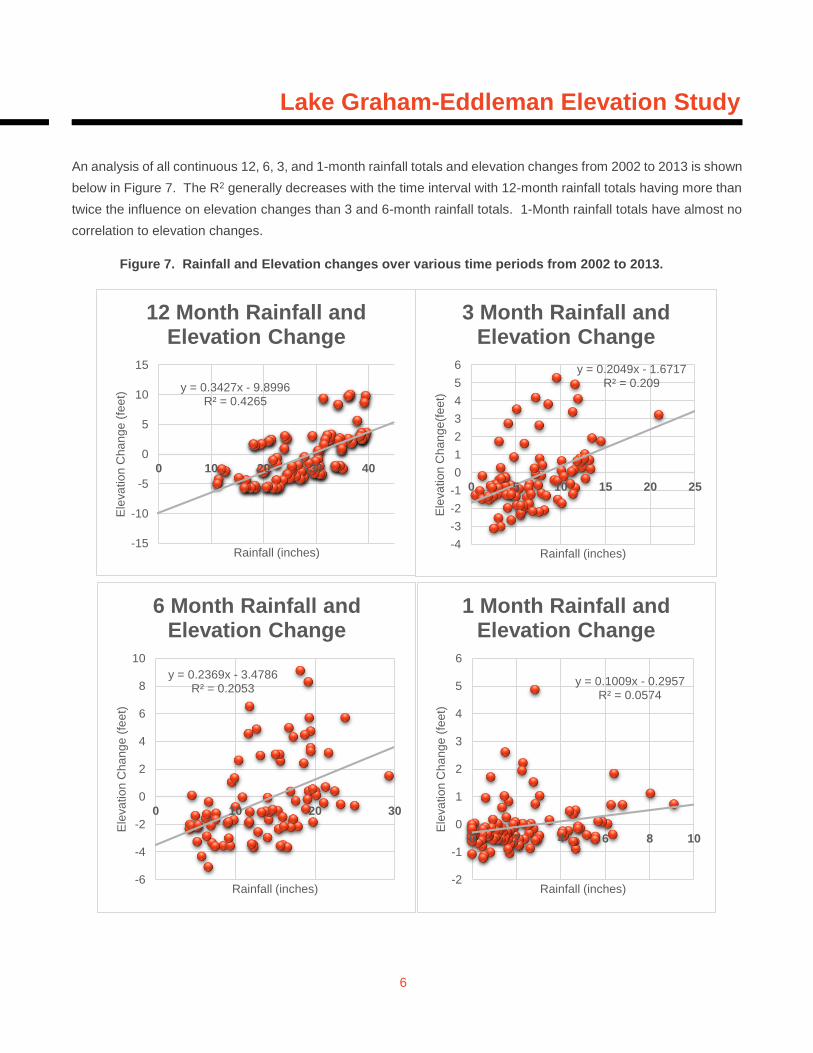
An analysis of all continuous 12, 6, 3, and 1-month rainfall totals and elevation changes from 2002 to 2013 is shown
below in Figure 7. The R2 generally decreases with the time interval with 12-month rainfall totals having more than
twice the influence on elevation changes than 3 and 6-month rainfall totals. 1-Month rainfall totals have almost no
correlation to elevation changes.
Figure 7. Rainfall and Elevation changes over various time periods from 2002 to 2013.
y = 0.3427x - 9.8996R² = 0.4265
-15
-10
-5
0
5
10
15
0 10 20 30 40
Ele
va
tio
n C
ha
ng
e (
fee
t)
Rainfall (inches)
12 Month Rainfall and Elevation Change
y = 0.2049x - 1.6717R² = 0.209
-4
-3
-2
-1
0
1
2
3
4
5
6
0 5 10 15 20 25
Ele
va
tio
n C
ha
ng
e(f
ee
t)
Rainfall (inches)
3 Month Rainfall and Elevation Change
y = 0.2369x - 3.4786R² = 0.2053
-6
-4
-2
0
2
4
6
8
10
0 10 20 30
Ele
va
tio
n C
ha
ng
e (
fee
t)
Rainfall (inches)
6 Month Rainfall and Elevation Change
y = 0.1009x - 0.2957R² = 0.0574
-2
-1
0
1
2
3
4
5
6
0 2 4 6 8 10
Ele
va
tio
n C
ha
ng
e (
fee
t)
Rainfall (inches)
1 Month Rainfall and Elevation Change
Pg. 07
Lake Graham-Eddleman Elevation Study
7
Historic Recharge Events
July, 2004
In one week, from July 25 to July 31, the elevation of the Lake increased 6.26 feet from 1063.43 to 1069.69 feet.
The volume of the Lake increased during this event by 11,176 acre-feet. Less than 0.1 inches of rain fell on July
25 and 26 and 1.69 inches was recorded on July 28. An average of 1.69 inches of rain over the 221 square mile
watershed represents 19,942 acre-feet of water, of which 56% ran off and flowed into the Lake.
In the month of June, 2004, 6.12 inches of rain was recorded and the elevation of the Lake increased 0.19 feet.
During April, May, and June of 2004, 12.25 inches of rain was recorded and the elevation of the Lake increased
0.65 feet. During the 3 month period prior to July, 2004, approximately 144,000 acre-feet of rain fell in the Lake’s
watershed of which less than 1% ran off and flowed into the Lake. The rainfall in April, May, and June of 2004
saturated subsurface soils and filled impoundments making it possible for a major runoff event in July, 2004.
March-July, 2007
From March to July, 2007, the elevation of the Lake increased 5.45 feet from 1069.77 to 1075.22 feet. The volume
of the Lake increased during this time by 12,511 acre-feet. During this 5-month period, 26.05 inches of rain was
recorded including 10.68 inches in June. 26.05 inches of rain amount to approximately 300,000 acre feet of water
in the Lake’s watershed. Much of the runoff from this event was probably not captured and passed downstream
once the elevation level exceeded conservation pool capacity of 1075.0 feet.
April, 2010
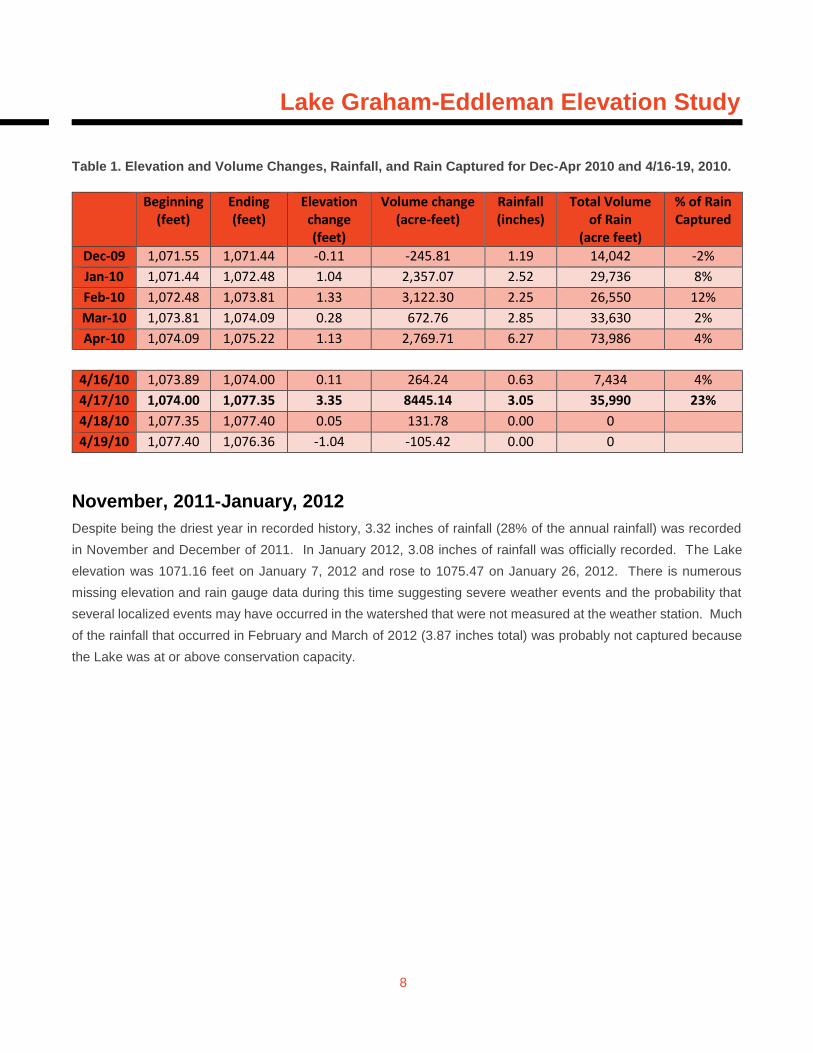
From December, 2009 to April 16, 2010, 8.81 inches or rainfall and snow was recorded. During this time, the Lake
elevation increased from 1071.55 to 1073.89. On April 15, 2010, 3.05 inches of rain fell raising the lake elevation
3.35 feet to 1077.35 feet and exceeding conservation pool capacity. Again, much of this event was not captured.
The statistics for the five month period from December, 2009 to April, 2010 and for April 16-19, 2010 are shown in
Table 1.
Pg. 08
Lake Graham-Eddleman Elevation Study
8
Table 1. Elevation and Volume Changes, Rainfall, and Rain Captured for Dec-Apr 2010 and 4/16-19, 2010.
Beginning (feet)
Ending (feet)
Elevation change (feet)
Volume change (acre-feet)
Rainfall (inches)
Total Volume of Rain
(acre feet)
% of Rain Captured
Dec-09 1,071.55 1,071.44 -0.11 -245.81 1.19 14,042 -2%
Jan-10 1,071.44 1,072.48 1.04 2,357.07 2.52 29,736 8%
Feb-10 1,072.48 1,073.81 1.33 3,122.30 2.25 26,550 12%
Mar-10 1,073.81 1,074.09 0.28 672.76 2.85 33,630 2%
Apr-10 1,074.09 1,075.22 1.13 2,769.71 6.27 73,986 4%
4/16/10 1,073.89 1,074.00 0.11 264.24 0.63 7,434 4%
4/17/10 1,074.00 1,077.35 3.35 8445.14 3.05 35,990 23%
4/18/10 1,077.35 1,077.40 0.05 131.78 0.00 0
4/19/10 1,077.40 1,076.36 -1.04 -105.42 0.00 0
November, 2011-January, 2012
Despite being the driest year in recorded history, 3.32 inches of rainfall (28% of the annual rainfall) was recorded
in November and December of 2011. In January 2012, 3.08 inches of rainfall was officially recorded. The Lake
elevation was 1071.16 feet on January 7, 2012 and rose to 1075.47 on January 26, 2012. There is numerous
missing elevation and rain gauge data during this time suggesting severe weather events and the probability that
several localized events may have occurred in the watershed that were not measured at the weather station. Much
of the rainfall that occurred in February and March of 2012 (3.87 inches total) was probably not captured because
the Lake was at or above conservation capacity.
Pg. 09
Lake Graham-Eddleman Elevation Study
9
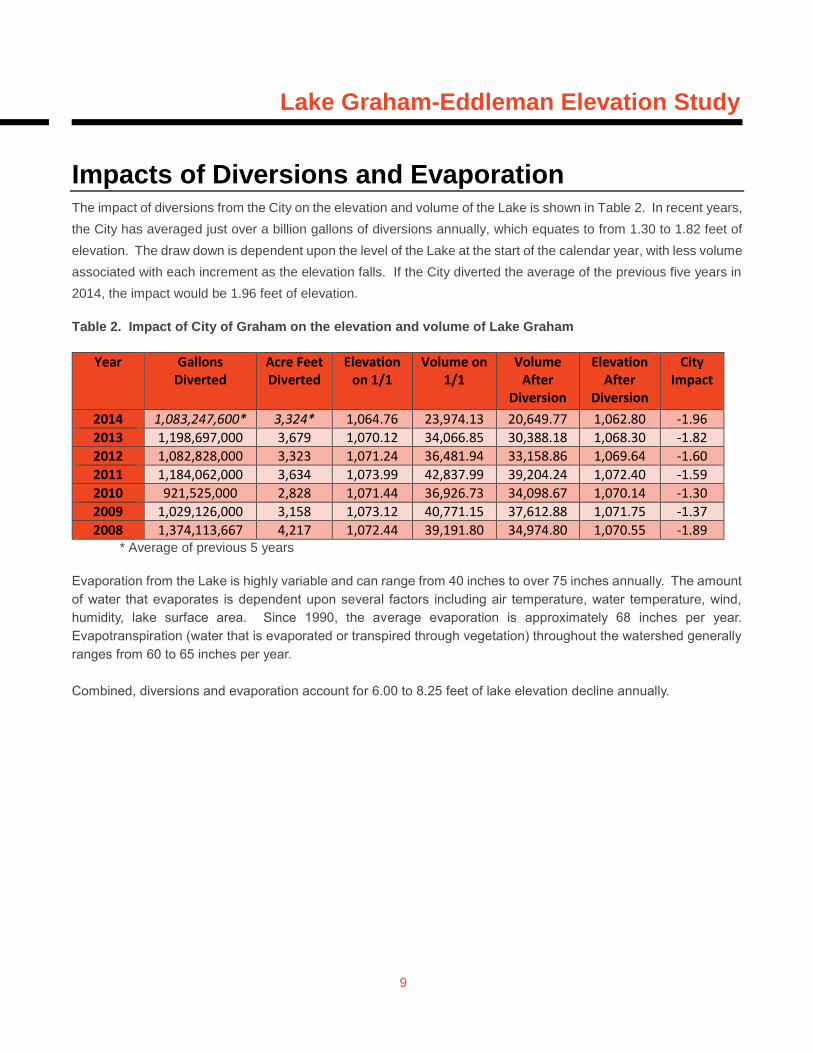
Impacts of Diversions and Evaporation The impact of diversions from the City on the elevation and volume of the Lake is shown in Table 2. In recent years,
the City has averaged just over a billion gallons of diversions annually, which equates to from 1.30 to 1.82 feet of
elevation. The draw down is dependent upon the level of the Lake at the start of the calendar year, with less volume
associated with each increment as the elevation falls. If the City diverted the average of the previous five years in
2014, the impact would be 1.96 feet of elevation.
Table 2. Impact of City of Graham on the elevation and volume of Lake Graham
Year Gallons Diverted
Acre Feet Diverted
Elevation on 1/1
Volume on 1/1
Volume After
Diversion
Elevation After
Diversion
City Impact
2014 1,083,247,600* 3,324* 1,064.76 23,974.13 20,649.77 1,062.80 -1.96
2013 1,198,697,000 3,679 1,070.12 34,066.85 30,388.18 1,068.30 -1.82
2012 1,082,828,000 3,323 1,071.24 36,481.94 33,158.86 1,069.64 -1.60
2011 1,184,062,000 3,634 1,073.99 42,837.99 39,204.24 1,072.40 -1.59
2010 921,525,000 2,828 1,071.44 36,926.73 34,098.67 1,070.14 -1.30
2009 1,029,126,000 3,158 1,073.12 40,771.15 37,612.88 1,071.75 -1.37
2008 1,374,113,667 4,217 1,072.44 39,191.80 34,974.80 1,070.55 -1.89 * Average of previous 5 years
Evaporation from the Lake is highly variable and can range from 40 inches to over 75 inches annually. The amount
of water that evaporates is dependent upon several factors including air temperature, water temperature, wind,
humidity, lake surface area. Since 1990, the average evaporation is approximately 68 inches per year.
Evapotranspiration (water that is evaporated or transpired through vegetation) throughout the watershed generally
ranges from 60 to 65 inches per year.
Combined, diversions and evaporation account for 6.00 to 8.25 feet of lake elevation decline annually.
Pg. 10
Lake Graham-Eddleman Elevation Study
10
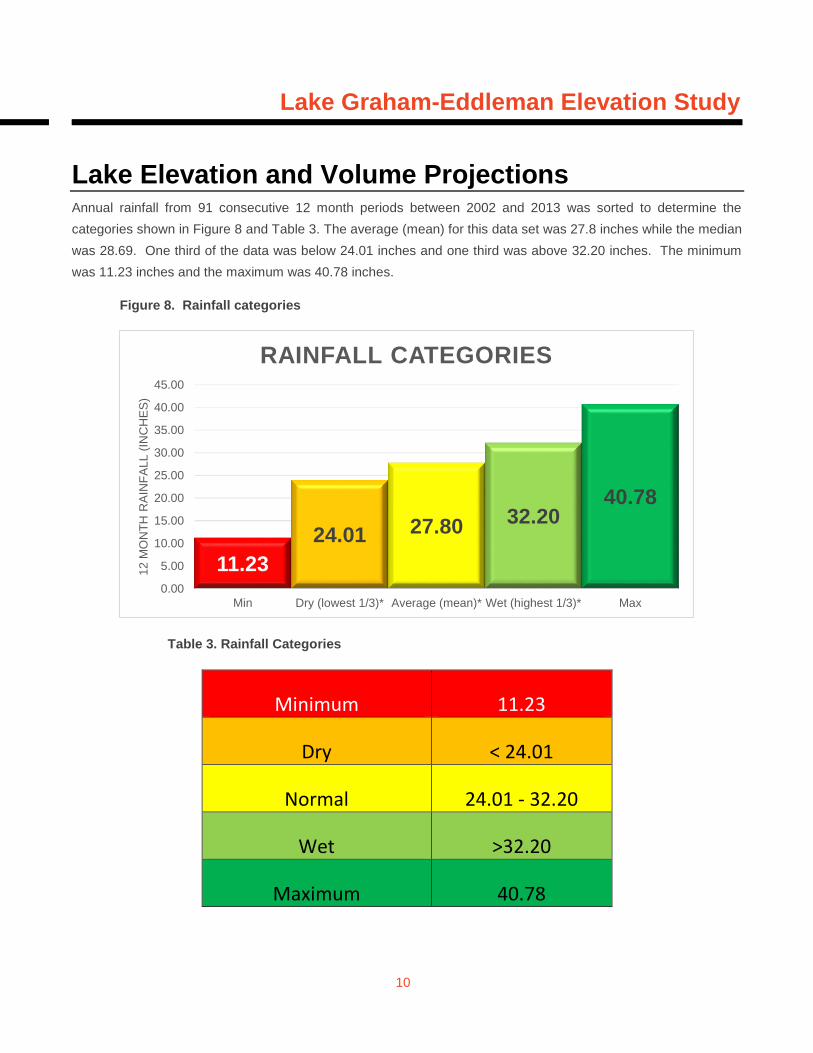
Lake Elevation and Volume Projections Annual rainfall from 91 consecutive 12 month periods between 2002 and 2013 was sorted to determine the
categories shown in Figure 8 and Table 3. The average (mean) for this data set was 27.8 inches while the median
was 28.69. One third of the data was below 24.01 inches and one third was above 32.20 inches. The minimum
was 11.23 inches and the maximum was 40.78 inches.
Figure 8. Rainfall categories
Table 3. Rainfall Categories
Minimum 11.23
Dry < 24.01
Normal 24.01 - 32.20
Wet >32.20
Maximum 40.78
11.23
24.01 27.8032.20
40.78
0.00
5.00
10.00
15.00
20.00
25.00
30.00
35.00
40.00
45.00
Min Dry (lowest 1/3)* Average (mean)* Wet (highest 1/3)* Max
12
MO
NT
H R
AIN
FA
LL
(IN
CH
ES
)
RAINFALL CATEGORIES
Pg. 11
Lake Graham-Eddleman Elevation Study
11
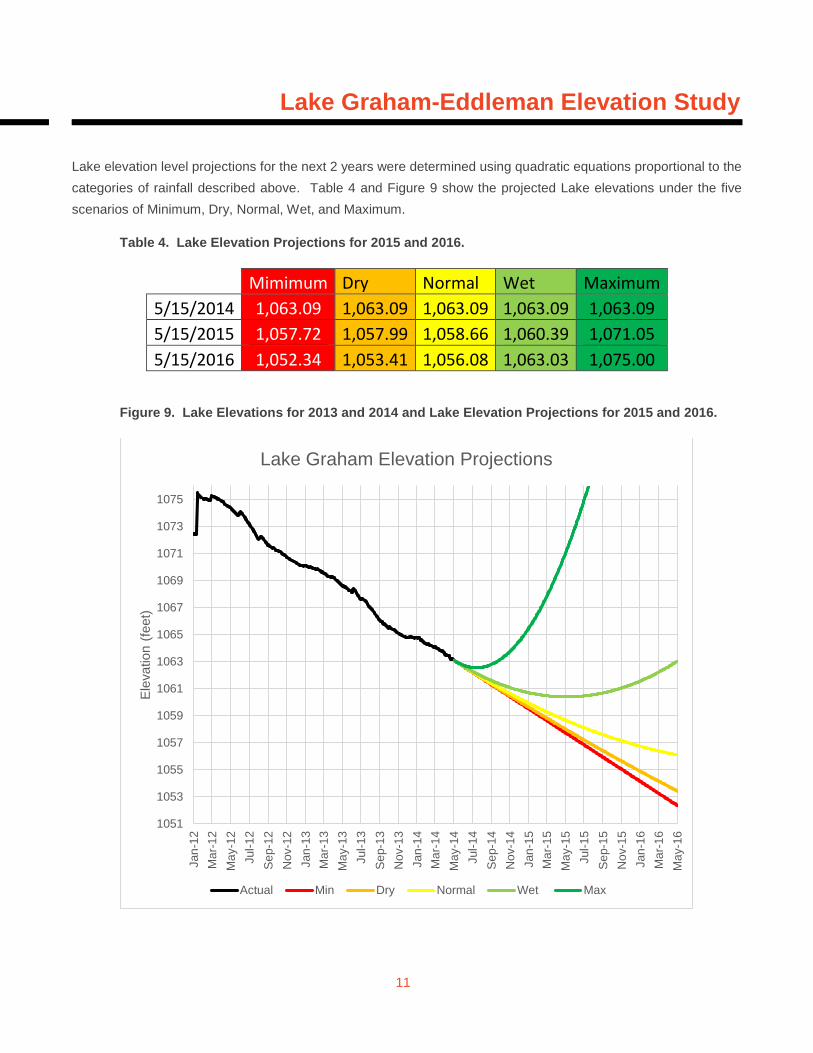
Lake elevation level projections for the next 2 years were determined using quadratic equations proportional to the
categories of rainfall described above. Table 4 and Figure 9 show the projected Lake elevations under the five
scenarios of Minimum, Dry, Normal, Wet, and Maximum.
Table 4. Lake Elevation Projections for 2015 and 2016.
Mimimum Dry Normal Wet Maximum
5/15/2014 1,063.09 1,063.09 1,063.09 1,063.09 1,063.09
5/15/2015 1,057.72 1,057.99 1,058.66 1,060.39 1,071.05
5/15/2016 1,052.34 1,053.41 1,056.08 1,063.03 1,075.00
Figure 9. Lake Elevations for 2013 and 2014 and Lake Elevation Projections for 2015 and 2016.
1051
1053
1055
1057
1059
1061
1063
1065
1067
1069
1071
1073
1075
Jan
-12
Ma
r-1
2
Ma
y-1
2
Jul-
12
Se
p-1
2
Nov-1
2
Jan
-13
Ma
r-1
3
Ma
y-1
3
Jul-
13
Se
p-1
3
Nov-1
3
Jan
-14
Ma
r-1
4
Ma
y-1
4
Jul-
14
Se
p-1
4
No
v-1
4
Jan
-15
Ma
r-1
5
Ma
y-1
5
Jul-
15
Se
p-1
5
Nov-1
5
Jan
-16
Ma
r-1
6
Ma
y-1
6
Ele
vation (
feet)
Lake Graham Elevation Projections
Actual Min Dry Normal Wet Max
Pg. 12
Lake Graham-Eddleman Elevation Study
12
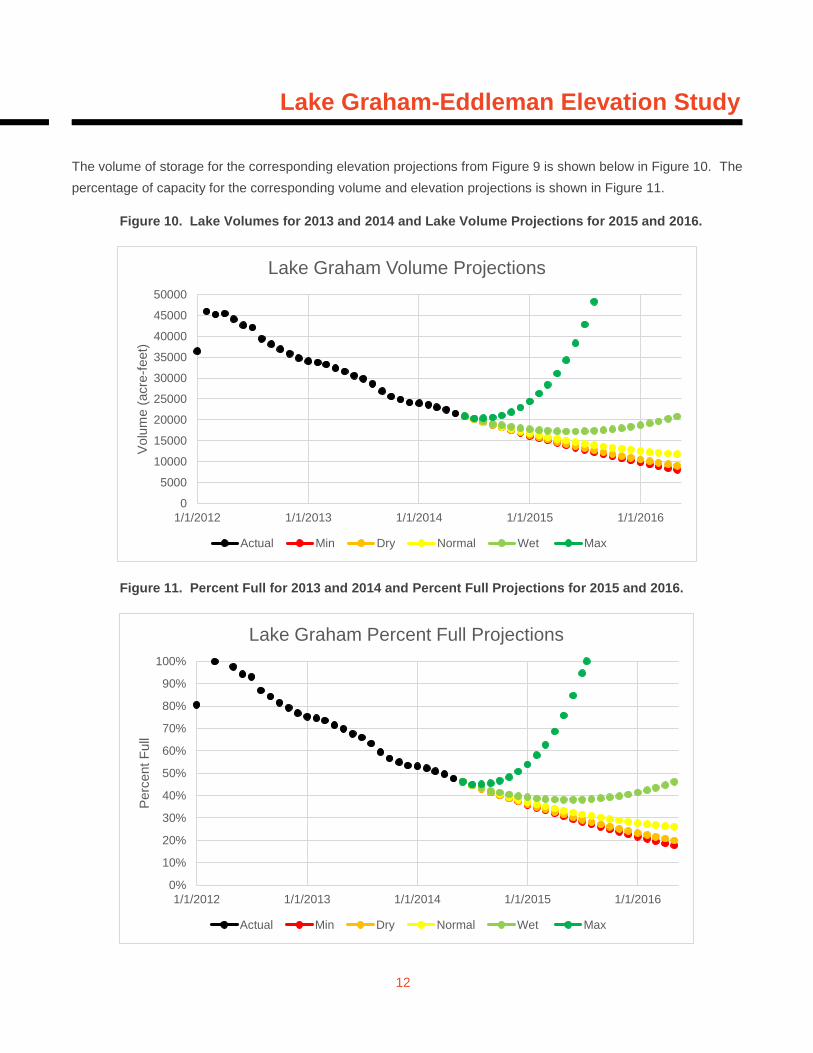
The volume of storage for the corresponding elevation projections from Figure 9 is shown below in Figure 10. The
percentage of capacity for the corresponding volume and elevation projections is shown in Figure 11.
Figure 10. Lake Volumes for 2013 and 2014 and Lake Volume Projections for 2015 and 2016.
Figure 11. Percent Full for 2013 and 2014 and Percent Full Projections for 2015 and 2016.
0
5000
10000
15000
20000
25000
30000
35000
40000
45000
50000
1/1/2012 1/1/2013 1/1/2014 1/1/2015 1/1/2016
Volu
me (
acre
-feet)
Lake Graham Volume Projections
Actual Min Dry Normal Wet Max
0%
10%
20%
30%
40%
50%
60%
70%
80%
90%
100%
1/1/2012 1/1/2013 1/1/2014 1/1/2015 1/1/2016
Perc
ent
Full
Lake Graham Percent Full Projections
Actual Min Dry Normal Wet Max
Pg. 13
Lake Graham-Eddleman Elevation Study
13
Conclusions Under “dry” rainfall conditions, the Lake has declined over 12 feet in elevation over the previous 27 months. At the
present rate of elevation decline, the Lake level will reach the level of the City’s intake structure by November, 2015.
A lake floor ridge that could present an obstruction to the flow of water to the intake structure was identified recently
at 1058 feet and could be reached by May, 2015. Under continued dry rainfall conditions, the Lake could fall below
20% capacity by January, 2016.
Lack of above average and exceptional rainfall events in recent history have contributed to a cumulative deficit of
rainfall and subsequent inflows into the Lake. Upstream soil conditions in the watershed are extremely dry.
Additionally, impoundments in the watershed are mostly empty at this time and have a high capacity to capture
runoff from minor and normal rainfall events. This analysis concludes that, based upon historical data, a series of
prolonged wet conditions or a maximum (flood) event would be necessary to significantly raise the elevation of Lake
Graham within the next 2 years.