Embed Size (px)
Citation preview
Niina Sallinen & Ulla Kotonen (toim.)
Lahti Circular EconomyAnnual Review 2019
Anni Orola (ed.)
The Publication Series of Lahti University of Applied Sciences, part 56
Dig
ital
Ser
vice
s
Tec
hnolo
gy Solutions Sustainable Environment Resource Efficiency

2
Lahti Circular Economy Annual Review 2019

The Publication Series of Lahti University of Applied Sciences, part 56Editor-in-chief: Miia WillmanLayout: Mainostoimisto SST OyISSN 2342-7507 (PDF) ISSN 2342-7493 (print)ISBN 978-951-827-323-6 (PDF)ISBN 978-951-827-324-3 (print)Lahti, 2019

ContentsAbout the Authors 6
Kati ManskinenForeword 9 Katerina Medkova, Susanna Vanhamäki, Johanna Snell Bio-based Circular Economy Action Plan Sets the Future Steps in Päijät-Häme 12
Anne-Marie TuomalaIndustry 4.0 and the Circular Economy Shake Hands without Forgetting Sustainability 18 Ari Serkkola, Matti Welin, Aleksi Kinnunen, Karri Miettinen Digimaa Application for the Purchase of Soil and Recycled Materials 24
Sami Luste, Katerina Medkova, Tapio KilponenExperiences of the Utilization of the Six Sigma Tool with the Wastewater Treatment Plant (WWTP) Data 32
Matti WelinLearning by Playing – Case WWTP Game 40
Kimmo HeponiemiMaterial Flow Cost Accounting – a Tool for Better Material Efficiency 50
Lea Heikinheimo, Erika TapaninenInternational Studies in Resource Efficiency and Circular Economy around the Baltic Sea 54
Oliver Carlo, Mahmudul Chowdhury, Eeva Aarrevaara and Silja KostiaExploring Japanese Cooperation Opportunities 58

6
Eeva Aarrevaara, D.Sc. (Arch.), is a Principal Lecturer at Lahti University of Applied Sciences, Faculty of Technology. She works for the Master´s Degree Programme in Urban Sustainability and Erasmus Mundus joint Master’s Degree Programme MUrCS (Master in Urban Climate and Sustain-ability). She is also involved in several RDI projects e.g. the HYPE project. Her recent interest is to present and demonstrate connections between urban development and circular economy.
Oliver Carlo, B.E. (Mechanical), is currently pursuing his Master’s degree in Urban Climate and Sustainability (MUrCS), a joint Master’s degree under the Erasmus Plus scholarship umbrella. He has four years of work experience as a sustainability consultant in the green building sector. His interests lie in understanding socio-technical issues and addressing the complexities to bridge the management-related gaps concerning sustainability.
Mahmudul Chowdhury, (B.Arch.), trained as an architect in Dhaka, where he also practiced the profession for two years. He also worked as a research associate at the Bengal Institute, a leading architectural research institute in Bangladesh, for three years. Currently, he is pursuing the Master’s degree in Urban Climate and Sustainability at Lahti University of Applied Sciences. His major interest is in climate sensitive city design and biomimicry approaches.
Lea Heikinheimo, D.Sc. (Tech), works as a Principal Lecturer at Lahti University of Applied Sciences, Faculty of Technology. She is also the project manager of the Crea-RE project.
Kimmo Heponiemi, B. Sc. (Env. Tech) is an RDI Specialist at Lahti University of Applied Sciences, Faculty of Technology. He works as the project manager in the sMARTTA project. His interests are circular economy, material and resource efficiency and industrial symbiosis.
Tapio Kilponen works as a process engineer at Lahti Aqua Ltd. He is an expert on the systems management of wastewater treatment plants.
Aleksi Kinnunen, B.Sc. (Media Technology), works as a graphic designer in the Digimaa project at Lahti University of Applied Sciences, Faculty of Technology. Digimaa is a joint project of LAMK and Aalto University. Aleksi is responsible for the graphical design and look and feel of the Digimaa mobile application.
Silja Kostia, PhD, is Dean of the Faculty of Technology at Lahti University of Applied Sciences. She has a long experience in educational leadership as well as research & development & innova-
About the Authors
7
tion activities in sustainable technologies and solutions. Special focus of her development work has been on regional collaboration with industry, university and other stakeholders, including international collaboration.
Sami Luste, Ph.D. (Env. Tech.), is a researcher at Lahti University of Applied Sciences, Faculty of Technology. He is the project manager in the IWAMA project. His interests are bioeconomy, capacity development, waste and water treatment, by-products and biogas. His main task is to introduce research as a tool for growth for the industry sector.
Katerina Medkova, M.Sc. (Metallurgy), M.I.B. (International Business Management), B.Sc. (Env. Tech.), works as a coordinator of environment-related projects at Lahti University of Applied Sciences, Faculty of Technology. Her main interest lies in circular economy, environmental pro-tection and cleantech. She has nearly 10 years of professional work experience in international business, and in environmental and waste management services.
Karri Miettinen works as a software developer in the Digimaa project at Lahti University of Applied Sciences, Faculty of Technology. Digimaa is a joint project of LAMK and Aalto University. Karri is the lead software developer of the front end of the Digimaa mobile application.
Ari Serkkola, Docent, D.Sc., is a chief research scientist in the Department of Built Environment at Aalto University. He has been the head of several innovation projects developing new environ-mental data management services in enterprise development and circular economy. He has years of multidisciplinary experience in the fields of industrial engineering, health care management and anthropology.
Johanna Snell, M.Sc. (Sustainable Development), works as a project coordinator in Interreg Eu-rope projects in the Regional Council of Päijät-Häme. Her areas of interest include sustainability, circular economy and environmental protection.
Erika Tapaninen, B.Sc., M.Sc. (Tech.) student, works as a specialist at LAMK, Faculty of Technol-ogy, in the focus area of circular economy solutions.
Anne-Marie Tuomala, M.Sc. (Industrial Engineering), MBA (Management & Leadership), M.Sc. (Arts) holds a lecturer’s position at Lahti University of Applied Sciences, Faculty of Technology. Her main fields of interest are renewable energy, industrial symbioses, Industry 4.0 and Society 5.0. She has over 20 years’ experience in international project management, consultation and education development.
8
Susanna Vanhamäki, M.Sc. (Human Geography), works as an RDI specialist and a project manag-er at Lahti University of Applied Sciences, Faculty of Technology. Her interests include sustainabil-ity and circular economy. She has long experience in regional and international R&D projects.
Matti Welin, Lic.Sc. (Software Engineering.), is a principal lecturer in Information and Communi-cations Technology (ICT) at Lahti University of Applied Sciences, Faculty of Technology. His main interests are in software architectures, web and mobile programming. He has done numerous pro-jects in close relation with the industry and the public sector. In the near future, he will be focusing on IoT, data analysis and machine learning technologies using modern cloud platforms in the ITKO project.
Lahti Circular EconomyAnnual Review 2019
Anni Orola (ed.)
The Publication Series of Lahti University of Applied Sciences, part 56
Dig
ital
Ser
vice
s
Tec
hnolo
gy Solutions Sustainable Environment Resource Efficiency
9
This review presents the latest interesting re-search, development and innovation activities in the context of Circular Economy written by ex-perts from Lahti University of Applied Sciences (LAMK) and their partners. Lahti UAS is develop-ing innovations and incentives that enable the transition towards a carbon neutral society. The aim of our university is to create new technol-ogies and digital solutions as well as systemic approaches and resource efficient methods that promote the sustainable circulation of materials.
The circular economy is promoted through European and national level policies. However, the regions play an essential role when practi-cal cases of circular economy are implement-ed in real-word systems. The circular economy was chosen to be one of the three spearheads in the revised Päijät-Häme regional development strategy and programme 2018–2021 (Päijät-Häme Regional Council, 2017). The region is especially well-known for bio-based circular economy with several recognized transferable good practices such as a co-operation model of the grain cluster or bio-based industrial symbiosis of Labio Ltd (In-terreg Europe, 2019). In order to further strength-en the bio-based circular economy in the region, a Bio-based Circular Economy Action Plan was drawn up in 2018. The first article of this review, written by Ms. Katerina Medkova, Ms. Susanna Vanhamäki and Ms. Johanna Snell, describes the concrete actions stimulating regional bio-based circular economy.
When talking about the circular economy, the significance of digitalization is often highlighted.
Digitalization can boost the sustainable circula-tion of material, e.g. by providing accurate infor-mation on the availability, location and condition of products (Antikainen et al., 2018). The article written by Ms. Anne-Marie Tuomala presents how industrial smart system platforms enable the transition towards circular economy and UN’s 17 Sustainability Development Goals. The digitalization also plays a major role in the arti-cle of Dr. Ari Serkola, Mr. Karri Miettinen and Mr. Aleksi Kinnunen, who present a new mobile cloud service called “Digimaa”, for the purchase of soil and recycled materials. Furthermore, the article written by Dr. Sami Luste, Ms. Katerina Medkova and Mr. Tapio Kilponen share the experiences of the utilization of the Six Sigma tool with waste-water treatment plant data. These actions were performed in a partly EU-funded (Interreg Baltic Sea region) Interactive Water Management (IWA-MA) project. In the same project, one of sub tar-gets was to develop a game for developing the competence of the wastewater treatment opera- tors. The game was designed and implement-ed by students from LAMK, and in his article Mr. Matti Welin describes the interesting game developing project from the perspective of the professor.
Resource efficiency is in the core of circu-lar economy. The article written by Mr. Kimmo Heponiemi presents a new tool for material flow cost accounting, which was developed for the needs of SMEs. Moreover, the importance of resource efficiency together with high quality education is pointed out by Dr. Lea Heikinhei-
Kati Manskinen
Foreword

10
mo and Ms. Erika Tapaninen, who in their arti-cle introduce co-created study methods for in-ternational students around the Baltic Sea. The international partnership networks offer our stu-dents a chance to expand their knowledge in an intercultural environment. LAMK’s new master’s program MUrCS (Master in Urban Climate and Sustainability) has opened new possibilities for international co-operation. Two MUrCS program students, Mr. Oliver Carlo and Mr. Mahmudul Chowdhury, joined a co-operation project where the City of Lahti strengthens co-operation with the City of Kyoto and the Kyoto prefecture in the field of environmental expertise, education and circular economy. In their interesting article, the students, together with Dr. Eeva Aarrevaara and Dr. Silja Kostia, describe their experiences of Finnish-Japanese collaboration.
Dig
ital
Bus
ines
s
Touris
m and Event Management Supply Chain Management Responsible B
usiness
FESTIVAL
I warmly thank all authors who made it pos-sible to publish this review once again. I express my sincere thanks to all authors who published their latest results in the review. I am very glad that many of you had a chance to share your in-teresting results here. I express my gratitude to the editor of the review Ms. Anni Orola and to Ms. Maija Varala for correcting the English language of the articles. I hope that this review gives you some new insights and further ideas in the tran-sition towards circular economy society.
Lahti, 10 November, 2019Dr. Kati ManskinenRDI Director Circular Economy Solutions LAMK
References
Antikainen, M., Uusitalo, T. & Kivikytö-Reponen, P. 2018. Digitalisation as an Enabler of Circular Economy. Procedia CIRP. Vol. 73, 45-49. [Cited 9 Nov 2019]. Available at: https://doi.org/10.1016/j.procir.2018.04.027
Interreg Europe. 2019. Policy Learning Platform System. Interreg Europe. [Cited 10 Nov 2019]. Avail-able at: https://www.interregeurope.eu/policylearning
Päijät-Hämeen liitto. 2017. Päijät-Häme maakuntastrategia ja -ohjelma. Päijät-Hämeen liiton julkaisu A 235. [Cited 9 Nov 2018]. Available at: http://www.paijat-hame.fi/wp-content/uploads/2018/01/Maakuntastrategia_ja_ohjelma_2018-2021_nettiin.pdf

11

12
Katerina Medkova, Susanna Vanhamäki, Johanna Snell
Bio-based Circular Economy Action Plan Sets the Future Steps in Päijät-HämeIn bio-based circular economy, biological re-sources are used and managed sustainably, and economic, social and ecological values of products and nutrients are maintained for as
long as possible. This article presents how bio-based circular economy is developed through a bottom-up action plan in the Päijät-Häme re-gion.
Figure 1. Bio-based circular economy offers solutions towards more sustainable future (Photo by Mac Mullins from Pexels).
13
Policy Background - EU, National and Regional LevelThe European Commission (EC) strongly supports circular economy and bioeconomy. In 2015, the first circular economy package consisted of an EU circular economy Action Plan and proposals for waste legislation revision, was published by the EC. A new circular economy package includ-ing the revised Waste and Packaging Directives to be implemented by all Member States by June 2020 at the latest, was published in 2018. Also, the EU’s Bioeconomy Strategy was updated in 2018, to meet current environmental, social and economic challenges. In Finland, The Finnish Road Map to a Circular Economy 2016-2025 was published in 2016.
It was the world’s first national circular econo- my roadmap, which described actions for Finland to become a pioneer in the circular economy. In 2019, an update of the roadmap, Finland’s Road Map to The Circular Economy 2.0 ensued. Fur-thermore, in 2014, the Finnish Bioeconomy Strat-egy was issued with a vision of sustainable solu-tions for bioeconomy to be the basis of Finland’s well-being and competitiveness.
At the end of 2017, the Päijät-Häme Regional Development Strategy and Plan for 2018–2021 was approved, defining the region’s three smart specialization spearheads: (1) circular economy, (2) design, and (3) sports and experiences. More-over, the strategy recognizes the importance of circularity and bioeconomy for the rural vitality of the region. (Päijät-Hämeen liitto 2017)
In 2017, the strategy’s circular economy ob-jectives and actions were further clarified in the Päijät-Häme Roadmap Towards Circular Economy. With the vision of Päijät-Häme to be a success-ful, resource-efficient region by 2030 in mind, five themes were specified in the road-map: (1) sus-
tainable business from the bio circular economy; (2) new consumption models and business oppor-tunities; (3) closed loops of technical streams; (4) moving towards energy self-sufficiency; and (5) piloting and demonstrating innovative solutions. In 2018, the regional circular economy roadmap was updated. As a central part of the update, the bio-based circular economy actions were listed: making a bio-based circular economy action plan, developing separate collection and composting of bio-waste, closing nutrient cycles, and new inno-vations in bioproducts and bioenergy.
In order to strengthen the bio-based circu-lar economy in the Päijät-Häme region, Finland, a Bio-based Circular Economy Action Plan was drawn up in 2018 in cooperation with regional stakeholders of the Päijät-Häme Circular Econ-omy Cooperation Group. The Group comprises of representatives of regional public authorities, academia, and business.
BIOREGIO Lays Cornerstone for Ac-tion PlanBIOREGIO, an Interreg Europe funded project (2017-2021), aims to boost regional bio-based circular economy through a transfer of expertise about best available technologies and coopera-tion models. During the project, bio-based circu-lar economy Good Practices have been identified in the project’s regions in Finland, Spain, Slova-kia, Greece, Romania, and France. Selected in-spiring Good Practices were/will then be utilized in defining actions in the regional action plans. BIOREGIO also strives for improving effectiveness of structural funds by adjusting its management and strategic focus on the bio-based circular economy development, and new bio circular economy projects funding.
14
Päijät-Häme Regional Council steered the Action Plan drafting and together with Lahti Uni-versity of Applied Sciences (LAMK) participated in the writing process. Both LAMK and the Coun-cil are BIOREGIO project partners and LAMK acts as a lead partner. The Päijät-Häme Bio-based Circular Economy Action Plan is issued in Finn-ish and English.
The Action Plan was approved and signed by the Regional Director, Laura Leppänen in May 2019. The Päijät-Häme Bio-based Circular Econo-my Action Plan’s implementation will be followed up by the Päijät-Häme Circular Economy Coope- ration Group and the BIOREGIO project. At the same time, the group is committed to update the earlier-mentioned Päijät-Häme Roadmap Towards Circular Economy.
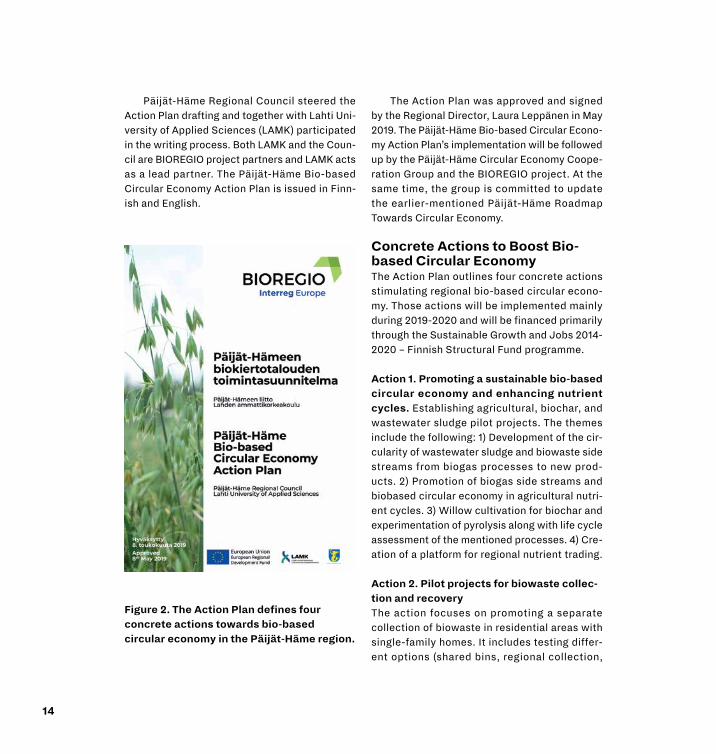
Concrete Actions to Boost Bio-based Circular EconomyThe Action Plan outlines four concrete actions stimulating regional bio-based circular econo-my. Those actions will be implemented mainly during 2019-2020 and will be financed primarily through the Sustainable Growth and Jobs 2014-2020 – Finnish Structural Fund programme.
Action 1. Promoting a sustainable bio-based circular economy and enhancing nutrient cycles. Establishing agricultural, biochar, and wastewater sludge pilot projects. The themes include the following: 1) Development of the cir-cularity of wastewater sludge and biowaste side streams from biogas processes to new prod-ucts. 2) Promotion of biogas side streams and biobased circular economy in agricultural nutri-ent cycles. 3) Willow cultivation for biochar and experimentation of pyrolysis along with life cycle assessment of the mentioned processes. 4) Cre-ation of a platform for regional nutrient trading.
Action 2. Pilot projects for biowaste collec-tion and recoveryThe action focuses on promoting a separate collection of biowaste in residential areas with single-family homes. It includes testing differ-ent options (shared bins, regional collection,
Figure 2. The Action Plan defines four concrete actions towards bio-based circular economy in the Päijät-Häme region.
15
composting and co-composting), as well as conducting life-cycle assessment. Also, raising awareness of residents to reduce the amount of biowaste through a user-oriented approach is in focus.
Action 3. Promoting the use of bio-products and bioenergyTogether with companies, industrial symbio-sis and opportunities for developing bio-based products e.g. bioplastics are promoted. The action comprises the development of piloting and testing environments for bio-based ma-terials, e.g. pyrolysis and digestion, and ex-ploring novel small-scale bioenergy solutions. Moreover, industrial symbiosis e.g. in order to close CO₂ cycles, and development of new products from bio-based side-streams are promoted. Also, the regional Climate Change Mitigation Roadmap is drafted in the region.
Action 4. Päijät-Häme as an international reference area for circular economy The last action concludes the other three as it underlines the strategic development of the cir-cular economy on the regional level. It includes dissemination of new solutions and good prac-tices in the region, as well as internationally, and strengthening the expertise of circular economy in cooperation with universities and companies. ConclusionsThe Bio-based Circular Economy Action Plan is a good example of how projects, as BIOREGIO, may provide concrete actions towards more sus-tainable future, and enhance cooperation in the region and between the regions, to benefit citi-zens, public and private sectors alike. Further-more, research and development projects are
capable to implement strategical goals. The development process of the Action Plan
has emphasized that cooperation between dif-ferent sectors and levels is a necessity when re-sults are sought after, and a systemic approach is needed in a way towards sustainable transi-tion. We have reached the point were visions need to be met, and strategies must become reality. Regarding bio-based circular economy, the Action Plan will serve as a regional tool for the follow-up process during the coming years.
This article reflects the authors’ views; the Inter-reg Europe programme authorities are not liable for any use that may be made of the information contained therein.
16
References
BIOREGIO. 2019a. Project Summary. Interreg Europe. [Cited 22 Sep 2019]. Available at: https://www.interre-geurope.eu/bioregio/
BIOREGIO. 2019b. Good Practices. Interreg Europe. [Cited 22 Sep 2019]. Available at: https://www.interre-geurope.eu/bioregio/good-practices/
BIOREGIO. 2019c. Päijät-Häme Bio-based Circular Economy Action Plan. Interreg Europe. [Cited 22 Sep 2019]. Available at: https://www.interregeurope.eu/bioregio/library/#folder=1725
European Commission 2015. Closing the loop – An EU action plan for the Circular Economy. [Cited 22 Sep 2019]. Available at: https://eur-lex.europa.eu/legal-content/EN/TXT/?qid=1453384154337&uri=CELEX:52015DC0614
European Commission 2018a. Circular Economy Package. [Cited 22 Sep 2019]. Available at: http://ec.europa.eu/environment/circular-economy/index_en.htm
European Commission 2018b. The bioeconomy strategy. [Cited 22 Sep 2019]. Available at: https://ec.europa.eu/research/bioeconomy/index.cfm?pg=policy&lib=strategy
Ministry of Employment and the Economy. 2019. Sustainable Growth and Employment 2014-2020. [Cited 12 Sep 2019]. Available at: http://www.rakennerahastot.fi/documents/27742/432739/Sustainable+growth+and+-jobs+2014-2020+brochure.pdf/d8ed1314-0d5a-46f2-b1ba-14d6257658ba
Päijät-Hämeen liitto. 2017. Päijät-Hämeen strategia ja maakuntaohjelma 2018-2021. [Cited 10 Sep 2019]. Available at: http://www.paijat-hame.fi/wp-content/uploads/2018/01/Maakuntastrategia_ja_ohjelma_2018-2021_nettiin.pdf
Päijät-Häme Roadmap. 2017. Towards Circular Economy in Finland. [Cited 11 Sep 2019]. Available at: http://www.kohtikiertotaloutta.fi/english/
Sitra 2016. Kierrolla kärkeen - Suomen tiekartta kiertotalouteen 2016–2025. Sitran selvityksiä 117. [Cited 22 Sep 2019]. Available at: https://media.sitra.fi/2017/02/24032626/Selvityksia117-2.pdf
Sitra 2019. Kriittinen siirto. Suomen kiertotalouden tiekartta 2.0. [Cited 22 Sep 2019]. Available at: https://www.sitra.fi/hankkeet/kriittinen-siirto-kiertotalouden-tiekartta-2/
Vanhamaki, S., Medkova, K., Malamakis, A., Kontogianni, S., Marisova, E., Huisman Dellago,D. & Moussiopoulos, N. 2019. Bio-based circular economy in European national and regional strategies. International Journal of Sus-tainable Development and Planning. Vol. 14 (1), 31-43. [Cited 22 Sept 2019]. Available at: https://doi.org/10.2495/SDP-V14-N1-31-43

17

18
Anne-Marie Tuomala
Industry 4.0 and the Circular Economy Shake Hands without Forgetting Sustainability
Industry 4.0 refers to economy on a smart plat-form, and it is also regarded as the 4th industrial revolution. The timing of this industrial era is es-timated to be in years 2006-2030. Finland does not have a national Industry 4.0 development pro-gram or strategy. In our country it has been decid-ed - at least for the time being - to work through the separate technology programs, circular econ-omy (CE) strategy and roadmaps, 5G strategy, and artificial intelligence (AI) development program.
Industry 4.0 changes how we perceive our en-vironment, how we shape our environment, how we communicate with our environment and how we and our environment move from one place to another. When we enter the stage where smart system platforms are in use in different industries (smart energy, smart health, smart agriculture, smart factory, smart logistics etc.), the integra-tion of the circular economy becomes possible. Then we will have Systems of Systems (SoS), where the circular economy has a new opera-tional environment. The SoS of Industry 4.0 and the circular economy increase information flow and opportunities in general and enable to create more resource efficiency. This concerns energy and innovations, products and services, data and information, as well as collaboration and learning.
When observing whether the combination of Industry 4.0. and the CE is sustainable and whether they together generate more sustainable business and a more sustainable society, we can, for instance, apply and benchmark practices of international institutions and other countries. The United Nations (UN) has followed the data volume development since the 1980s and emphasizes that the volume of data in the world is increasing exponentially: 90% of the data in the world has been created in the last two years, and it is an-ticipated to increase by 40% annually (UN 2013).
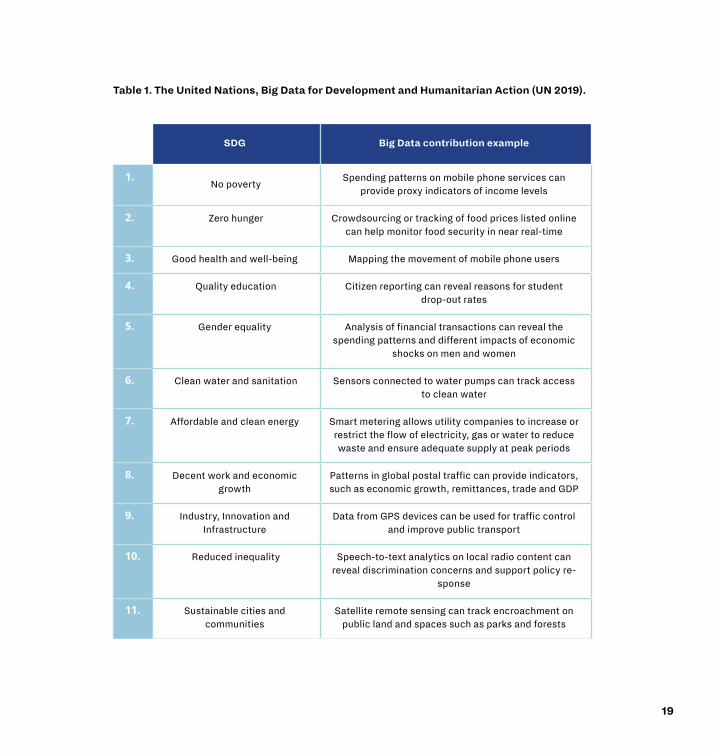
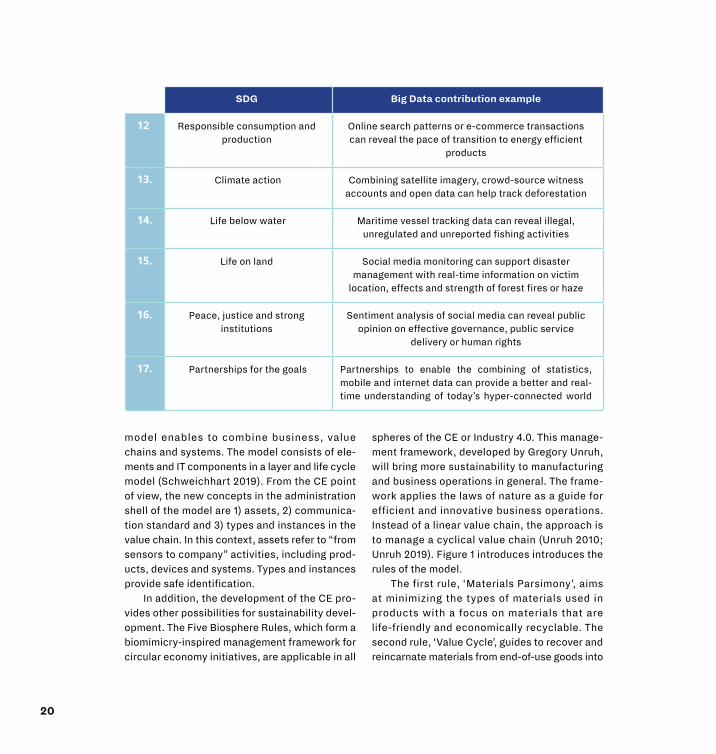
Continually generated large amounts of digi- tal data has been put under the umbrella term Big Data. The UN’s 17 Sustainability Development Goals (SDGs) are known worldwide and applied in all spheres of society and organizations. The following table is applied from the UN’s report “How data science and analytics can contribute to sustainable development”. For each SDG there is an example of how Big Data can contribute to it.
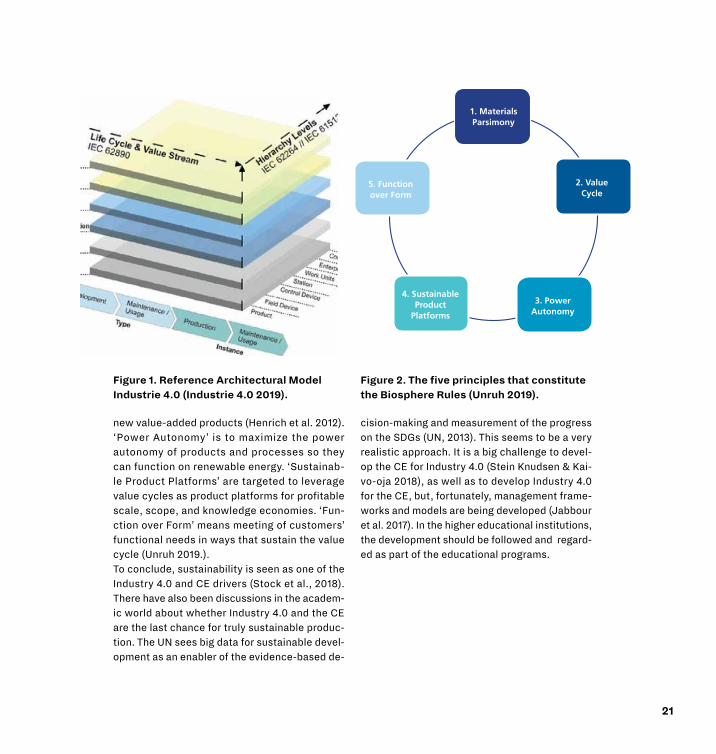
Industry 4.0 helps to highlight new possi-bilities of the CE and sustainability: Reference Architectural Model Industrie (RAMI) is seen as one of them (Dahmen & Roßmann 2018; Müller et al. 2018). This three-dimensional model was presented in 2015 at the Hannover Messe. The
19
SDG Big Data contribution example
1. No poverty
Spending patterns on mobile phone services can provide proxy indicators of income levels
2. Zero hunger Crowdsourcing or tracking of food prices listed online can help monitor food security in near real-time
3. Good health and well-being Mapping the movement of mobile phone users
4. Quality education Citizen reporting can reveal reasons for student drop-out rates
5. Gender equality Analysis of financial transactions can reveal the spending patterns and different impacts of economic
shocks on men and women
6. Clean water and sanitation Sensors connected to water pumps can track access to clean water
7. Affordable and clean energy Smart metering allows utility companies to increase or restrict the flow of electricity, gas or water to reduce waste and ensure adequate supply at peak periods
8. Decent work and economic growth
Patterns in global postal traffic can provide indicators, such as economic growth, remittances, trade and GDP
9. Industry, Innovation and Infrastructure
Data from GPS devices can be used for traffic control and improve public transport
10. Reduced inequality Speech-to-text analytics on local radio content can reveal discrimination concerns and support policy re-
sponse
11. Sustainable cities and communities
Satellite remote sensing can track encroachment on public land and spaces such as parks and forests
Table 1. The United Nations, Big Data for Development and Humanitarian Action (UN 2019).
20
SDG Big Data contribution example
12 Responsible consumption and production
Online search patterns or e-commerce transactions can reveal the pace of transition to energy efficient
products
13. Climate action Combining satellite imagery, crowd-source witness accounts and open data can help track deforestation
14. Life below water Maritime vessel tracking data can reveal illegal, unregulated and unreported fishing activities
15. Life on land Social media monitoring can support disaster management with real-time information on victim
location, effects and strength of forest fires or haze
16. Peace, justice and strong institutions
Sentiment analysis of social media can reveal public opinion on effective governance, public service
delivery or human rights
17. Partnerships for the goals Partnerships to enable the combining of statistics, mobile and internet data can provide a better and real-time understanding of today’s hyper-connected world
model enables to combine business, value chains and systems. The model consists of ele-ments and IT components in a layer and life cycle model (Schweichhart 2019). From the CE point of view, the new concepts in the administration shell of the model are 1) assets, 2) communica-tion standard and 3) types and instances in the value chain. In this context, assets refer to “from sensors to company” activities, including prod-ucts, devices and systems. Types and instances provide safe identification.
In addition, the development of the CE pro-vides other possibilities for sustainability devel-opment. The Five Biosphere Rules, which form a biomimicry-inspired management framework for circular economy initiatives, are applicable in all
spheres of the CE or Industry 4.0. This manage-ment framework, developed by Gregory Unruh, will bring more sustainability to manufacturing and business operations in general. The frame-work applies the laws of nature as a guide for efficient and innovative business operations. Instead of a linear value chain, the approach is to manage a cyclical value chain (Unruh 2010; Unruh 2019). Figure 1 introduces introduces the rules of the model.
The first rule, ‘Materials Parsimony’, aims at minimizing the types of materials used in products with a focus on materials that are life-friendly and economically recyclable. The second rule, ‘Value Cycle’, guides to recover and reincarnate materials from end-of-use goods into
21
new value-added products (Henrich et al. 2012). ‘Power Autonomy’ is to maximize the power autonomy of products and processes so they can function on renewable energy. ‘Sustainab-le Product Platforms’ are targeted to leverage value cycles as product platforms for profitable scale, scope, and knowledge economies. ‘Fun-ction over Form’ means meeting of customers’ functional needs in ways that sustain the value cycle (Unruh 2019.).To conclude, sustainability is seen as one of the Industry 4.0 and CE drivers (Stock et al., 2018). There have also been discussions in the academ-ic world about whether Industry 4.0 and the CE are the last chance for truly sustainable produc-tion. The UN sees big data for sustainable devel-opment as an enabler of the evidence-based de-
cision-making and measurement of the progress on the SDGs (UN, 2013). This seems to be a very realistic approach. It is a big challenge to devel-op the CE for Industry 4.0 (Stein Knudsen & Kai-vo-oja 2018), as well as to develop Industry 4.0 for the CE, but, fortunately, management frame-works and models are being developed (Jabbour et al. 2017). In the higher educational institutions, the development should be followed and regard-ed as part of the educational programs.
Figure 1. Reference Architectural Model Industrie 4.0 (Industrie 4.0 2019).
Figure 2. The five principles that constitute the Biosphere Rules (Unruh 2019).
1. Materials Parsimony
2. Value Cycle
3. Power Autonomy
5. Functionover Form
4. Sustainable Product
Platforms

22
References
Dahmen, U., & Roßmann, J. 2018. Experimentable digital twins for model-based systems engineering and simulation-based development. In: 2018 Annual IEEE International Systems Conference (SysCon). Rome, Italy 24-27 1-3 Oct. 2018. 1-8. [Cited 3 Oct 2019]. Available at: https://doi.org/10.1109/SysEng.2018.8544383
Henrich, J., Kothari, A. & Makarova, E. 2012. Design to Value: a smart asset for smart products. McKinsey& Company. Operations Extranet. [Cited 3 Oct 2019]. Available at: https://www.mckinsey.com/~/media/mck-insey/dotcom/client_service/consumer%20packaged%20goods/pdfs/20120301_dtv_in_cpg.ashx
Industrie 4.0. 2019. Technologieentwicklung und sicherheitstechnische Bewertung von Anwendungssze-narien (baua: Bericht) - Scientific Figure on ResearchGate. [Cited 3 Oct 2019]. Available at: https://www.researchgate.net/figure/Abb-23-RAMI-40-Referenzarchitektur-Modell-fuer-Industrie-40makroskopis-che-Sicht_fig1_331299158
Jabbour, C. J., Jabbour, A. B., Sarkis, J., & Filho, M. G. 2017. Unlocking the circular economy through new business models based on large-scale data: An integrative framework and research agenda. Technological Forecasting & Social Change. Vol. 144, 546-552. [Cited 3 Oct 2019]. Available at: https://doi.org/10.1016/j.techfore.2017.09.010
Müller, J.M., Kiel, D. & Voigt, K-I. 2018. What Drives the Implementation of Industry 4.0? The Role of Oppor-tunities and Challenges in the Context of Sustainability. Sustainability Vol. 10 (1), 247. [Cited 3 Oct 2019]. Available at: https://doi.org/10.3390/su10010247
Schweichhart, K. 2019. Reference Architectural Model Industrie 4.0 (RAMI 4.0). An Introduction. [Cited 3 Oct 2019]. Available at: https://ec.europa.eu/futurium/en/system/files/ged/a2-schweichhart-reference_ar-chitectural_model_industrie_4.0_rami_4.0.pdf
Stein Knudsen, M. & Kaivo-oja, J. (2018). Bridging Industry 4.0 and Circular Economy: A new research agenda for Finland? Finland Futures Research Centre’s Blog. [Cited 3 Oct 2019]. Available at: https://ffrc.wordpress.com/2018/09/12/bridging-industry-4-0-and-circular-economy/
Stock, T., Obenaus, M., Kunz, S., & Kohl, H. 2018. Industry 4.0 as enabler for a sustainable development: A qualitative assessment of its ecological and social potential. Process Safety and Environmental Protection. Vol. 118, 254-267.
Unruh, G. 2010. Earth, Inc.: Using Nature’s Rules to Build Sustainable Profits. Boston, MA:Harvard Business Review Press, 2010.

23
Unruh, G. 2018. Circular Economy, 3D Printing, and the Biosphere Rules. California Management Review. Vol. 60 (3), 95-111. [Cited 3 Oct 2019]. Available at: https://doi.org/10.1177/0008125618759684
United Nations Global Pulse. 2013. Big Data for Development: A Primer. [Cited 3 Oct 2019]. Available at: http://www.unglobalpulse.org/sites/default/files/Primer%202013_FINAL%20FOR%20PRINT.pdf

24
Ari Serkkola, Matti Welin, Aleksi Kinnunen, Karri Miettinen
Digimaa Application for the Purchase of Soil and Recycled MaterialsOrdering and Delivery of SoilThe Digimaa project has developed a mobile cloud service for the purchase of soil and re-cycled materials (ERDF 2017-19). The aim was to create a modern order-delivery service for earthworks constructors which can be used by companies in road, street, field and industrial construction. In the Digimaa service, the earth-works contractor sends an order with a mobile device to the soil manufacturer, who delivers the material to the building site. Drivers receive driving assignments including information on the collection and delivery sites, and site managers acknowledge receipt of the delivery of materi-als. All this creates a digital delivery note, which can be forwarded to invoicing, payroll and other tracking of material.
Project Partners The Digimaa demonstration was executed by the Aalto University Department of Water and Environmental Engineering in cooperation with the Lahti University of Applied Sciences Faculty of Technology and earthworks constructors. In terms of the division of labour between the re-search institutes, Aalto University was respon-sible for the planning of the background system and its data model (BackEnd), and Lahti Universi-
ty of Applied Sciences designed and implement-ed the mobile user interface prototype (Front-End). The application designers programmed the service according to the requirements, and integrated the background system into the user interface. This resulted in the demonstration de-scribed below.
ExecutionThe project was divided into tasks, the most important of which were identifying the require-ment attributes of the Digimaa service, devel-oping and programming the background system (BackEnd) and creating and programming the user interface model (FrontEnd). The project ad-hered to the following procedures:
The general business of soil transfer and the role of companies in earthworks acquisition and supply chains were surveyed. In the supply chain, the following types of roles were identified: the client placing an order for soil, the supplier, the transportation coordinator, the driver and the recipient / person who ordered the soil, and the orders and deliveries made by these roles.
The project team designed a general model for the order and delivery of soil, and the key ser-vice tasks. The companies demonstrated which tasks the information system should perform,
25
and which information is available for perform-ing these tasks. The team investigated how to forward information on orders and deliveries of soil from one company to another, and from one employee to another.
The researchers organised consultations on the different versions with companies. In the con-sultations, the users commented on the service features and their specifications. Based on the feedback, additional features were added to the application. The integration of additional features into the data model and user interface created challenges for easy access to the service.
The data model’s design was based on de-fining the actors’ roles, their communication and messaging processes, and the necessary data. The data model specified the main sections of the service, the data they use, and the data re-lationships in the supply chains. The data model was built to allow for new features and informa-tion to be added to the model in the future.
Programming the User InterfaceThe application was implemented as a scalable cloud service in the REST architectural style where the user interface communicates with the back-end system through an encrypted https protocol (Lahoti 2019). Initially, an API interface was designed for the model that defines which services are provided by the back-end system and what information is transmitted in service calls. In addition, agreements were made on the principles of data transfer, such as encryption. It was then possible to develop both parts autono-mously and independently of each other. By using the REST model, the architecture of the system is simplified, which also makes the functional au-thentication and testing easier. With this imple-mentation, the responsibilities of LAMK and Aalto
University in the development of the application were divided into the creation of a modern back-ground system and a user interface.
Secure communication is based on the open JSON Web Token (JWT) standard (RFC7519). The standard defines a compact and secure way of exchanging information between two operators using the JSON format. The recipient can trust the origin and accuracy of the messages, as the messages are digitally signed. (Auth0 2019)
The user interface follows Google’s Material Design code, one of the most popular guidelines in the digital world (Bose 2019). Google’s Material Design includes a set of rules, guidelines, compo-nents and best practices that should be used to design the UI for web services and applications (Google 2019a). A prototype of the user interface (UI mock-up) was first implemented using Ado-be’s XD UI/UX design tool. It was then used in consultations relating to the different versions to gather user experiences before programming the UI. The iterative nature of the design is illustrat-ed by the fact that several different versions of the user interface prototype had to be developed during the project. In addition, the user interface prototype was translated into both English and Spanish.
The user interface itself is a component-based web service implemented within the Angular software framework (Angular 2019). The appearance is responsive and the components of the Angular Material Library were utilised either as such, or in a modified form. Responsiveness means that the position, size and relationships of the user interface elements adapt to the screen size of the device in use, so that the elements look smooth and the user interface is easy to operate (Google 2019b). From the outside, the user interface looks like a so-called ‘single-page’
26
application. The pages are not fully downloaded during the start-up phase, but the user interface and the back-end system exchange data in the background, using Ajax technology. The software was packaged into a web service using the WebPack tool.
Applications for mobile technologies (An-droid 75% and iOS 21%) were implemented using a hybrid application, a shared source code. Hy-brid applications refer to applications that look
like native applications from the outside, but have been implemented following the principles of a single source code (Mendix 2019). In hybrid applications, an embedded web view is created in the user interface of the mobile application. A traditional web page is uploaded into this view, which means that, from the perspective of soft-ware development, this form of application de-velopment refers to the development of a web service, eliminating the need for specialised iOS
Figure 1. Main menu screen. Figure 2. Placing a new order.
27
or Android expertise. Digimaa’s mobile applica-tion was executed as a hybrid application using the Cordova software framework. Cordova also offers an interface to mobile device sensors and resources. Therefore, if necessary, the applica-tion can be uploaded to an app store (Google Play or Apple’s App Store). Another advantage of hybrid applications is that the application’s functionality can be changed without having to upload a new version of the application to the app store.
The application’s access rights have been implemented in a role-based manner (RBAC). Role-based access means that the users can only access the information that is necessary for carrying out their task. This ensures that the supply chain only allows the company to see its own information, and each company distributes role-based access rights to the employees se-lected for the task.
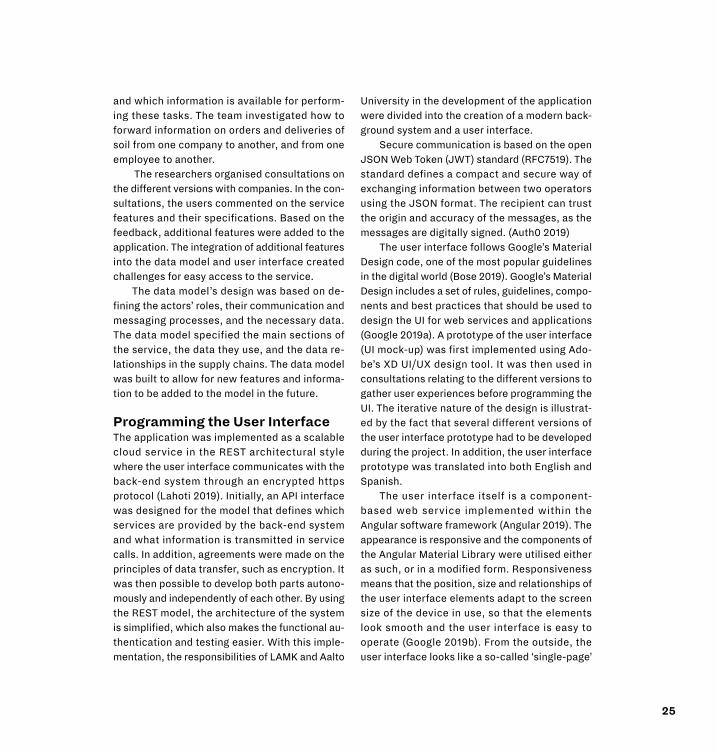
UI TemplateEarthworks contractors play one or more roles in the supply chain. This is why the Digimaa ap-plication is also designed to be role-based. The service is based on roles such as the buyer of soil or recycled material, supplier, transporta-tion coordinator, driver and recipient. The earth-works constructor, soil supplier or transport company may also use the service with their own employees. In the following figure the main menu screen is represented.
In the supply chain, companies supplement orders with their own data, and the software documents the information in the delivery note. In addition, almost all transportation of soil, stone aggregates and recycled material is re-corded as location data, where the collection
and delivery sites can be identified on the map. The delivery notes generate reports that can be forwarded to invoicing and payroll.
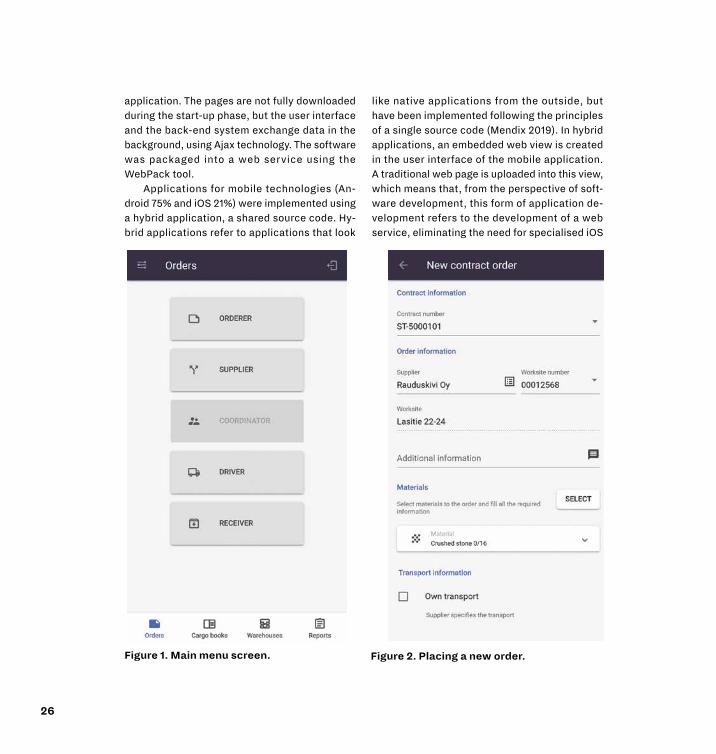
Placing OrdersThe orders concern the acquisition of soil, stone aggregates and recycled material, as well as transportation. The earthworks con-structor, such as a contractor, selects the soil supplier and type of material when completing the order (see Figure 2). The client ordering the material enters the amount in tonnes, and the place and desired time of delivery. The order is forwarded in real time to the supplier, who can be employed by the same company or another one. The earthworks constructor can also book transportation services from other haulage companies.
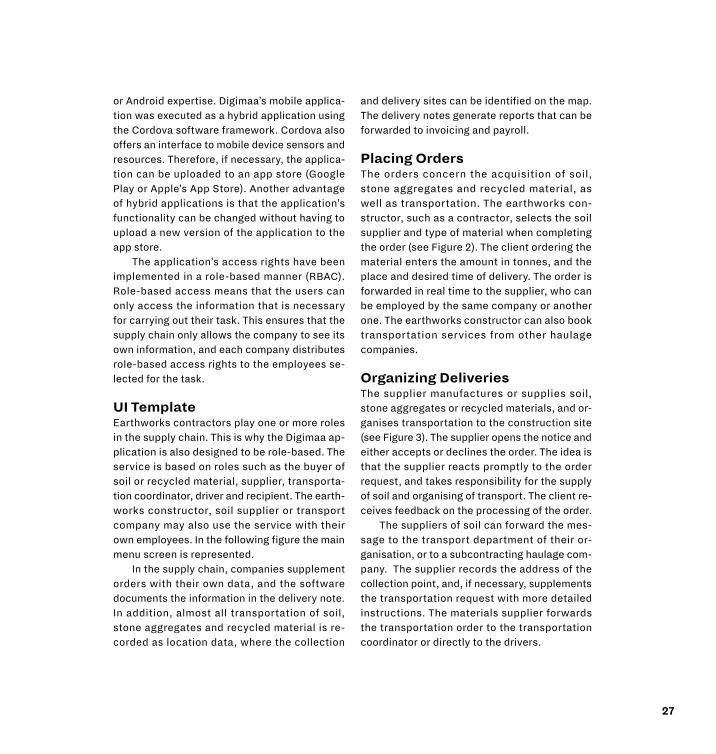
Organizing Deliveries The supplier manufactures or supplies soil, stone aggregates or recycled materials, and or-ganises transportation to the construction site (see Figure 3). The supplier opens the notice and either accepts or declines the order. The idea is that the supplier reacts promptly to the order request, and takes responsibility for the supply of soil and organising of transport. The client re-ceives feedback on the processing of the order.
The suppliers of soil can forward the mes-sage to the transport department of their or-ganisation, or to a subcontracting haulage com-pany. The supplier records the address of the collection point, and, if necessary, supplements the transportation request with more detailed instructions. The materials supplier forwards the transportation order to the transportation coordinator or directly to the drivers.
28
Soil TransportationsThe transportation coordinators’ task is to ar-range deliveries and select drivers. Transporta-tion coordinators have access to drivers in their own company, as well as drivers of the cooper-ating subcontractors. The transportation coordi-nators select the drivers and inform them about the task to be accomplished.
Figure 3. Defining delivery. Figure 4. Transportation details.
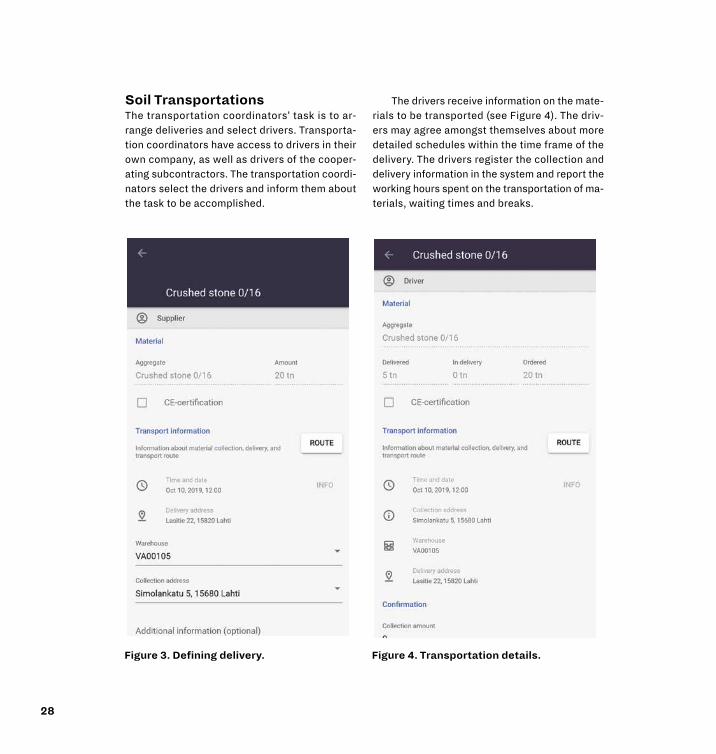
The drivers receive information on the mate-rials to be transported (see Figure 4). The driv-ers may agree amongst themselves about more detailed schedules within the time frame of the delivery. The drivers register the collection and delivery information in the system and report the working hours spent on the transportation of ma-terials, waiting times and breaks.

29
Figure 5. Receiving loads.
Delivery Information Included in the Delivery NotesThe order and delivery information is saved in the system and organised into delivery notes. The de-livery notes contain all the information required as supporting documents during deliveries, in re-ports and when monitoring material transfer (see Figure 6). The delivery notes can be forwarded in CSV or PDF format into invoicing, payroll or reports.
The Advantages of the Digimaa ServiceThe Digimaa application forwards the orders of soil, stone aggregates and recycled material ef-fortlessly to the entire supply chain. The service speeds up and systematises orders from one company or employee to another. The service makes the logistics and documentation of earth-works construction more efficient, facilitates the deliveries of soil, reduces transportation costs and creates location data for the monitoring of recycled materials.
Earthworks constructors can monitor the or-ders and their processing in real time. The system shows the earthworks constructors a real-time mass balance: how much has been ordered and how much has been delivered to each construc-tion site. The earthworks constructors receive delivery notes as a receipt of each order that has been delivered.
The suppliers of soil and recycled material can receive the assignment effortlessly without phone calls or e-mails, and acknowledge receipt of the assignment. The suppliers simply delegate the order with additional information to the trans-portation coordinator and to delivery.
The digital assignments make the transporta-tion company’s administration and invoicing du-
Recipient’s Receipt of AcceptanceThe recipients of soil and stone aggregates, such as construction managers or similar, can follow the transportation activities either on the con-struction site or in an office. The recipients will be informed on the deliveries and acceptance of material, including the collection and delivery stamps. Construction managers accept the loads either one at a time, or all at once (see Figure 5).

30
ties easier. Drivers are relieved from the need to record documents. The drivers only press the col-lection and delivery buttons related to orders of material transfer. The service helps drivers opti-mise their transport routes and reduce transport costs. In addition, drivers can use the service to transport various consignments by directing the delivery notes to different contracts.
The Digimaa service provides a method for documenting the location data of recycled ma-
terial. The service is suited for monitoring the recycling of solid materials, such as crushed concrete, ash from power plants, and car tyres. The documented delivery notes display the or-dered and delivered recycled materials, and their volume and location. Information in the delivery notes can later be refined into supporting docu-ments and indicator data for invoicing, payroll and environmental reporting.
Figure 6. Reporting view.

31
References
Angular. 2019. Architecture overview. [Cited 15 Sept 2019]. Available at: https://angular.io/guide/architecture
Auth0. 2019. Introduction to JSON Web Tokens. [Cited 15 Sept 2019]. Available at: https://jwt.io/introduction/
Bose, D. 2019. 10 Top Material Design Frameworks for 2019. [Cited 15 Sept 2019]. Available at: https://www.urbanui.com/material-design-frameworks/
Google. 2019a. Material Design, Introduction. [Cited 15 September 2019]. Available at: https://developers.google.com/web/fundamentals/design-and-ux/responsive
Google. 2019b. Web fundamentals, Responsive Web Design Basics. [Cited 15 Sept 2019]. Available at: https://material.io/design/introduction/#principles
Lahoti, S. 2019. Defining REST and its various architectural styles. Packt. [Cited 15 Sept 2019]. Available at: https://hub.packtpub.com/defining-rest-and-its-various-architectural-styles/
Mendix. 2019. What is a Hybrid Mobile App?. Mendix Tech BV. [Cited 15 Sept 2019]. Available at: https://www.mendix.com/what-is-a-hybrid-mobile-app/
32
Sami Luste, Katerina Medkova, Tapio Kilponen
Experiences of the Utilization of the Six Sigma Tool with the Wastewater Treatment Plant (WWTP) Data
The present article describes the way Six Sigma was used to enhance the local WWT network and the main observations from the Six Sigma results. The ultimate aim was to identify such dependencies that may help WWTPs to devel-op their monitoring facilities, for example what kind of new data is required to acquire more detailed information from the processes. Six Sigma was not selected as one of the actual capacity development tools produced during the IWAMA project, but hopefully the present article gives some idea of the possibilities it may provide.
Two activated sludge WWTPs were studied. The WWTPs are located near to each other, both with a population equivalent (PE)
of 100 000 inhabitants. WWTP 1 is operating outdoors, while WWTP 2 is in a cave. The data from the year 2016 included the following WWTP quantities:
• Incoming wastewater and
treated water flows (m³)
• Temperature from incoming water
and from aeration phase(°C)
• pH from incoming water, pre-clarification
and post-clarification stage
• Biological Oxygen Demand (BOD) from
incoming wastewater, pre-clarification
and leaving water (mg/l)
Six Sigma is a set of techniques for process improvement based on the number anal-ysis. The original aim was to conduct a preliminary study on Six Sigma as a capacity development tool for wastewater treatment plant (WWTP) operators. An effective co-operation model between universities and WWTPs was tested with examples of the opportunities that the Six Sigma analysis may offer for developing the maintenance and monitoring of WWTP processes. The actions were performed in a partly EU-funded (Interreg Baltic Sea region) Interactive Water Management (IWAMA) project as a part of a survey of capacity development tools.
33
• Nitrogen (N) from incoming
wastewater, pre-clarification and
from treated water (mg/l)
• Phosphorus (P) from incoming
wastewater, pre-clarification and
from treated water (mg/l)
• Suspended solids (SS) from
incoming water, pre-clarification
and from treated water (mg/l)
• Return sludge to aeration tank (m³/h)
• Sludge flow rate to the digestion
and the biogas flow rate from
the digestor (m³/h)
• Overall energy consumption (kWh)
It is notable that some measurements, such as BOD, N, P and SS measurement, were laboratory measurements that were performed on a weekly basis.
Working Method with the WWTP DataIn order to learn, develop and innovate, we need to identify new questions. If we continuously deal with the same questions, we probably also get the same answers unless there is something which will break, disrupt and challenge the cur-rent state. The following chapter presents the method and reasons for working in such assem-ply of actors than presented in Figure 1.
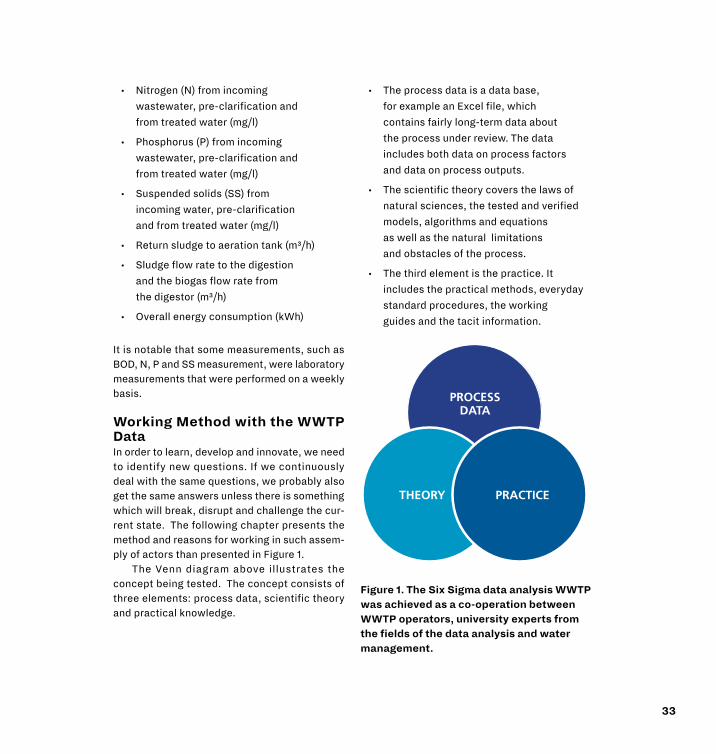
The Venn diagram above illustrates the concept being tested. The concept consists of three elements: process data, scientific theory and practical knowledge.
• The process data is a data base,
for example an Excel file, which
contains fairly long-term data about
the process under review. The data
includes both data on process factors
and data on process outputs.
• The scientific theory covers the laws of
natural sciences, the tested and verified
models, algorithms and equations
as well as the natural limitations
and obstacles of the process.
• The third element is the practice. It
includes the practical methods, everyday
standard procedures, the working
guides and the tacit information.
PROCESSDATA
THEORY PRACTICE
Figure 1. The Six Sigma data analysis WWTP was achieved as a co-operation between WWTP operators, university experts from the fields of the data analysis and water management.
34
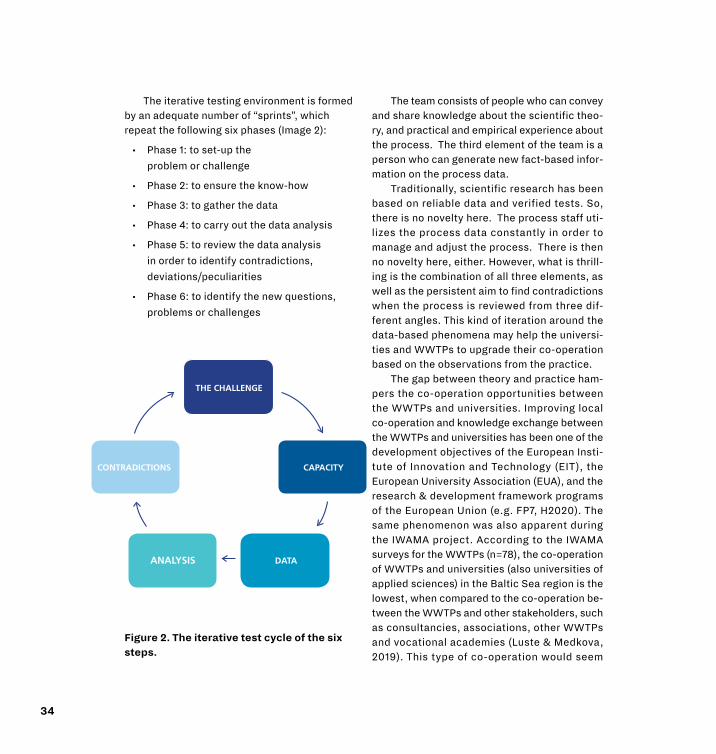
The iterative testing environment is formed by an adequate number of “sprints”, which repeat the following six phases (Image 2):
• Phase 1: to set-up the
problem or challenge
• Phase 2: to ensure the know-how
• Phase 3: to gather the data
• Phase 4: to carry out the data analysis
• Phase 5: to review the data analysis
in order to identify contradictions,
deviations/peculiarities
• Phase 6: to identify the new questions,
problems or challenges
THE CHALLENGE
CAPACITY
DATAANALYSIS
CONTRADICTIONS
Figure 2. The iterative test cycle of the six steps.
The team consists of people who can convey and share knowledge about the scientific theo-ry, and practical and empirical experience about the process. The third element of the team is a person who can generate new fact-based infor-mation on the process data.
Traditionally, scientific research has been based on reliable data and verified tests. So, there is no novelty here. The process staff uti-lizes the process data constantly in order to manage and adjust the process. There is then no novelty here, either. However, what is thrill-ing is the combination of all three elements, as well as the persistent aim to find contradictions when the process is reviewed from three dif-ferent angles. This kind of iteration around the data-based phenomena may help the universi-ties and WWTPs to upgrade their co-operation based on the observations from the practice.
The gap between theory and practice ham-pers the co-operation opportunities between the WWTPs and universities. Improving local co-operation and knowledge exchange between the WWTPs and universities has been one of the development objectives of the European Insti-tute of Innovation and Technology (EIT), the European University Association (EUA), and the research & development framework programs of the European Union (e.g. FP7, H2020). The same phenomenon was also apparent during the IWAMA project. According to the IWAMA surveys for the WWTPs (n=78), the co-operation of WWTPs and universities (also universities of applied sciences) in the Baltic Sea region is the lowest, when compared to the co-operation be-tween the WWTPs and other stakeholders, such as consultancies, associations, other WWTPs and vocational academies (Luste & Medkova, 2019). This type of co-operation would seem

35
Figure 3: Cause and effect diagram at sewage treatment plant.
very natural especially for universities of applied sciences.
The cause and effect diagram (Figure 3) presents the starting point to the research. It shows the supposed factors that may have an effect on the energy consumption at a WWTP.
To be able to confirm the hypothesis right or wrong, the process data is collected, cleaned and analysed. The data is historical data. It was collected day by day and the collection period was one year, i.e. 365 days. The data covered
two WWTPs, which are partly similar, but there are also clear differences. The main parameters that were paid attention to were the dependen-cies relating drivers from the operation environ-ment (temperature, rainfalls and storm waters, increased wastewater flows in the summer) and the energy efficiency of the plants.
The data was transferred from the Excel sheet to the Minitab application. Minitab is sta-tistical software, which is used in process im-provement activities.
Hypothetical factors of the energy consumption
Material
System
The energy consumption at the WWTP
Mother Nature
Month
Weekday
Amount of the return sludge
Temperature of the incoming wastewater
Aeration temperature
Outdoor/Indoor plant
The nature of the wastewater
Man and Method

36
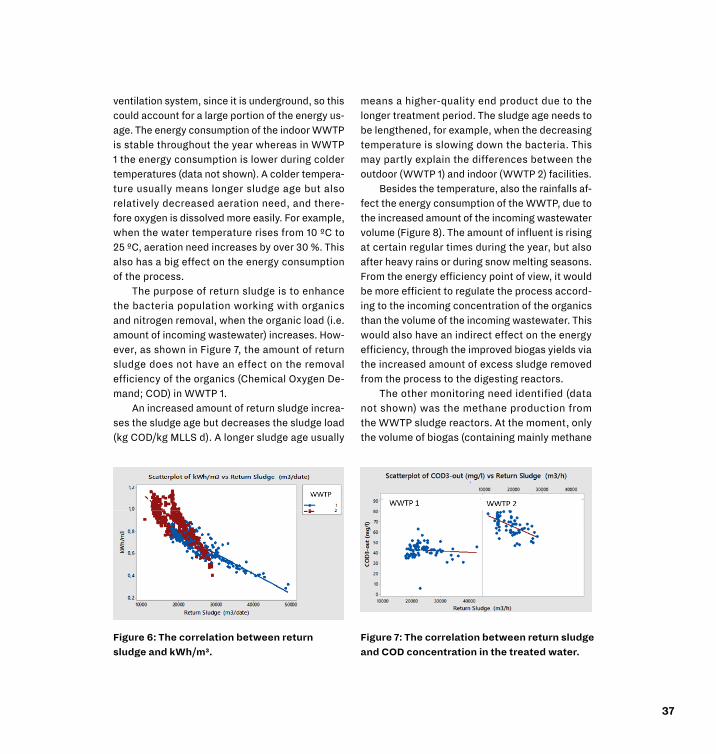
Example of an Energy Efficiency Survey by Six SigmaBelow is a short example based on the amount of return sludge, which is compared to the ener-gy consumption (kWh), the amount of incoming wastewater per day (m³) and the ratio of the en-ergy consumption and the incoming wastewater (kWh/m³). The return sludge from the post-clari- fication stage back to the aeration phase of the WWTP process is one of the key management processes in activated sludge type of WWTPs. It is connected to the organics and nitrogen removal as well as energy efficiency. It is also connected to the two key indicators of the process: sludge age and sludge load.
Figure 4 reveals that WWTP 2 uses more energy than WWTP 1. Figure 4 also shows that WWTP 1 is managed differently from WWTP 2.
When the return sludge and incoming waste-water are plotted into the scatterplot in Figure 5, the curves look very different. WWTP 1 seems to operate in a linear way: when the incoming water volume increases, the return sludge increases accordingly. Instead, WWTP 2 is different. The
upper limit of return sludge is about 3000 m³/day. According to the discussions with WWTP opera- tors, the return sludge is limited by the sludge settlement characteristics in post-clarification. WWTP 2 is receiving such industrial wastewaters the content of which (e.g. filamentous bacteria, yeasts) may affect the sedimentation characteris-tics of sewage sludge (Parmar et al. 2001).
In Figure 6, the Y axis refers to the ratio of energy consumption and incoming wastewater per day. The X axis refers to the amount of return sludge per day. This image also tells the same fact that WWTP 2 requires more energy to pro-cess the wastewater than WWTP 1 as well as that the processes are carried out in different ways.
The image also shows this linearity quite clearly: when the amount of return sludge in-creases, the energy efficiency improves. We can see that WWTP 1 (~1.5 m³ of treated water/ kWh of electricity) treats its water more efficient-ly than WWTP 2 (~1.1 m³ of treated water/ kWh of electricity). There are many possible reasons for the lower energy consumption. One of them is that the indoor WWTP 2 requires a very large
Figure 4: The correlation between return sludge and kWh.
Figure 5: The correlation between return sludge and incoming water (m³).
37
ventilation system, since it is underground, so this could account for a large portion of the energy us-age. The energy consumption of the indoor WWTP is stable throughout the year whereas in WWTP 1 the energy consumption is lower during colder temperatures (data not shown). A colder tempera- ture usually means longer sludge age but also relatively decreased aeration need, and there-fore oxygen is dissolved more easily. For example, when the water temperature rises from 10 ºC to 25 ºC, aeration need increases by over 30 %. This also has a big effect on the energy consumption of the process.
The purpose of return sludge is to enhance the bacteria population working with organics and nitrogen removal, when the organic load (i.e. amount of incoming wastewater) increases. How-ever, as shown in Figure 7, the amount of return sludge does not have an effect on the removal efficiency of the organics (Chemical Oxygen De-mand; COD) in WWTP 1.
An increased amount of return sludge increa- ses the sludge age but decreases the sludge load (kg COD/kg MLLS d). A longer sludge age usually
Figure 6: The correlation between return sludge and kWh/m³.
Figure 7: The correlation between return sludge and COD concentration in the treated water.
means a higher-quality end product due to the longer treatment period. The sludge age needs to be lengthened, for example, when the decreasing temperature is slowing down the bacteria. This may partly explain the differences between the outdoor (WWTP 1) and indoor (WWTP 2) facilities.
Besides the temperature, also the rainfalls af-fect the energy consumption of the WWTP, due to the increased amount of the incoming wastewater volume (Figure 8). The amount of influent is rising at certain regular times during the year, but also after heavy rains or during snow melting seasons. From the energy efficiency point of view, it would be more efficient to regulate the process accord-ing to the incoming concentration of the organics than the volume of the incoming wastewater. This would also have an indirect effect on the energy efficiency, through the improved biogas yields via the increased amount of excess sludge removed from the process to the digesting reactors.
The other monitoring need identified (data not shown) was the methane production from the WWTP sludge reactors. At the moment, only the volume of biogas (containing mainly methane

38
and carbon dioxide) is measured. The inhibition of the most sensitive digestion bacteria, methano-gens, may take place due to the incoming inhibi-tors, such as too high or low pH (varying from 5.0 to 8.3 ), too strong concentration of degradation intermediates (e.g. volatile fatty acids, ammo-nia) and industrial wastewaters (e.g. detergents, chemicals, yeasts). Moreover, the data from the incoming industrial wastewaters as well as inte-grated weather information would enhance the predictability of resource efficient systemic level process management.
Conclusion• A lot of data from different parts of the
process is needed, as well as “silent
knowhow” expertise, for example
concerning the measurement
points and working practices.
• Through the data-based iteration process
it is possible to identify (especially)
the factors relating to monitoring
needs and the development of the data
collection system toward more energy
efficiency, as well as to increase the
predictability perspectives for more
systematic process management.
• Iterative working around the questions
rising from the data is a highly fruitful
way to increase the practice-driven
co-operation between the WWTPs and
universities. This is also an efficient
way for the students to get involved in
the process by getting a good overall
picture of the WWTP activities.
Figure 8. WWTP 1 and energy consumption’s relation to the rainfalls in 2016.
39
References
Luste, S., & Medkova, K. (Eds.). 2019. Lifelong Learning and Wastewater Treatment in the Baltic Sea Region - Capacity Development Opportunities Observed in the IWAMA Project. Lahti: Lahti University of Applied Sciences. The Publication Series of Lahti University of Applied Sciences, part 47. [Cited 10 Sept 2019]. Available at: http://urn.fi/URN:ISBN:978-951-827-307-6
Parmar, N., Singh, A., Ward, O., 2001. Enzyme treatment to reduce solids and improve settling of sewage sludge. Journal of Industrial Microbiology and Biotechnology. Vol. 26(6), 383-386.
40
Matti Welin
Learning by playing – case WWTP gameGeneralSerious games are an expanding field of game development used in simulations and other im-mersive, interactive experiences developed for various fields of industrys (Suvak 2014).
Serious games have numerous definitions, but the aspect that is common to definitions is ‘a game designed for a primary purpose other than pure entertainment’ (Growth Engineering 2016). Serious games can be used for various purposes like education, training, health care, and market-ing (Oksanen 2014).
The IWAMA project, started in spring 2016, was a joint project with north European uni-versities and industry, funded by the European Union (European Regional Development Fund) (IWAMA 2019a). The aim of the project was to improve wastewater management by develop-ing the competence of the wastewater treatment operators. The main focus area was the Baltic Sea Region. By implementing pilot investments, the energy efficiency and sludge handling were also improved (IWAMA 2019b). One sub-project towards the goal was the ‘Day at the WWTP’ game designed and implemented by students from Lahti University of Applied Sciences.
Game ProjectThe IWAMA game project started in fall 2017 and it was integrated into workshop courses of ICT students at the Faculty of Technology. The ini-tial project group consisted of seven third-year
students of media technology and software en-gineering. Technical specifications of a waste-water treatment plant and biological formulas were defined by the environmental engineering experts involved in the project. Circular economy professionals and the fresh ICT point of view pro-duced the idea of a ‘Day at the treatment plant’ game. The game idea consists of a series of mini games dealing with daily operations at a mod-ern wastewater treatment plant. By using small mini games, it is possible to give an overview of the whole process and then focus more deeply on different areas of the treatment process for learning purposes.
Development Tool UnityAt the start of the game project, development tools had to be chosen. In this case, teachers and the project group decided to use the Unity Game Development Platform developed by Unity Technologies, a tool which is used on a majority of the game development courses and was thus familiar to students. Unity is one of the leading game development platforms on the market (Dil-let 2018). It supports both 2D and 3D designs, has an impressive real-time rendering machine and an advanced Nvidia PhysX physics engine for real-time physics operations (Unity 2019a). Unity integrates seamlessly to other 3D design tools such as 3D Max and Blender. Unity is also a cross-platform game engine that supports over 20 different platforms including iOS, Android,

41
Mac, Linux, WebGL and various game consoles and smart TVs. This means that once the game has been developed, it can be deployed to, i.e. played on, all supported platforms. The Unity graphical editor is available on Windows and Mac computers.
Graphical DesignIn the beginning of the project, in parallel with the game concept design, game graphic design started. The aim was to design the look and feel of the game and characters used. A consistent look and feel works as an umbrella to tie all the mini games together: consistency is one of the molecules of the Design DNA (Nikolov 2017). Ar-tefacts of the graphical design, like the charac-ter, colors, fonts, textures among others, were imported to Unity. Building the plant environ-ment, character movement and animation was
a big part of that development. The following fig-ure presents the character used in the game. On the left side is the character without any safety equipment and on the right side is the character wearing a helmet and a safety vest.
Especially the development of character ani-mation took a long time, but had to be done care-fully, because the same clips were re-used in all different mini games. Animation in Unity is built around Animation Clips: A Game Object must have an Animator component and that Animator component should have an Animator Controller assigned to it. The Animator Controller asset must have at least one Animation Clip assigned (Unity 2019b). Animations like standing, walking, turning, and exiting from the scene were devel-oped during the spring 2018 semester. At the end of spring semester 2018, the character anima-tions and movement were fully implemented.
Figure 1. Character without and with safety equipment
42
Game DevelopmentUnity games are based on scenes. A scene can be thought of as a level of a game. A scene has all the game objects in a hierarchy tree. To be able to perform unique operations in the game, game objects can have script components attached to them. A script is a piece of program code written in the c#-language, which is executed during the game play. Scripts usually handle the user ac-tions such as mouse clicks and keyboard input.
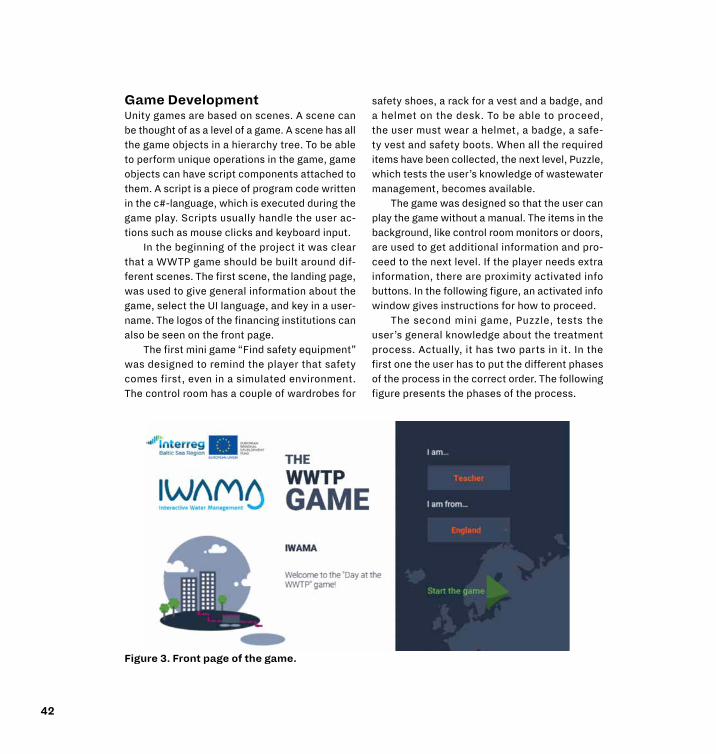
In the beginning of the project it was clear that a WWTP game should be built around dif-ferent scenes. The first scene, the landing page, was used to give general information about the game, select the UI language, and key in a user-name. The logos of the financing institutions can also be seen on the front page.
The first mini game “Find safety equipment” was designed to remind the player that safety comes first, even in a simulated environment. The control room has a couple of wardrobes for
safety shoes, a rack for a vest and a badge, and a helmet on the desk. To be able to proceed, the user must wear a helmet, a badge, a safe-ty vest and safety boots. When all the required items have been collected, the next level, Puzzle, which tests the user’s knowledge of wastewater management, becomes available.
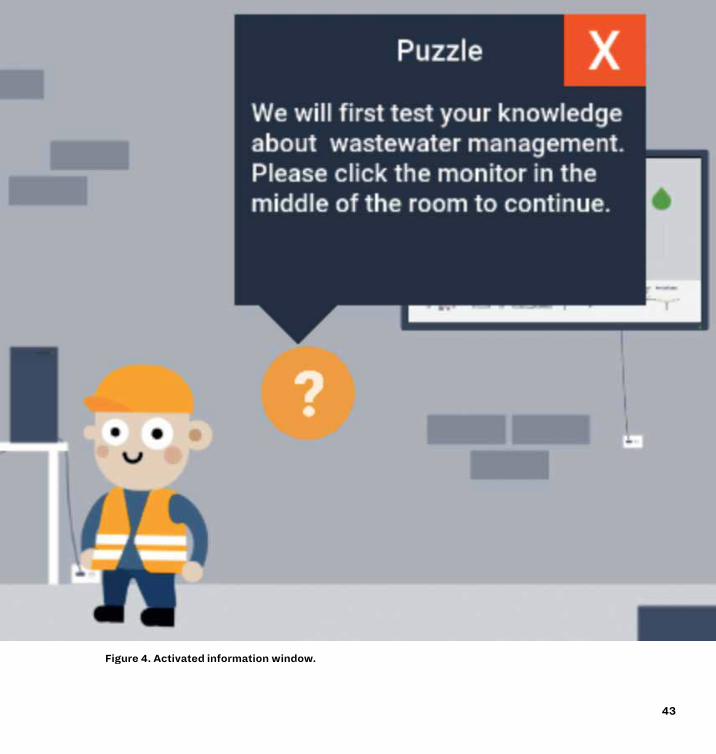
The game was designed so that the user can play the game without a manual. The items in the background, like control room monitors or doors, are used to get additional information and pro-ceed to the next level. If the player needs extra information, there are proximity activated info buttons. In the following figure, an activated info window gives instructions for how to proceed.
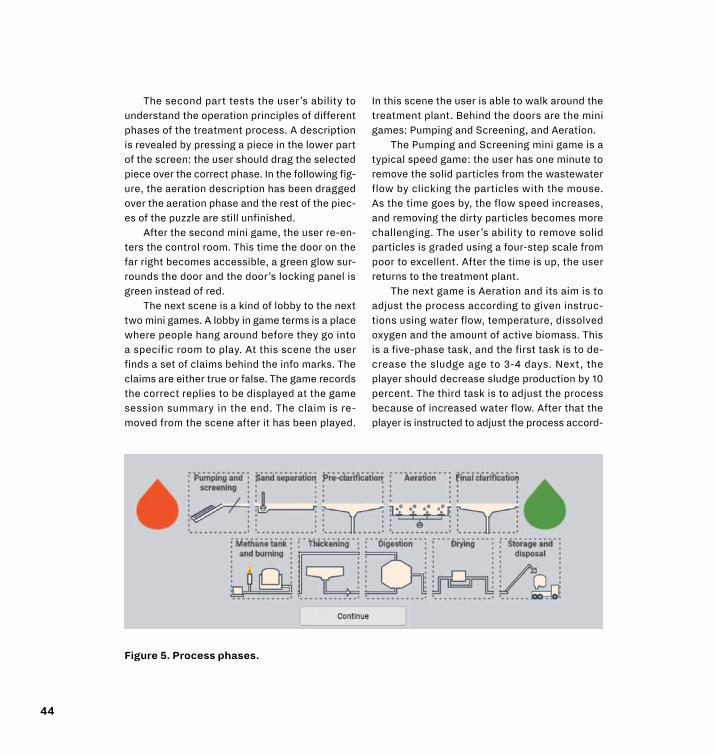
The second mini game, Puzzle, tests the user’s general knowledge about the treatment process. Actually, it has two parts in it. In the first one the user has to put the different phases of the process in the correct order. The following figure presents the phases of the process.
Figure 3. Front page of the game.
43
Figure 4. Activated information window.
44
Figure 5. Process phases.
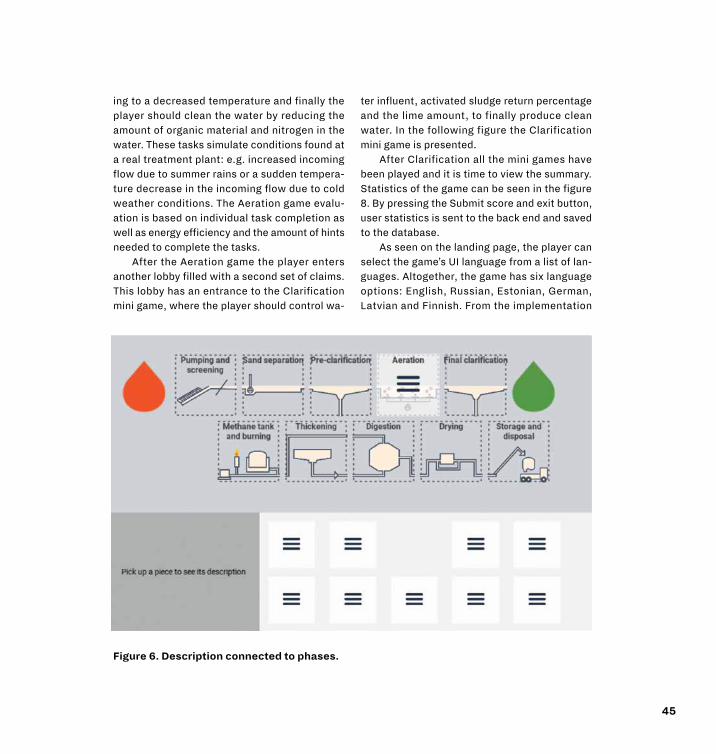
The second part tests the user’s ability to understand the operation principles of different phases of the treatment process. A description is revealed by pressing a piece in the lower part of the screen: the user should drag the selected piece over the correct phase. In the following fig-ure, the aeration description has been dragged over the aeration phase and the rest of the piec-es of the puzzle are still unfinished.
After the second mini game, the user re-en-ters the control room. This time the door on the far right becomes accessible, a green glow sur-rounds the door and the door’s locking panel is green instead of red.
The next scene is a kind of lobby to the next two mini games. A lobby in game terms is a place where people hang around before they go into a specific room to play. At this scene the user finds a set of claims behind the info marks. The claims are either true or false. The game records the correct replies to be displayed at the game session summary in the end. The claim is re-moved from the scene after it has been played.
In this scene the user is able to walk around the treatment plant. Behind the doors are the mini games: Pumping and Screening, and Aeration.
The Pumping and Screening mini game is a typical speed game: the user has one minute to remove the solid particles from the wastewater flow by clicking the particles with the mouse. As the time goes by, the flow speed increases, and removing the dirty particles becomes more challenging. The user’s ability to remove solid particles is graded using a four-step scale from poor to excellent. After the time is up, the user returns to the treatment plant.
The next game is Aeration and its aim is to adjust the process according to given instruc-tions using water flow, temperature, dissolved oxygen and the amount of active biomass. This is a five-phase task, and the first task is to de-crease the sludge age to 3-4 days. Next, the player should decrease sludge production by 10 percent. The third task is to adjust the process because of increased water flow. After that the player is instructed to adjust the process accord-
45
Figure 6. Description connected to phases.
ing to a decreased temperature and finally the player should clean the water by reducing the amount of organic material and nitrogen in the water. These tasks simulate conditions found at a real treatment plant: e.g. increased incoming flow due to summer rains or a sudden tempera-ture decrease in the incoming flow due to cold weather conditions. The Aeration game evalu-ation is based on individual task completion as well as energy efficiency and the amount of hints needed to complete the tasks.
After the Aeration game the player enters another lobby filled with a second set of claims. This lobby has an entrance to the Clarification mini game, where the player should control wa-
ter influent, activated sludge return percentage and the lime amount, to finally produce clean water. In the following figure the Clarification mini game is presented.
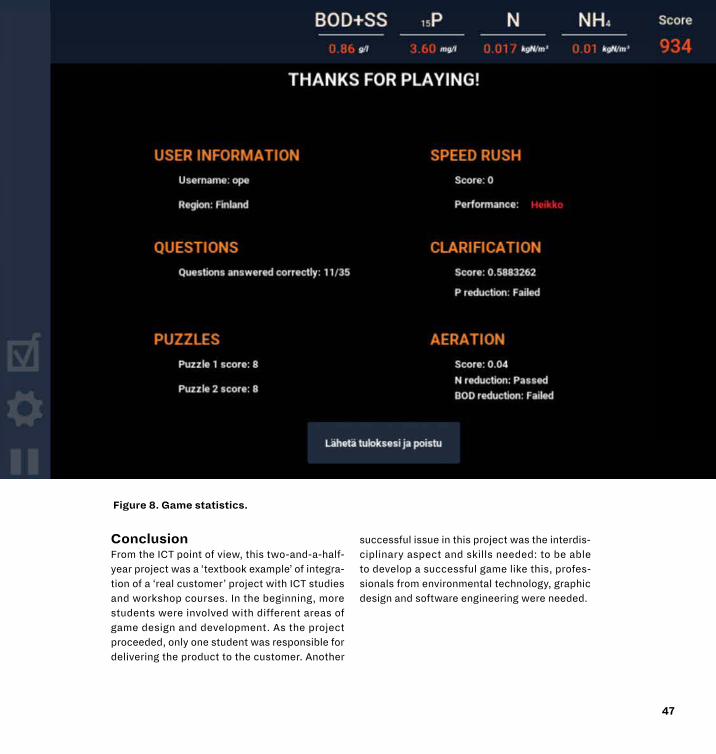
After Clarification all the mini games have been played and it is time to view the summary. Statistics of the game can be seen in the figure 8. By pressing the Submit score and exit button, user statistics is sent to the back end and saved to the database.
As seen on the landing page, the player can select the game’s UI language from a list of lan-guages. Altogether, the game has six language options: English, Russian, Estonian, German, Latvian and Finnish. From the implementation

46
point of view, an Excel spreadsheet was filled with one sheet per language. This translation file was then packed as a part of the Unity assets and a script at the start of the game reads the correct sheet according to the user’s preference.
The workshop courses with the student group ended in the spring 2018. After that the de-velopment mainly concentrated on coding. One student from the original group decided to par-
ticipate in this project as internship. Final code changes were made during the spring semester 2019 after all the translations were ready. Build-ing and packing of the Web-ready product took place in June 2019. The game was published in the IWAMA web server (http://wwtpgame.iwa-ma.eu/) and a link to the game is available on the IWAMA www pages.
Figure 7. Clarification.
47
Figure 8. Game statistics.
ConclusionFrom the ICT point of view, this two-and-a-half-year project was a ‘textbook example’ of integra-tion of a ‘real customer’ project with ICT studies and workshop courses. In the beginning, more students were involved with different areas of game design and development. As the project proceeded, only one student was responsible for delivering the product to the customer. Another
successful issue in this project was the interdis-ciplinary aspect and skills needed: to be able to develop a successful game like this, profes-sionals from environmental technology, graphic design and software engineering were needed.
48
References
Dillet, R. 2018. Unity CEO says half of all games are built on Unity. [Cited 15 Sept 2019]. Available at: https://techcrunch.com/2018/09/05/unity-ceo-says-half-of-all-games-are-built-on-unity/
Growth Engineering. 2016. What are serious games? [Cited 15 Sept 2019]. Available at:https://www.growthengineering.co.uk/what-are-serious-games/
IWAMA. 2019a. About IWAMA. [Cited 15 Sept 2019]. Available at: http://www.iwama.eu/about
IWAMA. 2019b. Welcome to the IWAMA project. [Cited 15 Sept 2019]. Available at:http://www.iwama.eu/
Nikolov, A. 2017. Design principle: Consistency. [Cited 15 Sept 2019]. Available at: https://uxdesign.cc/design-prin-ciple-consistency-6b0cf7e7339f
Oksanen, K, J. 2014. Serious Game Design: Supporting Collaborative Learning and Investigating Learners’ Ex-periences. PhD Thesis. University of Jyväskylä. Finnish Institute for Educational Research. Jyväskylä: Studies 31. [Cited 15 Sept 2019]. Available at:http://urn.fi/URN:ISBN:978-951-39-5857-2
Suvak, J. 2014. Learn Unity3D Programming with UnityScript. New York: APress.
Unity. 2019a. Performance by default, high-fidelity real-time graphics, and artist tools. [Cited 15 Sept 2019]. Available at: https://unity3d.com/unity?_ga=2.172360163.1368119000.1569913083-1270971374.1569913083
Unity. 2019b. Creating a new Animation Clip. [Cited 15 Sept 2019]. Available at: https://docs.unity3d.com/Manual/animeditor-CreatingANewAnimationClip.html

49

50
Kimmo Heponiemi
Material flow cost accounting – a tool for better material efficiencyGlobal stateWe all have heard about IPCC reports and other research that had told us how we have been go-ing to the wrong direction for quite a long time when it comes to sustainable way of living. The same kind of carefree consumption of non-re-newable raw materials and energy has been go-ing on also in many industries.
The industrial sector produced over one third of the global greenhouse gas emissions in 2010 (IPCC 2014). Industry-related greenhouse gas emissions have been increasing since that and it is estimated that the demand for material extrac-
tion and processing will be doubled in the next 35 years (Alwood et al. 2013). The environmental im-pacts of material production and processing are rapidly becoming critical (Allwood et al. 2010). Global stocks of non-renewable raw materials, like oil and ore, are dwindling. Our planet’s sup-ply of those non-renewable raw materials will eventually be exhausted to the point that their cost exceeds their utility (Allwood et al. 2011). Declining concentration of ore increases the en-ergy intensity of utilizing the ore and increases greenhouse gas emissions (Allwood et al. 2013). Though some concerns about the scarcity of raw
Figure 1. Example of a MFCA mass flow chart.
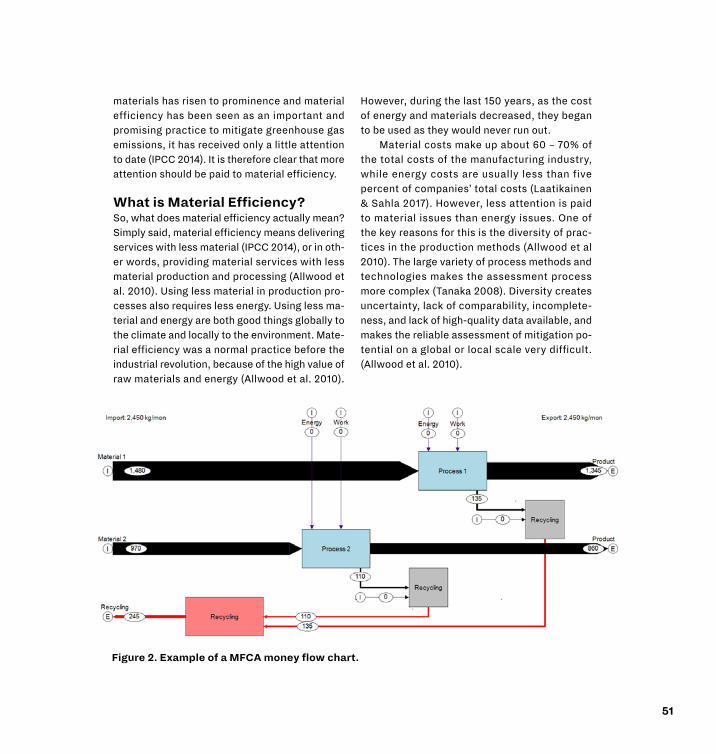
51
materials has risen to prominence and material efficiency has been seen as an important and promising practice to mitigate greenhouse gas emissions, it has received only a little attention to date (IPCC 2014). It is therefore clear that more attention should be paid to material efficiency.
What is Material Efficiency?So, what does material efficiency actually mean? Simply said, material efficiency means delivering services with less material (IPCC 2014), or in oth-er words, providing material services with less material production and processing (Allwood et al. 2010). Using less material in production pro-cesses also requires less energy. Using less ma-terial and energy are both good things globally to the climate and locally to the environment. Mate-rial efficiency was a normal practice before the industrial revolution, because of the high value of raw materials and energy (Allwood et al. 2010).
However, during the last 150 years, as the cost of energy and materials decreased, they began to be used as they would never run out.
Material costs make up about 60 – 70% of the total costs of the manufacturing industry, while energy costs are usually less than five percent of companies’ total costs (Laatikainen & Sahla 2017). However, less attention is paid to material issues than energy issues. One of the key reasons for this is the diversity of prac-tices in the production methods (Allwood et al 2010). The large variety of process methods and technologies makes the assessment process more complex (Tanaka 2008). Diversity creates uncertainty, lack of comparability, incomplete-ness, and lack of high-quality data available, and makes the reliable assessment of mitigation po-tential on a global or local scale very difficult. (Allwood et al. 2010).
Figure 2. Example of a MFCA money flow chart.
52
Material Flow Cost AccountingOne tool to address material issues and man-age material flows is material flow cost ac-counting (MFCA). The MFCA model was de-veloped in Germany, but it is popular in Japan (iPoint-systems gmbh 2019). By making an MFCA audit, a company can track its material side streams, calculate the price tag for those side streams and find ways to improve material efficiency (Figure 1). The MFCA process usual-ly takes several months from the first meeting to the final report. MFCA also monitors ener-gy and labor costs and allocates those costs to products and material losses. The compa-ny’s responsibility in the audit process is to dig up the necessary numerical values of the production process and the consultant’s job is to analyze these numbers and create a visual presentation of material flows and costs in the process.
In the sMARTTA project, implemented by LAMK, an updated version of the MFCA audit model has been developed. sMARTTA’s ver-sion of the MFCA audit model aims to be light-er, more flexible and more suitable for SME’s. This MFCA audit model is being piloted in the Päijät-Häme region between summer 2019 and autumn 2020. Companies have been very inter-ested in the model. In the first round of piloting there are companies from many different sec-tors of industry, including the plastic, metal, furniture and food industry. The large variety of different industries is a very good thing at this stage of the developing process, because this is how it is possible to gain more experience and a wider perspective about the possibili-ties and limitations of the model. The updated MFCA model will be available for public use when the project ends at the end of 2020.
Benefits of MFCA to the CompanyThe audit model suits a wide variety of compa-nies, large or small, and in many fields. MFCA will help to optimize production processes and improve material efficiency in many ways. By using MFCA it is possible to find out the hidden streams in the production that carry money away from the business. It is estimated that the value of these hidden streams could be 3 -5 % of the company’s turnover (Motiva 2017). The result of the MFCA audit process is practical suggestions for improving material efficiency and it can be used to support decision-making (Hyrslova et al. 2010).
The MFCA audit process calculates the price tag to the side streams of the production (Figure 2). This helps the company focus the actions on those points in production where the price tag is the highest. The audit process also points out the bottle necks of the production.
Some other benefits to the companies are that the audit process activates the personnel to pay attention to the material efficiency issues and commits the personnel to the principles of continuous improvement. The audit process also digs out so called silent wisdom in the company. Good practices, which may only be located in an employee’s head, are documented and shared with other employees. The findings of the audit process can also be used as a part of the envi-ronmental marketing.
Companies are Slowly Waking upTo this day, we have been more or less neglect-ing material efficiency issues. However, the increasing prices of the raw materials and the costs of utilizing them force us to pay attention to a more efficient use of materials. Quite often promoting material efficiency can be done with-
53
out large investments by developing operating methods, by better monitoring and by more effi-cient production planning.
In the sMARTTA project, it has been encour-aging to note that as the knowledge about mate-rial efficiency issues has been growing and the benefits have become tangible, companies are eager to get involved in improving material effi-
ciency. Slowly, companies are starting to wake up to material efficiency and see its potential. By conducting a material flow cost accounting audit process it is possible to make the hidden waste flows visible and tackle them. The fact is that every single kilogram of raw material that has been purchased and does not reach the final product has cost money to the company.
References
Allwood, J., Ashby, M., Gutowski, T., Worrell, E. 2010. Material efficiency: A white paper. Resources, Conservation and Recycling. Vol. 55 (3), 362-381. [Cited 23 Sept 2019]. Available at: https://doi.org/10.1098/rsta.2012.0496
Allwood, J., Ashby, M., Gutowski, T., Worrell, E. 2013. Material efficiency: Providing material services with less material production. Philosophical Transactions of the Royal Society A. Mathematical Physical and Engineering Sciences. Vol. 371 (1986), 1-15. [Cited 23 Sept 2019]. Available at: https://doi.org/10.1098/rsta.2012.0496
Hyrslova, J., Vagner, M., Palasek, J. 2010. Material Flow Cost Accounting (MFCA) – Tool For The Optimazion Of Corporate Production Process. Business, Management and Education. Vol. 9 (1), 5-18. [Cited 27 Sept 2019]. Available at: https://doi.org/10.3846/bme.2011.01
iPoint systems gmbh. 2015. Material Flow Cost Accounting: Resource Efficiency Made Simple. [Cited 29 Sept 2019]. Available at: https://www.ipoint-systems.com/blog/material-flow-cost-accounting-resource-efficien-cy-made-simple/
IPCC. 2014. Climate Change2014 – Mitigation of Climate Change. [Cited 25 Sept 2019]. Available at: https://www.ipcc.ch/site/assets/uploads/2018/03/WGIIIAR5_SPM_TS_Volume-3.pdf
Laatikainen, T., Sahla, S. 2017. Tästä voi vielä nipistää. Tekniikka ja Talous 1/2017 s.12-13.
Motiva Oy. 2019. Materiaalitehokkuus muoviteollisuudessa. [Cited 25 Sept 2019]. Available at: https://www.moti-va.fi/yritykset/energia-_ja_materiaalikatselmus/materiaalikatselmus/materiaalitehokkuus_muoviteollisuudessa
Tanaka, K. 2008. Assessment of energy efficiency performance measures in industry and their application for policy. Energy Policy. Vol. 36 (8), 2887-2902. [Cited 25 Sept 2019]. Available at: https://doi.org/10.1016/j.en-pol.2008.03.032
54
Lea Heikinheimo, Erika Tapaninen
International Studies in Resource Efficiency and Circular Economy around the Baltic Sea One of the main objectives in the project Crea-RE ”Creating aligned studies in Resource Effi-ciency” is to implement joint innovative coop-eration between companies and providers of higher vocational education and training, to ensure better matching work opportunities in sustainable business. As a part of the theme of resource efficiency and circular economy, case studies have been organized in Latvia, Sweden and Finland.
A total of almost 50 students from Latvia, Sweden, Finland and Russia have participated in these case studies, four different cases in each country. Students from those countries carried out their studies in groups to investigate pos-sibilities for enhancing resource efficiency and circular economy in different industries. Case-study courses were held in Riga, Latvia (Univer-sity of Latvia UL) in the autumn of 2018; in Gävle, Sweden (University of Gävle HIG) in the spring of 2019; and in Lahti, Finland (Lahti University of Applied Sciences LAMK) in the autumn of 2019. In the spring of 2020, the final case-study course will be organized in St. Petersburg, Rus-sia (ITMO University).
Learning in International GroupsThe idea of case-study courses is to bring to-gether students and staff from different na-tionalities and knowledge to help companies
with resource efficiency and circular economy issues. This increases the multicultural com-petence and understanding in students and in companies. In the Crea-RE project, some stu-dents have worked in an international group for the first time. Some challenges have been identified during case-study courses in every country, but this was expected. Mari Sagulin (2005) mentioned in her Master’s thesis that it is challenging to work in a foreign language with people from different cultures and working habits. This is one of the most important rea-sons why such courses are needed. Teamwork is one of the most important skills in working life. With this kind of international courses, students who do not have the opportunity to become an exchange student still have an opportunity to improve their language and international team-working skills.
Intensive Week in LahtiThe third case-study course, i.e. intensive study week, was held in Lahti, Finland in the first week of October 2019. A selected group of students was particularly international as the students had nine different nationalities due to exchange students of LAMK and HIG. The week included interesting lectures dealing with digital moni- toring of traffic emissions, examples of shar-ing economy, textile sorting technologies, and

55
industrial symbiosis. The students also visited furniture company ISKU and had a possibility to attend “Responsible Plastics – International Seminar for Students”.
In the previous intensive weeks, we have had some challenges in getting specific tasks for the student group or getting feedback on the students’ reports from the companies. This time, special attention was paid to the selection of companies and only those that had previously been co-operative were selected. The compa-nies were:
Purkupiha Purkupiha is one of Finland’s largest demolition companies for buildings and industrial plants (Purkupiha 2019). To assist Purkupiha to eval-uate export opportunities for their products, students are collecting examples of construc-tion companies and power plants from each
student’s home country. Due to the multicultural background of the student group, the collected information is expected to be valuable to the company.
EnvirateEnvirate is a startup company that has created a platform for completely new environmental big data, which produces valuable information for individuals, businesses, and policymakers. The solution is built on well-established, ex-isting technologies: a smartphone app, cloud computing for web hosting, big data collection, and AI for data analysis. The app is easy to use: data is collected based on using natural human senses (look, hear and breathe) via the users’ smartphone. (Envirate 2019) One of the tasks that Envirate gave the students was to find new ideas how the citizens, companies or institu-tions would like to utilize Envirate data.
Figure 1. Students became familiar with the sorting of construction waste (picture by Erika Tapaninen).
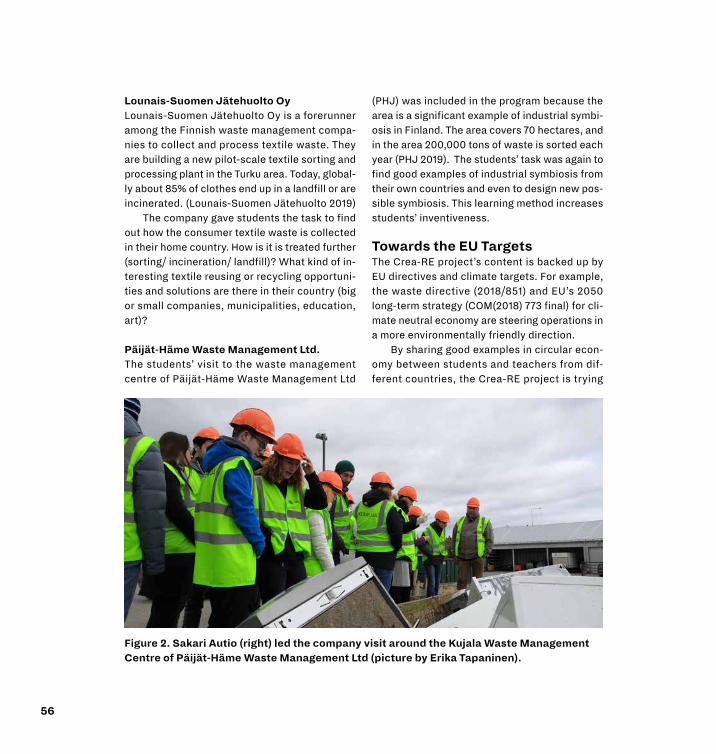
56
Lounais-Suomen Jätehuolto OyLounais-Suomen Jätehuolto Oy is a forerunner among the Finnish waste management compa-nies to collect and process textile waste. They are building a new pilot-scale textile sorting and processing plant in the Turku area. Today, global-ly about 85% of clothes end up in a landfill or are incinerated. (Lounais-Suomen Jätehuolto 2019) The company gave students the task to find out how the consumer textile waste is collected in their home country. How is it is treated further (sorting/ incineration/ landfill)? What kind of in-teresting textile reusing or recycling opportuni-ties and solutions are there in their country (big or small companies, municipalities, education, art)?
Päijät-Häme Waste Management Ltd.The students’ visit to the waste management centre of Päijät-Häme Waste Management Ltd
(PHJ) was included in the program because the area is a significant example of industrial symbi-osis in Finland. The area covers 70 hectares, and in the area 200,000 tons of waste is sorted each year (PHJ 2019). The students’ task was again to find good examples of industrial symbiosis from their own countries and even to design new pos-sible symbiosis. This learning method increases students’ inventiveness.
Towards the EU Targets The Crea-RE project’s content is backed up by EU directives and climate targets. For example, the waste directive (2018/851) and EU’s 2050 long-term strategy (COM(2018) 773 final) for cli-mate neutral economy are steering operations in a more environmentally friendly direction.
By sharing good examples in circular econ-omy between students and teachers from dif-ferent countries, the Crea-RE project is trying
Figure 2. Sakari Autio (right) led the company visit around the Kujala Waste Management Centre of Päijät-Häme Waste Management Ltd (picture by Erika Tapaninen).
57
to make its share to prevent climate change. Good examples are shared with companies in four different countries and students are shar-ing their new knowledge further. The feedback from the students on the study visits has been very positive.
The Crea-RE project is funded by the Interreg Central Baltic Programme and it is implemented in 2018-2020. The Russian partner is participat-
ing in the project (Crea-RE-RU) with funding from the Swedish Institute. (Crea-RE 2019)
The authors would like to express their grat-itude to the Interreg Central Baltic Programme for the funding of the project “Crea-RE Creating aligned studies in Resource Efficiency”.
Also, we would like to thank the partners and all the participants of the Crea-RE project who helped with organizing the case studies.
References
European Comission. 2018. Communication from the Commission. A Clean Planet for all. A European strate-gic long-term vision for a prosperous, modern, competitive and climate neutral economy. COM/2018/773 final. Brussels: European Commission. [Cited 14 Oct 2019]. Available at: https://eur-lex.europa.eu/legal-content/EN/TXT/?uri=CELEX:52018DC0773
Crea-RE. 2019. Project. [Cited 14 Oct 2019]. Available at: https://creareproject.wordpress.com/crea-re-project/
DIRECTIVE (EU) 2018/851. 2018. Amending Directive 2008/98/EC on waste. [Cited 14 Oct 2019]. Available at: https://eur-lex.europa.eu/legal-content/FI/TXT/?uri=CELEX%3A32018L0851
Envirate. 2019. Envirate – a visionary, boundary-crossing, research-based innovation with strong scientific foun-dation, while utilising the latest information and communications technology. Global market opportunity potential for building a sustainable planetary future. [Cited 14 Oct 2019]. Available at: http://www.envirate.net/#hello
Purkupiha. 2019. Purkupiha Group Oy. [Cited 14 Oct 2019]. Available at: https://www.purkupiha.fi/en/purkupiha-group-oy/
Päijät-Häme waste management (PHJ). 2019. Kujala waste centre. [Cited 14 Oct 2019]. Available at: https://www.phj.fi/in-english/kujala-waste-centre/
Sagulin, M. 2005. Yliopistojen kansainvälisen opiskelijavaihdon tuottama oppiminen. Pro Gradu. University of Jyväskylä. Faculty of Education and Psychology. Department of Education. Jyväskylä. [Cited 14 Oct 2019]. Available at: https://jyx.jyu.fi/bitstream/handle/123456789/8804/URN_NBN_fi_jyu-2005156.pdf?sequence=1
Lounais-Suomen Jätehuolto. 2019. LSJH kehittää kiertotaloutta osana valtakunnallisia yhteistyöverkostoja. [Cited 14 Oct 2019]. Available at: https://www.lsjh.fi/fi/yritys-ja-ymparisto/hankkeet/

58
Oliver Carlo, Mahmudul Chowdhury, Eeva Aarrevaara and Silja Kostia
Exploring Japanese Cooperation Opportunities Lahti region aims to strengthen co-operation with the city of Kyoto and the Kyoto prefecture. The targets of the development work are to pro-mote opportunities for local companies to en-ter the Asian market and to introduce regional environmental expertise, education and circular economy implementations. Ongoing successful collaboration between universities, companies, cities and municipalities as well as regional de-velopment companies are a good basis towards achieving these targets.
Cooperation had started in 2016, with mu-tual visits in Lahti region and in Tokyo and Kyoto regions in Japan. Since 2018 it has been organ-ized under HYPE project, coordinated by Ladec Ltd while City of Lahti and LAMK act as project partners. HYPE stands for “Wellbeing and clean environment – Japan-Finland cooperation plat-form for Asian markets”. The nomination of Lahti as the European Green Capital 2021 strength-ened the reputation of Lahti as environmental forerunner. United Nations Sustainable Devel-opment Goals goals are also well recognized in Kyoto, due to Kyoto Protocol which was signed in 1998 and came into force in 2005 including the mechanism of emissions trade.
LAMK’s new master’s program MUrCS (Mas- ter in Urban Climate and Sustainability) has opened new possibilities for international co-op-eration. LAMK has signed a Memorandum of Un-
derstanding (MoU) with Ryukoku University in Kyoto as a result of mutual visits and negotia-tions. Also, the last visit to Kyoto in the beginning of October 2019 contained meetings with Ryu-koku University representatives and discussions of further cooperation opportunities. During this visit the mayor of Lahti, Pekka Timonen, signed cooperation agreements with the city of Kyoto and with Kyoto prefecture.
Development in Urbanization and Universities Finland and Japan share two important challeng-es: low birth rate causing declining age groups and decreasing rural population when people are moving to urban areas because of better career opportunities. The population of Kyoto prefecture surrounding the city of Kyoto is 2,6 million while the growing city of Kyoto has app. 1,5 million in-habitants. Majority of the cities in Kyoto prefec-ture are by size between 50 000 and 100 000 in-habitants. In the light of these facts Päijät-Häme region has many similar challenges with Kyoto prefecture. Both Japan and Finland are high technology countries and have developed new business opportunities based on clean technol-ogy. The challenge is to find new business op-portunities in rural areas where agriculture is the main source of livelihood. Although the needs for urban areas are primarily in discussions in the
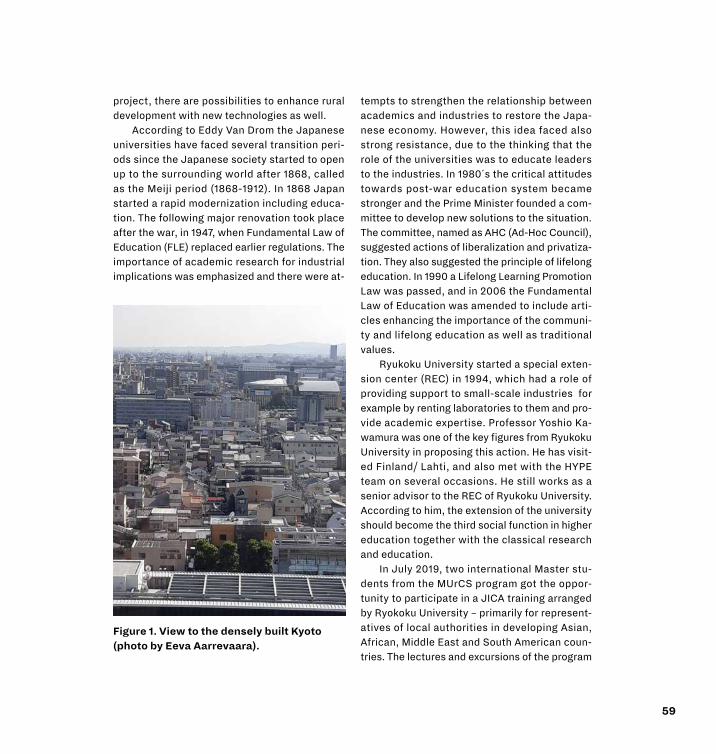
59
project, there are possibilities to enhance rural development with new technologies as well.
According to Eddy Van Drom the Japanese universities have faced several transition peri-ods since the Japanese society started to open up to the surrounding world after 1868, called as the Meiji period (1868-1912). In 1868 Japan started a rapid modernization including educa-tion. The following major renovation took place after the war, in 1947, when Fundamental Law of Education (FLE) replaced earlier regulations. The importance of academic research for industrial implications was emphasized and there were at-
Figure 1. View to the densely built Kyoto (photo by Eeva Aarrevaara).
tempts to strengthen the relationship between academics and industries to restore the Japa-nese economy. However, this idea faced also strong resistance, due to the thinking that the role of the universities was to educate leaders to the industries. In 1980´s the critical attitudes towards post-war education system became stronger and the Prime Minister founded a com-mittee to develop new solutions to the situation. The committee, named as AHC (Ad-Hoc Council), suggested actions of liberalization and privatiza-tion. They also suggested the principle of lifelong education. In 1990 a Lifelong Learning Promotion Law was passed, and in 2006 the Fundamental Law of Education was amended to include arti-cles enhancing the importance of the communi-ty and lifelong education as well as traditional values.
Ryukoku University started a special exten-sion center (REC) in 1994, which had a role of providing support to small-scale industries for example by renting laboratories to them and pro-vide academic expertise. Professor Yoshio Ka-wamura was one of the key figures from Ryukoku University in proposing this action. He has visit-ed Finland/ Lahti, and also met with the HYPE team on several occasions. He still works as a senior advisor to the REC of Ryukoku University. According to him, the extension of the university should become the third social function in higher education together with the classical research and education.
In July 2019, two international Master stu-dents from the MUrCS program got the oppor-tunity to participate in a JICA training arranged by Ryokoku University – primarily for represent-atives of local authorities in developing Asian, African, Middle East and South American coun-tries. The lectures and excursions of the program
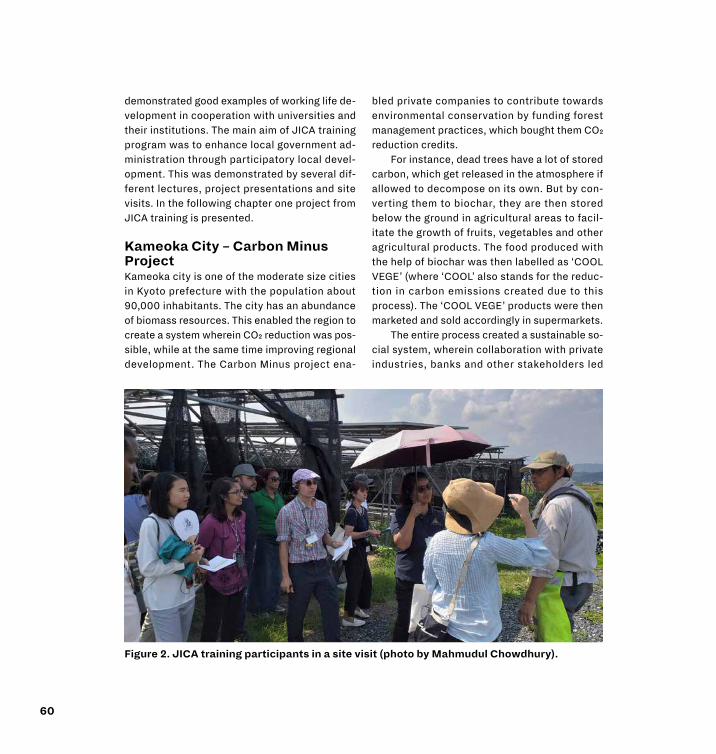
60
demonstrated good examples of working life de-velopment in cooperation with universities and their institutions. The main aim of JICA training program was to enhance local government ad-ministration through participatory local devel-opment. This was demonstrated by several dif-ferent lectures, project presentations and site visits. In the following chapter one project from JICA training is presented.
Kameoka City – Carbon Minus ProjectKameoka city is one of the moderate size cities in Kyoto prefecture with the population about 90,000 inhabitants. The city has an abundance of biomass resources. This enabled the region to create a system wherein CO₂ reduction was pos-sible, while at the same time improving regional development. The Carbon Minus project ena-
Figure 2. JICA training participants in a site visit (photo by Mahmudul Chowdhury).
bled private companies to contribute towards environmental conservation by funding forest management practices, which bought them CO₂ reduction credits.
For instance, dead trees have a lot of stored carbon, which get released in the atmosphere if allowed to decompose on its own. But by con-verting them to biochar, they are then stored below the ground in agricultural areas to facil-itate the growth of fruits, vegetables and other agricultural products. The food produced with the help of biochar was then labelled as ‘COOL VEGE’ (where ‘COOL’ also stands for the reduc-tion in carbon emissions created due to this process). The ‘COOL VEGE’ products were then marketed and sold accordingly in supermarkets.
The entire process created a sustainable so-cial system, wherein collaboration with private industries, banks and other stakeholders led
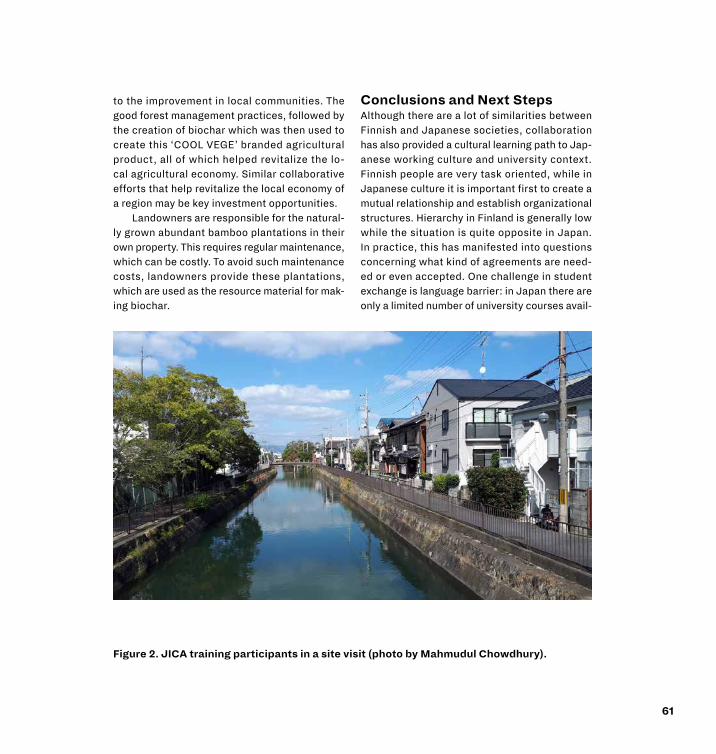
61
to the improvement in local communities. The good forest management practices, followed by the creation of biochar which was then used to create this ‘COOL VEGE’ branded agricultural product, all of which helped revitalize the lo-cal agricultural economy. Similar collaborative efforts that help revitalize the local economy of a region may be key investment opportunities.
Landowners are responsible for the natural-ly grown abundant bamboo plantations in their own property. This requires regular maintenance, which can be costly. To avoid such maintenance costs, landowners provide these plantations, which are used as the resource material for mak-ing biochar.
Conclusions and Next Steps Although there are a lot of similarities between Finnish and Japanese societies, collaboration has also provided a cultural learning path to Jap-anese working culture and university context. Finnish people are very task oriented, while in Japanese culture it is important first to create a mutual relationship and establish organizational structures. Hierarchy in Finland is generally low while the situation is quite opposite in Japan. In practice, this has manifested into questions concerning what kind of agreements are need-ed or even accepted. One challenge in student exchange is language barrier: in Japan there are only a limited number of university courses avail-
Figure 2. JICA training participants in a site visit (photo by Mahmudul Chowdhury).
62
able in English which means that the exchange studies are either a special project, a field work or a thesis project. Naturally, the same challenge concerns possible Japanese students entering Finnish universities.
Finland and Japan are celebrating one cen-tury of diplomatic relationship and the new free trade agreement between Japan and European Union has increased interest in developing mu-tual relationships in different fields of society. Cooperation with the Finnish Embassy in Japan and representatives of Business Finland has been essential for networking with enterprises, admin-istrations and universities in Japan. Based on the
earlier experiences the project team will develop further relationships and common understanding with Japanese stakeholders in the field of busi-nesses and higher education. The nomination of City of Lahti as the European Green Capital 2021 will support these aims by providing a year full of events available for international professionals and students. Olympic games in 2020 and Metsä Pavilion in the site of the Finnish Embassy in Ja-pan, Tokyo, are opportunities for Finnish com-panies, regions and universities to create new networks next autumn.
References
Carlo, O. & Chowdhury, M. 2019. Report on Collaboration between Lahti University of Applied Sciences and Ryokoku University. Through JICA Training Programme 2019. Unpublished report.
City population. Japan: Kyoto. 2019. [Cited 4 Oct 2019]. Available at: https://www.citypopulation.de/Japan-Kyoto.html
MUrCS. Erasmus Mundus Joint Master Programme. 2019. Available at: www.murcs.eu.
United Nations. 2019. Kyoto Protocoll. [Cited 6 Oct 2019]. Available at: https://unfccc.int/kyoto_protocol.
Van Drom, E. 2008. Reforms in the Japanese University System & Changes in the Contributions of Universities toward the Japanese Society. The Hannan Ronshu. Journal of Hannan University. Vol. 44(1), 35-44. [Cited 9 Oct 2019]. Available at: https://hannan-u.repo.nii.ac.jp/?action=repository_action_common_download&item_id=217&item_no=1&attribute_id=18&file_no=1

64
The theme of this publication is circular economy solutions, which is one of the four focus areas at Lahti University of Applied Sciences (LAMK). This publication contains eight articles written by experts and students from Lahti University of Applied Sciences, Aalto University, Regional Council of Päijät-Häme and Lahti Aqua Oy. The aim of this review is to present the latest interesting research and development projects in the field of circular economy.
The Lahti Circular Economy Annual Review series supports communication with LAMK’s partner universities, companies and other stakeholders, and it is a part of circular economy related actions in the R&D, educational and company partnership operations of LAMK. This Lahti Circular Economy Annual Review is published as a part of the sMARTTA - Smart Material Efficiency project (2018-2020), which is funded by the European Regional Development Fund.
The Publication Series of Lahti University of Applied Sciences, part 56ISSN 2342-7507 (PDF) ISSN 2342-7493 (print)ISBN 978-951-827-323-6 (PDF)ISBN 978-951-827-324-3 (print)
EUROPEAN UNIONEuropean Regional Development Fund


![FOR RENT Economy Circular Economy Infographic.pdf · the framework of a circular economy."[5] Global Partners Many major companies are embracing the circular economy shift by partnering](https://img.pdfslide.us/doc/110x75/6013459c7f9b4e43ae74bad4/for-rent-economy-circular-economy-the-framework-of-a-circular-economy5.jpg)