Embed Size (px)
Citation preview

Lagrangian particle tracking in mechanicallyagitated polydisperse suspensions: multi-component hydrodynamics and spatial distributionLiu, Li; Barigou, Mostafa
DOI:10.1016/j.ijmultiphaseflow.2015.03.008
License:Other (please specify with Rights Statement)
Document VersionPeer reviewed version
Citation for published version (Harvard):Liu, L & Barigou, M 2015, 'Lagrangian particle tracking in mechanically agitated polydisperse suspensions: multi-component hydrodynamics and spatial distribution' International Journal of Multiphase Flow, vol 73, pp. 80–89.DOI: 10.1016/j.ijmultiphaseflow.2015.03.008
Link to publication on Research at Birmingham portal
Publisher Rights Statement:NOTICE: this is the author’s version of a work that was accepted for publication. Changes resulting from the publishing process, such aspeer review, editing, corrections, structural formatting, and other quality control mechanisms may not be reflected in this document. Changesmay have been made to this work since it was submitted for publication. A definitive version was subsequently published as Liu, L., Barigou,M., Lagrangian Particle Tracking in Mechanically Agitated Polydisperse Suspensions: Multi-Component Hydrodynamics and Spatial Distribution, International Journal of Multiphase Flow (2015), doi:http://dx.doi.org/10.1016/j.ijmultiphaseflow.2015.03.008
General rightsUnless a licence is specified above, all rights (including copyright and moral rights) in this document are retained by the authors and/or thecopyright holders. The express permission of the copyright holder must be obtained for any use of this material other than for purposespermitted by law.
•Users may freely distribute the URL that is used to identify this publication.•Users may download and/or print one copy of the publication from the University of Birmingham research portal for the purpose of privatestudy or non-commercial research.•User may use extracts from the document in line with the concept of ‘fair dealing’ under the Copyright, Designs and Patents Act 1988 (?)•Users may not further distribute the material nor use it for the purposes of commercial gain.
Where a licence is displayed above, please note the terms and conditions of the licence govern your use of this document.
When citing, please reference the published version.
Take down policyWhile the University of Birmingham exercises care and attention in making items available there are rare occasions when an item has beenuploaded in error or has been deemed to be commercially or otherwise sensitive.
If you believe that this is the case for this document, please contact [email protected] providing details and we will remove access tothe work immediately and investigate.
Download date: 15. Jul. 2018

Accepted Manuscript
Lagrangian Particle Tracking in Mechanically Agitated Polydisperse Suspen-sions: Multi-Component Hydrodynamics and Spatial Distribution
Li Liu, Mostafa Barigou
PII: S0301-9322(15)00064-6DOI: http://dx.doi.org/10.1016/j.ijmultiphaseflow.2015.03.008Reference: IJMF 2183
To appear in: International Journal of Multiphase Flow
Received Date: 14 September 2014Revised Date: 16 February 2015Accepted Date: 1 March 2015
Please cite this article as: Liu, L., Barigou, M., Lagrangian Particle Tracking in Mechanically Agitated PolydisperseSuspensions: Multi-Component Hydrodynamics and Spatial Distribution, International Journal of MultiphaseFlow (2015), doi: http://dx.doi.org/10.1016/j.ijmultiphaseflow.2015.03.008
This is a PDF file of an unedited manuscript that has been accepted for publication. As a service to our customerswe are providing this early version of the manuscript. The manuscript will undergo copyediting, typesetting, andreview of the resulting proof before it is published in its final form. Please note that during the production processerrors may be discovered which could affect the content, and all legal disclaimers that apply to the journal pertain.

1
LAGRANGIAN PARTICLE TRACKING IN MECHANICALLY AGITATED POLYDISPERSE
SUSPENSIONS: MULTI-COMPONENT HYDRODYNAMICS AND SPATIAL DISTRIBUTION
Li Liu and Mostafa Barigou*
School of Chemical Engineering, University of Birmingham, Edgbaston, Birmingham, B15 2TT, UK
Abstract
We investigated the local hydrodynamics and phase distribution of complex polydisperse suspensions ‘just-
suspended’ by a down-pumping pitched blade impeller in a mechanically agitated vessel. The solid-liquid
mixtures consisted of five size fractions of coarse glass particles in water, and the total concentration was varied
within the range 2.4−23.6 vol% (5−40 wt%). The whole flow field and spatial distribution of the liquid phase
and of each particle size fraction were resolved using the Lagrangian technique of positron emission particle
tracking (PEPT). For the first time, it has been possible to conduct such a detailed ‘pointwise’ examination
within an opaque polydisperse suspension of this type and complexity. For each component of the two-phase
flow, results are presented in the form of maps of local velocity, solid concentration and time-averaged slip
velocity, as well as plots of spatial suspension uniformity index. The accuracy of measurements is verified
through six-component mass balance and mass continuity calculations.
Keywords: Lagrangian tracking; mixing; PEPT; polydisperse suspension; slip velocity; suspension uniformity. __________________________________ *Corresponding author: Tel: +44 (0)121 414 5277 Fax: +44 (0)121 414 5324 Email: [email protected]

2
1. Introduction
Industrial processing of solid-liquid suspensions such as bio-slurries, minerals, food, crystallisation and catalytic
mixtures, is commonly conducted in mechanically agitated vessels. A key aspect of such a process is the
achievement of good mixing to ensure a good distribution of all the different phase components and enable an
efficient interaction between them. The methods generally used for designing stirred vessels for solid-liquid
mixing have tended to follow a global ‘black-box’ approach, but a more detailed description of the internal flow
structure is needed to enable more rational rules to be established for equipment and process design. The advent
of powerful measurement and modelling techniques in recent years has revivified interest in this field and
increasingly more attempts are being devoted to better understand the mechanisms behind particle suspension
and distribution in such systems (Kagoshima and Mann, 2006; Guha et al., 2007; Unadkat et al., 2009;
Tamburini et al., 2009).
Homogeneous suspension exists when the solids are practically uniformly distributed throughout the vessel
volume, i.e. there are no solids concentration gradients, and for a polydisperse system the particle size
distribution should also be approximately the same everywhere. This condition is required when it is necessary
to obtain uniform treatment of all the particles, when a suspension must be dispensed at a constant concentration
for sampling, for further processing, or for packaging and the process result that the mixing has to achieve is that
the discharge from the vessel should enable homogeneous filling of packaging lines, e.g. meat/vegetable pieces
in a sauce or fruit particles in yoghurt. Another example would be in a crystalliser where a non-uniform solids
distribution may cause high local supersaturation levels and hence non-uniform crystal growth which is
undesirable. Therefore, knowledge of the local solid concentration and distribution in polydisperse systems,
where multiple particle size fractions are suspended in a liquid phase, would be useful for optimum process
design, development and scale-up.
Detailed experimental investigation of these phenomena has remained a major challenge for decades due to a
lack of adequate measurement techniques capable of probing such opaque multiphase systems (Barigou, 2004).
Among the various flow visualisation techniques, laser Doppler velocimetry (LDV) and particle image
velocimetry (PIV) have become the most reliable to examine complex flow fields in optically transparent single-
phase systems (Ducci and Yianneskis, 2006; Chung et al., 2007, 2009). Application to multi-phase studies,
however, has been confined to dilute suspensions as these techniques fail completely in dense systems which are
opaque.
Attempts at local measurements in these complex systems have been chiefly limited to the measurement of
mean axial solid-concentration profiles at relatively low concentrations, using a single vertical conductivity or
capacitance probe traverse or a withdrawal technique (Barresi and Baldi, 1987; Brunazzi et al., 2004). More
recent experimental studies using electrical resistance tomography (ERT) demonstrated, albeit mainly
qualitatively, how visualisation of gas, solid or liquid distribution can help improve understanding of mixing
processes (Wang et al., 2000). However, none of these methods is capable of probing concentrated suspensions
in detail to acquire quantitative information on the local flow dynamics of the different phase components or
their individual 3-D distributions.

3
Rammohan et al. (2001) developed a more sophisticated computer automated radioactive particle tracking
(CARPT) technique based on gamma-ray emissions. It has been argued for some time that Lagrangian data
obtained from a single particle trajectory, where such data can be accurately determined, may unravel valuable
mixing information which is not provided by Eulerian observations (Villermaux, 1996; Wittmer et al., 1998;
Doucet et al., 2008; Guida et al., 2009; Barigou et al., 2009). The technique of positron emission particle
tracking (PEPT) allows non-invasive probing of opaque fluids and within opaque apparatus by using a single
small sub-millimetre positron-emitting particle as flow tracer (Parker and Fan, 2008). Being able to examine
flow phenomena in three dimensions in dense opaque systems that could not be observed as effectively by using
other techniques, PEPT is particularly useful for the study of non-transparent multi-phase or multi-component
flows, where one component can be selectively labelled and its behaviour observed (Fangary et al., 2000, 2002).
A number of mixing studies have reported that in stirred solid-liquid systems, variation in the particle size
produces significant effects on the fluid dynamics and phase distribution. For example, Virdung and Rasmuson
(2007) using LDV measurements showed that the fluid velocity fluctuations due to turbulence in the liquid
phase were higher in solid-liquid suspensions than in single phase flow, an effect that increased with particle
size. Although their simulations involved particle sizes less than 0.1 mm, Altway et al. (2001) showed that the
pattern of solid concentration contours for different particle sizes was qualitatively similar; however, smaller
particles showed a more uniform distribution. Using larger particles with 0.1 mm < d < 0.5 mm, Špidla et al.
(2005) experimentally confirmed by means of a conductivity probe that smaller solid particles generate a more
homogeneous suspension. Their results also showed that the homogeneity of the solid-liquid suspension
improved with increasing average solid concentration. We recently observed the same effect using coarse
monosized or binary suspensions of glass particles (d ~ 1, 3 mm) (Guida et al., 2010a, 2011; Liu and Barigou,
2013).
In this paper, we report on the use of the Lagrangian PEPT technique to study the mixing of dense polydisperse
mixtures consisting of glass beads of five different size classes suspended in water. We present for the first time
extensive data for these polydisperse systems containing up to 40 wt% (23.6 vol%) solids. Detailed Lagrangian
information is obtained on particle and fluid trajectories which is converted to give a ‘pointwise’ Eulerian
description of the flow field as well as the spatial distribution of each of the liquid and solid components of the
mixture.
2. Materials and methods
2.1 Experimental conditions
The mixing experiments were conducted in a fully-baffled flat-base Perspex vessel of diameter T = 288 mm,
agitated by a down-pumping 6-blade 45º pitched-turbine (PBT) of diameter D = T/2, as illustrated in Fig. 1. The
height of the suspension was set at H = T and the impeller off-bottom clearance was T/4. The suspending liquid
was an aqueous solution of NaCl of density 1150 kg m-3 − NaCl was added to enable the water density to be
matched to that of the resin PEPT tracer used to track the liquid phase − and the solid particles used were
spherical glass beads of density 2485 kg m-3. Five nearly-monomodal particle size fractions, (dp ~ 1.0 mm; ~ 1.5

4
mm; ~ 2.0 mm; ~ 2.5 mm; ~ 3.0 mm) were used to make polydisperse solid-liquid suspensions. The five size
fractions were mixed in equal proportions with a total solid mass concentration, X, varying from 0 to 40 wt%,
i.e. XXXXXX 2.054321 ===== . Experiments were conducted under the ‘just-suspended’ regime
corresponding to the minimum impeller speed for particle suspension Njs, which was visually determined in the
transparent vessel according to the well-known Zwietering criterion (Zwietering, 1958), i.e. no particle remains
stationary on the bottom of the tank for longer than 1-2 s. The experimental mixing conditions are summarized
in Table 1.
2.2 Multi-component positron emission particle tracking
The multi-component two-phase flow field and spatial phase distribution in the mixing vessel were determined
by the technique of positron emission particle tracking (PEPT), as illustrated in Fig. 1. PEPT uses a single
positron-emitting particle as a flow tracer which is then tracked in 3-D space and time to reveal its full
Lagrangian trajectory. The measurements can be analysed in two different ways: a Lagrangian-statistical
analysis exploiting concepts such as residence time, circulation time and trajectory length distribution; or, a
Lagrangian-Eulerian analysis used to extract local Eulerian quantities from the purely Lagrangian information
contained in the tracer trajectory such as the three velocity components ( ru , zu , θu ) of each phase
component, its local occupancy or time-average concentration (Guida et al., 2012). PEPT has been validated by
comparing its measurements with PIV in water, and has been shown to be an accurate and reliable technique
(Pianko-Oprych et al., 2009). More details about the technique can be found in our earlier papers (Barigou,
2004; Guida et al., 2009; Barigou et al., 2009; Guida et al., 2010a, 2011, 2012).
In multi-component positron emission particle tracking, the full three-dimensional trajectory of each component
must be resolved separately using different particle tracers. Currently, PEPT can most accurately track one
particle at a time and, therefore, each component of the suspension was individually tracked in the suspension
and its full trajectory separately determined in one of six successive experiments (liquid phase + 5 solid
components). A neutrally-buoyant radioactive resin tracer of 600 µm diameter was used to track the liquid
phase, and from each particle size fraction a representative glass particle was taken, was directly irradiated via a
cyclotron and its motion tracked within the agitated slurry (Parker and Fan, 2008). The PEPT tracking time was
30 min in each case, long enough so that good data resolution was obtained in every region of the vessel.
Furthermore, ergodicity of flow, the theoretical condition which guarantees that a flow follower is representative
of all the solid or liquid phase it represents, could be safely assumed under such conditions. This is justified
given that in such a system the probability of visit of a cell by the tracer particle is sufficiently uniform by virtue
of the highly turbulent state of the suspension (Reimp = ND2/ν > 105), and the open geometry of the vessel where
all regions are more or less equally accessible by the tracer. Experimental confirmation of the ergodicity
assumption has been discussed in previous papers (Guida et al., 2010a, 2010b, 2011).
3. Results and discussion
The measurements obtained from the 3-D Lagrangian tracking of the liquid phase and the five solid fractions
were analysed and converted, for each component of the two-phase flow, to azimuthally-averaged Eulerian

5
maps of local flow velocity, spatial concentration distribution and time-averaged particle-liquid slip velocity,
using a cylindrical grid consisting of nc = 512 (16 by 32) cells of equal volume, as illustrated in Fig. 2. Cells
near the wall have dimensions 4.49 × 2.29 mm2, whilst the innermost cells have dimensions 4.49 × 18.00 mm2.
Six-component mass balance and continuity calculations were also conducted throughout the vessel to verify the
accuracy of the PEPT measurements. In order to enable efficient consultation and comparison of data, results
are presented in a concise format using sets of images judiciously produced by grouping together multiple
graphs, greyscale contours, or vector plots. Finally, the uniformity of the suspensions was assessed by means of
a uniformity index.
3.1 Local velocity fields
Maps of the local flow velocity are shown in Fig. 3 for the liquid phase and for the five solid fractions at
conditions of suspension corresponding to the Njs values given in Table 1. The Njs value shown for each
suspension concentration is the one which ensured that all particles were just suspended. It should be noted,
however, that Njs was not significantly affected by particle size over the range of particle diameters investigated
(1–3 mm). Using cylindrical coordinates, the radial-axial 2-D velocity maps were obtained by azimuthally
averaging the 3-D velocity data and projecting them onto the 2-D radial-axial plane (rz). Whilst two-
dimensional, these flow maps are, however, representative of the whole 3-D velocity field.
The observed flow field with a single flow loop is typical of a down-pumping PBT with a low off-bottom
clearance. As expected, fluid velocities are highest in the impeller region (about 0.6utip near the edge of the
impeller) and around the flow loop, but much lower in the upper parts of the vessel and near the centre of the
loop.
For ease of comparison, all the velocity plots have been normalised by the impeller tip speed, utip. The
normalised plots for the liquid and solid components of the flow exhibit remarkable similarity regardless of
particle size and solid concentration. The tendency of flow structures at high Reynolds numbers to present
similar characteristics, is a phenomenon often referred to as Reynolds number similarity. In fully turbulent
flow, viscosity effects vanish and dimensionless mean values such as velocities normalised by the impeller tip
speed should be independent of Reynolds number. The values of the impeller Reynolds number (Reimp = ND2/ν)
are given in Table 1, and span the range 1.5×10⁵ – 2.4×10⁵. We have previously observed such a similarity in
less complex suspensions of mono and binary composition (Liu and Barigou, 2013, 2014). Sample results
plotted in Fig. 4, show the azimuthally-averaged radial distributions of the normalised velocity components for
the liquid phase and two solid components (1 mm, 3 mm) at all solid concentrations investigated. Some minor
disparities are observed, but the principle of Reynolds number similarity seems to hold for both liquid and solids
at all solid concentrations.
3.2 Time-averaged slip velocity maps
The magnitude of the local time-averaged slip velocity vector was determined for each solid component j, thus:
( ) ( ) ( )2)()(2)()(2)()( jLjz
Lz
jr
Lrj uuuuuus ϑθ −+−+−=
(1)

6
where (ur, uz, uθ) are the mean cylindrical velocity components for the liquid (L) and solid component (j). The
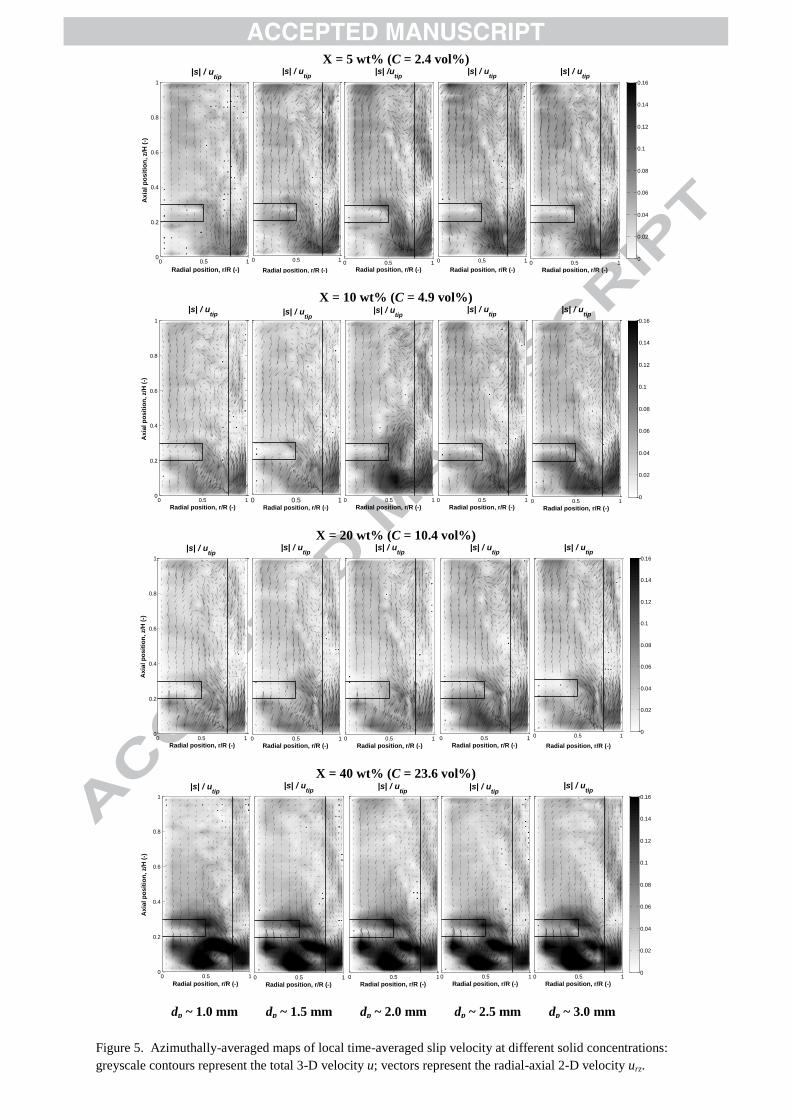
effects of the mean solid concentration on the spatial distribution of the normalised total slip velocity for each
solid component of the mixture are depicted in Fig. 5. The largest local slip velocities occur in the discharge
region of the impeller and are of the order of ~ 0.10utip. At the lower solid concentrations, the larger particles
with more inertia display significantly more slip than the smaller ones. This effect, however, is barely
noticeable at higher solid concentrations as particle-particle interactions become important and differences in
velocity reduce through frequent particle collisions.
There are wide variations in the spatial distribution of sj. As a consequence of Eq. (1), which combines radial,
axial and tangential contributions, the regions of maximum slip velocity occasionally correspond with the lower
tip of the impeller blades (tangential dominance), with the discharge region of the impeller (radial-axial
dominance), or with both areas when there is a more balanced contribution of the three cylindrical components
of the slip velocity vector. Considering the individual components of the slip velocity vector, detailed analysis
showed that by far the largest slip occurs in the axial z direction (data not shown). Nevertheless, some
significant slip (up to ~ 0.10utip) was also observed in the r and θ directions in small regions confined to the
impeller discharge and below the impeller (data not shown). For all particle size fractions, there is a gradual but
significant reduction in the slip velocity with increasing X in the upper parts of the vessel, but below the
impeller and in the impeller discharge region substantial increases are observed.
3.3 Spatial solids distribution
In addition to location and velocity information, PEPT allows the particle occupancy distribution within the
vessel to be determined. By dividing the vessel volume into a grid of nc cells, occupancy can be obtained by
calculating the fraction of the total experimental time, t∞, spent by the tracer in each cell during the experiment.
Such a definition establishes a mathematical identity between occupancy and probability of presence of the
particle tracer, but undesirably makes occupancy highly dependent on the density of the grid so that as the
number of cells increases occupancy tends to zero. If the cells are chosen to have equal volume, however, this
problem is circumvented by using the ‘ergodic time’ defined as cE ntt /∞= , instead of the total experimental
time t∞.
The ergodic time represents the time that the tracer would spend in any cell if the flow were ergodic, an
asymptotic status in which the flow tracer has exactly an equal probability of presence everywhere within the
system. Thus, the local occupancy, Oj, can be defined as:
E
j
jt
tO
∆= (2)
where ∆tj is the time that the tracer of the j-th component (solid or liquid) of the mixture spends inside a given
cell. For the polydisperse systems examined in this work, the index j assumes values 1 to 6, where j = 1 to 5
denotes the solid components, and j = 6 denotes the liquid phase also designated by the symbol L.

7
On the basis of such a definition, it can be shown that, in a multiphase system, occupancy, Oj, of component j is
directly related to its local phase volume concentration, cj, via the relationship:
j
j
jC
cO = (3)
where Cj is the mean phase volume concentration of component j in the vessel. Full details of the mathematical
treatment can be found in our previous papers (Guida et al., 2010a, 2011).
Thus, using Eq. (3) the spatial distribution of the local concentration of each flow component was fully resolved
in the polydisperse suspensions investigated. Azimuthally-averaged solid concentration maps are presented in
Fig. 6. The highest local concentrations are several times greater than the mean solid concentration and are
observed in a clearly defined mound of solids accumulating beneath the agitator as well as in small fillets in the
corners. This effect is more pronounced at the lower solid loadings for which solids distribution in the upper
parts of the vessel is poor. However, this maldistribution of solids improves substantially as X increases for all
particle fractions in the mixture, tending gradually towards a much more uniform state at X = 40 wt%. This
seems to suggest, perhaps counter-intuitively, that in the ‘just suspended’ regime more concentrated suspensions
tend towards a homogeneous state by virtue of their increased solids loading. The smaller particles, however,
are significantly better dispersed than the larger ones at all the values of X used here.
The local particle size distributions in the vessel are presented in the maps shown Fig. 7. The azimuthally- and
vertically-averaged particle size distributions are shown above the local particle distribution maps. There are
considerable concentration gradients in the vertical direction, an effect which is clearly captured in the radially-
averaged particle size distributions shown to the right of the maps. Such an effect, as pointed out above, is
much more pronounced at lower X values. Horizontally, however, the vertically-averaged distributions above
the maps are fairly flat except close to the wall in the upper parts of the vessel where the smaller particles seem
to predominate somewhat.
Locally, at lower mean concentrations, the larger particles tend to represent the higher fractions beneath the
impeller, but the local size distributions become increasingly more uniform as X increases. However, the mass
of solids is clearly still not quite homogeneously distributed in the volume of the vessel even at X = 40 wt%. It
is well known that, in general, impeller speeds substantially higher than Njs and, consequently, much higher
power inputs are required to achieve a state of homogeneous suspension. Such an increase in power demand is
even larger for (denser) faster settling particles as is the case here, and the power consumption could be several
folds its value at Njs (Oldshue, 1983).
The uniformity of a given component in the suspension can be quantified using the uniformity index, ξ,
introduced in our recent works (Guida et al., 2009, 2010a), thus:

8
11
1
1
1
1
22
+
−=
+=
∑=
cn
i
i
c C
Cc
n
σξ (4)
where nc, as defined above, is the total number of cells in the PEPT measurement grid and i is the cell number.
The uniformity of the suspension is at its minimum when ξ → 0 (condition achieved for a theoretically infinite
variance, σ2, of the normalised local concentration); and the solids are uniformly distributed within the vessel
volume when ξ = 1, i.e., the local solid concentration is equal to the average concentration everywhere in the
vessel (σ2 = 0).
The effects observed in the particle-size-distribution maps displayed in Fig. 7, are clearly captured in Fig. 8 by
the variations of ξ. The uniformity index is considerably higher for the smaller particles and, for all particle
sizes, it increases considerably as a function of X, but the rate of increase reduces significantly at higher
concentrations. The gap in homogeneity between small and large particles reduces gradually with increasing
concentration from 70% at X = 5 wt% down to 12% at X = 40 wt%. For the smallest particles, ξ reaches 0.9 at
X = 40 wt%.
3.4 Mass balance and mass continuity
The ‘pointwise’ measurements obtained from PEPT enabled the solids mass balance throughout the vessel to be
accurately verified, i.e. the measured local values, cj, of the five solid volume concentrations should balance the
experimental parameter Cj = Vj /
VT, so that:
j
n
i
ij
c
Ccn
c
≡∑=1
)(1 (5)
where Vj is the volume of component j in the vessel and VT is the total suspension volume. The identity symbol
‘≡’ appears in Eq. (5) because the local concentration is obtained from Eq. (3), through the measurement of
local values of the occupancy Oj whose average value is by definition identically equal to 1. The error on the
mas balance for all components was ~ 1%.
Another important tool for checking the accuracy and reliability of flow data is mass continuity. The net mass
flux through a volume bounded by a closed surface S should be zero, thus:
0)( ≅∆⋅∑S
j Su (6)
Calculations can be made by considering a closed cylindrical surface S with the same vertical axis, base and
diameter as the tank but of a shorter height. Because the vector u is zero over the external surface of the vessel
or is parallel to it, the term u·∆S is zero everywhere except in the horizontal plane across the tank, so that S can

9
be reduced to such a plane, Sz, and Eq. (6) is reduced to a zero average of axial velocities across the horizontal
plane considered.
Alternatively, a similar situation can be envisaged where S is a closed cylindrical envelope with the same
vertical axis and height as the tank but with a smaller diameter; Eq. (6) then becomes a zero average of radial
velocities across the lateral surface, Sr, of the considered cylindrical volume. These two types of surfaces Sh and
Sr were numerically introduced in the vessel and the continuity test was applied to all the sets of data collected
in this study. The results are summarised in Fig. 9, showing a very good verification of the mass continuity as
the velocity average across the given surface in each case is close to zero, generally less than 0.02utip. The slight
discrepancy is probably due to systematics in the intrinsic measurement error or in artefacts introduced by data
processing, e.g. uncertainty associated with the location of the tracer, grid size for occupancy, smoothing of
position data during velocity calculations etc.
Conclusions
The Lagrangian technique of PEPT has been successfully extended, for the first time, to the analysis of complex
highly-concentrated solid-liquid flows of polydisperse suspensions consisting of five particle size fractions.
Thus, it has been possible to determine for each component of the two-phase flow detailed distributions of the
local velocity, spatial distribution, and time-averaged slip velocity, and to quantitatively assess the homogeneity
of suspension of each particle size fraction relative to the other size fractions. The accuracy of the 3-D
Lagrangian measurements has been ascertained through multi-component mass balance and continuity
verifications throughout the vessel.
The measured local velocity distributions showed that the Reynolds number similarity holds for all components
of the two-phase flow under all conditions investigated. The local time-averaged slip velocity varies widely
within the vessel, is generally very different from the particle terminal settling velocity, and can reach
considerable values greater than 0.10utip. At the lower solid concentrations, the larger particles with more
inertia display considerably more inter-phase slip than the smaller ones. This effect, however, reduces
substantially with an increase in solid concentration and impeller speed as particle-particle interactions become
important.
The uniformity of suspension improves as a function of mean solid concentration when suspensions are
considered at the same ‘just suspended’ hydrodynamic regime corresponding to the Njs speed. Smaller particles
exhibit considerably better suspension homogeneity. This study has shown that PEPT is a powerful non-
intrusive Lagrangian technique which is ideally suited to the study of dense solid-liquid systems of complex
composition. The technique can, therefore, be extended to the study of more challenging systems with wider
particle size distributions, more complex rheologies and probably even higher solid concentrations.
10
Acknowledgements
Li Liu’s PhD research was funded jointly by a China Scholarship and an Elite scholarship from the University
of Birmingham. We are grateful to Prof. D.J. Parker and J.F. Gargiuli of the Positron Imaging Centre at The
University of Birmingham for their assistance with the PEPT experiments.
References
Altway A, Setyawan H, Margono, Winardi S. Effect of particle size on simulation of three-dimensional solid dispersion in stirred tank. Chemical Engineering Research & Design. 2001; 79(A8):1011-1016. Barigou M, Chiti F, Pianko-Oprych P, Guida A, Adams L, Fan X, Parker DJ, Nienow AW. Using Positron Emission Particle Tracking (PEPT) to Study Mixing in Stirred Vessels: Validation and Tackling Unsolved Problems in Opaque Systems. Journal of Chemical Engineering of Japan. 2009; 42(11):839-846. Barigou M. Particle tracking in opaque mixing systems: An overview of the capabilities of PET and PEPT. Chemical Engineering Research & Design. 2004; 82(A9):1258-1267. Barresi A, Baldi G. Solid dispersion in an agitated vessel. Chemical Engineering Science. 1987; 42(12):2949-2956. Brunazzi E, Galletti C, Paglianti A, Pintus S. An impedance probe for the measurements of flow characteristics and mixing properties in stirred slurry reactors. Chemical Engineering Research & Design. 2004; 82(A9):1250-1257. Chung KHK, Barigou M, Simmons MJH. Reconstruction of 3-D flow field inside miniature stirred vessels using a 2-D PIV technique. Chemical Engineering Research & Design. 2007; 85(A5):560-567. Chung KHK, Simmons MJH, Barigou M. Angle-resolved Particle Image Velocimetry measurements of flow and turbulence fields in small-scale stirred vessels of different mixer configurations. Industrial & Engineering Chemistry Research. 2009; 48(2):1008-1018. Doucet J, Bertrand F, Chaouki J. A measure of mixing from Lagrangian tracking and its application to granular and fluid flow systems. Chemical Engineering Research & Design. 2008; 86(12A):1313-1321. Ducci A, Yianneskis M. Turbulence kinetic energy transport processes in the impeller stream of stirred vessels. Chemical Engineering Science. 2006; 61(9):2780-2790. Fangary YS, Barigou M, Seville JPK, Parker DJ. A Langrangian study of solids suspension in a stirred vessel by Positron Emission Particle Tracking (PEPT). Chemical Engineering & Technology. 2002; 25(5):521-528. Fangary YS, Barigou M, Seville JPK, Parker DJ. Fluid trajectories in a stirred vessel of non-newtonian liquid using positron emission particle tracking. Chemical Engineering Science. 2000; 55(24):5969-5979. Guha D, Ramachandran PA, Dudukovic MP. Flow field of suspended solids in a stirred tank reactor by Lagrangian tracking. Chemical Engineering Science. 2007; 62(22):6143-6154. Guida A, Fan X, Parker DJ, Nienow AW, Barigou M. Positron emission particle tracking in a mechanically agitated solid–liquid suspension of coarse particles. Chemical Engineering Research & Design. 2009; 87(4):421-429. Guida A, Nienow AW, Barigou M. Mixing of dense binary suspensions: multi-component hydrodynamics and spatial phase distribution by PEPT. AIChE J. 2011; 57 (9), 2302-2315. Guida A, Nienow AW, Barigou M. PEPT measurements of solid-liquid flow field and spatial phase distribution in concentrated monodisperse stirred suspensions. Chemical Engineering Science. 2010a; 65(6):1905-1914. Guida A, Nienow AW, Barigou M. Shannon entropy for local and global description of mixing by Lagrangian particle tracking. Chem. Eng. Sci. 2010b; 65 (10), 2865-2883.

11
Guida, A, Nienow, AW, Barigou M. Lagrangian tools for the analysis of mixing in single- and multi-phase flow systems. AIChE J. 2012; 58 (1), 31-45. Kagoshima M, Mann R. Development of a networks-of-zones fluid mixing model for an unbaffled stirred vessel used for precipitation. Chemical Engineering Science. 2006; 61(9):2852-2863. Liu, L, Barigou, M. Experimentally validated CFD simulations of multi-component hydrodynamics and phase distribution in agitated high solid fraction binary suspensions. Industrial & Engineering Chemistry Research. 2014; 53 (2), 895−908. Liu, L, Barigou, M. Numerical modelling of velocity field and phase distribution in dense monodisperse solid-liquid suspensions under different regimes of agitation: CFD and PEPT experiments. Chemical Engineering Science. 2013; 101, 837–850. Oldshue JY. Fluid mixing technology and practice. Chem. Eng. 1983, 90, 82-108. Parker DJ, Fan X. Positron emission particle tracking - Application and labelling techniques. Particuology. 2008; 6(1):16-23. Pianko-Oprych P, Nienow AW, Barigou M. Positron emission particle tracking (PEPT) compared to particle image velocimetry (PIV) for studying the flow generated by a pitched-blade turbine in single phase and multi-phase systems. Chem. Eng. Sci. 2009; 64 (23), 4955–4968. Rammohan AR, Kemoun A, Al-Dahhan MH, Dudukovic MP. A Lagrangian description of flows in stirred tanks via computer-automated radioactive particle tracking (CARPT). Chemical Engineering Science. 2001; 56(8):2629-2639. Špidla M, Sinevič V, Jahoda M, Machoň V. Solid particle distribution of moderately concentrated suspensions in a pilot plant stirred vessel. Chemical Engineering Journal. 2005; 113(1):73-82. Tamburini A, Cipollina A, Micale G, Ciofalo M, Brucato A. Dense solid-liquid off-bottom suspension dynamics: Simulation and experiment. Chemical Engineering Research & Design. 2009; 87(4A):587-597. Unadkat H, Rielly CD, Hargrave GK, Nagy ZK. Application of fluorescent PIV and digital image analysis to measure turbulence properties of solid-liquid stirred suspensions. Chemical Engineering Research & Design. 2009; 87(4A):573-586. Villermaux J. Trajectory Length Distribution (TLD), a novel concept to characterize mixing in flow systems. Chemical Engineering Science. 1996; 51(10):1939-1946. Virdung T, Rasmuson A. Measurements of continuous phase velocities in solid-liquid flow at elevated concentrations in a stirred vessel using LDV. Chemical Engineering Research & Design. 2007; 85(A2):193-200. Wang M, Dorward A, Vlaev D, Mann R. Measurements of gas-liquid mixing in a stirred vessel using electrical resistance tomography (ERT). Chemical Engineering Journal. 2000; 77(1-2):93-98. Wittmer S, Falk L, Pitiot P, Vivier H. Characterization of stirred vessel hydrodynamics by three dimensional trajectography. Canadian Journal of Chemical Engineering. 1998; 76(3):600-610. Zwietering TN. Suspending of solid particles in liquid by agitators. Chemical Engineering Science. 1958; 8(3-4):244-253.

12
Figure and Table captions
Figure 1. Experimental set-up for studying the mixing of polydisperse suspensions by PEPT: 1 tank; 2 shaft; 3
baffle; 4 PBT; 5 γ-ray detectors; 6 PEPT particle tracer; 7 polydisperse glass particles.
Figure 2. Illustration of the cylindrical grid consisting of equal volume cells used for the analysis of the Lagrangian data, and a grid cell with multiple PEPT tracer visits.
Figure 3. Azimuthally-averaged local velocity maps of liquid and solid phase components at different solid
concentrations: greyscale contours represent the total 3-D velocity u; vectors represent the radial-axial 2-D
velocity urz.
Figure 4. Demonstration of Reynolds number similarity – Azimuthally-averaged radial distributions of the
normalized velocity components for three mixture components: — X = 5 wt%; --- X = 10 wt%; -·-·-· X =
20 wt%; · · · X = 40 wt%; Reimp = 1.5×10⁵ – 2.4×10⁵ (see Table 1).
Figure 5. Azimuthally-averaged maps of local time-averaged slip velocity at different solid concentrations:
greyscale contours represent the total 3-D velocity u; vectors represent the radial-axial 2-D velocity urz.
Figure 6. Azimuthally-averaged maps of local solid volume concentration at different solid concentrations.
Figure 7. Maps of azimuthally-averaged local particle size distribution at different solid concentrations: particle
size fractions from left to right, dp ~ 1.0 mm; dp ~ 1.5 mm; dp ~ 2.0 mm; dp ~ 2.5 mm; dp ~ 3.0 mm.
Figure 8. Variation of uniformity index for all solid components at varying X.
Figure 9. Normalised radial and axial velocities averaged on surface Sr (of diameter 0.53T) and Sz (0.3H off the
base), respectively: □ 1.0 mm; ◌ 1.5 mm; ∆ 2.0 mm; × 2.5 mm; ● 3.0 mm; ■ liquid.
Table 1. Experimental conditions.

Figure 1. Experimental set-up for studying the mixing of polydisperse suspensions by PEPT: 1 tank; 2 shaft; 3
baffle; 4 PBT; 5 γ-ray detectors; 6 PEPT particle tracer; 7 polydisperse glass particles.
1
5
4
2
3 6
5
7 7

PEPT particle tracer locations
u 3
u 1
1
2 3
4
5
6
8
4 3
2 1
4
2
3
1
u 2
5
z
r
7
Figure 2. Illustration of the cylindrical grid consisting of equal volume cells used for the analysis of the
Lagrangian data, and a grid cell with multiple PEPT tracer visits.

X = 5 wt% (C = 2.4 vol%)
X = 10 wt% (C = 4.9 vol%)
X = 20 wt% (C = 10.4 vol%)
X = 40 wt% (C = 23.6 vol%)
liquid dp ~ 1.0 mm dp ~ 1.5 mm dp ~ 2.0 mm dp ~ 2.5 mm dp ~ 3.0 mm
Figure 3. Azimuthally-averaged local velocity maps of liquid and solid phase components at different solid
concentrations: greyscale contours represent the total 3-D velocity u; vectors represent the radial-axial 2-D
velocity urz.
Radial position, r/R (-)
Axia
l p
osit
ion
, z/H
(-)
|u| / utip
0 0.5 10
0.2
0.4
0.6
0.8
1
Radial position, r/R (-)
|u| / utip
0 0.5 1
Radial position, r/R (-)
|u| / utip
0 0.5 1
Radial position, r/R (-)
|u| / utip
0 0.5 1
Radial position, r/R (-)
|u| / utip
0 0.2 0.4 0.6 0.8 1
Radial position, r/R (-)
|u| / utip
0 0.5 10
0.1
0.2
0.3
0.4
0.5
0.6
Radial position, r/R (-)
Axia
l p
osit
ion
, z/H
(-)
|u| / utip
0 0.5 10
0.2
0.4
0.6
0.8
1
Radial position, r/R (-)
|u| / utip
0 0.5 1
Radial position, r/R (-)
|u| / utip
0 0.5 1
Radial position, r/R (-)
|u| / utip
0 0.5 1
Radial position, r/R (-)
|u| / utip
0 0.5 1
Radial position, r/R (-)
|u| / utip
0 0.5 10
0.1
0.2
0.3
0.4
0.5
0.6
Radial position, r/R (-)
Axia
l p
osit
ion
, z/H
(-)
|u| / utip
0 0.5 1
0
0.2
0.4
0.6
0.8
1
Radial position, r/R (-)
|u| / utip
0 0.5 1
Radial position, r/R (-)
|u| / utip
0 0.5 1
Radial position, r/R (-)
|u| / utip
0 0.5 1
Radial position, r/R (-)
|u| / utip
0 0.5 1
Radial position, r/R (-)
|u| / utip
0 0.5 10
0.1
0.2
0.3
0.4
0.5
0.6
Radial position, r/R (-)
Axia
l p
osit
ion
, z/H
(-)
|u| / utip
0 0.5 10
0.2
0.4
0.6
0.8
1
Radial position, r/R (-)
|u| / utip
0 0.5 1
Radial position, r/R (-)
|u| / utip
0 0.5 1
Radial position, r/R (-)
|u| / utip
0 0.5 1
Radial position, r/R (-)
|u| / utip
0 0.5 1
Radial position, r/R (-)
|u| / utip
0 0.5 10
0.1
0.2
0.3
0.4
0.5
0.6

Figure 4. Demonstration of Reynolds number similarity – Azimuthally-averaged radial distributions of the normalized velocity components for
three mixture components: — X = 5 wt%; --- X = 10 wt%; -·-·-· X = 20 wt%; ··· X = 40 wt%; Reimp = 1.5×10⁵ – 2.4×10
5 (see Table 1).
liquid dp ~ 1.0 mm dp ~ 3.0 mm
-.6
-.3
0
.3
.6
-.6
-.3
0
.3
-.6
-.3
0
.3
-.6
-.3
0
.3
Radial position, r/R (-)
No
rma
liz
ed
ve
loc
ity
co
mp
on
en
t, u
/uti
p (
-)
0 0.2 0.4 0.6 0.8-.6
-.3
0
.3
uz
0 0.2 0.4 0.6 0.8
ur
0 0.2 0.4 0.6 0.8 1
u
Radial position, r/R (-)0 0.2 0.4 0.6 0.8
uz
0 0.2 0.4 0.6 0.8
ur
0 0.2 0.4 0.6 0.8 1
u
z =
0.8
3H
z =
0.3
3H
z =
0.1
7H
z =
0.0
8H
Radial position, r/R (-)
0 0.2 0.4 0.6 0.8
uz
z =
0.0
16
H
0 0.2 0.4 0.6 0.8
ur
0 0.2 0.4 0.6 0.8 1
u
X = 5 wt% (C = 2.4 vol%)
X = 10 wt% (C = 4.9 vol%)
X = 20 wt% (C = 10.4 vol%)
X = 40 wt% (C = 23.6 vol%)
dp ~ 1.0 mm dp ~ 1.5 mm dp ~ 2.0 mm dp ~ 2.5 mm dp ~ 3.0 mm
Figure 5. Azimuthally-averaged maps of local time-averaged slip velocity at different solid concentrations:
greyscale contours represent the total 3-D velocity u; vectors represent the radial-axial 2-D velocity urz.
Radial position, r/R (-)
Axia
l p
osit
ion
, z/H
(-)
|s| / utip
0 0.5 10
0.2
0.4
0.6
0.8
1
Radial position, r/R (-)
|s| / utip
0 0.5 1
Radial position, r/R (-)
|s| /utip
0 0.5 1
Radial position, r/R (-)
|s| / utip
0 0.5 1
Radial position, r/R (-)
|s| / utip
0 0.5 10
0.02
0.04
0.06
0.08
0.1
0.12
0.14
0.16
Radial position, r/R (-)
Axia
l p
osit
ion
, z/H
(-)
|s| / utip
0 0.5 10
0.2
0.4
0.6
0.8
1
Radial position, r/R (-)
|s| / utip
0 0.5 1Radial position, r/R (-)
|s| / utip
0 0.5 1
Radial position, r/R (-)
|s| / utip
0 0.5 1
Radial position, r/R (-)
|s| / utip
0 0.5 10
0.02
0.04
0.06
0.08
0.1
0.12
0.14
0.16
Radial position, r/R (-)
Axia
l p
osit
ion
, z/H
(-)
|s| / utip
0 0.5 10
0.2
0.4
0.6
0.8
1
Radial position, r/R (-)
|s| / utip
0 0.5 1
Radial position, r/R (-)
|s| / utip
0 0.5 1
Radial position, r/R (-)
|s| / utip
0 0.5 1
Radial position, r/R (-)
|s| / utip
0 0.5 10
0.02
0.04
0.06
0.08
0.1
0.12
0.14
0.16

X = 5 wt% (C = 2.4 vol%)
X = 10 wt% (C = 4.9 vol%)
X = 20 wt% (C = 10.4 vol%)
X = 40 wt% (C = 23.6 vol%)
dp ~ 1.0 mm dp ~ 1.5 mm dp ~ 2.0 mm dp ~ 2.5 mm dp ~ 3.0 mm
Figure 6. Azimuthally-averaged maps of local solid volume concentration at different solid concentrations.
Radial position, r/R (-)
Axia
l p
osit
ion
, z/H
(-)
c/C
0 0.5 10
0.2
0.4
0.6
0.8
1
Radial position, r/R (-)
c/C
0 0.5 1
Radial position, r/R (-)
c/C
0 0.5 1
Radial position, r/R (-)
c/C
0 0.5 1
Radial position, r/R (-)
c/C
0 0.5 10
1
2
3
4
5
6
Radial position, r/R (-)
Ax
ial p
os
itio
n,
z/H
(-)
c/C
0 0.5 10
0.2
0.4
0.6
0.8
1
Radial position, r/R (-)
c/C
0 0.5 1
Radial position, r/R (-)
c/C
0 0.5 1
Radial position, r/R (-)
c/C
0 0.5 1
Radial position, r/R (-)
c/C
0 0.5 10
1
2
3
4
5
6
Radial position, r/R (-)
Axia
l p
osit
ion
, z/H
(-)
c/C
0 0.5 10
0.2
0.4
0.6
0.8
1
Radial position, r/R (-)
c/C
0 0.5 1
Radial position, r/R (-)
c/C
0 0.5 1
Radial position, r/R (-)
c/C
0 0.5 1
Radial position, r/R (-)
c/C
0 0.5 10
1
2
3
4
5
6
Radial position, r/R (-)
Ax
ial p
os
itio
n,
z/H
(-)
c/C
0 0.5 10
0.2
0.4
0.6
0.8
1
Radial position, r/R (-)
c/C
0 0.5 1
Radial position, r/R (-)
c/C
0 0.5 1
Radial position, r/R (-)
c/C
0 0.5 1
Radial position, r/R (-)
c/C
0 0.5 10
1
2
3
4
5
6

X = 5 wt% (C = 2.4 vol%) X = 10 wt% (C = 4.9 vol%)
X = 20 wt% (C = 10.4 vol%) X = 40 wt% (C = 23.6 vol%)
Figure 7. Maps of azimuthally-averaged local particle size distribution at different solid concentrations: particle
size fractions from left to right, dp ~ 1.0 mm; dp ~ 1.5 mm; dp ~ 2.0 mm; dp ~ 2.5 mm; dp ~ 3.0 mm.
Radially-averaged distributions
Vertically-averaged distributions
Vertically-averaged distributions
Radially-averaged distributions
Radial position, r/R (-) Radial position, r/R (-)
Radial position, r/R (-) Radial position, r/R (-)

Figure 8. Variation of uniformity index for all solid components at varying X.
0 5 10 15 20 25 30 35 40 45 0
0.2
0.4
0.6
0.8
1
Uniformity index, (-)
Mean solid mass concentration, X (wt%)
d p ~ 1.0 mm d p ~ 1.5 mm d p ~ 2.0 mm d p ~ 2.5 mm d p ~ 3.0 mm

Figure 9. Normalised radial and axial velocities averaged on surface Sr (of diameter 0.53T) and Sz (0.3H off the
base), respectively: □ 1.0 mm; ◌ 1.5 mm; Δ 2.0 mm; × 2.5 mm; ● 3.0 mm; ■ liquid.
0
.02
.04
.06
.08
0.1
<u
r>S
r/uti
p (
-)
0 5 10 15 20 25 30 35 40 450
.02
.04
.06
.0.1
0
Mean solid mass concentration, X (wt%)
<u
z>
Sz/u
tip (
-)
Sz
Sr
0.53T
0.3H

13
Table 1. Experimental conditions.
C (vol%) X (wt%) Njs (rpm) Reimp (-)
2.4 5 378 1.5 × 10⁵
4.9 10 450 1.8 × 10⁵
10.4 20 510 2.0 × 10⁵
23.6 40 612 2.4 × 10⁵

14
Highlights
- The technique of multi-component positron emission particle tracking is used
- New unique data are reported for the mixing of dense complex polydisperse suspensions
- 3-D local velocities and spatial distribution of each phase component are measured
- Maps of local particle size distribution and particle slip velocity are reported
- The uniformity of dispersion of each flow component is quantified