Embed Size (px)
Citation preview

SEK M %
0
200
400
600
800
1,000
1,200
1,400
1,600
201720162015201420135
6
7
8
9
10
11
12
13
Year-end report 2017
• A number of organisational changes were made on 1 January 2017 where-by operations were transferred from the Parent Company, Länsförsäk-ringar AB, to the Bank Group. A total of 116 full-time employees joined the Bank Group.
• Operating profit increased 9% to SEK 1,599 M (1,467) and the return on equity amounted to 10.0% (10.1).
• Net interest income increased 15% to SEK 3,996 M (3,464). • Operating income increased 12% to SEK 3,258 M (2,904). • Operating expenses amounted to SEK 1,601 M (1,399). • Loan losses amounted to SEK 57.7 M (37.6*), net, corresponding to a loan loss level of 0.02% (0.02).
• Business volumes increased 14% to SEK 519.5 billion (456.1). • Deposits rose 9% to SEK 99.4 billion (91.2). Lending increased 15% to SEK 261.4 billion (226.7).
• The Common Equity Tier 1 capital ratio for the consolidated situation amounted to 23.3% (23.4**) on 31 December 2017.
• The number of customers with Länsförsäkringar as their primary bank rose 11% and the number of cards increased 13%.
• According to the 2017 Swedish Quality Index customer satisfaction survey, Länsförsäkringar Bank is the single player on the bank market with the most satisfied retail and corporate customers. Länsförsäkringar Bank also has the most satisfied mortgage customers and corporate custo-mers for property loans according to the 2017 Swedish Quality Index.Figures in parentheses pertain to the same period in 2016. * The comparative figure includes the dissolution of reserves amounting to SEK 23.3 M. ** Pertains to 30 September 2017.
The year in brief, Group President’s comment
Once again, we report strong earnings and can summarise 2017 as the best year in the bank’s history. Net interest income trended favourably during the year and the credit qu-ality of the loan portfolio remains high. Busi-ness volumes reported healthy growth and market the position improved in all segments. For the 12th time in the past 14 years, Läns-försäkringar Bank is the single player on the bank market with the most satisfied retail customers. In addition, it is highly gratifying to state that we now also have the most sa-tisfied corporate customers as well as the most satisfied mortgage and property-loan customers according to the 2017 Swedish Quality Index. The continued high customer inflow is ultimately confirmation that custo-mers appreciate our offering. We firmly be-lieve that the combination of our strong local presence and our market-leading digital ser-vices will continue to create the conditions for high customer satisfaction and additional inflows of new customers in 2018.
Anders BorgcrantzPresident of Länsförsäkringar Bank
Operating profit, SEK M Return on equity, %
Operating profit and return on equity
0
100
200
300
400
500
600
700
201720162015201420130
100
200
300
400
500
20172016201520142013
Card trendNumber of cards, 000s
Customer trendNumber of primary bank customers, 000s
9 February 2018
Länsförsäkringar Bank
lansforsakringar.se/finansielltbank

A sense of optimism prevailed in the eco-nomy during 2017, with the global economy growing stronger. The largest surprise was Europe’s performance where the economy clearly surged and growth exceeded ex-pectations. However, inflation remained far short of targets, which means that the ECB is expected to maintain its expansive monetary policy. The US economy also trended positi-vely, particularly the strong labour market, although inflation was lower than anticipa-ted, which led to the Fed continuing its aus-terity measures in monetary policy at a res-trained rate and increased interest rates three times. The Republican tax reform slightly raised expectations of US growth in 2018, further fuelling stock market perfor-mance. In general, the global economy was surprisingly stable in 2017, particularly in light of the political risks that dominated the news. The UK applied to leave the EU, Ger-many experienced difficulties in forming a government and the US markedly elevated
Market commentary
its tone towards North Korea, while risks in the Middle East increased. Stock markets generally posted a favourable trend for the year, led by emerging markets.
The fixed-income market reported no major fluctuations during the year. Long-term US interest rates moved sideways fol-lowing a sharp upswing towards the end of 2016, while short-term rates tracked the Fed’s three rate hikes. Swedish and European long-term interest rates ended 2017 slightly higher than at the start of the year and short-term rates fell marginally. Rates on Swedish covered bonds fell during the year and demand from investors was good.
The Swedish economy performed strong-ly during the year; growth was surprisingly positive, the labour market continued to im-prove and inflation rose. The employment rate is now well above levels prior to the fi-nancial crisis of 2008. Nevertheless, the Riksbank decided to wait out interest rate in-creases, and the repo rate has been negative
for almost three years. The SEK strengthe-ned against the USD but weakened against the EUR during the year. Continued expansi-ve signals from the Riksbank, a degree of concern regarding the Swedish housing mar-ket and a stronger EUR underpinned this trend. Housing prices generally show seaso-nal variations with a weaker performance towards the end of the year, yet 2017 repor-ted considerably weaker figures than normal and housing prices, excluding seasonal varia-tions, fell 5.3% in the second half of the year. The Swedish Financial Supervisory Authori-ty’s decision to introduce a stricter repay-ment requirement combined with a tempora-rily high supply of new-builds may have accelerated this development. Looking for-ward, the housing market has now become a more distinct risk for the Swedish economy, even though the underlying economic condi-tions for the households remain unchanged.
Key figures
GroupQ 4
2017Q 3
2017Q 4
2016Jan-Dec
2017Jan-Dec
2016
Return on equity, % 10.43 10.61 10.34 10.00 10.09
Return on total capital, % 0.55 0.57 0.56 0.53 0.54
Investment margin, % 1.35 1.34 1.36 1.32 1.28
Cost/income ratio before loan losses 0.49 0.46 0.48 0.49 0.48
Common Equity Tier 1 capital ratio, Bank Group, % 24.3 24.2 24.8 24.3 24.8
Tier 1 ratio, Bank Group, % 26.8 26.7 27.5 26.8 27.5
Total capital ratio, Bank Group, % 32.1 32.1 33.4 32.1 33.4
Core Tier 1 ratio, consolidated situation, % 23.3 23.4 21.2 23.3 21.2
Tier 1 ratio, consolidated situation, % 24.8 25.3 23.2 24.8 23.2
Total capital ratio, consolidated situation, % 28.1 29.4 27.6 28.1 27.6
Percentage of impaired loans, gross, % 0.11 0.10 0.11 0.11 0.11
Reserve ratio in relation to loans, % 0.10 0.10 0.11 0.10 0.11
Reserve ratio in relation to loans, incl. withheld remuneration to regional insurance companies, % 0.14 0.13 0.17 0.14 0.17
Loan loss level, % 0.04 0.02 0.00* 0.02 0.02*
* Includes the dissolution of reserves.
Income statement, quarterly
Group, SEK MQ 4
2017Q 3
2017Q 2
2017Q 1
2017Q 4
2016
Net interest income 1,070.1 1,015.4 970.7 940.0 944.8
Net commission –227.8 –194.6 –168.3 –159.6 –187.3
Net gains/losses from financial items –6.3 –7.7 –5.1 –30.3 –14.6
Other operating income 47.7 3.8 6.0 3.7 16.0
Total operating income 883.3 817.0 803.3 753.8 758.9
Staff costs –124.6 –128.2 –153.0 –143.2 –114.1
Other expenses –303.4 –245.9 –259.6 –242.9 –,251.8
Total operating expenses –428.0 –374.1 –412.6 –386.2 –366.0
Profit before loan losses 455.3 442.9 390.7 367.6 393.0
Loan losses, net -22.9 –13.8 –5.9 –15.1 –2.4
Operating profit 432.4 429.1 384.8 352.5 390.6
Year-end report 2017 2 Länsförsäkringar Bank

Significant changes since 1 January 2017
The Bank Group implemented a number of organisational changes on 1 January 2017 to develop the governance of the operations and to further enhance cost control.
Reclassifications in the accounts have also been made in order to better reflect the ban-king operations and their underlying perfor-mance. As a result, certain items have been changed in the income statement. Compara-tive figures for the reclassifications in the accounts have been restated to facilitate comparison between the periods. The chang-es have a neutral effect on earnings. The un-derlying earnings and cost trend remain fa-vourable.
The changes made and their effects on costs and earnings for the January – December 2017 period are described below.
Organisational changes 1. The Bank Business Service unit, which per-forms back office services, was transferred from the Parent Company, Länsförsäkringar AB, to Länsförsäkringar Bank on 1 January 2017. This action resulted in the number of employees in the Bank Group increasing by 109 individuals. The cost for Bank Business Service of SEK 70 M was charged to staff costs in 2017. The cost in the same amount is invoiced to the regional insurance companies and recognised as commission income. This action has a neutral effect on earnings.
2. Part of previously externally outsourced fund management in Länsförsäkringar Fond-förvaltning has been taken over by the com-pany itself, for which three fund managers were employed. Services were previously purchased via external managers and reco-gnised in the item administration costs. This is charged to the item staff costs from 1 Ja-nuary, and amounted to SEK 8 M for 2017. Net commission improved in an amount att-ributable to the cost that Länsförsäkringar Fondförvaltning previously incurred for ex-ternal managers. This action has a conti-nuously positive effect on earnings.
3. The Economic Research Department, which provides the Bank Group and Länsför-säkringar AB with services in macroecono-mic analysis, was transferred from Länsför-säkringar AB to Länsförsäkringar Bank’s operations, and entailed an increased cost of SEK 13 M for 2017. The number of employees who joined the Bank Group in this unit is four individuals.
Adjusted for the three organisational chang-es above, the underlying cost increase for the Bank Group was 6.9% in 2017 period compared with the year-earlier period. The effect on the number of employees in the Bank Group was a total increase of 116 indivi-duals.
Reclassifications in the accounts 4. Administration costs for Länsförsäkringar Fondförvaltning have been reclassified between “Other administration expenses” and “Commission expense.” Comparative fi-gures have been restated and the effect for 2017 amounts to SEK 169 M. This action has a neutral effect on earnings.
5. Income for Wasa Kredit has been reclassi-fied between the items “Other operating in-come” and “Commission income.” The change entails that income for services rendered that was previously classified as “Other ope-rating income” has now been transferred to “Commission income.” Comparative figures have been restated and the effect for the 2017 amounts to SEK 94 M. This action has a neutral effect on earnings.
Year-end report 2017 3 Länsförsäkringar Bank

Business volumesBusiness volumes rose 14%, or SEK 63.4 bil-lion, to SEK 519.5 billion (456.1). Lending in-creased 15%, or SEK 34.7 billion, to SEK 261.4 billion (226.7), with continued high credit qu-ality. Lending in Länsförsäkringar Hypotek rose 17%, or SEK 28.8 billion, to SEK 197.7 bil-lion (168.9). Lending in Wasa Kredit increased 18% to SEK 21.6 billion (18.3). Deposits incre-ased 9%, or SEK 8.2 billion, to SEK 99.4 billion (91.2). Fund volumes increased 15%, or SEK 20.5 billion, to SEK 158.7 billion (138.2).
Retail mortgages Customer deposits Agricultural loans Funds Other loans
Business volumes
0
100
200
300
400
500
600
20172016201520142013
SEK bn
CustomersThe number of customers with Länsförsäk-ringar as their primary bank increased 11% to 467,000 (419,000) and the average number of products per customer was 5. Some 92% of those customers who have the bank as their primary bank are also existing Länsförsäk-ringar insurance customers. The number of bank cards rose 13% to 655,000 (580,000).
Earnings and profitabilityOperating profit increased 9% to SEK 1,599 M (1,467), attributable to higher net interest income. The investment margin strengthe-ned to 1.32% (1.28). Profit before loan losses rose 10% to SEK 1,657 M (1,505). The return on equity amounted to 10.0% (10.1).
0
1,000
2,000
3,000
4,000
20172016201520142013
SEK M
Net interest income
IncomeOperating income increased 12% to SEK 3,258 M (2,904), primarily due to higher net interest income. In addition, SEK 42.2 M was received in dividends from the sale of the holding in Visa Europe. Net interest income rose 15% to SEK 3,996 M (3,464) attributable to increased volumes and lower refinancing costs. Net losses from financial items amounted to SEK –49.4 M (68.4) due to changes in fair value. Commission income in-creased 11% to SEK 1,789 M (1,616), as a result of an improvement in securities commission, a rise in other commission, and commission income from the regional insurance compa-nies for the cost of the Bank Business Servi-ce unit. Net commission amounted to SEK –750.3 M (–661.9), due to increased remune-ration to the regional insurance companies based on higher volumes and the strengthe-ned profitability of the business.
ExpensesOperating expenses amounted to SEK 1,601 M (1,399), up 14%. The increase was mainly attributable to higher staff costs associated with additional personnel since 1 January 2017 from Länsförsäkringar AB as described on page 3 of this year-end report. Adjusted for these organisational changes, the under-lying cost increase totalled 6.9%, due to, for example, initiatives for future-oriented IT in-vestments. The cost/income ratio was 0.49 (0.48) before loan losses and 0.51 (0.49) after loan losses.
0.4
0.5
0.6
0.7
0.8
20172016201520142013
Cost/income ratio before loan losses
Loan lossesLoan losses amounted to SEK 57.7 M (37.6*), net, corresponding to a loan loss level of 0.02% (0.02). Impaired loans, gross, amoun-ted to SEK 277.9 M (240.2), corresponding to a percentage of impaired loans, gross, of 0.11% (0.11). Reserves totalled SEK 267.5 M (250.1), corresponding to a reserve ratio in
relation to loans of 0.10% (0.11). In addition, SEK 88.2 M (129.6) of the remuneration to the regional insurance companies’ credit-risk commitments for generated business is withheld in accordance with the settlement model. The reserve ratio in relation to loans, including withheld remuneration to the regi-onal insurance companies, was 0.14% (0.17).
For more information regarding loan los-ses, reserves and impaired loans, see notes 6 and 7. * The comparative figure includes dissolution of reserves of SEK 23.3 M.
Deposits and savingsDeposits from the public increased 9%, or SEK 8.2 billion, to SEK 99.4 billion (91.2). Deposits from small businesses amounted to SEK 11.2 billion (11.0). The total number of deposit ac-counts increased 10%. On 31 December 2017, the market share for household deposits ac-cording to Statistics Sweden amounted to 4.8% (4.8). Fund volumes increased 15%, or SEK 20.5 billion, to SEK 158.7 billion (138.2) attributa-ble to positive changes in value and increased inflows in the fund business.
Loans All loans are granted in Sweden, in SEK and have a well-diversified geographic distribu-tion. Loans to the public increased 15%, or SEK 34.7 billion, to SEK 261.4 billion (226.7). The credit quality of lending remained high. The weighted average loan-to-value ratio of the mortgage portfolio, LTV, declined to 60% (61). Lending in Länsförsäkringar Hypotek rose 17%, or SEK 28.8 billion, to SEK 197.7 bil-lion (168.9). The percentage of retail mortga-ges in relation to the total loan portfolio was at 76%. On 31 December 2017, the market share of retail mortgages had strengthened to 6.3% (5.8) according to Statistics Sweden. Agricultural lending increased 6% to SEK 26.8 billion (25.3). Agricultural lending prima-rily comprises first-lien mortgages to fami-ly-owned agricultural operations, and the av-erage commitment was low at SEK 2.4 M on 31 December 2017. First-lien mortgages for agricultural properties, comprising 94% (93) of agricultural lending, accounted for the en-tire increase in agricultural loans and increa-sed to SEK 25.3 billion (23.5). Agricultural lending is continuing to grow at a lower rate than other loans and its share of total loans is falling. Loans to small businesses totalled SEK 1.8 billion (1.5) on 31 December 2017.
Lending in Wasa Kredit increased 18% to SEK 21.6 billion (18.3).
2017 compared with 2016
Year-end report 2017 4 Länsförsäkringar Bank

Loan portfolio, distribution in %
Lending segment, % 31 Dec 2017 31 Dec 2016
Retail mortgages 75.7 74.4
Agriculture 10.2 11.1
Multi-family housing 3.0 3.5
Leasing and hire purchase 6.4 6.3
Unsecured loans 3.2 3.5
Other 1.5 1.2
TOTAL 100 100
Volume of retail mortgages in Bank Group by loan-to-value ratio*
Capital receivable Total
Loan-to-value ratio Volume, SEK M Total, %
0–50% 161,440 81.8%
51–60% 18,829 9.5%
61–70% 11,428 5.8%
71–75% 2,961 1.5%
75%+ 2,802 1.4%
TOTAL 197,458 100%
* Refers to loans with single-family homes, tenant-owned apartments or vacation homes as collateral.
FundingThe Group has a low refinancing risk and the maturity profile is well diversified. Debt se-curities in issue increased 21%, or SEK 34.1 billion, to a nominal SEK 183.0 billion (151.6), of which covered bonds amounted to SEK 146.6 billion (121.6), senior long-term funding to SEK 35.1 billion (28.9) and short-term fun-ding to SEK 1.0 billion (1.1). The average re-maining term for the long-term funding was 3.5 years (3.3) on 31 December 2017.
Covered bonds were issued during the year at a volume of a nominal SEK 39.0 billion (31.3). Repurchased covered bonds totalled a nominal SEK 7.2 billion (8.4) and matured co-vered bonds a nominal SEK 6.8 billion (8.3). Länsförsäkringar Bank issued senior unsecu-red bonds in the nominal amount of SEK 14.3 billion (8.1) during the year and senior unse-cured bonds of a nominal SEK 7.8 billion (6.7) fell due for payment.
In March, Länsförsäkringar Hypotek issued a seven-year Euro benchmark-covered bond for a nominal EUR 500 M, and in September, Länsförsäkringar Bank issued a five-year
senior unsecured Euro bond for a nominal EUR 500 M. The transaction was the first step of a long-term strategy to also build up an investor base in the Euro market for seni-or funding. In addition, Länsförsäkringar Hy-potek issued two Swedish benchmark bonds during the year, LFH516 and LFH517, which mature in September 2023 and September 2024, respectively.
Covered bonds Senior unsecured Commercial papers
Maturity profile
0
5
10
15
20
25
30
35
40
2025-2024202320222021202020192018
SEK bn
LiquidityOn 31 December 2017, the liquidity reserve totalled SEK 48.1 billion (41.6). The liquidity reserve is invested in securities with very high credit quality and that are eligible for transactions with the Riksbank and, where applicable, with the ECB. By utilising the li-quidity reserve, contractual undertakings can be met for more than two years without needing to secure new funding in the capital market. The Liquidity Coverage Ratio (LCR) for the consolidated situation on 31 Decem-ber 2017 according to the Swedish Financial Supervisory Authority’s definition amounted to 202% (169) and according to the European Commission’s delegated act to 339% (342). The Net Stable Funding Ratio (NSFR) for the consolidated situation amounted to 116%** (116) on 31 December 2017. ** The calculation is based on Länsförsäkringar Bank’s interpreta-tion of the Basel Committee’s most recent Net Stable Funding Ratio proposal. The comparative figure pertains to 30 September 2017.
Swedish covered bonds Swedish government bonds Swedish bonds with an AAA/Aaa credit rating Bonds issued/guaranteed by European
governments/ multinational development banks Deposits with Swedish National Debt Office and
central bank Nordic AAA/Aaa-rated covered bonds
*** Comprising 99% AAA-rated bonds.
Liquidity reserve ***
58%
6%4% 3%
21%
8%
RatingLänsförsäkringar Bank’s credit rating is A/Sta-ble from Standard & Poor’s and A1/Stable from Moody’s. Länsförsäkringar Hypotek’s covered bonds have the highest credit rating of Aaa from Moody’s and AAA/Stable from Standard & Poor’s.
Capital adequacy, consolidated situation1
In accordance with the CRR (575/2013), the consolidated situation includes the parent mixed financial holding company Länsförsäk-ringar AB, in addition to the Bank Group. Sin-ce the bank is of the opinion that the actual risk and capital situation is best presented in the Bank Group’s capital ratios, the actual risk and capital situation are published in parallel with the capital ratios according to the consolidated situation.
RatingCompany Agency Long-term rating Short-term rating
Länsförsäkringar Bank Standard & Poor’s A/Stable A–1(K–1)
Länsförsäkringar Bank Moody’s A1/Stable P–1
Länsförsäkringar Hypotek † Standard & Poor’s AAA/Stable –
Länsförsäkringar Hypotek † Moody’s Aaa –
† Pertains to the company’s covered bonds.
Year-end report 2017 5 Länsförsäkringar Bank

Consolidated situation (SEK M) 31 Dec 2017 30 Sep 2017
IRB Approach 34,148 33,722
retail exposures 26,798 26,090
exposures to corporates 7,350 7,632
Standardised Approach 17,643 17,085
Operational risks 11,346 11,346
Total REA 64,379 63,464
Common Equity Tier 1 capital 14,992 14,835
Tier 1 capital 15,936 16,035
Total capital 18,100 18,627
Common Equity Tier 1 capital ratio 23.3% 23.4%
Tier 1 ratio 24.8% 25.3%
Total capital ratio 28,1% 29,4%
The Common Equity Tier 1 capital ratio amounted to 23.3% (23.4). The Bank Group continued to generate a profit in the fourth quarter. However, a deduction for the expec-ted, proposed dividend from the Parent Company Länsförsäkringar AB to the share-holders of SEK 300 M reduced Common Equity Tier 1 capital.
Tier 1 and Tier 2 capital were impacted by a re-interpretation regarding eligible own funds instruments made in the fourth quar-ter. In November 2017, the European Banking Authority published an Opinion on an inter-pretation regarding how own funds instru-ments are to be credited in own funds. The Opinion clarified the application of the limi-tation rules on eligible own funds instru-ments in the consolidated situation. The new interpretation led to the consolidated situa-tion on 31 December 2017 adding only own funds instruments issued externally by Läns-försäkringar Bank to the portion of capital required to cover the capital requirements of Länsförsäkringar Bank and its subsidiaries. On December 31, 2017, the capital require-ment is based on the transition rules under Basel 1. Eligible Tier 1 capital amounted to SEK 944 M (1,200) and eligible Tier 2 capital to SEK 2,163 M (2,592) on 31 December 2017.
Total Risk Exposure Amount (REA) in the consolidated situation on 31 December 2017 amounted to SEK 64,379 M (63,464). REA in-creased SEK 915 M in the quarter, primarily due to loans to the public continuing to in-crease. The credit quality of lending remai-ned favourable. The total REA for the Bank Group was SEK 48,432 M (47,921) on 31 De-cember 2017.
Bank Group (SEK M) 31 Dec 2017 30 Sep 2017
IRB Approach 34,148 33,722
retail exposures 26,798 26,090
exposures to corporates 7,350 7,632
Standardised Approach 8,701 8,547
Operational risks 4,341 4,341
Total REA 48,432 47,921
Common Equity Tier 1 capital 11,767 11,596
Tier 1 capital 12,967 12,796
Total capital 15,559 15,388
Common Equity Tier 1 capital ratio 24.3% 24.2%
Tier 1 ratio 26.8% 26.7%
Total capital ratio 32.1% 32.1%
Internally assessed capital requirement and bufferThe internally assessed capital requirement for the consolidated situation on 31 Decem-ber 2017 amounted to SEK 6,367 M, compri-sing the minimum capital requirement under Pillar I and the capital requirement for risks managed under Pillar II. The internally asses-sed capital requirement is calculated based on the methods and models used to calcula-te the capital requirement under the fra-mework of Pillar I. Internal models are used for Pillar II risks.
In addition to this, there is the capital re-quirement for the risk weight floor for Swedish mortgages, the countercyclical ca-pital buffer and the capital conservation buf-fer. The risk weight floor for mortgages of 25% entailed a capital requirement of SEK 5,077 M on 31 December 2017. The counter-cyclical capital buffer of 2% of REA amoun-ted to SEK 1,288 M on 31 December 2017 and the capital conservation buffer of 2.5% of REA to SEK 1,609 M.
The capital meeting the internal capital requirement including buffer, meaning own funds, amounted to SEK 18,100 M. The lever-age ratio on 31 December 2017 amounted to 4.8% (4.9).
For the Bank Group, the internally asses-sed capital requirement amounted to SEK 4,984 M and own funds to SEK 15,559 M.
For more information on capital adequa-cy, see note 111 The comparative period pertains to 30 September 2017.
MRELIn December 2017, the Swedish National Debt Office announced its decision on reso-lution plans and minimum requirements for own funds and eligible liabilities (MREL) for the ten institutions that have business activi-ties that are deemed to be critical to the Swedish financial system. MREL for the consolidated situation is 6.2% of total liabili-ties and own funds. This MREL level of 6.2% is divided into a loss absorption amount of 2.6% that is to be covered by own funds in-struments and a recapitalisation amount of 3.6% that is to be covered by bail-inable liabi-lities. According to the decision, the bail-ina-ble liabilities are to be issued by Länsförsäk-ringar Bank. Bail-inable liabilities includes senior unsecured funding with a remaining term of more than one year. A requirement that bail-inable liabilities are to be subordina-ted will be gradually phased in over the peri-od until 1 January 2022. The National Debt Office will announce in 2018 whether the consolidated situation will be subject to the subordination requirement. On 31 December 2017, Länsförsäkringar Bank had outstanding senior unsecured funding with a remaining term of more than one year of SEK 28.7 bil-lion, which exceeds MREL by a very high mar-gin.
Interest-rate riskOn 31 December 2017, an increase in market interest rates of 1 percentage point would have increased the value of interest-bearing assets and liabilities, including derivatives, by SEK 48.7 M (decrease: 16.1).
Risks and uncertainties The operations are characterised by a low risk profile. Bank Group is exposed to a num-ber of risks, primarily comprising credit risks, refinancing risks and market risks. The ma-croeconomic situation in Sweden is critical for credit risk since all loans are granted in Sweden. Market risks primarily comprise in-terest-rate risks. Loan losses remain low and the refinancing of business activities was highly satisfactory during the year. A more detailed description of risks is available in the 2016 Annual Report. No significant changes in the allocation of risk have taken place compared with the description provi-ded in the Annual Report.
Year-end report 2017 6 Länsförsäkringar Bank

Fourth quarter of 2017 compared with third quarter of 2017Operating profit amounted to SEK 432.4 M (429.1) attributable to higher net interest in-come. The return on equity amounted to 10.4% (10.6). Operating income increased 8% to SEK 883.3 M (817.0) due to higher net inte-rest income and dividends received of SEK 42.2 M from the sale of the holding in Visa Europe. Net interest income increased 5% to SEK 1,070 M (1,015) as a result of continued positive volume growth. The investment mar-gin strengthened to 1.35% (1.34). Commission income amounted to SEK 463.9 M (445.0) and the commission expense to SEK 691.8 M (639.6). Net commission amounted to SEK –227.8 M (–194.6). Net losses from financial items amounted to SEK –6.3 M (–7.7). Opera-ting expenses increased 14% to SEK 428.0 M (374.1), mainly due to future-oriented IT in-vestments as well as due to effects from a change on how VAT should be calculated for Wasa Kredit. The cost/income ratio before loan losses amounted to 0.49 (0.46). Loan losses amounted to SEK 22.9 M (13.8), net.
SEK M %
0
100
200
300
400
500
Q42017
Q3 2017
Q22017
Q12017
Q42016
4
6
8
10
12
14
Operating profit, SEK M Return on equity, %
Operating profit and return on equity
SEK M
0
100
200
300
400
500
Q4 2017
Q32017
Q22017
Q12017
Q42016
0.4
0.5
0.6
0.7
0.8
0.9
Operating expenses, SEK M Cost/Income ratio
Operating expenses and cost/income ratio
Other informationSven Eggefalk was appointed the new Presi-dent of Länsförsäkringar Bank AB on 24 No-vember 2017. Sven Eggefalk will take office on 3 April 2018 and succeeds Anders Borg-crantz who was appointed President on 30 June 2017.
Events after the end of the periodOn 2 February 2018, Johan Agerman left the position as Board Chairman of Länsförsäk-ringar Bank. In connection with this, Sören Westin was appointed as Board Chairman of Länsförsäkringar Bank.
Annual ReportThe Annual Report will be available on Läns-försäkringar Bank’s website on 13 March 2018.
Year-end report 2017 7 Länsförsäkringar Bank

Länsförsäkringar HypotekLending increased 17%, or SEK 28.8 billion, to SEK 197.7 billion (168.9). Retail mortgages up to 75% of the market value of the collateral on the granting date are granted by Länsför-säkringar Hypotek and the remainder by the Parent Company. Operating profit increased 23% to SEK 813.0 M (658.4), due to higher net interest income. Net interest income rose 28% to SEK 2,101 M (1,647), attributable to higher volumes and lower refinancing costs. Operating expenses amounted to SEK 103.4 M (97.4). Loan losses amounted to SEK 0.0 M (–4.8**), net, corresponding to a loan loss le-vel of 0.00% (–0.00). The number of retail mortgage customers increased 10% to SEK 255,000 (231,000).** The comparative figure includes the dissolution of reserves
amounting to SEK 3.1 M.
SEK M 31 Dec 2017 31 Dec 2016
Total assets 215,337 189,228
Lending volume 197,655 168,948
Net interest income 2,101 1,647
Operating profit 813 658
Parent Company
Subsidiaries
Loans to the public amounted to SEK 42.2 billion (39.5). Deposits from the public incre-ased 9%, or SEK 8.3 billion, to SEK 99.8 billion (91.5). Debt securities in issue amounted to SEK 35.6 billion (29.1). Operating profit decli-ned 12% to SEK 289.6 M (329.8) due to increa-sed operating expenses. Net interest income amounted to SEK 1,127 M (1,124). Operating income increased 7% to SEK 1,302 M (1,217) due to higher commission income. Commis-sion income increased 30% to SEK 490.8 M (378.1), mainly attributable to commission in-
Wasa KreditWasa Kredit’s lending volumes increased 18% to SEK 21.6 billion (18.3). Operating profit amounted to SEK 402.0 M (402.0). Net inte-rest income rose 11% to SEK 768.5 M (692.8). Operating expenses amounted to SEK 453.6 M (413.4) and loan losses, net, were SEK 53.1 M (20.8).
SEK M 31 Dec 2017 31 Dec 2016
Total assets 22,321 18,869
Lending volume 21,586 18,274
Net interest income 768 693
Operating profit 402 402
Länsförsäkringar FondförvaltningFund volumes increased 15%, or SEK 20.5 bil-lion, to SEK 158.7 billion (138.2) attributable to increased inflows in the fund business and positive changes in value in 2017. The fund offering includes 37 mutual funds under Länsförsäkringar’s own brand with various investment orientations and a fund market with external funds. Three Swedish equities funds are internally managed by Länsförsäk-ringar Fondförvaltning. Assets under mana-gement under Länsförsäkringar’s own brand amounted to SEK 138.5 billion (124.5). Opera-ting profit amounted to SEK 96.2 M (77.2).
SEK M 31 Dec 2017 31 Dec 2016
Total assets 592 520
Fund volumes 158,706 138,192
Net flow 6,337 6,062
Net commission 245 208
Operating profit 96 77
come from the regional insurance companies for costs for the Bank Business Service unit. Net commission amounted to SEK 22.9 M (–60.0). Operating expenses increased 16% to SEK 1,008 M (865.3), primarily attributable to higher staff costs related the reorganisa-tion of personnel from Länsförsäkringar AB to the Bank Business Service unit. Loan los-ses amounted to SEK 4.6 M (21.6*), net, cor-responding to a loan loss level of 0.01% (0.05). * The comparative figure includes dissolution of reserves of SEK 20.2 M.
2017 compared with 2016
2017 compared with 2016
Year-end report 2017 8 Länsförsäkringar Bank

Income statement – Group
SEK M Note Q 4
2017 Q 3
2017 Change Q 4
2016 ChangeJan-Dec
2017Jan-Dec
2016 Change
Interest income 1,219.4 1,169.9 4% 1,054.1 16% 4,568.6 4,035.6 13%
Interest expense -149.3 -154.5 -3% -109.3 37% -572.4 -572.0
Net interest income 3 1,070.1 1,015.4 5% 944.8 13% 3,996.3 3,463.5 15%
Dividends received 42.2 0.1 0.0 42.3 0.2
Commission income 463.9 445.0 4% 416.7 11% 1,789.4 1,616.1 11%
Commission expense -691.8 -639.6 8% -603.9 15% -2,539.7 -2,278.0 11%
Net commission income 4 -227.8 -194.6 17% -187.3 22% -750.3 -661.9 13%
Net gains / losses from financial items 5 -6.3 -7.7 -18% -14.6 -57% -49.4 68.4
Other operating income 5.2 3.8 37% 16.0 -68% 18.6 33.7 -45%
Total operating income 883.3 817.0 8% 759.0 16% 3,257.5 2,903.8 12%
Staff costs -124.6 -128.2 -3% -114.1 9% -549.0 -469.8 17%
Other administration expenses -276.1 -224.5 23% -234.1 18% -960.4 -852.7 13%
Total administration expenses -400.7 -352.7 14% -348.2 15% -1,509.3 -1,322.5 14%
Depreciation / amortisation and impairment of property and equipment / intangible assets -27.3 -21.4 28% -17.7 54% -91.5 -76.3 20%
Total operating expenses -428.0 -374.1 14% -366.0 17% -1,600.9 -1,398.8 14%
Profit before loan losses 455.3 442.9 3% 393.0 16% 1,656.6 1,505.0 10%
Loan losses, net 6 -22.9 -13.8 66% -2.4 -57.7 -37.6 53%
Operating profit 432.4 429.1 1% 390.6 11% 1,598.9 1,467.3 9%
Tax -105.3 -94.4 12% -97.0 9% -361.9 -330.8 9%
Profit for the period 327.1 334.7 -2% 293.6 11% 1,237.0 1,136.6 9%
Statement of comprehensive income – Group
Mkr Q 4
2017 Q 3
2017 Change Q 4
2016 ChangeJan-Dec
2017Jan-Dec
2016 Change
Profit for the period 327.1 334.7 -2% 293.6 11% 1,237.0 1,136.6 9%
Other comprehensive income
Items that cannot be transferred to the income statement
Cash-flow hedges 14.4 -25.8 -71.4 -131.9 –98.6 34%
Change in fair value of available-for-sale financial assets 11.7 -6.1 16.0 -27% 56.5 130.2 -57%
Tax attributable to items that have been transfer-red or can be transferred to profit for the period -5.7 7.0 12.2 16.6 –6.9
Total 20.4 -24.9 -43.2 -58.8 24.7
Items that cannot be transferred to profit and loss
Chagne in defined-benefit pension plans 1.8 _ - 1.8 -
Tax attributable to items that cannot be reversed to profit and loss -0.4 _ - -0.4 -
Total 1.3 - - 1.3 -
Total other comprehensive income for the period, net after tax 21.7 -24.9 -43.2 -57.5 -
Comprehensive income for the period 348.8 309.8 13% 250.4 39% 1,179.5 1,161.3 2%
Year-end report 2017 7 Länsförsäkringar Bank

Balance sheet – Group
SEK M Note 31 Dec 2017 31 Dec 2016
Assets
Cash and balances with central banks 17.0 21.6
Treasury bills and other eligible bills 10,531.5 7,867.2
Loans to credit institutions 265.0 280.2
Loans to the public 7 261,444.2 226,705.0
Bonds and other interest-bearing securities 35,717.8 32,809.7
Shares and participations 38.3 25.4
Derivatives 8 5,125.5 6,216.7
Fair value changes of interest-rate-risk hedged items in the portfolio hedge 248.0 635.9
Intangible assets 969.3 488.3
Property and equipment 10.5 7.8
Deferred tax assets 30.0 2.7
Other assets 546.8 505.1
Prepaid expenses and accrued income 422.5 385.5
Total assets 315,366.3 275,951.1
Liabilities and equity
Due to credit institutions 3,995.9 3,872.8
Deposits and borrowing from the public 99,403.6 91,207.1
Debt securities in issue 188,406.7 155,999.5
Derivatives 8 1,166.4 1,894.6
Fair value changes of interest-rate-risk hedged items in the portfolio hedge 1,200.2 3,191.4
Deferred tax liabilities 508.0 421.6
Other liabilities 791.6 595.2
Accrued expenses and deferred income 2,959.1 2,978.8
Provisions 9.9 12.3
Subordinated liabilities 2,596.5 2,595.4
Total liabilities 301,037.9 262,768.8
Equity
Share capital 954.9 954.9
Other capital contributed 7,442.5 7,442.5
Reserves 26.5 83.9
Additional Tier 1 instruments 1,200.0 1,200.0
Retained earnings 3,467.5 2,364.5
Profit for the period 1,237.0 1,136.6
Total equity 14,328.4 13,182.3
Total liabilities and equity 315,366.3 275,951.1
Notes
Accounting policies 1
Segment reporting 2
Pledged assets, contingent liabilities and commitments 9
Fair value valuation techniques 10
Capital-adequacy analysis 11
Disclosures on related parties 12
8 Länsförsäkringar BankYear-end report 2017
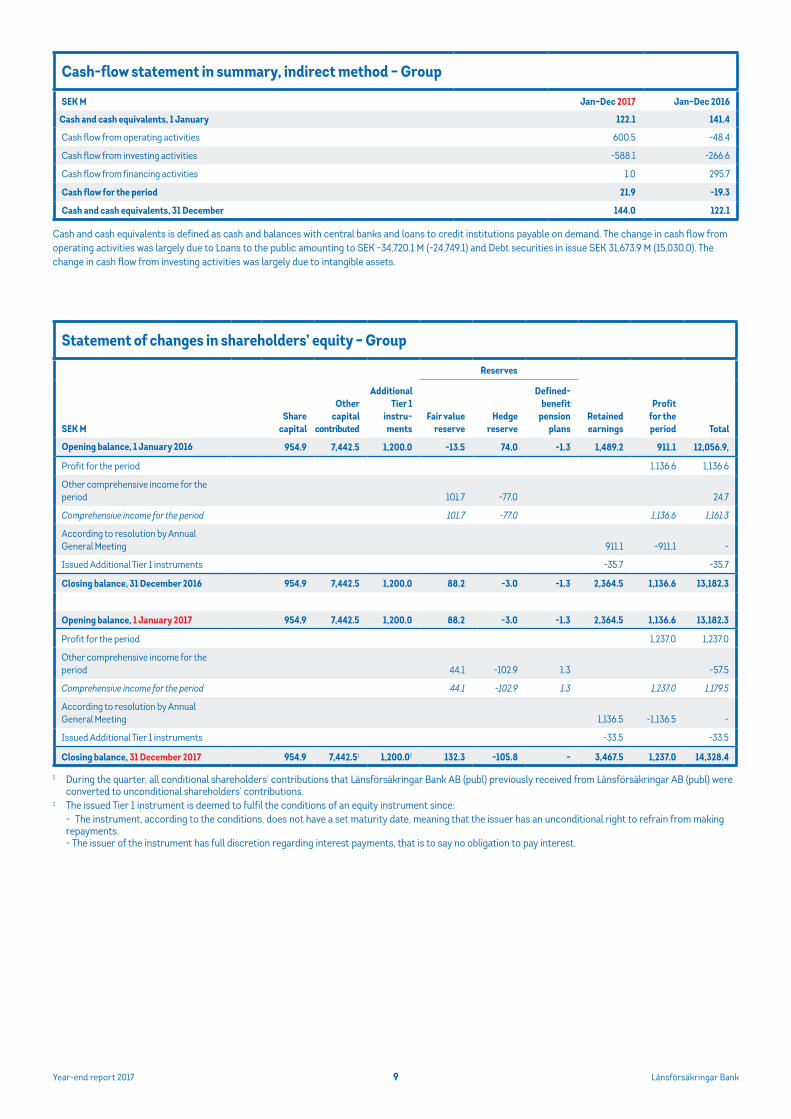
Cash and cash equivalents is defined as cash and balances with central banks and loans to credit institutions payable on demand. The change in cash flow from operating activities was largely due to Loans to the public amounting to SEK -34,720.1 M (-24,749.1) and Debt securities in issue SEK 31,673.9 M (15,030.0). The change in cash flow from investing activities was largely due to intangible assets.
1 During the quarter, all conditional shareholders’ contributions that Länsförsäkringar Bank AB (publ) previously received from Länsförsäkringar AB (publ) were converted to unconditional shareholders’ contributions.
2 The issued Tier 1 instrument is deemed to fulfil the conditions of an equity instrument since: - The instrument, according to the conditions, does not have a set maturity date, meaning that the issuer has an unconditional right to refrain from making repayments. - The issuer of the instrument has full discretion regarding interest payments, that is to say no obligation to pay interest.
Cash-flow statement in summary, indirect method – Group
SEK M Jan–Dec 2017 Jan–Dec 2016
Cash and cash equivalents, 1 January 122.1 141.4
Cash flow from operating activities 600.5 -48.4
Cash flow from investing activities -588.1 -266.6
Cash flow from financing activities 1.0 295.7
Cash flow for the period 21.9 -19.3
Cash and cash equivalents, 31 December 144.0 122.1
Statement of changes in shareholders’ equity – Group
Reserves
SEK MShare
capital
Other capital
contributed
Additional Tier 1
instru-ments
Fair value reserve
Hedge reserve
Defined- benefit
pension plans
Retained earnings
Profit for the period Total
Opening balance, 1 January 2016 954.9 7,442.5 1,200.0 -13.5 74.0 -1.3 1,489.2 911.1 12,056.9,
Profit for the period 1,136.6 1,136.6
Other comprehensive income for the period 101.7 -77.0 24.7
Comprehensive income for the period 101.7 -77.0 1,136.6 1,161.3
According to resolution by Annual General Meeting 911.1 -911.1 -
Issued Additional Tier 1 instruments -35.7 -35.7
Closing balance, 31 December 2016 954.9 7,442.5 1,200.0 88.2 -3.0 -1.3 2,364.5 1,136.6 13,182.3
Opening balance, 1 January 2017 954.9 7,442.5 1,200.0 88.2 -3.0 -1.3 2,364.5 1,136.6 13,182.3
Profit for the period 1,237.0 1,237.0
Other comprehensive income for the period 44.1 -102.9 1.3 -57.5
Comprehensive income for the period 44.1 -102.9 1.3 1,237.0 1,179.5
According to resolution by Annual General Meeting 1,136.5 -1,136.5 -
Issued Additional Tier 1 instruments -33.5 -33.5
Closing balance, 31 December 2017 954.9 7,442.51 1,200.02 132.3 -105.8 - 3,467.5 1,237.0 14,328.4
9 Länsförsäkringar BankYear-end report 2017

Amounts in SEK million if not otherwise stated.
Note 1 Accounting policies
This interim report complies with the requirements of IAS 34 Interim Financial Reporting. The consolidated financial statements were prepared in accordance with International Financial Reporting Standards (IFRS) issued by the International Accounting Standards Board (IASB) and the interpre-tations of these standards issued by the International Financial Reporting Interpretations Committee (IFRIC) as adopted by the EU. Furthermore, the Swedish Annual Accounts Act for Credit Institutions and Securities Com-panies (ÅRKL) (1995:1559) and the regulations and general guidelines of the Swedish Financial Supervisory Authority (FFFS 2008:25) were applied. The Group also applies the Swedish Financial Reporting Board’s recommendation RFR 1 Supplementary Accounting Rules for Groups and statements (UFR).
Changes to 2017 reporting The following changes and reclassifications have been made to the income statement and balance sheet from 1 January 2017:
1. The Group has decided to present financial instruments measured at fair value including accrued interest, which conforms with the classifications in the CRR regulations. The change affected comparative figures in the balance sheet as per 31 December 2016. The affected asset items are: Treasury bills and other eligible bills have increased by SEK 73 M, Bonds and other inte-rest-bearing securities have increased by SEK 388, Derivatives have increa-sed by SEK 662 M and Prepaid expenses and accrued income have declined by SEK 1,123 M. The affected liability items are: Derivatives have increased by SEK 251 M and Accrued expenses and deferred income have declined by SEK 251 M. Comparative figures and performance measures have been updated to the new classification. The change has not affected equity.
2. Income has been reclassified between the items Other operating income and Commission income. The change entails that income for services rendered that was previously classified as Other operating income has now been transferred to Commission income. Comparative figures including performance measures have been restated and the full-year effect amounts to SEK 94 M. The change has no effect on earnings. 3. Administration costs have been reclassified between Other administration expenses and Commission expense. Comparative figures including perfor-mance measures have been restated and the full-year effect amounts to SEK 169 M. The change has no effect on earnings.
NEW IFRS AND INTERPRETATIONS THAT HAVE NOT YET BEEN APPLIED IFRS 9 Financial instruments IFRS 9 Financial Instruments took effect on 1 January 2018 and largely replaces IAS 39. The standard contains new requirements for the classification and measurement of financial instruments, new hedge accounting rules and an expected loss impairment model. The Group’s project to implement the new rules has been completed and the outcome is as follows:
Classification and measurementFinancial assets are to be divided into three measurement categories under IFRS 9. The division into these three categories is based on the Group’s business model for the various holdings and the cash flow characteristics that the assets give rise to. The outcome for the Group is:
Financial assetFair value through
profit and loss Amortised cost
Fair value through other comprehensive
income
Cash and balances with central banks X
Treasury bills and other eligible bills X
Loans to credit institutions X
Loans to the public X
Bonds and other interest-bearing securities X
Shares and participations X
Derivatives X
Other financial assets X
The transition to IFRS 9 does not entail any material reclassification of financial assets in the Group and thus does not impact the carrying amounts of the assets.
The classification of financial liabilities has not been changed and financial liabilities continue to be measured at amortised cost.
Hedge accountingIn 2017, the Group further analysed the options for hedge accounting under IFRS 9 and decided to make use of the exceptions that entail that the rules in IAS 39 can continue to be applied for all hedging relationships.
Expected credit losses The impairment model under IFRS 9 encompasses financial assets measured at amortised cost and debt instruments measured at fair value through other comprehensive income, financial guarantees and loan commitments.
The expected loss impairment model is based on dividing the financial assets in three different stages. Stage 1 comprises assets for which the credit risk has not increased significantly since initial recognition. Stage 2 comprises assets for which the credit risk has increased significantly since initial recognition, but the asset is not credit-impaired. Stage 3 comprises credit-impaired assets. Estimating expected credit losses for stage 1 is to correspond to the 12-month expected credit losses (ECL). For stages 2 and 3, estimating expected credit losses is to correspond to the full lifetime expected credit losses. The approach selected to assess the significant increase in credit risk is to compare PD on the reporting date in question with PD from the initial reporting date. In addition, a credit risk is deemed to have increased significantly for assets that are more than 30 days past due.
Notes – Group
10 Länsförsäkringar BankYear-end report 2017

The calculations are primarily based on existing internal ratings-based models, but the reporting standard includes the new requirement that the calculations must also take into account prospective information. The provision for the expected credit losses is achieved by calculating the expected credit loss for the asset’s contractual cash flows. The present value of the expected credit loss is calculated for every date in each cash flow by multiplying the remaining exposure with the probability of default (PD) and the loss given default (LGD). For stage 1, the expected credit loss is calculated as the present value of the 12-month ECL, while the credit loss for stages 2 and 3 is calculated as the present value of the full lifetime expected credit losses. All calculations of the expected credit losses including estimates of exposure, PD and LGD take into account prospective information and are based on a weighting of at least three different possible macroeconomic scenarios. A number of statistical macro models have been developed to determine how each macroeconomic scenario will affect the expected future exposure, PD and LGD.
The effect of the transition from IAS 39 to IFR 9 is recognised as an adjustment of equity (after tax) in the opening balance for 2018. A calculation of the provision for expected credit losses under IFRS 9 was performed on 1 January 2018. The change in the provision entails that the Bank Group’s equity decreased by SEK 83.2 M. For the Parent Company, the change in the provision is that equity decreased by SEK 0.4 M.
The effect on own funds is marginal since the Group applies the IRB Approach to most of its loan portfolio. The Group has decided not to apply the capital adequacy rules that permit a phase-in of expected credit losses in own funds.
The Group does not intend to restate comparative figures for IFRS 9 in future financial statements.
IFRS 15 Revenue from Contracts with Customers IFRS 15 Revenue from Contracts with Customers replaced all previously issued standards and interpretations on income on 1 January 2018. The stan-dard contains a single model for recognising revenue from contracts with customers that is not encompassed by other standards (for example, IFRS 9). The effect of the regulations will not entail any adjustments of opening retained earnings, but the implementation does give rise to a reclassification in the Group’s net commission:
- The portion of the cost for securities commission that is to reduce the transaction price in accordance with IFRS 15 will be recognised as a de-duction under commission income. Based on amounts for 2017, the reclas-sification would have entailed the transfer of SEK 630 M from commission expense to commission income.
In addition, the standard stipulates more detailed disclosure requirements regarding revenue from contracts with customers.
The Group will apply the future-oriented transition method, which entails that the Group will recognise the effects of IFRS 15 as an adjustment to the opening balance of retained earnings. No such effects have arisen. The method also means that comparative figures for 2017 will not be restated.
IFRS 16 LeasesIFRS 16 Leases will replace IAS 17 Leases on 1 January 2019. Early adoption is permitted provided that IFRS 15 Revenue from Contracts with Customers is also applied. The Group will not apply the standard in advance. The largest changes entailed by the new standard is that a lessee is to recognise leases in its balance sheet. The Group currently has a project in progress to analyse the effects of the standard.
Alternative performance measuresThe European Securities and Markets Authority’s (ESMA) Guidelines on Alter-native Performance Measures came into effect on 3 July 2016. In accordan-ce with these guidelines, disclosures on financial performance measures that are not defined by IFRS have been provided. Alternative performance measures, such as return on equity, return on total capital, investment mar-gin, cost/income ratio before loan losses, reserve ratio in relation to loans and loan loss level are defined in the 2016 Annual Report.
In all other respects, the interim report has been prepared in accordance with the same accounting policies and calculation methods applied in the 2016 Annual Report.
Year-end report 2017 11 Länsförsäkringar Bank

Note 2 Segment reporting
Income statement, Jan-Dec 2017, SEK MBanking
operationsMortgage
institutionFinance
company Mutual fundsEliminations /
Adjustments Total
Net interest income 1,127.2 2,100.6 768.5 0.0 - 3,996.3
Dividends received 42.3 - - - - 42.3
Net commission 22.9 -1,141.3 124.0 244.8 -0.8 -750.3
Net gain / loss from financial items -6.4 -43.0 - - - -49.4
Intra-Group income 112.9 - 0.8 - -113.7 0.0
Other income 2.9 0.0 15.5 0.1 - 18.6
Total operating income 1,301.9 916.4 908.8 244.9 -114.4 3,257.5
Intra-Group expenses 7.5 -82.2 -10.4 -29.3 144.4 0.0
Other administration expenses -936.1 -21.0 -431.2 -119.0 -2.0 -1,509.3
Depreciation / amortisation and impairment -79.0 -0.2 -12.0 -0.4 - -91.5
Total operating expenses -1,007.7 -103.4 -453.6 -148.7 112.5 -1,600.9
Profit before loan losses 294.2 813.0 455.1 96.2 -2.0 1,656.6
Loan losses, net -4.6 0.0 -53.1 0.0 0.0 -57.7
Operating profit / loss 289.6 813.0 402.0 96.2 -2.0 1,598.9
Balance sheet 31 December 2017
Total assets 160,396.8 215,336.6 22,320.7 592.0 -83,279.9 315,366.3
Liabilities 149,754.4 204,869.4 19,758.0 172.0 -73,515.9 301,037.9
Equity 10,642.4 10,467.3 2,562.7 420.0 -9,764.0 14,328.4
Total liabilities and equity 160,396.8 215,336.6 22,320.7 592.0 -83,279.9 315,366.3
Income statement, Jan-Dec 2016, SEK M
Net interest income 1,123.8 1,646.9 692.8 0.0 0.0 3,463.5
Dividends received 0.2 0.0 0.0 0.0 0.0 0.2
Net commission -60.0 -935.2 125.5 207.8 0.0 -661.9
Net gain / loss from financial items 29.3 39.1 0.0 0.0 0.0 68.4
Intra-Group income 107.3 0.0 1.0 0.0 -108.4 0.0
Other income 16.2 0.2 16.9 0.5 0.0 33.7
Total operating income 1,216.7 751.0 836.2 208.3 -108.4 2,903.9
Intra-Group expenses 8.1 -77.5 -10.3 -28.6 108.4 0.0
Other administration expenses -808.4 -19.7 -392.3 -102.2 0.0 -1,322.6
Depreciation / amortisation and impairment -65.0 -0.2 -10.8 -0.4 0.0 -76.3
Total operating expenses -865.3 -97.4 -413.4 -131.1 108.4 -1,398.9
Profit / loss before loan losses 351.4 653.6 422.8 77.2 0.0 1,505.0
Loan losses, net -21.6 4.8 -20.8 0.0 0.0 -37.6
Operating profit / loss 329.8 658.4 402.0 77.2 0.0 1,467.3
Balance sheet 31 December 2016
Total assets 148,007.4 189,227.6 18,869.1 520.0 -80,673.1 275,951.1
Liabilities 137,586.6 181,239.9 16,742.0 174.5 -72,974.0 262,768.8
Equity 10,420.8 7,987.7 2,127.2 345.5 -7,699.2 13,182.3
Total liabilities and equity 148,007.4 189,227.6 18,869.1 520.0 -80,673.1 275,951.1
Income and assets are attributable in their entirety to Sweden. The segment distribution per legal entity reflects the internal reporting to the chief operating decision maker. The legal structure within Länsförsäkringar Bank Group is in line with the product offering to external customers. The portion of assets and liabilities that is not distributed per segment comprises intra-Group eliminations within the Bank Group.
12 Länsförsäkringar BankYear-end report 2017

1 Of which negative interest on Loans to credit institutions of SEK -15.5 M, Interest-bearing securities of SEK -57.9 M, Due to credit institutions of SEK 27.1 M and Deposits and borrowing from the public of SEK 2.8 M.
Note 3 Net interest income
SEK M Q 4
2017 Q 3
2017 Change Q 4
2016 ChangeJan-Dec
2017Jan-Dec
2016 Change
Interest income
Loans to credit institutions 0.1 -0.8 0.6 -83% -2.81 -3.7 -24%
Loans to the public 1,364.6 1,339.7 2% 1,252.5 9% 5,267.2 4,928.6 7%
Interest-bearing securities 53.6 52.6 2% 68.4 -22%, 224.01 330.7 -32%
Derivatives -199.0 -221.6 -10% -267.6 -26% -919.7 -1,220.2 -25%
Other interest income 0.0 - 0.2 -0.1 0.2
Total interest income 1,219.4 1,169.9 4% 1,054.1 16% 4,568.6 4,035.6 13%
Interest expense
Due to credit institutions 8.3 5.5 51% 6.4 30% 26.51 20.1 32%
Deposits and borrowing from the public -27.5 -29.7 -7% -40.5 -32% -130.41 -185.6 -30%
Debt securities in issue -502.6 -486.4 3% -488.7 3% -1,984.6 -2,012.7 -1%
Subordinated liabilities -14.1 -14.0 1% -13.9 1% -55.2 -71.5 -23%
Derivatives 442.9 437.4 1% 434.9 2% 1,791.3 1,780.2 1%
Other interest expense, including government deposit insurance
-56.2 -67.3 -16% -7.5 -220.0 -102.6
Total interest expense -149.3 -154.5 -3% -109.3 37% -572.4 -572.0
Total net interest income 1,070.1 1,015.4 5% 944.8 13% 3,996.3 3,463.5 15%
Interest income on impaired loans 1.1 1.5 -27% 1.2 -8% 10.7 14.7 -27%
Average interest rate on loans to the public during the period, including net leasing, % 2.1 2.2 -5% 2.2 -5% 2.2 2.3 -5%
Average interest rate on deposits from the public during the period, %
0.1 0.1 0.2 -50% 0.1 0.2 -50%
Note 4 Net commission income
SEK M Q 4
2017 Q 3
2017 Change Q 4
2016 ChangeJan-Dec
2017Jan-Dec
2016 Change
Commission income
Payment mediation 24.6 21.3 15% 21.9 12% 87.3 84.3 4%
Loans 60.5 58.8 3% 54.1 12% 232.1 211.1 10%
Deposits 2.7 2.6 4% 2.5 8% 11.3 11.0 3%
Securities 301.9 290.0 4% 290.7 4% 1,180.7 1,134.4 4%
Cards 58.6 56.8 3% 47.2 24% 213.2 173.6 23%
Remuneration to regional insurance companies 15.5 15.3 1% - - 64.1 -
Other commission 0.2 0.1 0.4 -50% 0.8 1.7 -53%
Total commission income 463.9 445.0 4% 416.7 11% 1,789.4 1,616.1 11%
Commission expense
Payment mediation -21.3 -35.6 -40% -27.9 -24% -125.2 -103.9 21%
Securities -170.0 -166.7 2% -169.1 1% -677.1 -626.2 8%
Cards -34.7 -24.7 40% -31.0 12% -117.7 -106.9 10%
Remuneration to regional insurance companies -438.7 -384.4 14% -339.3 29% -1,501.7 -1,261.5 19%
Management costs -24.3 -25.5 -5% -33.9 -28% -107.1 -169.0 -37%
Other commission -2.8 -2.6 8% -2.7 4% -10.9 -10.4 5%
Total commission expense -691.8 -639.6 8% -603.9 15% -2,539.7 -2,278.0 11%
Total net commission income -227.8 -194.6 17% -187.3 22% -750.3 -661.9 13%
13 Länsförsäkringar BankYear-end report 2017

The settlement model regarding the commitment that the regional insurance companies have for loan losses related to the business they have originated, entails that the regional insurance companies cover 80% of the provision requirement on the date when an impairment is identified. Off-setting takes place against, and can amount to a maximum of, accrued commission. Remuneration corresponding to 80% of the provision requirement is withheld on every occasion until the lending mediated by the regional insurance company has been regulated. On 31 December 2017 , the total credit reserve requirement amounted to SEK 355 M, of which the Bank Group’s recognised credit reserve accounted for SEK 267 M and the remainder of SEK 88 M was offset against the regional insurance companies’ withheld funds, according to the model described above.
Note 5 Net gains / losses from financial items
SEK M Q 4
2017 Q 3
2017 Change Q 4
2016 ChangeJan-Dec
2017Jan-Dec
2016 Change
Interest-bearing assets and liabilities and related derivatives -2.2 –16.7 -87% –23.2 -91% -70.5 23.6
Other financial assets and liabilities -12.6 –0.1 –0.2 -12.9 0.2
Interest compensation 8.4 9.2 -9% 8.8 -5% 34.0 44.6 -24%
Total net gains / losses from financial items -6.3 –7.7 -18% –14.6 -57% -49.4 68.4
Not 6 Kreditförluster och osäkra lånefordringar
Net loan losses, SEK M Q 4
2017 Q 3
2017 Change Q 4
2016 ChangeJan-Dec
2017Jan-Dec
2016 Change
Specific reserve for individually assessed loan receivables
Write-off confirmed loan losses during the year -42.4 -29.8 42% -47.7 -11% -131.0 -135.1 -3%
Reversed earlier impairment of loan losses recognised as confirmed losses 31.9 29.2 9% 47.0 -32% 118.4 133.3 -11%
Impairment of loan losses during the year -36.5 -39.1 -7% -65.1 -44% -147.5 -140.9 5%
Payment received for prior confirmed loan losses 21.4 20.4 5% 20.0 7% 90.3 66.8 35%
Reversed impairment of loan losses no longer required 2.3 2.0 15% 57.4 -96% 9.9 67.1 -85%
Net expense for the year for individually assessed loan receivables -23.3 -17.3 35% 11.7 -59.9 -8.8
Collective assessed homogenous groups of loan receivables with limited value and similar credit risk
Provision/reversal of impairment of loan losses 0.3 3.4 -91% -14.2 1.9 -29.1
Net expense for the year for collectively assessed receivables 0.3 3.4 -91% -14.2 1.9 -29.1
Net expence for the year for fulfillment of guarantees 0.1 0.1 0.1 0.3 0.3
Net expense of loan losses for the year -22.9 -13.8 66% -2.4 -57.7 -37.6 53%
All information pertains to receivables from the public
Reserve ratios
Total impaired loans reserve ratio, % 96.2 102.0 104.1 96.2 104.1
Impaired loans reserve ratio excluding collective impairments, % 58.3 61.4 59.5 58.3 59.5
31 December 2017 31 December 2016
Impaired loans, SEK M Gross
Individual impair-
ments
Collective impair-
ments Net Gross
Individual impair-
ments
Collective impair-
ments Net
Corporate sector 77.2 -67.3 -20.6 -10.7 60.9 -49.8 -18.8 -7.7
Retail sector 200.7 -94.8 -84.8 21.2 179.3 -93.1 -88.4 -2.2
of which private individuals 171.7 -102.3 -45.3 24.1 147.4 -85.2 -42.1 20.1
Total 277.9 -162.1 -105.4 10.5 240.2 -142.9 -107.2 -9.9
14 Länsförsäkringar BankYear-end report 2017

Länsförsäkringar enters into financial hedging agreements to hedge against the interest-rate risk and currency risk that the Group’s funding programmes give rise to. By using derivatives, the company can hedge both the fair value of the bonds issued due to changes in the market interest rate, and hedge cash flows attributa-ble to future flows in foreign currency. Hedging instruments primarily comprise interest and currency interest-rate swaps.
Contingent liabilities comprise contingent liabilities, which in turn comprise guarantees. Assumptions comprises loans/bank overdraft facilities and card loans approved but not disbursed.
Note 7 Loans to the public Loan receivables are geographically attributable in their entirety to Sweden.
SEK M 31 December 2017 31 December 2016
Public sector 2,014.1 1,136.9
Corporate sector 18,402.4 17,276.0
Retail sector 241,294.8 208,524.0
Other 0.3 18.2
Loan to the public before reserves 261,711.6 226,955.1
Reserves -267.5 -250.1
Loans to the public 261,444.2 226,705.0
Fixed-interest period
Remaining term of not more than 3 months 194,248.2 155,156.4
Remaining term of more than 3 months but not more than 1 year 21,624.7 18,017.6
Remaining term of more than 1 year but not more than 5 years 43,675.9 51,468.5
Remaining term of more than 5 years. 1,895.4 2,062.6
Loans to the public 261,444.2 226,705.0
Note 8 Derivatives
31 December 2017 31 December 2016
SEK M Nominal value Fair value Nominal value Fair value
Derivatives with positive values
Derivatives in hedge accounting
Interest-related 117,810.8 1,900.5 98,286.0 2,893.8
Currency-related 35,828.8 3,210.6 26,514.1 3,280.5
Other derivatives
Currency-related 401.8 14.4 303.9 42.4
Total derivatives with positive values 154,041.4 5,125.5 125,104.0 6,216.7
Derivatives with negative values
Derivatives in hedge accounting
Interest-related 102,307.0 805.0 97,590.0 1,469.4
Currency-related 4,733.5 361.4 4,935.9 417.9
Other derivatives
Currency-related - - 363.8 7.3
Total derivatives with negative values 107,040.5 1,166.4 102,889.7 1,894.6
Note 9 Pledged assets, contingent liabilities and commitments
SEK M 31 December 2017 31 December 2016
For own liabilities, pledged assets 203,273.4 173,186.9
Contingent liabilities 34.5 38.9
Commitments 21,979.4 19,365.8
15 Länsförsäkringar BankYear-end report 2017

The carrying amount of cash and balances with central banks, treasury bills and other eligible bills, loans to credit institutions, other assets, due to credit insti-tutions and other liabilities comprises a reasonable approximation of the fair value based on the cost of the assets and liabilities, since these assets and liabilities have short terms.
Gains and losses are recognised in profit and loss under “net gains from financial items.”
Note 10 Fair value valuation techniques
31 December 2017 31 December 2016
SEK M Book value Fair value Book value Fair value
Financial Assets
Cash and balances with central banks 17.0 17.0 21.6 21.6
Treasury bills and other eligible bills 10,531.5 10,531.5 7,867.2 7,867.2
Loans to credit institutions 265.0 265.0 280.2 280.2
Loans to the public 261,444.2 262,346.0 226,705.0 227,784.0
Bonds and other interest-bearing securities 35,717.8 35,717.8 32,809.7 32,809.7
Shares and participations 38.3 38.3 25.4 25.4
Derivatives 5,125.5 5,125.5 6,216.7 6,216.7
Other assets 253.5 253.5 207.3 207.3
Total 313,392.7 314,294.6 274,133.1 275,212.1
Financial Liabilities
Due to credit institutions 3,995.9 3,995.9 3,872.8 3,872.8
Deposits and borrowing from the public 99,403.6 101,169.1 91,207.1 91,644.4
Debt securities in issue 188,406.7 192,362.8 155,999.5 161,185.9
Derivatives 1,166.4 1,166.4 1,894.6 1,894.6
Other liabilities 179.3 179.3 119.7 119.7
Subordinated liabilities 2,596.5 2,681.5 2,595.4 2,674.8
Total 295,748.4 301,555.0 255,689.1 261,392.2
16 Länsförsäkringar BankYear-end report 2017

Shares and participations and other assets in Level 3 are initially measured at cost since the holdings cannot be reliably measured at fair value, and impaired if objective evidence exists to recognise an impairment loss. The assessment is based on the most recent Annual Report and forecast earnings. The fair value of Level 2 shares and participations that pertain to unquoted Series B shares with conversion rights to quoted Series A shares without restrictions is measured based on the price of the Series A share on the balance-sheet date. Derivatives in Level 2 essentially refer to swaps for which fair value has been calculated by discounting expected future cash flows. There were no significant transfers between Level 1 and Level 2 in 2017 or 2016. There were also no transfers from Level 3 in these years.
Note 10 Fair Value valuation techniques, continued
Financial assets and liabilities measured at fair value in the balance sheet are presented in the table based on the valuation techniques applied:
Level 1 refers to prices determined from prices listed in an active market Level 2 refers to prices determined by calculated prices of observable market listings Level 3 refers to prices based on own assumptions and judgements
Financial instruments measured at fair value in the balance sheet
31 December 2017, SEK M Level 1 Level 2 Level 3 Total
Assets
Treasury bills and other eligible bills 10,531.5 10,531.5
Bonds and other interest-bearing securities 35,717.8 35,717.8
Shares and participations 0.2 7.9 30.1 38.3
Derivatives 5,125.5 5,125.5
Other assets
Liabilities
Derivatives 1,166.4 1,166.4
31 December 2016, SEK M
Assets
Treasury bills and other eligible bills 7,867.2 7,867.2
Bonds and other interest-bearing securities 32,809.7 32,809.7
Shares and participations 0.2 6.0 19.2 25.4
Derivatives 6,216.7 6,216.7
Other assets 20.0 20.0
Liabilities
Derivatives 1,894.6 1,894.6
Change in level 3, SEK M Other assetsShares and
participations
Opening balance 1 January 2017 20.0 19.2
Acquisition - 0.9
Conversion to shares -20.0 20.0
Impairment 1 - -10.0
Closing balance, 31 December 2017 - 30.1
Opening balance 1 January 2016 – 15.5
Acquisition 20.01 -
Shareholder contributions - 3.7
Closing balance 31 December 2016 20.0 19.2
1 Refers to investment in Bohemian Wrappsody AB. Due to uncertainty regarding qualitication as a going concern, an impairment of SEK 10 M was recognised in the quarter.
17 Länsförsäkringar BankYear-end report 2017

When calculating the fair value of deposits and funding from the public and loans to the public, anticipated cash flows have been discounted using a discount rate set at the current deposit and lending rates applied (including discounts). Fair value for debt securities in issue and subordinated liabilities is determined based on quoted prices. Parts of debt securities in issue that are considered to be illiquid are adjusted based on expected current issue prices. Commercial papers do not have external market prices and the fair value is determined based on the yield curve of each currency.
There were no significant transfers between Level 1 and Level 2 in 2017 or 2016. There were also no transfers from Level 3 in these years.
For further information about how the fair value was determined for financial instruments measured at fair value, and about valuation techniques and inputs, see also the note on Accounting policies in the most recently pubished annual report.
Note 10 Fair Value valuation techniques, continued
Financial instruments measured at amortised cost in the balance sheet
31 December 2017, SEK M Level 1 Level 2 Level 3 Total
Assets
Loans to the public 262,346.0 262,346.0
Liabilities
Deposits and borrowing from the public 101,169.1 101,169.1
Debt securities in issue 192,362.8 192,362.8
Subordinated liabilities 2,681.5 2,681.5
31 December 2016
Assets
Loans to the public 227,784.0 227,784.0
Liabilities
Deposits and borrowing from the public 91,644.4 91,644.4
Debt securities in issue 161,185.9 161,185.9
Subordinated liabilities 2,674.8 2,674.8
18 Länsförsäkringar BankYear-end report 2017

Not 11 Capital-adequacy
Presentation of own funds in accordance with Article 5 of the European Commission Implementing Regulation (EU) No 1423/2013. Rows that are empty in the presentation in accordance with the Regulation have been excluded in the table below to provide a better overview. There are no items encompassed by the provisions applied before Regulation (EU) No 575/2013 or any prescribed residual amounts under the Regulation.
SEK M
Consolidated situation
31 Dec 2017
Consolidated situation
31 Dec 2016Bank Group31 Dec 2017
Bank Group31 Dec 2016
Common Equity Tier 1 capital: instruments and reserves
Capital instruments and associated share premium reserves 11,314.6 11,314.6 1,238.6 1,231.0
Of which: share capital 1,042.5 1,042.5 954.9 954.9
Non-distributed earnings (Retained earnings) 8,781.4 7,246.3 10,626.4 9,531.0
Accumulated Other comprehensive income 474.8 448.3 26.5 83.8
Interim profits, net, after deductions for foreseeable charge and dividends that have been verified by persons independent of the institution 2,550.2 1,570.3 1,235.1 1,134.6
Common Equity Tier 1 capital before legislative adjustments 23,121.0 20,579.5 13,126.5 11,980.4
Common Equity Tier 1 capital: legislative adjustments
Additional value adjustments -52.1 -48.3 -51.4 -47.4
Intangible assets (net after reduction for associated tax liabilities) -1,739.3 -1,319.1 -969.3 -488.3
Fair value reserves related to gains or losses on cash-flow hedges 105.9 16.1 105.9 3.0
Negative amounts resulting from the calculation of expected loss amounts -444.3 -393.1 -444.3 -393.1
Direct, indirect and synthetic holdings by the institution of Common Equity Tier 1 instruments of financial sector entities where the institution does not have a significant investment in those entities -5,999.3 -6,214.9 - -
Amounts exceeding threshold of 15% - -3.2 - -
Of which: direct, indirect and synthetic holdings by the institution of Common Equity Tier 1 instruments of financial sector entities where the institution does not have a significant investment in those entities - -1.7 - -
Of which: deffered tax assets arise from temporary differences - -1.5 - -
Total legislative adjustments of Common Equity Tier 1 capital Common Equity Tier 1 capital -8,129.1 -7,962.6 -1,359.1 -925.9
Common equity Tier 1 capital 14,991.9 12,616.9 11,767.4 11,054.5
Additional Tier 1 instruments: instruments
Capital instruments and associated share premium reserves - 1,200.0 1,200.0 1,200.0
Of which: classified as wquity within the meaning of the applicable accounting framwork - 1,200.0 1,200.0 1,200.0
Qualifying Tier 1 instruments included in consolidated Tier 1 capital issued by subsidiaries and held by a third party 944.3 - – –
Additional Tier 1 instruments 944.3 1,200.0 1,200.0 1,200.0
Tier 1 capital (Tier 1 capital = Common Equity Tier 1 capital + Additional Tier 1 instruments) 15,936.2 13,816.9 12,967.4 12,254.5
Tier 2 capital: instruments and provisions
Capital instruments and associated share premium reserves - 2,591.7 2,591.7 2,591.7
Qualifying own funds instruments included in consolidated Tier 2 capital issued by subsidiaries and held by a third party 2,163.3 - – –
Tier 2 capital 2,163.3 2,591.7 2,591.7 2,591.7
Total capital (total capital = Tier 1 capital + Tier 2 capital) 18,099.5 16,408.6 15,559.1 14,846.2
Total risk-weighted assets 64,379.2 59,512.8 48,432.2 44,498.3
Capital ratios and buffers
Common Equity Tier 1 capital (as a percentage of the total risk-weighted exposure amount) 23.3% 21.2% 24.3% 24.8%
Tier 1 capital (as a percentage of the total risk-weighted exposure amount) 24.8% 23.2% 26.8% 27.5%
Total capital (as a percentage of the total risk-weighted exposure amount) 28.1% 27.6% 32.1% 33.4%
Institution-specific buffer requirements 9.0% 8.5% 9.0% 8.5%
Of which: capital conservation buffer requirement 2.5% 2.5% 2.5% 2.5%
Of which: countercyclical capital buffer requirement 2.0% 1.5% 2.0% 1.5%
Of which: systemic risk buffer requirement - - - -
Of which: buffer for globally systemically important institution or for another systemically important institution - - - -
Common Equity Tier 1 capital available for use as a buffer (as a percentage of the risk-weighted exposure amount) 18.8% 16.7% 19.8% 20.3%
Capital requirement according to Basel I floor *) 12,880.4 11,253.8 12,511.5 10,911.2
Own funds adjusted according to Basel I floor 18,543.8 16,801.7 16,003.4 15,239.4
Surplus capital according to Basel I floor 5,663.4 5,547.9 3,491.9 4,328.2
19 Länsförsäkringar BankYear-end report 2017

Note 12 Disclosures on related parties
Significant agreements for the Bank Group are primarily outsourcing agreements with the 23 regional insurance companies and outsourcing ag-reements with Länsförsäkringar AB regarding development, service, finance and IT. The Group’s remuneration to the regional insurance companies in accordance with prevailing outsourcing agreements is presented in note Commission expense. Normal business transactions took place between Group companies as part of the outsourced operations.
Note 11 Capital-adequacy, continued
Consolidated situation
31 Dec 2017
Consolidated situation
31 Dec 2016Bank Group 31 Dec 2017
Bank Group 31 Dec 2016
SEK M
Risk exposure
amount
Capital require-
ment
Risk exposure
amount
Capital require-
ment
Risk exposure
amount
Capital require-
ment
Risk exposure
amount
Capital require-
ment
Credit risk according to Standardised Approach
Exposures to institutions 1,293.5 103.5 1,396.2 111.7 1,242.7 99.4 1,340.9 107.3
Exposures to corporates 1,723.9 137.9 1,697.1 135.8 1,695.8 135.7 1,697.1 135.8
Retail exposures 1,730.7 138.5 1,527.4 122.2 1,730.7 138.5 1,527.4 122.2
Exposures in default 56.2 4.5 64.0 5.1 56.2 4.5 64.0 5.1
Covered bonds 15.0 1.2 30.0 2.4 15.0 1.2 30.0 2.4
Exposures to CIU 2,989.4 239.2 2,779.3 222.3 2,917.3 233.4 2,695.2 215.6
Exposures to equity 5,296.0 423.7 4,748.6 379.9 40.6 3.2 38.0 3.0
Other items 4,538.0 363.0 3,978.4 318.3 1,002.7 80.2 628.8 50.3
Total capital requirement and risk exposure amount 17,642.7 1,411.4 16,220.9 1 297.7 8,701.0 696.1 8,021.4 641.7
Credit risk according to IRB Approach
Retail exposures
Secured by real estate SME 2,217.4 177.4 2,226.9 178.2 2,217.4 177.4 2,226.9 178.2
Secured by real estate non-SME 13,118.6 1,049.5 11,453.0 916.2 13,118.6 1,049.5 11,453.0 916.2
Other SME 4,375.0 350.0 4,008.5 320.7 4,375.0 350.0 4,008.5 320.7
Other non-SME 7,087.4 567.0 6,422.1 513.8 7,087.4 567.0 6,422.1 513.8
Total retail exposures 26,798.4 2,143.9 24,110.4 1 928.8 26,798.4 2,143.9 24,110.4 1,928.8
Exposures to corporates 7,349.7 588.0 7,038.7 563.1 7,349.7 588.0 7,038.7 563.1
Total capital requirement and risk exposure amount 34,148.1 2,731.8 31,149.1 2 491.9 34,148.1 2,731.8 31,149.1 2,491.9
Operational risks
Standardised Approach 11,346.2 907.7 10,717.4 857.4 4,340.9 347.3 3,902.5 312.2
Total capital requirement for operational risk 11,346.2 907.7 10,717.4 857.4 4,340.9 347.3 3,902.5 312.2
Total capital requirement for credit valuation adjustments 1,242.2 99.4 1,425.3 114.0 1,242.2 99.4 1,425.3 114.0
Total capital requirement and risk exposure amount 64,379.2 5,150.3 59,512.8 4 761.0 48,432.2 3,874.6 44,498.3 3,559.9
20 Länsförsäkringar BankYear-end report 2017

Income statement – Parent Company
SEK M Q 4
2017 Q 3
2017 Change Q 4
2016 ChangeJan-Dec
2017Jan-Dec
2016 Change
Interest income 380.6 372.1 2% 367.4 4% 1,463.9 1,434.1 2%
Interest expense -78.1 -98.3 -21% -60.2 30% -336.7 -310.3 9%
Net interest income 302.4 273.7 10% 307.2 -2% 1,127.2 1,123.8
Dividends received 42.2 0.1 0.0 42.3 0.2
Commission income 131.4 121.1 9% 97.4 35% 490.8 378.1 30%
Commission expense -149.6 -103.5 45% -113.3 32% -467.8 -438.1 7%
Net commission income -18.2 17.6 -15.9 14% 22.9 -60.0
Net gain / loss from financial items -18.1 3.6 2.4 -6.4 29.3
Other operating income 29.9 27.8 8% 38.5 -22% 115.8 123.5 -6%
Total operating income 338.3 322.8 5% 332.2 2% 1,301.9 1,216.7 7%
Staff costs -54.5 -64.6 -16% -45.4 20% -267.7 -185.7 44%
Other administration expenses -174.5 -159.2 10% -161.9 8% -661.0 -614.6 8%
Total administration expenses -229.0 -223.8 2% -207.3 10% -928.6 -800.3 16%
Depreciation / amortisation and impairment of property and equipment / intangible assets -24.3 -17.6 38% -14.7 65% -79.0 -65.0 22%
Total operating expenses -253.2 -241.4 5% -222.0 14% -1,007.7 -865.3 16%
Profit / loss before loan losses 85.0 81.4 4% 110.2 -23% 294.2 351.4 -16%
Loan losses net -7.5 3.7 4.7 -4.6 -21.6 -79%
Operating profit / loss 77.5 85.1 -9% 114.9 -33% 289.6 329.8 -12%
Allocation fund -90.0 - -100.0 -10% -90.0 -97.1 -7%
Tax -2.8 -18.7 -85% -2.8 -49.4 -48.0 3%
Profit / loss for the period -15.2 66.4 12.1 150.2 184.7 -19%
Statement of comprehensive income – Parent Company
SEK M Q 4
2017 Q 3
2017 Change Q 4
2016 ChangeJan-Dec
2017Jan-Dec
2016 Change
Profit for the period -15.2 66.4 12.1 150.2 184.7 -19%
Other comprehensive income
Items that are reclassified or may subsequently be reclassified to the income statement
Cash-flow hedges 5.0 -3.6 –0.8 -5.0 2.1
Change in fair value from available-for-sale financial assets 14.1 0.5 15.8 -11% 49.5 113.0 -56%
Tax attributable to items that are transferred or can be transferred as income for the period -4.2 0.7 –3.3 27% -9.8 –25.3 -61%
Other comprehensive income for the period, net after tax 14.9 -2.4 11.7 27% 34.7 89.8 -61%
Total comprehensive income for the period -0.3 64.0 23.8 184.9 274.5 -7%
21 Länsförsäkringar BankYear-end report 2017

Balance sheet – Parent Company
SEK M 31 Dec 2017 31 Dec 2016
Tillgångar
Cash and balances with central banks 17.0 21.6
Treasury bills and other eligible bills 10,531.5 7,867.2
Loans to credit institutions 67,005.7 64,183.5
Loans to the public 42,203.2 39,483.6
Bons and other interest-bearing securities 25,880.0 23,495.8
Shares and participations 38.3 25.4
Shares and participations within the Group 9,764.0 7,699.0
Derivatives 3,639.1 4,268.6
Fair value changes of interest-rate-risk hedged items in the portfolio hedge 40.5 99.5
Intangible assets 873.2 451.9
Property and equipment 2.8 2.5
Deffered tax assets 2.4 2.0
Other assets 278.0 280.9
Prepaid expenses and accrued income 121.4 126.0
Total assets 160,396.8 148,007.4
Liabilities, provisions and equity
Due to credit institutions 7,031.4 8,682.1
Deposits and borrowing from the public 99,808.4 91,505.5
Debt securities in issue 35,594.8 29,111.6
Derivatives 3,677.4 4,552.2
Fair value changes of interest-rate-risk hedged items in the portfolio hedge 65.5 164.2
Other liabilities 420.2 366.5
Accrued expenses and deferred income 500.1 566.3
Provisions 4.7 7.0
Subordinated liabilities 2,596.5 2,595.4
Total liabilities and provisions 149,699.0 137,551.0
Untaxed reserves 252.0 162.0
Equity
Share capital 954.9 954.9
Development Expenditures Fund 18.4 18.4
Statutory reserve 730.9 239.9
Additional Tier 1 instruments 1,200.0 1,200.0
Fair value reserves 95.6 60.9
Retained earnings 7,295.9 7,635.8
Profit for the period 150.2 184.7
Total equity 10,445.9 10,294.5
Total liabilities, provisions and equity 160,396.8 148,007.4
Notes
Accounting policies 1
Capital-adequacy 2
Loan losses and impaired loans 3
Disclosures on related parties 4
Pledged assets, contingent liabilities and commitments 5
22 Länsförsäkringar BankYear-end report 2017

Cash and cash equivalents are defined as cash and balances at central banks and loans due to credit institutions payable on demand.The change in cash flow from operating activities was largely due to Deposits and borrowing from the public amounting to SEK 8,269.4 M (7,284.5), Debt securities in issue to SEK 6,420.3 M (-485.4) and Loans to credit institutions to SEK -2,796.2 M (-8,066.2). The change in cash flow from investing activities included a paid shareholders’ contribution of SEK -2,065.0 M (-700.0).
1 During the quarter, all conditional shareholders’ contributions that Länsförsäkringar Bank AB (publ) previously received from Länsförsäkringar AB (publ) were converted to unconditional shareholders’ contributions.
2 The issued Tier 1 instrument is deemed to fulfil the conditions of an equity instrument since:- The instrument, according to the conditions, does not have a set maturity date, meaning that the issuer has an unconditional right to refrain from making repayments.- The issuer of the instrument has full discretion regarding interest payments, that is to say no obligation to pay interest.
Cash-flow statement in summary, indirect method – Parent Company
SEK M Jan–Dec 2017 Jan–Dec 2016
Cash and cash equivalents, 1 January 110.5 124.1
Cash flow from operating activities 2,598.8 638.8
Cash flow from investing activities -2,578.5 -948.1
Cash flow from financing activities 1.0 295.7
Cash flow for the period 21.3 -13.6
Cash and cash equivalents, 30 September 131.8 110.5
Statement of changes in shareholders’ equity – Parent Company
Restricted equity Non-restricted equity
SEK M Fair value reserve
Share capital
Develop-ment
Expenditu-res Fund
Statutory Reserve
Additional Tier 1
instru-ments
Fair valuereserve
Hedge reserve
Retained earnings
Profit for the period Total
Opening balance, 1 January 2016 954.9 - 18.4 1,200.0 -23.4 -5.6 7,775.5 135.9 10,055.7
Profit for the period 184.7 184.7
Other comprehensive income for the period 88.2 1.6 89.8
Comprehensive income for the period 88.2 1.6 184.7 274.5
According to resolution by Annual General Meeting 135.9 -135.9 -
Issued additional Tier 1 instruments -35.7 -35.7
Capitalised proprietary development expenditures 239.9 -239.9 -
Closing balance, 31 December 2016 954.9 239.9 18.4 1,200.0 64.8 -3.9 7,635.8 184.7 10,294.5
Opening balance, 1 January 2017 954.9 239.9 18.4 1,200.0 64.8 -3.9 7,635.8 184.7 10,294.5
Profit for the period 150.2 150.2
Other comprehensive income for the period 38.6 -3.9 34.7
Comprehensive income for the period 38.6 -3.9 150.2 184.9
According to resolution by Annual General Meeting 184.7 -184.7 -
Issued additional Tier 1 instruments -33.5 -33.5
Capitalised proprietary development expenditures 491.1 -491.1 -
Closing balance, 31 December 2017 954.9 730.9 18.4 1,200.02 103.4 -7.8 7,295.91 150.2 10,445.9
23 Länsförsäkringar BankYear-end report 2017

Year-end report 2017
Amounts in SEK million if not otherwise stated.
Notes – Parent Company
Note 1 Accounting policies
Länsförsäkringar Bank AB prepared its report in accordance with the Swedish Annual Accounts Act for Credit Institutions and Securities Compa-nies (ÅRKL), and the Swedish Financial Supervisory Authority’s regulations and general guidelines regarding annual reports in insurance companies (FFFS 2008:25). The company also applies the Swedish Financial Reporting Board’s recommendation RFR 2 Accounting for Legal Entities and statements issued pertaining to listed companies.
The impact on capital adequacy due to new or revised IFRS that have not yet been applied and changes that have affected the financial reports during 2017 are described in note 1 for the Group.
In all other respects, the interim report has been prepared in accordance with the same accounting policies and calculation methods applied in the 2016 Annual Report.
24 Länsförsäkringar Bank

Not 2 Capital-adequacy
Presentation of own funds in accordance with Article 5 of the European Commission Implementing Regulation (EU) No 1423/2013. There are no items encompassed by the provisions applied before Regulation (EU) No 575/2013 or any prescribed residual amounts under the Regulation.
SEK M 31 Dec 2017 31 Dec 2016
Common Equity Tier 1 capital: instruments and reserves
Capital instruments and associated share premium reserves 1,900.7 1,339.5
Of which: share capital 954.9 954.9
Non-distributed earnings (Retained earnings) 7,295.9 7,635.8
Accumulated Other comprehensive income 95.6 60.9
Interim profits, net, after deductions for foreseeable charge and dividends that have been verified by persons independent of the institution 148.3 182.8
Common Equity Tier 1 capital before legislative adjustments 9,440.5 9,218.9
Common Equity Tier 1 capital: legislative adjustments
Additional value adjustments -42.7 -39.0
Intangible assets (net after reduction for associated tax liabilities) -873.2 -451.9
Fair value reserves related to gains or losses on cash-flow hedges 7.8 3.9
Negative amounts resulting from the calculation of expected loss amounts -85.9 -85.4
Total legislative adjustments of Common Equity Tier 1 capital -994.0 -572.4
Common Equity Tier 1 capital 8,446.5 8,646.5
Additional Tier 1 instruments: instruments
Capital instruments and associated share premium reserves 1,200.0 1,200.0
Of which: classified as equity within the meaning of the applicable accounting framework 1,200.0 1,200.0
Additional Tier 1 instruments 1,200.0 1,200.0
Tier 1 capital (Tier 1 capital = Common Equity Tier 1 capital + Additional Tier 1 instruments) 9,646.5 9,846.5
Tier 2 capital: instruments and provisions
Capital instruments and associated share premium reserves 2,591.7 2,591.7
Adjustment due to credit risk 13.5 27.9
Tier 2 capital 2,605.2 2,619.6
Total capital (total capital = Tier 1 capital + Tier 2 capital) 12,251.7 12,466.2
Total risk-weighted assets 26,173.8 24,179.9
Capital ratios and buffers
Common Equity Tier 1 capital (as a percentage of the total risk-weighted exposure amount) 32.3% 35.8%
Tier 1 capital (as a percentage of the total risk-weighted exposure amount) 36.9% 40.7%
Total capital (as a percentage of the total risk-weighted exposure amount) 46.8% 51.6%
Institution-specific buffer requirements 9.0% 8.5%
Of which: capital conservation buffer requirement 2.5% 2.5%
Of which: countercyclical capital buffer requirement 2.0% 1.5%
Of which: systemic risk buffer requirement - -
Of which: buffer for globally systemically important institution or for another systemically important institution - -
Common Equity Tier 1 capital available for use as a buffer (as a percentage of the risk-weighted exposure amount) 27.8% 31.3%
Capital requirement according to Basel I floor *) 3,390.9 3,155.5
Own funds adjusted according to Basel I floor 12,324.1 12,523.7
Surplus capital according to Basel I floor 8,933.2 9,368.2
From 1 January 2018, the capital requirement under the Basel I floor based Article 500(1) of the Regulation No 575/2013/EU on prudential requirements ceases to apply.
25 Länsförsäkringar BankYear-end report 2017

Note 3 Loan losses and impaired loans
The settlement model regarding the commitment that the regional insurance companies have for loan losses related to the business they have originated, entails that the regional insurance companies cover 80% of the provision requirement on the date when an impairment is identified. Off-setting takes place against, and can amount to a maximum of, accrued commission. Remu-neration corresponding to 80% of the provision requirement is withheld on every occasion until the lending mediated by the regional insurance company has been regulated. On 31 December 2017, the total credit reserve require-ment amounted to SEK 126 M of which the Bank Group’s recognised credit reserve accounted for SEK 58 M and the remainder of SEK 69 M was offset against the regional insurance companies’ withheld funds, according to the model described above.
Note 4 Disclosures on related parties
Significant agreements for Länsförsäkringar Bank AB are primarily outsour-cing agreements with the 23 regional insurance companies and outsourcing agreements with Länsförsäkringar AB regarding development, service, finance and IT. Normal business transactions took place between Group companies as part of the outsourced operations.
Contingent liabilities comprise contingent liabilities, which in turn comprise guarantees. Assumptions comprises loans/bank overdraft facilities and card loans approved but not disbursed.
Note 2 Capital-adequacy, continued
31 Dec 2017 31 Dec 2016
SEK M
Risk exposure
amountCapital
requirement
Risk exposure
amountCapital
requirement
Credit risk according to Standardised Approach
Exposures to institutions 799.7 64.0 822.3 65.8
High risk items 15.0 1.2 30.0 2.4
Covered bonds 1,933.6 154.7 1,763.5 141.1
Equity exposures 10,605.8 848.5 9,003.8 720.3
Other items 465.5 37.2 392.1 31.4
Total capital requirement and risk exposure amount 13,819.6 1,105.6 12,011.8 960.9
Credit risk according to IRB Approach
Retail exposures
Secured by real estate SME 1,786.3 142.9 1,803.7 144.3
Secured by real estate non-SME 1,381.3 110.5 1,394.9 111.6
Other SME 500.7 40.1 536.8 42.9
Other non-SME 2,119.4 169.6 2,354.5 188.4
Total retail exposures 5,787.7 463.0 6,089.9 487.2
Exposures to corporates 4,035.0 322.8 3,689.9 295.1
Total capital requirement and risk exposure amount 9,822.7 785.8 9,778.9 782.3
Operational risks
Standardised Approach 1,798.1 143.8 1,631.1 130.5
Total capital requirement for operational risk 1,798.1 143.8 1,631.1 130.5
Total capital requirement for credit valuation adjustments 733.4 58.7 758.1 60.6
Total capital requirement and risk exposure amount 26,173.8 2,093.9 24,179.9 1,934.4
Note 5 Pledged assets, contingent liabilities and commitments
SEK M 31 Dec 2017 31 Dec 2016
For own liabilities, pledged assets 5,549.0 5,049.8
Contingent liabilities 34.5 38.9
Commitments 35,693.0 34,586.5
26 Länsförsäkringar BankYear-end report 2017

This interim report is a translation of the Swedish interim report that has been reviewed by the company´s auditors.
The Board of Directors and President affirm that this interim report provides a true and fair view of the company’s and the Group’s operations, financial position and earnings and describes the significant risks and uncertainties to which the company and the com-panies included in the Group are exposed.
Stockholm, 9 February 2018
Anders Borgcrantz President
27 Länsförsäkringar BankYear-end report 2017

Review report
To the Board of Directors of Länsförsäkringar Bank AB (publ)Corp. id. 516401-9878
IntroductionI have reviewed the summary interim financial information (interim report) of Länsförsäkringar Bank AB (publ) as per 31 December, 2017 and the twelve-month period then ended. The Board of Directors and the Managing Director are responsible for the preparation and presentation of this interim report in accordance with IAS 34 and the Annual Accounts Act for Credit Institutions and Securities Com-panies. My responsibility is to express a conclusion on this interim report based on my review.
Scope of reviewI conducted my review in accordance with International Standard on Review Engagements ISRE 2410 Review of Interim Financial Informa-tion Performed by the Independent Auditor of the Entity. A review of interim financial information consists of making inquiries, primarily of persons responsible for financial and accounting matters, and applying analytical and other review procedures. A review is substantially less in scope than an audit conducted in accordance with International Standards on Auditing and other generally accepted auditing practi-ces and consequently does not enable me to obtain assurance that I would become aware of all significant matters that might be identi-fied in an audit. Accordingly, I do not express an audit opinion.
ConclusionBased on my review, nothing has come to my attention that causes me to believe that the interim report is not prepared, in all material respects, for the Group in accordance with IAS 34 and the Annual Accounts Act for Credit Institutions and Securities Companies, and for the Parent Company in accordance with the Annual Accounts Act for Credit Institutions and Securities Companies.
Stockholm 9 February 2018
Dan BeitnerAuthorized Public Accountant
28 Länsförsäkringar BankYear-end report 2017

LF 04512 utg 59 Sitrus 207382 2017-11
FOR FURTHER INFORMATION, PLEASE CONTACT:
Anders Borgcrantz, President, Länsförsäkringar Bank [email protected], +46 (0)8-588 412 51, +46 (0)73-964 12 51
Martin Rydin, CFO, Länsförsäkringar Bank AB,[email protected], +46 (0)8-588 412 79, +46 (0)73-964 28 23
Stefan Karkamanis, Investor Relations, Länsförsäkringar Bank [email protected], +46 (0)8-588 402 90, +46 (0)72-310 00 80
Länsförsäkringar Bank AB (publ),Corporate Registration Number 516401-9878Street address: Tegeluddsvägen 11–13Postal address: SE-106 50 StockholmTelephone: +46 (0)8-588 400 00
This report contains such information that Länsförsäkringar Bank AB (publ) must publish in accordance with the Securities Market Act and EU Market Abuse Regulation. The information was submitted for publication on 9 February 2018 at 12:00 a.m. Swedish time.
Financial calendar
Interim report January–March Länsförsäkringar Bank 25 April 2018
Interim report January–March Länsförsäkringar Hypotek 25 April 2018
lansforsakringar.se


![Index [mb.cision.com]mb.cision.com/Main/492/9762879/372094.pdf · The production of our products shall take place under ... the Bangladesh Accord on Fire and Building Safety. By](https://img.pdfslide.us/doc/110x75/5b90613809d3f2b86e8bdece/index-mb-mb-the-production-of-our-products-shall-take-place-under-the.jpg)