Embed Size (px)
Citation preview

Lada Adamic, HP Labs, Palo Alto, CA

Talk outline
Information flow through blogs
Information flow through email
Search through email networks
Search within the enterprise
Search in an online community

Implicit Structure and Dynamics of BlogSpaceEytan Adar, Li Zhang, Lada Adamic, & Rajan Lukose
• Blog use:– Record real-world and virtual experiences– Note and discuss things “seen” on the net
• Blog structure: blog-to-blog linking
• Use + Structure– Great to track “memes” (catchy ideas)

Approaches and uses of blog analysis
• Patterns of information flow– How does the popularity of a topic evolve over time?– Who is getting information from whom?
• Ranking algorithms that take advantage of transmission patterns

Pop
ula
rity
Time
Slashdot Effect
BoingBoing Effect
Tracking popularity over time
Blogdex, BlogPulse, etc. track the most popular links/phrases of the day

Different kinds of information have differentpopularity profiles
Products, etc.
Major-news site (editorial content) – back of the paper
5 10 15 5 10 155 10 150
0.1
0.2
0.3
0.4
0.5
0.6
0.7
0.8
0.9
1
5 10 15
% of hits received on each day since first appearance
Slashdotpostings
Front-pagenews

Micro example: Giant Microbes

Microscale Dynamics
• What do we need track specific info ‘epidemics’?– Timings– Underlying network
b1b1
Time of infectiont0 t1
b2b2
b3b3
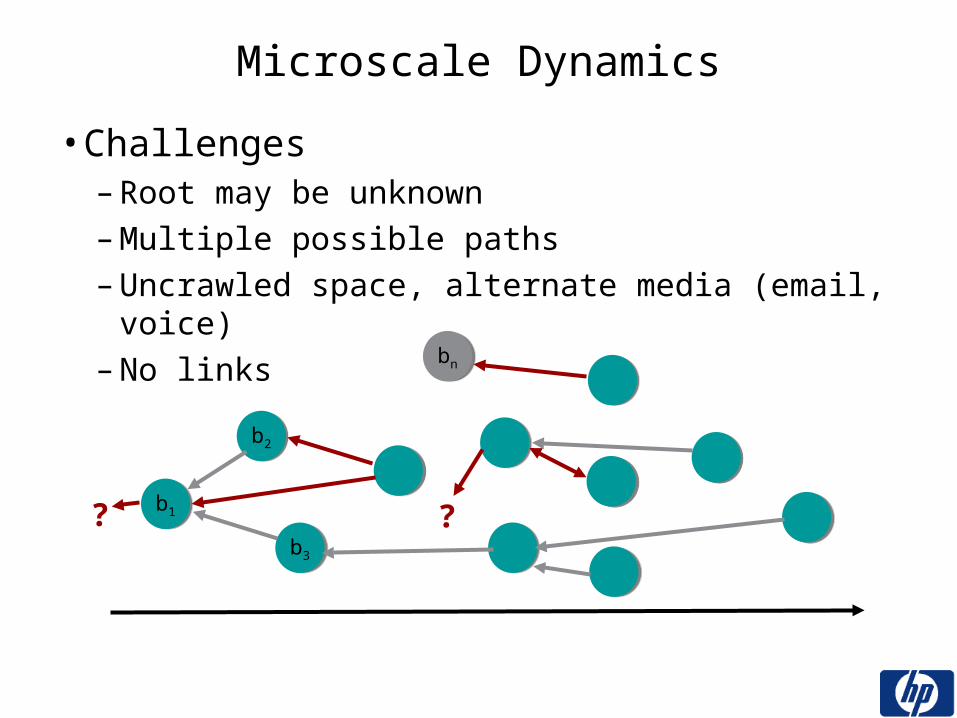
Microscale Dynamics
• Challenges– Root may be unknown– Multiple possible paths– Uncrawled space, alternate media (email, voice)– No links
b1b1
Time of infectiont0 t1
b2b2
b3b3
??
bnbn

Microscale Dynamics who is getting info from whom
• Explicit blog to blog links (easy)– Via links are even better
• Implicit/Inferred transfer (harder)– Use ML algorithm for link inference problem
• Support Vector Machine (SVM)• Logistic Regression
– What we can use• Full text• Blogs in common• Links in common• History of infection

Visualization
• Zoomgraph tool– Using GraphViz (by AT&T) layouts
• Simple algorithm– If single, explicit link exists, draw it– Otherwise use ML algorithm
• Pick the most likely explicit link• Pick the most likely possible link
• Tool lets you zoom around space, control threshold, link types, etc.
http://www-idl.hpl.hp.com/blogstuff

Giant Microbes epidemic visualization
via link explicit link inferred link blog

iRank
Find early sources of good informationusing inferred information paths or timing
b1b1
b2b2
b3b3 b4b4 b5b5 bnbn…
True source
Popular site

iRank Algorithm
• Draw a weighted edge for all pairs of blogs that cite the same URL• higher weight for mentions closer together• run PageRank• control for ‘spam’
Time of infectiont0 t1

Do Bloggers Kill Kittens?
02:00 AM Friday Mar. 05, 2004 PST Wired publishes:
"Warning: Blogs Can Be Infectious.”
7:25 AM Friday Mar. 05, 2004 PST Slashdot posts:
"Bloggers' Plagiarism Scientifically Proven"
9:55 AM Friday Mar. 05, 2004 PST Metafilter announces
"A good amount of bloggers are outright thieves."

Information flow in social groupsFang Wu, Bernardo Huberman, Lada Adamic, Joshua Tyler

co-worker
co-worker
co-worker
mike
mom
collegefriend
Spread of disease is affected by the underlying network

co-worker
co-worker
co-worker
mike
mom
collegefriend
Spread of computer virusesis affected by the underlying network

Viruses (computer and otherwise) are sharedindiscriminately (involuntarily)
Information is passed selectively from one host to another based on knowledge of the recipient’s interests
Difference between information flow and disease/virus spread

co-worker
co-worker
co-worker
mike
mom
collegefriend
Spread of information is affected by its content, potential recipients,and network topology

0 5 10 15 200
0.2
0.4
0.6
0.8
1
1.2
distance between personal homepages
aver
age
sim
ilarit
y at
the
dist
ance
homophily: individuals with like interests associate with one another
personal homepages at Stanford
distance between personal homepages

The Model:Decay in transmission probability as a function of the distance m between potential target and originating node
T(m) = (m+1)- T
m=0
m=1
m=2
power-law implies slowest decay

Degree distribution of all senders of email passing through the HP email server
outdegree k
/)( keCkkP
Virus, information transmission on a scale free network
100
101
102
103
104
10-8
10-6
10-4
10-2
100
outdegree
freq
uenc
y
outdegree distribution = 2.0 fit
P(k
)

1 1.5 2 2.5 3 3.5 40
0.2
0.4
0.6
0.8
1
criti
cal t
hre
sho
ld =, =0=100, =0=100, =1
106 nodes, epidemic if 1% (104) infected
Pastor-Satorras & Vespignani (2001)
epidemics on scale free graphs
Newman (2002)
Wu et al. (2004)

40 participants (30 within HPL, 10 elsewhere in HP & other orgs)
6370 URLs and 3401 attachments crypotgraphically hashed
Question: How many recipients in our sample did each item reach?
caveats:messages are deleted (still, the median number of messages > 2000)non-uniform sample
Study of the spread of URLs and attachments

forwarded URLs
forwardedmessage
Only forwarded messages are counted

100
101
100
101
102
103
104
number of recipients
num
ber
of i
tem
s w
ith s
o m
any
reci
pien
ts
email attachments
x-4.1
URLs
x-3.6
short term expensecontrol
ads at thebottom ofhotmail &yahoomessages
average = 1.1 for attachments, and 1.2 for URLs
Results

02/19/2003 15:45:33 I-1 I-2
02/19/2003 15:45:33 I-1 I-3
02/19/2003 15:45:40 E-1 I-4
02/19/2003 15:45:52 I-5 E-2
02/19/2003 15:45:55 E-3 I-6
02/19/2003 15:45:58 I-7 I-8
02/19/2003 15:46:00 E-4 I-9
02/19/2003 15:46:05 I-10 I-11
02/19/2003 15:46:10 I-12 I-13
02/19/2003 15:46:10 I-12 I-14
02/19/2003 15:46:10 I-12 I-15
02/19/2003 15:46:14 I-16 E-5
. . . . . . . .
Simulate transmission on email log
each message has a probability p of transmitting information from an infected individual to the recipient
internalnode
externalnode

Simulation of information transmission onthe actual HP Labs email graph
an individual is infected if they receive a particular pieceof information
individuals remain infected for 24 hours
start by infecting one individual at random
every time an infected individual sends an email they havea probability p of infecting the recipient
track epidemic over the course of a week, most run theircourse in 1-2 days

Introduce a decay in the transmission probabilitybased on the hierarchical distance
75.10
hpp
distance 1 distance 2distance 2
distance 1A B
hAB = 5

7119 potential recipients
0 0.2 0.4 0.6 0.8 10
500
1000
1500
2000
2500
probability of transmission
ave
rag
e s
ize
of o
utb
rea
k o
r e
pid
em
ic outbreak w/ decayepidemic w/ decayoutbreak w/o decayepidemic w/o decay
p0

Conclusions on info flow in social groups
Information spread typically does not reach epidemic proportions
Information is passed on to individuals with matching properties
The likelihood that properties match decreases with distancefrom the source
Model gives a finite threshold
Results are consistent with observed URL & attachment frequenciesin a sample
Simulations following real email patterns also consistent

NE
MA
Milgram’s experiment:
Given a target individual and a particular property, pass the message to a person you correspond with who is “closest” to the target.
How to search in a small world

Small world experiment at Columbia
Dodds, Muhamad, Watts, Science 301, (2003)
email experiement conducted in 200218 targets in 13 different countries
24,163 message chains 384 reached their targetsaverage path length 4.0

Why study small world phenomena?
Curiosity:Why is the world small?How are people able to route messages?
Social Networking as a Business:Friendster, Orkut, MySpaceLinkedIn, Spoke, VisiblePath

Six degrees of separation - to be expected
Pool and Kochen (1978) - average person has 500-1500 acquaintances
Ignoring clustering, other redundancy …
~ 103 first neighbors, 106 second neighbors, 109 third neighbors
But networks are clustered:my friends’ friends tend to be my friends
Watts & Strogatz (1998) - a few random links in an otherwise clustered graph give an average shortest path close to that of a random graph

How to choose among hundreds of acquaintances?
Strategy:Simple greedy algorithm - each participant chooses correspondentwho is closest to target with respect to the given property
Models
geographyKleinberg (2000)
hierarchical groupsWatts, Dodds, Newman (2001), Kleinberg(2001)
high degree nodesAdamic, Puniyani, Lukose, Huberman (2001), Newman(2003)
But how are people are able to find short paths?

Kleinberg (2000)
nodes are placed on a lattice andconnect to nearest neighbors
additional links placed with f(d)~ d(u,v)-r
if r = 2, can search in polylog (< (logN)2) time
Spatial search
“The geographic movement of the [message] from Nebraska to Massachusetts is striking. There is a progressive closing in on the target area as each new person is added to the chain”
S.Milgram ‘The small world problem’, Psychology Today 1,61,1967

Kleinberg: searching hierarchical structures
‘Small-World Phenomena and the Dynamics of Information’, NIPS 14, 2001
Hierarchical network models:h is the distance between two individuals in hierarchywith branching b
f(h) ~ b-h
If = 1, can search in O(log n) steps
Group structure models:
q = size of smallest group that two individuals belong to
f(q) ~ q-
If = 1, can achieve in O(log n) steps

Identity and search in social networksWatts, Dodds, Newman (2001)
individuals belong to hierarchically nested groups
multiple independent hierarchies coexist
pij ~ exp(- x)

Identity and search in social networksWatts, Dodds, Newman (2001)
There is an attrition rate rNetwork is ‘searchable’ if a fraction q of messages reach the target
N=102400
N=409600
N=204800

Mary
Bob
Jane
Who couldintroduce me toRichard Gere?
High degree search
Adamic et al. Phys. Rev. E, 64 46135 (2001)

1
6
54
63
67
2
94
number ofnodes found
power-law graph

93
number ofnodes found
13
711
1519
Poisson graph

101
102
103
104
105
100
101
102
103
size of graph
cove
rtim
e fo
r h
alf
the
no
des
random walk = 0.37 fit
degree sequence = 0.24 fit
Scaling of search time with size of graphSharp cutoff at k~N1/2nd degree neighbors

Use a well defined network:HP Labs email correspondence over 3.5 months
Edges are between individuals who sent at least 6 email messages each way
Node properties specified:degreegeographical locationposition in organizational hierarchy
Can greedy strategies work?
Testing the models on social networks(w/ Eytan Adar)

100
101
102
103
104
10-8
10-6
10-4
10-2
100
outdegree
freq
uenc
y
outdegree distribution = 2.0 fit
Degree distribution of all senders of email passing through the HP email server
Strategy 1: High degree search
outdegree

Filtered network (6 messages sent each way)
0 20 40 60 800
5
10
15
20
25
30
35
number of email correspondents, k
p(k
)
0 20 40 60 8010
-4
10-2
100
k
p(k
)
450 usersmedian degree = 10
mean degree = 13
average shortest path = 3
High degree searchperformance (poor):median # steps = 16mean = 40
Degree distribution no longer power-law, but Poisson

Strategy 2:Geography

1U
2L 3L
3U
2U
4U
1L
87 % of the4000 links arebetween individualson the same floor
Communication across corporate geography

Cubicle distance vs. probability of being linked
102
103
10-3
10-2
10-1
100
distance in feet
pro
po
rtio
n o
f lin
ked
pa
irs
measured1/r
1/r2
optimum for search

Finding someone in a sea of cubicles
0 2 4 6 8 10 12 14 16 18 200
2000
4000
6000
8000
10000
12000
14000
16000
number of steps
nu
mb
er
of p
airs
median = 7mean = 12

Strategy 3: Organizational hierarchy

Email correspondence scrambled

Actual email correspondence

Example of search path
distance 1
distance 1
distance 2
hierarchical distance = 5search path distance = 4
distance 1

Probability of linking vs. distance in hierarchy
in the ‘searchable’ regime: 0 < < 2 (Watts 2001)
2 4 6 8 100
0.1
0.2
0.3
0.4
0.5
0.6p
rob
ab
ility
of l
inki
ng
hierarchical distance h
observedfit exp(-0.92*h)

Results
0 5 10 15 20 250
1
2
3
4
5x 10
4
number of steps in search
nu
mb
er o
f p
airs
distance search geodesic org random
median 4 3 6 28
mean 5.7 (4.7) 3.1 6.1 57.4

Group size vs. probability of linking

101
102
10-2
10-1
100
pro
ba
bili
ty o
f lin
kin
g
group size g
observed
fit g-0.74
g-1
optimum forsearch (Kleinberg 2001)
Group size and probability of linking
group size g

Search Conclusions
Individuals associate on different levels into groups.
Group structure facilitates decentralized search using social ties.
HP Labs as a social network is searchable but not quite optimal. searching using the organizational hierarchy is faster than using physical location
A fraction of ‘important’ individuals are easily findable
Humans may be much more resourceful in executing search tasks:making use of weak tiesusing more sophisticated strategies

PeopleFinder2 – a search engine for HP people
Live Demo
If live demo fails:Current PeopleFinder functionalityPeopleFinder2 info on a personExtracted topics for a personSocial network Social network visualizationSearch for individuals by topicVisualize knowledge networkFind social network paths to experts
Extract & disambiguate names from publicly available documentsEnrich information available about individualsSearch for them by topicIdentify knowledge communities from co-occurrence of names

To find out more:(papers, slides, other research in the group)
Information dynamics group (IDL) at HP Labs:http://www.hpl.hp.com/research/idl
List of publicationshttp://www.hpl.hp.com/personal/Lada_Adamic/research.html