Embed Size (px)
Citation preview
Lackawanna River Watch Report: Macroinvertebrate Collections, 1991-98 A Report of the Lackawanna River Corridor Association Volunteer Monitoring Effort
by Arthur Popp, M.S.
Aquatic Biologist, Lackawanna River Corridor Association
Daniel S. Townsend, Ph.D. Department of Biology, University of Scranton
A publication of the Lackawanna River Corridor Association P.O. Box 368 Scranton, PA 18501
© 1999 Lackawanna River Corridor Association
- 1 -
Executive Summary
Lackawanna River Watch is a program of the Lackawanna River Corridor Association (LRCA), a not for profit community based river conservation organization. The purpose of the LRCA is to promote the restoration and protection of the Lackawanna River and its watershed resources and to involve the community, individuals, groups, government agencies and businesses with the river and its watershed. The Lackawanna River is a fifty-mile long tributary to the North Branch of the Susquehanna River. It flows through four Northeastern Pennsylvania counties: Wayne, Susquehanna, Lackawanna, and Luzerne, and its watershed is spread over 350 square miles within these counties. The LRCA organized River Watch to help learn about the environmental conditions and ecological health of the river, and to educate ourselves and our fellow citizens about the environmental quality of the river and how the actions or in-actions of the human community impact the environmental quality of the river. Since the beginning of the River Watch program in 1989, citizen volunteer monitors have measured basic water quality parameters and collected macroinvertebrates at twenty one sites on the Lackawanna River, five on Roaring Brook, and one on Aylesworth Creek. The data collected from over two hundred forty sampling efforts has presented us with an overall picture of the river’s and its tributaries’ health. The primary focus of the sampling program has been macroinvertebrate collections, which are the subject of this report. We analyzed collections made in 1997-98, at five sites on the Lackawanna River and one on Roaring Brook, to determine current water quality conditions. These data were then compared to collections made in 1991-92, to determine if conditions have changed. Mean values of total taxa (the number of different types of organisms), EPT taxa, and the percentages of EPT organisms of all organisms collected were used to make these comparisons. EPT refers to the group of organisms found in the insect Orders Ephemeroptera (mayflies), Plecoptera (stoneflies), and Trichoptera (caddisflies). They are considered pollution-sensitive organisms, and their presence or absence is a good indication of whether a site is being impacted by inputs of pollution. Data collected in 1997-98 from the five sites on the Lackawanna indicate that good water quality conditions exist at the two most upstream sites, in Forest City (Site 1) and Jermyn (Site 2). Both sites had the highest mean total and EPT taxa, and percent EPT organism values. This indicates that conditions within the upper portion of the River are relatively non-impacted by inputs of pollution. Collections from a North Scranton site (Site 3) indicate that water quality has noticeably decreased as the river enters Scranton. Though mean total taxa values are essentially the same at Site 3 as Site 2, the number of EPT taxa collected was half of that collected at Site 2, and the percentage of EPT’s collected is also lower. The loss in EPT taxa and percentage values indicate that water quality is being affected by pollution inputs between Sites 2 and 3, limiting the number of pollution sensitive organisms able to survive there. Non-EPT taxa begin to replace the pollution sensitive ones, keeping total taxa values relatively unchanged from Site 2. Conditions continue to decline downstream at sites in South Scranton (Site 4) and Old Forge (Site 5). Even lower values of total and EPT taxa, and of EPT percentages were found at these two sites. Generally, only a single EPT taxon was common throughout this stretch, and the remaining community was dominated by non-EPT organisms. This indicates that pollution sources in Scranton and downstream degrade conditions even further, restricting the macroinvertebrate community to organisms able to tolerate poor water quality. Conditions at the Roaring Brook site in East Scranton (Site 6), indicate that water quality at that site is similar to that found in the Lackawanna River between Sites 4 and 5. Low values of total and EPT taxa reflect pollution problems and their restriction on development of a diverse and pollution sensitive community. A comparison of 1991-92 collections with those of 1997-98 indicates improved water quality conditions at Sites 1-3, but relatively little change at Sites 4-5 and Site 6. Total and EPT taxa values increased at Sites 1-3, indicating that conditions in the River between Forest City and North Scranton are currently less impacted by pollution inputs. Data for total and EPT taxa values at Sites 4-5 show little change from 1991-92, reflecting continued water quality impairment in the River in Scranton and downstream. At Site 6, 1991-92 total and EPT taxa values were slightly greater than those found in 1997-98, indicating perhaps a decline in water quality at this site. The EPT percentages reflected the same trends as values for total and EPT taxa, with increases at Sites 1-3, and little change at Sites 4-5 and Site 6.
INTRODUCTION
To promote the restoration and protection of the Lackawanna River and its watershed, the Lackawanna River Corridor Association (LRCA) initiated a progr am in 1989 to identify and address water quality
- 2 -
problems. Patterned after the Vermont River Watch Network, the Lackawanna River Watch program was designed to involve residents of the watershed in monitoring the biological, physical and chemical conditions of the Lackawanna and its tributaries. With this program, the LRCA hoped to promote awareness and involvement of the public in river stewardship, and thereby a greater sense of community ownership of this valuable resource. In 1989, area high school and university students began monitoring basic water quality parameters and aquatic life at eight sites. By 1991, local citizens began visiting additional sites and expanding activities of the River Watch program to include monitoring leaking sewer lines, erosion, sedimentation, and riverside dumping. During 1992-93, an additional project, carried out cooperatively with Pennsylvania Gas & Water Company, involved collecting water samples near sewer treatment plant outfalls for bacteriological testing. A major aspect of the River Watch monitoring program has been to collect benthic macroinvertebrates from the River. Benthic macroinvertebrates include the insects, crayfish, worms, clams, snails, and other invertebrates that spend at least part of their lives on the stream bottom, and are large enough to see with the naked eye. The types and numbers of macroinvertebrates found in a particular portion of a river are a consequence of the water quality conditions that occur there. Some kinds of macroinvertebrates can only survive in water that is virtually free of pollution, and will disappear if water becomes contaminated, for example by chemicals, or increased sediment loads or nutrients, or lower dissolved oxygen levels. Others are more tolerant of pollution and occur more typically in water that is somewhat contaminated. Yet others may be very tolerant of polluted conditions and dominate waters that are highly contaminated. These differences in pollution-tolerance make benthic macroinvertebrates excellent indicators of the water quality conditions where they live. Collecting these organisms repeatedly in an area over a long period of time can, therefore, provide an idea of whether and how conditions may be changing, and whether new water quality problems are arising. There are a variety of pollution sources to the Lackawanna River that impact the macroinvertebrate community. Four major sources are inputs from combined sewer-storm water overflows (CSO), sewage treatment plant (STP) outfalls, mine drainage, and erosion and sedimentation (E&S) from construction sites, roadways and abandoned coal mine lands. In many municipalities along the river and its major tributari es, runoff from rain events or snow melt drains directly into sewer lines, the main trunks of which run alongside the streams. When the sewage-storm water mixture exceeds the capacity of the sewer line, CSO regulators are designed to open and allow the mixture to flow directly into the river or tributary. There are approximately 140 of these overflow outlets along the River. Water discharged into the river from CSOs contains not only sewage but many other materials picked up by storm water in its rush downhill. These include trash, sediment and de-icing material from roads, dumped or spilled chemicals from homes and businesses, oil leaked from cars, and other materials. The six major STPs along the Lackawanna River are additional pollution sources. The effluent from an STP may contain high concentrations of nutrients such as nitrates and phosphates which promote the growth of algae, and a high capacity to consume dissolved oxygen (known as biochemical oxygen demand or BOD) which reduces its availability to aquatic plants and animals. STP effluent can contain other pollutants as well, including metals from the treatment process itself. Metals and other chemical pollutants are discharged into the river from the surface openings of flooded mine tunnels, which tend to be located right along the river banks. Some of the largest mine discharges, particularly in the lower reaches of the Lackawanna River, dump millions of gallons into the river daily. Water from mine discharges generally has high concentrations of iron and sulfur compounds, very low concentrations of dissolved oxygen, and low (acidic) pH. In addition to CSOs, STPs and mine drainage openings as point sources of pollution, there are many non-point pollution sources, including sediment and leached materials from abandoned mine lands, culm piles and construction sites, and trash dumped in or along the river. Pollutants from all of these sources alter water quality from its natural state, and affect the types of macroinvertebrates that can live under these altered conditions. In this report, we focus on the macroinvertebrate collections of the River Watch program. Our two main objectives are, (1) to document and evaluate current water quality conditions based on macroinvertebrate data from 1997-98, and (2) to determine if conditions have changed from 1991-92, when we first sampled the river, to 1997-98.
- 3 -
METHODS
Study Sites. From 1991 to 1998, 21 sites on the Lackawanna River, 5 sites on Roaring Brook and one site on Aylesworth Creek were sampled under the River Watch program. On the Lackawanna River, sample sites ranged from a site in Forest City (just downstream of the Stillwater Dam) 36.7 miles upstream of the confluence with the Susquehanna River (River Mile 36.7 = RM 36.7) to the furthest downstream site in Old Forge (RM 3.5). Sites were often located near tributary streams, AMD and STP outfalls, or major CSOs. Appendix A provides information on the locations of all sampling sites, as well as the years and number of times they were sampled in each year. A total of 240 macroinvertebrate sampling efforts were carried out between 1991 and 1998, with an average of thirteen sites sampled each year. Not every site was sampled each year; volunteer turnover and changes in program resulted in some sites dropping out or new ones being added over the eight years. For this report, we analyzed the data from five sites on the Lackawanna River and one site on Roaring Brook, Table 1. Sampling at these six sites was the most consistent from year to year, and each site was visited at least twice during the two sampling periods discussed in this report, 1991-92 and 1997-98. These six sites represent a geographic range on the Lackawanna River and Roaring Brook, as well as a variety of disturbance and pollution conditions.
SAMPLING
Typically, a site was sampled three to four times a year between May and October. Macroinvertebrates were collected with rectangular frame nets (opening of 46 cm wide by 22 cm high, 0.5 mm mesh) in a riffle area at each site. The bottom edge of the net was placed against the bottom of the stream and all rocks in an area as wide as the net and approximately 0.5 meters upstream were rubbed under water. The dislodged macroinvertebrates and organic material were carried by the River's current into the net. The sampled area was also kicked, to insure that all macroinvertebrates had been collected from that area before the net was removed from the water. The same procedure was then repeated in one or two other areas of the riffle. Contents of the net were put in a half-gallon plastic container for transport back to the laboratory. Some samples were transported back to the lab alive; others had 75-80% ethanol added to them to preserve the organisms until they could be sorted.
LABORATORY ANALYSIS
Upon return to a University of Scranton laboratory, each sample was washed in a 0.5 mm sieve and placed into a shallow sorting tray. From 1991 to 1995, all of the macroinvertebrates were picked from each sample, which often involved hundreds of organisms. Beginning in 1996, we used the Environmental Protection Agency's Rapid Bioassessment Protocol and randomly picked out the first 100 macroinvertebrates from each sample. All macroinvertebrate samples were stored in 75% ethanol and retained for reference. During sorting, the macroinvertebrates in each sample were separated by taxonomic order. Initial identifications were made to the level of order or, in some cases, family using general macroinvertebrate guides. Organisms of a particular order or family that were distinctly different were further separated and recorded as separate taxa. For example, when all mayflies (Order Ephemeroptera) had been separated from a sample, if there were four distinctly different types of mayflies, we recorded separate counts for each of the four taxa under the Ephemeroptera. All identifications and counts were later checked for accuracy by aquatic biologists. Table 2 lists all of the macroinvertebrate orders that were recorded from the six sites.
DATA ANALYSIS
We present an analysis of the macroinvertebrate collections in terms of two mutually exclusive groups: "EPT taxa" and "non-EPT taxa." Taken together, these two groups represent all of the macroinvertebrate organisms collected at a site. The acronym EPT is derived from the first letters of three invertebrate orders, the Ephemeroptera (mayflies), Plecoptera (stoneflies) and Trichoptera (caddisflies). These three orders comprise organisms that are especially good indicators of water quality, and hence their presence and numbers provide a sensitive assay of stream conditions. Mayflies and stoneflies are especially intolerant of
- 4 -
pollution, and tend to be the most sensitive taxa to polluted water. While many caddisflies are intolerant, one family – the Hydropsychidae – is more tolerant of polluted conditions. Hence, the diversity (number of different taxa) and abundance of EPT macroinvertebrates are widely used as indicators of water quality in streams and rivers. Non-EPT macroinvertebrates include such organisms as aquatic earthworms, snails, clams, leeches, crayfish, and the larvae or adults of insects in the Orders Megaloptera (hellgramites and dobsonflies), Coleoptera (beetles) and Diptera (craneflies, blackflies and midges). For each of the six sites considered in this report, we calculated the mean number of taxa in each order, the mean number of total taxa, and the mean number of EPT taxa for each of the two periods we consider, 1991-92 and 1997-98. We also computed the relative frequency of each order at each site as the percentage of samples taken at the site in which at least one organism in the order occurred. Finally, for each site, we computed the percentage of all individual organisms comprised by EPT organisms, for each of the two periods.
RESULTS AND DISCUSSION Current Conditions (1997-98)
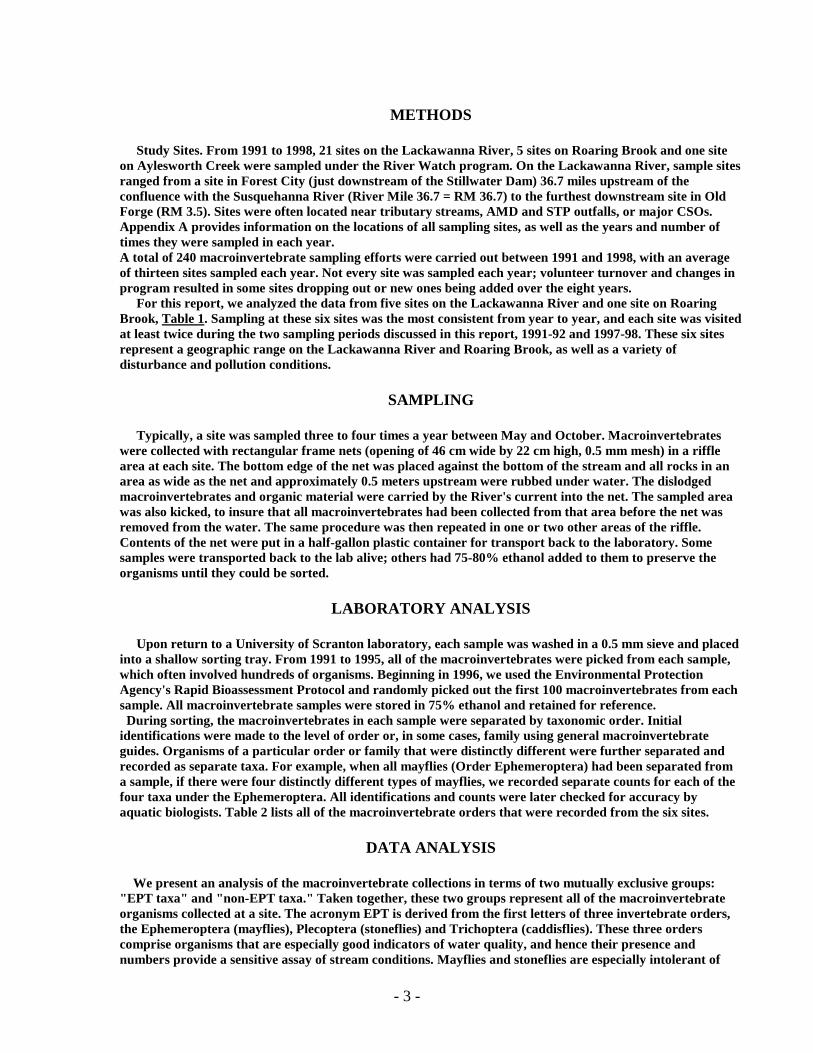
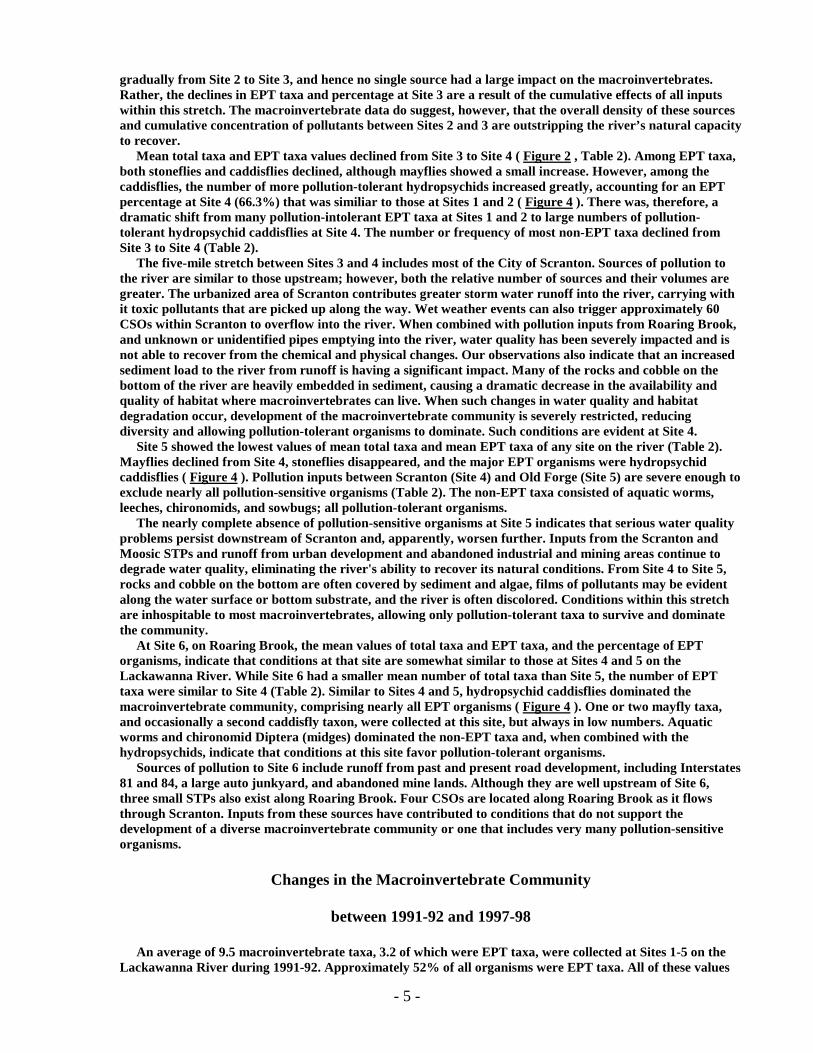
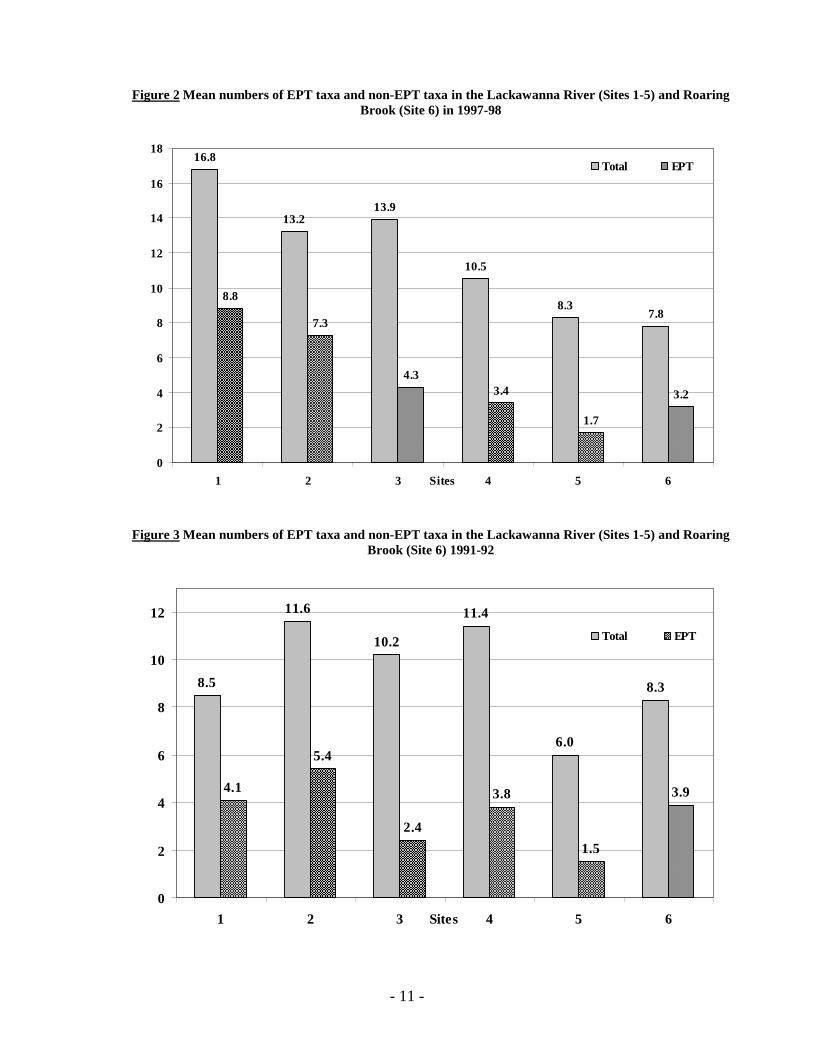
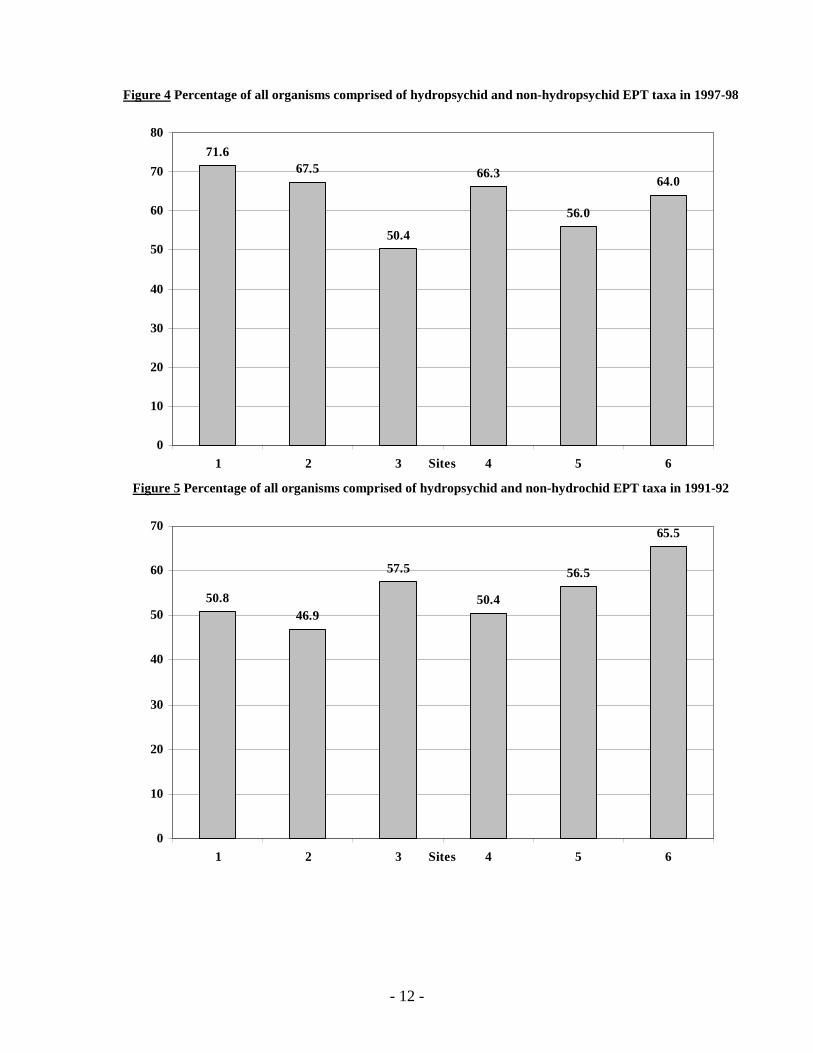
An average of 12.5 macroinvertebrate taxa, 5.1 of them EPT taxa, were collected from the Lackawanna River per sampling event during 1997-98. The mean values for total taxa and for EPT taxa were greatest in the upper portion of the Lackawanna River at Site 1, and generally decreased downstream to Site 5 ( Figure 2 ). The means for Site 6, on Roaring Brook, were generally similar to those at Sites 4 and 5 on the Lackawanna River (Table 2). The percentage of all organisms comprised by EPT taxa did not vary greatly among the five sites on the Lackawanna River (it was somewhat lower at Site 3), but the proportion of EPT organisms comprised by pollution-tolerant hydrospychid caddisflies increased dramatically from Site 1 to Site 5 Figure 4. Site 1 exhibited the highest number of total taxa (16.8) and EPT taxa (8.8) in 1997-98 (Table 2). EPT organisms comprised 72% of all organisms collected ( Figure 3 ) and included a variety of pollution-sensitive mayflies and stoneflies. The high diversity at Site 1 indicates that water quality conditions in this upper section of River are relatively unimpacted by pollution and can recover from inputs that do occur. This allows undisturbed development and survival of a community dominated by pollution-sensitive macroinvertebrates. At Site 2, the mean numbers of total taxa (13.2) and EPT taxa (7.3) were marginally lower than those at Site 1. Decreases were due principally to declines in the number of stonefly and pollution-sensitive (non-hydropsychid) caddisfly taxa (Table 2). Those EPT taxa that were present, however, occurred in greater numbers and hence EPT percentage remained virtually the same as at Site 1 ( Figure 3 ). Major point sources of pollution entering the river between Sites 1 and 2 are associated with the Clinton Township STP, which serves Forest City, Vandling and Browndale, and mine discharges, including a high volume mine discharge in Jermyn (the Jermyn Tunnel). Other sources include CSOs within the municipalities of Carbondale, Mayfield and Jermyn, urban runoff from these areas, and runoff from abandoned mine lands. While the macroinvertebrate data suggest that pollutants entering the river between Sites 1 and 2 are not having a detrimental effect on the overall composition of the macroinvertebrate community, conditions are apparently unfavorable for some of the most sensitive EPT organisms. This indicates that water quality is being affected by pollution inputs, but still maintains and recovers enough of its good water quality to allow development of a relatively unimpaired macroinbertebrate community. The mean total taxa value increased slightly from Site 2 to Site 3, whereas the mean number of EPT taxa decreased ( Figure 2 Table 2). This decrease in EPT taxa was due entirely to a decline in the number of mayfly taxa collected, from 4.0 at Site 2 to 1.0 at Site 3 (Table 2). Although the numbers of stonefly and non-hydropsychid caddisfly taxa did not decrease, they exhibited much lower numbers at Site 3, typically only one or two per taxon. Total taxa values did not decrease from Site 2 to Site 3, primarily due to an increase in the number of pollution-tolerant taxa that began to appear in larger numbers at Site 3 (Table 2). These included the larvae of midges and black flies (Diptera), sowbugs (Isopoda), scuds (Amphipoda) and leeches (Hirudinea). The increase in abundance of more pollution-tolerant organisms, the loss of mayfly taxa, and a drop in the number of non-hydropsychid caddisflies at Site 3 contributed to a 17% decline in the percentage of EPT organisms ( Figure 4 ). Sources of pollution entering the River between Sites 2 and 3 include two STP outfalls (Archbald and Throop) and three mine drainage outfalls (Wadell, Gravity Slope, and Lackawanna), as well as numerous CSOs, and runoff from urban and suburban communities, and mine lands in the Mid Valley area. Data from other River Watch sites, some nearer to these pollution sources (Appendix A), suggest that EPT taxa decline
- 5 -
gradually from Site 2 to Site 3, and hence no single source had a large impact on the macroinvertebrates. Rather, the declines in EPT taxa and percentage at Site 3 are a result of the cumulative effects of all inputs within this stretch. The macroinvertebrate data do suggest, however, that the overall density of these sources and cumulative concentration of pollutants between Sites 2 and 3 are outstripping the river’s natural capacity to recover. Mean total taxa and EPT taxa values declined from Site 3 to Site 4 ( Figure 2 , Table 2). Among EPT taxa, both stoneflies and caddisflies declined, although mayflies showed a small increase. However, among the caddisflies, the number of more pollution-tolerant hydropsychids increased greatly, accounting for an EPT percentage at Site 4 (66.3%) that was similiar to those at Sites 1 and 2 ( Figure 4 ). There was, therefore, a dramatic shift from many pollution-intolerant EPT t axa at Sites 1 and 2 to large numbers of pollution-tolerant hydropsychid caddisflies at Site 4. The number or frequency of most non-EPT taxa declined from Site 3 to Site 4 (Table 2). The five-mile stretch between Sites 3 and 4 includes most of the City of Scranton. Sources of pollution to the river are similar to those upstream; however, both the relative number of sources and their volumes are greater. The urbanized area of Scranton contributes greater storm water runoff into the river, carryin g with it toxic pollutants that are picked up along the way. Wet weather events can also trigger approximately 60 CSOs within Scranton to overflow into the river. When combined with pollution inputs from Roaring Brook, and unknown or unidentified pipes emptying into the river, water quality has been severely impacted and is not able to recover from the chemical and physical changes. Our observations also indicate that an increased sediment load to the river from runoff is having a significant impact. Many of the rocks and cobble on the bottom of the river are heavily embedded in sediment, causing a dramatic decrease in the availability and quality of habitat where macroinvertebrates can live. When such changes in water quality and habitat degradation occur, development of the macroinvertebrate community is severely restricted, reducing diversity and allowing pollution-tolerant organisms to dominate. Such conditions are evident at Site 4. Site 5 showed the lowest values of mean total taxa and mean EPT taxa of any site on the river (Table 2). Mayflies declined from Site 4, stoneflies disappeared, and the major EPT organisms were hydropsychid caddisflies ( Figure 4 ). Pollution inputs between Scranton (Site 4) and Old Forge (Site 5) are severe enough to exclude nearly all pollution-sensitive organisms (Table 2). The non-EPT taxa consisted of aquatic worms, leeches, chironomids, and sowbugs; all pollution-tolerant organisms. The nearly complete absence of pollution-sensitive organisms at Site 5 indicates that serious water quality problems persist downstream of Scranton and, apparently, worsen further. Inputs from the Scranton and Moosic STPs and runoff from urban development and abandoned industrial and mining areas continue to degrade water quality, eliminating the river's ability to recover its natural conditions. From Site 4 to Site 5, rocks and cobble on the bottom are often covered by sediment and algae, films of pollutants may be evident along the water surface or bottom substrate, and the river is often discolored. Conditions within this stretch are inhospitable to most macroinvertebrates, allowing only pollution-tolerant taxa to survive and dominate the community. At Site 6, on Roaring Brook, the mean values of total taxa and EPT taxa, and the percentage of EPT organisms, indicate that conditions at that site are somewhat similar to those at Sites 4 and 5 on the Lackawanna River. While Site 6 had a smaller mean number of total taxa than Site 5, the number of EPT taxa were similar to Site 4 (Table 2). Similar to Sites 4 and 5, hydropsychid caddisflies dominated the macroinvertebrate community, comprising nearly all EPT organisms ( Figure 4 ). One or two mayfly taxa, and occasionally a second caddisfly taxon, were collected at this site, but always in low numbers. Aquatic worms and chironomid Diptera (midges) dominated the non-EPT taxa and, when combined with the hydropsychids, indicate that conditions at this site favor pollution-tolerant organisms. Sources of pollution to Site 6 include runoff from past and present road development, including Interstates 81 and 84, a large auto junkyard, and abandoned mine lands. Although they are well upstream of Site 6, three small STPs also exist along Roaring Brook. Four CSOs are located along Roaring Brook as it flows through Scranton. Inputs from these sources have contributed to conditions that do not support the development of a diverse macroinvertebrate community or one that includes very many pollution-sensitive organisms.
Changes in the Macroinvertebrate Community
between 1991-92 and 1997-98
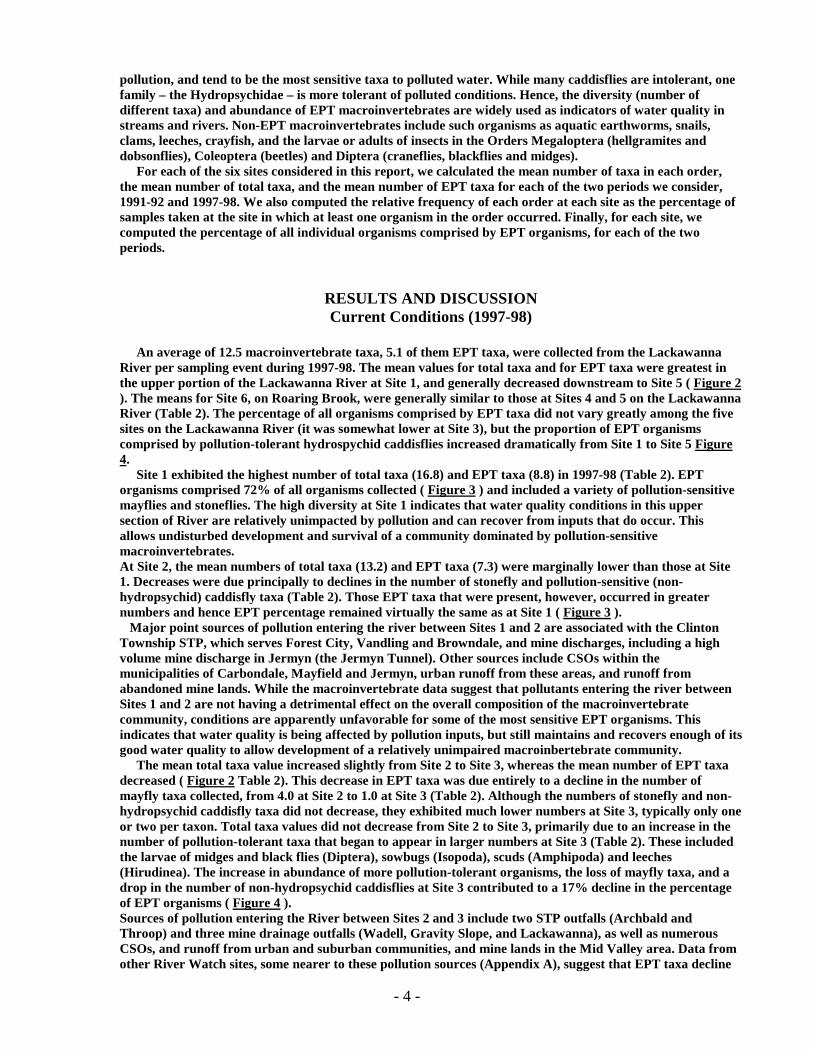
An average of 9.5 macroinvertebrate taxa, 3.2 of which were EPT taxa, were collected at Sites 1-5 on the Lackawanna River during 1991-92. Approximately 52% of all organisms were EPT taxa. All of these values
- 6 -
had increased by 1997-98; hence, the macroinvertebrates in the Lackawanna indicate a general improvement in water quality from 1991-92 to 1997-98. However, changes in the macroinvertebrate community were not equally great at all sites. In the upper portion of the river, at Sites 1 and 2, there were marked improvements while Sites 4 and 5 exhibited marginal changes. Site 6, on Roaring Brook, also changed little between the two sampling periods, indicating that water quality conditions have remained about the same. At Site 1 we found dramatic increases, from 1991-92 to 1997-98, in mean number of all taxa, in the number of EPT taxa, and in the EPT percentage. Total taxa and EPT taxa values essentially doubled (Table 2). The increase in EPT taxa resulted from a doubling in the number of taxa of the three orders (mayflies, stoneflies and caddisflies) of these insects. The percentage of EPT increased from 50.8 in 1991-92 to 71.6 in 1997-98 ( Figure 4 & Figure 5 ). Among non-EPT taxa, there were increases in Megaloptera (dobsonflies), Coleoptera (beetles) and Diptera (true flies), and the new appearance of bivalves (clams and limpets). Most of the additional taxa were pollution-sensitive macroinvertebrates, indicating that water quality at Site 1 improved from 1991-92 to 1997-98. Mean total taxa, EPT taxa and EPT percentage also increased at Site 2 from 1991-92 to 1997-98 (Table 2). Unlike Site 1, the increase in the number of EPT taxa was due principally to a three-fold increase in the number of Ephemeroptera (mayflies) taxa. The percentage of EPT organisms increased from 46.9% in 1991-92 to 67.5% in 1997-98 ( Figure 4 & Figure 5 ). The increase in non-EPT macroinvertebrate taxa was smaller than at Site 1, and its causes more dispersed among the non-EPT taxa. Site 3 also exhibited an positive change in its macroinvertebrate community from 1991-92 to 1997-98 (Table 2, Figure 4 & Figure 5 ). The number of all taxa increased and the number of EPT taxa almost doubled. Hydropsychid caddisflies were the major EPT taxon in 1991-92, comprising nearly all of the EPT organisms collected ( Figure 5 ). In 1997-98, hydropsychids comprised a smaller proportion of EPT organisms ( Figure 4 ) while mayflies and stoneflies, which were rarely collected in 1991-92, occurred in larger numbers and with much greater frequency (Table 2). Several new non-EPT taxa were collected at Site 3 in 1997-98 (Table 2) although most were not pollution-sensitive organisms. The changes in macroinvertebrates at Site 3 suggest that water quality conditions improved from 1991-92 to 1997-98. The macroinvertebrate community remained relatively unchanged at Site 4 from 1991-92 to 1997-98. The mean number of all taxa and of EPT taxa changed little (Table 2). There was an increase in the EPT percentage from 50.4% in 1991-92 to 66.3% in 1997-98 ( Figure 4 & Figure 5 ), but the change was due mainly to an increase in the number of hydropsychid caddisflies in 1997-98. One noteworthy change was the first appearance of stoneflies, albeit only once, at Site 4 in 1997-98 (Table 2), suggesting that water quality conditions may have improved slightly. Periods of stress from pollution inputs must still occur, however, as a diverse EPT community has not been established at this site. Site 5 exhibited little change from 1991-92 to 1997-98. The mean number of all taxa increased marginally (Table 2) due to small increases in some non-EPT taxa. Non-EPT organisms collected in 1997-98 that were not present in 1991-92 included water mites, scuds and sowbugs, all relatively pollution-tolerant. The number and frequency of EPT taxa were unchanged between the two sampling periods. Hydropsychid caddisflies dominated the EPT taxa at Site 5 in 1991-92 and 1997-98; stoneflies did not occur during either sampling period (Table 2). Hence, there was no improvement in water quality, although a few more pollution-tolerant taxa were able to colonize the area. Organisms that are pollution-intolerant are still unable to live in this lower reach of the River. The macroinvertebrate community at Site 6, on Roaring Brook, exhibited little change from 1991-92 to 1997-98. Mean total taxa and mean EPT taxa showed marginal changes between the two sampling periods (Table 2). In fact, the number and frequency of EPT taxa declined slightly and, whereas stoneflies were collected once in 1991-92, they were never collected in 1997-98 (Table 2). The EPT percentage was unchanged and the vast majority of EPT organisms were hydropsychid caddisflies in both periods ( Figure 4 & Figure 5 ). There were marginal changes in the number of non-EPT taxa, although several groups of organisms that were recorded in 1991-92 were not collected in 1997-98. The comparative data at Roaring Brook suggest that water quality conditions have remained the same, or even declined slightly, since 1991-92.
CONCLUSIONS
Macroinvertebrate collections in 1997-98 indicate that good to excellent water quality conditions in the upper reaches of the Lackawanna River (Sites 1 and 2) support a diverse benthic community. This community contains a variety of pollution-sensitive EPT organisms, as well as some more pollution-tolerant non-EPT taxa. The presence of multiple mayfly and stonefly taxa within this upper stretch of the river suggests that conditions are consistently suitable for pollution-sensitive organisms and are relatively unaffected by pollution inputs. Downstream from Site 2, the macroinvertebrate community is increasingly
- 7 -
dominated by more pollution-tolerant organisms, particularly hydropsychid caddisflies. While some mayflies have been collected downstream, their gradual decline, and the disappearance of stoneflies, indicates that water quality conditions steadily decline below Site 2. The decline in water quality is evident at Site 3, and becomes more serious as the river approaches and flows through Scranton. The current macroinvertebrate community appears to be much more diverse than that recorded during the early years of the River Watch program, especially within the upper portion of the River. Since 1991-92, many more pollution-sensitive EPT taxa have colonized Sites 1 to 3. A greater diversity of mayflies and stoneflies at these three sites indicates that water quality conditions have improved and pollution inputs have decreased. With the increased occurrence of stoneflies at Site 3 and their first occurrence at Site 4, there is an indication that conditions may be starting to improve downstream as well. However, water quality conditions in the lower reaches of the river have not improved a great deal as measured by the benthic macroinvertebrate community. The current macroinvertebrate community at Site 6, on Roaring Brook, is similiar to that found at Sites 4 and 5 on the Lackawanna River and has shown little change from 1991-92 to 1997-98. Although mayflies have been collected at Site 6, the community appears to be depressed by pollution inputs, as it is dominated by hydropsychid caddisflies and many other pollution-tolerant non-EPT organisms, and lacks any stonefly organisms. Based on our current knowledge of water quality conditions in the lower reaches of Roaring Brook, barely one mile above its confluence with the Lackawanna River, it is not contributing any improvement to the river’s conditions.
ACKNOWLEDGEMENTS
A project of this magnitude and duration is possible only with hundreds of hours of volunteer time aligned with the deep and sustaining belief it is a thing worth doing. We acknowledge and applaud those who have contributed through the years. Jack Byrne, of the Vermont River Watch Network, helped get the Lackawanna River Watch program started. John Gable and Mary Ruane were the early program coordinators; Karen Caparo, of the Pennsylvania Gas and Water Company, and Jay Clymer, of Marywood University, provided technical advice and support. Eunice Alexander and Kerry Gildea did the lion’s share of computerizing the River Watch data. Brian Oliveiri, James Palumbo and Libby Kuniegel assisted in verifiying macroinvertebrate identifications and counts. The Biology Department, University of Scranton, provided laboratory facilities and computer access for the River Watch program. A great corps of volunteers braved all kinds of weather conditions and river levels to collect the data, brought their samples back to the lab, and stayed to sort and identify the "bugs." They include Julie Albrecht, Beth Ames, Chris Arthur, Mark Brennan, Bill Brennan, Bill Burrell, Victor Capooci , Jerry Carpenter, Matt Carpenter, Sean Captain, Lynn Conrad, John Corkill, Anna Cummings, Steve Esser, Bill Feddock, Jennifer Gallo, John Gallo, Jim Gordon, Len Gorney, Pat Green, P. Grogan, Renee Gullone, Debbie Hetti, Hank Hewitt, Zach Jud, Vince Kadish, Adam Kaeser, Joe Keenan, J. Kelly, Kendell Kielan, Tony Konsavage, Gary Kwiecinski, Angela Lambert, Kerri Lasako, Mark Lesko, Scott Linde, Tom McClane, Bernie McGurl, Bob McHugh, John McIntyre, Kevin Nordberg, Michael Nordberg, Jeff Padden, Joe Patutka, Pete Pattavina, John Pehanich, Tim Phelan, Margaret Rempe, Andrew Parsons, Maggie Parsons, Bill Sabatella, Jeff Scott, Bill Shoener, Ed Shoener, Ed Shoener Jr., Tom Simpson, Harold Smith, Bruce Valentine, Kevin Viena, John Visci, Bill Waller, Mary Beth Walsh, Melinda Wolter, Mike Wysocki, Ted Zawistowski, and George Zeo. To all of these individuals, we express our deepest gratitude and our hope that this report proudly reflects the value of your contribution of time, interest and stewardship for the Lackawanna River – it is, after all, the result of your labor.
- 8 -
TABLES
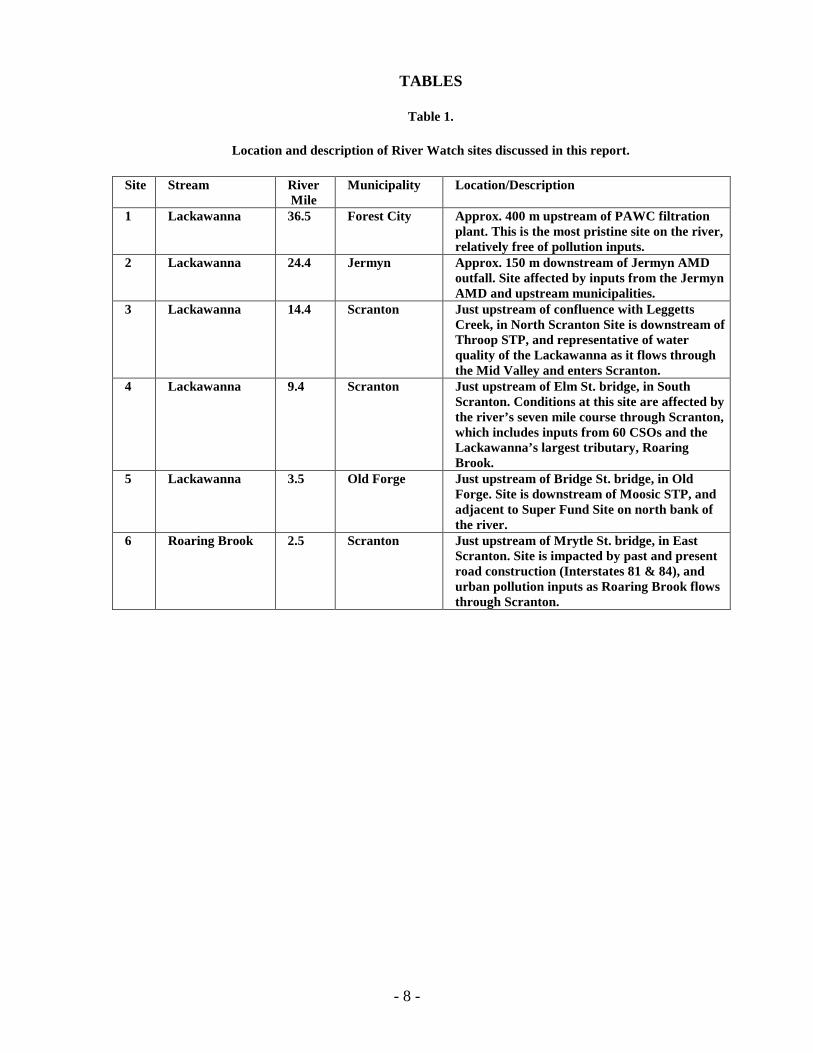
Table 1.
Location and description of River Watch sites discussed in this report.
Site Stream River Mile
Municipality Location/Description
1 Lackawanna 36.5 Forest City Approx. 400 m upstream of PAWC filtration plant. This is the most pristine site on the river, relatively free of pollution inputs.
2 Lackawanna 24.4 Jermyn Approx. 150 m downstream of Jermyn AMD outfall. Site affected by inputs from the Jermyn AMD and upstream municipalities.
3 Lackawanna 14.4 Scranton Just upstream of confluence with Leggetts Creek, in North Scranton Site is downstream of Throop STP, and representative of water quality of the Lackawanna as it flows through the Mid Valley and enters Scranton.
4 Lackawanna 9.4 Scranton Just upstream of Elm St. bridge, in South Scranton. Conditions at this site are affected by the river’s seven mile course through Scranton, which includes inputs from 60 CSOs and the Lackawanna’s largest tributary, Roaring Brook.
5 Lackawanna 3.5 Old Forge Just upstream of Bridge St. bridge, in Old Forge. Site is downstream of Moosic STP, and adjacent to Super Fund Site on north bank of the river.
6 Roaring Brook 2.5 Scranton Just upstream of Mrytle St. bridge, in East Scranton. Site is impacted by past and present road construction (Interstates 81 & 84), and urban pollution inputs as Roaring Brook flows through Scranton.
- 9 -
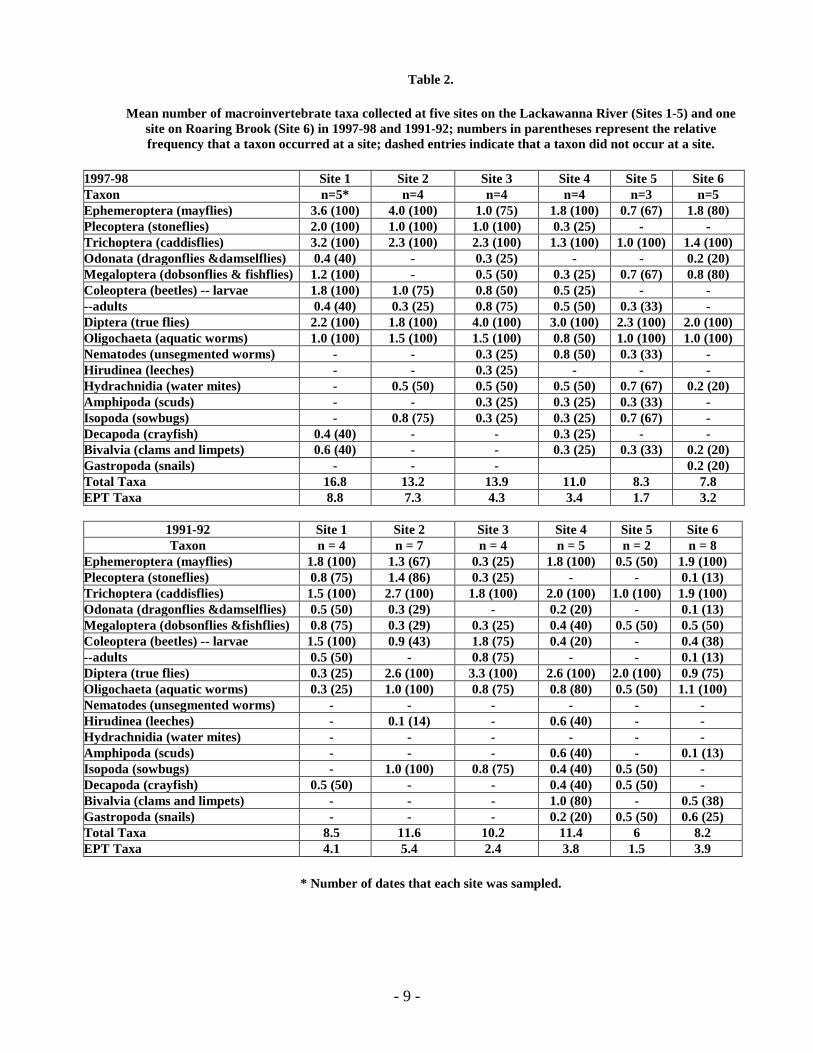
Table 2.
Mean number of macroinvertebrate taxa collected at five sites on the Lackawanna River (Sites 1-5) and one site on Roaring Brook (Site 6) in 1997-98 and 1991-92; numbers in parentheses represent the relative frequency that a taxon occurred at a site; dashed entries indicate that a taxon did not occur at a site.
1997-98 Site 1 Site 2 Site 3 Site 4 Site 5 Site 6 Taxon n=5* n=4 n=4 n=4 n=3 n=5 Ephemeroptera (mayflies) 3.6 (100) 4.0 (100) 1.0 (75) 1.8 (100) 0.7 (67) 1.8 (80) Plecoptera (stoneflies) 2.0 (100) 1.0 (100) 1.0 (100) 0.3 (25) - - Trichoptera (caddisflies) 3.2 (100) 2.3 (100) 2.3 (100) 1.3 (100) 1.0 (100) 1.4 (100) Odonata (dragonflies &damselflies) 0.4 (40) - 0.3 (25) - - 0.2 (20) Megaloptera (dobsonflies & fishflies) 1.2 (100) - 0.5 (50) 0.3 (25) 0.7 (67) 0.8 (80) Coleoptera (beetles) -- larvae 1.8 (100) 1.0 (75) 0.8 (50) 0.5 (25) - - --adults 0.4 (40) 0.3 (25) 0.8 (75) 0.5 (50) 0.3 (33) - Diptera (true flies) 2.2 (100) 1.8 (100) 4.0 (100) 3.0 (100) 2.3 (100) 2.0 (100) Oligochaeta (aquatic worms) 1.0 (100) 1.5 (100) 1.5 (100) 0.8 (50) 1.0 (100) 1.0 (100) Nematodes (unsegmented worms) - - 0.3 (25) 0.8 (50) 0.3 (33) - Hirudinea (leeches) - - 0.3 (25) - - - Hydrachnidia (water mites) - 0.5 (50) 0.5 (50) 0.5 (50) 0.7 (67) 0.2 (20) Amphipoda (scuds) - - 0.3 (25) 0.3 (25) 0.3 (33) - Isopoda (sowbugs) - 0.8 (75) 0.3 (25) 0.3 (25) 0.7 (67) - Decapoda (crayfish) 0.4 (40) - - 0.3 (25) - - Bivalvia (clams and limpets) 0.6 (40) - - 0.3 (25) 0.3 (33) 0.2 (20) Gastropoda (snails) - - - 0.2 (20) Total Taxa 16.8 13.2 13.9 11.0 8.3 7.8 EPT Taxa 8.8 7.3 4.3 3.4 1.7 3.2
1991-92 Site 1 Site 2 Site 3 Site 4 Site 5 Site 6 Taxon n = 4 n = 7 n = 4 n = 5 n = 2 n = 8
Ephemeroptera (mayflies) 1.8 (100) 1.3 (67) 0.3 (25) 1.8 (100) 0.5 (50) 1.9 (100) Plecoptera (stoneflies) 0.8 (75) 1.4 (86) 0.3 (25) - - 0.1 (13) Trichoptera (caddisflies) 1.5 (100) 2.7 (100) 1.8 (100) 2.0 (100) 1.0 (100) 1.9 (100) Odonata (dragonflies &damselflies) 0.5 (50) 0.3 (29) - 0.2 (20) - 0.1 (13) Megaloptera (dobsonflies &fishflies) 0.8 (75) 0.3 (29) 0.3 (25) 0.4 (40) 0.5 (50) 0.5 (50) Coleoptera (beetles) -- larvae 1.5 (100) 0.9 (43) 1.8 (75) 0.4 (20) - 0.4 (38) --adults 0.5 (50) - 0.8 (75) - - 0.1 (13) Diptera (true flies) 0.3 (25) 2.6 (100) 3.3 (100) 2.6 (100) 2.0 (100) 0.9 (75) Oligochaeta (aquatic worms) 0.3 (25) 1.0 (100) 0.8 (75) 0.8 (80) 0.5 (50) 1.1 (100) Nematodes (unsegmented worms) - - - - - - Hirudinea (leeches) - 0.1 (14) - 0.6 (40) - - Hydrachnidia (water mites) - - - - - - Amphipoda (scuds) - - - 0.6 (40) - 0.1 (13) Isopoda (sowbugs) - 1.0 (100) 0.8 (75) 0.4 (40) 0.5 (50) - Decapoda (crayfish) 0.5 (50) - - 0.4 (40) 0.5 (50) - Bivalvia (clams and limpets) - - - 1.0 (80) - 0.5 (38) Gastropoda (snails) - - - 0.2 (20) 0.5 (50) 0.6 (25) Total Taxa 8.5 11.6 10.2 11.4 6 8.2 EPT Taxa 4.1 5.4 2.4 3.8 1.5 3.9
* Number of dates that each site was sampled.
- 10 -
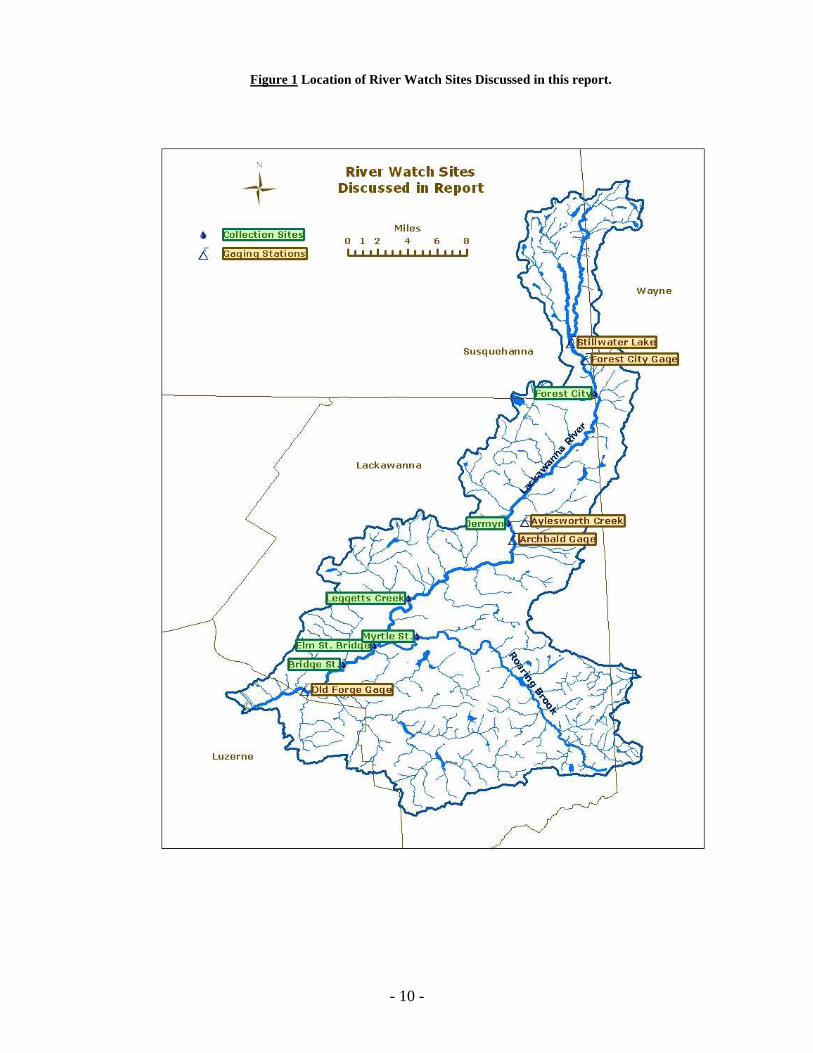
Figure 1 Location of River Watch Sites Discussed in this report.
- 11 -
Figure 2 Mean numbers of EPT taxa and non-EPT taxa in the Lackawanna River (Sites 1-5) and Roaring
Brook (Site 6) in 1997-98
16.8
13.213.9
10.5
8.37.8
8.8
7.3
4.33.4
1.7
3.2
0
2
4
6
8
10
12
14
16
18
1 2 3 4 5 6Sites
Total EPT
Figure 3 Mean numbers of EPT taxa and non-EPT taxa in the Lackawanna River (Sites 1-5) and Roaring Brook (Site 6) 1991-92
8.5
11.6
10.2
11.4
6.0
8.3
4.1
5.4
2.4
3.8
1.5
3.9
0
2
4
6
8
10
12
1 2 3 4 5 6Sites
Total EPT
- 12 -
Figure 4 Percentage of all organisms comprised of hydropsychid and non-hydropsychid EPT taxa in 1997-98
71.667.5
50.4
66.3
56.0
64.0
0
10
20
30
40
50
60
70
80
1 2 3 4 5 6Sites
Figure 5 Percentage of all organisms comprised of hydropsychid and non-hydrochid EPT taxa in 1991-92
50.846.9
57.5
50.4
56.5
65.5
0
10
20
30
40
50
60
70
1 2 3 4 5 6Sites
- 13 -
APPENDIX A
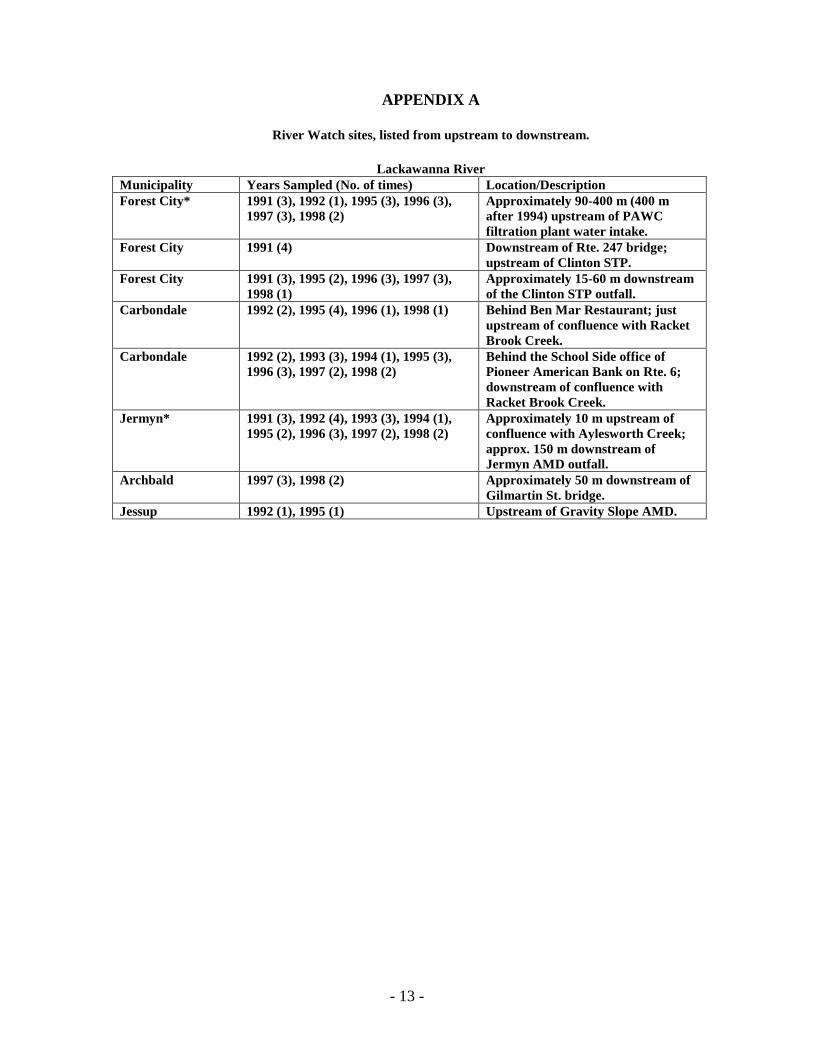
River Watch sites, listed from upstream to downstream.
Lackawanna River Municipality Years Sampled (No. of times) Location/Description Forest City* 1991 (3), 1992 (1), 1995 (3), 1996 (3),
1997 (3), 1998 (2) Approximately 90-400 m (400 m after 1994) upstream of PAWC filtration plant water intake.
Forest City 1991 (4) Downstream of Rte. 247 bridge; upstream of Clinton STP.
Forest City 1991 (3), 1995 (2), 1996 (3), 1997 (3), 1998 (1)
Approximately 15-60 m downstream of the Clinton STP outfall.
Carbondale 1992 (2), 1995 (4), 1996 (1), 1998 (1) Behind Ben Mar Restaurant; just upstream of confluence with Racket Brook Creek.
Carbondale 1992 (2), 1993 (3), 1994 (1), 1995 (3), 1996 (3), 1997 (2), 1998 (2)
Behind the School Side office of Pioneer American Bank on Rte. 6; downstream of confluence with Racket Brook Creek.
Jermyn* 1991 (3), 1992 (4), 1993 (3), 1994 (1), 1995 (2), 1996 (3), 1997 (2), 1998 (2)
Approximately 10 m upstream of confluence with Aylesworth Creek; approx. 150 m downstream of Jermyn AMD outfall.
Archbald 1997 (3), 1998 (2) Approximately 50 m downstream of Gilmartin St. bridge.
Jessup 1992 (1), 1995 (1) Upstream of Gravity Slope AMD.
- 14 -
Lackawanna River Municipality Years Sampled (No. of times) Location/Description Jessup 1994 (2) Downstream of Gravity Slope AMD;
dead end of Basalyga & High Sts.; approx. 450 m upstream of Constitution Ave. bridge.
Peckville 1997 (1), 1998 (3) Approximately 250 m downstream of walking bridge, at the downstream end of Mellow Park.
Dickson City 1995 (1), 1996 (1), 1997 (1) Approximately 70 m upstream of Boulevard Ave. bridge.
Scranton* 1991 (2), 1992 (2), 1993 (3), 1994 (2), 1995 (4), 1996 (2), 1997 (2), 1998 (2)
Just upstream of confluence with Leggetts Creek, in North Scranton.
Scranton 1991 (2), 1992 (1), 1993 (3), 1994 (1), 1996 (1), 1997 (1)
At the confluence with Leggetts Creek.
Scranton 1991 (3), 1993 (3), 1995 (3), 1997 (1) Approximately 20 m downstream of confluence with Leggetts Creek.
Scranton 1991 (4), 1992 (4) Riverside Dr. in Plot Section; upstream of Sanderson Ave. bridge, and off parking lot at end of Canton Place.
Scranton 1991 (1) Downstream of D & H Railroad bridge between Plot Section and Green Ridge.
Scranton 1991 (3), 1992 (4), 1993 (4), 1994 (1), 1995 (4), 1996 (3), 1997 (1)
Approximately 90 m downstream of West Market St. bridge.
Scranton* 1991 (3), 1992 (3), 1993 (3), 1994 (2), 1995 (3), 1996 (2), 1997 (3), 1998 (1)
Just upstream or downstream of Elm St. bridge. Behind South Side Shopping Center; downstream of Roaring Brook.
Taylor 1993 (1), 1995 (1), 1996 (2), 1997 (3) Just upstream of, or under Davis St. bridge.
Taylor 1991 (2), 1995 (2), 1996 (1) From just under the PA Turnpike bridge to 100 m upstream.
Old Forge* 1991 (1), 1995 (4), 1996 (3), 1997 (2), 1998 (2)
Downstream of confluence with Spring Brook; next to PCB Superfund Site; along Lonesome Rd.
Roaring Brook
Moscow 1992 (1) Near Rita's Sports Store. Elmhurst 1995 (1) At Chicko's. Roaring Br. Twp. 1992 (3), 1993 (2) Between Elmhurst and Dunmore,
just off Rte. 435. Dunmore 1992 (4), 1993 (1), 1995 (1) Downstream of No. 7 Dam. Scranton* 1991 (4), 1992 (4), 1993 (3), 1995 (2), 1996
(3), 1997 (3), 1998 (2) Approximately 30 m upstream of Myrtle St. bridge. Along Richter Ave. and near E. Scranton Little League fields.
Aylesworth Creek
Jermyn 1991 (3), 1995 (1) Approximately 20 m upstream of confluence with the Lackawanna River.
* Sites discussed in this report.


![Threshold Responses of Macroinvertebrate Communities to ... · The Guayas River basin consists of two large tributaries: the Daule River and the Babahoyo River [14]. The two rivers](https://img.pdfslide.us/doc/110x75/5f96e32d0838c5545b4da96f/threshold-responses-of-macroinvertebrate-communities-to-the-guayas-river-basin.jpg)