Embed Size (px)
Citation preview
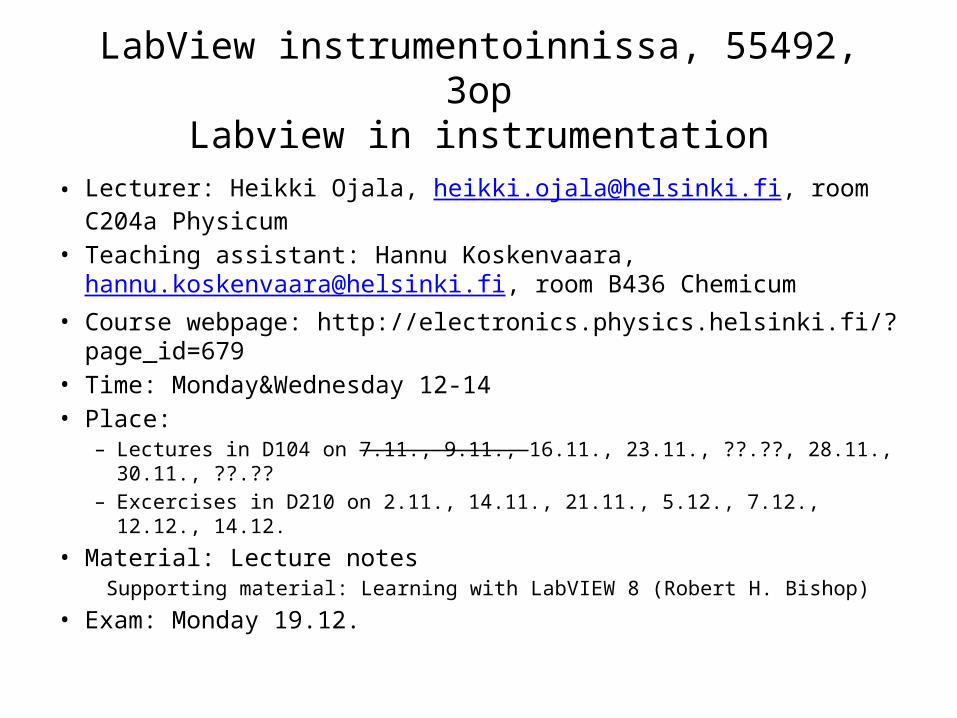
LabView instrumentoinnissa, 55492, 3opLabview in instrumentation
• Lecturer: Heikki Ojala, [email protected], room C204a Physicum
• Teaching assistant: Hannu Koskenvaara, [email protected], room B436 Chemicum
• Course webpage: http://electronics.physics.helsinki.fi/?page_id=679• Time: Monday&Wednesday 12-14• Place:
– Lectures in D104 on 7.11., 9.11., 16.11., 23.11., ??.??, 28.11., 30.11., ??.??– Excercises in D210 on 2.11., 14.11., 21.11., 5.12., 7.12., 12.12., 14.12.
• Material: Lecture notes Supporting material: Learning with LabVIEW 8 (Robert H. Bishop)
• Exam: Monday 19.12.
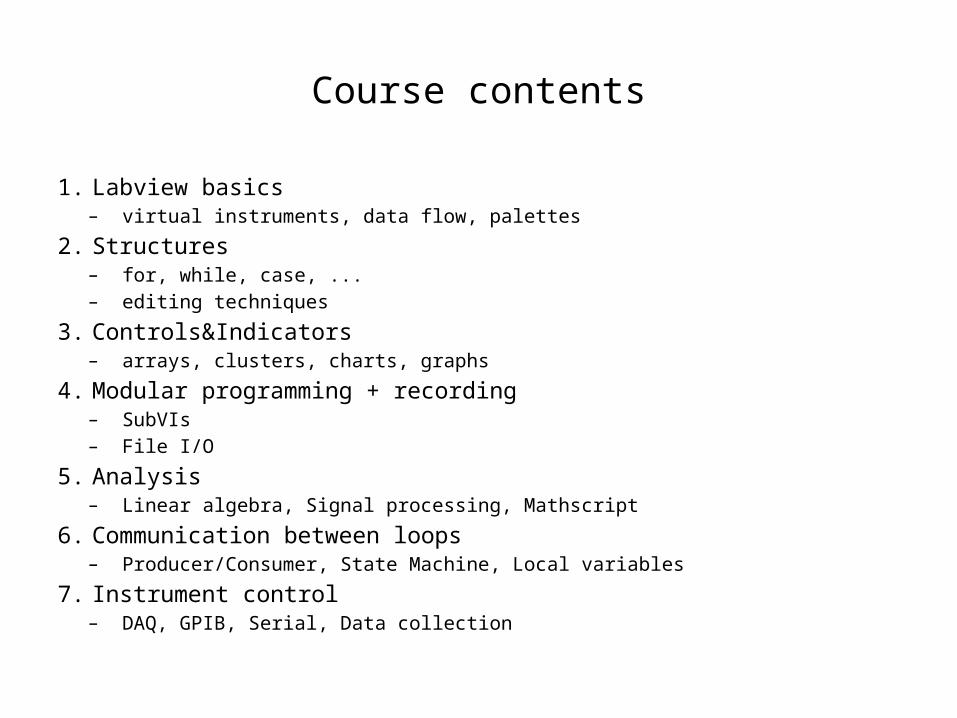
Course contents
1. Labview basics– virtual instruments, data flow, palettes
2. Structures– for, while, case, ...– editing techniques
3. Controls&Indicators– arrays, clusters, charts, graphs
4. Modular programming + recording– SubVIs– File I/O
5. Analysis– Linear algebra, Signal processing, Mathscript
6. Communication between loops– Producer/Consumer, State Machine, Local variables
7. Instrument control– DAQ, GPIB, Serial, Data collection
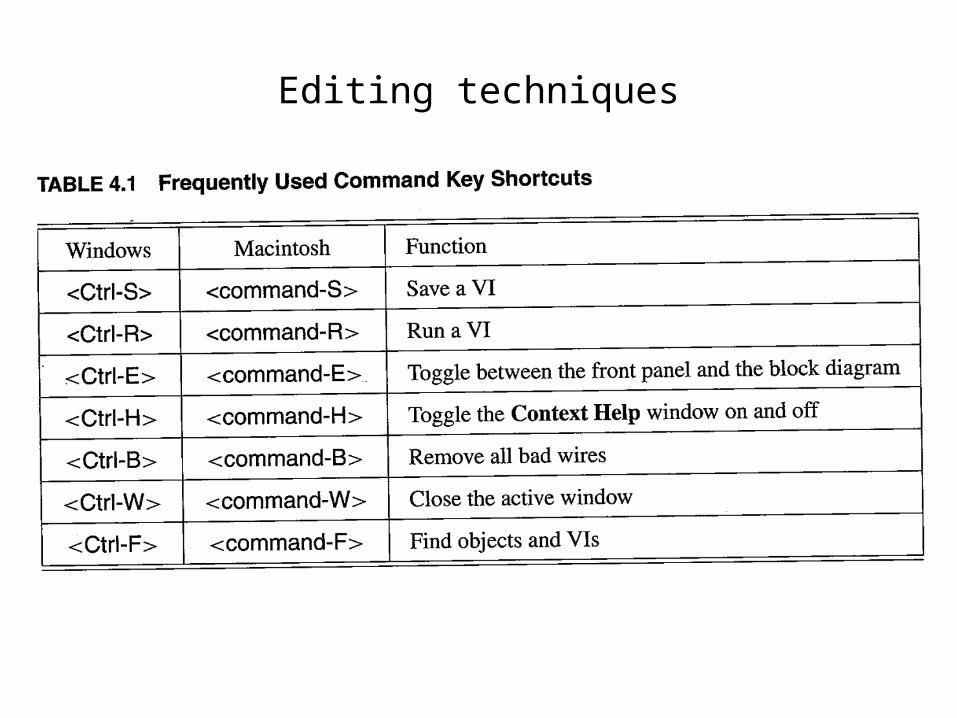
Editing techniques
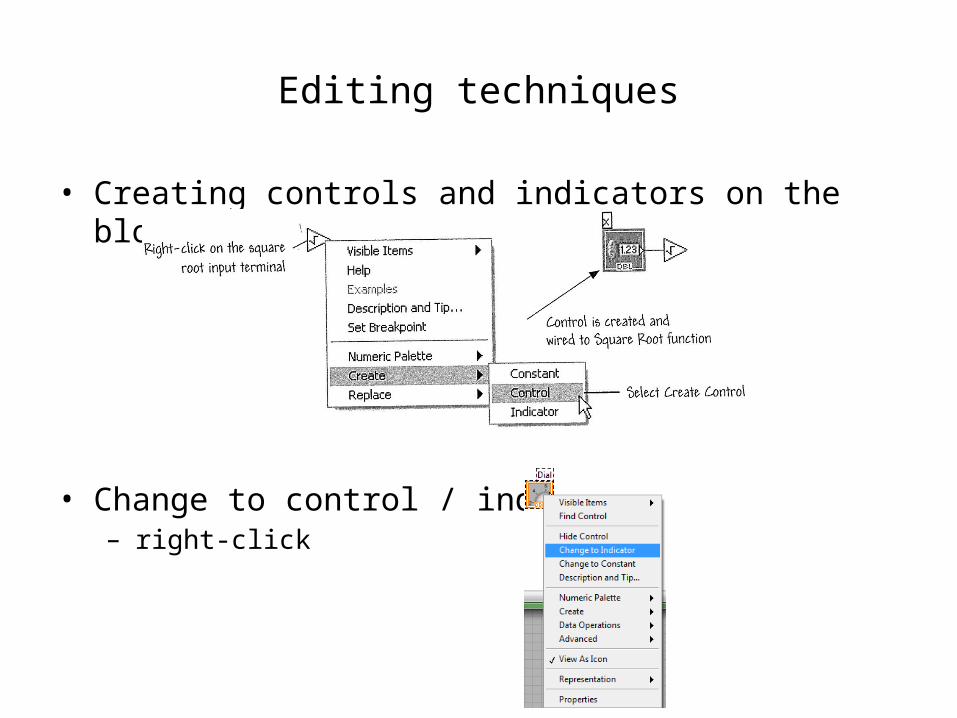
• Creating controls and indicators on the block diagram
• Change to control / indicator– right-click
Editing techniques
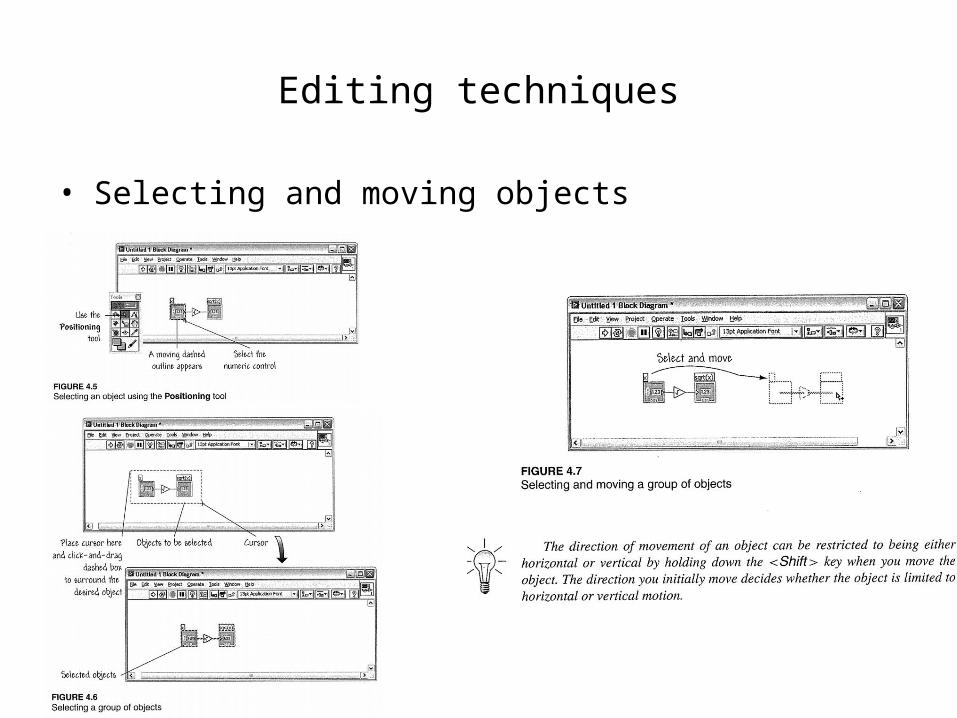
• Selecting and moving objects
Editing techniques
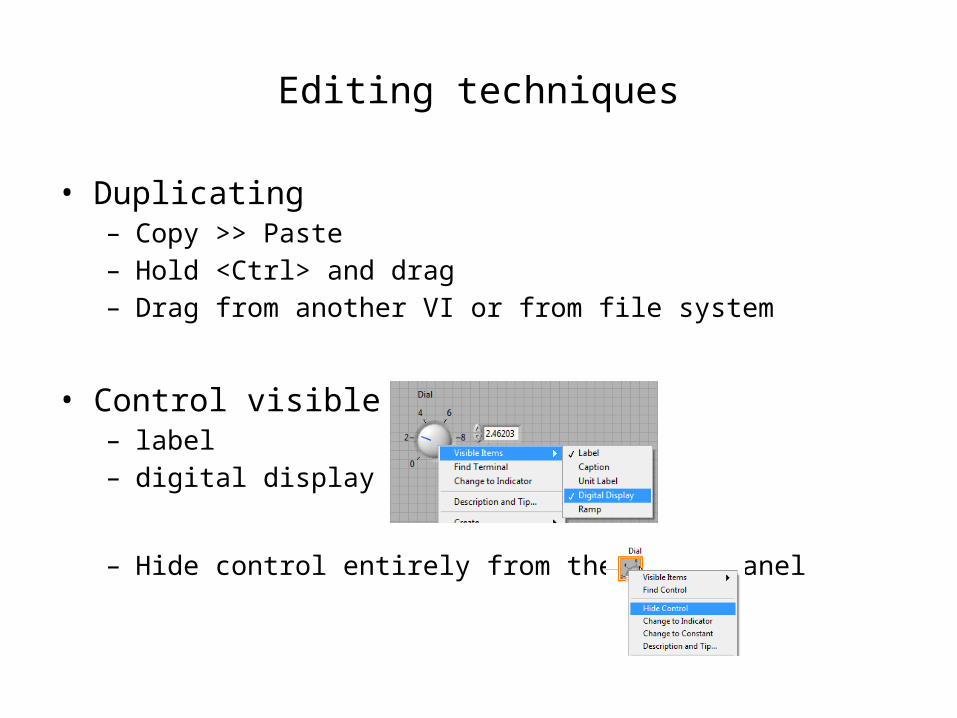
• Duplicating– Copy >> Paste– Hold <Ctrl> and drag– Drag from another VI or from file system
• Control visible items– label– digital display
– Hide control entirely from the front panel

Editing techniques
• Resize front panel objects– pull from resizing handles
• Labeling tool– create free labels or edit existing ones
• Change text font, style, and size
Editing techniques
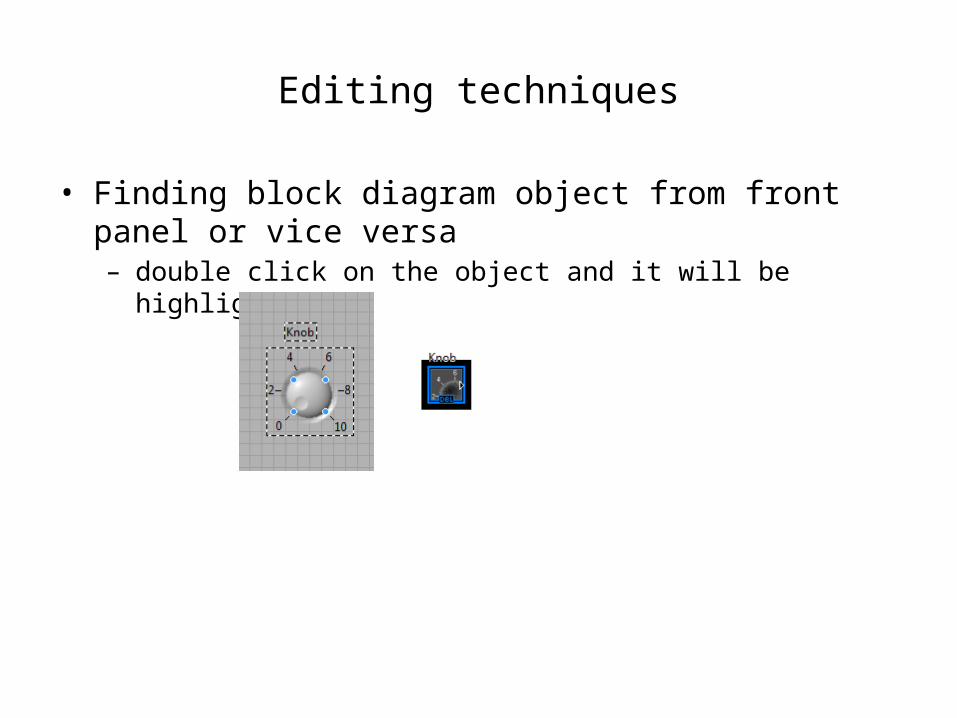
• Finding block diagram object from front panel or vice versa– double click on the object and it will be highlighted
Editing techniques
Editing techniques
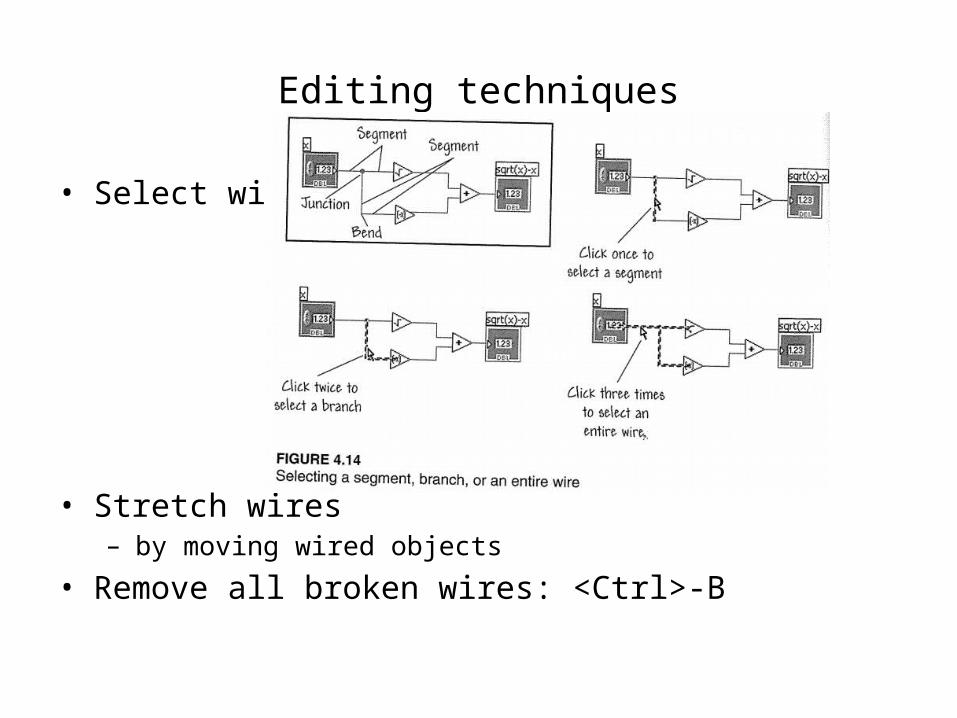
• Select wires
• Stretch wires– by moving wired objects
• Remove all broken wires: <Ctrl>-B
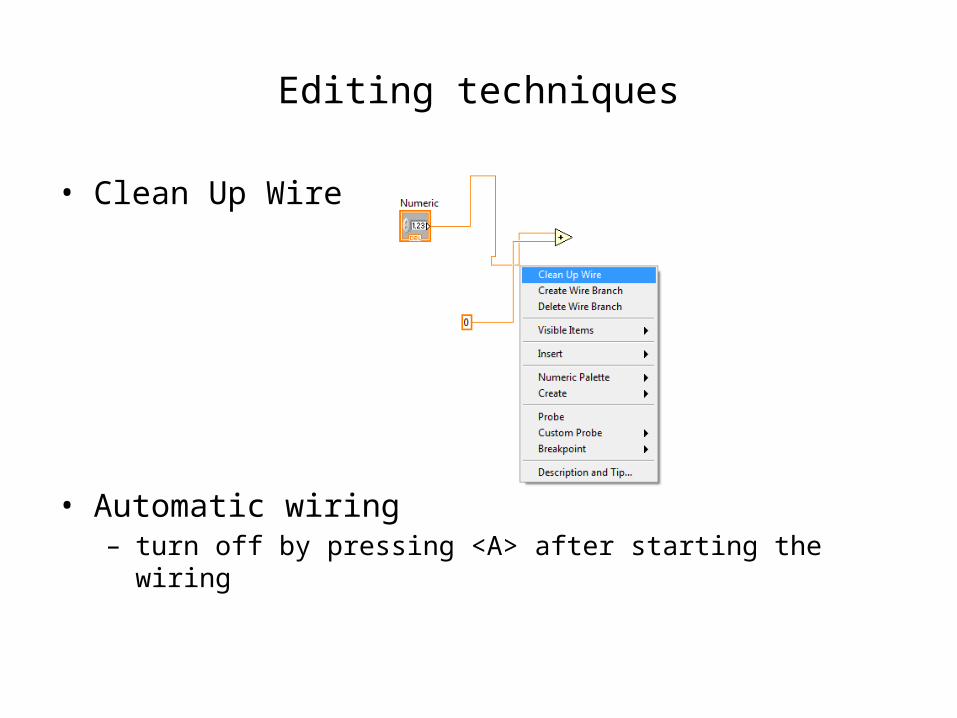
Editing techniques
• Clean Up Wire
• Automatic wiring– turn off by pressing <A> after starting the wiring
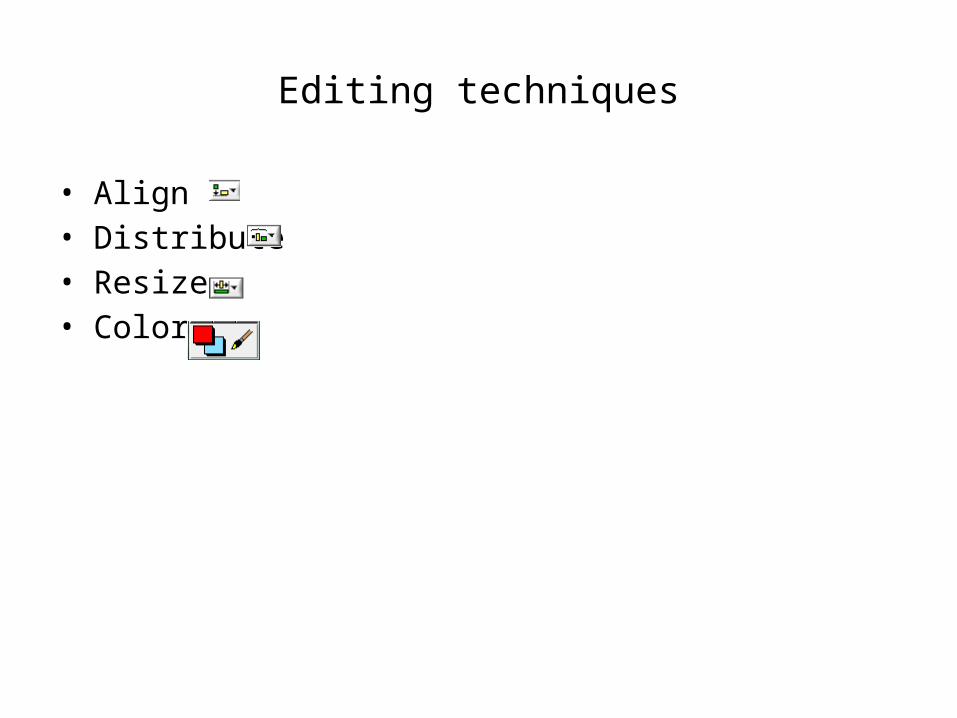
Editing techniques
• Align• Distribute• Resize• Color
Editing techniques
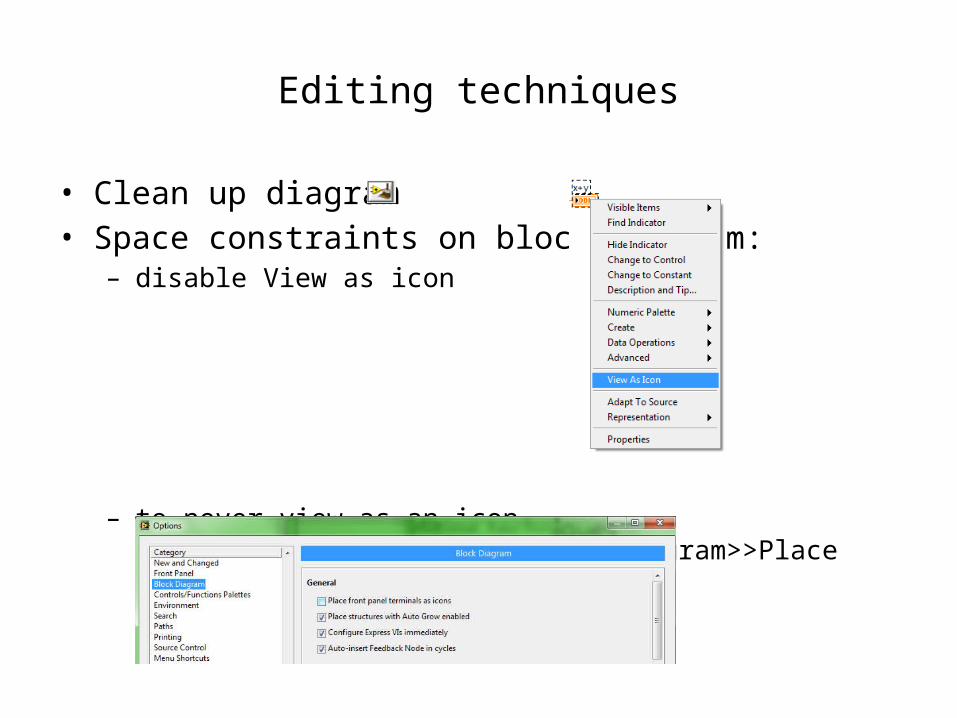
• Clean up diagram• Space constraints on block diagram:
– disable View as icon
– to never view as an icon, uncheck:Tools>>Options>>Block Diagram>>Place front panel terminals as icons
Editing techniques
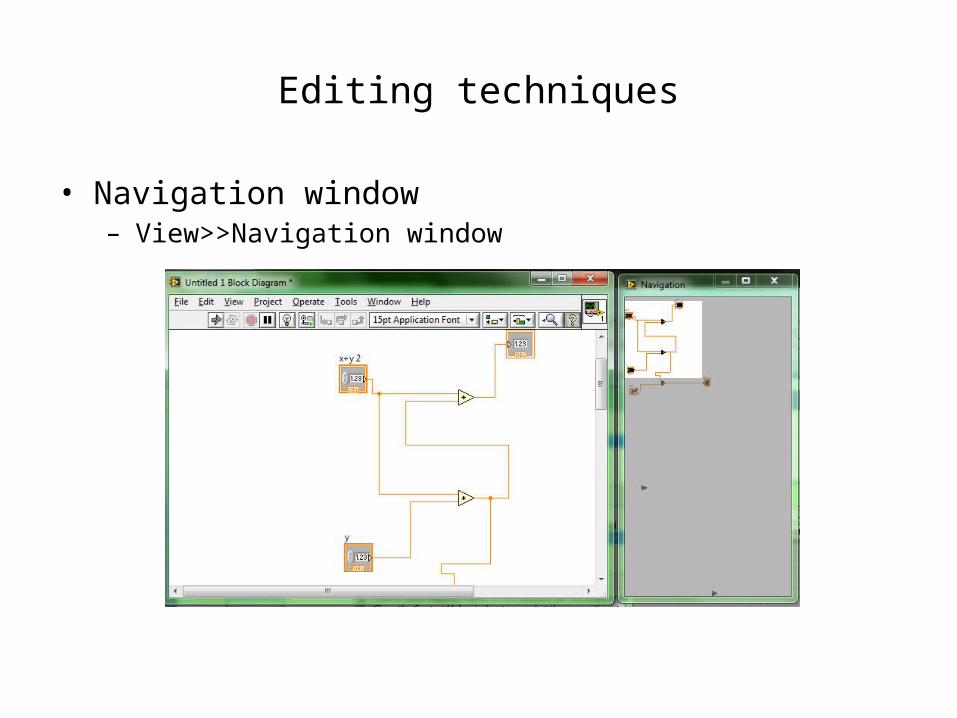
• Navigation window– View>>Navigation window
Debugging
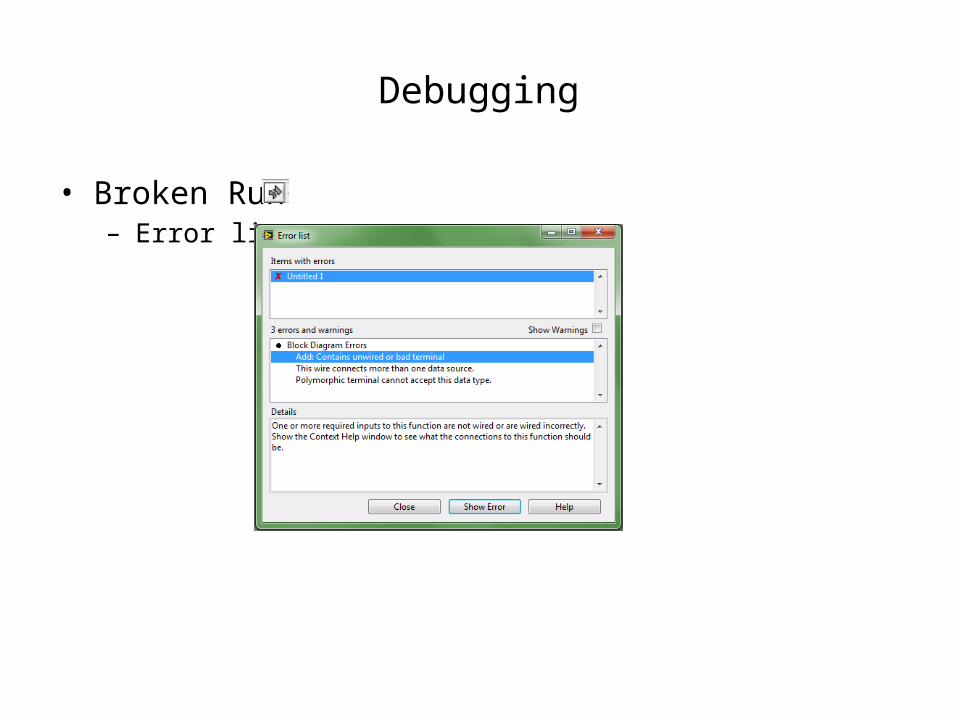
• Broken Run– Error list
Debugging Techniques
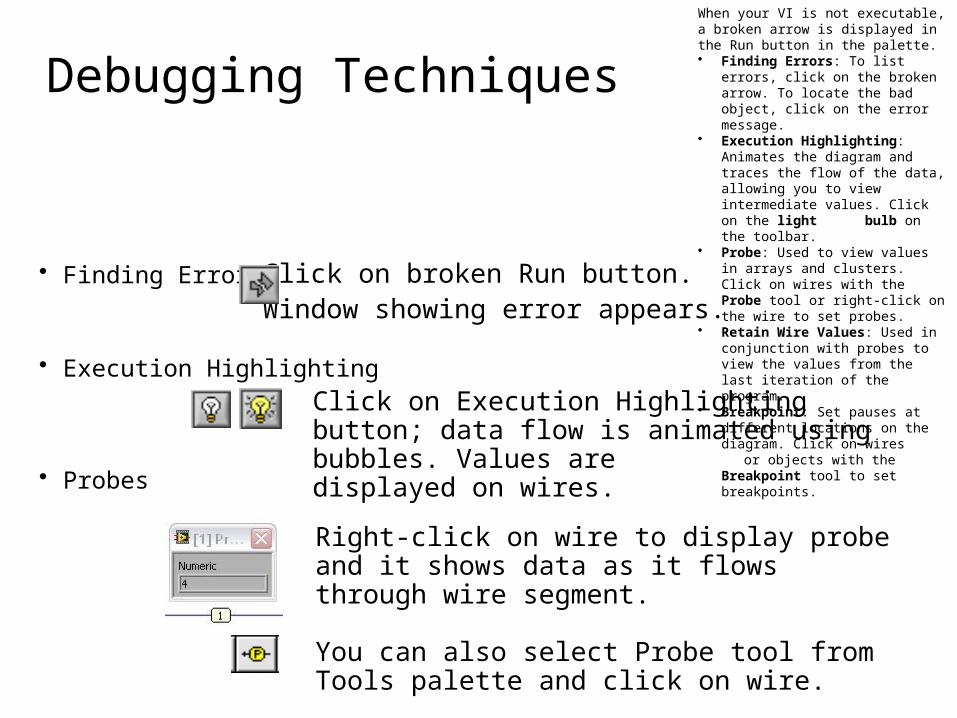
• Finding Errors
• Execution Highlighting
• Probes
Click on broken Run button.Window showing error appears.
Click on Execution Highlighting button; data flow is animated using bubbles. Values are displayed on wires.
Right-click on wire to display probe and it shows data as it flows through wire segment.
You can also select Probe tool from Tools palette and click on wire.
When your VI is not executable, a broken arrow is displayed in the Run button in the palette.• Finding Errors: To list errors, click on
the broken arrow. To locate the bad object, click on the error message.
• Execution Highlighting: Animates the diagram and traces the flow of the data, allowing you to view intermediate values. Click on the light bulb on the toolbar.
• Probe: Used to view values in arrays and clusters. Click on wires with the Probe tool or right-click on the wire to set probes.
• Retain Wire Values: Used in conjunction with probes to view the values from the last iteration of the program.
• Breakpoint: Set pauses at different locations on the diagram. Click on wires
or objects with the Breakpoint tool to set breakpoints.
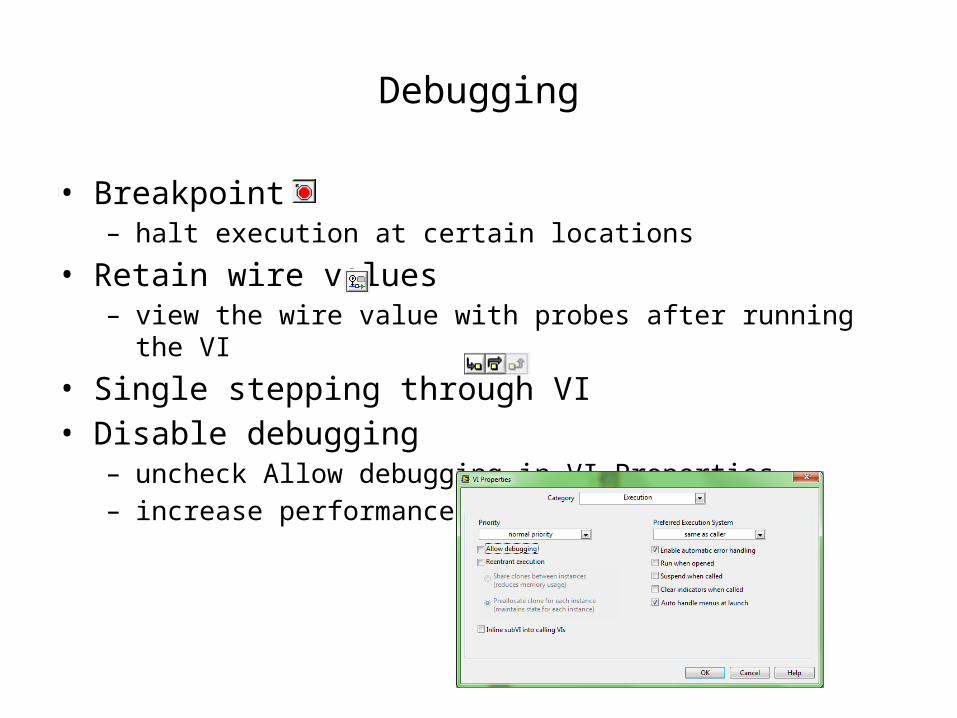
Debugging
• Breakpoint– halt execution at certain locations
• Retain wire values– view the wire value with probes after running the VI
• Single stepping through VI• Disable debugging
– uncheck Allow debugging in VI Properties– increase performance 1-2%
Structures
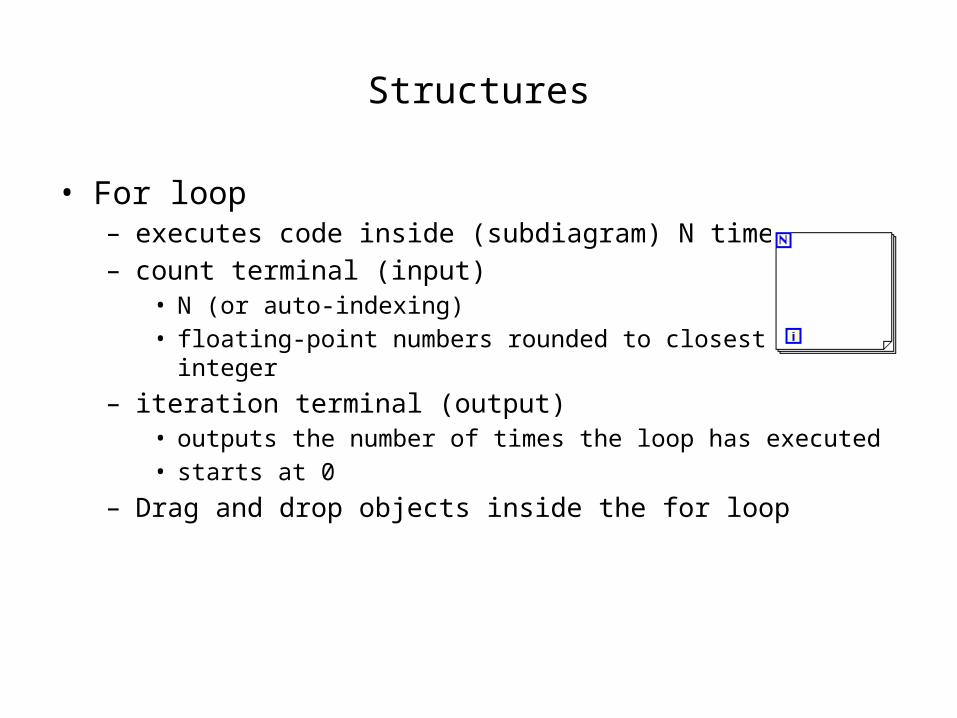
• For loop– executes code inside (subdiagram) N times– count terminal (input)
• N (or auto-indexing)• floating-point numbers rounded to closest even integer
– iteration terminal (output)• outputs the number of times the loop has executed• starts at 0
– Drag and drop objects inside the for loop
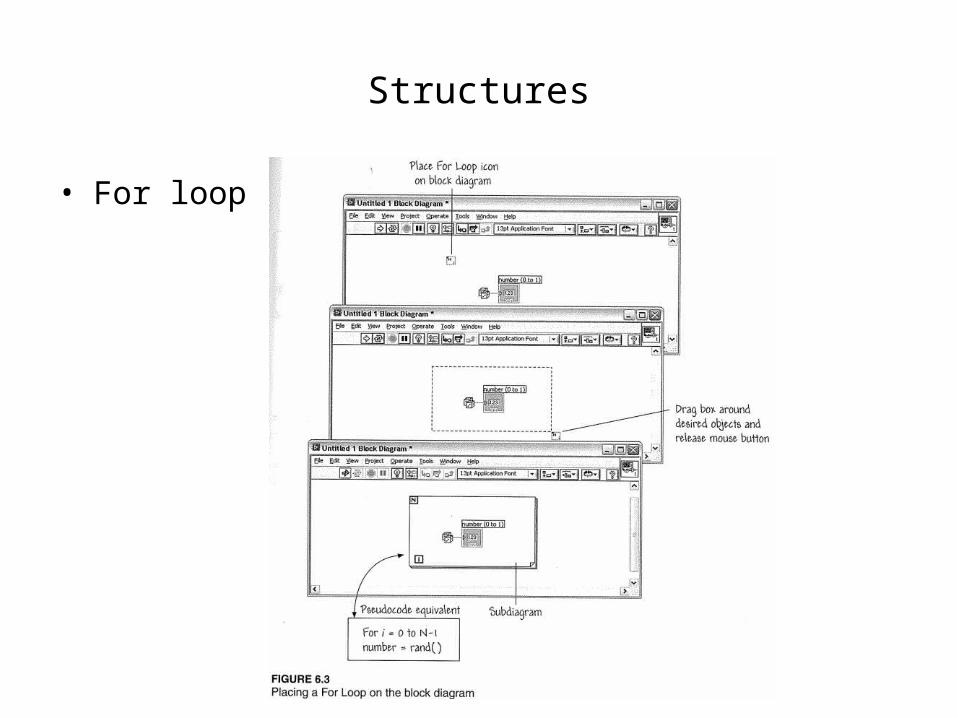
Structures
• For loop
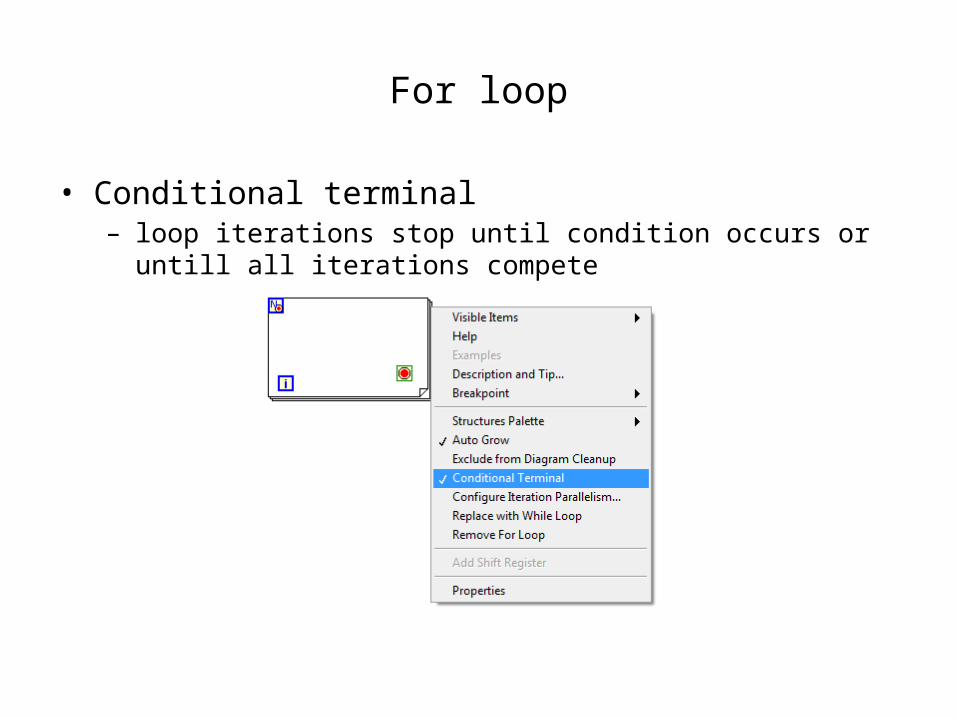
For loop
• Conditional terminal– loop iterations stop until condition occurs or untill all iterations
compete
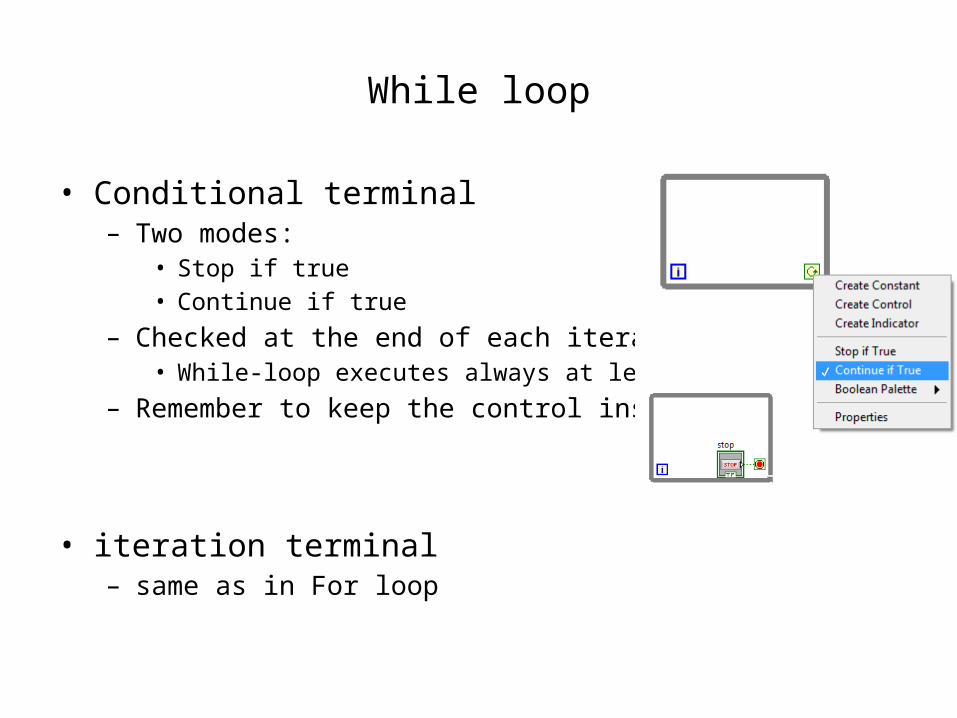
While loop
• Conditional terminal– Two modes:
• Stop if true• Continue if true
– Checked at the end of each iteration• While-loop executes always at least once
– Remember to keep the control inside the loop
• iteration terminal– same as in For loop
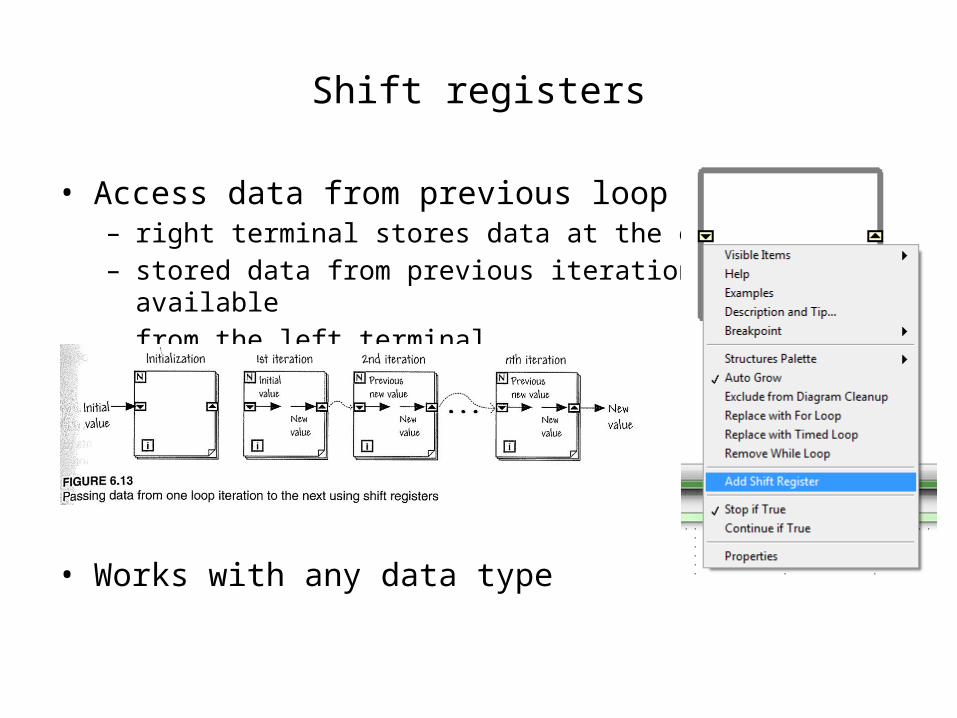
Shift registers
• Access data from previous loop iterations– right terminal stores data at the end of loop– stored data from previous iteration is available
from the left terminal
• Works with any data type
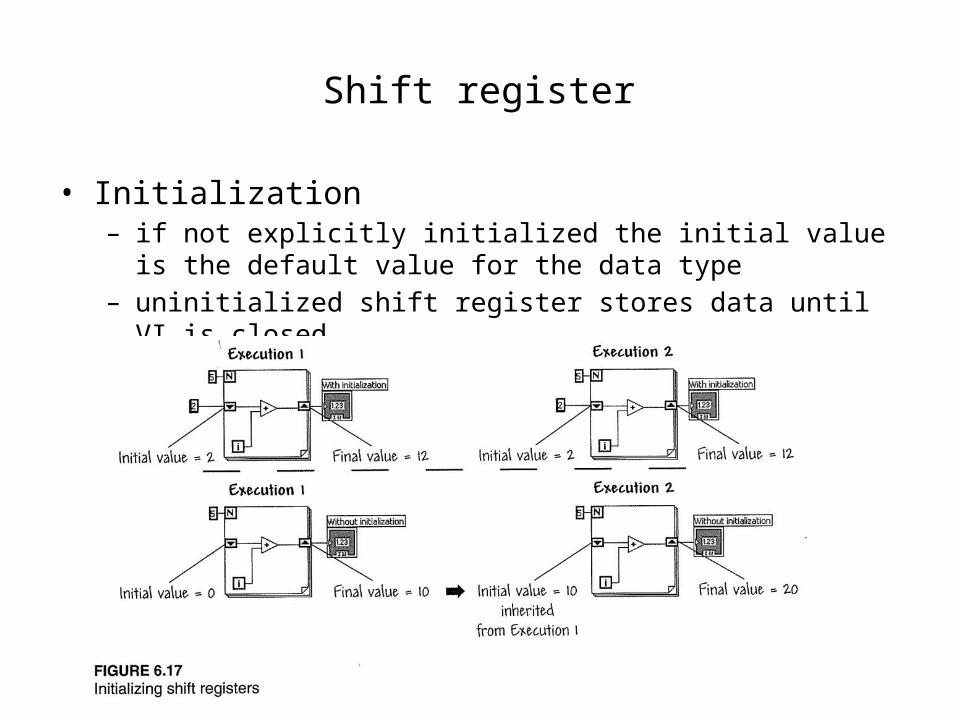
Shift register
• Initialization– if not explicitly initialized the initial value is the default value for the
data type– uninitialized shift register stores data until VI is closed
Shift register
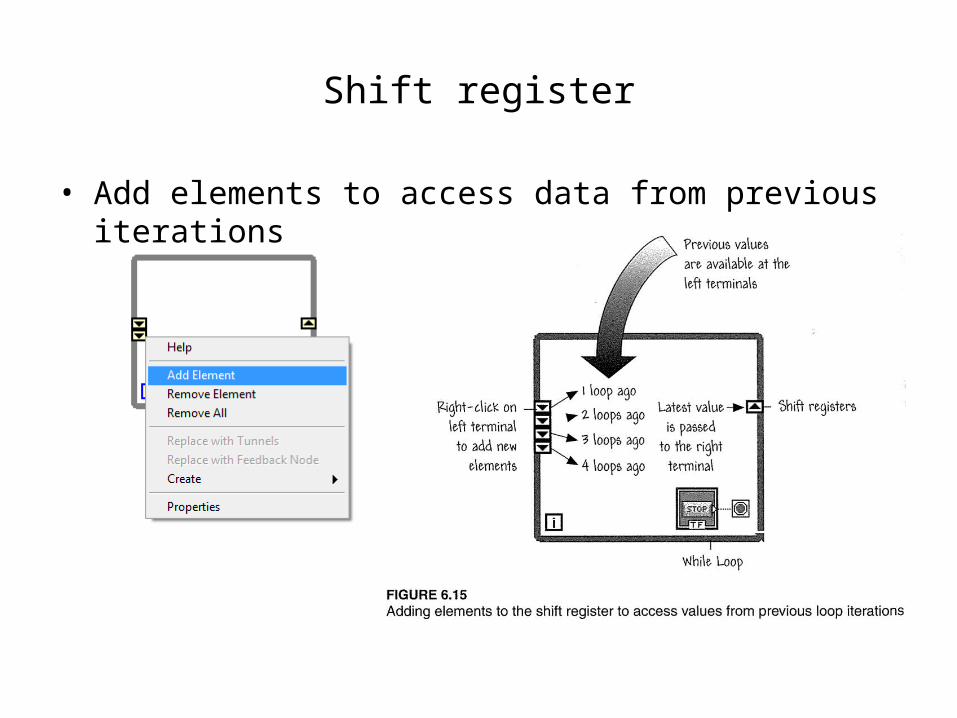
• Add elements to access data from previous iterations
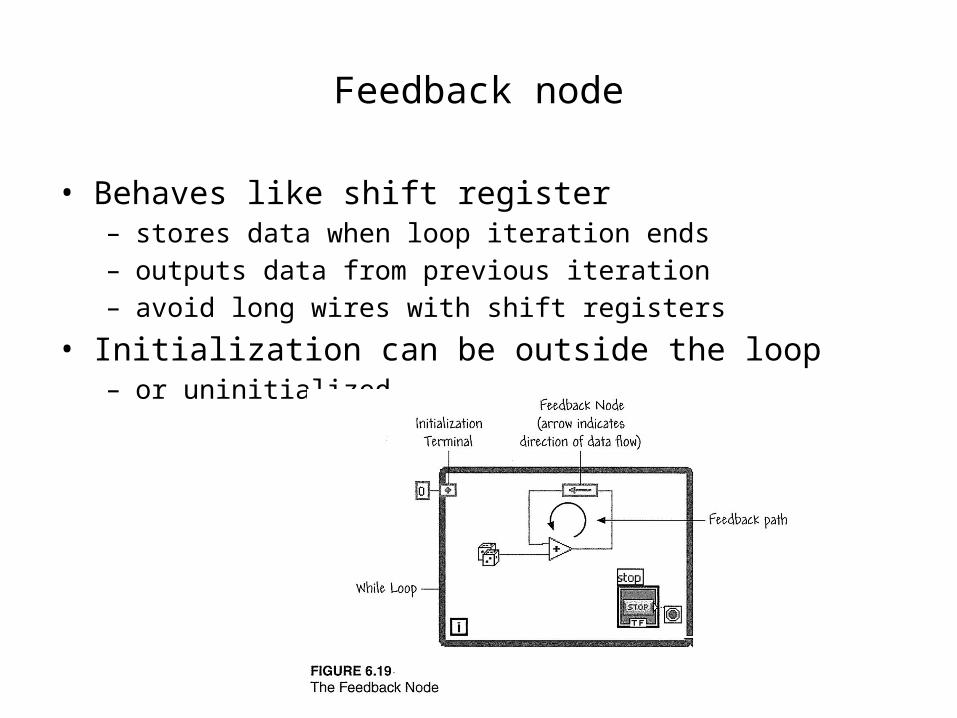
Feedback node
• Behaves like shift register– stores data when loop iteration ends– outputs data from previous iteration– avoid long wires with shift registers
• Initialization can be outside the loop– or uninitialized
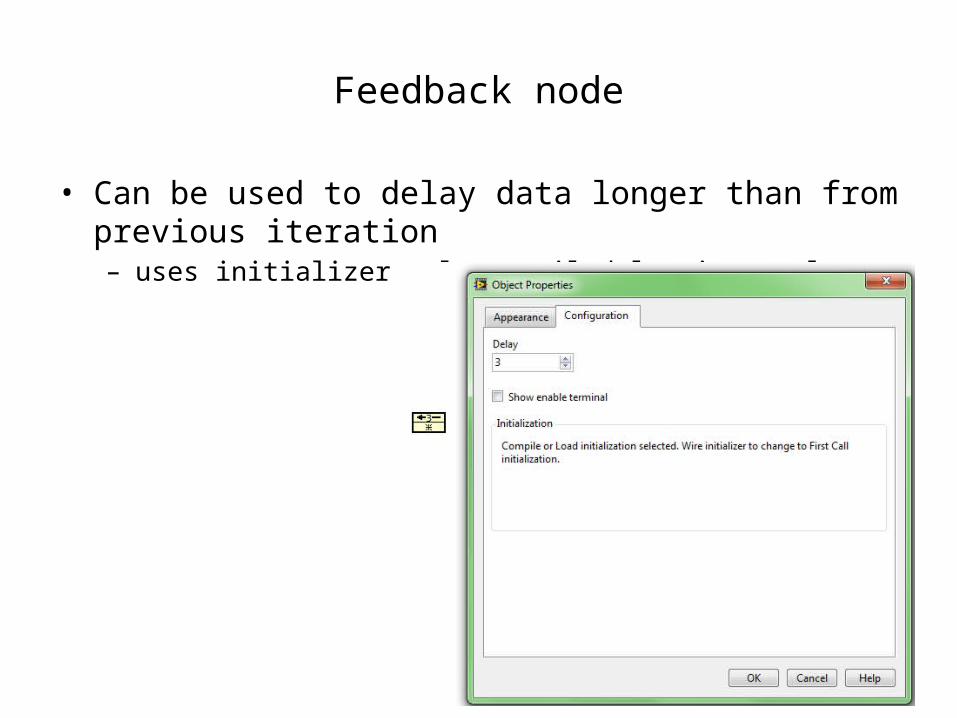
Feedback node
• Can be used to delay data longer than from previous iteration– uses initializer value until delay is complete
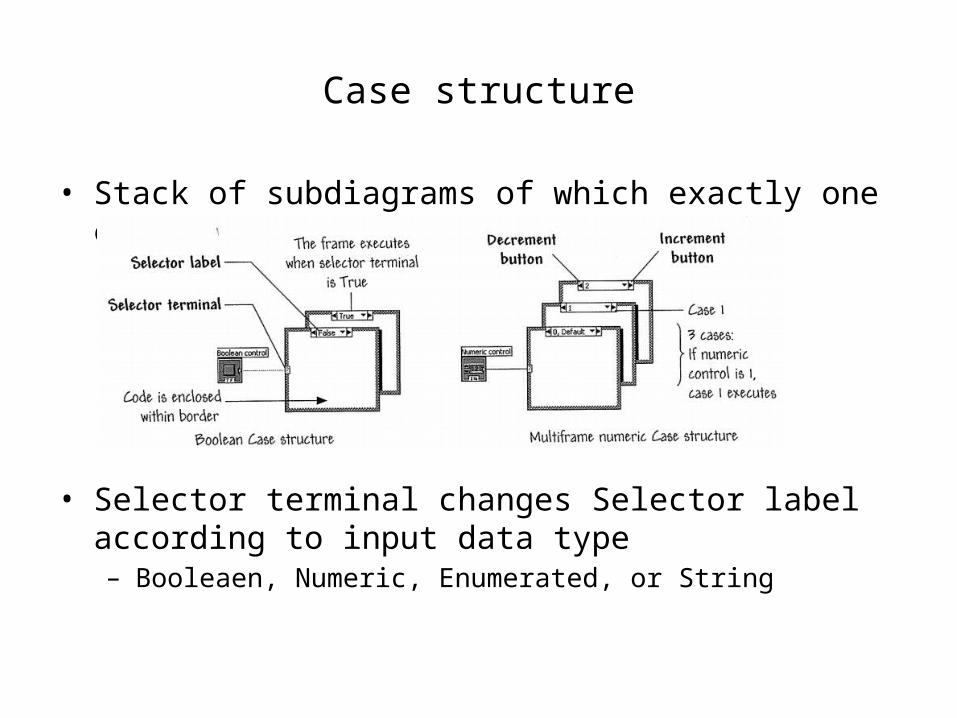
Case structure
• Stack of subdiagrams of which exactly one excecutes
• Selector terminal changes Selector label according to input data type– Booleaen, Numeric, Enumerated, or String
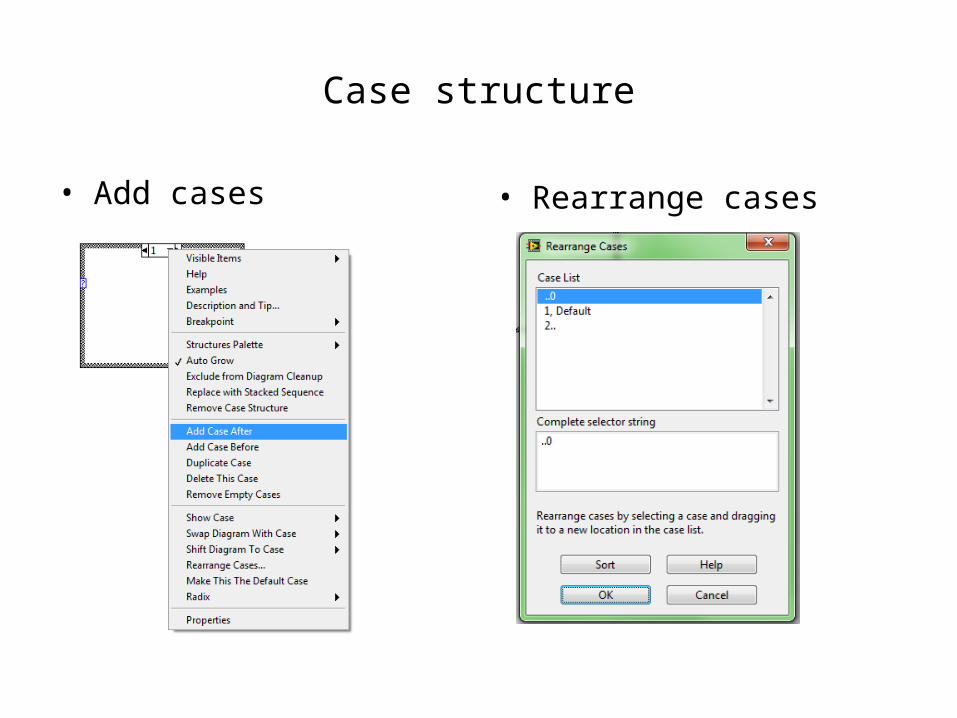
Case structure
• Add cases • Rearrange cases
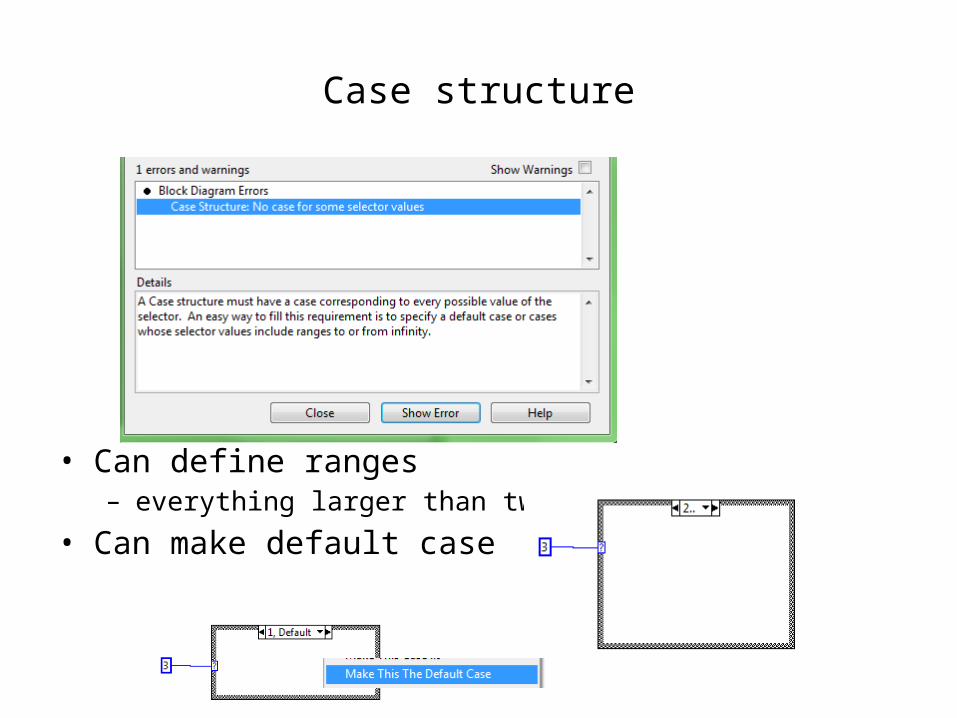
Case structure
• Can define ranges– everything larger than two: 2..
• Can make default case
Case structure
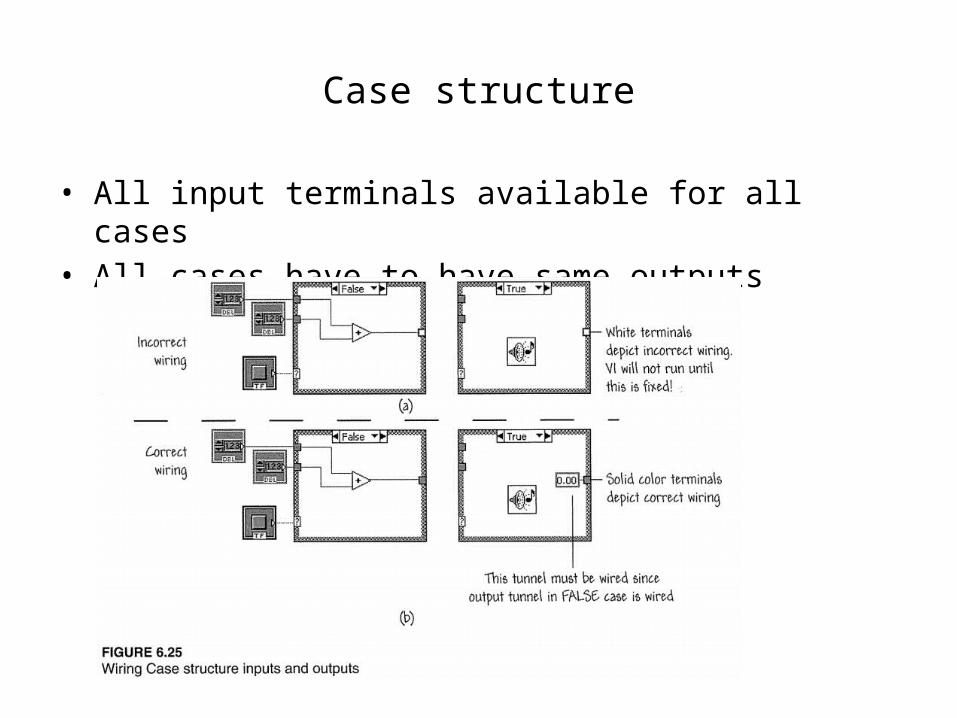
• All input terminals available for all cases• All cases have to have same outputs
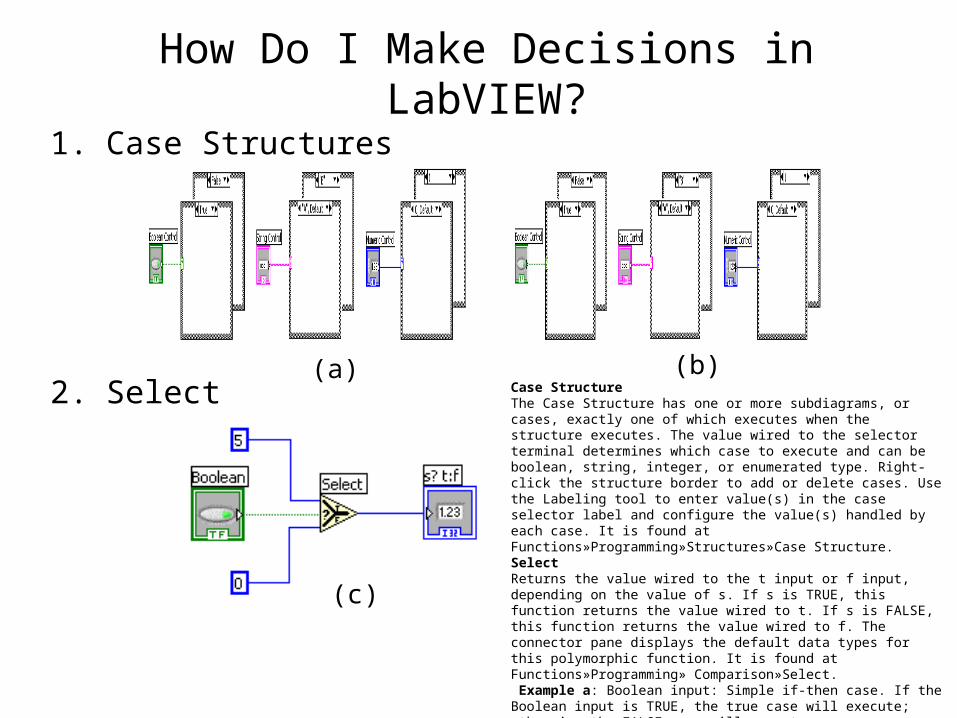
How Do I Make Decisions in LabVIEW?1. Case Structures
2. Select(a) (b)
(c)
Case StructureThe Case Structure has one or more subdiagrams, or cases, exactly one of which executes when the structure executes. The value wired to the selector terminal determines which case to execute and can be boolean, string, integer, or enumerated type. Right-click the structure border to add or delete cases. Use the Labeling tool to enter value(s) in the case selector label and configure the value(s) handled by each case. It is found at Functions»Programming»Structures»Case Structure.Select Returns the value wired to the t input or f input, depending on the value of s. If s is TRUE, this function returns the value wired to t. If s is FALSE, this function returns the value wired to f. The connector pane displays the default data types for this polymorphic function. It is found at Functions»Programming» Comparison»Select. Example a: Boolean input: Simple if-then case. If the Boolean input is TRUE, the true case will execute; otherwise the FALSE case will execute. Example b: Numeric input. The input value determines which box to execute. If out of range of the cases, LabVIEW will choose the default case. Example c: When the Boolean passes a TRUE value to the Select VI, the value 5 is passed to the indicator. When the Boolean passes a FALSE value to the Select VI, 0 is passed to the indicator.
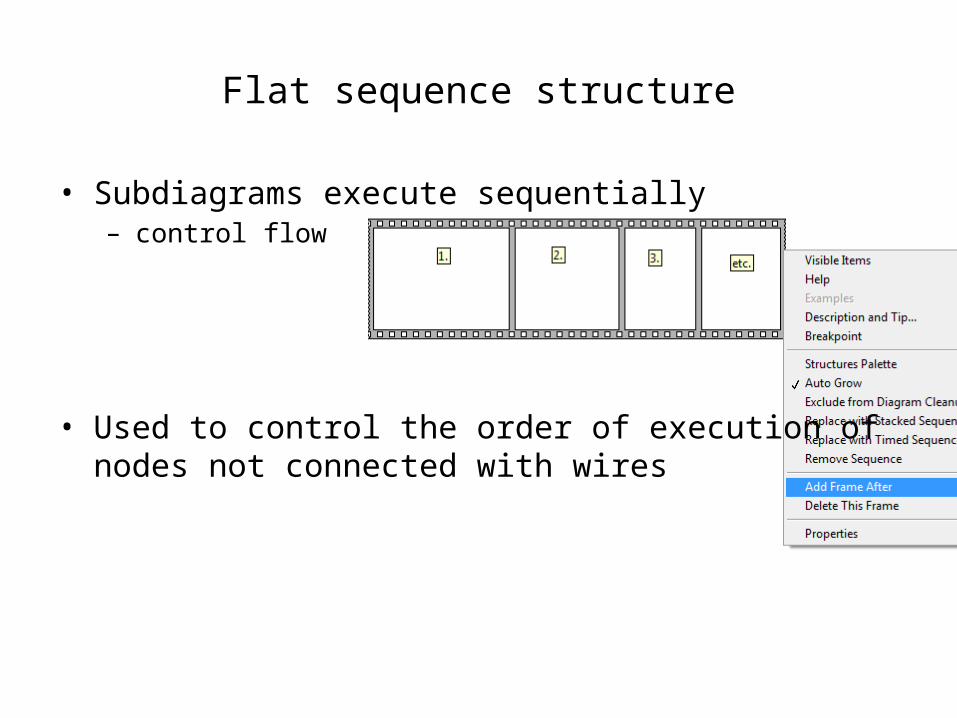
Flat sequence structure
• Subdiagrams execute sequentially– control flow
• Used to control the order of execution of nodes not connected with wires
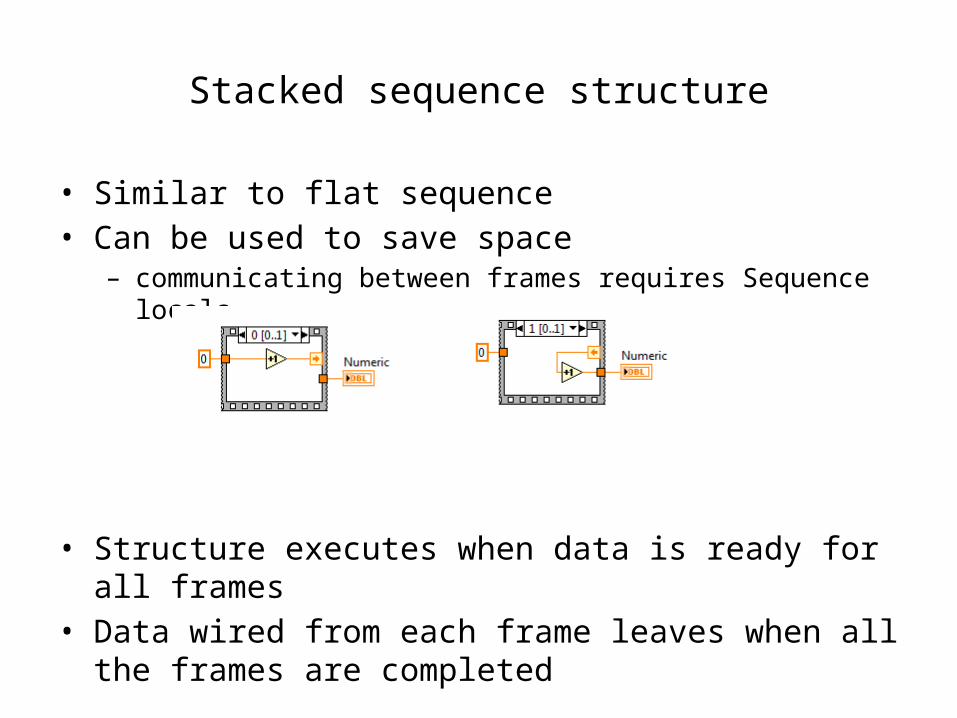
Stacked sequence structure
• Similar to flat sequence• Can be used to save space
– communicating between frames requires Sequence locals
• Structure executes when data is ready for all frames• Data wired from each frame leaves when all the frames are
completed
Flat/stacked sequence
• Avoid overuse– prohibits parallel operations
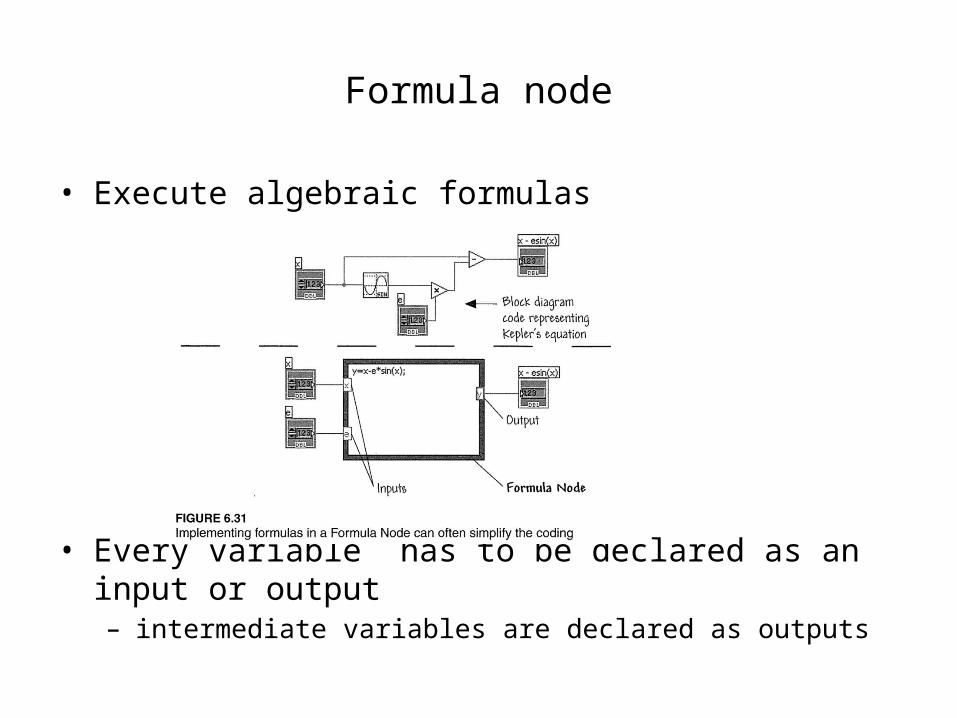
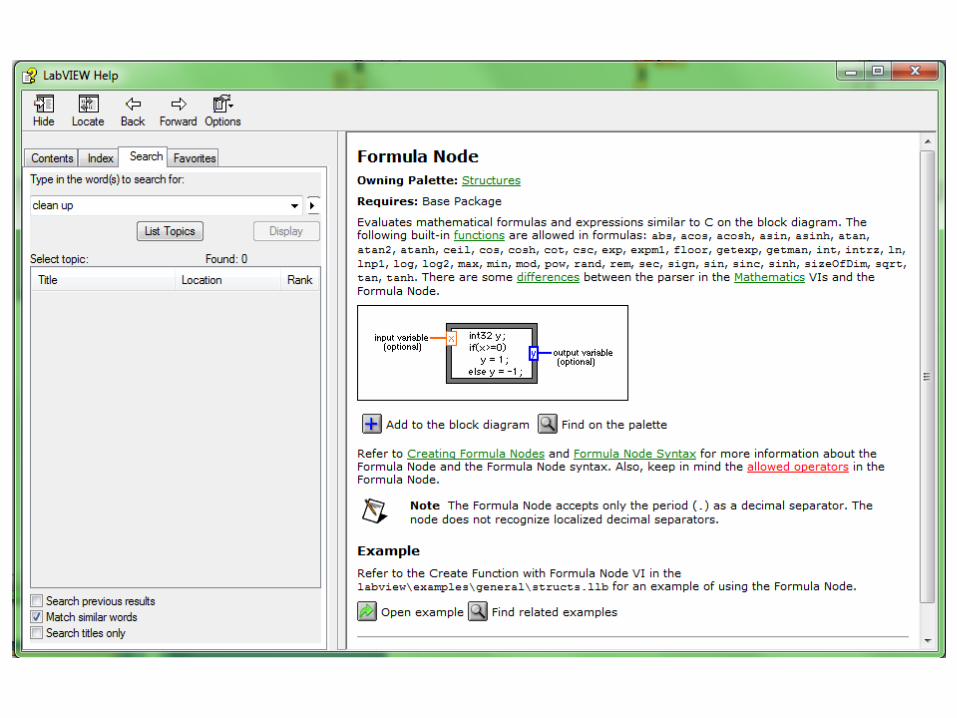
• Execute algebraic formulas
• Every variable has to be declared as an input or output– intermediate variables are declared as outputs
Formula node
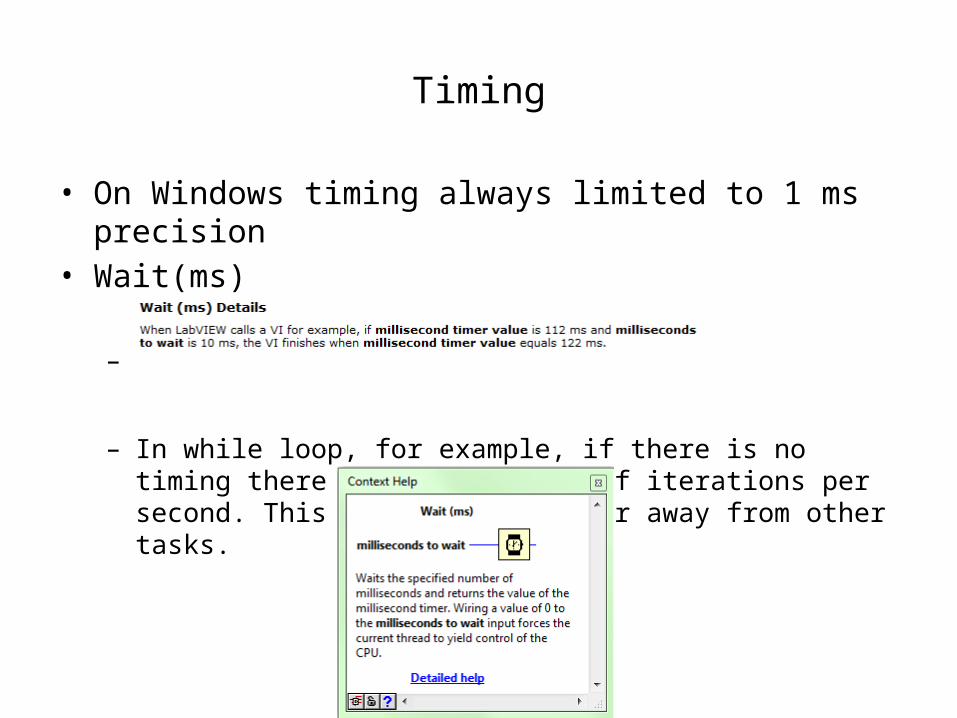
Timing
• On Windows timing always limited to 1 ms precision • Wait(ms)
–
– In while loop, for example, if there is no timing there can be millions of iterations per second. This can take CPU power away from other tasks.
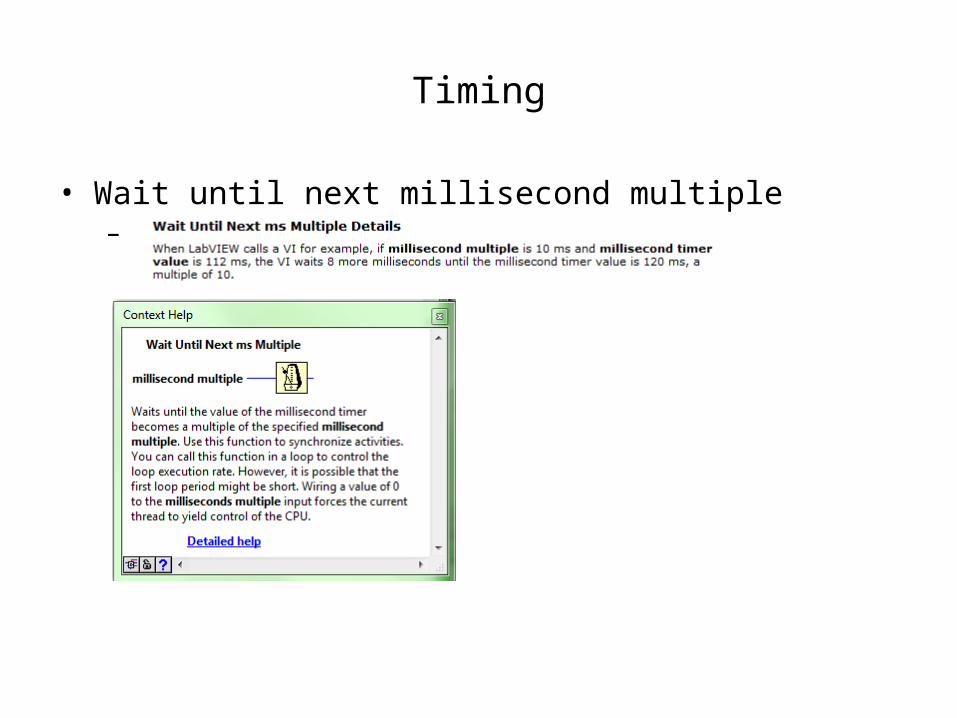
Timing
• Wait until next millisecond multiple–
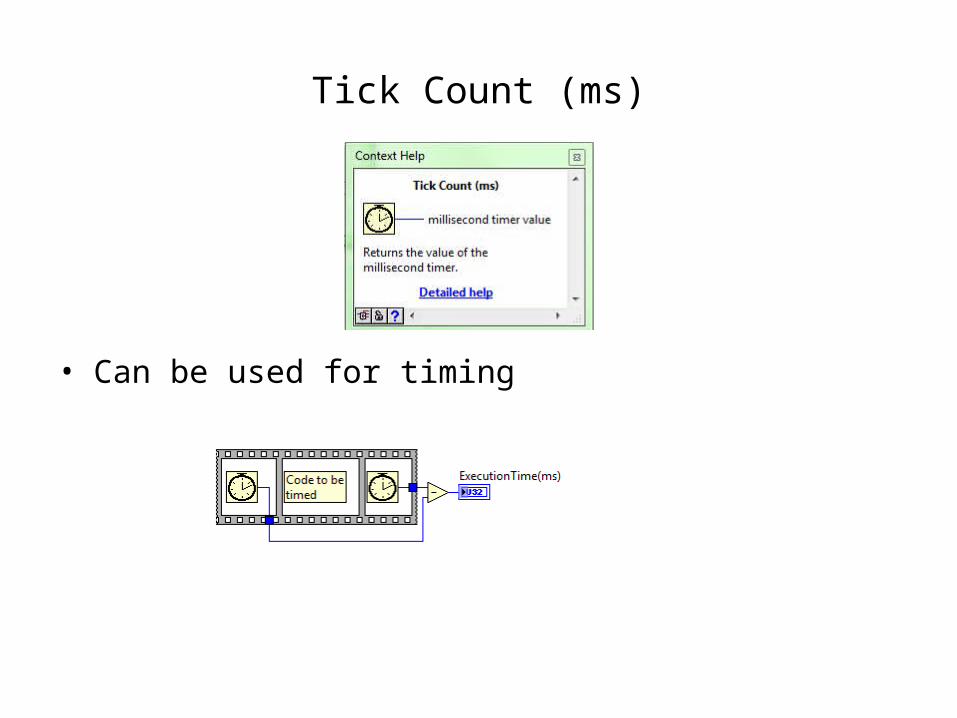
Tick Count (ms)
• Can be used for timing
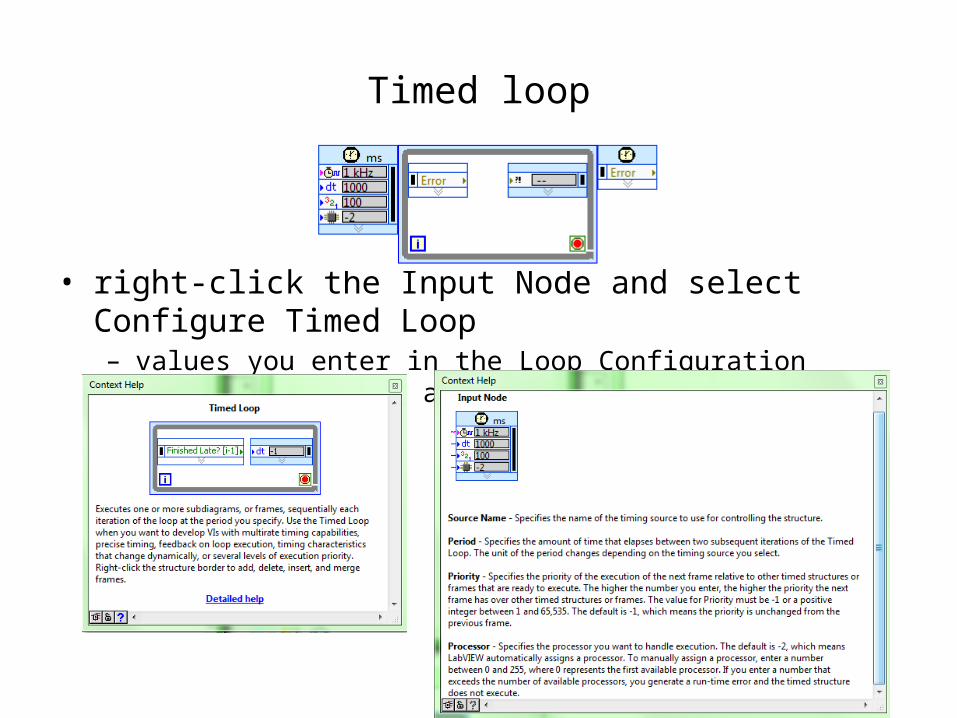
Timed loop
• right-click the Input Node and select Configure Timed Loop – values you enter in the Loop Configuration dialog box appear as
options in the Input Node
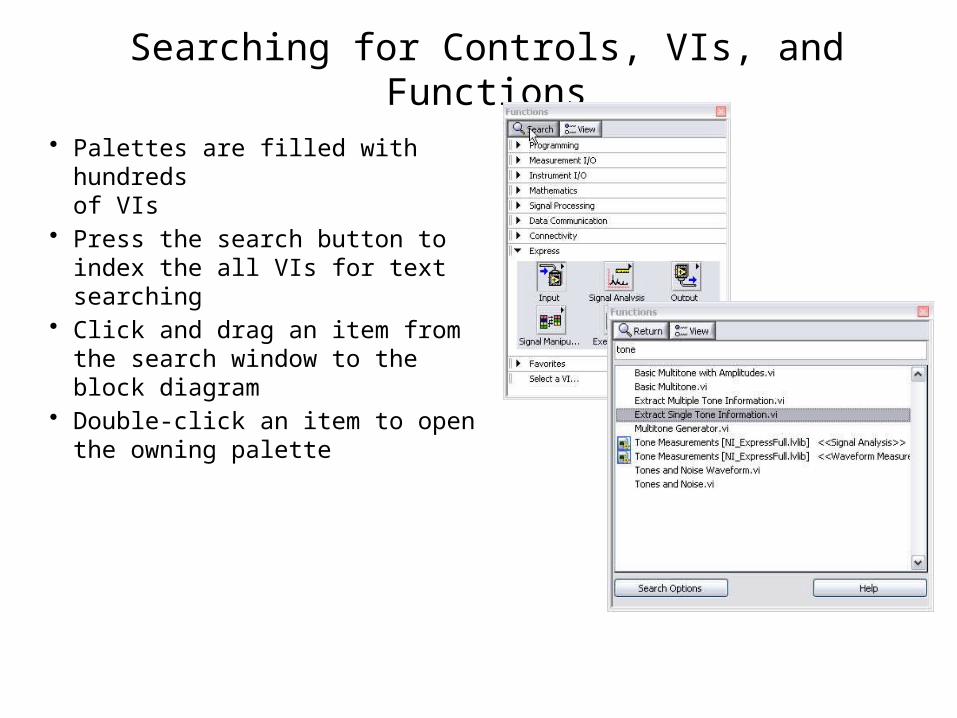
Searching for Controls, VIs, and Functions
• Palettes are filled with hundreds of VIs
• Press the search button to index the all VIs for text searching
• Click and drag an item from the search window to the block diagram
• Double-click an item to open the owning palette
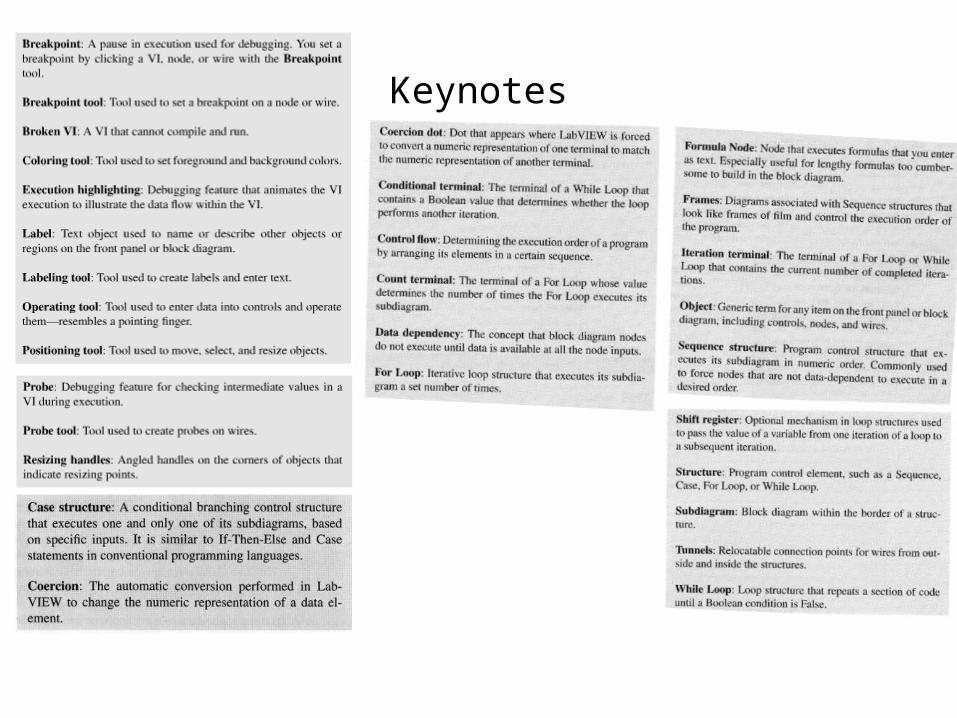
Keynotes