Embed Size (px)
Citation preview
Journal of Engineering Science and Technology Special Issue on Applied Engineering and Sciences, October (2014) 66 - 75 © School of Engineering, Taylor’s University
66
LABVIEW BASED FLOW RATE MONITORING AND MEASUREMENT ALGORITHM FOR ROTARY ENCODER
R. GARMABDARI1,*, S. SHAFIE
1,3, A. GARMABDARI
2,
H. JAAFAR1, A. K. ARAM
1
1Faculty of Engineering, Universiti Putra Malaysia, 43400 UPM Serdang, Selangor, Malaysia 2Faculty of Engineering, Islamic Azad University of Qazvin, 1655, Barajin, Qazvin, Iran
3Institute of Advanced Technology, Universiti Putra Malaysia, 43300 Serdang, Selangor, Malaysia
*Corresponding Author: [email protected]
Abstract
The water usage is increasing twice of the rate of global population growth
within the last century. According to the statistical studies, the global
population is growing by roughly 80 million people annually, representing
increased freshwater demand of around 64 billion cubic meters in the same
period of time. This amount of water is being consumed in three fields
comprising irrigation 70%, industry 20% and domestic usage 10%.Therefore,
monitoring and controlling of natural water resources are counted as two most
vital issues in water crisis. For the purpose of control and supervision on natural
water sources, the water consumption parameters such as instantaneous
consumption, flow rate, and accumulated consumption should be measured and
monitored. This paper presents a new monitoring algorithm implemented in
Labview to monitor, calculate and plot the mentioned parameters based on the
rotary encoders such as electromagnetic, ultrasonic, capacitive, or even hall-
effect sensors based. The results show that, the algorithm is capable to measure
and display flow rate, instantaneous and cumulative consumption. It is also able
to recognise and present the fluid flow direction and the system fault.
Keywords: Water measurement, Rotary encoder, Flow rate, Monitoring algorithm.
1. Introduction
Although there are various techniques to monitor and measure water flow rate,
instantaneous and cumulative water consumption parameters, but they require
different equipment to measure and register each one of them. For instance, a water
meter and flow meter are needed to measure consumption and flow rate respectively.
Furthermore, the peripheral software may be required to extract the statistical
Labview Based Flow Rate Monitoring and Measurement Algorithm for . . . . 67
Journal of Engineering Science and Technology Special Issue 10/2014
Nomenclatures
Vx Output voltage of hall sensor x, V
Vy Output voltage of hall sensor y, V
Abbreviations
C.P Counted Pulses
CC Cumulative Consumption
CET Constant Elapsed Time Technique
F.R Flow Rate
MFR Mean of Flow Rate
MR Magneto Resistive Sensor
RPM Round per Minute
information [1]. The difficulty and cost of implementation of such these
measurement systems motivated to design and develop a new display algorithm
based on Labview which is able to plot flow rate, the mean of flow rate,
instantaneous and cumulative consumption graphs. The mean of flow rate has a
statistical concept and generally is calculated every hour during a day. All these
values can be recorded in a database according to their date and time. The stored
information can be utilised to achieve more statistical information such as
periodical consumption which needs to be accomplished in a long period of time.
Furthermore, the errors of the system and flow direction of fluid are presented on
the display of the developed Labview based algorithm.
2. Hall Effect Sensor Based Encoder
Generally, rotary encoders recognise the position of rotary shaft connected to the
rotary part of encoder. Basically, rotary encoders comprise revolving part to
install sensor’s actuators, fixed part wherein the sensors are placed on it, readout
circuit and processor to analyze the coded data [2]. Although rotary encoders are
classified based on principle of operation such as electromagnetic, capacitive,
optical, ultrasonic based encoders, they may also be categorised to magnetic and
optical encoders in terms of small dimension, high performance and dependency
to the environment conditions [3]. Since, the structure of optical encoders are
more complicated than electromagnetic types and also the electromagnetic
encoders have less dependency to the environment condition such as mist, mud,
dirt, water, dust and vibration [4], in this paper, it is focused on electromagnetic
rotary encoders and especially hall-effect based due to their low power
consumption. However, the optical encoders are capable to recognise the angular
position of the revolving shaft in high resolution, but in this scheme, it is
supposed to count the number of rotation of the shaft, detect the direction [5] of
rotation, and recognise the source of error occurred in the system as the main
functions of measurement.
Basically, magnetic encoders are used as non-contacting encoders in restricted
applications like the speed of rotation [6]. Many different types of magnetic
encoders have been reported based on the applied technique to sense the motion
of revolving shaft such as magneto resistive sensor (MR) based, differential
transformer with a rotary core, induction based using inductor, and hall-effect
68 R. Garmabdari et al.
Journal of Engineering Science and Technology Special Issue 10/2014
sensor based. Although, the proposed Labview based measurement system can be
applied for all types of encoders and the functionality of different blocks of
algorithm are similar, but the approach and method of acquisition data and
calculation blocks must be changed according to the data encrypting procedure.
The hall-effect sensor based angular position encoders are normally utilised in
automotive and industrial applications due to their long life, low power
consumption, and also low cost implementation [7]. The operation principle of
hall-effect sensors is based on the induced voltage in two sides of a hall material
when it is located in a magnetic field according to the angle between material’s
surface axis and the magnetic flux.
The hall-effect encoders can be classified to different types in aspect of
configuration and application. Some encoders are assigned to only detect and
count the number of complete rotations of rotary shaft [8, 9]whereas another
group is developed to calculate the angular position of rotating shaft with respect
to either a reference point or the last position of rotary shaft. The proposed
algorithm can be applied to both groups of encoders but the only blocks that
should be modified is the calculation and acquisition blocks according to the
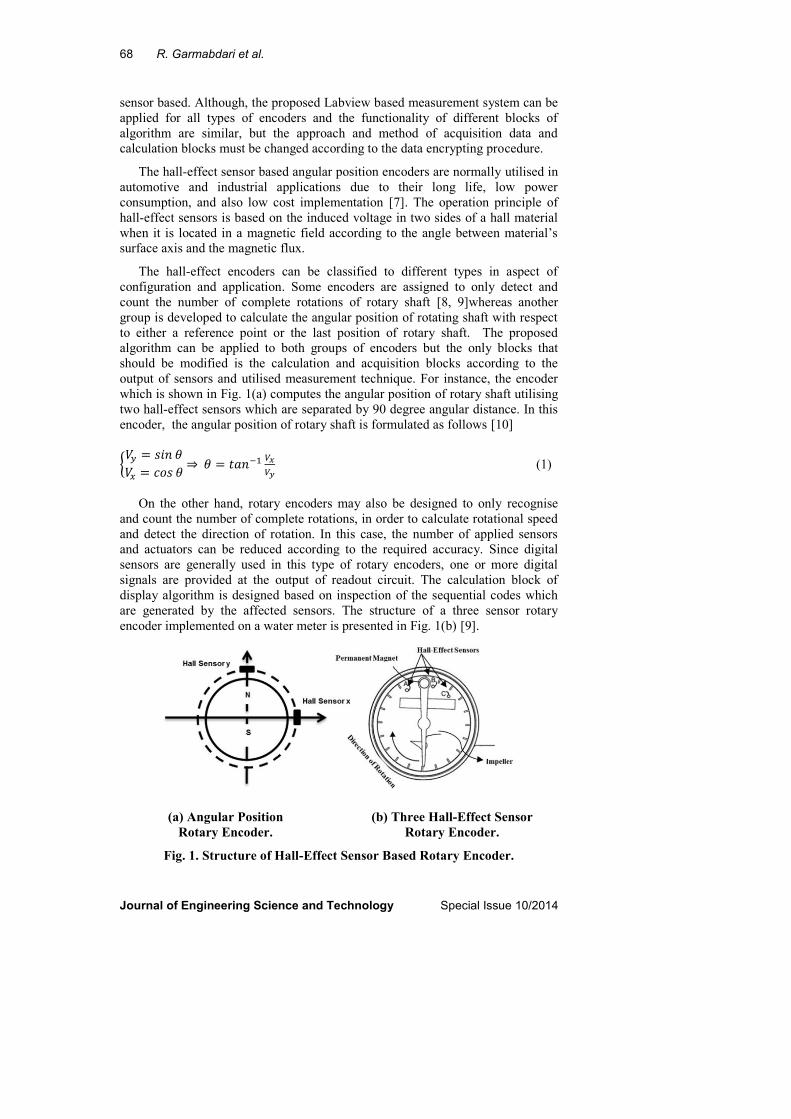
output of sensors and utilised measurement technique. For instance, the encoder
which is shown in Fig. 1(a) computes the angular position of rotary shaft utilising
two hall-effect sensors which are separated by 90 degree angular distance. In this
encoder, the angular position of rotary shaft is formulated as follows [10]
{𝑉𝑦 = 𝑠𝑖𝑛 𝜃
𝑉𝑥 = 𝑐𝑜𝑠 𝜃 ⇒ 𝜃 = 𝑡𝑎𝑛−1 𝑉𝑥
𝑉𝑦 (1)
On the other hand, rotary encoders may also be designed to only recognise
and count the number of complete rotations, in order to calculate rotational speed
and detect the direction of rotation. In this case, the number of applied sensors
and actuators can be reduced according to the required accuracy. Since digital
sensors are generally used in this type of rotary encoders, one or more digital
signals are provided at the output of readout circuit. The calculation block of
display algorithm is designed based on inspection of the sequential codes which
are generated by the affected sensors. The structure of a three sensor rotary
encoder implemented on a water meter is presented in Fig. 1(b) [9].
(a) Angular Position
Rotary Encoder.
(b) Three Hall-Effect Sensor
Rotary Encoder.
Fig. 1. Structure of Hall-Effect Sensor Based Rotary Encoder.
Labview Based Flow Rate Monitoring and Measurement Algorithm for . . . . 69
Journal of Engineering Science and Technology Special Issue 10/2014
In this apparatus, since three digital hall-effect sensors have been sequentially
located on the dial plate, the generated code at the output of interface circuit will
also be sequential according to the direction of rotation and arrangement of
sensors’ position.
3. Flow Rate and Consumption Measurement and Monitoring Technique
For the purposes of analysis of the obtained data from readout circuit to calculate
and display the water flow rate and consumption, a processing and monitoring
algorithm is required to develop on a standalone system.
Basically, the angular speed is considered as one of the most important types
of measurement in rotary based machines in order to monitor and control the
effective factors on rotation. Basically, there are several techniques to measure the
speed of a rotating shaft. The applied speed measurement approach depends on
the sensory system and interface circuit architecture [11].
Although, the angular velocity can be measured by different methods which are
classified into two main categories; timer /counter based and analog-to-digital based
techniques. These two techniques can also be divided to variety types based on the
predetermined parameters of measurement technique and the data acquisition
approach [11, 12]. The most appropriate technique is selected according to the
required range of measurement such as maximum and minimum value of speed, the
required accuracy, and the output signal of interface circuit. In this paper the constant
elapsed time technique (CET) is applied due to increase the accuracy of measurement
at low speed [13]. The principle of this technique is a combination of two simple and
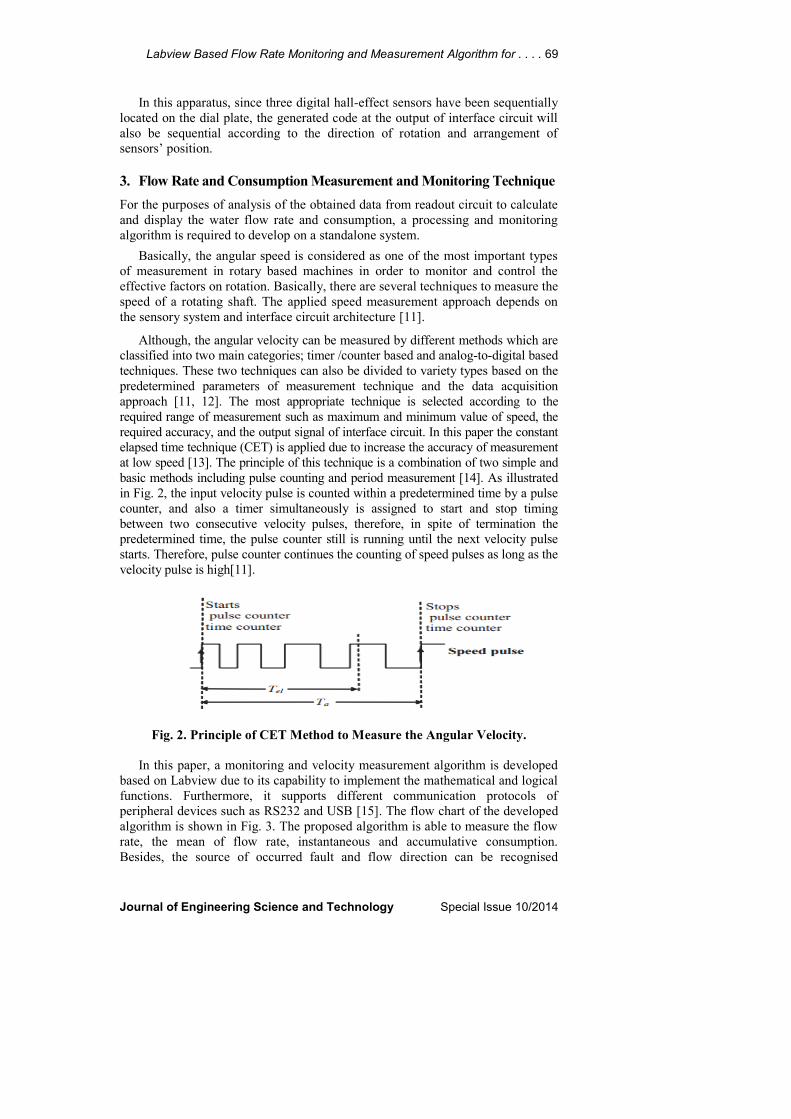
basic methods including pulse counting and period measurement [14]. As illustrated
in Fig. 2, the input velocity pulse is counted within a predetermined time by a pulse
counter, and also a timer simultaneously is assigned to start and stop timing
between two consecutive velocity pulses, therefore, in spite of termination the
predetermined time, the pulse counter still is running until the next velocity pulse
starts. Therefore, pulse counter continues the counting of speed pulses as long as the
velocity pulse is high[11].
Fig. 2. Principle of CET Method to Measure the Angular Velocity.
In this paper, a monitoring and velocity measurement algorithm is developed
based on Labview due to its capability to implement the mathematical and logical
functions. Furthermore, it supports different communication protocols of
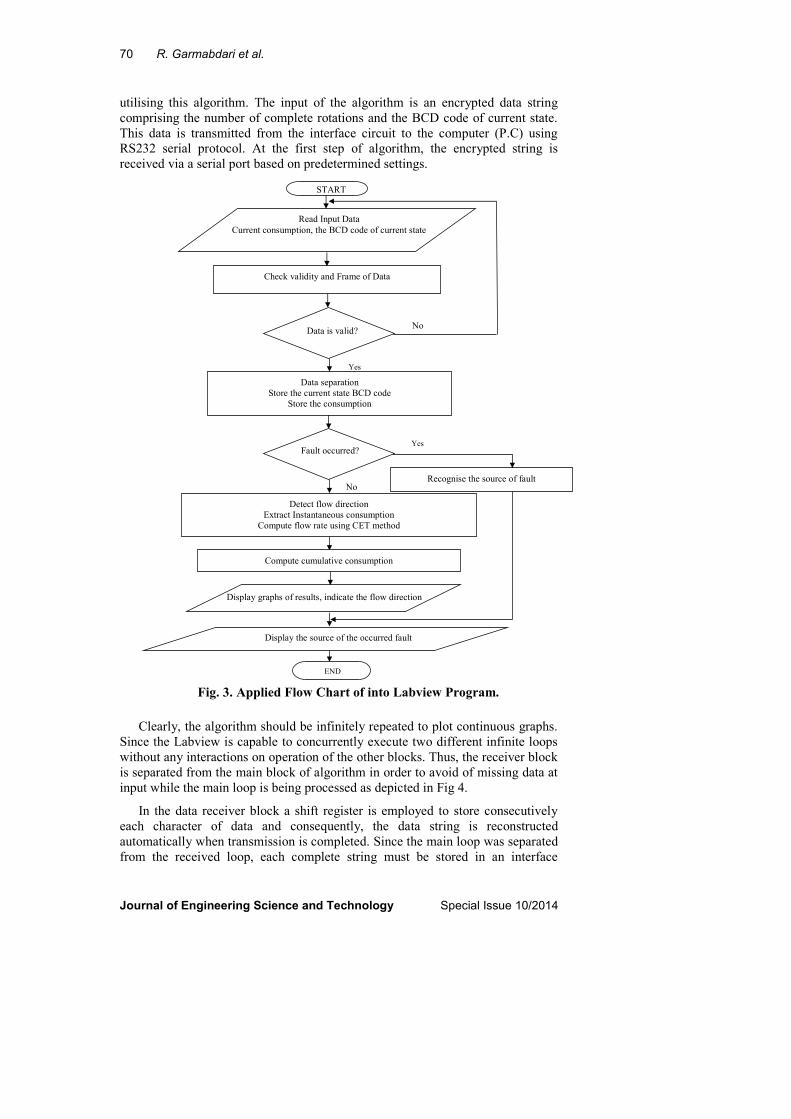
peripheral devices such as RS232 and USB [15]. The flow chart of the developed
algorithm is shown in Fig. 3. The proposed algorithm is able to measure the flow
rate, the mean of flow rate, instantaneous and accumulative consumption.
Besides, the source of occurred fault and flow direction can be recognised
70 R. Garmabdari et al.
Journal of Engineering Science and Technology Special Issue 10/2014
utilising this algorithm. The input of the algorithm is an encrypted data string
comprising the number of complete rotations and the BCD code of current state.
This data is transmitted from the interface circuit to the computer (P.C) using
RS232 serial protocol. At the first step of algorithm, the encrypted string is
received via a serial port based on predetermined settings.
Fig. 3. Applied Flow Chart of into Labview Program.
Clearly, the algorithm should be infinitely repeated to plot continuous graphs.
Since the Labview is capable to concurrently execute two different infinite loops
without any interactions on operation of the other blocks. Thus, the receiver block
is separated from the main block of algorithm in order to avoid of missing data at
input while the main loop is being processed as depicted in Fig 4.
In the data receiver block a shift register is employed to store consecutively
each character of data and consequently, the data string is reconstructed
automatically when transmission is completed. Since the main loop was separated
from the received loop, each complete string must be stored in an interface
Check validity and Frame of Data
Yes
No
Read Input Data
Current consumption, the BCD code of current state
START
Data separation
Store the current state BCD code
Store the consumption
Data is valid?
Yes
No
Recognise the source of fault
Fault occurred?
Detect flow direction
Extract Instantaneous consumption
Compute flow rate using CET method
END
Compute cumulative consumption
Display graphs of results, indicate the flow direction
Display the source of the occurred fault
Labview Based Flow Rate Monitoring and Measurement Algorithm for . . . . 71
Journal of Engineering Science and Technology Special Issue 10/2014
register to compensate the none-synchronization between the main and receiver
loops. It should be considered that the interface register should be cleared after
every reading by the main block.
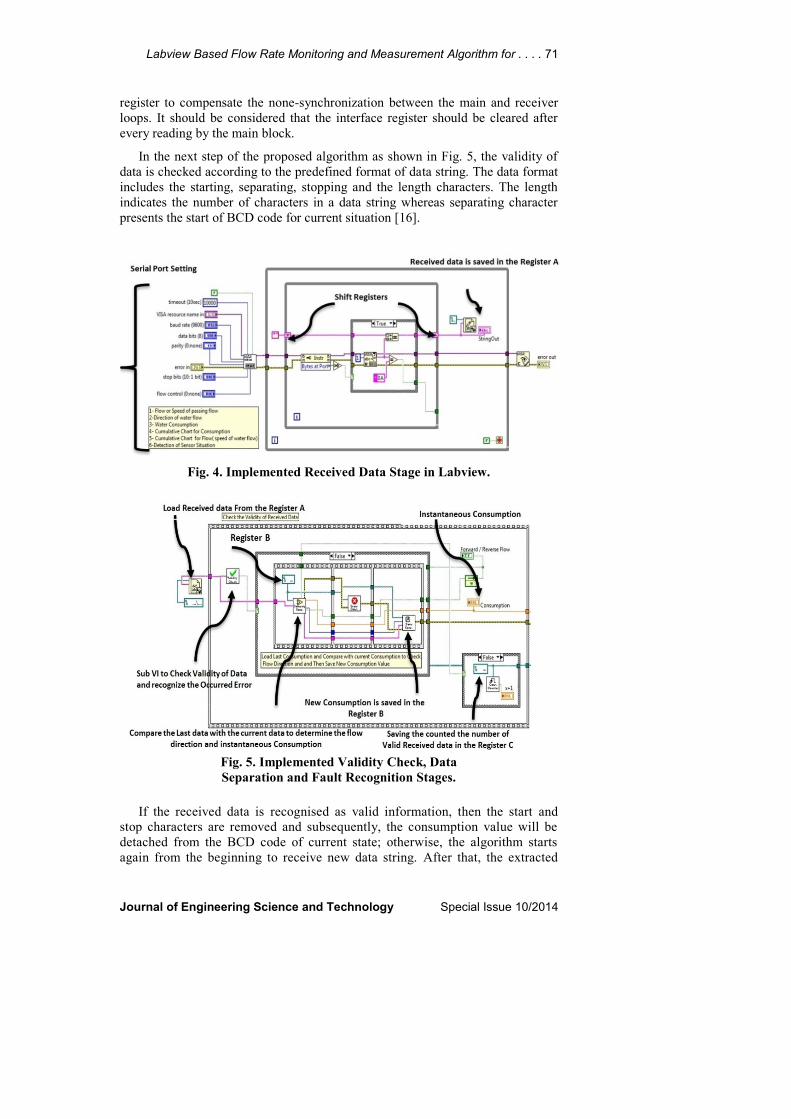
In the next step of the proposed algorithm as shown in Fig. 5, the validity of
data is checked according to the predefined format of data string. The data format
includes the starting, separating, stopping and the length characters. The length
indicates the number of characters in a data string whereas separating character
presents the start of BCD code for current situation [16].
Fig. 4. Implemented Received Data Stage in Labview.
Fig. 5. Implemented Validity Check, Data
Separation and Fault Recognition Stages.
If the received data is recognised as valid information, then the start and
stop characters are removed and subsequently, the consumption value will be
detached from the BCD code of current state; otherwise, the algorithm starts
again from the beginning to receive new data string. After that, the extracted
72 R. Garmabdari et al.
Journal of Engineering Science and Technology Special Issue 10/2014
information is stored in two registers. Now, the current state of sensors is
compared to the predetermined sequential BCD codes and the last stored state
code in order to recognise the source of fault if any happened. Afterward, the
current codes are substituted with the last codes in a register. In case of fault
occurred in the system, the algorithm is transferred directly to the display fault
source stage and then the iteration will be stopped until the fault is resolved and
system is restarted. If no error is detected in the fault inspecting step, the flow
direction is determined by comparison between the extracted current and last
stored consumption values. Obviously, the flow direction is forward if the
current consumption is greater than its last value and it is reverse if the current
consumption is smaller than the last consumption.
The flow rate is calculated based on CET method as the next task of this stage.
For this purpose, two timers are applied which first one measures the constant
predetermined time while another one measures the actual time. Once, the first
valid data string is received, both timers and the pulse counter are run. The
number of pulses is counted within the constant time period of the first timer and
when the predetermined time period elapsed, the current state of sensors is
compared with the reference state wherein the encoder had started to rotate. So,
whenever the last rotation is completed another timer also is stopped and the
measured time by the second timer is stored as the actual time. Then, the flow rate
can be computed by dividing the number of counted pulses (𝐶. 𝑃) overthe actual
time (𝑇𝑎) converted to minute. The unit of calculated flow rate (𝐹. 𝑅) is round per
minute (RPM).
𝐹. 𝑅 =𝐶.𝑃
𝑇𝑎
[𝑅𝑜𝑢𝑛𝑑𝑠]
[𝑀𝑖𝑛𝑢𝑡𝑒]= [𝑅𝑃𝑀] (2)
Next, the cumulative consumption (𝐶. 𝐶) which is defined as the sum of
consumption from the start time till the current moment is computed to display as
below equation.
𝐶. 𝐶 = ∑ 𝐶𝑜𝑛𝑠.𝑖𝑡𝑐𝑖=𝑡0
(3)
The mean of flow rate (𝑀𝐹𝑅)during a certain period of time which normally
is considered every one hour, can be computed to determine the peak usage hours.
The mean of flow rate can be extracted using an independent timer to measure the
intervals and it also can be calculated as below.
𝑀𝐹𝑅 =∑ (𝐹.𝑅)𝑖
𝑁𝑖=1
𝑁=
∑𝐶.𝑃𝑖𝑇𝑎𝑖
𝑁𝑖=1
𝑁 (4)
where the index 𝑖 refers to the number of calculated flow speeds.The 𝐶. 𝑃𝑖 and
𝑇𝑎𝑖represent the counted pulse and measured actual time in each speed calculation
respectively, and 𝑁 denotes the total number of calculated speed within the time
period of independent time like one hour. The implemented computation stage of
the algorithm base on Labview program is shown in Fig. 6.
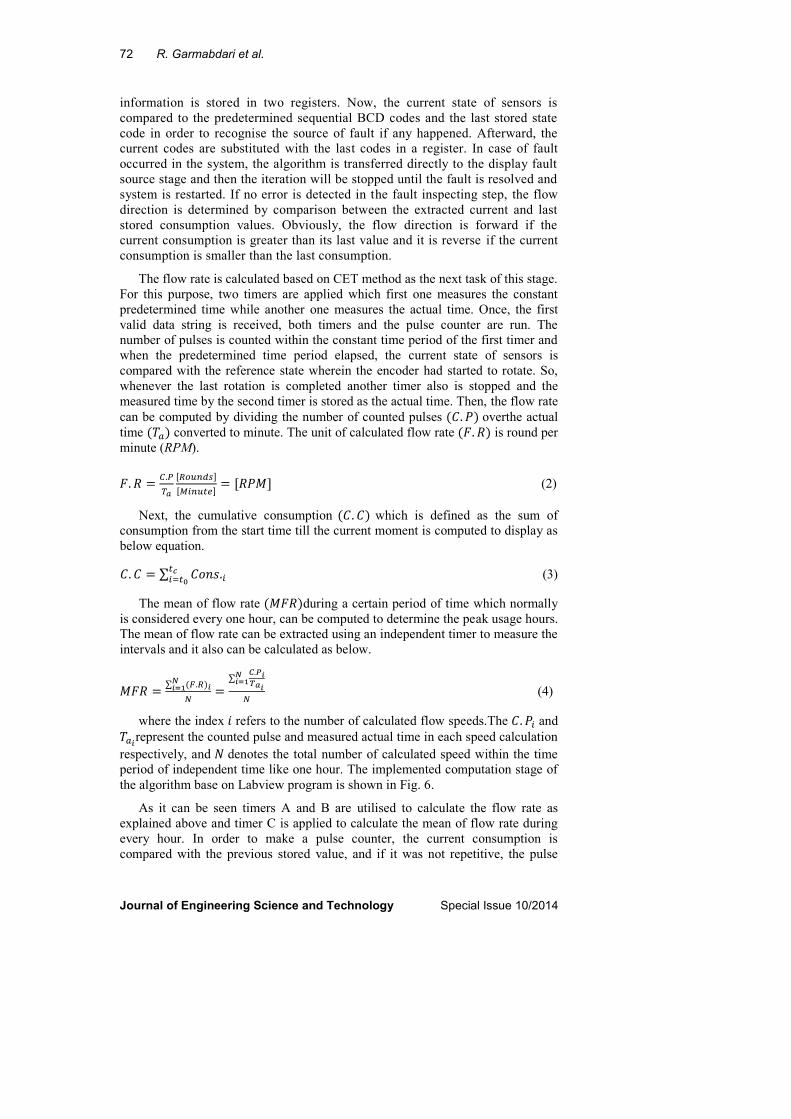
As it can be seen timers A and B are utilised to calculate the flow rate as
explained above and timer C is applied to calculate the mean of flow rate during
every hour. In order to make a pulse counter, the current consumption is
compared with the previous stored value, and if it was not repetitive, the pulse
Labview Based Flow Rate Monitoring and Measurement Algorithm for . . . . 73
Journal of Engineering Science and Technology Special Issue 10/2014
counter is incremented by one, Otherwise; the value of pulse counter will remain
unchanged. The computed results should be plotted on graphs versus absolute
time as the penultimate stage of algorithm. For this purpose three waveform chart
are utilised as shown in Fig. 6.
Fig. 6. Implemented Computing and Plotting Stages in Labview.
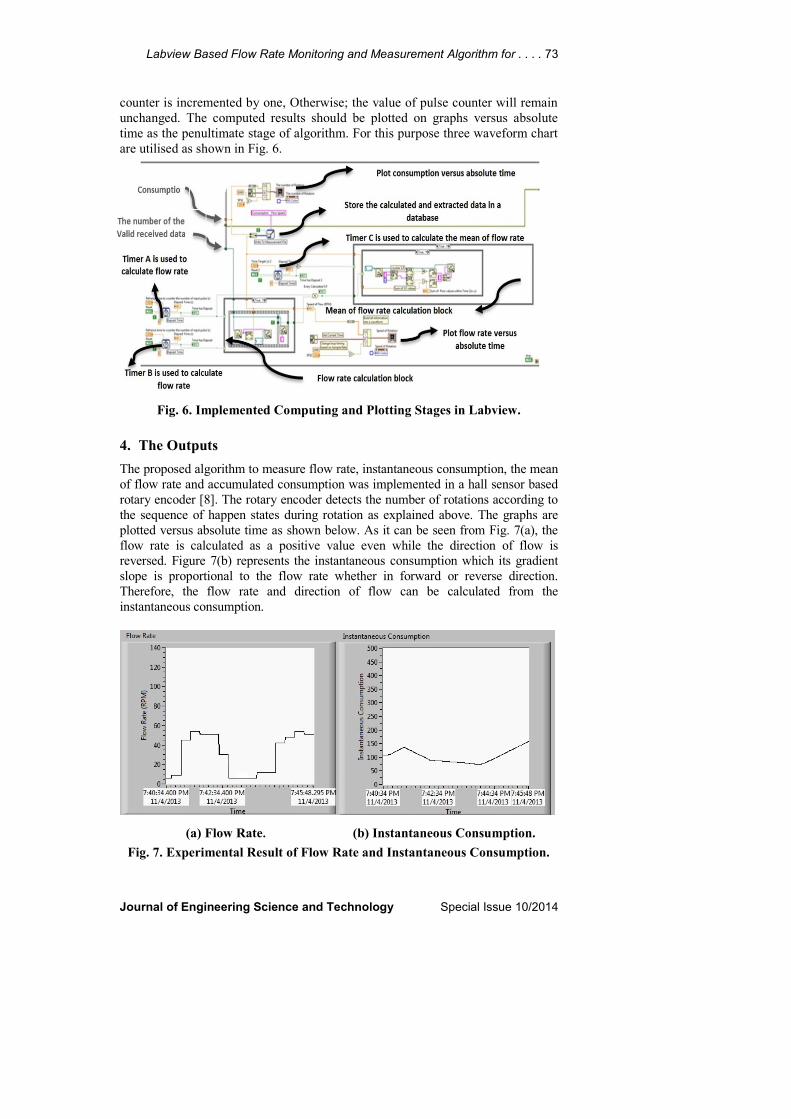
4. The Outputs
The proposed algorithm to measure flow rate, instantaneous consumption, the mean
of flow rate and accumulated consumption was implemented in a hall sensor based
rotary encoder [8]. The rotary encoder detects the number of rotations according to
the sequence of happen states during rotation as explained above. The graphs are
plotted versus absolute time as shown below. As it can be seen from Fig. 7(a), the
flow rate is calculated as a positive value even while the direction of flow is
reversed. Figure 7(b) represents the instantaneous consumption which its gradient
slope is proportional to the flow rate whether in forward or reverse direction.
Therefore, the flow rate and direction of flow can be calculated from the
instantaneous consumption.
(a) Flow Rate. (b) Instantaneous Consumption.
Fig. 7. Experimental Result of Flow Rate and Instantaneous Consumption.

74 R. Garmabdari et al.
Journal of Engineering Science and Technology Special Issue 10/2014
The fault in the measurement system can be recognised based on the
comparison between the sequences of predetermined codes and occur codes.
Therefore if any error in the sensory system or interface circuit happens, the
corresponding code and error message are presented in the front panel of Labview
program as shown in Fig. 8. The flow direction is illustrated via a Boolean
indicator in Labview so that it is switched on once the direction of flow is forward
and vice versa. The mean of flow rate is plotted within a period of one minute to
test the performance of system and it is computed every one hour. This curve
shows how the rate of consumption is changed and determines the maximum
demand of water every hour. The accumulated consumption shows he total water
consumption measured by the proposed system.
Fig. 8. The Mean of Flow Rate, Accumulated, Consumption,
Fault Recognition and Flow Direction Indicators.
5. Conclusion
The implemented algorithm was tested using Labview program and its operation
was verified to plot the flow speed, instantaneous consumption. The functionality
to diagnose the fault and direction has also been confirmed. As a result the
employed algorithm can accurately collect the necessary data utilising minimum
number of measurement equipment. Moreover, all data of the system are saved
into separate files in the database to be used for statistical analysis. The
implemented monitoring algorithm can be utilised by water distributor
organisations in order to monitoring and control the consumption based on water
demand and more importantly to conserve water resources.
Acknowledgment
The authors would like to thank to University Putra of Malaysia and Ministry of
Education, Malaysia for supporting this work under the Fundamental Research
Grant Scheme.
Labview Based Flow Rate Monitoring and Measurement Algorithm for . . . . 75
Journal of Engineering Science and Technology Special Issue 10/2014
References
1. Martínez, J.; Alvarez, R.; Cortez, P.; Mejia, V.; and Zarate, V. H. (2007). An
automation system based on labview to control the test of mechanical flow
meters. Water Resources Management, IV(I), 603-611.
2. Miyashita, K. (1987). Features of a magnetic rotary encoder. IEEE
Transactions onMagnetics, 23(5), 2182-2184.
3. Kikuchi, Y.; and Nakamura, F. (1997). Consideration of magnetization and
detection on magnetic rotary encoder using finite element method.
Transcations on Magnetics, 33(2), 2159-2162.
4. Kikuchi, Y.; and Nakamura, F. (1997). Index phase output characteristics of
magnetic rotary encoder using a magneto-resistive element. IEEE
Transactions on Magnetics, 33(5), 3370-3372.
5. Rummer, R.; and Rummer, D. (1993). An inexpensive digital rotation sensor.
Computers and electronics in agriculture, 9(3), 269-274.
6. Dynamics Research Corp. (1980). Techniques for digitizing rotary and linear
motion (10-11). Wilmington: Wilmington, Mass.
7. Nyce, D. (2004). Linear position sensors: theory and application (109). New
Jersey: Wiley-Interscience.
8. Garmabdari, R.; Shafie, S.; and Isa, M. (2012). Sensory system for the
electronic water meter. Institute of Electrical and Electronik Engineering,
International Conference on Control Applications (IEEE ICCA), 223-226.
9. Sr, A.H.; Gallon, R.; and Harvey, I. (2011). Encoder-type register for an
automatic water meter reader. US Patent 8,051,723.
10. Lee, Y.Y.; Wu, R.H.; and Xu, S.T. (2011). Applications of linear Hall-effect
sensors on angular measurement. Institute of Electrical and Electronik
Engineering-International Conference on Control Applications, 479-482.
11. Li, Y.; Gu, F.; Harris, G.; Ball, A.; Bennett, N.; and Travis, K. (2005). The
measurement of instantaneous angular speed. Mechanical Systems and Signal
Processing, 19(4), 786-805.
12. Arif, S.; Imdadullah, I.; and Asghar, J. (2011). Rotating magnetic field based
instantaneous angular speed measurement of low speed rotating machines. In
Multimedia, Signal Processing and Communication Technology, 252-255.
13. Pu, J.; and Wang, H. (2012). A novel variable M/T method for speed measurement
with high precision in a wide speed range. Atlantis Press. 1855-1858.
14. Tsuji, T.; and Hashimoto, T. (2009). A wide-range velocity measurement
method for motion control. Industrial Electronics, 56(2), 510-519.
15. Bitter, R.; Mohiuddin, T.; and Nawrocki, M. (2006). LabVIEW: Advanced
Programming Techniques (Second Ed.). CRC press, Boca Raton, London,
New York, 221-223.
16. Garmabdari, R.; Shafie, S.; and Isa, M. (2013). Measurement technique for
bidirectional four sensor rotary encoder. Institute of Electrical and Electronik
Engineering-International Conference on Smart Instrumentation, Measurement
and Applications, 1-5.