Embed Size (px)
Citation preview
Labour market tightness and wages: evidence from online job postings Pawel Adrjan and Reamonn Lydon
Draft 1.1
March 2019
[Do not circulate or quote without permission]
The use of online job search has grown hugely over the last decade. Using data from Indeed, this article asks whether ‘big data’ can shed new light on how labour markets work. Comparisons with official data show that online job postings closely track vacancy data from firm-level surveys. They also have the distinct advantage of being timelier than data collected via survey methods. Another advantage of online data is its granularity – knowing what jobs employees search for, what skills employers want and what roles attract higher or lower wages. We combine information on job postings and clicks per posting to construct a measure of tightness for hundreds of job titles over several years. After controlling for observable job characteristics and traditional tightness measures, such as regional unemployment, we find that the number of clicks on a posting is a strong predictor of wages posted in job vacancies.
Key words: Internet, job search, wages, bargaining
JEL Classification: J64, E24, J30
UK Economist at the Indeed Hiring Lab. [email protected]. Senior Advisor, Research & Analysis at the Central Bank of Ireland. [email protected]. We thank Alassane-Anand Ndour for excellent research assistance. We also thank seminar participants at the Central Bank of Ireland and colleagues at the Indeed hiring lab for comments on earlier drafts.
1
1. Introduction
Despite being a relatively recent development, online job search now plays a central role
in matching employees to jobs. Once primarily the preserve of newspaper ads and notice
boards, the presence of job advertisements in print is in steady decline. The spectacular
growth and scale of online job postings and website traffic, which we summarise below,
suggests that the internet is now the primary platform for hiring and job search. In the
era of big data, information gleaned from online job search has the potential to improve
our understanding of the labour market.
With a view to understanding how useful this data is for labour market research, this
paper analyses online job postings and job search data from Indeed’s Irish website.
Ireland is an interesting case study as it is a labour market characterised by significant
variation across time, geography and occupations, while its small size relative to other
markets allows us to explore the data in substantial detail.
Indeed’s data are attractive for several reasons. On attraction is that, unlike survey-
based labour market statistics, there is a significantly shorter time lag with the online
data. This means that up-to-date information on what skills employers are looking for,
what jobs employees search for and how many jobs have been posted is readily
available. However, such ‘non-traditional’ data, does not always lend itself easily to
economic analysis and interpretation. There are important questions to be answered
around measurement, comparisons with existing ‘official’ sources, separating trends
from growing market size effects, and dealing with the concerns of the corporate data
owners.1 This means that when we use the data for economic analysis, it is vital to first
assess the reliability and representativeness of the data.
Notwithstanding some of these concerns, for labour economists, the granularity of
online data has significant potential. This is because it can provide fresh insights into the
job search and hiring process – i.e. the ‘matching function’. Several recent studies have
used online data on job postings and search to research these questions. Faberman and
Kudlyak (2016) show that job search effort is stronger for people with weaker prospects
– counter to standard assumptions in the literature. Kuhn and Mansour (2014) show that
online job search helps unemployed people find jobs more quickly. This means that
online job search can improve matching efficiency. Brown and Matsa (2016) use online
data to analyse job search during the financial crisis. They show that jobseekers are more
likely to apply to more financially sound firms, highlighting the importance of job security
1 These themes and others were explored in a recent Brookings event on “Can big data improve economic measurement?” Presentations from the event are available at https://www.brookings.edu/events/can-big-data-improve-economic-measurement.
2
to applicants. Brenčič (2015) investigates the measurement issues that arise when using
job postings to analyse wages and salaries. They find that employers are less likely to
post a wage in adverts for skilled workers. Previewing some of our own analysis, we find
that despite only a sub-sample of postings including wage or salary information – around
one one-in-seven postings include this information – comparisons with official survey
data shows that the distribution of salaries (but not wages) is very similar to the national
pattern.
The paper by Marinescu and Wolthoff (2016) is relevant for our own study. They use the
role description in online job postings to show that job titles can explain up to 90% of the
variance in wages. Previously, only around half of the cross-sectional variance in wages
could be explained by worker and job characteristics (i.e. four-digit occupation codes).
This effectively ascribed a large chunk of wage differences in the population to ‘luck’.
Marinescu and Wolthoff’s important contribution is to show that luck has almost no role
to play. Using OJS textual data from the role description, they show that fully controlling
for the wide-ranging task and skill content in jobs explains almost all of the differences
in wages we observe in the population. This paper is an important precedent for our own
work in two ways. First, we also estimate wage regressions from the online job postings
on Indeed. Second, we also use the text in the job title and job ad to extract observable
job characteristics relating to geography, seniority/experience, education and job-type
(permanent, contract, part-time, full-time, etc).
Our paper adds to a growing literature using online data in economic research. Our main
research question is whether measures of labour market tightness derived from online
job postings are informative for wages, over and above traditional tightness measures,
such as unemployment, and after controlling for job characteristics. Before we get into
this, however, the first part of the paper delves into some of the common measurement
concerns about using online data. We do this by comparing the Indeed data with official
labour market statistics in several dimensions. First, we show that job-posting trends
closely track vacancies published by the Irish Central Statistics Office (‘CSO’). Next, we
compare the geographic dispersion of postings with employment growth at the county
level. Finally, we show that the distribution of salaries (but not wages) in the Indeed job
postings data are very similar to distributions from the main household income survey
carried out annually by the CSO.
The second part of the paper presents our analysis of wages and tightness. We show
which jobs attract the highest posted salaries. We then show how the data can be used
to construct a measure of labour market tightness, which can then be related to wages.
Our analysis builds on the work of Lydon and Lozej (2018), who show the positive link

3
between new hires’ pay and labour market tightness, as measured using unemployment
at the regional level. Our contribution here is threefold: (1) construction of a measure of
tightness from Indeed data; (2) more granular tightness measure (at the level of jobs);
and (3) a more timely tightness measure.
2. The data – job postings on Indeed
Indeed is the No. 1 job site worldwide2, with a presence in 60 countries. It provides
details of job advertisements, both by aggregating other Internet sources, including
companies’ own career sites, and by employers posting jobs directly to the site. Globally,
it has 250 million unique visitors per month3, 150 million CVs, and 600 million salary data
points. Indeed is present in Ireland since 2009. It is the most-visited job site in the
country, with 3.9 million monthly visits.4 On average, over 30,000 new job postings in
Ireland are added each month. The typical duration of a job posting is just over one
month.
For Labour research, Indeed’s data has both advantages and disadvantages over other
data sources, as summarised in Table 1. For policy use, representativeness is a key
factor. Although, as more and more job search moves on-line representativeness
becomes much less of a concern. Whilst we are unable to find Irish data on the extent of
online job search, Sinclair and Mamertino (2018) report that according to a Harris Poll
survey in 2015, 78% of new hires in a set of advanced countries (UK, Germany, France
and the Netherlands) reported using online resources in their job search. Statistical
agencies, like the CSO, use census weights to ensure that survey responses are
representative of the population. In this paper, we do not attempt to re-weight the
Indeed data. However, the sheer number of observations – on average 30,000 new job
postings per month – means that we are able to make comparisons with official survey
data across several dimensions.
In the following sections, we compare the online data across time, geographies, job mix
and salaries. Whilst there are some differences between the sources – partly driven by
differences in measurement concepts – the discrepancies are not so large as to lead us
to conclude that this data are not representative of the labour market for new hires.
2 comScore, Total Visits, March 2018 3 Google Analytics, Unique Visitors, September 2018 4 SimilarWeb, Total Visits, January 2019

4
Table 1 | Advantages and disadvantages of OJS data relative to survey sources
Advantages Disadvantages
Shorter lags in data delivery Limited historical data
Higher granularity Proprietary taxonomies different to CSO
Information on labour demand & supply May not be representative of population
Global reach Limited demographic information
2.1 Trends in job postings versus job vacancies
The most comparable official series for job postings is CSO vacancy data, collected in
the quarterly Earnings, Hours and Employment Costs Survey (EHECS). Figure 1 shows
that trends in monthly job postings on Indeed closely track trends in official job
vacancies series. The job postings data, which we show to end-February 2019, suggest
that growth in job openings in Ireland has levelled off in 2018, although they remain
high relative to recent historical patterns. The fact that job postings have continued at
a high level through to end-Feb 2019 suggests that the fall-off in the official vacancies
series in December 2018 – vacancies were 10% lower than in June 2018 – is not the
start of a downward trend.
Source: Indeed monthly data to end-Feb 2019. CSO vacancies to Q4 2018. Both series seasonally adjusted using X-13ARIMA-SEATS.
90
100
110
120
130
140
150
160
170
180
190
90
100
110
120
130
140
150
160
170
180
190
Figure 1 | Job postings vs. CSO vacancies Index, March 2014 = 100
CSO vacancies
Indeed job postings
5
2.2 Cross-sectional coverage – mix of jobs, geography and salaries
The time-series coverage of the Indeed data is very good, albeit relatively short. It is also
important to point out that, as a market, online job search is still growing. To be
confident about using Indeed data to assess the state of the labour market, it is also
important to verify its cross-sectional coverage. Here, we compare the mix of jobs,
geographic coverage and salaries with published official statistics.
Indeed groups job postings under hundreds of granular, and proprietary, ‘job titles’. This
is one of the common draw backs of using non-traditional data – direct comparisons with
existing taxonomies – such as Standard Occupational Codes (SOC) – is not
straightforward.5 Nonetheless, looking at the top-ten postings (Indeed) and new hires
(LFS), it is possible to pick out commonalities in the jobs and roles (Table 2). Table 2
shows the top ten job titles in Indeed data for 2018 alongside the top-ten new hires by
four-digit occupation code (UK SOC) from the Labour Force Survey. Because job postings
primarily reflect gross labour demand (i.e. both growth and turnover) and new hires
reflect the intersection of both demand and supply, we do not expect the two lists to be
identical. There is, however, a high degree of overlap between the two lists, with several
job titles/occupations appearing in both lists. Furthermore, several of the job titles in
the job postings list that do not appear in the new hires list are only just outside the top-
ten, for example nurses (16th in the ranking of new hires) and accountants (12th).
Similarly, almost all jobs in the new hires top-ten that do not appear in the job postings
top-ten appear just outside the top-ten.
5 The Indeed database does include a cross-walk of Irish job postings to US SOC occupation codes. We use this aggregation below to include occupation fixed effects in the wage regression because we do not have sufficiently large cell sizes at the Indeed job title level. However, this is not useful for comparisons with the Irish Labour Force Survey, which uses UK SOC codes. We have commenced a project using a UK-US SOC cross-walk, which is a work in progress.
6
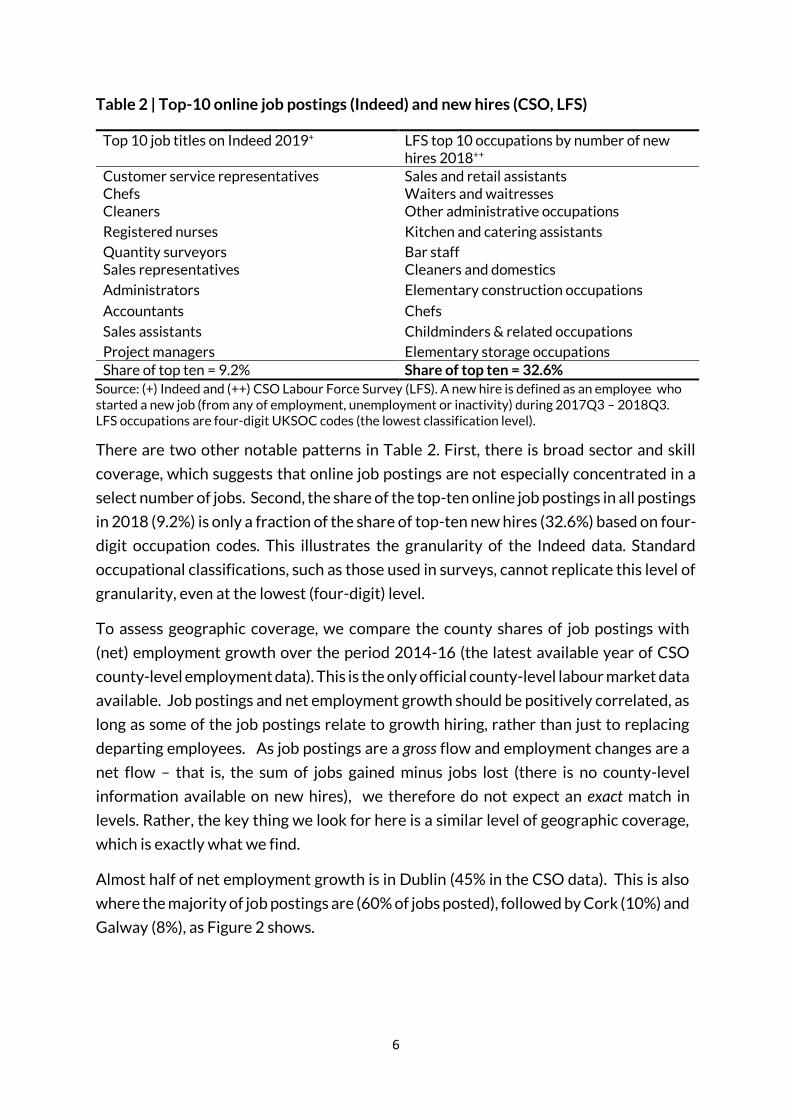
Table 2 | Top-10 online job postings (Indeed) and new hires (CSO, LFS)
Top 10 job titles on Indeed 2019+ LFS top 10 occupations by number of new hires 2018++
Customer service representatives Sales and retail assistants Chefs Waiters and waitresses Cleaners Other administrative occupations
Registered nurses Kitchen and catering assistants
Quantity surveyors Bar staff Sales representatives Cleaners and domestics
Administrators Elementary construction occupations
Accountants Chefs
Sales assistants Childminders & related occupations
Project managers Elementary storage occupations Share of top ten = 9.2% Share of top ten = 32.6%
Source: (+) Indeed and (++) CSO Labour Force Survey (LFS). A new hire is defined as an employee who started a new job (from any of employment, unemployment or inactivity) during 2017Q3 – 2018Q3. LFS occupations are four-digit UKSOC codes (the lowest classification level).
There are two other notable patterns in Table 2. First, there is broad sector and skill
coverage, which suggests that online job postings are not especially concentrated in a
select number of jobs. Second, the share of the top-ten online job postings in all postings
in 2018 (9.2%) is only a fraction of the share of top-ten new hires (32.6%) based on four-
digit occupation codes. This illustrates the granularity of the Indeed data. Standard
occupational classifications, such as those used in surveys, cannot replicate this level of
granularity, even at the lowest (four-digit) level.
To assess geographic coverage, we compare the county shares of job postings with
(net) employment growth over the period 2014-16 (the latest available year of CSO
county-level employment data). This is the only official county-level labour market data
available. Job postings and net employment growth should be positively correlated, as
long as some of the job postings relate to growth hiring, rather than just to replacing
departing employees. As job postings are a gross flow and employment changes are a
net flow – that is, the sum of jobs gained minus jobs lost (there is no county-level
information available on new hires), we therefore do not expect an exact match in
levels. Rather, the key thing we look for here is a similar level of geographic coverage,
which is exactly what we find.
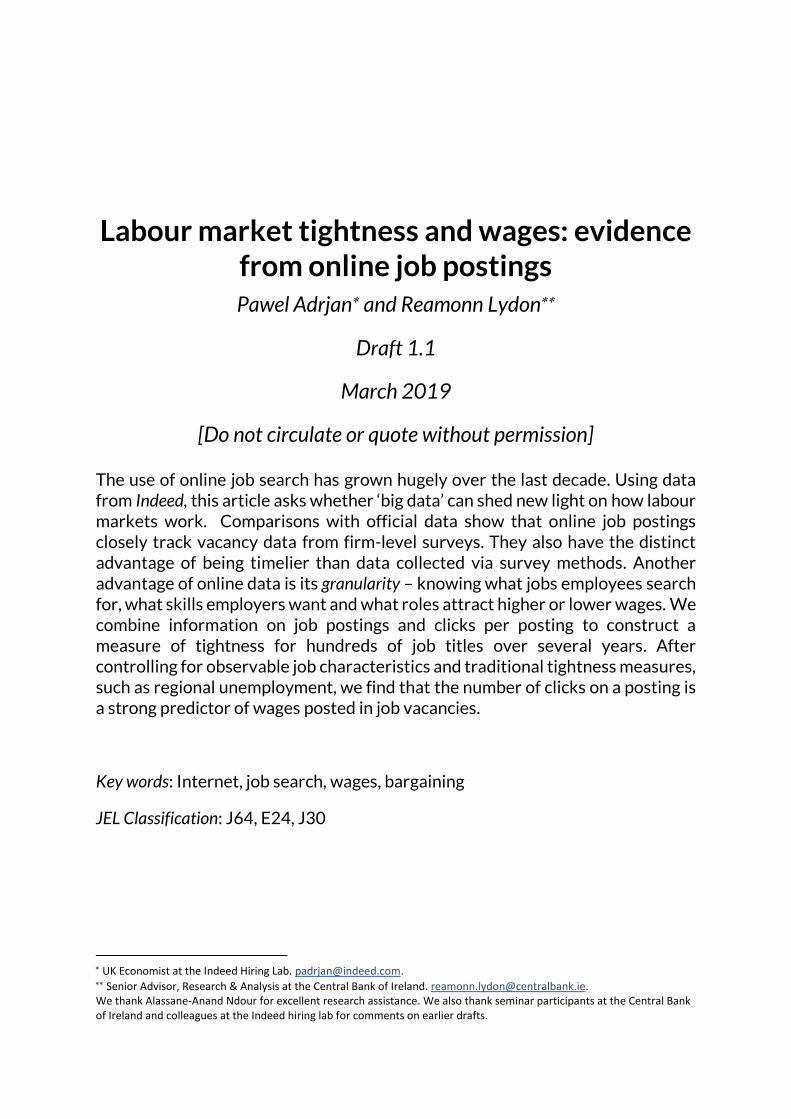
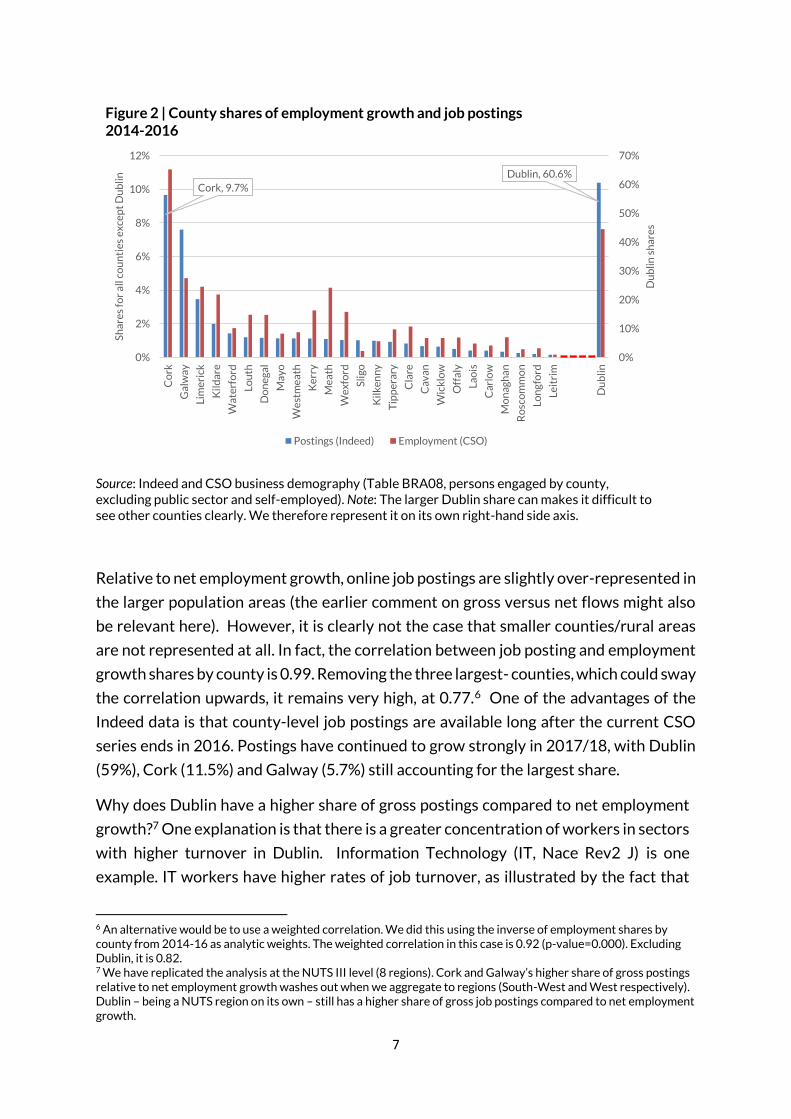
Almost half of net employment growth is in Dublin (45% in the CSO data). This is also
where the majority of job postings are (60% of jobs posted), followed by Cork (10%) and
Galway (8%), as Figure 2 shows.
7
Source: Indeed and CSO business demography (Table BRA08, persons engaged by county, excluding public sector and self-employed). Note: The larger Dublin share can makes it difficult to see other counties clearly. We therefore represent it on its own right-hand side axis.
Relative to net employment growth, online job postings are slightly over-represented in
the larger population areas (the earlier comment on gross versus net flows might also
be relevant here). However, it is clearly not the case that smaller counties/rural areas
are not represented at all. In fact, the correlation between job posting and employment
growth shares by county is 0.99. Removing the three largest- counties, which could sway
the correlation upwards, it remains very high, at 0.77.6 One of the advantages of the
Indeed data is that county-level job postings are available long after the current CSO
series ends in 2016. Postings have continued to grow strongly in 2017/18, with Dublin
(59%), Cork (11.5%) and Galway (5.7%) still accounting for the largest share.
Why does Dublin have a higher share of gross postings compared to net employment
growth?7 One explanation is that there is a greater concentration of workers in sectors
with higher turnover in Dublin. Information Technology (IT, Nace Rev2 J) is one
example. IT workers have higher rates of job turnover, as illustrated by the fact that
6 An alternative would be to use a weighted correlation. We did this using the inverse of employment shares by county from 2014-16 as analytic weights. The weighted correlation in this case is 0.92 (p-value=0.000). Excluding Dublin, it is 0.82. 7 We have replicated the analysis at the NUTS III level (8 regions). Cork and Galway’s higher share of gross postings relative to net employment growth washes out when we aggregate to regions (South-West and West respectively). Dublin – being a NUTS region on its own – still has a higher share of gross job postings compared to net employment growth.
Cork, 9.7%
Dublin, 60.6%
0%
10%
20%
30%
40%
50%
60%
70%
0%
2%
4%
6%
8%
10%
12%C
ork
Ga
lwa
y
Lim
eri
ck
Kil
da
re
Wa
terf
ord
Lo
uth
Do
ne
ga
l
Ma
yo
We
stm
ea
th
Ke
rry
Me
ath
We
xfo
rd
Sli
go
Kil
ke
nn
y
Tip
pe
rary
Cla
re
Cav
an
Wic
klo
w
Off
aly
La
ois
Car
low
Mo
nag
ha
n
Ro
sco
mm
on
Lo
ng
ford
Le
itri
m
Du
bli
n
Du
bli
n s
ha
res
Sh
are
s fo
r a
ll c
ou
nti
es
ex
cep
t D
ub
lin
Figure 2 | County shares of employment growth and job postings 2014-2016
Postings (Indeed) Employment (CSO)
8
they have 30 months less average time on the job (average job tenure) relative to other
workers (controlling for age).8 In 2018, 7% of employees in Dublin work in the IT sector,
compared with 2% for the rest of the country. Similarly, workers in “Professional,
Scientific and Technical Activities” (Nace Rev2 M), have 14 months less time on the job
on average compared to other workers. Workers in this sector account for 7% of Dublin
employees, compared with 4% in the rest of the country. These factors contribute to a
higher rate of job churn more generally in Dublin. In 2018, Job churn, as measured by
the quarterly job-switching rate in Staunton and Lydon (2018), was a full percentage
point higher for jobs in Dublin (3.9%) versus the rest of the country (2.9%).
As summarised in Brenčič (2015), typically only a subset of job vacancy postings include
salary or wage information. This is certainly the case with the Indeed Ireland, where only
14% of postings in 2018 included either salary or wage information. There could be
several reasons for this, such as negotiable packages, or concerns about attracting (or
deterring) applications from a certain pool of applicants. For example, employers
sometimes point out that it can reduce the number of applications for a position,
particularly for skilled jobs.
Despite only a fraction of job postings having salary or wage information, with over
360,000 new postings per year, we are not concerned about sample size, even at the job
title level. Rather, the main concern is sample selection, and whether certain jobs or
skills under-represented in the salary or wage distribution. We test this by comparing
the distribution in Indeed data with nationally representative survey data (the EU
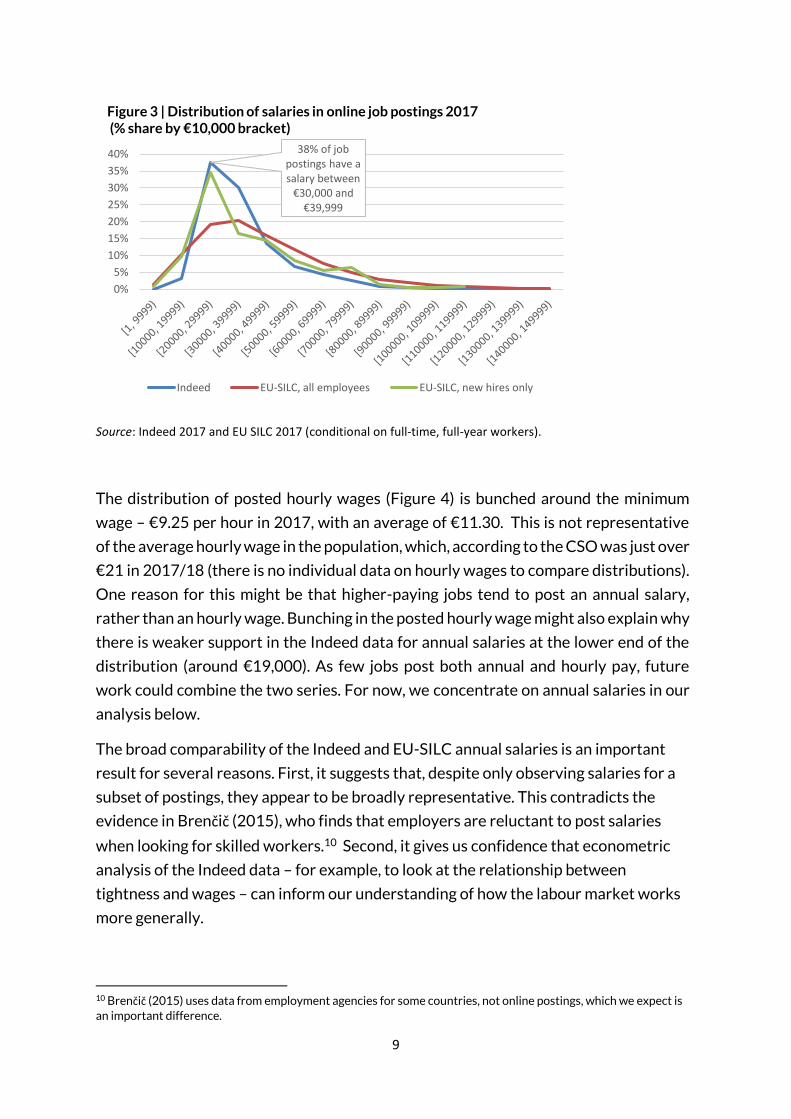
Survey on Income and Living Conditions, EU-SILC). Figure 3 plots the two salary
distributions for 2017, the last available year of EU-SILC micro data. It is important to
point out that we restrict ourselves to salaries of new hires in the survey data. The two
distributions are very similar. The mean salary in the Indeed Ireland job posting data is
€36,700, compared with €38,800 for new hires in EU-SILC.9
8 Results from a regression of job tenure on a sector dummy (Nace Rev 2 J) and age, using the LFS microdata. 9 We use the 2017 data to calculate the salary distribution, as this is the latest available EU-SILC release. Lydon and Lozej (2018) show that the salary distribution for new hires is very different to that for incumbent workers, hence our focus on new hires.
9
Source: Indeed 2017 and EU SILC 2017 (conditional on full-time, full-year workers).
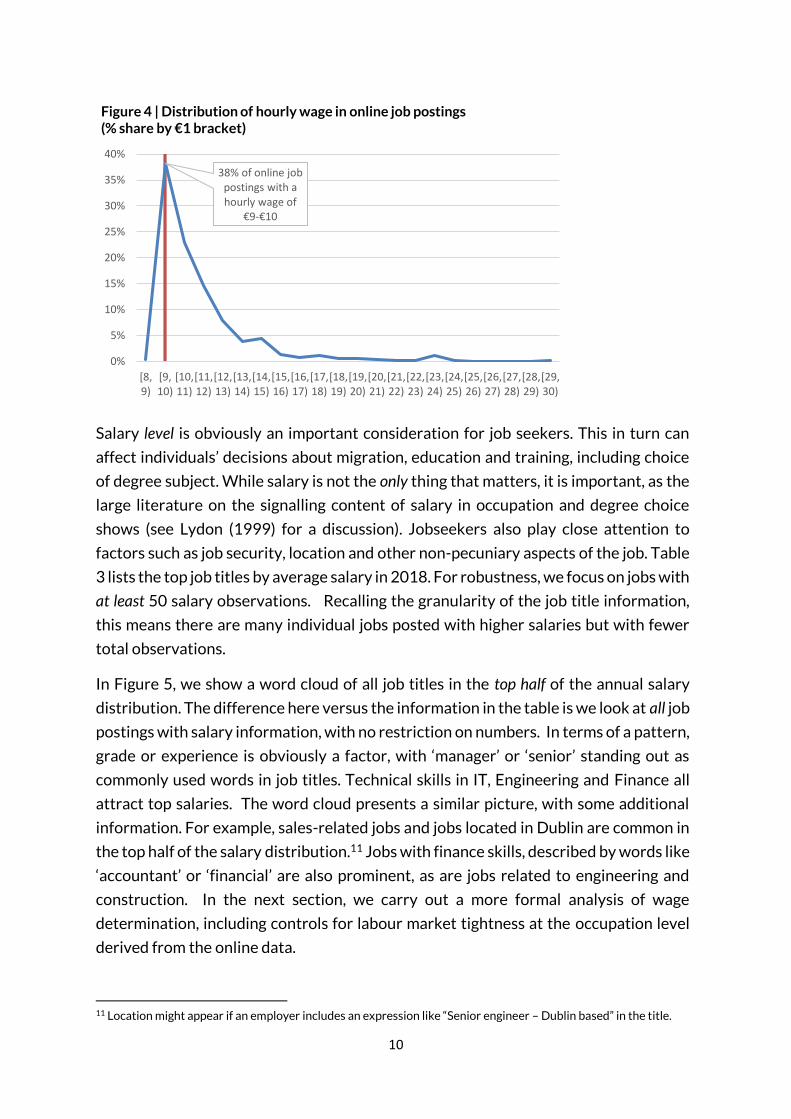
The distribution of posted hourly wages (Figure 4) is bunched around the minimum
wage – €9.25 per hour in 2017, with an average of €11.30. This is not representative
of the average hourly wage in the population, which, according to the CSO was just over
€21 in 2017/18 (there is no individual data on hourly wages to compare distributions).
One reason for this might be that higher-paying jobs tend to post an annual salary,
rather than an hourly wage. Bunching in the posted hourly wage might also explain why
there is weaker support in the Indeed data for annual salaries at the lower end of the
distribution (around €19,000). As few jobs post both annual and hourly pay, future
work could combine the two series. For now, we concentrate on annual salaries in our
analysis below.
The broad comparability of the Indeed and EU-SILC annual salaries is an important
result for several reasons. First, it suggests that, despite only observing salaries for a
subset of postings, they appear to be broadly representative. This contradicts the
evidence in Brenčič (2015), who finds that employers are reluctant to post salaries
when looking for skilled workers.10 Second, it gives us confidence that econometric
analysis of the Indeed data – for example, to look at the relationship between
tightness and wages – can inform our understanding of how the labour market works
more generally.
10 Brenčič (2015) uses data from employment agencies for some countries, not online postings, which we expect is
an important difference.
38% of job postings have a salary between
€30,000 and €39,999
0%
5%
10%
15%
20%
25%
30%
35%
40%
Figure 3 | Distribution of salaries in online job postings 2017(% share by €10,000 bracket)
Indeed EU-SILC, all employees EU-SILC, new hires only
10
Salary level is obviously an important consideration for job seekers. This in turn can
affect individuals’ decisions about migration, education and training, including choice
of degree subject. While salary is not the only thing that matters, it is important, as the
large literature on the signalling content of salary in occupation and degree choice
shows (see Lydon (1999) for a discussion). Jobseekers also play close attention to
factors such as job security, location and other non-pecuniary aspects of the job. Table
3 lists the top job titles by average salary in 2018. For robustness, we focus on jobs with
at least 50 salary observations. Recalling the granularity of the job title information,
this means there are many individual jobs posted with higher salaries but with fewer
total observations.
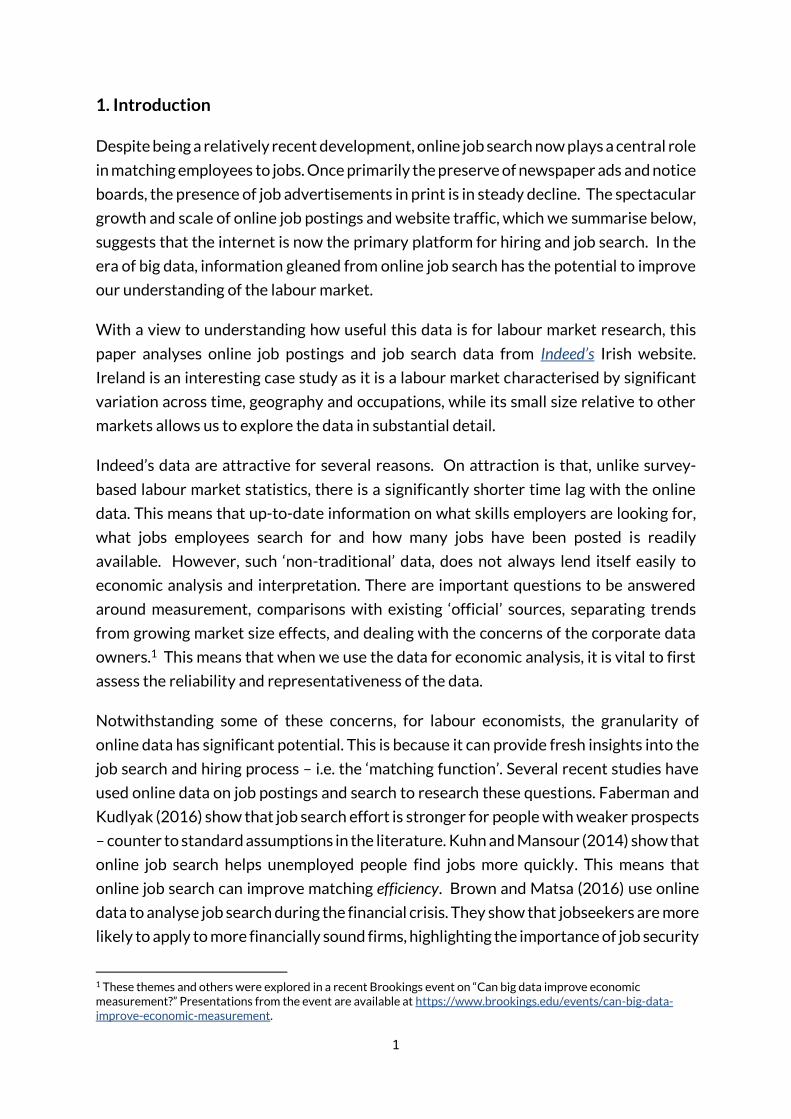
In Figure 5, we show a word cloud of all job titles in the top half of the annual salary
distribution. The difference here versus the information in the table is we look at all job
postings with salary information, with no restriction on numbers. In terms of a pattern,
grade or experience is obviously a factor, with ‘manager’ or ‘senior’ standing out as
commonly used words in job titles. Technical skills in IT, Engineering and Finance all
attract top salaries. The word cloud presents a similar picture, with some additional
information. For example, sales-related jobs and jobs located in Dublin are common in
the top half of the salary distribution.11 Jobs with finance skills, described by words like
‘accountant’ or ‘financial’ are also prominent, as are jobs related to engineering and
construction. In the next section, we carry out a more formal analysis of wage
determination, including controls for labour market tightness at the occupation level
derived from the online data.
11 Location might appear if an employer includes an expression like “Senior engineer – Dublin based” in the title.
38% of online job postings with a hourly wage of
€9-€10
0%
5%
10%
15%
20%
25%
30%
35%
40%
[8,9)
[9,10)
[10,11)
[11,12)
[12,13)
[13,14)
[14,15)
[15,16)
[16,17)
[17,18)
[18,19)
[19,20)
[20,21)
[21,22)
[22,23)
[23,24)
[24,25)
[25,26)
[26,27)
[27,28)
[28,29)
[29,30)
Figure 4 | Distribution of hourly wage in online job postings (% share by €1 bracket)

11
Table 3 | Top 10 job titles by salary (2018)
Job title Average salary
Contract Manager €74,000
Pharmacist €68,000
Finance Manager €60,000
Site Manager €60,000 Project Manager €57,000
Site Agent €56,000
Foreman €55,000
Quantity Surveyor €54,000
Site Engineer €52,000 Software Engineer €51,000 Financial Accountant €51,000
Source: Indeed. Average salary is calculated as exponent (mean log salary) in 2018.
Minimum number of observations per job title: 50
Figure 5 | Most commonly occurring words in the titles of top-paying jobs
Source: Indeed. We rank all salaries of all jobs in 2018 and use the top half of the distribution to construct the word cloud.
12
3. Labour market tightness and wages
Labour market tightness refers to the balance of demand and supply in the labour
market. The smaller the gap between the number of workers employers demand and
the available supply of workers, the tighter the market. The wage bargaining setup in
search and matching models allows the wage to increase with tightness as bargaining
power shifts from employers to employees; see, for example, Cahuc et al (2014,
Chapter 9) or Hornstein et al (2005) for an exposition of the framework. For policy
makers, understanding tightness and how it affects wage growth is important for at
least two reasons. First, higher wages mean higher costs for firms, which could feed
through to inflation. Second, as earnings from employment are the main source of
income for households, wage developments influence savings and spending decisions,
contributing significantly to domestic demand.12 Recent Central Bank research has
looked at the relationship between wages and tightness using a Philips curve – which
suggests that wage growth tends to pick up when unemployment is low – and job
switching rates – which show that periods when job switching is high tend to be
followed by higher wage growth.13
The basic search and matching framework defines labour market tightness as the ratio
of vacancies (V) to unemployment (U). As Pissarides (2009) shows, however, the wage
that matters for job creation is that of new hires, and not aggregate or average wages.
This is one of the attractions of job posting data: by definition, all the information on
(offered) wages and salaries is for new hires. Using a decade of wage data derived from
administrative tax returns, and occupation/regional unemployment rates to proxy
tightness, Lydon and Lozej (2018) show that new hires’ pay is more than twice as
sensitive to changes in the unemployment rate as incumbent workers’ pay. In essence,
our aim in this paper is to update the Lydon and Lozej (2018) evidence using a measure
of tightness derived from Indeed’s online job postings.
The evidence in Figure 1 indicates that online job postings are a close substitute for
vacancies. In the standard model, the inclusion of unemployment in the denominator
aims to capture, in a very broad sense, how much job search is happening at any one
time. However, the extent of job search is actually the product of two factors: the
number of people searching and the degree of search effort. Unemployment only
imperfectly captures the first element and, arguably, does not capture search effort
12 In 2018, personal consumption expenditure accounted for around half of total domestic demand in Ireland. 13 One of the draw-backs of the job switching metric for Ireland is that it cannot differentiate between voluntary and involuntary layoffs; see Staunton and Lydon (2018). This makes it all the more important to look at alternative measures of tightness. On Phillips curves, see Linehan et al. (2017) and Byrne and Zekaite (2018). Of course, aggregate wage growth can also be impacted by other factors, such as firm dynamics, see Adrjan (2018).
13
very well at all.14 We use Indeed data on the number of clicks on job postings to capture
search effort directly. Our tightness measure is postings divided by clicks.
Clicks capture the number of user clicks on job postings, which open a description of
the role in both the mobile and web formats of the Indeed site.15 It is important to point
out that we do not capture the number of users doing the clicking. Whilst using cookies
or registered user data could address this, these remain imperfect ways to identify
unique users. They also introduce different problems, namely selection of registered
users. In any case, it is difficult to see how using the number of clicks could bias our
measure across time and/or between jobs. It is reasonable to assume that the same job
seeker clicking on the same job multiple times is not something that varies
systematically across jobs or time.
As well as capturing search effort directly, the granularity of the Indeed clicks and
postings data offers other advantages. Studies that use micro data on wages, such as
Stüber (2016), Haefke and Van Rens (2013) and Gertler et al (2016), typically relate
individual wages to aggregate measures of unemployment and vacancies, for example
at a regional or one-digit occupation level. In this paper, we construct a measure of
tightness (postings/clicks) at the three-digit occupation level, almost 600 occupations in
the data. This significantly reduces measurement error, and therefore removes a key
downward bias from our estimates of the relationship between tightness and pay. With
more data, we can also explore the functional form of the pay-tightness relationship.
Specifically, we can test for threshold effects. The literature on non-linear Phillips
curve (e.g. Albuquerque (2016)) finds that wages and inflation respond non-linearly to
changes in slack, with larger jumps evident above certain threshold levels.
Using clicks to track behaviour, whilst relatively novel in economic research, is
fundamental to the commerciality of online services. Clicks are one way in which the
owners of the online content or technology monetise the interaction, either through
advertising revenue or other forms of direct targeted sales. Clicks have also been used
by economists to measure demand. A recent example is the paper by Gorodnichenko
et al. (2018) uses data from an online shopping platform to build a demand curve,
including matching clicks (as a proxy for sales) to price quotes.
In our case, clicks capture the degree of search (both search numbers and search effort)
for a given job or occupation. If clicks are high, we interpret this as implying there is
14 This is one of the contributions of Faberman and Kudlyak (2016), who use OJS data to measure search effort directly. 15 We exclude activity carried out through the Application Programming Interface, or API, which captures activities of customers or internal programmers.

14
ample supply of workers. We assume that employers can observe supply ex-ante, and
post wages in job adverts to reflect the relative demand for and supply of employees.
Specification and Results
We use a wage regression to relate posted salaries (in logs) to job characteristics, a
time-trend and tightness (postings/clicks in logs).16 We use data on job postings with
salary information for the period January 2016 to December 2018, giving us a sample
of around 52,000 jobs. Whilst Indeed has been posting jobs in Ireland since 2009, the
initial years of operation are characterised by very high rates of growth, both as the
online job posting market grew and as Indeed’s penetration of that market increased.
We therefore focus on the more recent years to minimise any bias arising from growth
in market size/penetration. We also include month-year dummies for the date of initial
posting. As we are specifically interested in whether the Indeed data contain any
incremental information over and above what we can learn from existing public data
sources, we also include regional unemployment (8 NUTS III regions) to capture local
labour market conditions.
We consider both the cross-sectional and time-series dimension of clicks. Whilst clicks
are observed at the level of the individual job posting, they can also be aggregated, for
example up to Standard Occupational Codes (or SOC) using the indeed cross-walk from
job titles to US SOC. Aggregation is potentially attractive for two reasons. First, if we
have concerns about small cell-size or noise at the job posting level that could distort
the results; and second, US SOC dummy variables are available at the same level of
aggregation (3-digit). When we use postings/clicks at the US SOC 3-digit level, we use
annual averages.
The job postings themselves contain a wealth of information on job and (desired)
candidate characteristics. Indeed combines both postings published through its own
platform and postings collated from across the internet, including from companies’ own
websites. This means that there is no job-posting template, resulting in a considerable
amount of work to mine the information from the job ads.17 From this exercise, we
extract information on experience, education, job type, contract type, full-/part-time
and job location (26 counties). Summary statistics are shown in Table A1 in the
appendix.
16 See Chapter 9 in “Labor economics”, by Cahuc, Pierre, Stéphane Carcillo, and André Zylberberg (MIT press, 2014) for a derivation of a wage curve linking the wage and labour market tightness through the wage bargaining process. Hornstein et al (2005) also explain the theoretical framework linking wages to tightness (unemployment in their case). 17 Einav et al. (2015) and Marinescu and Wolthoff (2016) carry out a similar exercise for ebay adverts and online job postings respectively.
15
Table 3 shows the regression results. The dependent variable is the log of the posted
wage.18 The unemployment rate is available for eight NUTS III regions and is included
at a three-month lag, to allow wages adjust to conditions. All specifications include
month-year controls, and we incrementally add occupation fixed effects and/or the
Indeed postings/clicks tightness measure.
The unemployment rate is significant in the specification with occupation fixed effects
(column (2)). As unemployment is measured in percentage points, the coefficient can
be interpreted as a semi-elasticity. The coefficient (-0.80) means that a 1% decrease in
the unemployment rate is associated with a 0.8% increase in wages. This result is very
much in line with the results in Lydon and Lozej (2018), Stüber (2016), Haefke and Van
Rens (2013) and Gertler et al (2016).
The other factors that are correlated with higher wages tally with the unconditional
picture from the word cloud (Figure 5). Posted wages are higher for jobs located in
Dublin (over 8% higher on average). This can be interpreted as pure Dublin wage
premium, as the regression includes many other controls, including occupation fixed
effects. Not surprisingly, jobs with higher educational requirements tend to have
higher posted wages. For example, jobs requiring a college degree have a 15 to 20% pay
premium. Higher grade/experience jobs also pay more, with managerial jobs
registering a premium of 21%. Posted wages for apprenticeships and internships are
30% lower. Jobs that involve part-time work also carry a large wage penalty, with
wages 25% lower on average.
In column (3), we add the tightness measure (postings/clicks), initially at the US SOC 3-
digit level. Tightness is positively correlated with wages and statistically significant,
even when unemployment is not (when we exclude occupation fixed effects), with a
coefficient of 0.18. Compared to specification (1), the R2 is significantly larger including
the tightness measure, increasing from 0.18 to 0.26. To interpret the 0.18 coefficient
on tightness economically, it implies that a one standard deviation increase in tightness
(0.64) increases wages by 11%. This seems implausibly high, and it seems likely that the
measure is, in part picking up occupation fixed effects – given that we measure
postings/clicks at the US-SOC 3 digit level. In specification (4), therefore, we add
occupation fixed effects. The coefficient on tightness is reduced, but remains (just)
statistically significant. As before, increases in the unemployment rate reduce posted
wages (-0.747). Comparing the two effects, a one standard deviation fall in
unemployment (1.19) is associated with a 0.88% increase in wages (-1.19*0.747);
whereas a one standard deviation increase in tightness (0.64) is associated with a 3.7%
18 As inflation was almost zero during this period, hence we use nominal wages.
16
increase in wages (0.058*0.64). These effects, whilst still large and significant, are more
plausible than the specification excluding occupation fixed effects.
In the final specification (5) in Table 3, we measure clicks at the lowest level of
aggregation, the individual posting level. This also allows for full time variation in clicks.
The average number of clicks at the job posting level is 19 (see Table A1 in the
appendix), and the minimum is, obviously, one (we exclude a small number of postings
with zero clicks, 669 observations). At this most granular, the standard deviation of the
tightness measure is higher, increasing from 0.624 at the US SOC 3-digit level to 1.495
at this level. The coefficient on our tightness measure remains positive, although it falls
from 0.058 to 0.018. That precision of the estimate is, however, far greater, as
illustrated by the fall in the standard error compared with specification (4). In economic
terms, the coefficient of 0.018 implies that a one-standard deviation increase in
tightness (1.495) increases wages by 2.7%.
Allowing for threshold effects in tightness
The regression results suggest that wages are increasing in tightness, even after
controlling for local unemployment, job/worker characteristics and occupation fixed
effects. In the raw data, the wages-tightness relationship appears to move through
several thresholds, as shown in Figure 6. There is little or no difference in wages at low
levels of tightness (bottom third of the distribution), a large increase at the middle of
the distribution, before flattening again, and, finally, one more large increase at very
high levels of tightness (the top two deciles of the distribution).
To test for threshold effects, we re-estimate specifications 4 and 5, with dummy
variables for deciles of the tightness distribution. The results are shown in Table 4. The
coefficients show that wage effects of tightness has several thresholds, more-or-less
in-line with the pattern in Figure 6. At very low levels of labour market tightness, there
is little or no wage boost from increasing tightness. Wages jump up considerably, by
between 4 and 8%, in the middle of the distribution. Finally, in the top-two deciles,
wages are around 10% higher. As with the linear results, the coefficients on
log(1/clicks) are measured with far greater precision. These results also suggest just
one threshold in the tightness relationship with wages, at the 7th decile, after which the
wage premium largely levels-off. It is important to emphasise that these effects are
present even after controlling for a very wide range of job/application characteristics
– many of which are positively correlated with pay – and after controlling for
occupation fixed effects.

17
Table 3 | Wage regression results – (postings/clicks at US SOC 3-digit level)
(1) (2) (3) (4) (5)
Coeff. Std. err. Coeff.
Std. err. Coeff.
Std. err. Coeff.
Std. err. Coeff. Std. err.
Unemployment rate 0.100 (0.335) -0.805*** (0.283) 0.102 (0.586) -0.747*** (0.347) -0.854*** (0.286)
Log (postings/clicks)+ 0.181*** (0.022) 0.058* (0.033)
Log (1/clicks)++ 0.181*** (0.022) 0.058* (0.033) 0.018*** (0.001)
Manager 0.199 (0.004) 0.209 (0.004) 0.188 (0.033) 0.211 (0.033) 0.203 (0.004)
Associate 0.120 (0.019) 0.071 (0.017) 0.061 (0.044) 0.070 (0.033) 0.062 (0.017)
Education < degree [omit] [omit] [omit] [omit]
Bachelor 0.296 (0.007) 0.150 (0.007) 0.213 (0.018) 0.145 (0.013) 0.144 (0.007)
Master 0.305 (0.017) 0.197 (0.015) 0.267 (0.032) 0.197 (0.029) 0.199 (0.015)
Doctoral 0.303 (0.068) 0.181 (0.066) 0.274 (0.086) 0.177 (0.073) 0.187 (0.065)
Full-time [omit] [omit] [omit] [omit] [omit]
Part-time -0.255 (0.012) -0.249 (0.011) -0.248 (0.041) -0.248 (0.031) -0.235 (0.011)
Permanent 0.084 (0.003) 0.049 (0.003) 0.071 (0.013) 0.048 (0.008) 0.041 (0.003)
Apprenticeship -0.287 (0.051) -0.310 (0.053) -0.238 (0.054) -0.318 (0.056) -0.295 (0.053)
Internship -0.265 (0.081) -0.291 (0.086) -0.280 (0.101) -0.288 (0.095) -0.273 (0.087)
Contract 0.026 (0.006) 0.033 (0.006) 0.028 (0.019) 0.032 (0.013) 0.030 (0.006)
County
Dublin [omit] [omit] [omit] [omit] [omit]
Cork -0.081 (0.005) -0.075 (0.005) -0.102 (0.031) -0.077 (0.021) -0.071 (0.005)
Clare -0.122 (0.018) -0.092 (0.015) -0.124 (0.022) -0.098 (0.017) -0.081 (0.015)
Cavan 0.000 (0.022) -0.034 (0.018) -0.032 (0.031) -0.035 (0.024) -0.023 (0.018)
Carlow -0.161 (0.021) -0.141 (0.018) -0.172 (0.036) -0.144 (0.032) -0.129 (0.018)
Donegal -0.098 (0.022) -0.122 (0.018) -0.120 (0.031) -0.123 (0.023) -0.108 (0.018)
Galway -0.084 (0.010) -0.052 (0.009) -0.087 (0.019) -0.053 (0.015) -0.039 (0.009)
Kildare -0.075 (0.009) -0.060 (0.008) -0.072 (0.017) -0.060 (0.011) -0.052 (0.008)
Kilkenny -0.119 (0.021) -0.092 (0.016) -0.119 (0.031) -0.093 (0.021) -0.077 (0.016)
Kerry -0.151 (0.017) -0.104 (0.015) -0.156 (0.036) -0.105 (0.025) -0.095 (0.016)
Longford -0.092 (0.035) -0.081 (0.027) -0.092 (0.064) -0.083 (0.036) -0.064 (0.027)
Louth -0.121 (0.012) -0.093 (0.01) -0.106 (0.026) -0.095 (0.020) -0.081 (0.01)
Limerick -0.095 (0.010) -0.071 (0.008) -0.091 (0.019) -0.073 (0.012) -0.060 (0.008)
Leitrim -0.159 (0.036) -0.087 (0.030) -0.169 (0.044) -0.087 (0.036) -0.079 (0.029)
Laois -0.118 (0.031) -0.071 (0.026) -0.099 (0.038) -0.071 (0.026) -0.052 (0.026)
Meath -0.113 (0.013) -0.083 (0.012) -0.093 (0.023) -0.084 (0.019) -0.070 (0.012)
Monaghan -0.092 (0.015) -0.120 (0.015) -0.091 (0.044) -0.120 (0.031) -0.112 (0.014)
Mayo -0.075 (0.020) -0.043 (0.017) -0.089 (0.028) -0.052 (0.019) -0.029 (0.017)
Offaly -0.156 (0.031) -0.093 (0.027) -0.136 (0.030) -0.094 (0.021) -0.069 (0.028)
Roscommon -0.139 (0.023) -0.108 (0.018) -0.135 (0.027) -0.110 (0.015) -0.101 (0.018)
Sligo -0.122 (0.021) -0.095 (0.019) -0.131 (0.025) -0.096 (0.031) -0.080 (0.019)
Tipperary -0.091 (0.017) -0.069 (0.013) -0.086 (0.028) -0.065 (0.011) -0.064 (0.014)
Waterford -0.074 (0.016) -0.058 (0.013) -0.079 (0.027) -0.062 (0.013) -0.050 (0.013)
Westmeath -0.138 (0.019) -0.090 (0.016) -0.137 (0.035) -0.094 (0.019) -0.075 (0.016)
Wicklow -0.134 (0.011) -0.089 (0.009) -0.122 (0.031) -0.090 (0.025) -0.083 (0.01)
Wexford -0.026 (0.019) -0.030 (0.015) -0.044 (0.041) -0.030 (0.030) -0.014 (0.015)
Year-month FE Yes Yes Yes Yes Yes
Occupation FE No Yes No Yes Yes
N , R2 52,066 0.18 52,066 0.41 51,116 0.26 51,116 0.41 50,941 0.41
Notes: Data are Indeed Irish job postings with salary data posted between January 2016 and December 2018. Occupation fixed effects are at the US SOC 3-digit level. Dependent variable is the log of salary in job posting. Standard errors clustered at occupation level in specifications (2), (4) and (5). Standard errors in parentheses. Variation in sample size arises from a small number of postings with zero clicks. (+) Postings/clicks = sum of job postings at the US SOC 3-Digit level/sum clicks on these postings. (++) 1/clicks on each individual job posting.

18
Figure 6 | Mean of log wages by decile of tightness (postings/clicks, US SOC 3 digit)
Notes: Data are Indeed Irish job postings with salary data posted between January 2016 and
December 2018. Shaded area is the 95% confidence interval.
Table 4 | Wage regression results, non-linear tightness Log(postings/clicks)+ Log(1/clicks)++
Coeff. Std. err. Coeff. Std. err.
Unemployment rate -0.798*** (0.343) -0.880*** (0.285)
Tightness decile 1 [omit] [omit]
2 -0.009 (0.013) 0.017*** (0.006)
3 0.020** (0.009) 0.045*** (0.006)
4 0.035* (0.019) 0.053*** (0.006) 5 0.061** (0.027) 0.064*** (0.006)
6 0.079** (0.030) 0.079*** (0.006)
7 0.051* (0.031) 0.093*** (0.006)
8 0.063** (0.030) 0.094*** (0.006) 9 0.110*** (0.029) 0.096*** (0.007)
10 0.101*** (0.030) 0.086*** (0.007)
Manager 0.211 (0.033) 0.203 (0.004) Associate 0.069 (0.033) 0.062 (0.017)
Education < degree level [Omit] [Omit]
Bachelor 0.145 (0.013) 0.142 (0.007)
Master 0.196 (0.029) 0.198 (0.015) Doctoral 0.177 (0.073) 0.190 (0.065)
Full-time [Omit] [Omit]
Part-time -0.250 (0.030) -0.230 (0.011)
Permanent 0.048 (0.008) 0.040 (0.003) Apprenticeship -0.315 (0.056) -0.289 (0.053)
Internship -0.289 (0.094) -0.270 (0.086)
Contract 0.033 (0.013) 0.028 (0.006)
Year-month dummies Yes Yes
US-SOC 3D dummies Yes Yes
N 51,116 50,941
R2 0.41 0.41
Notes: See notes for Table 3. (+) measured at the US SOC 3-digit level. (++) Measured at the level
of the job posting
10.25
10.35
10.45
10.55
10.65
10.75
1 2 3 4 5 6 7 8 9 10Log
wag
e in
job
po
stin
g
Decile of tightness (postings/clicks)
19
4. Conclusion
This paper shows how data on online job postings and job search behaviour can shed
new light on labour market trends – and do so in a timely, highly granular manner. Using
data from Indeed, we construct a measure of labour market tightness (postings/clicks)
which summarises the balance of supply and demand in the labour market. We show
that jobs where demand for employees is strong relative to supply have significantly
higher wages, even after controlling for occupation fixed effects and other job and
applicant characteristics. This result contributes to a growing body of research that
quantifies the sensitivity of new hires’ pay to changes in labour market conditions.
The tightness measure we construct is also useful for employers and policy makers. We
illustrate this in Tables 4 and 5, by ranking the twenty ‘most-tight’ and ‘least tight’ jobs.
A clear picture emerges of the relative demand for skills, with skilled and experienced
jobs in engineering, finance and health dominating the list of most tight jobs. In contrast,
the twenty least tight jobs tend not to be concentrated in any one sector, but are
generally lowered skilled or elementary roles.
Future research directions for this work include assessing how labour supply and
demand respond to shocks, as well as extending the regression analysis to include job
postings with hourly posted wages. Using geographic information in job search could
also provide fresh insights into migration patterns and potential labour supply in Ireland
and other open economies. This is particularly relevant for our analysis of clicks. Unlike
unemployment as a measure of slack, clicks does not ignore potential migrant labour
supply. Identifying the specific jobs and sectors where migrant labour supply will be
important in the future is important for understanding potential employment growth.

20
Table 4 | Top-20 job titles by
postings per click / postings per CV
Job postings per click - top-20
Senior Fund Accountant Gastroenterologist Senior Mechanical Designer Tax Senior Dermatologist Senior Agency Manager Tax Director Regulatory Reporting Manger Corporate Lawyer Senior Quality Engineer Senior Design Engineer Learning Disability Nurse Accounting Supervisor Senior Process Engineer Senior Auditor Senior Staff Nurse Radiologist Senior .Net Developer Commercial Lawyer Registered Nurse - Medical / Surgical
Source: Indeed. In ascending order by
(postings / clicks). Job titles with a
minimum of 100 postings in 2018.
Table 5 | Bottom-20 job titles by
postings per click/ postings per CV
Job postings per click - bottom-20
Babysitter/Nanny Van Driver Floor Staff Shop Assistant House Cleaner Packer Office Assistant Factory Worker Sales Assistant Handy Man General Assistant Production Operator Customer Assistant Stocking Associate Apprentice Electrician Pharmacy Assistant Labourer Medical Secretary Office Administrator Retail Sales Associate
Source: Indeed. In ascending order by
(postings / clicks). Job titles with a
minimum of 100 postings in 2018.
21
References
Albuquerque, Bruno, and Ursel Baumann. “Will US inflation awake from the dead? The
role of slack and non-linearities in the Phillips curve.” Journal of Policy Modeling 39.2
(2017): 247-271.
Brenčič, Vera. “Wage posting: evidence from job ads.” Canadian Journal of
Economics/Revue canadienne d'économique 45.4 (2012): 1529-1559.
Brown, Jennifer, and David A. Matsa. “Boarding a sinking ship? An investigation of job
applications to distressed firms.” The Journal of Finance 71.2 (2016): 507-550.
Cahuc, Pierre, S. Carcillo, and André Zylberberg. “Labor economics.” MIT press, 2014.
Einav, Liran, Theresa Kuchler, Jonathan Levin, and Neel Sundaresan (2015). “Assessing
Sale Strategies in Online Markets Using Matched Listings.” American Economic
Journal: Microeconomics, 7, 215–247.
Faberman, Jason, and Marianna Kudlyak. “What does online job search tell us about
the labor market?” FRB Chicago Economic Perspectives 40.1 (2016).
Gertler, Mark, Christopher Huckfeldt, and Antonella Trigari. “Unemployment
fluctuations, match quality, and the wage cyclicality of new hires.” No. w22341.
National Bureau of Economic Research, 2016.
Gorodnichenko, Yuriy, Viacheslav Sheremirov, and Oleksandr Talavera. “Price setting
in online markets: Does IT click?” Journal of the European Economic Association 16.6
(2018): 1764-1811.
Haefke, Christian, Marcus Sonntag, and Thijs Van Rens. “Wage rigidity and job
creation.” Journal of monetary economics 60.8 (2013): 887-899.
Hornstein, Andreas, Per Krusell, and Giovanni L. Violante. “Unemployment and
vacancy fluctuations in the matching model: Inspecting the mechanism.” FRB
Richmond Economic Quarterly 91.3 (2005): 19-51.
Kuhn, Peter, and Hani Mansour. “Is Internet job search still ineffective?” The Economic
Journal 124.581 (2014): 1213-1233.
Lydon, Reamonn, and Matija Lozej. “Flexibility of new hires’ earnings in Ireland.” Labour
Economics 53 (2018): 112-127.
Lydon, Reamonn. “Aspects of the labour market for new graduates in Ireland: 1982-
1997.” Economic and Social Review Vol. 30, No. 3, July, (1999).
Marinescu, Ioana, and Ronald Wolthoff. “Opening the black box of the matching
function: The power of words.” No. w22508. National Bureau of Economic Research,
2016.
Pissarides, Christopher A. “The unemployment volatility puzzle: Is wage stickiness the
answer?” Econometrica 77.5 (2009): 1339-1369.

22
Table A1 | Summary statistics
N Mean Std. Dev. Min Max
Log (wage) 52,066 10.49 0.38 9.21 13.12
Tightness
Unemployment 52,066 6.29 1.19 3.80 14.60
Postings per click (US SOC 3-digit) 52,066 0.015 0.009 0.002 0.053
Log (postings per click, US SOC 3-digit) 51,116 -4.425 0.624 -6.012 -2.983
1/clicks (individual job posting level) 50,941 0.054 0.124 0.00007 1
Log (1/clicks, individual job posting level) 50,941 -4.066 1.495 -9.528 0
Experience/grade
Manager 52,066 27.2% 44.5% 0 1
Associate 52,066 0.6% 7.8% 0 1
Education
Bachelor 52,066 16.1% 0.367559 0 1
Master 52,066 1.4% 0.115493 0 1
Doctoral 52,066 0.2% 0.039654 0 1
Secondary 52,066 4.7% 0.212702 0 1
Job/contract type
Permanent 52,066 46.3% 49.9% 0 1
Temporary 52,066 2.7% 16.3% 0 1
Apprenticeship 52,066 0.2% 3.9% 0 1
Internship 52,066 0.1% 2.6% 0 1
Contract 52,066 7.6% 26.5% 0 1
Full-/part-time 52,066
Full-time 52,066 66.9% 47.1% 0 1
Part-time 52,066 2.7% 16.2% 0 1
Cork 52,066 9.3% 29.1% 0 1
Clare 52,066 0.7% 8.1% 0 1
Cavan 52,066 0.4% 6.5% 0 1
Carlow 52,066 0.4% 6.6% 0 1
Dublin 52,066 68.3% 46.5% 0 1
Donegal 52,066 0.5% 7.4% 0 1
Galway 52,066 2.8% 16.5% 0 1
Kildare 52,066 2.5% 15.5% 0 1
Kilkenny 52,066 0.6% 7.8% 0 1
Kerry 52,066 0.7% 8.3% 0 1
Longford 52,066 0.2% 4.8% 0 1
Louth 52,066 1.7% 13.0% 0 1
Limerick 52,066 2.5% 15.6% 0 1
Leitrim 52,066 0.1% 3.8% 0 1
Laois 52,066 0.3% 5.1% 0 1
Meath 52,066 1.1% 10.2% 0 1
Monaghan 52,066 0.7% 8.1% 0 1
Mayo 52,066 0.6% 7.6% 0 1
Offaly 52,066 0.2% 4.8% 0 1
Roscommon 52,066 0.4% 5.9% 0 1
Sligo 52,066 0.5% 7.3% 0 1
Tipperary 52,066 0.8% 9.2% 0 1
Waterford 52,066 1.0% 9.7% 0 1
Westmeath 52,066 0.8% 9.1% 0 1
Wicklow 52,066 1.6% 12.6% 0 1
Wexford 52,066 0.8% 8.7% 0 1


![LABOUR LAWS A CHANGING PARADIGM - ICSI · The establishments employing 50% Contract Labour or minimum of 20 number of Contract Labour [20%]. ... Minimum Wages Act, 1948 Minimum Wages](https://img.pdfslide.us/doc/110x75/5f9e534b011c1423ad28a4d0/labour-laws-a-changing-paradigm-icsi-the-establishments-employing-50-contract.jpg)