Embed Size (px)
Citation preview
© Department of Pharmaceutics, H. R. P. I. E. R, Shirpur, 2016-17 1 | P a g e
LABOROTORY
MANUAL
OF
PHYSICAL
PHARMACEUTICS
© Department of Pharmaceutics, H. R. P. I. E. R, Shirpur, 2016-17 2 | P a g e
LABORATORY INSTRUCTIONS
1. Laboratory should be cleaned two times in a day, first in the morning and second
in evening before closing the laboratory.
© Department of Pharmaceutics, H. R. P. I. E. R, Shirpur, 2016-17 3 | P a g e
This laboratory manual is prepared for only Students of H .R. P. I. P. E.R.
Shirpur. It should never be used by anyone without permission. The main objective
of this manual is to enhance student-teacher interaction during performing
experiments. Wide margin on every page of this manual can be used by students for
noting important points.
It is hoped that the present Laboratory practical Book in its revised and
2. Student should enter in the laboratory five minutes before the practical timing.
3. Maintaining cleanliness is the job responsibility for every student in the
laboratory.
4. Silence should be maintained in the laboratory and any disturbance should be
strictly avoided.
5. Going out and coming in between practicals should be avoided strictly.
6. Chatting unnecessary in the corridors should be avoided. Enter the lab with
clean and neat apron.
7. Keep the working table clean and neat
8. Maintain discipline in the laboratory.
9. Complete you practical record in the laboratory.
10. Be careful while using chemicals in the laboratory.
11. Turn off the burners of the gas when it is not required.
12. Close the water taps properly after use.
13. If you have any allergic problem you must use hand glows while handling the
chemicals.
14. For any problem, consult concerned teacher or technician of the laboratory.
15. Wearing ornaments while doing the experiment is strictly avoided.
PREFACE
© Department of Pharmaceutics, H. R. P. I. E. R, Shirpur, 2016-17 4 | P a g e
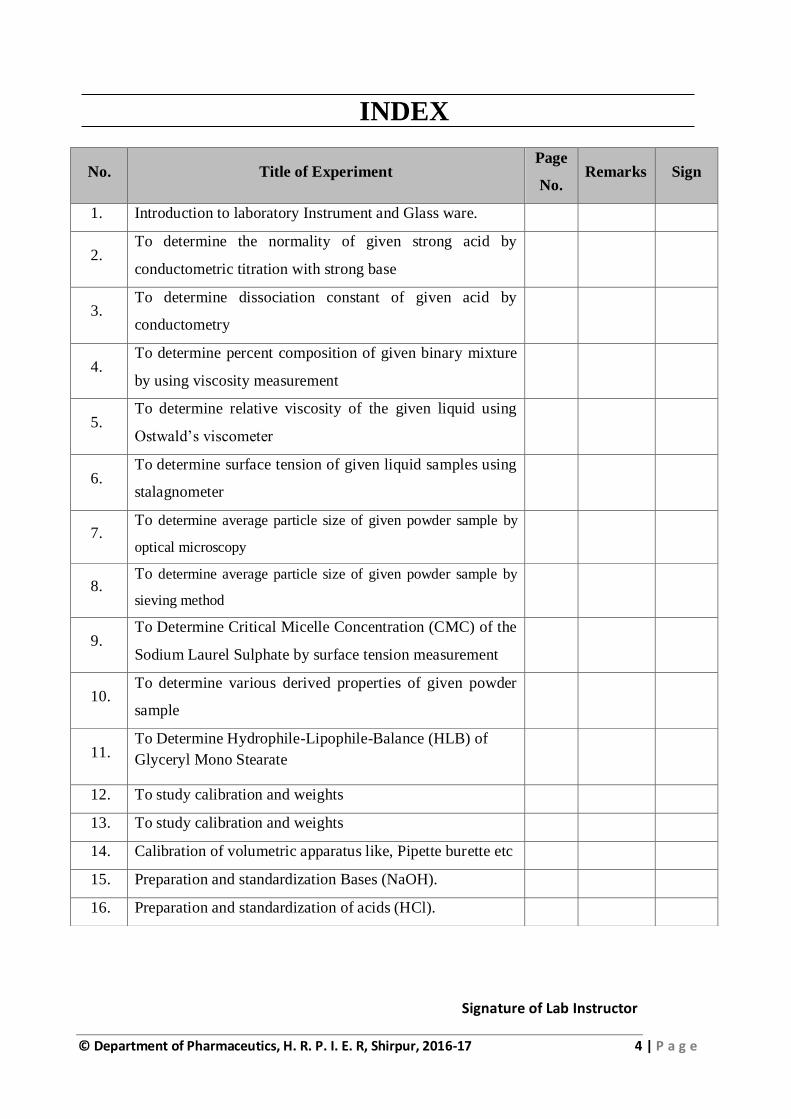
INDEX
Signature of Lab Instructor
No. Title of Experiment Page
No. Remarks Sign
1. Introduction to laboratory Instrument and Glass ware.
2. To determine the normality of given strong acid by
conductometric titration with strong base
3. To determine dissociation constant of given acid by
conductometry
4. To determine percent composition of given binary mixture
by using viscosity measurement
5. To determine relative viscosity of the given liquid using
Ostwald’s viscometer
6. To determine surface tension of given liquid samples using
stalagnometer
7. To determine average particle size of given powder sample by
optical microscopy
8. To determine average particle size of given powder sample by
sieving method
9. To Determine Critical Micelle Concentration (CMC) of the
Sodium Laurel Sulphate by surface tension measurement
10. To determine various derived properties of given powder
sample
11. To Determine Hydrophile-Lipophile-Balance (HLB) of
Glyceryl Mono Stearate
12. To study calibration and weights
13. To study calibration and weights
14. Calibration of volumetric apparatus like, Pipette burette etc
15. Preparation and standardization Bases (NaOH).
16. Preparation and standardization of acids (HCl).
© Department of Pharmaceutics, H. R. P. I. E. R, Shirpur, 2016-17 5 | P a g e
© Department of Pharmaceutics, H. R. P. I. E. R, Shirpur, 2016-17 6 | P a g e
Aim- Introduction to laboratory Instrument and Glass ware.
Theory-
1. Glass wares
2. Beakers
3. Funnel
4. Porcelain apparatus
5. Pipettes
6. Burettes
7. Analytical Balance
8. Weights
Result – All necessary laboratory instruments were handled and studies
Experiment No.: 1 Date:
Laboratory Instrument and Glass Ware
© Department of Pharmaceutics, H. R. P. I. E. R, Shirpur, 2016-17 7 | P a g e
Aim:
To determine the normality of given strong acid by conductometric titration
with strong base.
Learning objective:
You will be able to explain-
1. Conductometric titration
2. Equivalence point
3. Conductance of solution and its unit
Introduction:
The electrolytic conductors obey Ohm’s law. It states that strength of the current
(I) passing through the conductor of resistance (R) is directly proportional to the
potential difference (V) applied across the conductor.
The resistance (R) is directly proportional to the length (l) and inversely
proportional to cross section (a) of the conductor.
Where, = specific resistance
When l = 1cm, a = 1 cm2 and R = .
The unit of specific conductance is mho.cm-1
The Conductance of a solution of electrolyte is determined by conductivity cell.
V
R
I =
l
a
R l
a
R =
1
Specific conductance = = KC
Experiment No.: 2 Date:
Conductometric Titration
© Department of Pharmaceutics, H. R. P. I. E. R, Shirpur, 2016-17 8 | P a g e
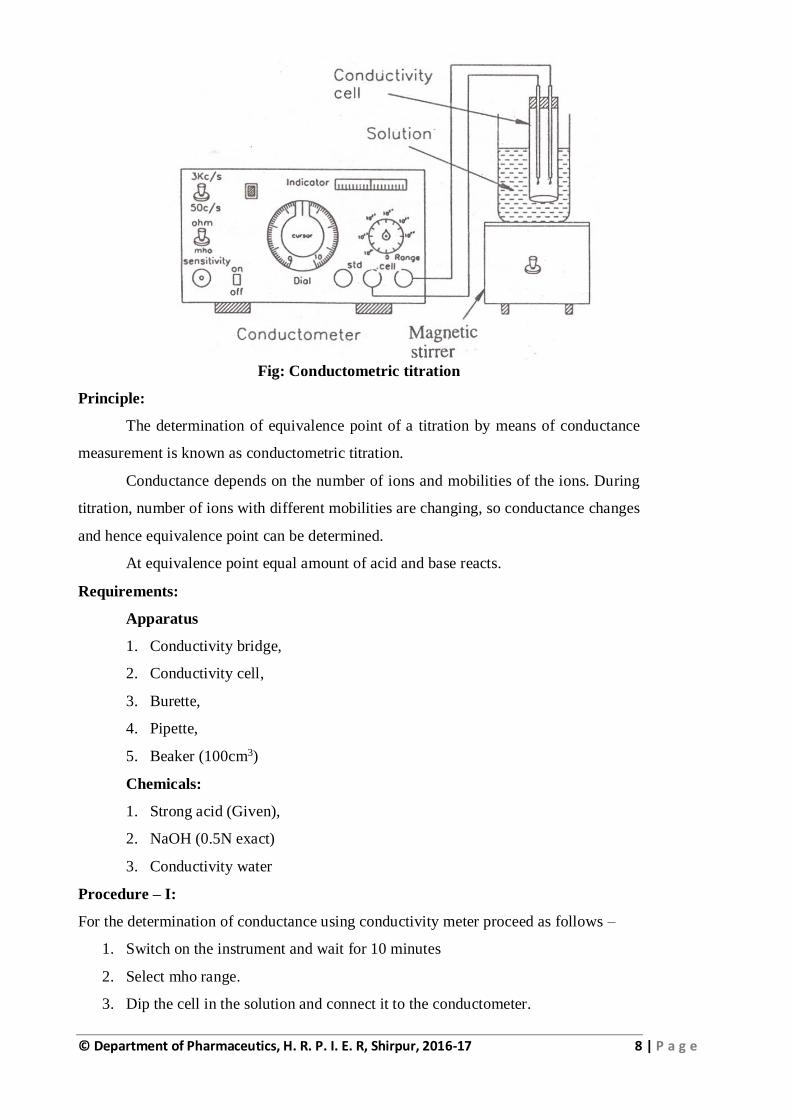
Fig: Conductometric titration
Principle:
The determination of equivalence point of a titration by means of conductance
measurement is known as conductometric titration.
Conductance depends on the number of ions and mobilities of the ions. During
titration, number of ions with different mobilities are changing, so conductance changes
and hence equivalence point can be determined.
At equivalence point equal amount of acid and base reacts.
Requirements:
Apparatus
1. Conductivity bridge,
2. Conductivity cell,
3. Burette,
4. Pipette,
5. Beaker (100cm3)
Chemicals:
1. Strong acid (Given),
2. NaOH (0.5N exact)
3. Conductivity water
Procedure – I:
For the determination of conductance using conductivity meter proceed as follows –
1. Switch on the instrument and wait for 10 minutes
2. Select mho range.
3. Dip the cell in the solution and connect it to the conductometer.
© Department of Pharmaceutics, H. R. P. I. E. R, Shirpur, 2016-17 9 | P a g e
4. Select the appropriate range and read the reading on screen. In digital
conductometer directly conductance is shown on the screen.
Procedure – II:
1. Now wash the conductivity cell and beaker with conductivity water.
2. Pipette out 10cm3 of given acid solution in a beaker. Place it on magnetic stirrer.
Put stirrer in it. Dip the conductivity cell in it. Add sufficient amount of
conductivity water to cover the electrodes completely. Connect the cell to
conductometer. Stir the solution.
3. Measure conductance of solution.
4. Fill the burette with 0.5N NaOH solution.
5. Add 0.2cm3 NaOH solution in a beaker containing strong acid solution. Stir the
solution.
6. Measure conductance.
7. Repeat procedure (5) and (6) until equivalence point is obtained.
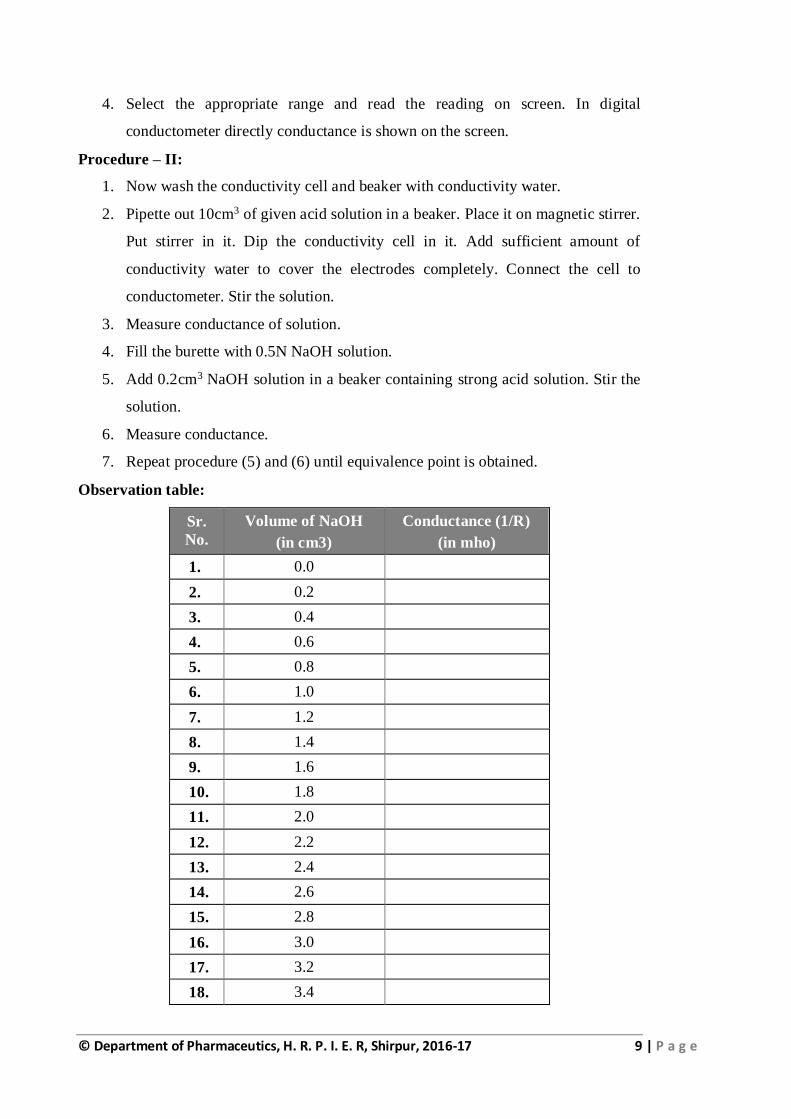
Observation table:
Sr.
No.
Volume of NaOH
(in cm3)
Conductance (1/R)
(in mho)
1. 0.0
2. 0.2
3. 0.4
4. 0.6
5. 0.8
6. 1.0
7. 1.2
8. 1.4
9. 1.6
10. 1.8
11. 2.0
12. 2.2
13. 2.4
14. 2.6
15. 2.8
16. 3.0
17. 3.2
18. 3.4
© Department of Pharmaceutics, H. R. P. I. E. R, Shirpur, 2016-17 10 | P a g e
19. 3.6
20. 3.8
21. 4.0
Plot a graph of conductance Vs cm3 of NaOH added.
Find the equivalence point Z from the graph.
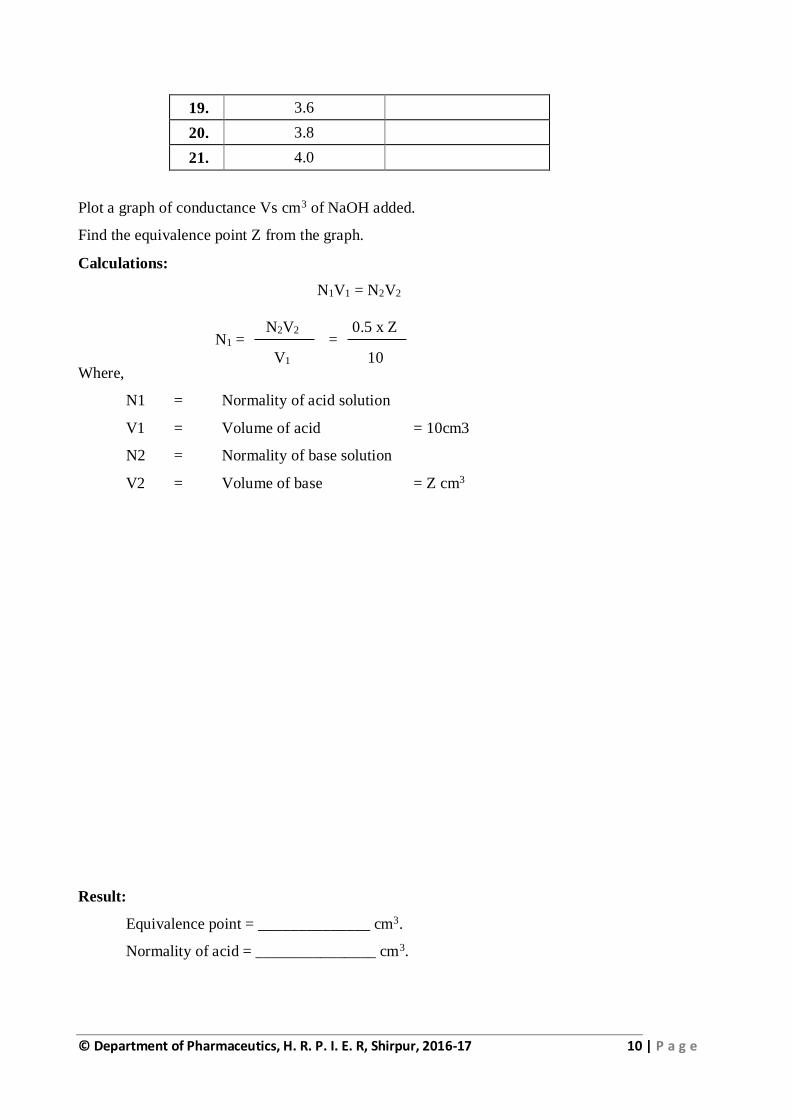
Calculations:
N1V1 = N2V2
Where,
N1 = Normality of acid solution
V1 = Volume of acid = 10cm3
N2 = Normality of base solution
V2 = Volume of base = Z cm3
Result:
Equivalence point = ______________ cm3.
Normality of acid = _______________ cm3.
N2V2
V1
N1 = 0.5 x Z
10
=
© Department of Pharmaceutics, H. R. P. I. E. R, Shirpur, 2016-17 11 | P a g e
Answer the following
1. Define equivalence point.
2. What is conductometric titration?
3. Write a reaction between HCl and NaOH.
4. Write advantages of conductometric titration.
5. What is conductivity cell? Explain with figure.
© Department of Pharmaceutics, H. R. P. I. E. R, Shirpur, 2016-17 12 | P a g e
Aim:
To determine dissociation constant of weak monobasic acid by conductometric
measurement.
Aim:
To determine dissociation constant of given acid by conductometry.
Learning objective:
You will be able to explain –
1. Cell constant
2. Equivalence conductance and its units.
3. Equivalence conductance at infinite dilution.
4. Kohlrausch’s law
5. Degree of dissociation and dissociation constant
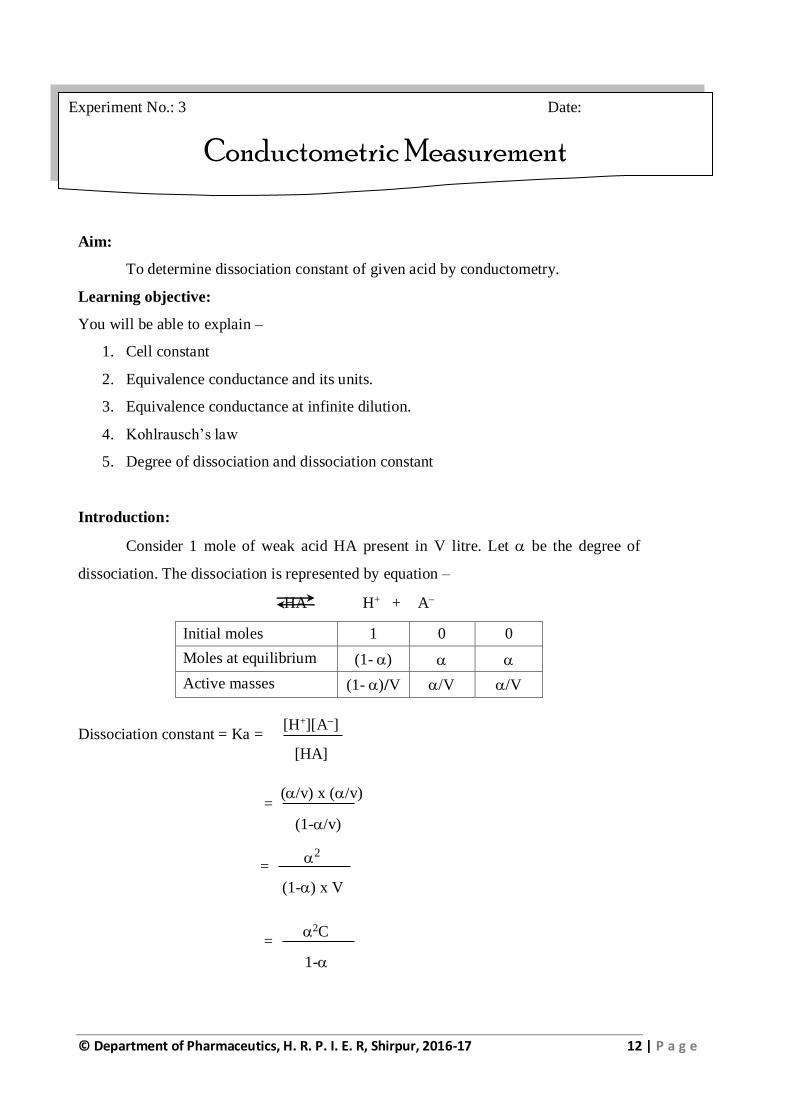
Introduction:
Consider 1 mole of weak acid HA present in V litre. Let be the degree of
dissociation. The dissociation is represented by equation –
HA H+ + A
Initial moles 1 0 0
Moles at equilibrium (1- )
Active masses (1- )/V /V /V
Dissociation constant = Ka =
Experiment No.: 3 Date:
Conductometric Measurement
[H+][A]
[HA]
(/v) x (/v)
(1-/v)
=
2
(1-) x V
=
2C
1-
=
© Department of Pharmaceutics, H. R. P. I. E. R, Shirpur, 2016-17 13 | P a g e
Where, C is concentration in moles/lit of acid solution. The degree of dissociation ()
can be determined by conductivity measurement.
c represents equivalent conductance at concentration C.
o represents equivalent conductance at zero concentration.
Then,
Substituting the value of and C, the dissociation constant can be determined.
o is obtained by the use of Kohlrausch’s law.
o = o+ + o
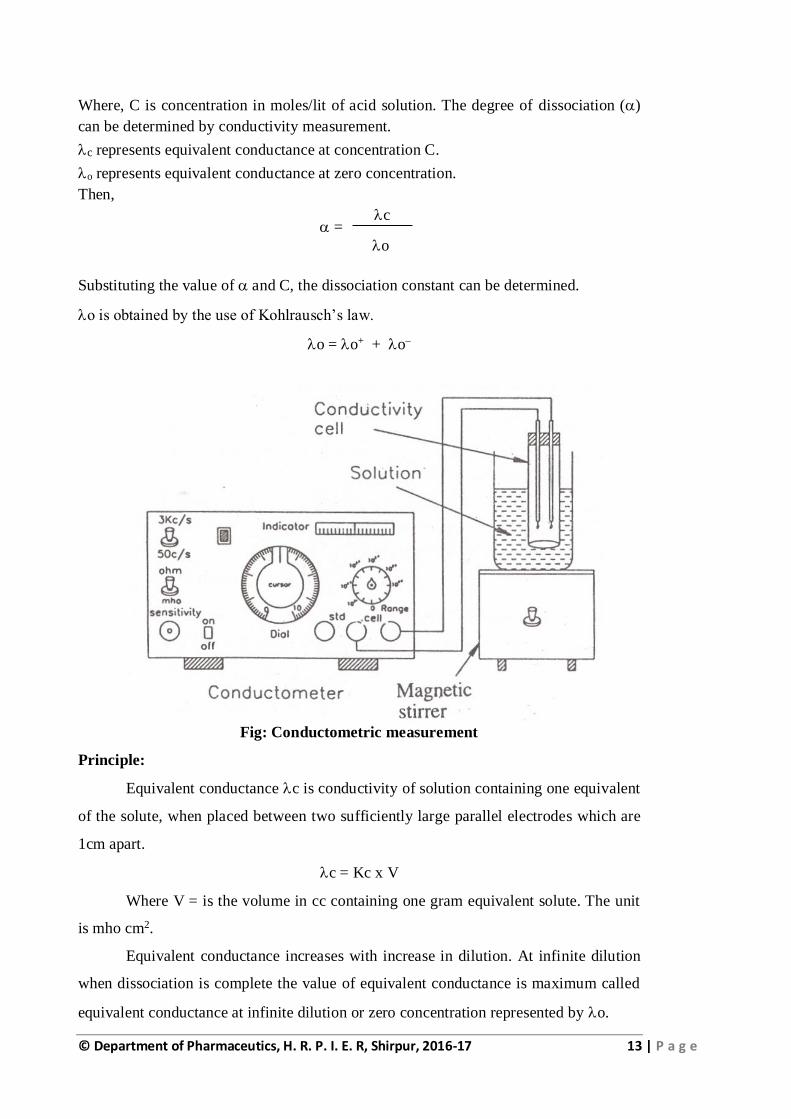
Fig: Conductometric measurement
Principle:
Equivalent conductance c is conductivity of solution containing one equivalent
of the solute, when placed between two sufficiently large parallel electrodes which are
1cm apart.
c = Kc x V
Where V = is the volume in cc containing one gram equivalent solute. The unit
is mho cm2.
Equivalent conductance increases with increase in dilution. At infinite dilution
when dissociation is complete the value of equivalent conductance is maximum called
equivalent conductance at infinite dilution or zero concentration represented by o.
c
o
=
© Department of Pharmaceutics, H. R. P. I. E. R, Shirpur, 2016-17 14 | P a g e
Apparatus
1. Conductivity bridge,
2. Conductivity cell,
3. Pipette
4. Beaker
Chemicals
1. 0.02M KCl,
2. 0.1N monobasic acid,
3. Conductivity water
Procedure:
Part A: Determination of cell constant.
1. Wash the cell with conductivity water. Rinse the cell and beaker with 0.02M
KCl solution. Take sufficient quantity of 0.02M KCl solution so that electrodes
are completely covered with the solution about 50cm3.
2. Connect the cell to Conductivity Bridge.
3. Measure the conductance.
Observation table:
Room temperature = ____________ oC.
Solution Conductance (mho)
0.02M KCl
Calculations:
=
Part B: Determination of dissociation constant.
Specific conductance of 0.02M KCl
Conductance of 0.02M KCl solution observed Cell constant = =
© Department of Pharmaceutics, H. R. P. I. E. R, Shirpur, 2016-17 15 | P a g e
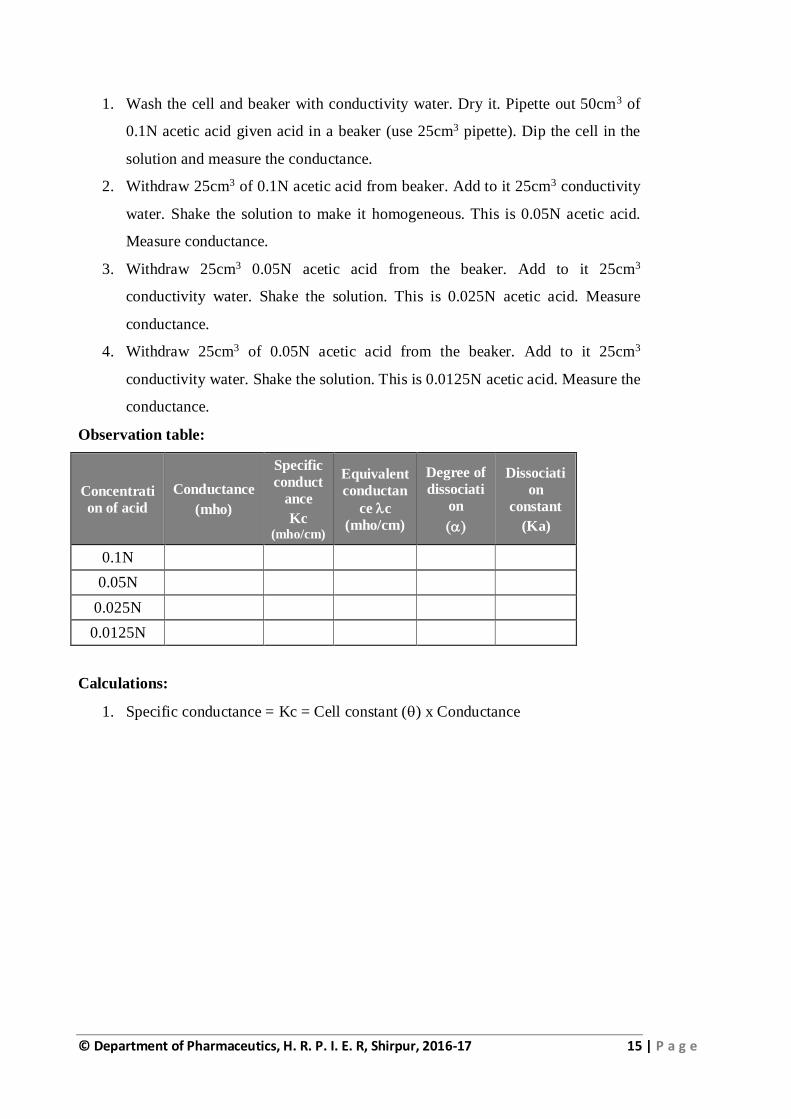
1. Wash the cell and beaker with conductivity water. Dry it. Pipette out 50cm3 of
0.1N acetic acid given acid in a beaker (use 25cm3 pipette). Dip the cell in the
solution and measure the conductance.
2. Withdraw 25cm3 of 0.1N acetic acid from beaker. Add to it 25cm3 conductivity
water. Shake the solution to make it homogeneous. This is 0.05N acetic acid.
Measure conductance.
3. Withdraw 25cm3 0.05N acetic acid from the beaker. Add to it 25cm3
conductivity water. Shake the solution. This is 0.025N acetic acid. Measure
conductance.
4. Withdraw 25cm3 of 0.05N acetic acid from the beaker. Add to it 25cm3
conductivity water. Shake the solution. This is 0.0125N acetic acid. Measure the
conductance.
Observation table:
Concentrati
on of acid
Conductance
(mho)
Specific
conduct
ance
Kc (mho/cm)
Equivalent
conductan
ce c
(mho/cm)
Degree of
dissociati
on
Dissociati
on
constant
(Ka)
0.1N
0.05N
0.025N
0.0125N
Calculations:
1. Specific conductance = Kc = Cell constant () x Conductance
© Department of Pharmaceutics, H. R. P. I. E. R, Shirpur, 2016-17 16 | P a g e
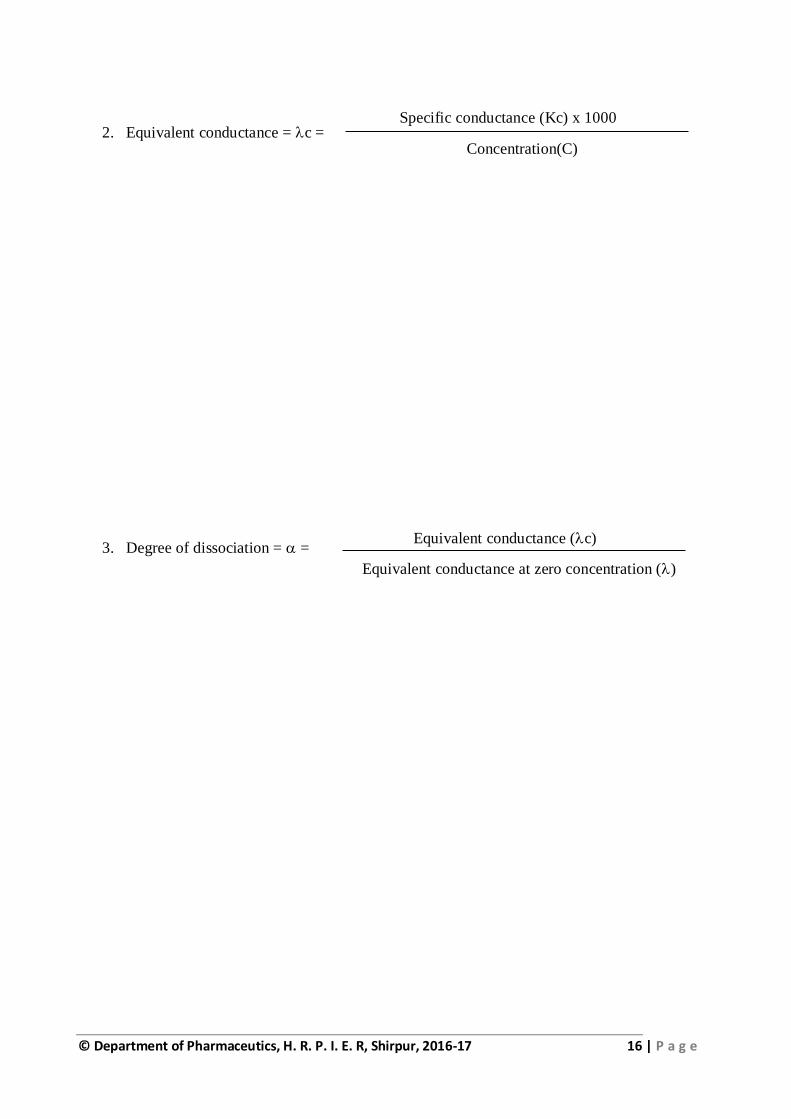
2. Equivalent conductance = c =
3. Degree of dissociation = =
Specific conductance (Kc) x 1000
Concentration(C)
Equivalent conductance (c)
Equivalent conductance at zero concentration ()
© Department of Pharmaceutics, H. R. P. I. E. R, Shirpur, 2016-17 17 | P a g e
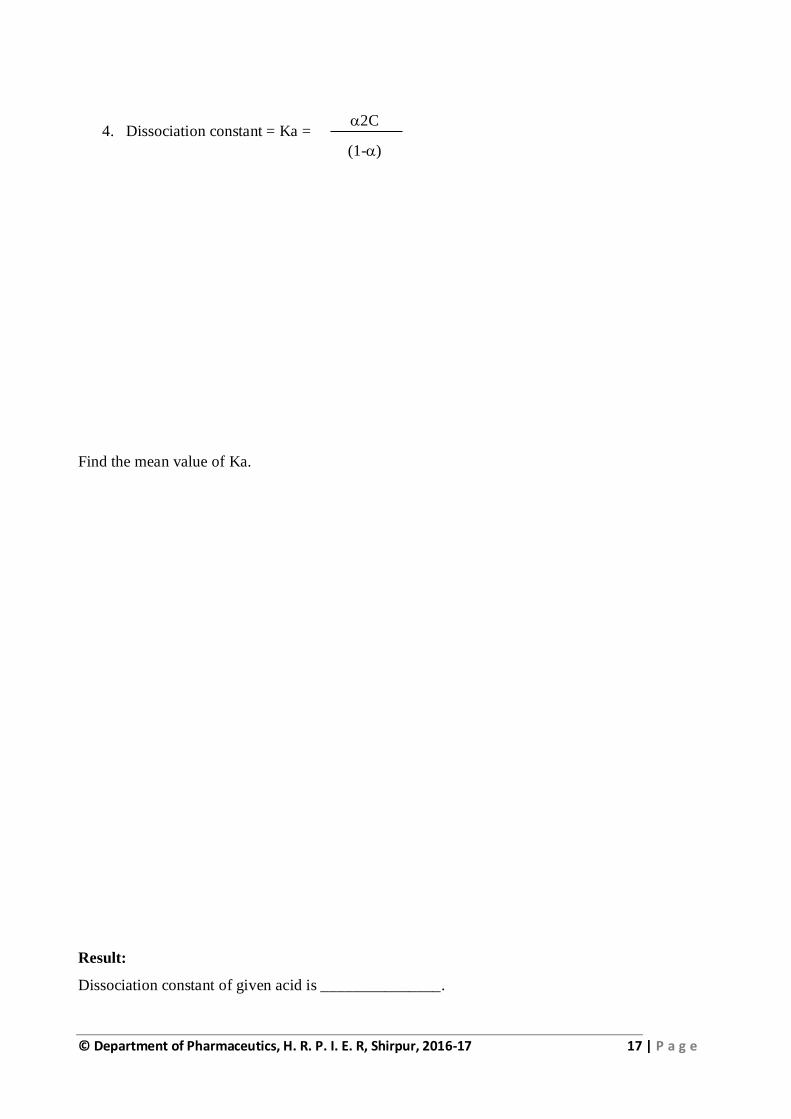
4. Dissociation constant = Ka =
Find the mean value of Ka.
Result:
Dissociation constant of given acid is _______________.
2C
(1-)
© Department of Pharmaceutics, H. R. P. I. E. R, Shirpur, 2016-17 18 | P a g e
Answer the following.
1. What is specific conductance? Give its unit.
2. What is cell constant? Give its unit.
3. What is equivalent conductance? Give is unit.
4. What is equivalent conductance at infinite dilution?
5. Define and explain Kohlrausch’s law.
© Department of Pharmaceutics, H. R. P. I. E. R, Shirpur, 2016-17 19 | P a g e
Aim:
To determine percent composition of given binary mixture by using viscosity
measurement.
Learning objective:
You will be able to explain:
1. Viscosity
2. Coefficient of viscosity
3. Specific gravity
Theory:
Viscosity of the liquid is the characteristic of the liquid and for a given liquid it change
with temperature. The viscosity decrease remarkably as the temperature of the the
liquid is raised. Poiseuillie’s equation is use, for the direct measurement of viscosity. It
requires the measurement of rate of flow of liquid under definite pressure through the
capillary of same radius.
The reciprocal of coefficient of viscosity (η) is called as fluidity (Ф)
Consider mixture of two liquids. When the two liquid are similar and they do not form
complex in the mixture then their fluidity is additive .The fluidity of the mixture can be
calculated by, Ф= X1 ; X2 Д2 where Ф is fluidity of mixture , Ф1 -fluidity of liquid
1, Ф2 – fluidity of liquid 2, x1 and x2 are mole fraction of liquid 1 and 2 respectively.
The composition of mixture can be studied by viscosity technique.
Experiment No.: 4 Date:
% Composition of Binary Mixture
1 = ------ η
© Department of Pharmaceutics, H. R. P. I. E. R, Shirpur, 2016-17 20 | P a g e
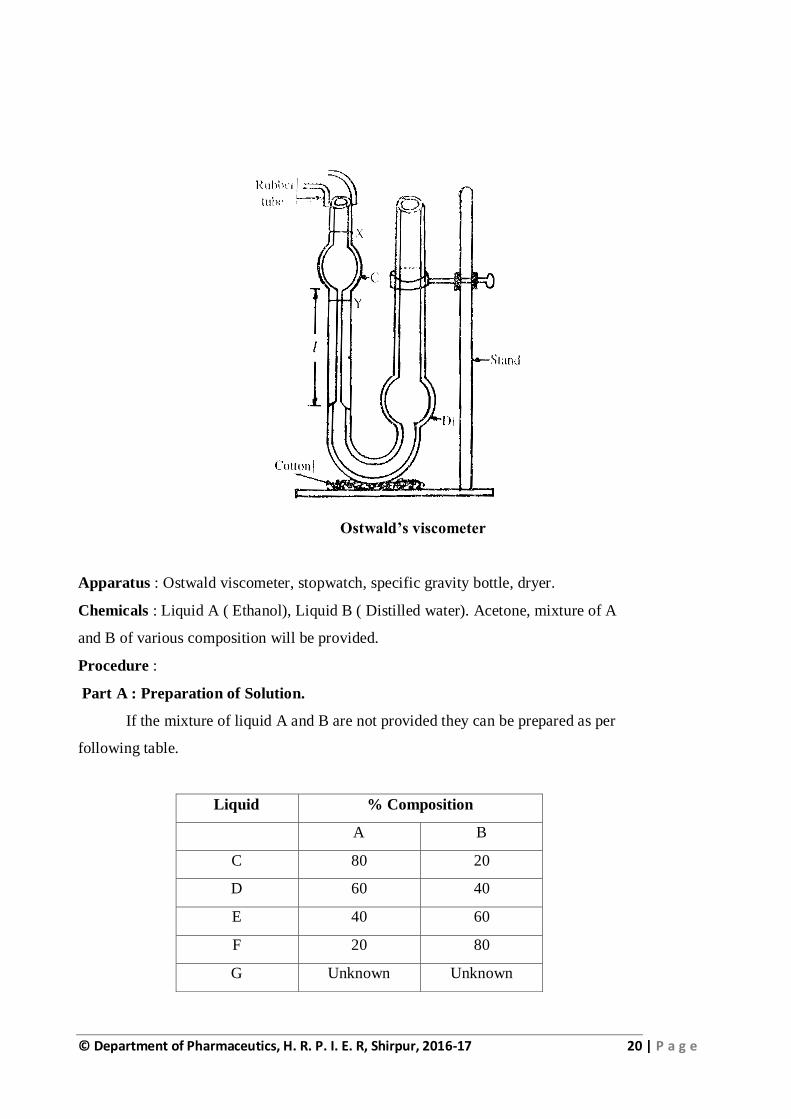
Ostwald’s viscometer
Apparatus : Ostwald viscometer, stopwatch, specific gravity bottle, dryer.
Chemicals : Liquid A ( Ethanol), Liquid B ( Distilled water). Acetone, mixture of A
and B of various composition will be provided.
Procedure :
Part A : Preparation of Solution.
If the mixture of liquid A and B are not provided they can be prepared as per
following table.
Liquid % Composition
A B
C 80 20
D 60 40
E 40 60
F 20 80
G Unknown Unknown
© Department of Pharmaceutics, H. R. P. I. E. R, Shirpur, 2016-17 21 | P a g e
Part B : Determination of flow time for the liquids.
1. Clean the viscometer with distilled water and rinse with acetone. Dry it by drier.
2. Take fix volume (10 ml or 20 ml) of liquid A in the brode limb by using pipette.
3. Suck the liquid using rubber tube till it reaches slightly above mark X.
4. Allow the liquid using to flow downward side and start the stop watch when the
liquid level coincide with mark X.
5. Note down the time require to flow the liquid from mark X to mark Y. Repeat
for two to three times and find out mean time.
6. Repeat the same procedure for same volume of liquid B, C, D, E and unknown
liquid G. ( Generally 50 % A + 50 % B is taken as unknown).
7. The densities of pure liquid A,B and mixture should be provided. If it is not
provided they can be determine by using specific gravity bottle as part A in
experiment no. 1.
Observation Table :
No. Liquid % Composition Flow time t in sec. Density
(d) g cm3
D x t poise
A B 1 2 3 Mean
1
2
3
4
5
6
7
A
B
C
D
E
F
G
100
0
80
60
40
20
0
100
20
40
60
80
Unknown
Graph and Calculations:
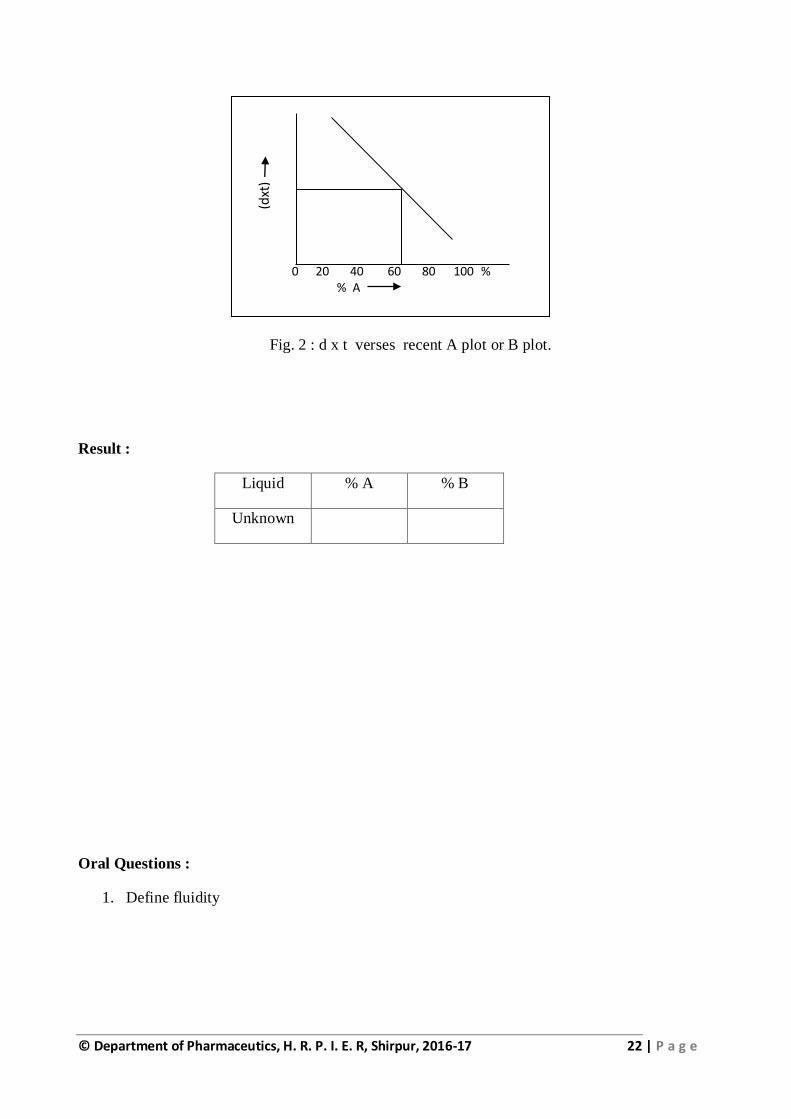
Plot a graph of % composition with respective A and B against dxt, separetly.
From (d x t ) values for the mixture with unknown composition we can
determine composition of mixture. The nature of graph is as shown in figure.
© Department of Pharmaceutics, H. R. P. I. E. R, Shirpur, 2016-17 22 | P a g e
Fig. 2 : d x t verses recent A plot or B plot.
Result :
Liquid % A % B
Unknown
Oral Questions :
1. Define fluidity
0 20 40 60 80 100 % % A
(dxt
)
© Department of Pharmaceutics, H. R. P. I. E. R, Shirpur, 2016-17 23 | P a g e
2. What is unit of density of liquid ?
3. Why acetone is use in viscosity experiment?
4. How density of liquid is determine ?
5. Explain the nature of graph dt Vs percent A.
© Department of Pharmaceutics, H. R. P. I. E. R, Shirpur, 2016-17 24 | P a g e
Aim:
To determine relative viscosity of the given liquid using Ostwald’s viscometer.
Learning objective:
You will be able to explain:
1. Viscosity
2. Coefficient of viscosity
3. Specific gravity
Introduction:
Viscosity is a property of liquid due to which it resist the relative motion of
successive layers of liquid. Viscosity is a force of friction between layers of liquid.
Viscosity is measured in terms of viscosity coefficient ‘’. The unit is poise.
Viscosity coefficient of a liquid is given by Poiseuille’s equation –
Where, P = pressure due to column of liquid,
r = radius of capillary of length l and volume V,
t = time taken by liquid to flow through capillary.
For this method experiments deals with determination of time of flow of fixed volume
‘V’ of liquid through uniform capillary of length ‘l’ and radius ‘r’ may be done by
using Ostwald’s viscometer.
Experiment No.: 5 Date:
Relative Viscosity of Liquid
P r4 t
8 V l =
© Department of Pharmaceutics, H. R. P. I. E. R, Shirpur, 2016-17 25 | P a g e
Principle:
Flow is a characteristic property of liquids. Hence, the liquids are also called as
fluids. The rate of flow depends on the nature of the liquid and the extent of
intermolecular force of attraction between the molecules of liquid. The motion of a
liquid in a glass tube may considered to be composed of number of molecular layers
arranged one over other. The layers in contact with the tube s almost stationary. The
second layer moves slowly, the third little fast and so on. Each layer exerts a drag on
the other. This internal friction between layers of liquid is called as viscosity of liquid.
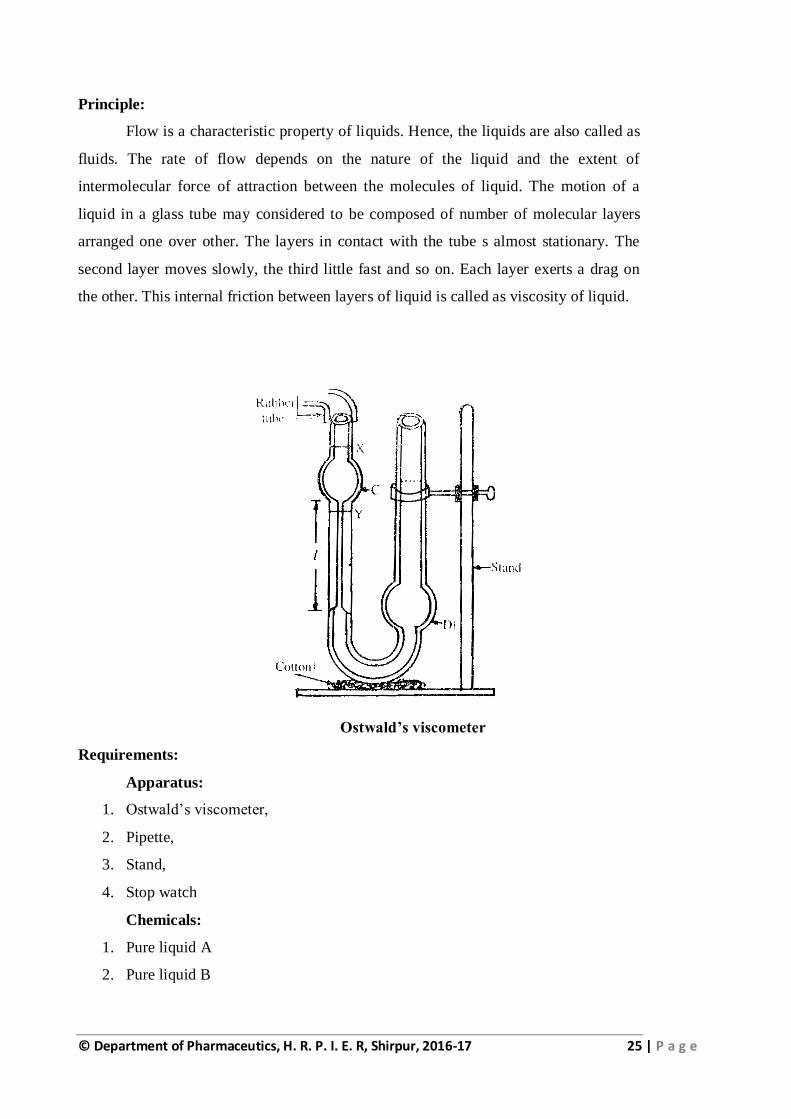
Ostwald’s viscometer
Requirements:
Apparatus:
1. Ostwald’s viscometer,
2. Pipette,
3. Stand,
4. Stop watch
Chemicals:
1. Pure liquid A
2. Pure liquid B
© Department of Pharmaceutics, H. R. P. I. E. R, Shirpur, 2016-17 26 | P a g e
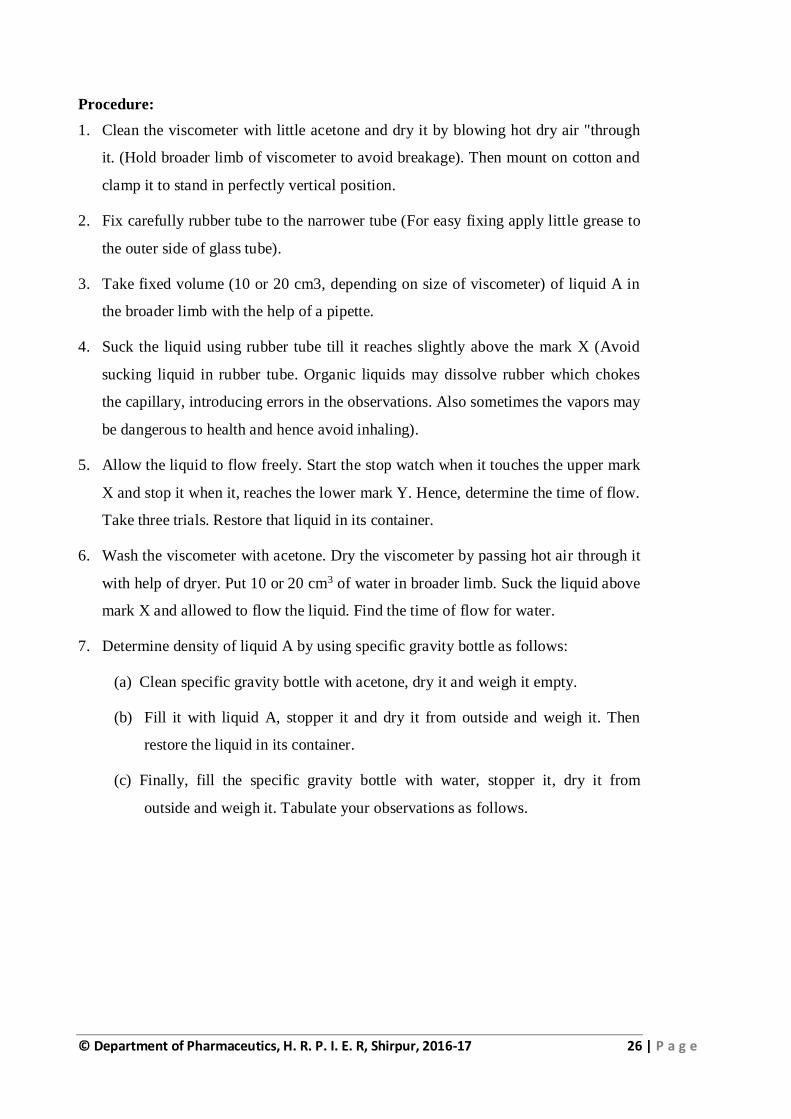
Procedure:
1. Clean the viscometer with little acetone and dry it by blowing hot dry air "through
it. (Hold broader limb of viscometer to avoid breakage). Then mount on cotton and
clamp it to stand in perfectly vertical position.
2. Fix carefully rubber tube to the narrower tube (For easy fixing apply little grease to
the outer side of glass tube).
3. Take fixed volume (10 or 20 cm3, depending on size of viscometer) of liquid A in
the broader limb with the help of a pipette.
4. Suck the liquid using rubber tube till it reaches slightly above the mark X (Avoid
sucking liquid in rubber tube. Organic liquids may dissolve rubber which chokes
the capillary, introducing errors in the observations. Also sometimes the vapors may
be dangerous to health and hence avoid inhaling).
5. Allow the liquid to flow freely. Start the stop watch when it touches the upper mark
X and stop it when it, reaches the lower mark Y. Hence, determine the time of flow.
Take three trials. Restore that liquid in its container.
6. Wash the viscometer with acetone. Dry the viscometer by passing hot air through it
with help of dryer. Put 10 or 20 cm3 of water in broader limb. Suck the liquid above
mark X and allowed to flow the liquid. Find the time of flow for water.
7. Determine density of liquid A by using specific gravity bottle as follows:
(a) Clean specific gravity bottle with acetone, dry it and weigh it empty.
(b) Fill it with liquid A, stopper it and dry it from outside and weigh it. Then
restore the liquid in its container.
(c) Finally, fill the specific gravity bottle with water, stopper it, dry it from
outside and weigh it. Tabulate your observations as follows.
© Department of Pharmaceutics, H. R. P. I. E. R, Shirpur, 2016-17 27 | P a g e
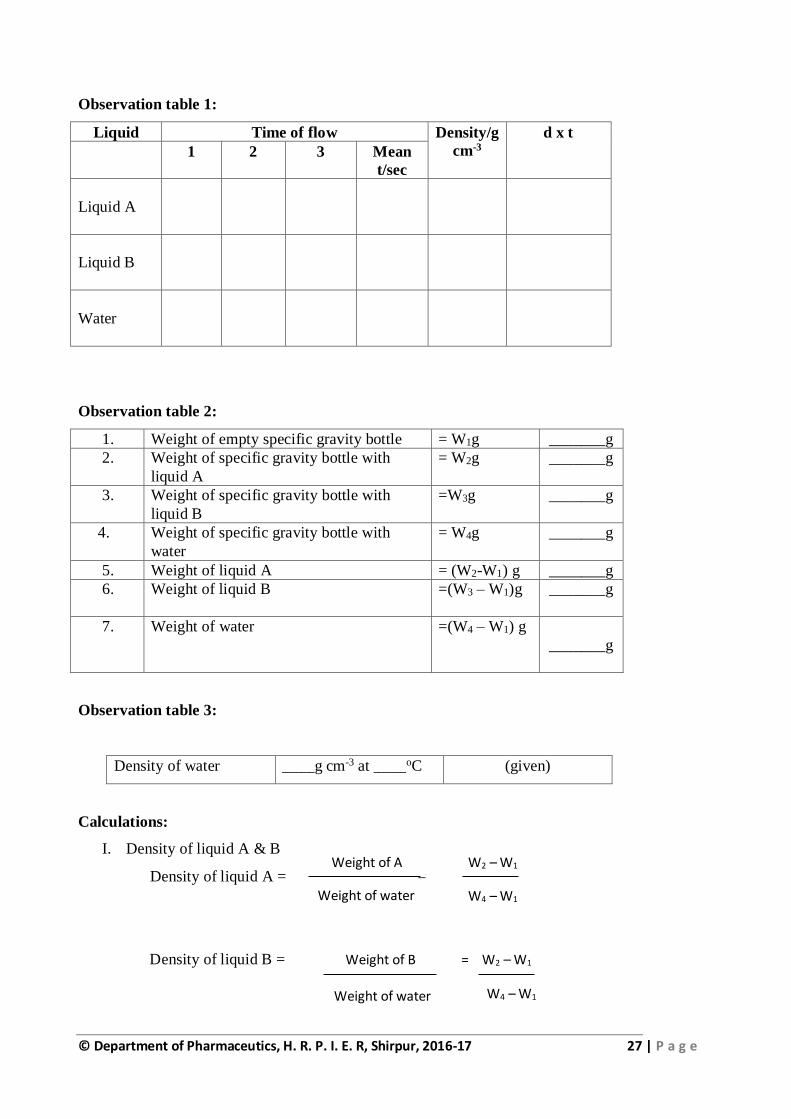
Observation table 1:
Liquid Time of flow Density/g
cm-3
d x t
1 2 3 Mean
t/sec
Liquid A
Liquid B
Water
Observation table 2:
1. Weight of empty specific gravity bottle = W1g _______g
2. Weight of specific gravity bottle with
liquid A
= W2g _______g
3. Weight of specific gravity bottle with
liquid B
=W3g _______g
4. Weight of specific gravity bottle with
water
= W4g _______g
5. Weight of liquid A = (W2-W1) g _______g
6. Weight of liquid B =(W3 – W1)g _______g
7. Weight of water =(W4 – W1) g
_______g
Observation table 3:
Density of water ____g cm-3 at ____oC (given)
Calculations:
I. Density of liquid A & B
Density of liquid A = =
Density of liquid B = Weight of B = W2 – W1
W4 – W1
Weight of A
Weight of water
W2 – W1
W4 – W1
Weight of water
© Department of Pharmaceutics, H. R. P. I. E. R, Shirpur, 2016-17 28 | P a g e
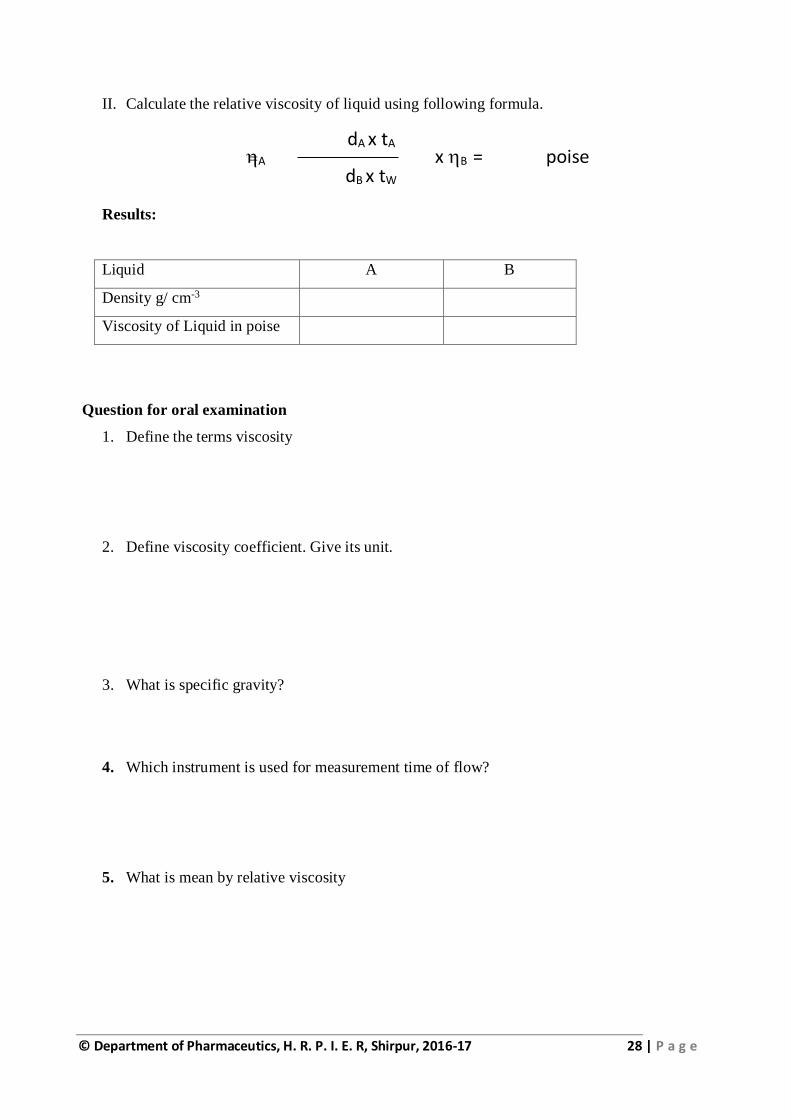
II. Calculate the relative viscosity of liquid using following formula.
=
Results:
Liquid A B
Density g/ cm-3
Viscosity of Liquid in poise
Question for oral examination
1. Define the terms viscosity
2. Define viscosity coefficient. Give its unit.
3. What is specific gravity?
4. Which instrument is used for measurement time of flow?
5. What is mean by relative viscosity
A dA x tA
dB x tW x B = poise
© Department of Pharmaceutics, H. R. P. I. E. R, Shirpur, 2016-17 29 | P a g e
Aim:
To determine surface tension of given liquid samples using stalagnometer
Learning objective:
You will be able to explain
1. Surface
2. Interface
3. Surface tension
Introduction:
The molecules at the surface of a liquid are subjected to an unbalanced force of
molecular attraction as the molecules of the liquid tend to pull those at the surface
inward while the vapor does not have as strong an attraction. This unbalance causes
liquids to tend to maintain the smallest surface possible. The magnitude of this force is
called the surface tension. When this lowest possible energetic state is achieved the
surface tension acts to hold the surface together where the force is parallel to the
surface. The symbol for surface tension is "gamma". Conventionally the tension
between the liquid and the atmosphere is called surface tension while the tension
between one liquid and another is called interfacial tension.
Principle:
The principle involved in falling drop method is described as follows. It is very
convenient and quick method.
In this technique, stalagnometer is used to measure surface tension; it measures
the strength of cohesive forces of liquids. For example, water has strong cohesive
forces, so surface tension is more, on the other hand liquid such as benzene exhibits low
surface tension compared to water.
The lower the surface tension of liquid, the smaller the size of drops formed.
Then more amount of drops are formed for same volume of a liquid.
Experiment No.: 6 Date:
Surface tension
© Department of Pharmaceutics, H. R. P. I. E. R, Shirpur, 2016-17 30 | P a g e
Hence by simply counting the number of drops for an unknown liquid and water, is
sufficient to calculate surface tension. The above arguments are valid when the
densities of liquids are same.
Requirements:
Apparatus:
1. Stalagnometer,
2. Specific gravity bottle,
3. Stop watch
4. Stirrer,
5. Beaker,
Chemicals
1. Acetone,
2. Benzene
3. Toluene
Procedure:
1. Select a clean stalagnometer, deep it in a beaker of water and suck the water
through rubber tube which is attached, up to a level higher than upper mark P.
2. Leave the rubber tube, and allow water to flow down.
3. Start counting water drops when water meniscus just passes the mark P until it
crosses the lower mark Q.
4. Deep the apparatus in beaker of next liquid and follow same procedure to count
number of drops formed of each liquid.
Formula:
ϒ1 = n1ρ2 = No of drops of water X Density of unknown
ϒ2 n2 ρ1 No of drops of unknown X Density of water
© Department of Pharmaceutics, H. R. P. I. E. R, Shirpur, 2016-17 31 | P a g e
Observation table:
Sr. No. Liquid No. of drops
counted
Density
gm/cm3
1. Water
2. Acetone
3. Benzene
4. Toluene
Calculations:
A) Determination of Densities
1. Acetone –
Wt of gravity bottle = ----- gms
Wt of acetone = ------ gms
Density = Wt of acetone / Wt of gravity bottle
Density = ---------- gms/cm3
2. Benzene –
Wt of gravity bottle = ----- gms
Wt of benzene = ------ gms
Density = Wt of benzene / Wt of gravity bottle
Density = ---------- gms/cm3
3. Toluene –
Wt of gravity bottle = ----- gms
Wt of toluene = ------ gms
Density = Wt of toluene / Wt of gravity bottle
Density = ---------- gms/cm3
B) Determination of Surface tension
1. Acetone –

© Department of Pharmaceutics, H. R. P. I. E. R, Shirpur, 2016-17 32 | P a g e
2. Benzene –
3. Toluene –
Result:
The Surface tension of given liquid samples using drop count method was found
as
Sr. No. Liquid Surface tension
dy/cm
Density
gm/cm3
1. Water
2. Acetone
3. Benzene
4. Toluene
© Department of Pharmaceutics, H. R. P. I. E. R, Shirpur, 2016-17 33 | P a g e
Answer the following
1. Define surface tension.
2. Define surface free energy.
3. Enlist various methods used to determine surface tension.
© Department of Pharmaceutics, H. R. P. I. E. R, Shirpur, 2016-17 34 | P a g e
Aim: To determine average particle size of given powder sample by optical microscopy
Learning objective:
You will be able to explain
1. Micromeritics
2. Fundamental & Derived properties of powders
3. Methods to determine particle size
Introduction –
Of the various methods employed for particle size determination, the optical
microscope method is the only one in which direct observation is made of the size of
the particles. Even this method has one drawback in that it has a tendency to measure
the largest dimensions unless the particles are properly dispersed with random
orientation. Also, the method is too much time consuming for extensive use between
purchaser and supplier for determining conformity to specifications. But it may be used
advantageously for two purposes, namely, (a) as a basis of calibration for faster
methods such as those involving sedimentation and (b) in the determination of the
particle size of routine samples, especially in the cases where particles are of such
shape that they do not obey Stokes’s law.
Outline of method:
A representative sample of the powder to be sized is dispersed and placed on a
glass slide. The particles are viewed through a microscope by means of transmitted
light. The areas of the magnified images of the particles are compared with those of the
reference circles of known size inscribed on a graticule and simultaneously visible.
The relative numbers of particles in each of a series of size classes are determined.
These numbers, expressed as percentages, constitute the size distribution by number.
From the relative number in the size classes the relative volumes are calculated,
Experiment No.: 7 Date:
Optical microscopy
© Department of Pharmaceutics, H. R. P. I. E. R, Shirpur, 2016-17 35 | P a g e
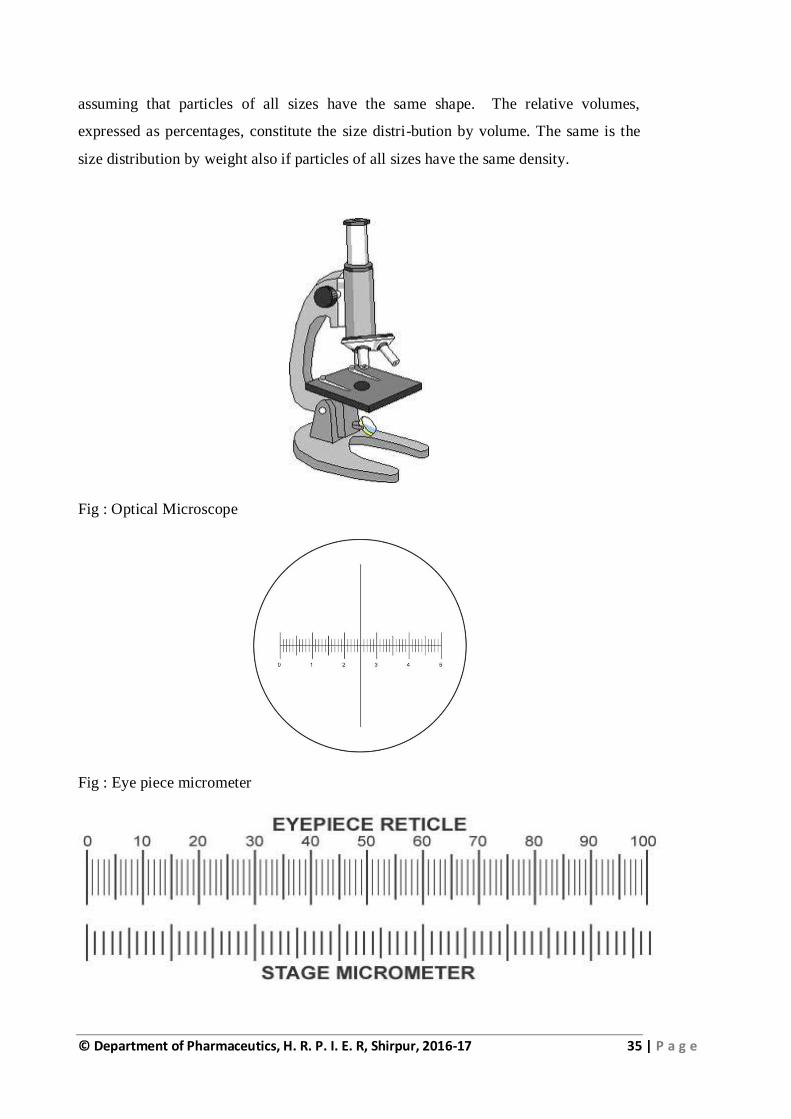
assuming that particles of all sizes have the same shape. The relative volumes,
expressed as percentages, constitute the size distri-bution by volume. The same is the
size distribution by weight also if particles of all sizes have the same density.
Fig : Optical Microscope
Fig : Eye piece micrometer
© Department of Pharmaceutics, H. R. P. I. E. R, Shirpur, 2016-17 36 | P a g e
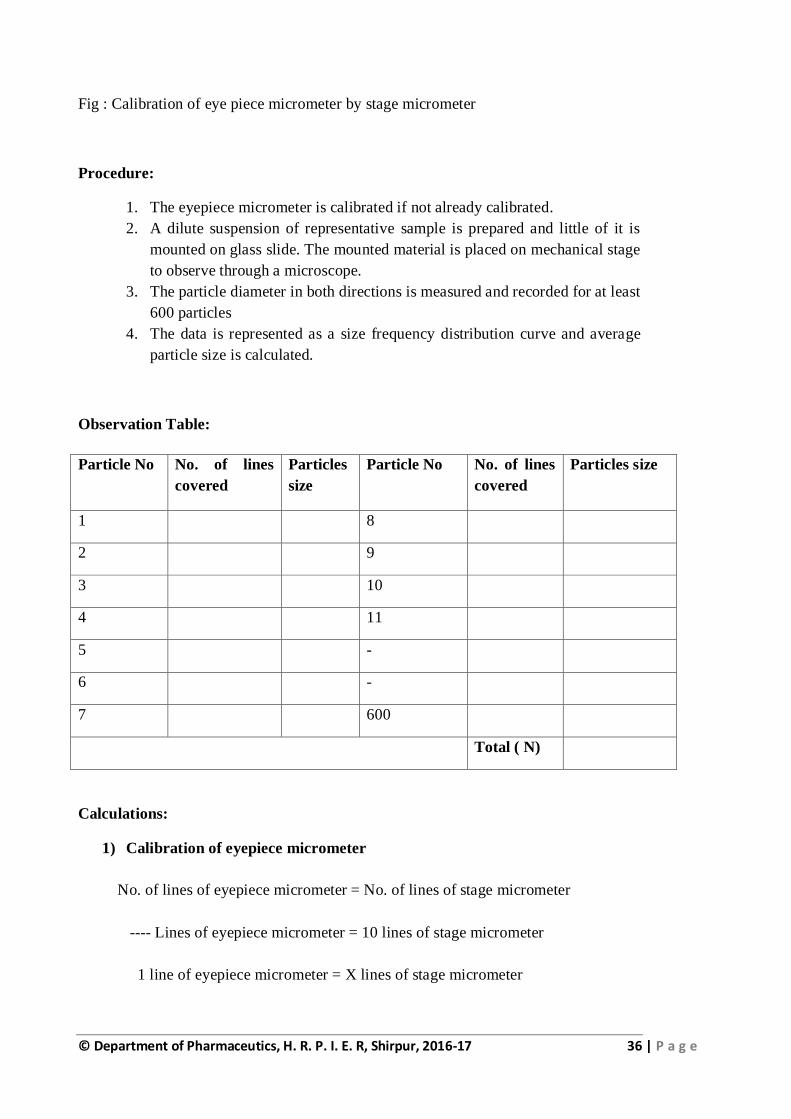
Fig : Calibration of eye piece micrometer by stage micrometer
Procedure:
1. The eyepiece micrometer is calibrated if not already calibrated.
2. A dilute suspension of representative sample is prepared and little of it is
mounted on glass slide. The mounted material is placed on mechanical stage
to observe through a microscope.
3. The particle diameter in both directions is measured and recorded for at least
600 particles
4. The data is represented as a size frequency distribution curve and average
particle size is calculated.
Observation Table:
Calculations:
1) Calibration of eyepiece micrometer
No. of lines of eyepiece micrometer = No. of lines of stage micrometer
---- Lines of eyepiece micrometer = 10 lines of stage micrometer
1 line of eyepiece micrometer = X lines of stage micrometer
Particle No No. of lines
covered
Particles
size
Particle No No. of lines
covered
Particles size
1 8
2 9
3 10
4 11
5 -
6 -
7 600
Total ( N)
© Department of Pharmaceutics, H. R. P. I. E. R, Shirpur, 2016-17 37 | P a g e
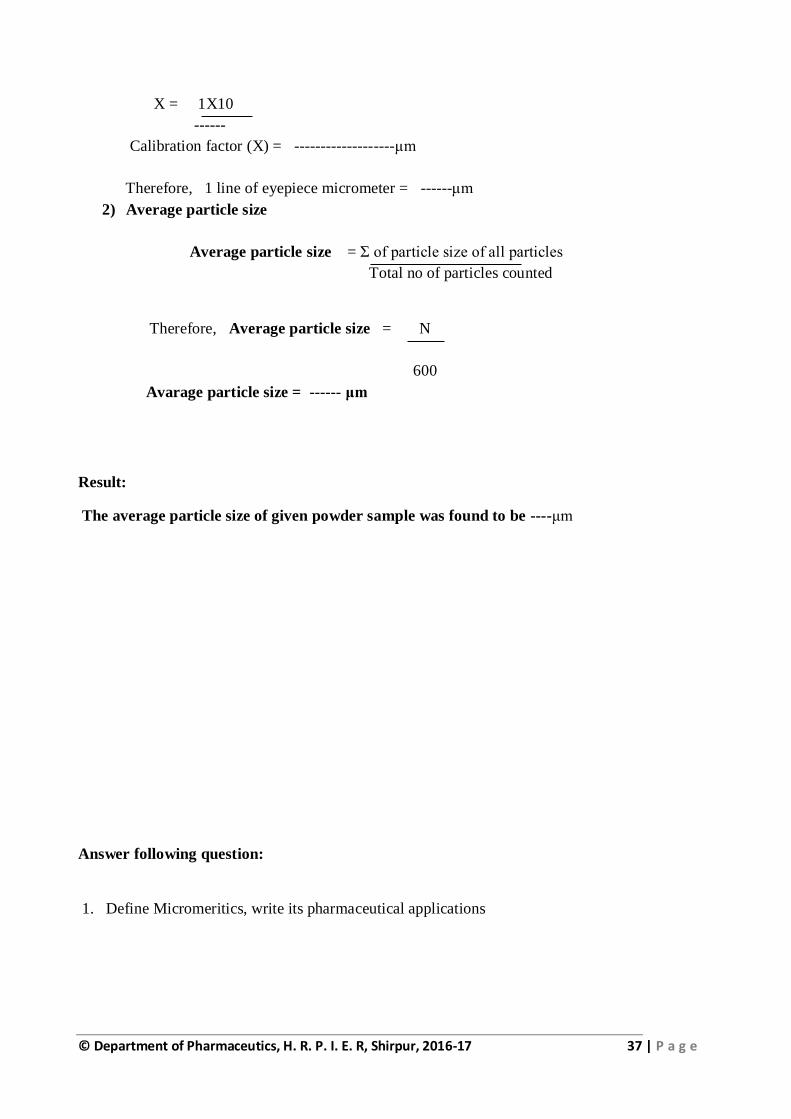
X = 1X10
------
Calibration factor (X) = -------------------μm
Therefore, 1 line of eyepiece micrometer = ------μm
2) Average particle size
Average particle size = Σ of particle size of all particles
Total no of particles counted
Therefore, Average particle size = N
600
Avarage particle size = ------ μm
Result:
The average particle size of given powder sample was found to be ----μm
Answer following question:
1. Define Micromeritics, write its pharmaceutical applications
© Department of Pharmaceutics, H. R. P. I. E. R, Shirpur, 2016-17 38 | P a g e
2. What are fundamental properties of powder?
3. Enlist various methods to determine particle size
4. What would be the size range that can be determined using optical microscopy?
© Department of Pharmaceutics, H. R. P. I. E. R, Shirpur, 2016-17 39 | P a g e
Aim: To determine average particle size of given powder sample by sieving method
Learning objective:
You will be able to explain
1. Micromeritics
2. Fundamental & Derived properties of powders
3. Methods to determine particle size
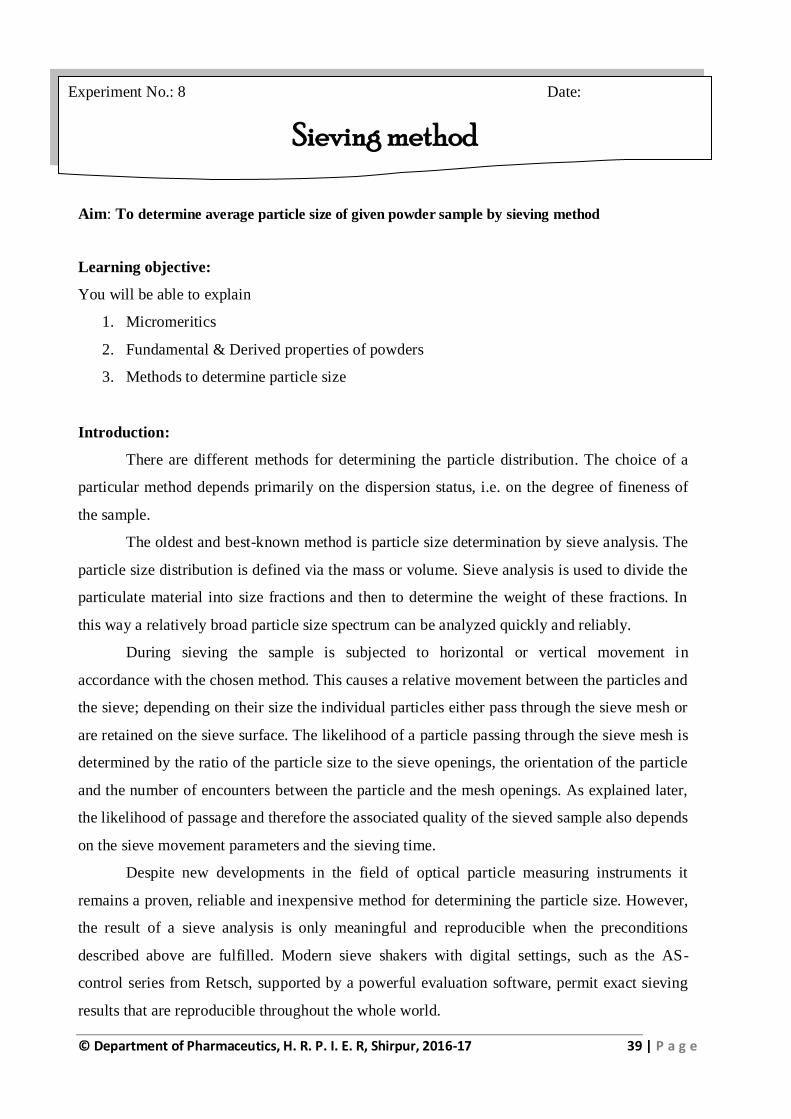
Introduction:
There are different methods for determining the particle distribution. The choice of a
particular method depends primarily on the dispersion status, i.e. on the degree of fineness of
the sample.
The oldest and best-known method is particle size determination by sieve analysis. The
particle size distribution is defined via the mass or volume. Sieve analysis is used to divide the
particulate material into size fractions and then to determine the weight of these fractions. In
this way a relatively broad particle size spectrum can be analyzed quickly and reliably.
During sieving the sample is subjected to horizontal or vertical movement in
accordance with the chosen method. This causes a relative movement between the particles and
the sieve; depending on their size the individual particles either pass through the sieve mesh or
are retained on the sieve surface. The likelihood of a particle passing through the sieve mesh is
determined by the ratio of the particle size to the sieve openings, the orientation of the particle
and the number of encounters between the particle and the mesh openings. As explained later,
the likelihood of passage and therefore the associated quality of the sieved sample also depends
on the sieve movement parameters and the sieving time.
Despite new developments in the field of optical particle measuring instruments it
remains a proven, reliable and inexpensive method for determining the particle size. However,
the result of a sieve analysis is only meaningful and reproducible when the preconditions
described above are fulfilled. Modern sieve shakers with digital settings, such as the AS-
control series from Retsch, supported by a powerful evaluation software, permit exact sieving
results that are reproducible throughout the whole world.
Experiment No.: 8 Date:
Sieving method
© Department of Pharmaceutics, H. R. P. I. E. R, Shirpur, 2016-17 40 | P a g e
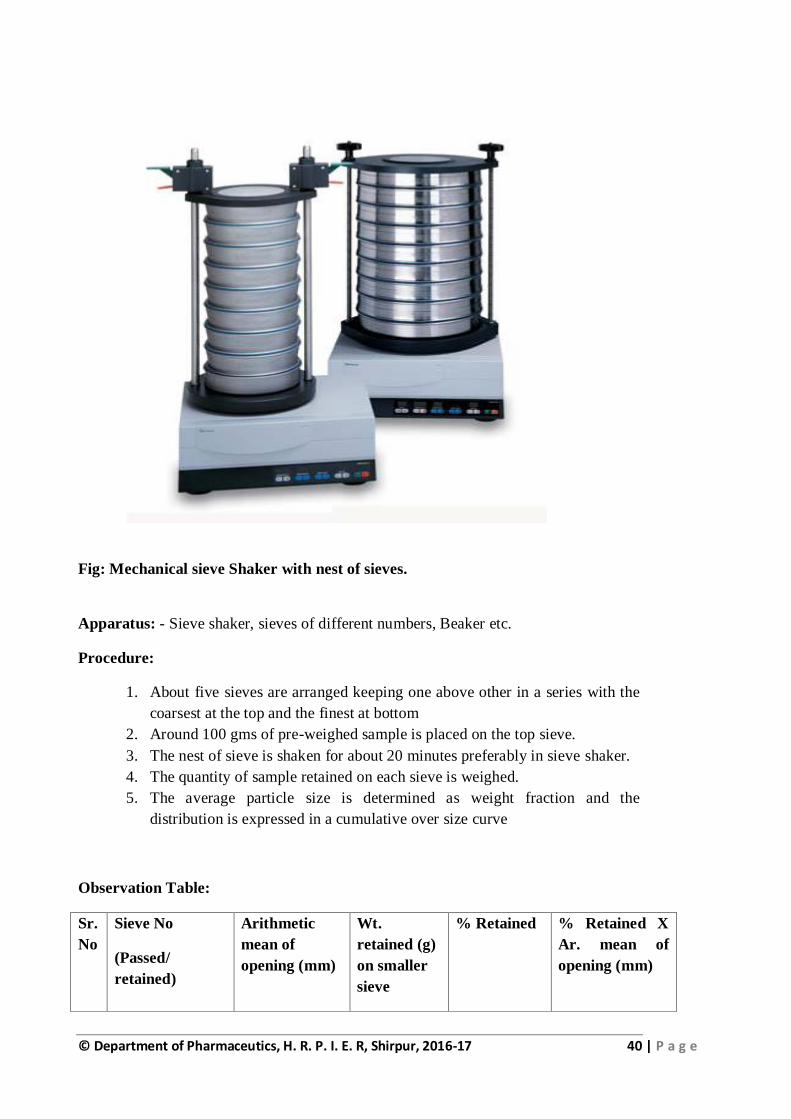
Fig: Mechanical sieve Shaker with nest of sieves.
Apparatus: - Sieve shaker, sieves of different numbers, Beaker etc.
Procedure:
1. About five sieves are arranged keeping one above other in a series with the
coarsest at the top and the finest at bottom
2. Around 100 gms of pre-weighed sample is placed on the top sieve.
3. The nest of sieve is shaken for about 20 minutes preferably in sieve shaker.
4. The quantity of sample retained on each sieve is weighed.
5. The average particle size is determined as weight fraction and the
distribution is expressed in a cumulative over size curve
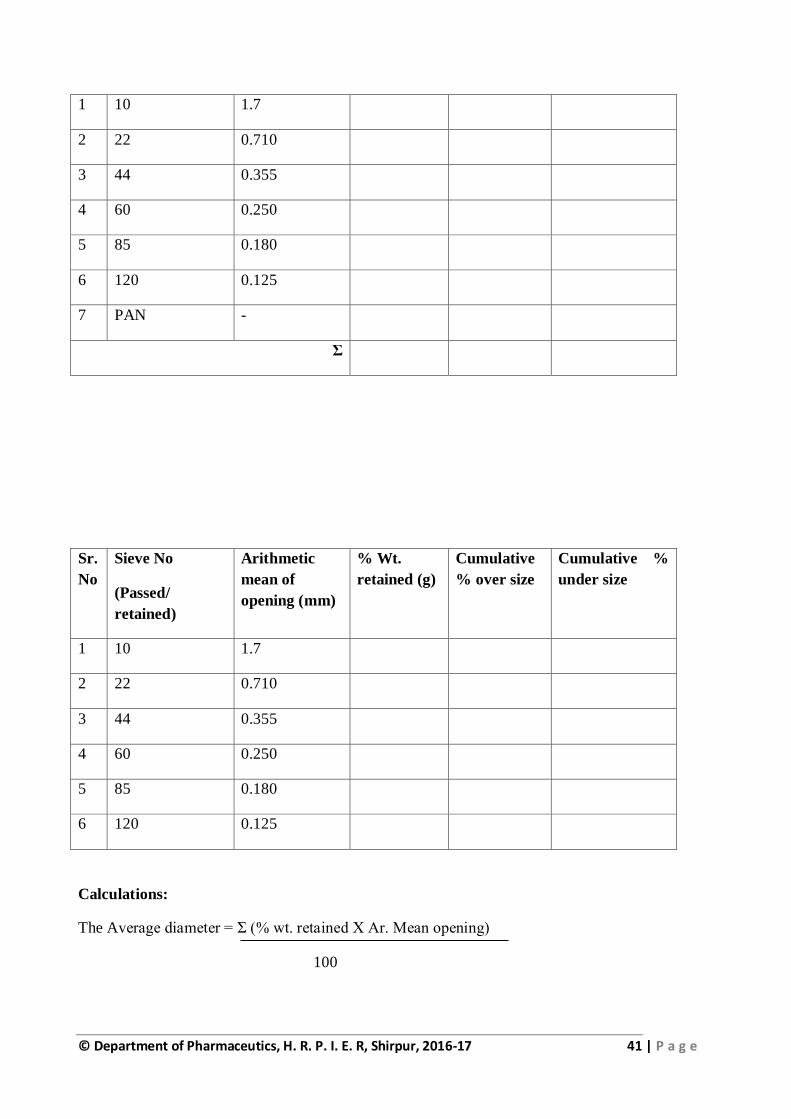
Observation Table:
Sr.
No
Sieve No
(Passed/
retained)
Arithmetic
mean of
opening (mm)
Wt.
retained (g)
on smaller
sieve
% Retained % Retained X
Ar. mean of
opening (mm)
© Department of Pharmaceutics, H. R. P. I. E. R, Shirpur, 2016-17 41 | P a g e
1 10 1.7
2 22 0.710
3 44 0.355
4 60 0.250
5 85 0.180
6 120 0.125
7 PAN -
Σ
Sr.
No
Sieve No
(Passed/
retained)
Arithmetic
mean of
opening (mm)
% Wt.
retained (g)
Cumulative
% over size
Cumulative %
under size
1 10 1.7
2 22 0.710
3 44 0.355
4 60 0.250
5 85 0.180
6 120 0.125
Calculations:
The Average diameter = Σ (% wt. retained X Ar. Mean opening)
100
© Department of Pharmaceutics, H. R. P. I. E. R, Shirpur, 2016-17 42 | P a g e
Therefore, the average diameter = ----------- mm
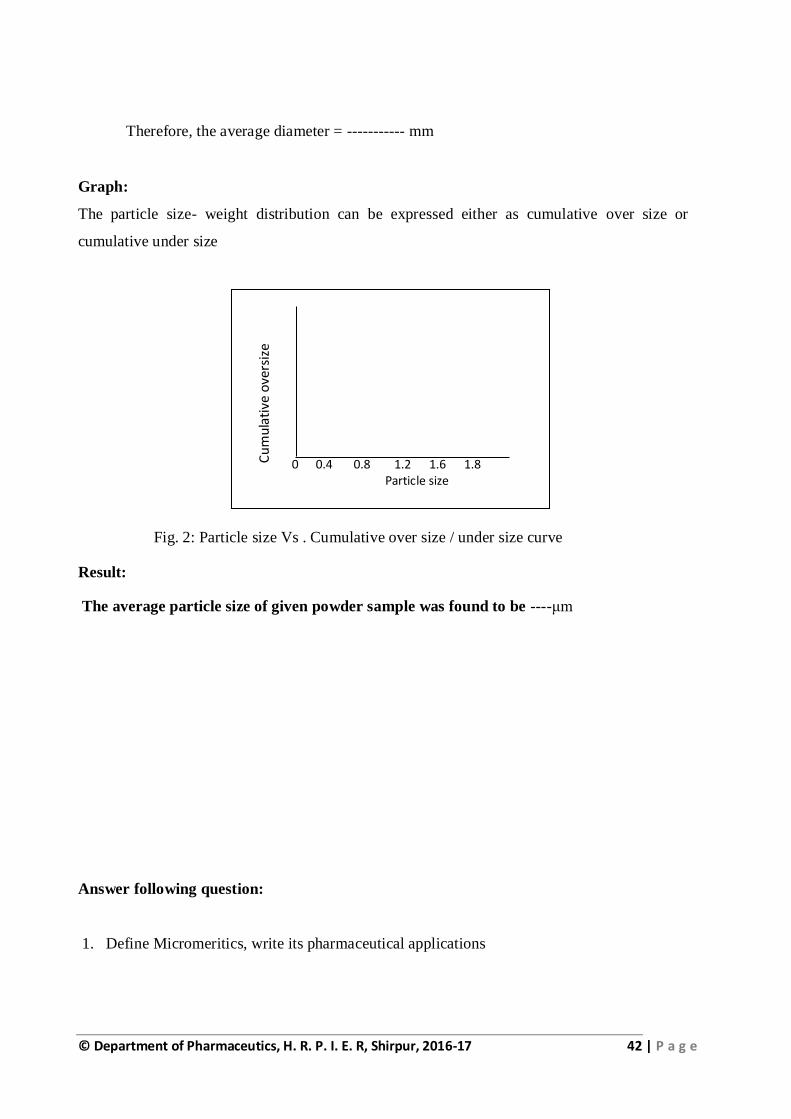
Graph:
The particle size- weight distribution can be expressed either as cumulative over size or
cumulative under size
Fig. 2: Particle size Vs . Cumulative over size / under size curve
Result:
The average particle size of given powder sample was found to be ----μm
Answer following question:
1. Define Micromeritics, write its pharmaceutical applications
0 0.4 0.8 1.2 1.6 1.8 Particle size
Cu
mu
lati
ve o
vers
ize
© Department of Pharmaceutics, H. R. P. I. E. R, Shirpur, 2016-17 43 | P a g e
2. What are fundamental properties of powder?
3. Enlist various methods to determine particle size
4. What would be the size range that can be determined using sieving method?
© Department of Pharmaceutics, H. R. P. I. E. R, Shirpur, 2016-17 44 | P a g e
Aim: To Determine Critical Micelle Concentration (CMC) of the Sodium Laurel
Sulphate by surface tension measurement,
Learning objective:
You will be able to explain
1. Surface acting agent
2. Surface tension
3. Critical micelle concentration
Introduction:
Surfactants, sometimes called surface-active agents or detergents, are among the
most versatile chemicals available. They have applications in many areas, including
chemistry (chemical kinetics or equilibria), biology (as membrane mimetics), and
pharmacy. Surfactants are amphiphilic materials containing both nonpolar long-chain
hydrocarbon “tail” and polar, usually ionic, “head” groups. In polar solvents, for
example water, this dual character of the amphiphile leads to self-association or
micellization: the surfactant molecules arrange themselves into organized molecular
assemblies known as micelles. The hydrophobic part of the aggregate forms the core of
the micelle, while the polar head groups are located at the micelle–water interface in
contact with and hydrated by a number of water molecules. Depending on the chemical
structure of the surfactant, its micelle can be cationic, anionic, ampholitic
(zwitterionic), or nonionic. This unique property
of surfactants makes aqueous surfactant solutions micro heterogeneous media; that is,
they are heterogeneous on a microscopic scale, even though they are often
homogeneous macroscopically.
Definition of CMC
It is the concentration (actually an arbitrary concentration within a narrow
range) of surfactant, above which micelles formation starts, is called the critical micelle
Experiment No.: 9 Date:
Critical Micelle Concentration
Preparation of p-Nitro acetanilide from Acetanilide
© Department of Pharmaceutics, H. R. P. I. E. R, Shirpur, 2016-17 45 | P a g e
concentration (CMC). Above the CMC, monomers and micelles exist in dynamic
equilibrium.
Micelles are small colloidal particles, relative to the wavelength of light. When
micelles form, the aqueous surfactant solution behaves as a micro heterogeneous
medium. The value of the CMC can be determined by the change in the
physicochemical properties of the surfactant solution as the surfactant concentration
increases.
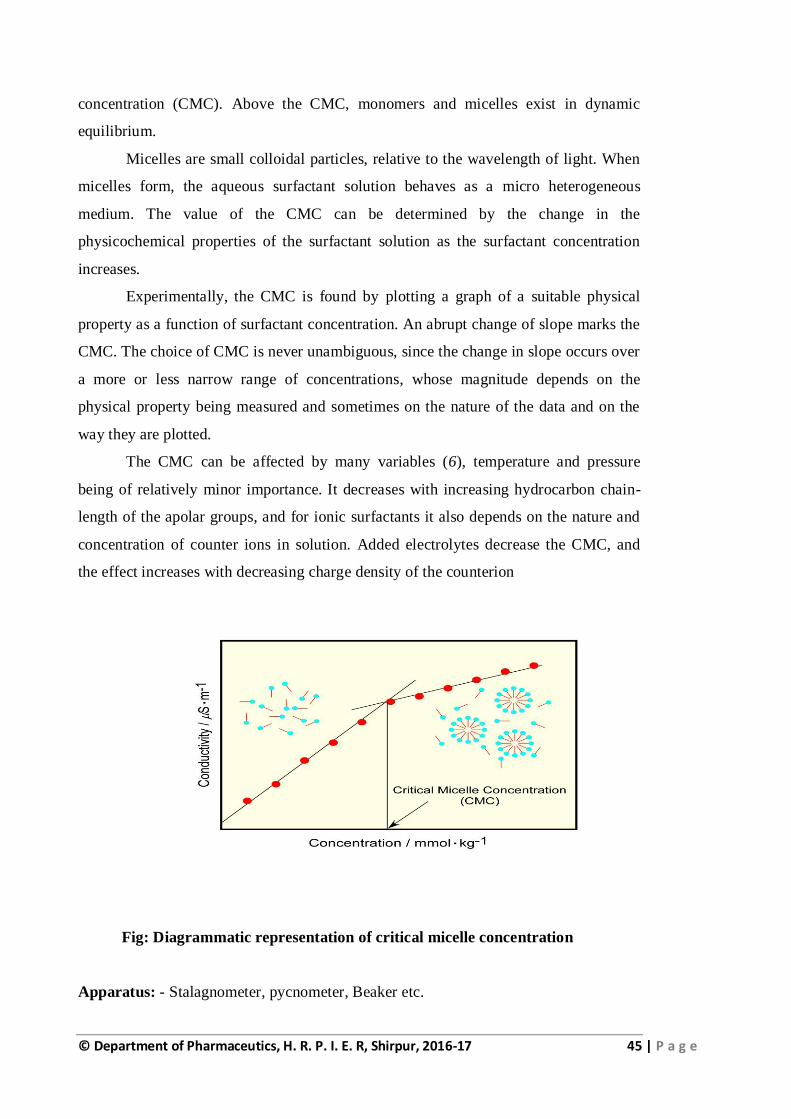
Experimentally, the CMC is found by plotting a graph of a suitable physical
property as a function of surfactant concentration. An abrupt change of slope marks the
CMC. The choice of CMC is never unambiguous, since the change in slope occurs over
a more or less narrow range of concentrations, whose magnitude depends on the
physical property being measured and sometimes on the nature of the data and on the
way they are plotted.
The CMC can be affected by many variables (6), temperature and pressure
being of relatively minor importance. It decreases with increasing hydrocarbon chain-
length of the apolar groups, and for ionic surfactants it also depends on the nature and
concentration of counter ions in solution. Added electrolytes decrease the CMC, and
the effect increases with decreasing charge density of the counterion
Fig: Diagrammatic representation of critical micelle concentration
Apparatus: - Stalagnometer, pycnometer, Beaker etc.
© Department of Pharmaceutics, H. R. P. I. E. R, Shirpur, 2016-17 46 | P a g e
Procedure:
1. A stock solution of 5% sodium lauryl sulphate (SLS) is prepared by
dissolving 5 grams of SLS in 100 ml water in volumetric flask.
2. A series of concentration of SLS is prepared by diluting stock solution as
follows
A. 50 mg per 100 ml ( 1 ml to 100 ml)
B. 100 mg per 100 ml ( 2 ml to 100 ml)
C. 150 mg per 100 ml ( 3 ml to 100 ml)
D. 200 mg per 100 ml ( 4 ml to 100 ml)
E. 250 mg per 100 ml ( 5 ml to 100 ml)
F. 300 mg per 100 ml ( 6 ml to 100 ml)
G. 400 mg per 100 ml ( 8 ml to 100 ml)
H. 500 mg per 100 ml ( 10 ml to 100 ml)
3. Surface tension of prepared solutions is determined by drop count method
using stalagnometer.
4. A graph of surface tension on Y axis Vs Concentration of SLS on X axis is
plotted to determine CMC.
Observation Table:
Sample Conc. in mg/
100 ml
No. of drops
(mean of 3
observations)
Density
gms/cm3
Surface
tension
dynes/cm
Water -
A 50
B 100
C 150
D 200
E 250
F 300
G 400
H 500
Calculations:
I. Determination of Densities
© Department of Pharmaceutics, H. R. P. I. E. R, Shirpur, 2016-17 47 | P a g e
Densities of all solutions (sample A to H and water) are determined
using specific gravity bottle as discussed previously.
II. Determination of Surface tension
To determine specific gravity, drop count method is followed using
stalagnometer as discussed previously (Experiment no 5, P.No- 27 -31)
Graph:
A graph of surface tension on Y axis Vs Concentration of SLS on X axis
is plotted to determine CMC.
Fig. 2: surface tension Vs. Concentration of SLS
Result:
The Critical Micelle Concentration (CMC) of Sodium lauryl sulphate is found to be ----
--- mg/100ml
0 50 100 150 200 250 Conc.
Su
rfac
e te
nsi
on
\\
ula
t
ive
ove
rsiz
e
© Department of Pharmaceutics, H. R. P. I. E. R, Shirpur, 2016-17 48 | P a g e
Aim: -
To determine various derived properties of given powder sample
Learning objective:
You will be able to explain
1. Micromeritics and its pharmaceutical applications
2. Bulk density, tapped density
3. Carr’s index and angle of repose
Introduction: -
Densities of particles: Density is defined as weight per unit volume (W/V).
Types of densities:
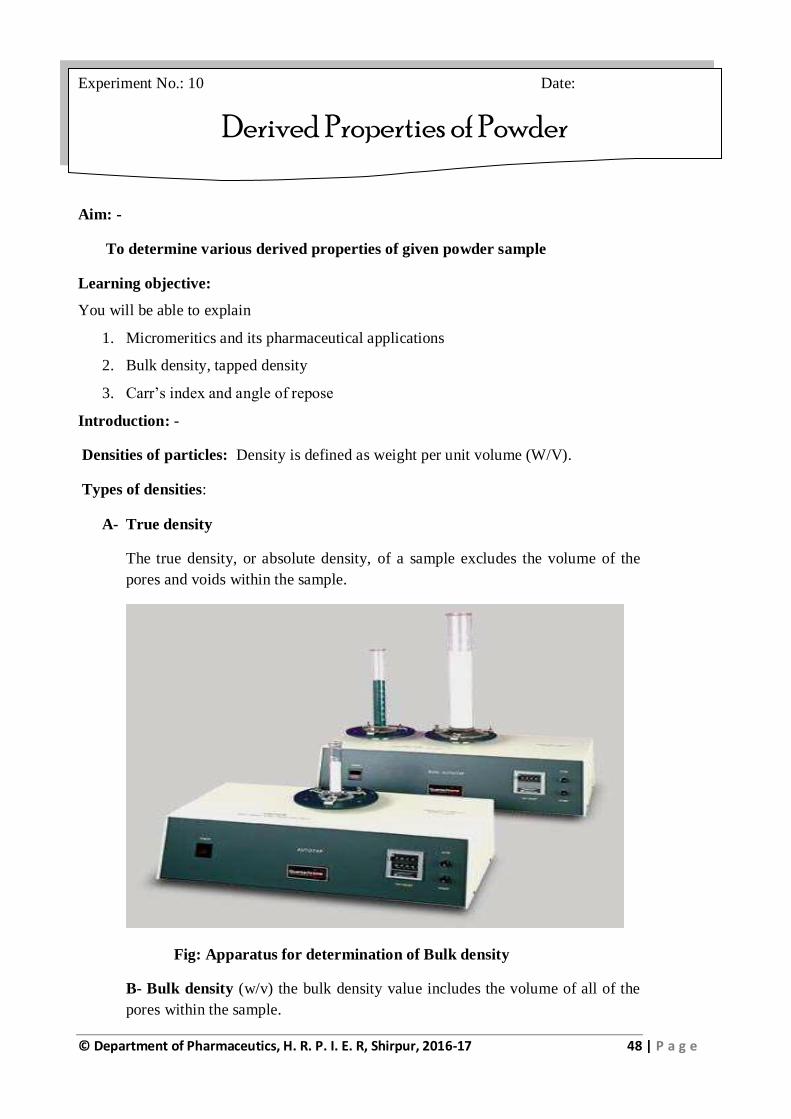
A- True density
The true density, or absolute density, of a sample excludes the volume of the
pores and voids within the sample.
Fig: Apparatus for determination of Bulk density
B- Bulk density (w/v) the bulk density value includes the volume of all of the
pores within the sample.
Experiment No.: 10 Date:
Derived Properties of Powder
© Department of Pharmaceutics, H. R. P. I. E. R, Shirpur, 2016-17 49 | P a g e
The bulk density of a powder is the ratio of the mass of an untapped
powder sample and its volume including the contribution of the interparticulate
void volume.
The bulk density of a powder is determined by measuring the volume of
a known weight of powder sample that may have been passed through a seive,
into a graduated cylinder, or by measuring the mass of a known volume of
powder that has been passed through a volumeter into a cup or a measuring
vessel.
Bulk density = weight / bulk volume
C -Tapped density
It is defined as mass divided by the tapped volume. The tapped density
is an increased bulk density attained after mechanically tapping a container
containing the powder sample. Tapped density is obtained by mechanically
tapping a graduated measuring cylinder or vessel containing a powder sample.
The mechanical tapping is achieved by raising the cylinder or vessel and
allowing it to drop under its own weight a specified distance by either of three
methods as described below. Devices that rotate the cylinder or vessel during
tapping may be preferred to minimize any possible separation of the mass
during tapping down.
Tapped density = weight / true volume
D- Carr’s compressibility index
A volume of powder is filled into a graduated glass cylinder and
repeatedly tapped for a known duration. The volume of powder after tapping is
measured.
Tapped density – Poured or bulk density
Carr’s index (%) = x 100
Tapped density
E – Angle of Repose (θ)
© Department of Pharmaceutics, H. R. P. I. E. R, Shirpur, 2016-17 50 | P a g e
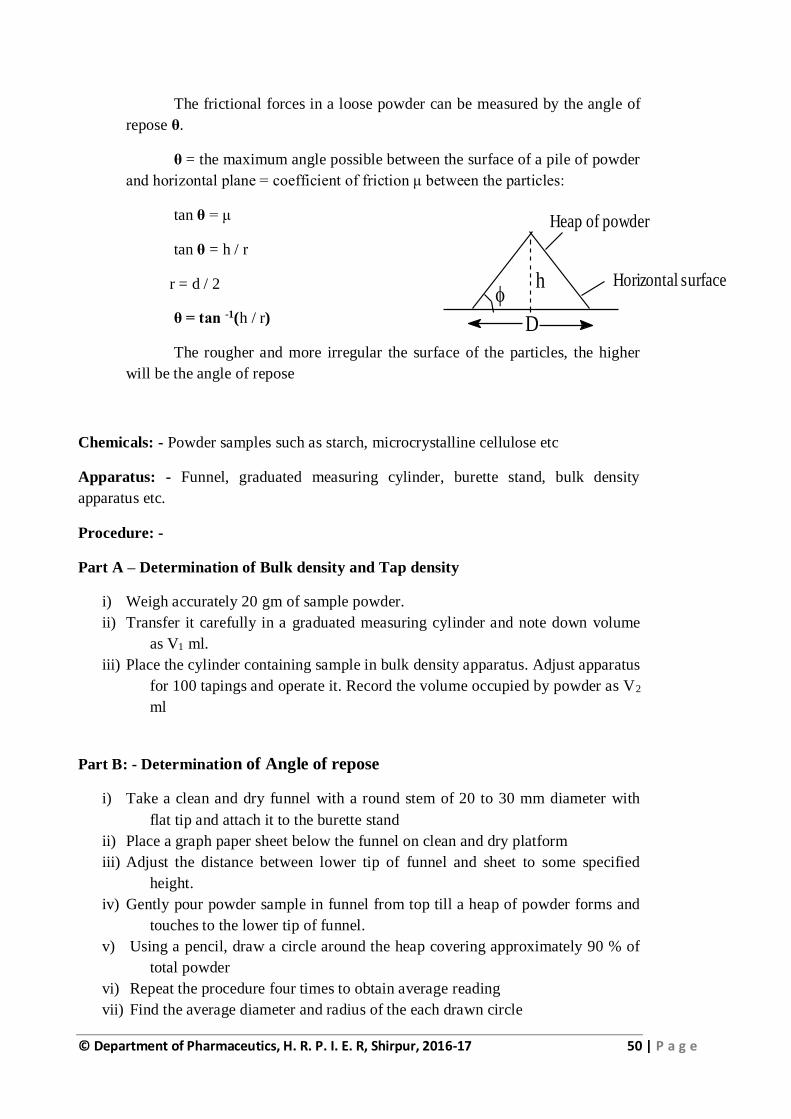
The frictional forces in a loose powder can be measured by the angle of
repose θ.
θ = the maximum angle possible between the surface of a pile of powder
and horizontal plane = coefficient of friction μ between the particles:
tan θ = μ
tan θ = h / r
r = d / 2
θ = tan -1(h / r)
The rougher and more irregular the surface of the particles, the higher
will be the angle of repose
Chemicals: - Powder samples such as starch, microcrystalline cellulose etc
Apparatus: - Funnel, graduated measuring cylinder, burette stand, bulk density
apparatus etc.
Procedure: -
Part A – Determination of Bulk density and Tap density
i) Weigh accurately 20 gm of sample powder.
ii) Transfer it carefully in a graduated measuring cylinder and note down volume
as V1 ml.
iii) Place the cylinder containing sample in bulk density apparatus. Adjust apparatus
for 100 tapings and operate it. Record the volume occupied by powder as V2
ml
Part B: - Determination of Angle of repose
i) Take a clean and dry funnel with a round stem of 20 to 30 mm diameter with
flat tip and attach it to the burette stand
ii) Place a graph paper sheet below the funnel on clean and dry platform
iii) Adjust the distance between lower tip of funnel and sheet to some specified
height.
iv) Gently pour powder sample in funnel from top till a heap of powder forms and
touches to the lower tip of funnel.
v) Using a pencil, draw a circle around the heap covering approximately 90 % of
total powder
vi) Repeat the procedure four times to obtain average reading
vii) Find the average diameter and radius of the each drawn circle
Horizontal surface
Heap of powder
h
D
f
© Department of Pharmaceutics, H. R. P. I. E. R, Shirpur, 2016-17 51 | P a g e
Calculations: -
1) Bulk Density:
Weight of powder (W1) = ------------ gms
Bulk volume of powder (V1) = --------------- ml
Bulk Density = W1
V1
Bulk Density = ------------ gm/ml
2) Tapped Density:
Weight of powder (W1) = ------------ gms
Tapped volume of powder (V2) = --------------- ml
Tapped Density = W1
V2
Tapped Density = ------------ gm/ml
3) Carr’s index:
Tapped density – Poured or bulk density
Carr’s index (%) = x 100
Tapped density
Carr’s index (%) = ------------ %
4) Angle of repose
Angle of repose (θ) = tan -1(h / r)
Angle of repose (θ) = --------- 0
Result:-
The derived properties of given powder sample are measured and reported as
below
© Department of Pharmaceutics, H. R. P. I. E. R, Shirpur, 2016-17 52 | P a g e
Sr. No. Derived properties Result
1 Bulk Density
2 Tapped Density
3 Carr’s index
4 Angle of repose
Answer the following question:
1. Write a short note on powder characterization
2. Define porosity, explain its importance
© Department of Pharmaceutics, H. R. P. I. E. R, Shirpur, 2016-17 53 | P a g e
Preparation and Standardization of Solution
Aim: -
To Determine Hydrophile-Lipophile-Balance (HLB) of Glyceryl Mono Stearate
Learning objective:
You will be able to explain
1. Surface active agents
2. Hydrophilic lipophilic balance and its significance
3. Methods to determine HLB
Introduction: -
The Hydrophile-Lipophile-Balance (HLB) System simplifies the choice
of surfactants to meet emulsion formulation requirements. It is based on the
balance between the hydrophilic and the lipophilic proportions that give each
surfactant its functionality. In the HLB System, the hydrophilic-lipophilic
balance of each surfactant has an HLB number. Each oil or wax to be emulsified
has a required HLB number, indicating the surfactant HLB required to give a
satisfactory emulsion. By choosing surfactants with HLB values appropriate for
emulsifying any given oil system, trial and error effort is reduced and optimum
performance is usually obtained rapidly. Emulsifier combinations in the HLB
range of 8 to 18 prove most suitable for oil in water products. Water in oil
emulsions generally requires emulsifiers in the HLB range of 4 to 6.
Generally, the lower the HLB value, the more lipophilic the surfactant;
conversely, the higher the HLB value, the more hydrophilic. For example,
surfactants with an HLB of 4 to 6 are considered lipophilic and tend to form
water-in-oil emulsions. Surfactants in the range of 8 to 18 are considered
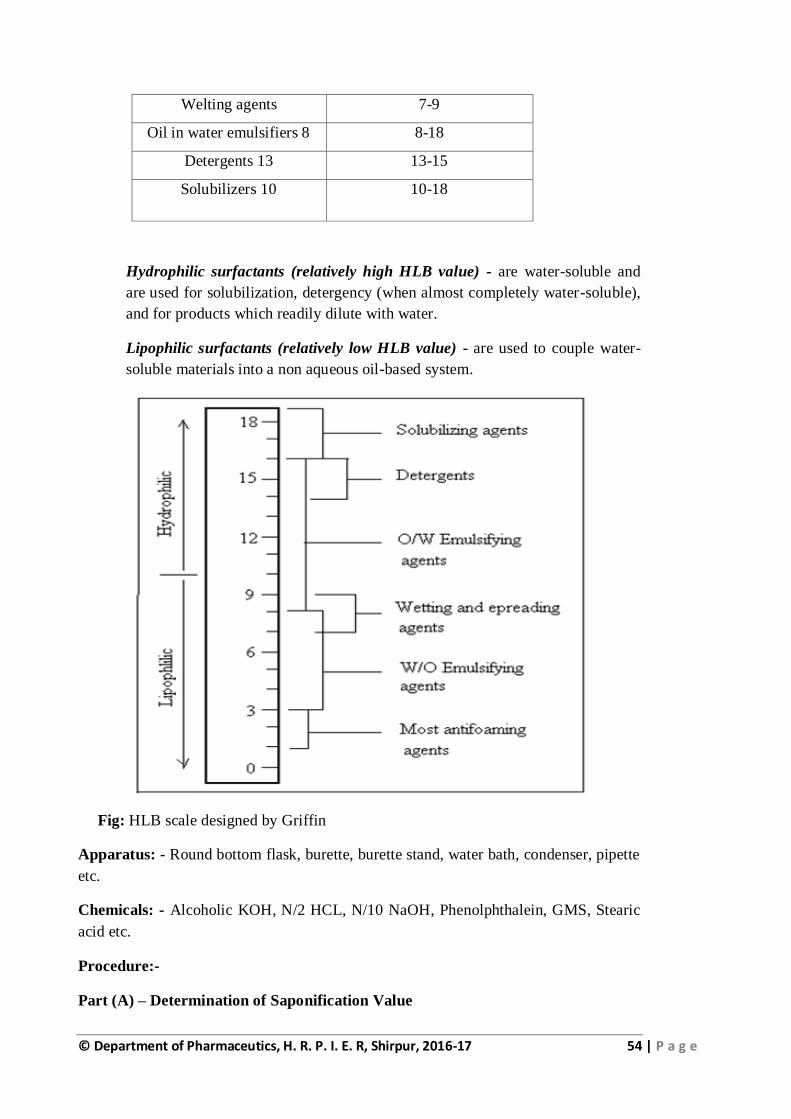
hydrophilic and tend to form oil-in-water emulsions. In general:
Application HLB Range
Water in oil emulsifiers 4-6
Experiment No.: 11 Date:
Hydrophile-Lipophile-Balance
© Department of Pharmaceutics, H. R. P. I. E. R, Shirpur, 2016-17 54 | P a g e
Welting agents 7-9
Oil in water emulsifiers 8 8-18
Detergents 13 13-15
Solubilizers 10 10-18
Hydrophilic surfactants (relatively high HLB value) - are water-soluble and
are used for solubilization, detergency (when almost completely water-soluble),
and for products which readily dilute with water.
Lipophilic surfactants (relatively low HLB value) - are used to couple water-
soluble materials into a non aqueous oil-based system.
Fig: HLB scale designed by Griffin
Apparatus: - Round bottom flask, burette, burette stand, water bath, condenser, pipette
etc.
Chemicals: - Alcoholic KOH, N/2 HCL, N/10 NaOH, Phenolphthalein, GMS, Stearic
acid etc.
Procedure:-
Part (A) – Determination of Saponification Value
© Department of Pharmaceutics, H. R. P. I. E. R, Shirpur, 2016-17 55 | P a g e
(Definition – It is the number of milligrams of KOH required to saponify 1 gram
of given ester)
i) Prepare 0.5 N alcoholic KOH, 0.5 N HCl and 0.1 N NaOH solutions.
ii) Add 0.5 grams of glyceryl mono stearate (GMS) in round bottom flask
containing 25 ml alcoholic KOH and then reflux the mixture for about 1
hour.
iii) Carry out blank determination with similar manner without sample.
iv) Cool both the mixtures to room temperature and titrate against 0.5 N HCl
solution using phenolphthalein as an indicator.
v) Note down the readings, One with sample (a) and another without sample
(b).
Part (B) – Determination of Acid value
(Definition – It is the number of milligrams of KOH required to completely
neutralize 1 gram of free acid in sample)
i) Weigh accurately 0.5 grams of Stearic acid, add it into conical flask
containing 10 ml alcohol and 10 ml ether.
ii) Warm the mixture on water bath if required.
iii) Cool the mixture and titrate against 0.1 N NaOH using phenolphthalein as
an indicator.
iv) Let the reading will be (c) ml
Calculations:-
(A) – Saponification Value
Factor – 1000 ml of 1 N KOH = 56000 mg of KOH
(b-a) of 0.5 N KOH = X
X = (b-a) X 0.5 X 56000
1000
Therefore,
X = ---------------- / 0.5 grams of NaOH
Hence,
For 0.5 grams of NaOH = X
For 1 grams of NaOH = S
(Cross multiplication)
© Department of Pharmaceutics, H. R. P. I. E. R, Shirpur, 2016-17 56 | P a g e
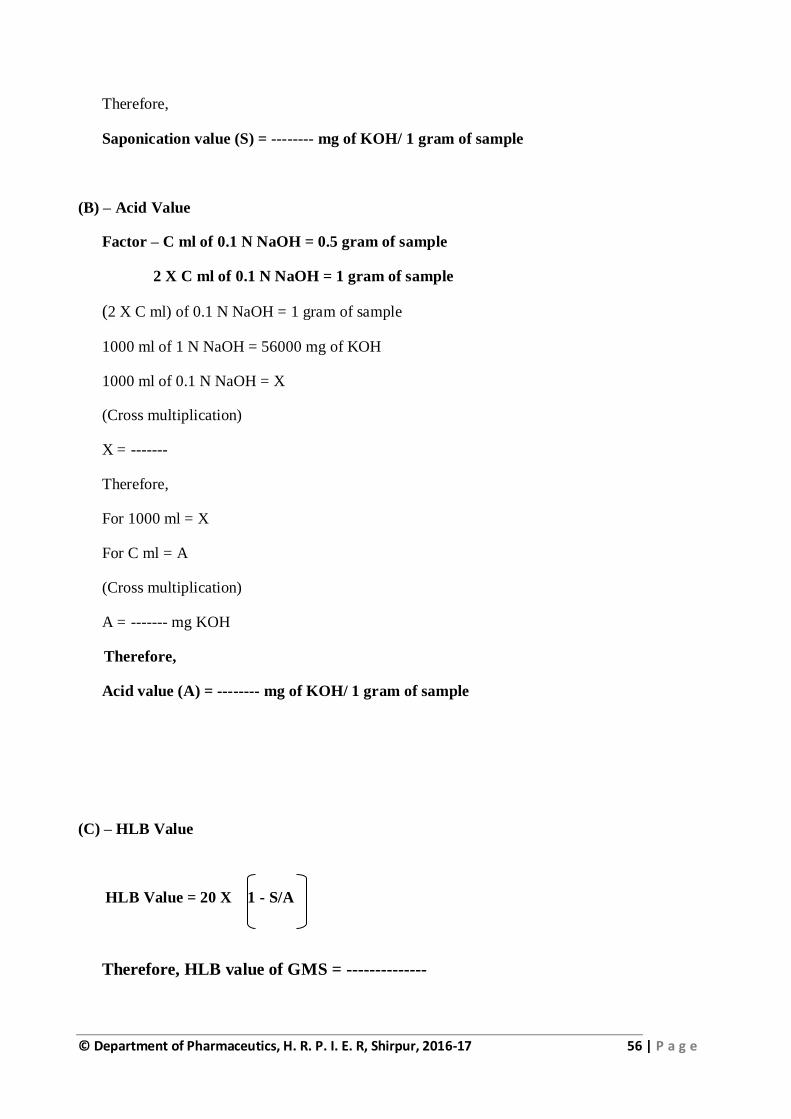
Therefore,
Saponication value (S) = -------- mg of KOH/ 1 gram of sample
(B) – Acid Value
Factor – C ml of 0.1 N NaOH = 0.5 gram of sample
2 X C ml of 0.1 N NaOH = 1 gram of sample
(2 X C ml) of 0.1 N NaOH = 1 gram of sample
1000 ml of 1 N NaOH = 56000 mg of KOH
1000 ml of 0.1 N NaOH = X
(Cross multiplication)
X = -------
Therefore,
For 1000 ml = X
For C ml = A
(Cross multiplication)
A = ------- mg KOH
Therefore,
Acid value (A) = -------- mg of KOH/ 1 gram of sample
(C) – HLB Value
HLB Value = 20 X 1 - S/A
Therefore, HLB value of GMS = --------------
© Department of Pharmaceutics, H. R. P. I. E. R, Shirpur, 2016-17 57 | P a g e
Result:-
The Hydrophile-Lipophile-Balance (HLB) value for Glyceryl Mono Stearate
was found to be ------------
Answer the following question:
1. Write importance of HLB determination
2. Define Acid value and Saponification value
© Department of Pharmaceutics, H. R. P. I. E. R, Shirpur, 2016-17 58 | P a g e
Aim- To study calibration and weights
References-1)V. Alexeyev. A Textbook of Quantitative Analysis, Foreign Languages
publishing House. P. No 39-41.
Theory- Although analyses of weights are made to a high degree of precision, their
actual weight may vary. Therefore weights must be checked or calibrated time to time.
It can be shown that difference in weights between tested weight and rider in mg is
P1 - P2 = ½ (L2 - L1) s……………………………………………………….(1)
s- Value of scale division
Result – Calibration and weights is studied as per protocol
Experiment No.: 12 Date:
Calibration and Weights
© Department of Pharmaceutics, H. R. P. I. E. R, Shirpur, 2016-17 59 | P a g e
Aim- To study calibration and weights
References-1)V. Alexeyev. A Textbook of Quantitative Analysis, Foreign Languages
publishing House. P. No 39-41.
Theory- Although analyses of weights are made to a high degree of precision, their
actual weight may vary. Therefore weights must be checked or calibrated time to time.
It can be shown that difference in weights between tested weight and rider in mg is
P1 - P2 = ½ (L2 - L1) s……………………………………………………….(1)
s- Value of scale division
Result – Calibration and weights are studied as per protocol
Experiment No.: 13 Date:
Calibration and Weights
© Department of Pharmaceutics, H. R. P. I. E. R, Shirpur, 2016-17 60 | P a g e
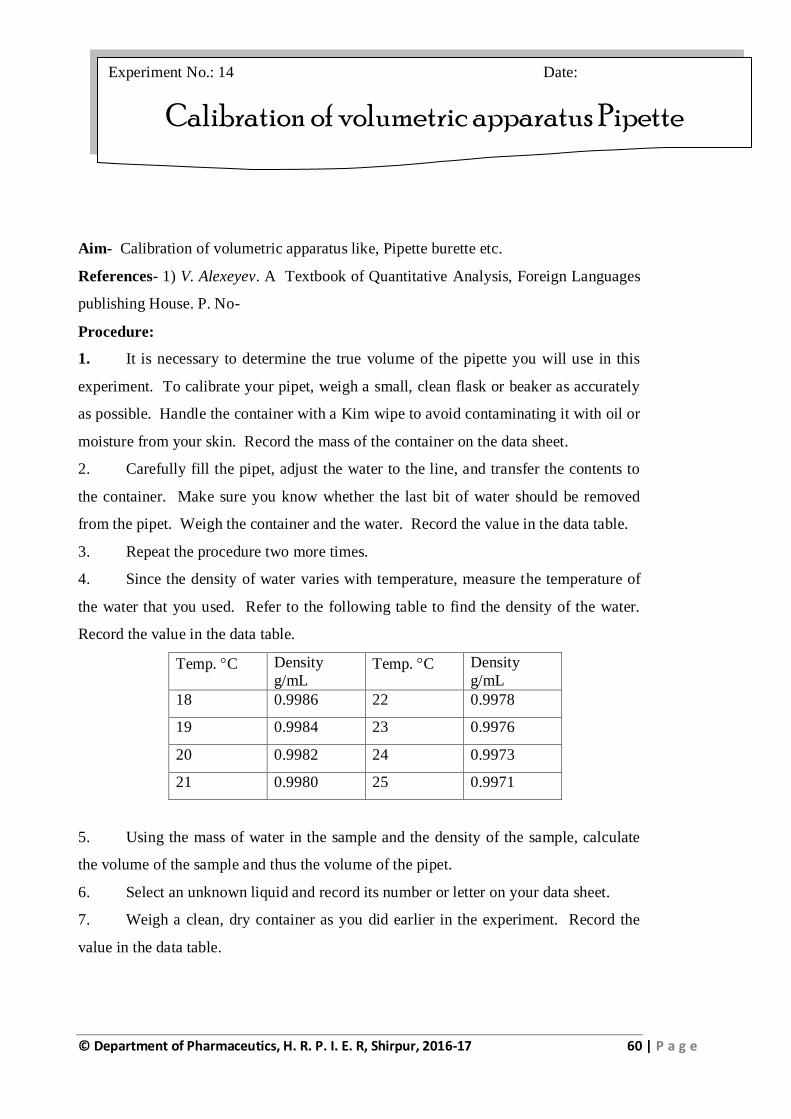
Aim- Calibration of volumetric apparatus like, Pipette burette etc.
References- 1) V. Alexeyev. A Textbook of Quantitative Analysis, Foreign Languages
publishing House. P. No-
Procedure:
1. It is necessary to determine the true volume of the pipette you will use in this
experiment. To calibrate your pipet, weigh a small, clean flask or beaker as accurately
as possible. Handle the container with a Kim wipe to avoid contaminating it with oil or
moisture from your skin. Record the mass of the container on the data sheet.
2. Carefully fill the pipet, adjust the water to the line, and transfer the contents to
the container. Make sure you know whether the last bit of water should be removed
from the pipet. Weigh the container and the water. Record the value in the data table.
3. Repeat the procedure two more times.
4. Since the density of water varies with temperature, measure the temperature of
the water that you used. Refer to the following table to find the density of the water.
Record the value in the data table.
Temp. C Density
g/mL Temp. C Density
g/mL
18 0.9986 22 0.9978
19 0.9984 23 0.9976
20 0.9982 24 0.9973
21 0.9980 25 0.9971
5. Using the mass of water in the sample and the density of the sample, calculate
the volume of the sample and thus the volume of the pipet.
6. Select an unknown liquid and record its number or letter on your data sheet.
7. Weigh a clean, dry container as you did earlier in the experiment. Record the
value in the data table.
Experiment No.: 14 Date:
Calibration of volumetric apparatus Pipette
© Department of Pharmaceutics, H. R. P. I. E. R, Shirpur, 2016-17 61 | P a g e
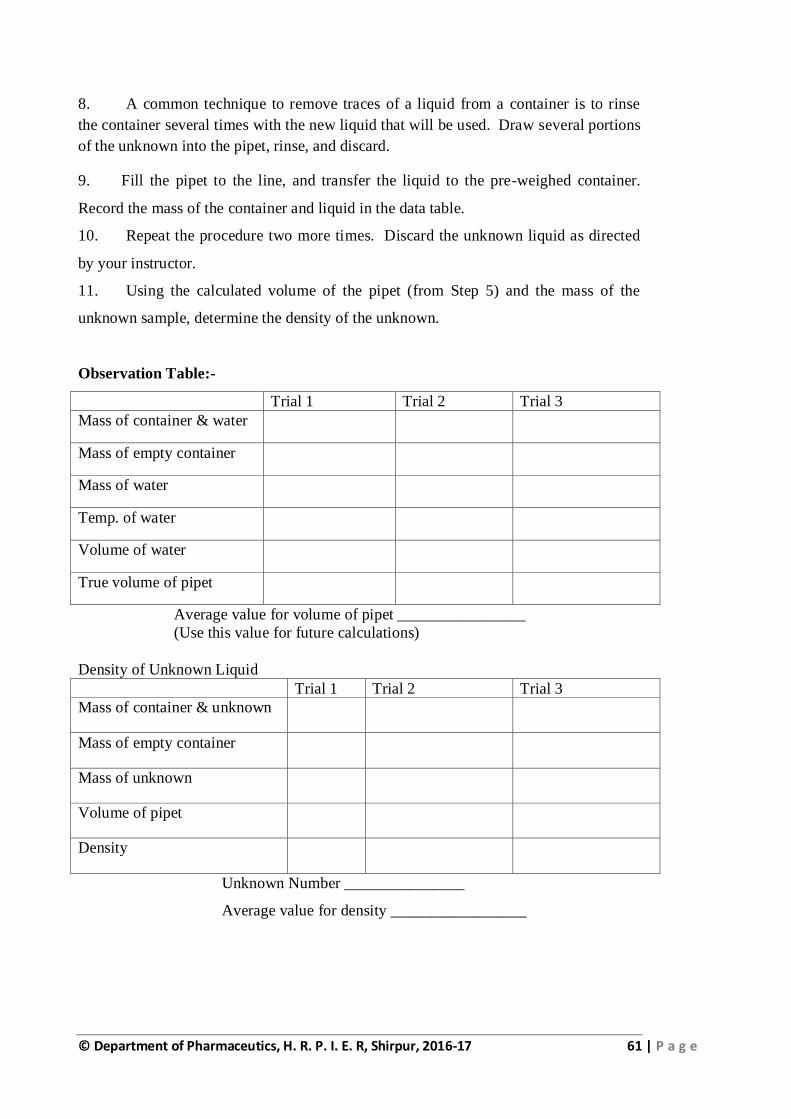
8. A common technique to remove traces of a liquid from a container is to rinse
the container several times with the new liquid that will be used. Draw several portions
of the unknown into the pipet, rinse, and discard.
9. Fill the pipet to the line, and transfer the liquid to the pre-weighed container.
Record the mass of the container and liquid in the data table.
10. Repeat the procedure two more times. Discard the unknown liquid as directed
by your instructor.
11. Using the calculated volume of the pipet (from Step 5) and the mass of the
unknown sample, determine the density of the unknown.
Observation Table:-
Trial 1 Trial 2 Trial 3
Mass of container & water
Mass of empty container
Mass of water
Temp. of water
Volume of water
True volume of pipet
Average value for volume of pipet ________________
(Use this value for future calculations)
Density of Unknown Liquid
Trial 1 Trial 2 Trial 3
Mass of container & unknown
Mass of empty container
Mass of unknown
Volume of pipet
Density
Unknown Number _______________
Average value for density _________________
© Department of Pharmaceutics, H. R. P. I. E. R, Shirpur, 2016-17 62 | P a g e
Aim- Preparation and standardization Bases (NaOH).
References-1)Indian Pharmacopoeia, 2007, volume 1, Government of India Ministry of
Health and Family Welfare, published by Indian Pharmacopoeia Commission,
Ghaziabad, p.552
Preparation of Sodium Hydroxide, 1 M:Dissolve 42 g of sodium hydroxidein
sufficient carbon dioxide-free water to produce 1000 ml.
Standardization Procedure-Weigh accurately about 5 g of potassium hydrogen
phthalate,
Previously powdered and dried at 120° for 2 hours, anddissolve in 75 ml of carbon
dioxide-free water. Add 0.1 ml ofphenolphthalein solution and titrate with the sodium
hydroxide solution until a permanent pink colour is produced.
1 ml of 1 M sodium hydroxide is equivalent to 0.2042 g ofC8H5KO4.
Result – NaOH (strong base) was prepared and standerdised as per Indian
pharmacopoeia
Experiment No.: 15 Date:
Preparation and Standardization of Bases (NaOH).
© Department of Pharmaceutics, H. R. P. I. E. R, Shirpur, 2016-17 63 | P a g e
Aim- Preparation and standardization of acids (HCl).
References- 1)Indian Pharmacopoeia, 2007, volume 1, Government of India Ministry
of Health and Family Welfare, published by Indian Pharmacopoeia Commision,
Gaziabad, p.550
Procedure:-
Preparation of Hydrochloric Acid, 1 M: Dilute 85 ml of hydrochloric acid with
water to produce 1000 ml. Standardise the solution in the following manner.
Standardization Procedure-Weigh accurately about 1.5 g of anhydrous sodium
carbonate, previously heated at about 270º for 1 hour. Dissolve it in 100 ml of water
and add 0.1 ml of methyl red solution. Add the acid slowly from a burette, with
constant stirring, until the solution becomes faintly pink. Heat the solution to boiling,
cool and continue the titration. Heat again to boiling and titrate further as necessary
until the faint pink colour is no longer affected by continued boiling.
1 ml of 1 M hydrochloric acid is equivalent to 0.05299 g of Na2CO3.
Result – HCl (strong acid) was prepared and standerdised as per Indian
pharmacopoeia
Experiment No.: 16 Date:
Preparation and Standardization of Acid (HCl).