Embed Size (px)
Citation preview
Laboratory Support for Multi-Increment Sampling Laboratory Support for Multi-Increment SamplingMark Bruce Ph.DLarry Penfold
October 2008©2008, TestAmerica Laboratories, Inc. All rights reserved.TestAmerica & Design ™ are trademarks of TestAmerica Laboratories, Inc.
USACE Fort Worth and Sacramento Districts
2
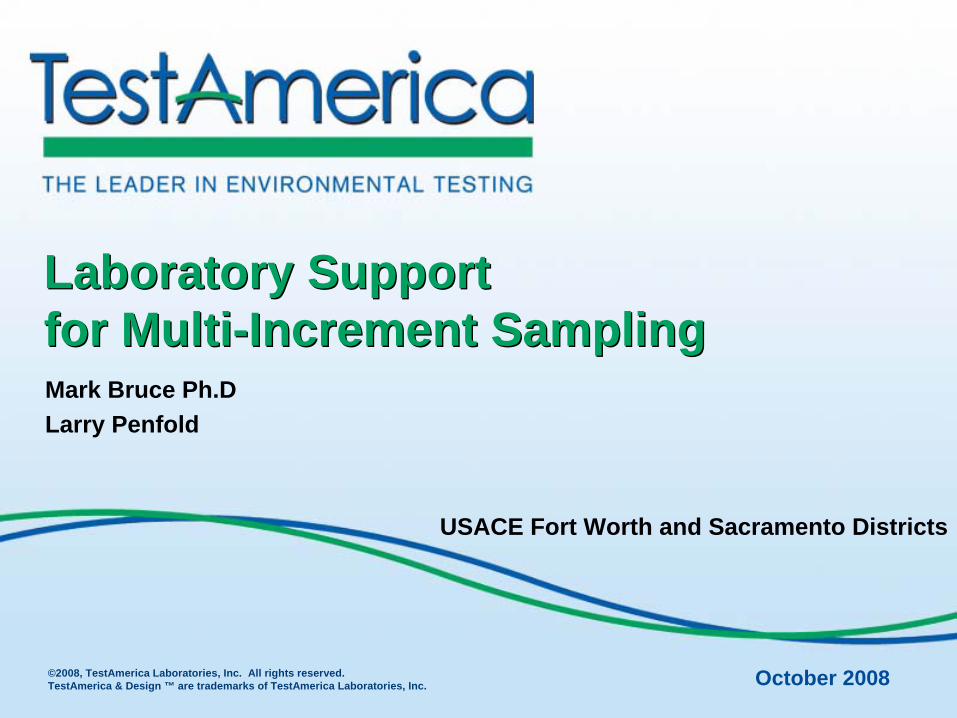
Objective of MIS Process
• Improve representativeness of field samples
• Improve representativeness of lab subsamples
Better estimate of the average concentration within Better estimate of the average concentration within an area of concernan area of concern
3
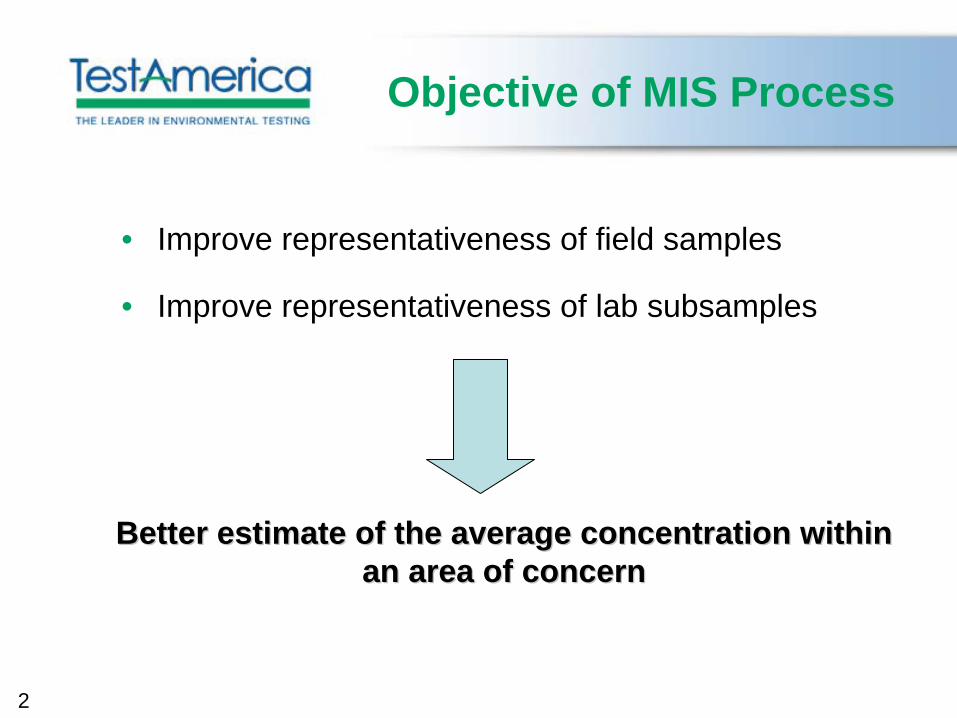
Chasing Sources of Uncertainty
• Instrumental analysis
• Sample preparation
• Laboratory sub-sampling
• Field sample collection
4
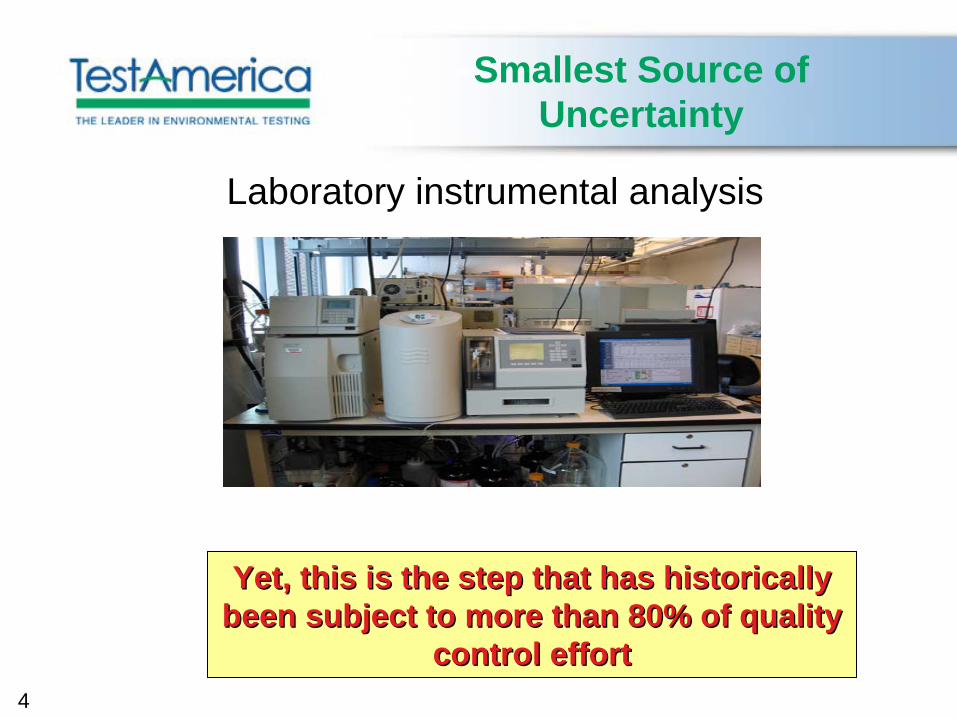
Smallest Source of Uncertainty
Laboratory instrumental analysis
Yet, this is the step that has historically Yet, this is the step that has historically been subject to more than 80% of quality been subject to more than 80% of quality
control effortcontrol effort
5
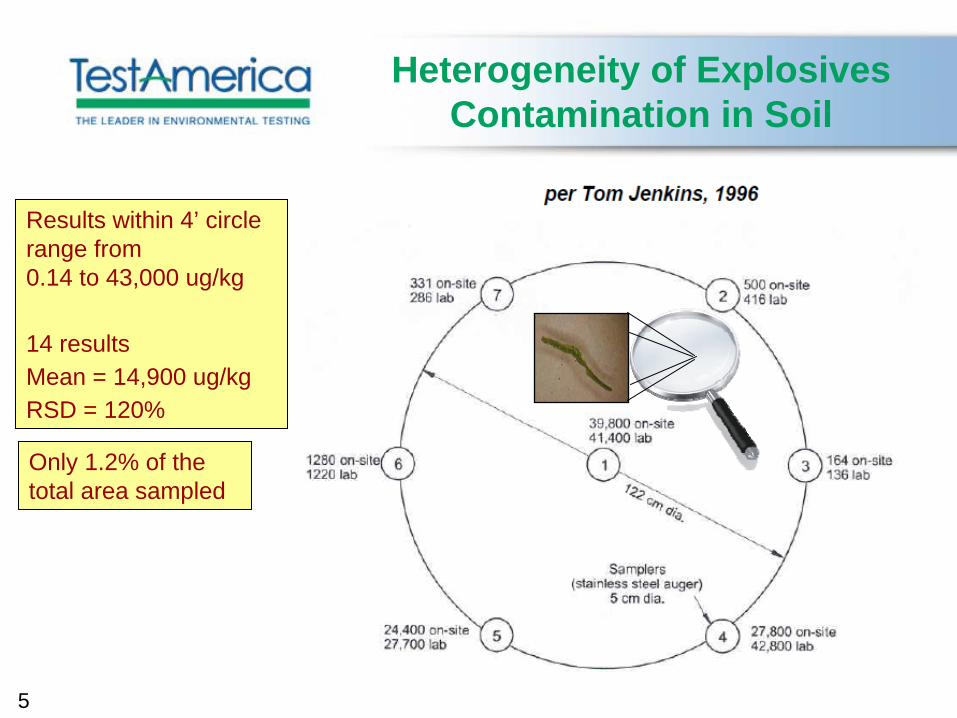
Results within 4’ circle range from 0.14 to 43,000 ug/kg
14 resultsMean = 14,900 ug/kgRSD = 120%
Only 1.2% of the total area sampled
Heterogeneity of Explosives Contamination in Soil
6
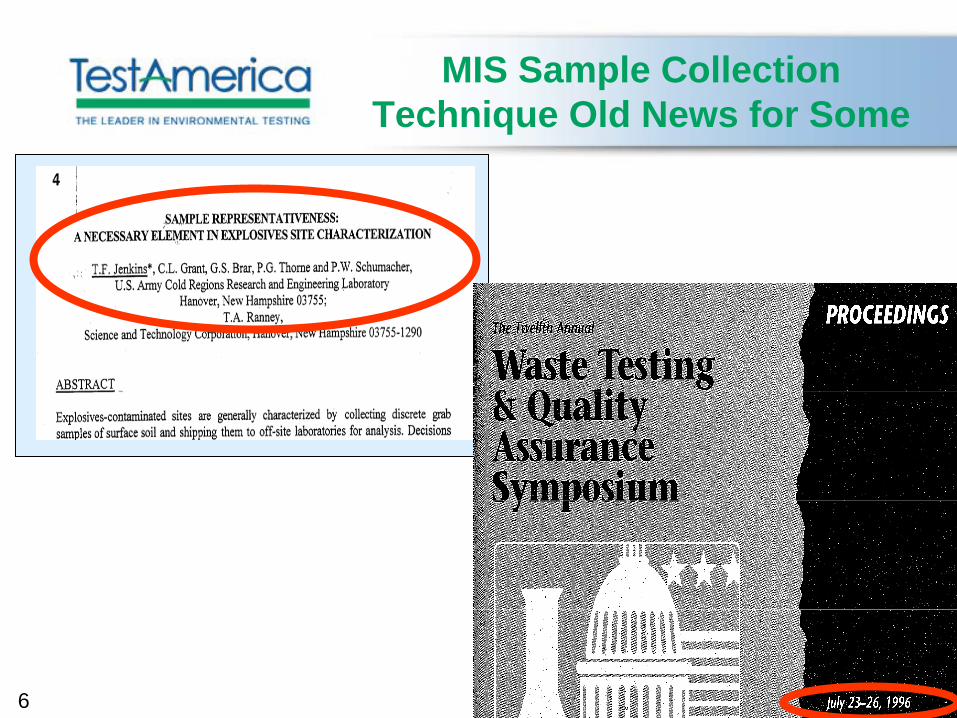
MIS Sample Collection Technique Old News for Some
7
Discrete sampling
2
4
5
1
3
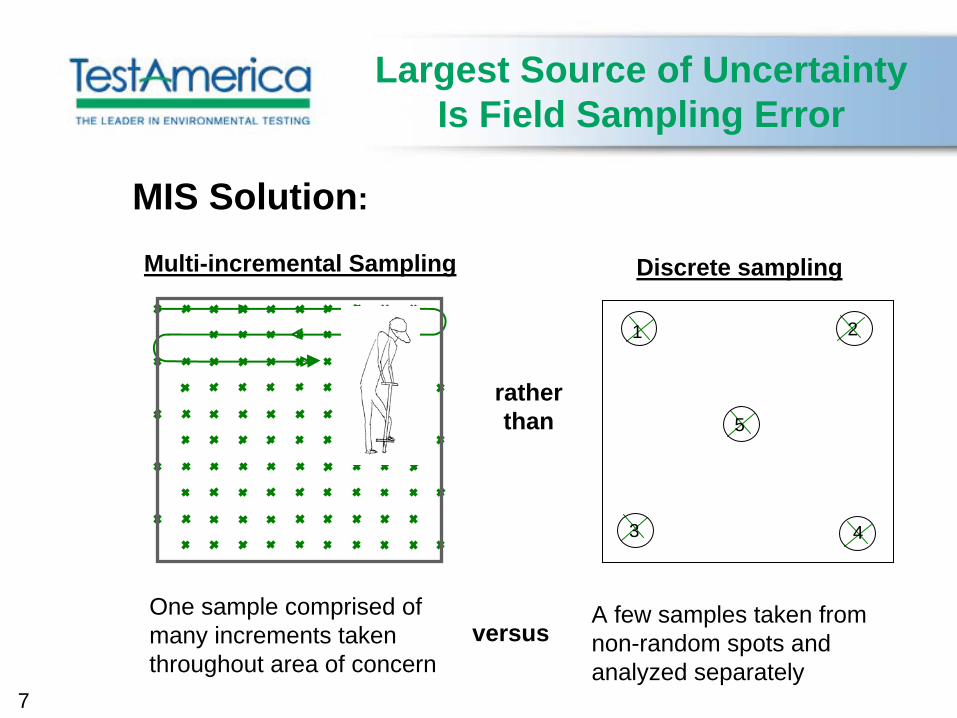
Largest Source of Uncertainty Is Field Sampling Error
MIS Solution:
rather than
Multi-incremental Sampling
One sample comprised of many increments taken throughout area of concern
A few samples taken from non-random spots and analyzed separately
versus
8
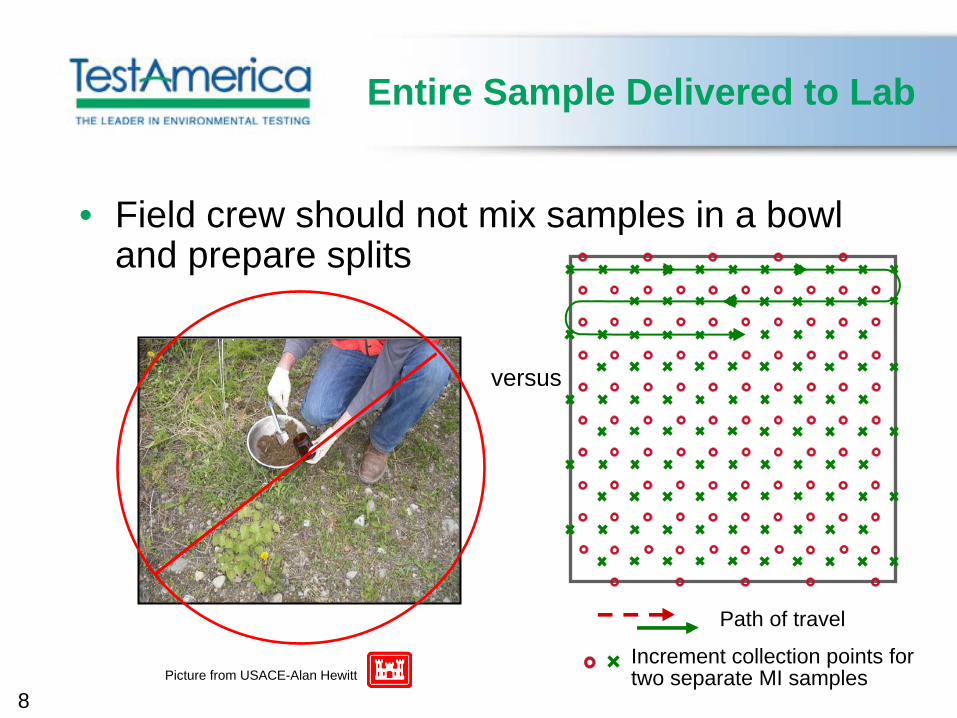
Entire Sample Delivered to Lab
• Field crew should not mix samples in a bowl and prepare splits
Path of travel
Increment collection points for two separate MI samples
versus
Picture from USACE-Alan Hewitt
9
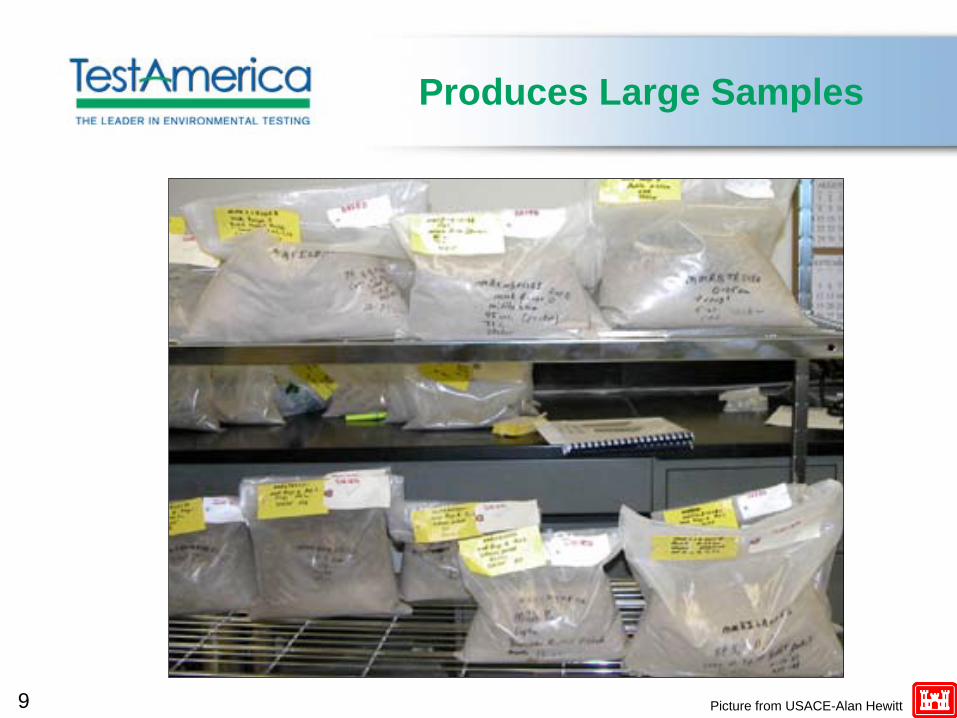
Produces Large Samples
Picture from USACE-Alan Hewitt
10
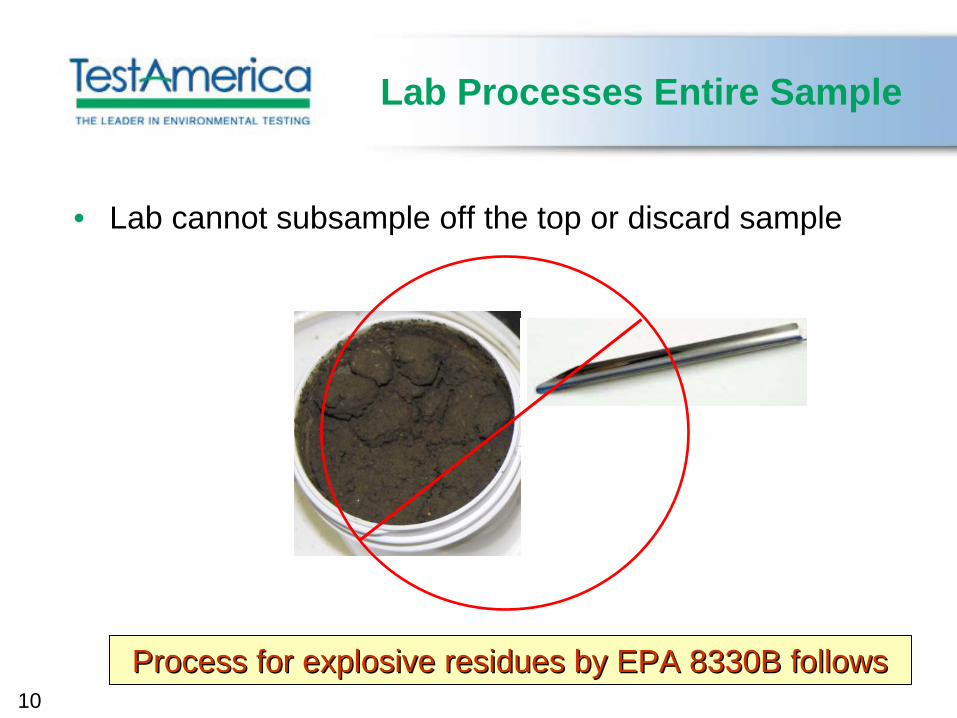
Lab Processes Entire Sample
• Lab cannot subsample off the top or discard sample
Process for explosive residues by EPA 8330B followsProcess for explosive residues by EPA 8330B follows
11
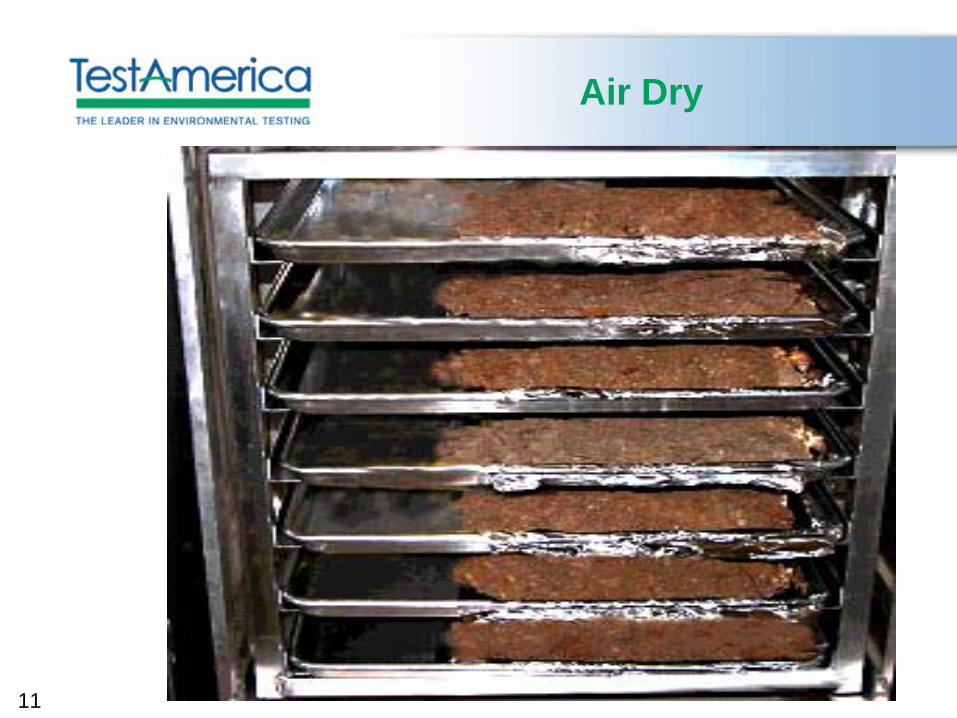
Air Dry
12
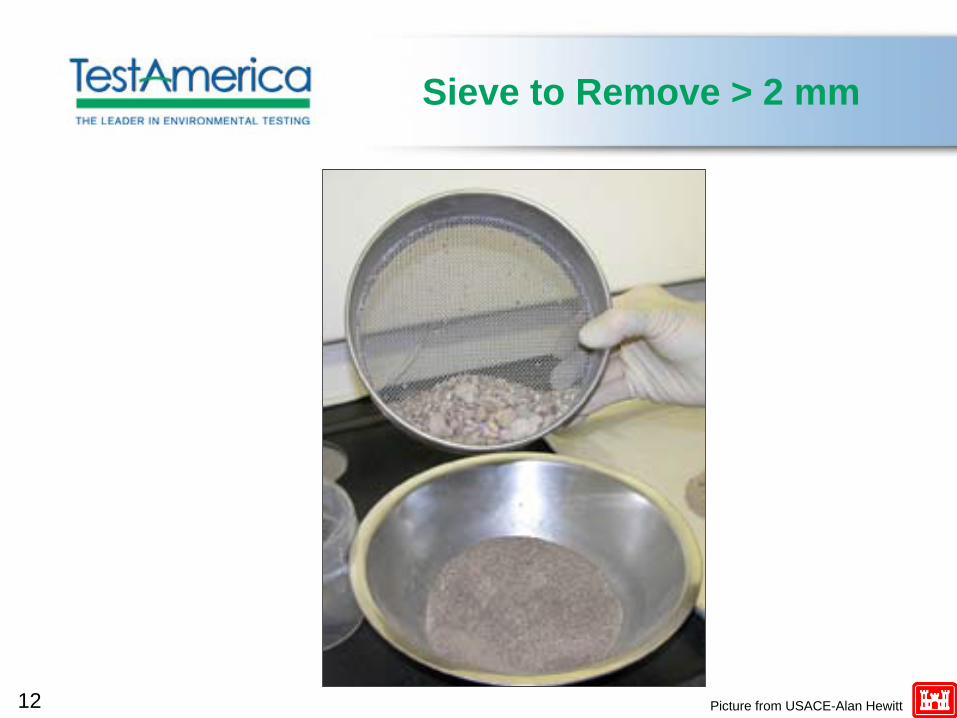
Sieve to Remove > 2 mm
Picture from USACE-Alan Hewitt
13
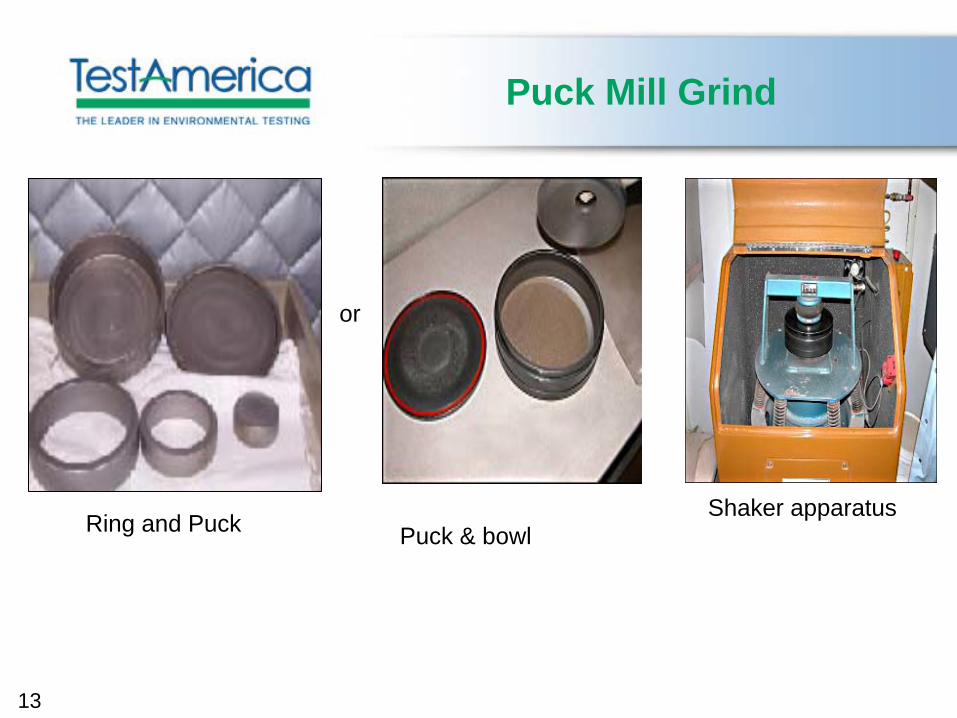
Puck Mill Grind
Shaker apparatusPuck & bowlRing and Puck
or
14
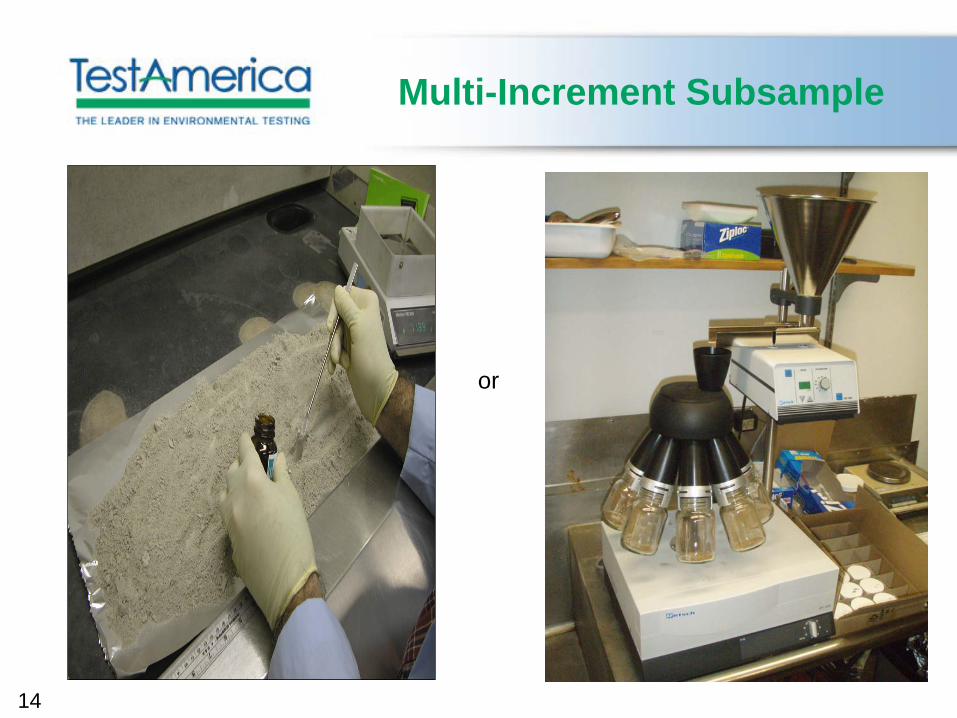
Multi-Increment Subsample
or
15
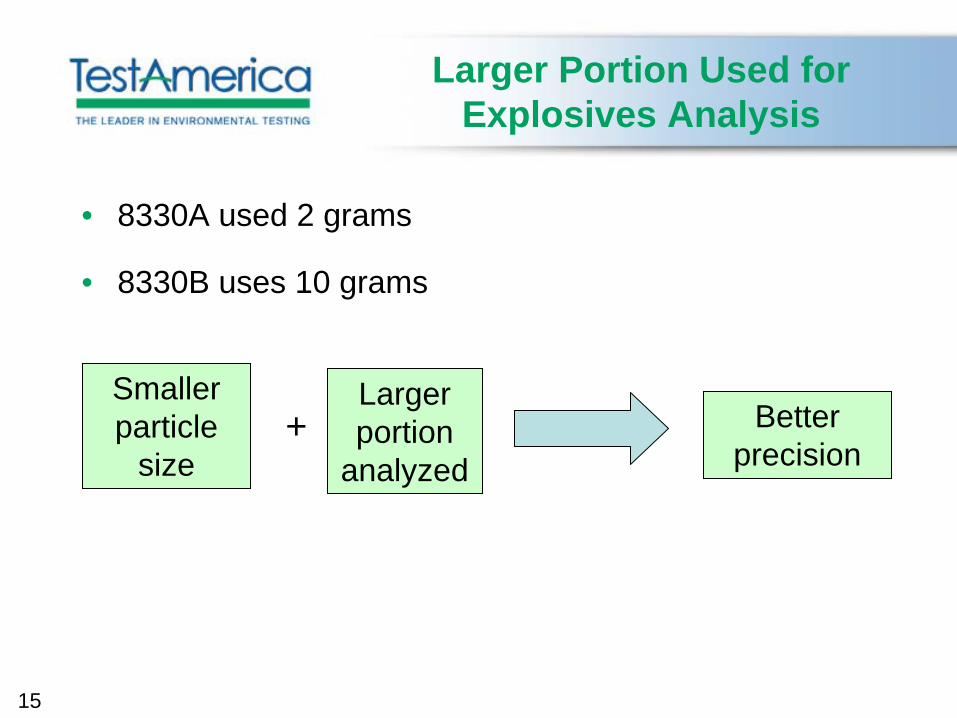
Larger Portion Used for Explosives Analysis
• 8330A used 2 grams
• 8330B uses 10 grams
Smaller particle
size+
Larger portion
analyzed
Better precision
16
How Much Difference Does It Make?
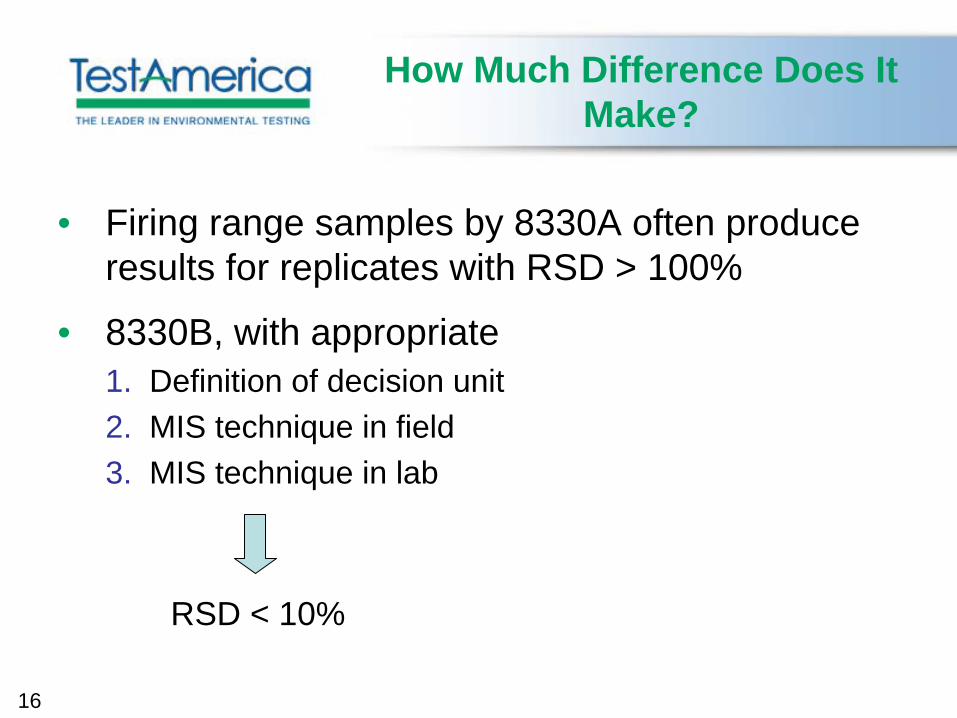
• Firing range samples by 8330A often produce results for replicates with RSD > 100%
• 8330B, with appropriate1. Definition of decision unit2. MIS technique in field3. MIS technique in lab
RSD < 10%
17
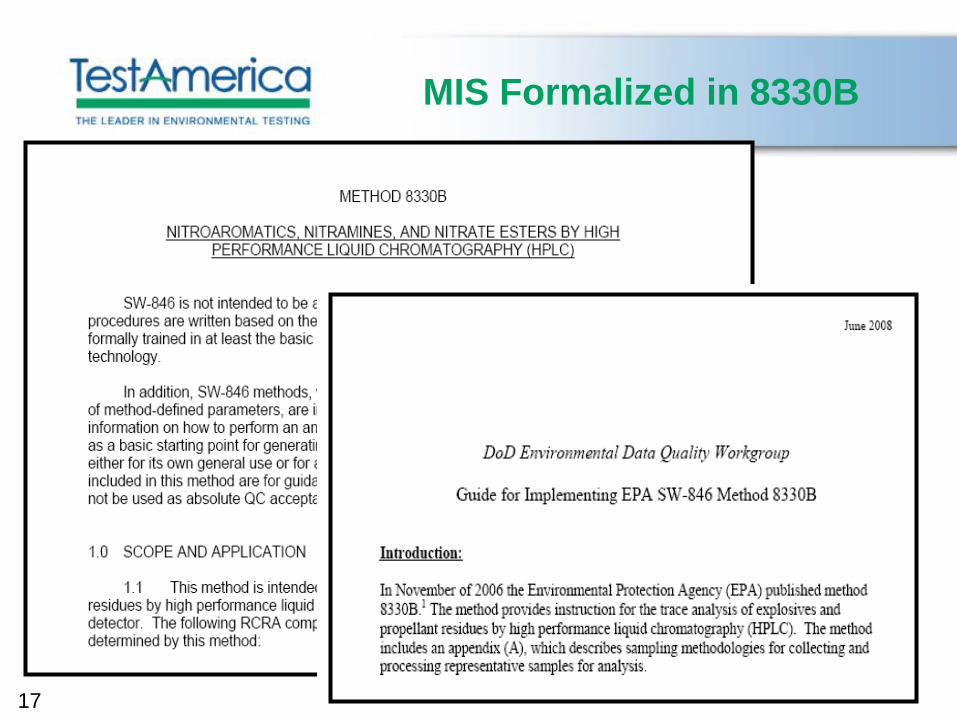
MIS Formalized in 8330B
18
EPA General Subsampling Guidance
Nov 2003
19
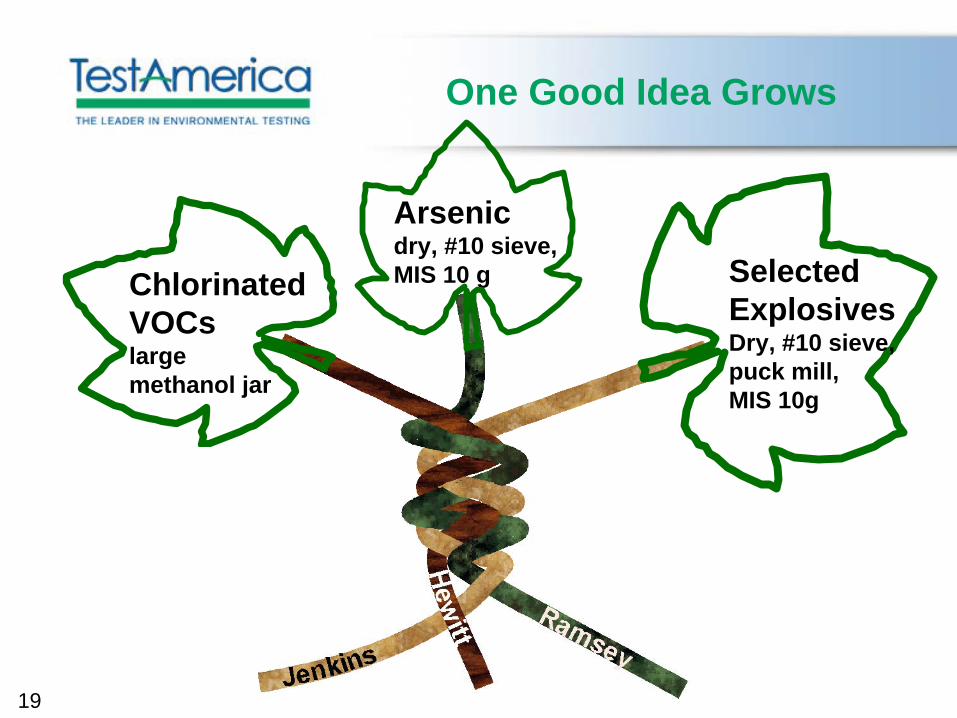
One Good Idea Grows
Arsenicdry, #10 sieve, MIS 10 gChlorinated
VOCs large methanol jar
Selected ExplosivesDry, #10 sieve, puck mill, MIS 10g
20
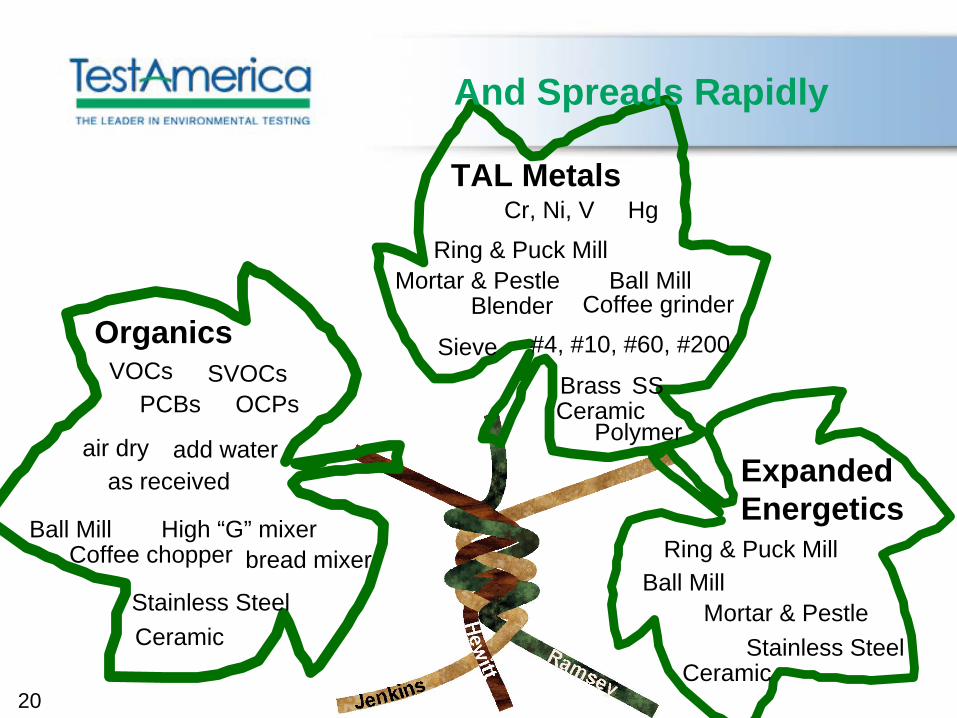
And Spreads Rapidly
Coffee grinderBlender
CeramicStainless Steel
SSSieve #4, #10, #60, #200
bread mixer
Cr, Ni, VTAL Metals
Brass
Polymer
High “G” mixer
OrganicsVOCs SVOCs
PCBs OCPs
Hg
Ceramic
Ring & Puck MillBall MillMortar & Pestle
Coffee chopperBall Mill
air dryas received
add water
Ball MillRing & Puck Mill
Mortar & Pestle
CeramicStainless Steel
Expanded Energetics
21
Working with the Lab
• There is no “one way” to implement MIS• Many options• To apply MIS technique successfully • Work with lab in advance to discuss
- Project objectives- Lab capabilities for bulk sample processing
• Leading to a plan customized to the needs of the project
22
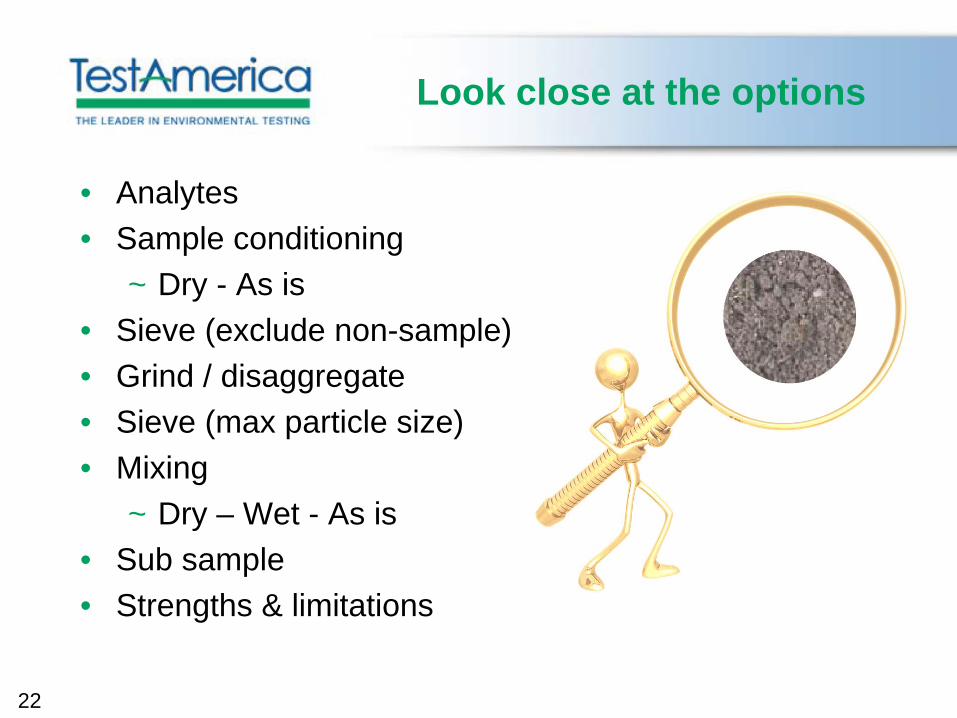
Look close at the options
• Analytes• Sample conditioning
~ Dry - As is• Sieve (exclude non-sample)• Grind / disaggregate• Sieve (max particle size)• Mixing
~ Dry – Wet - As is• Sub sample• Strengths & limitations
23
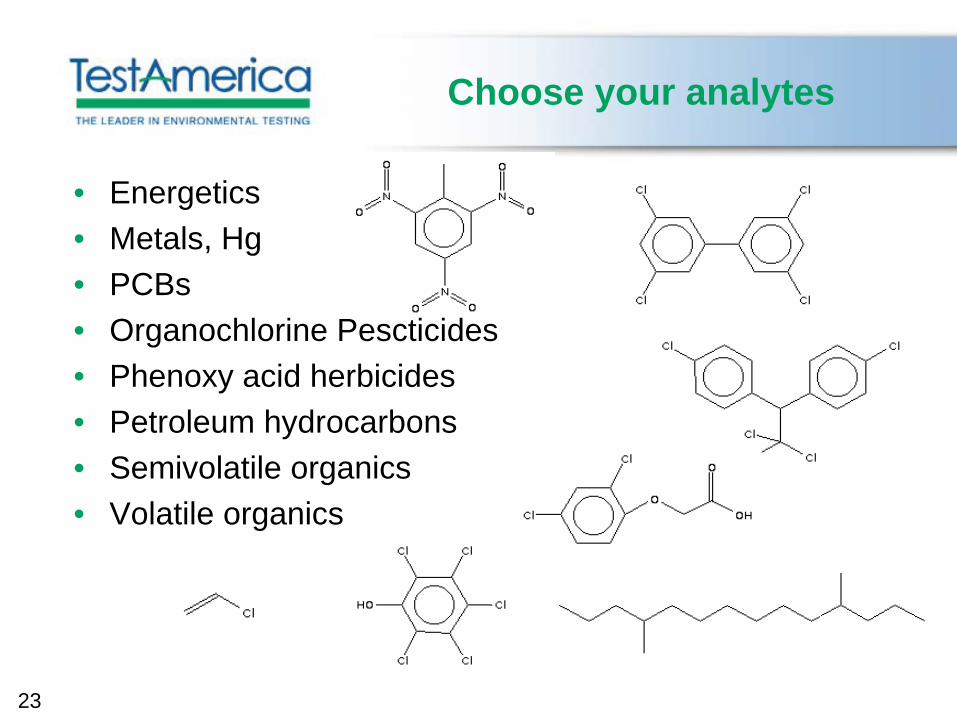
Choose your analytes
• Energetics• Metals, Hg• PCBs• Organochlorine Pescticides• Phenoxy acid herbicides• Petroleum hydrocarbons• Semivolatile organics• Volatile organics
24
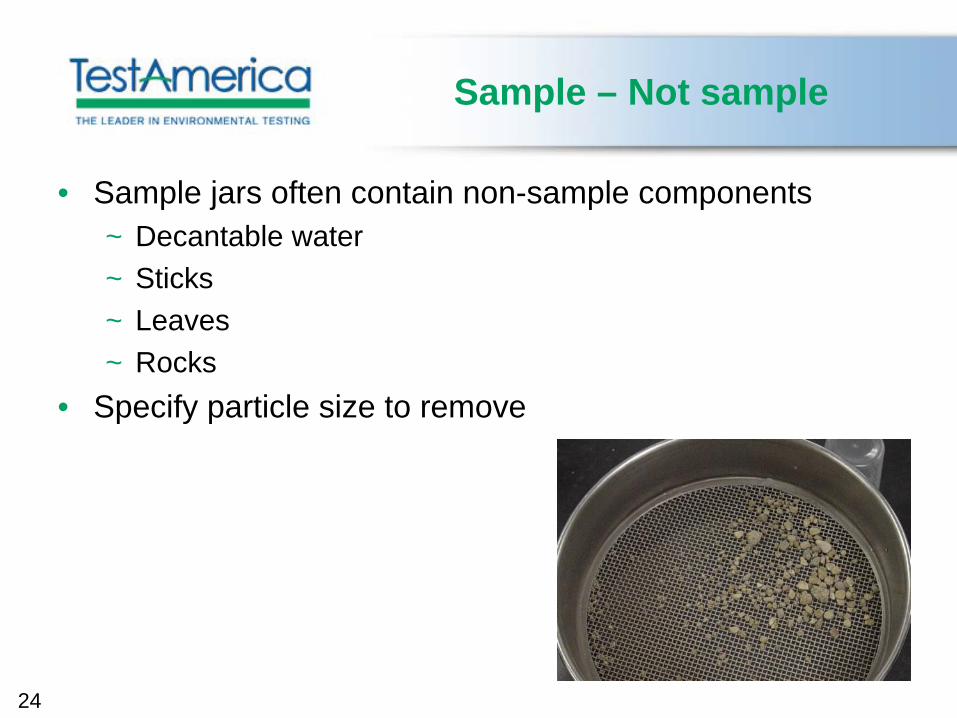
Sample – Not sample
• Sample jars often contain non-sample components~ Decantable water~ Sticks~ Leaves~ Rocks
• Specify particle size to remove
25
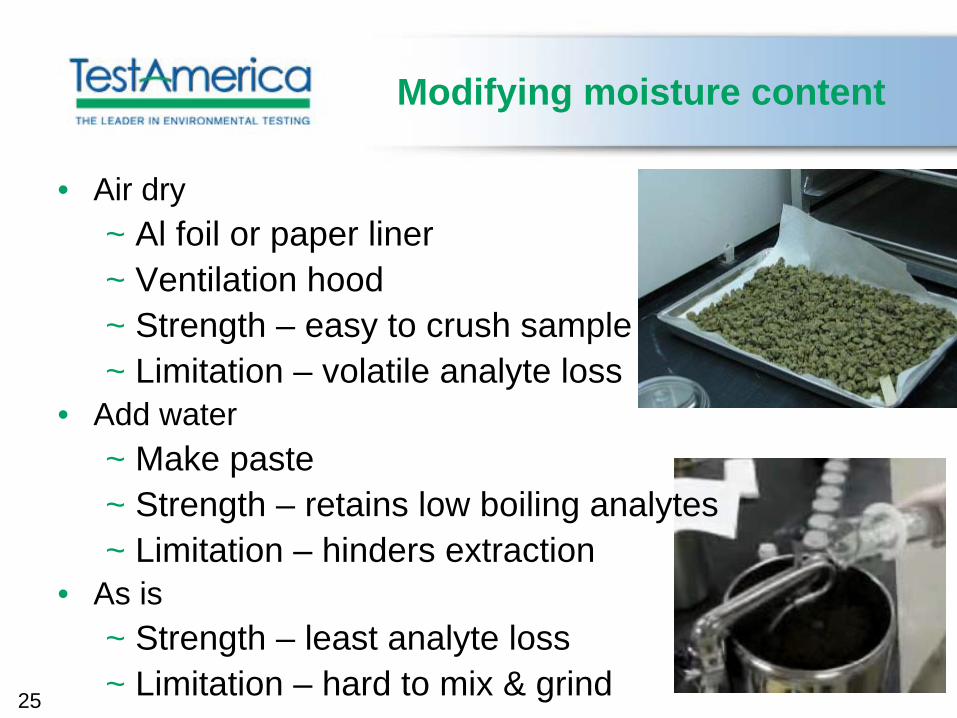
Modifying moisture content
• Air dry~ Al foil or paper liner~ Ventilation hood~ Strength – easy to crush sample~ Limitation – volatile analyte loss
• Add water~ Make paste~ Strength – retains low boiling analytes~ Limitation – hinders extraction
• As is~ Strength – least analyte loss~ Limitation – hard to mix & grind
26
Sieve to separate sample from non-sample
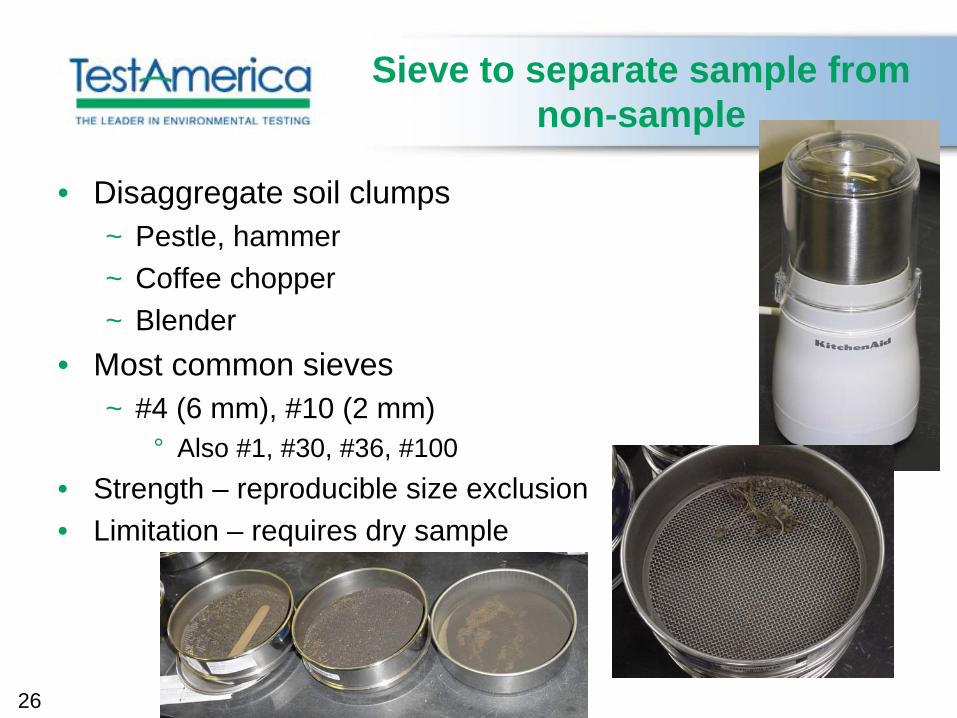
• Disaggregate soil clumps~ Pestle, hammer~ Coffee chopper~ Blender
• Most common sieves~ #4 (6 mm), #10 (2 mm)
° Also #1, #30, #36, #100• Strength – reproducible size exclusion• Limitation – requires dry sample
27
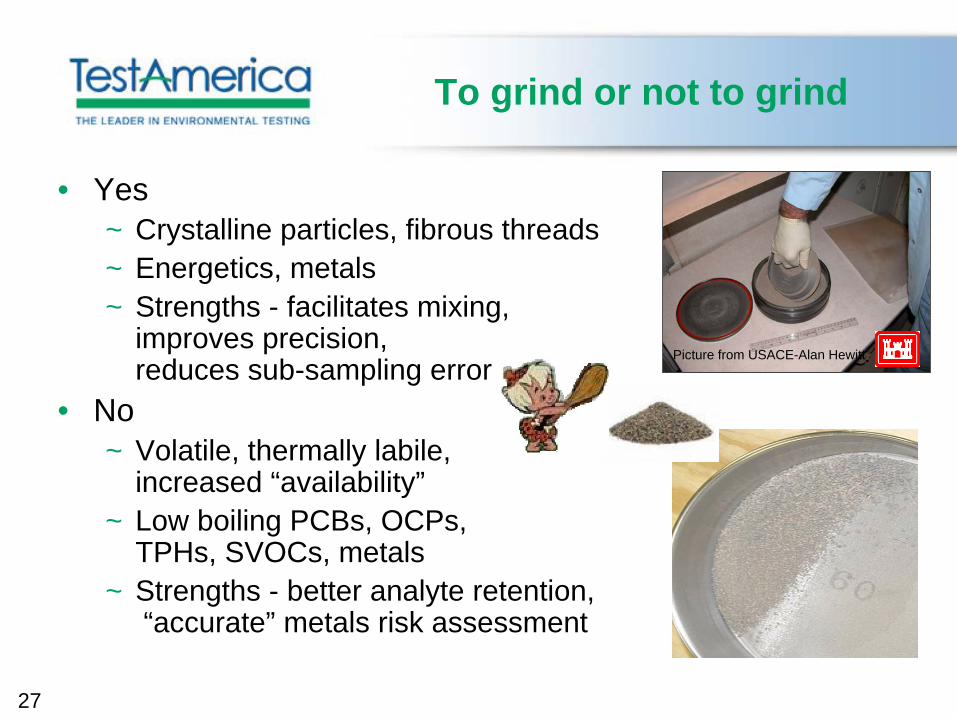
To grind or not to grind
• Yes ~ Crystalline particles, fibrous threads ~ Energetics, metals~ Strengths - facilitates mixing,
improves precision, reduces sub-sampling error
• No ~ Volatile, thermally labile,
increased “availability”~ Low boiling PCBs, OCPs,
TPHs, SVOCs, metals~ Strengths - better analyte retention,
“accurate” metals risk assessment
Picture from USACE-Alan Hewitt
28
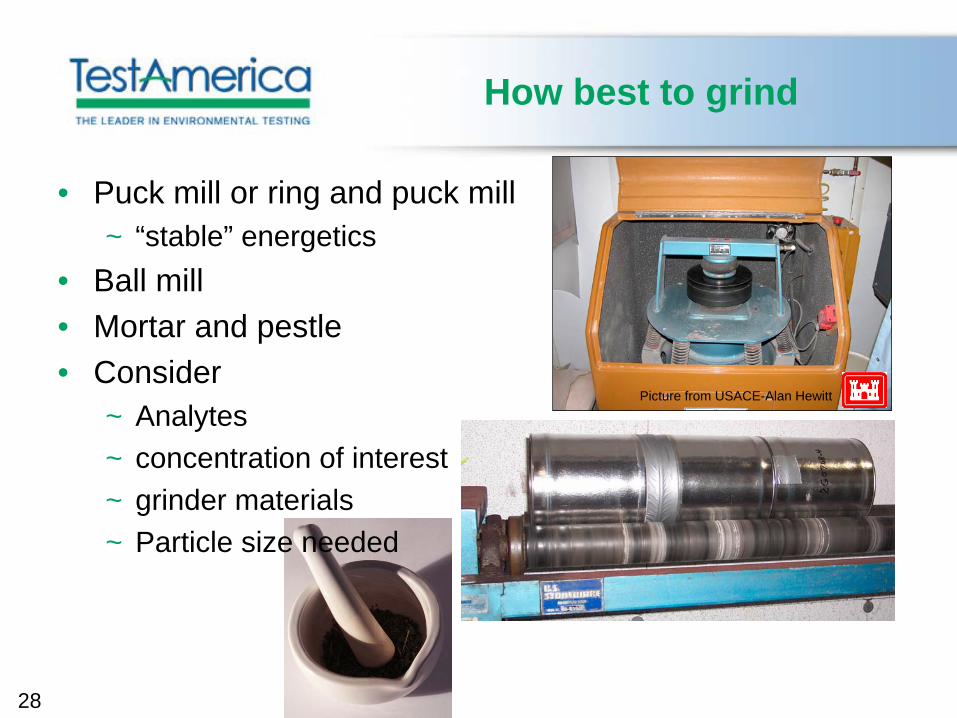
How best to grind
• Puck mill or ring and puck mill~ “stable” energetics
• Ball mill• Mortar and pestle• Consider
~ Analytes~ concentration of interest ~ grinder materials~ Particle size needed
Picture from USACE-Alan Hewitt
29
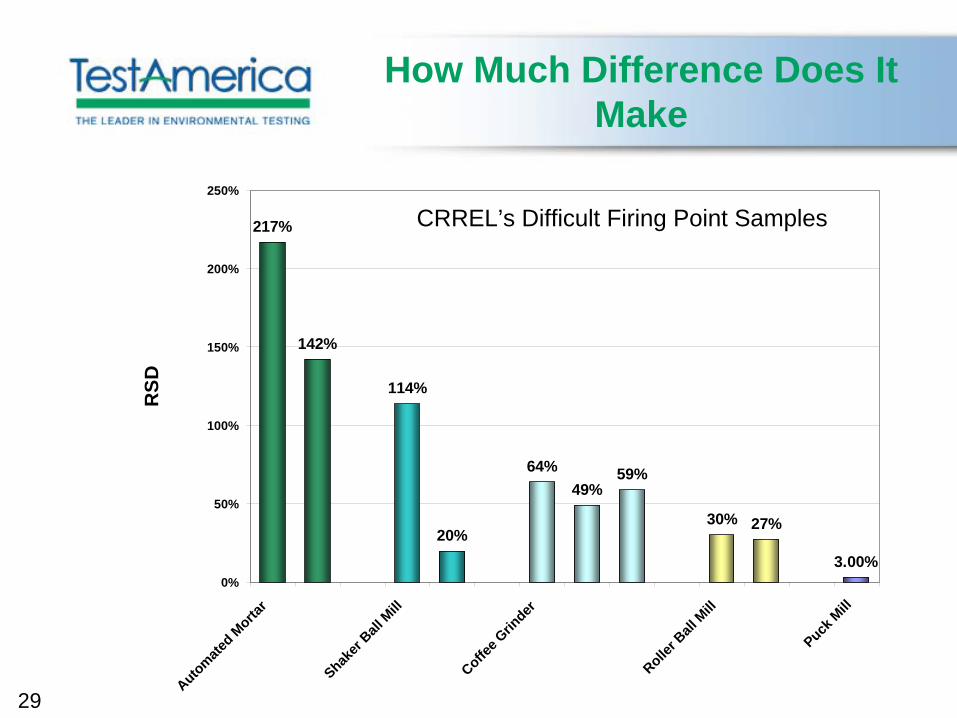
How Much Difference Does It Make
217%
142%
114%
20%
64%49%
59%
30% 27%
3.00%0%
50%
100%
150%
200%
250%
Automated M
ortar
Shaker
Ball M
ill
Coffee G
rinder
Roller B
all M
ill
Puck M
ill
RSD
CRREL’s Difficult Firing Point Samples
30
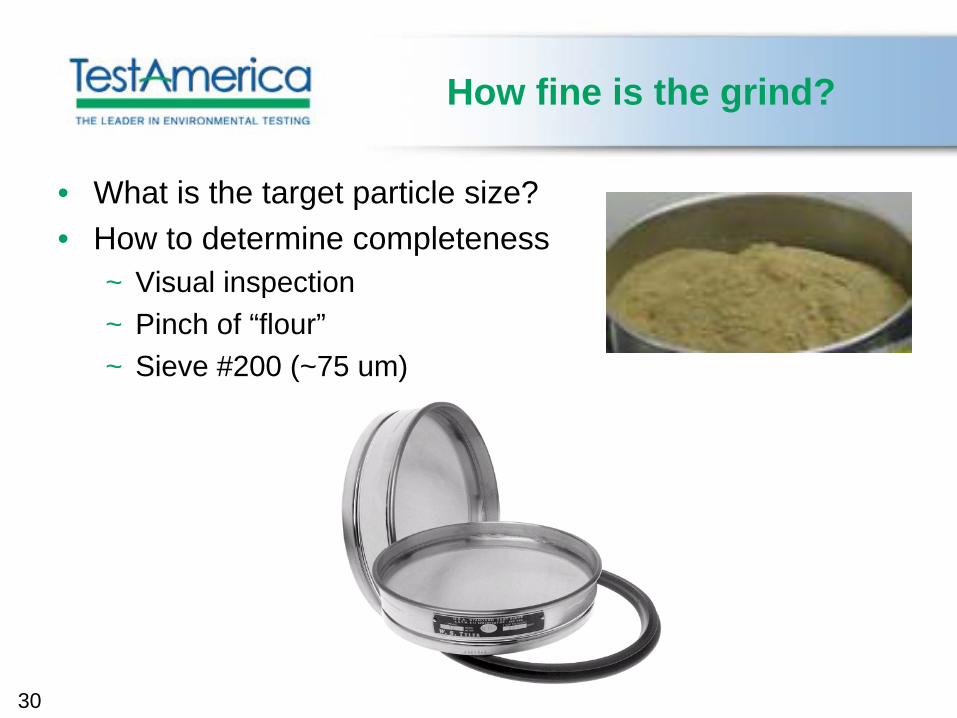
How fine is the grind?
• What is the target particle size?• How to determine completeness
~ Visual inspection~ Pinch of “flour”~ Sieve #200 (~75 um)
31
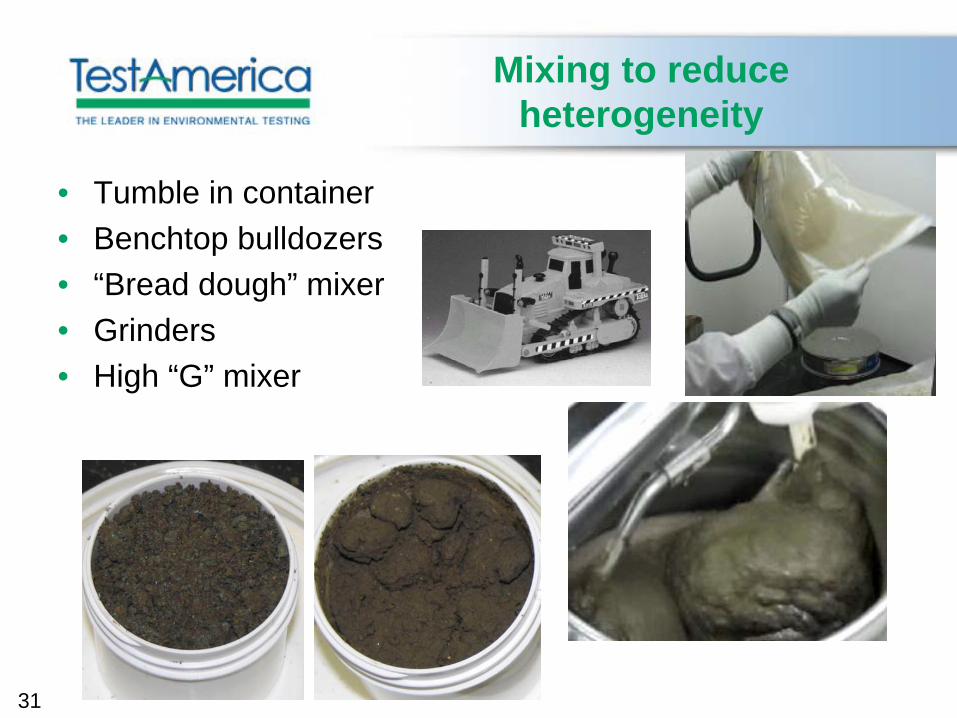
Mixing to reduce heterogeneity
• Tumble in container• Benchtop bulldozers• “Bread dough” mixer• Grinders• High “G” mixer
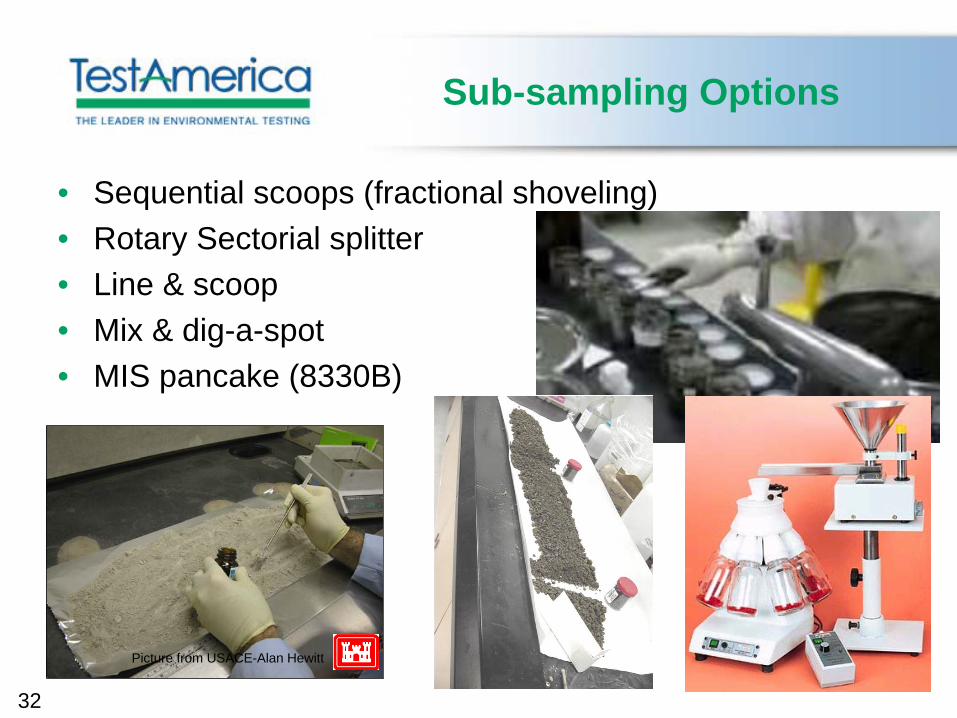
32
Sub-sampling Options
• Sequential scoops (fractional shoveling)• Rotary Sectorial splitter• Line & scoop• Mix & dig-a-spot• MIS pancake (8330B)
Picture from USACE-Alan Hewitt
33
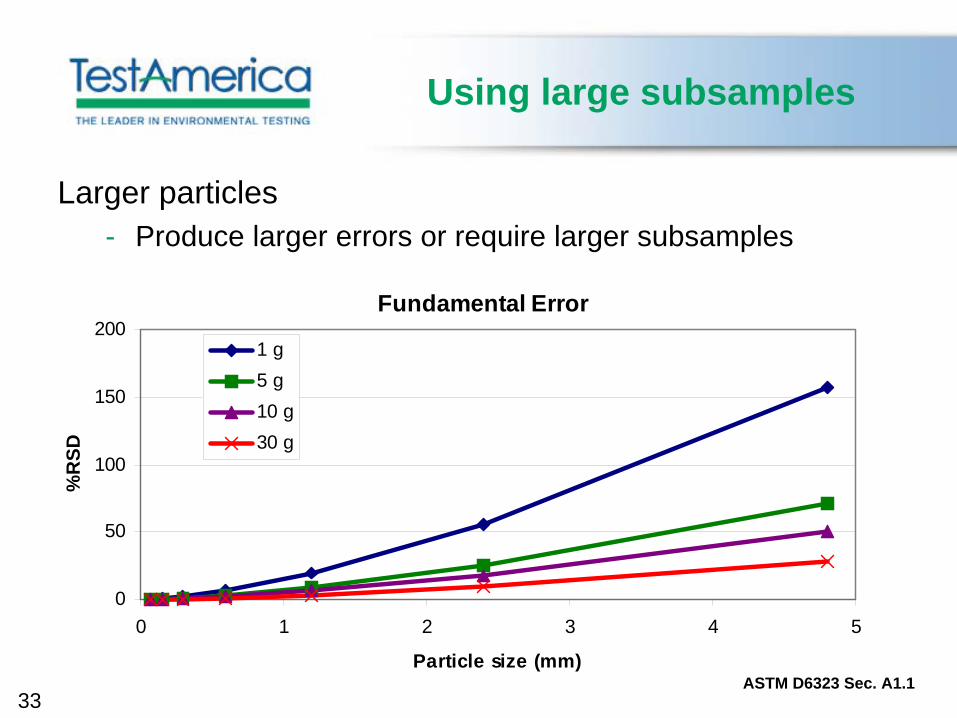
Fundamental Error
0
50
100
150
200
0 1 2 3 4 5
Particle size (mm)
%R
SD
1 g5 g10 g30 g
Using large subsamples
Larger particles- Produce larger errors or require larger subsamples
ASTM D6323 Sec. A1.1
34
How to choose?
• Talk with your laboratory• Specify the performance wanted/needed to make the
decision~ List all Analytes~ Sample mass range~ Particle size to include/exclude~ Analyte accuracy - %R~ Analyte precision - %RSD~ Pebbles, crystalline material
° Grind or not– If yes to what max particle size
35
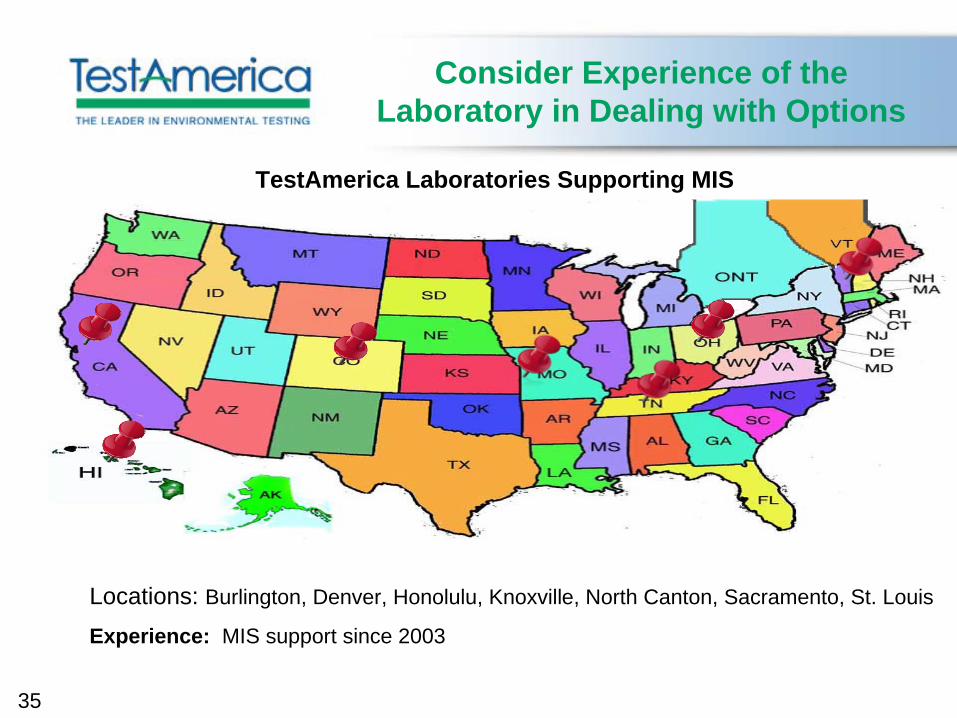
Consider Experience of the Laboratory in Dealing with Options
TestAmerica Laboratories Supporting MIS
Locations: Burlington, Denver, Honolulu, Knoxville, North Canton, Sacramento, St. Louis
Experience: MIS support since 2003
36
More to Follow
• Grinder tests, e.g., Bico ceramic grinder for metals
• Lab MIS tests, manual versus mechanical splitter
• ACIL 8330B Position Paper
• ITRC MIS Workgroup
• Training, discussion, training, discussion….
37
Acknowledgements
• Alan Hewitt, Tom Jenkins
• Brad Chirgwin (Burlington), Mustahsan Farooqui (Portland), Ben Hicks (St. Louis), Karen Kuoppala (Denver), Brian Nagy (Honolulu), Patrick Rainey (W. Sacramento), Chris Rigell (Knoxville)


![Brainf*ck Lexical Analysis - GitHub Pages€¦ · Brainf*ck Lexical Analysis Program: ++[>+[+]]. Program Tokens: INCREMENT INCREMENT LOOP_HEADER MOVE_RIGHT INCREMENT LOOP_HEADER INCREMENT](https://img.pdfslide.us/doc/110x75/5f98faba31b4de6080596e95/brainfck-lexical-analysis-github-pages-brainfck-lexical-analysis-program-.jpg)