Embed Size (px)
Citation preview
Laboratory "Proof of Principle" Investigation for the Acoustically Enhanced Remediation Technology
Authors:
Joe L. Iovenitti James W. Spencer Donald G. Hill
Timothy M. Rynne John F. Spadaro John Dering
Contractor:
Weiss Associates 5500 Shellmound Street, Suite 100 Emergyville, California 94608-24 1 1
Contract Number:
DE-AFU1-94MC30360
Conference Title:
Environmental Technology Development Through Industry Partnership
Conference Location:
Morgantown, West Virginia
Conference Dates:
October 3-5, 1995
Conference Sponsor:
U. S. Department of Energy, OEce of Environmental Management, Morgantown Energy Technology Center
DISCLAIMER
This report was prepared as an account of work sponsored by an agency of the United States Government. Neither the United States Government nor any agency thereof, nor any of their employees, makes any warranty, express or implied, or assumes any legal liability or responsibility for the accuracy, completeness, or usefulness of any information, apparatus, product, or process disclosed, or represents that its use would not infringe privately owned rights. Reference herein to any specific commercial product, process, or service by trade name, trademark, manu- facturer, or otherwise does not necessarily constitute or imply its endorsement, recommendation, or favoring by the United States Government or any agency thereof. The views and opinions of authors expressed herein do not necessarily state or reflect those of the United States Government or any agency thereof.
This report has been reproduced directly from the best available COPY-
Available to DOE and DOE contractors from the Office of Scientific and Technical Information, 175 Oak Ridge Turnpike, Oak Ridge, TN 37831; prices available at (615) 576-8401.
Available to the public from the National Technical Information Service, U.S. Department of Commerce, 5285 Port Royal Road, Springfield, VA 22161; phone orders accepted at (703) 487-4650.

Portions of this document mgy be iIlegible in electronic image products. Images are produced from the best available original dOCIllIlt!IlL
PII.4 Laboratory “Proof of Principle” Investigation for the Acoustically Enhanced Remediation Technology
Joe L. Iovenitti ([email protected]; 510-450-6141) James W. Spencer, Jr. ([email protected]; 510-450-6000)
Donald G. Hill (dgh@ weiss.com; 510-450-6102) Weiss Associates
5500 Shellmound Street, Suite 100 Emergyville, California 94608-241 1
Timothy M. Rynne ([email protected]; 714-373-5509) John F. Spadaro ([email protected]; 714-373-5509)
John Dering ([email protected]; 714-373-5509) Scientific Applications and Research Associates, Inc
15262 Pipeline Lane Huntington Beach, California 92649-1 136
Introduction
Weiss Associates is conducting a three phase program investigating the systematics of using acoustic excitation fields (AEFs) to enhance the in-situ remediation of contaminated soil and ground water under both saturated and unsaturated conditions.
Phase I - Laboratory Scale Parametric Investigation
Phase II - Technology Scaling Study
Phase III - Large Scale Field Tests
Phase I, the subject of this paper, consisted primarily of a laboratory proof of principle investigation. The field deployment and engineering viability of -acoustically enhanced remediation (AER) technology was also examined.
Phase II is a technology scaling study addressing the scale up between laboratory size samples on the order of inches, and the data required for field scale testing, on the order of hundreds of feet.
Phase III will consist of field scale testing at an non-industrialized, non- contaminated site and at a contaminated site to validate the technology.
Research sponsored by the U.S. Department of Energy’s Morgantown Energy Technology Center, under Contract No. DE-AR21-94MC30360 with Weiss Associates, 5500 Shellmound Street, Emeryville, CA 94608-241 1; fax (5 IO) 547-5043; phone (5 10) 450-6000.
Summarized herein are the results of the Phase I “proof-of-principle” investigation, and recommendations for Phase II. A general overview of AER technology along with the plan for the Phase I investigation was presented
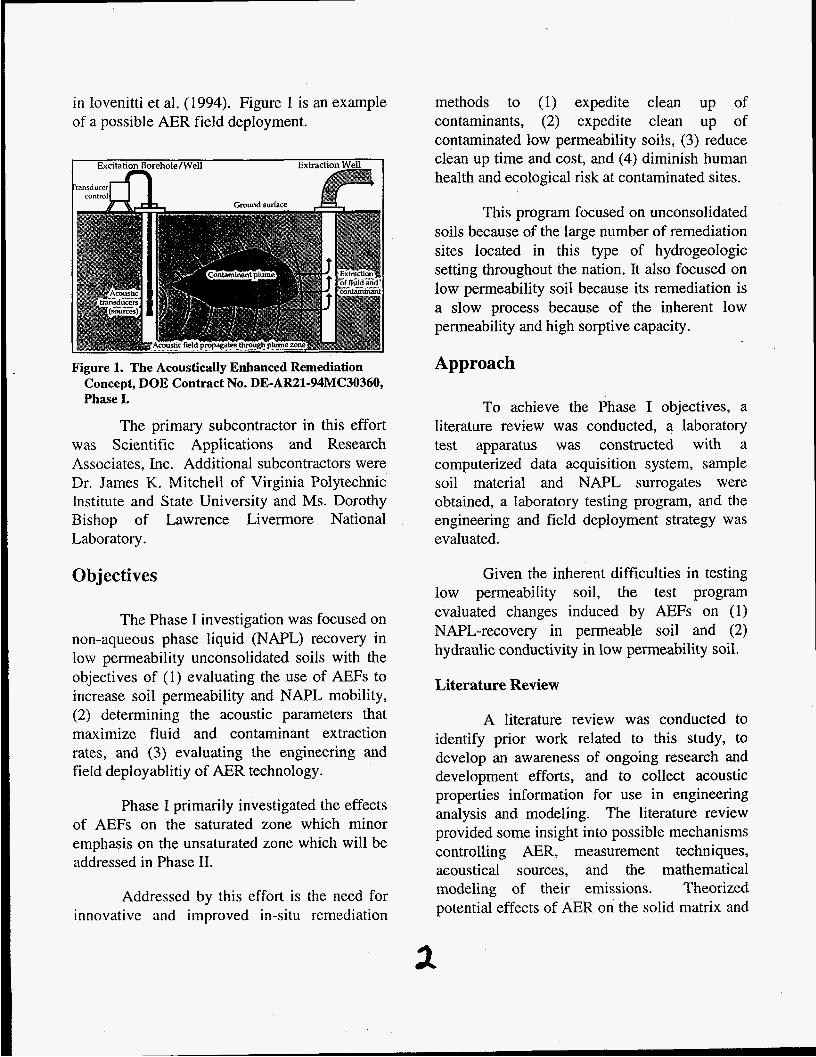
in Iovenitti et al. (1994). Figure 1 is an example of a possible AER field deployment.
Figure 1. The Acoustically Enhanced Remediation Concept, DOE Contract No. DE-AR21-94MC30360, Phase I.
The primary subcontractor in this effort was Scientific Applications and Research Associates, Inc. Additional subcontractors were Dr. James K. Mitchell of Virginia Polytechnic Institute and State University and Ms. Dorothy Bishop of Lawrence Livermore National Laboratory.
0 b j ectives
The Phase investigation was idcused on non-aqueous phase liquid (NAPL) recovery in low permeability unconsolidated soils with the objectives of ( I ) evaluating the use of AEFs to increase soil permeability and NAPL mobility, (2) determining the acoustic parameters that maximize fluid and contaminant extraction rates, and (3) evaluating the engineering and field deployablitiy of AEiR technology.
Phase I primarily investigated the effects of AEFs on the saturated zone which minor emphasis on the unsaturated zone which will be addressed in Phase 11.
Addressed by this effort is the need for innovative and improved in-situ remediation
methods to (1) expedite clean up of contaminants, (2) expedite clean up of contaminated low permeability soils, (3) reduce clean up time and cost, and (4) diminish human health and ecological risk at contaminated sites.
This program focused on unconsolidated soils because of the large number of remediation sites located in this type of hydrogeologic setting throughout the nation. It also focused on low permeability soil because its remediation is a slow process because of the inherent low permeability and high sorptive capacity.
Approach
To achieve the Phase I objectives, a literature review was conducted, a laboratory test apparatus was constructed with a computerized data acquisition system, sample soil material and NAPL surrogates were obtained, a laboratory testing program, and the engineering and field deployment strategy was evaluated.
Given the inherent difficulties in testing low permeability soil, the test program evaluated changes induced by AEFs on (1) NAPL-recovery in permeable soil and (2) hydraulic conductivity in low permeability soil.
Literature Review
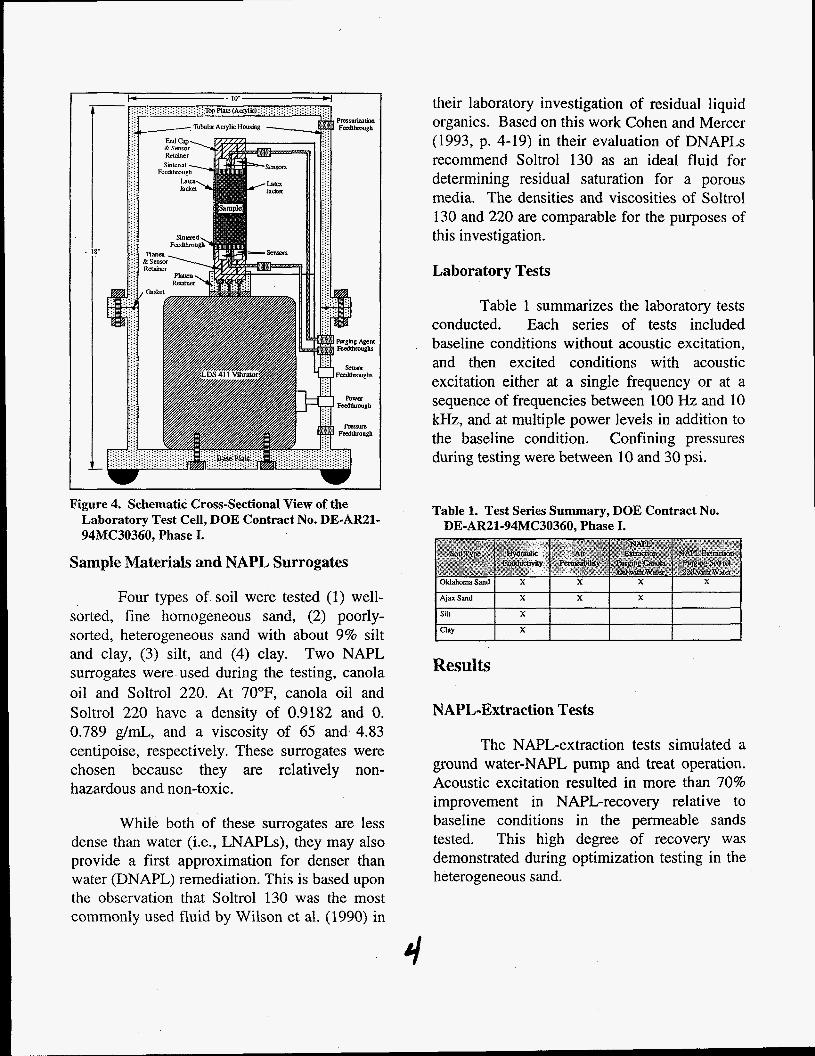
A literature review was conducted to identify prior work related to this study, to develop an awareness of ongoing research and development efforts, and to collect acoustic properties information for use in engineering analysis and modeling. The literature review provided some insight into possible mechanisms controlling AER, measurement techniques, acoustical sources, and the mathematical modeling of their emissions. Theorized potential effects of AER on the solid matrix and
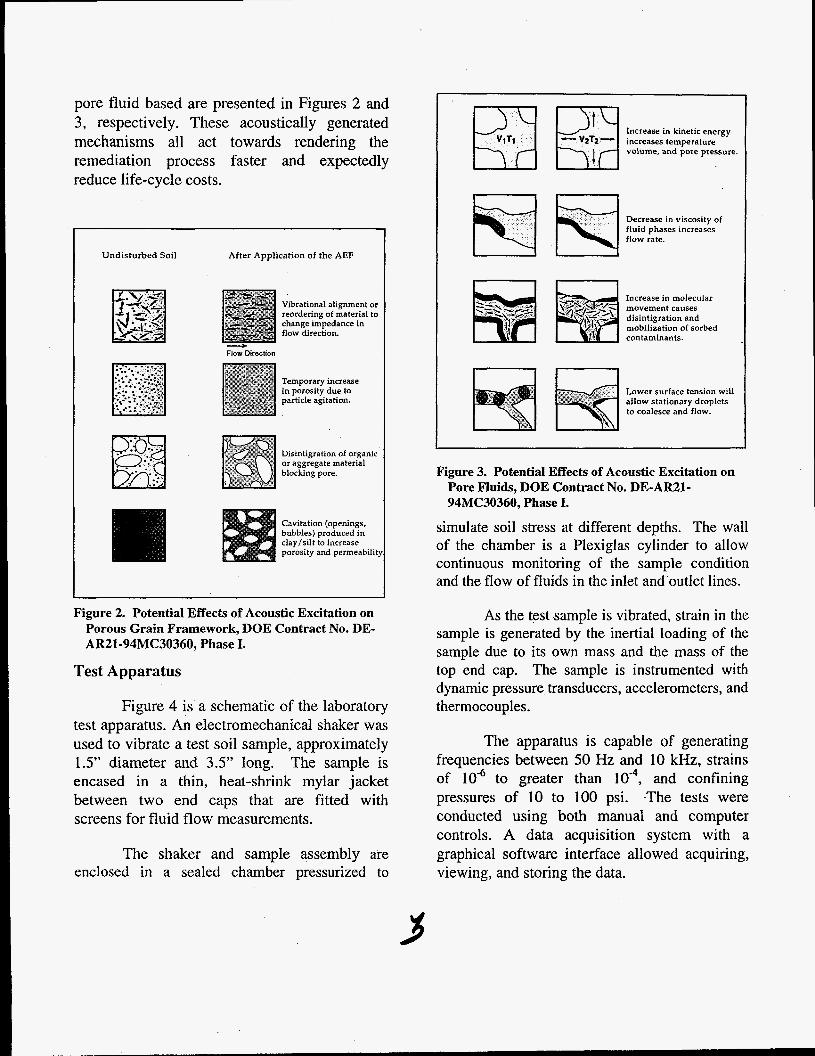
pore fluid based are presented in Figures 2 and 3, respectively. These acoustically generated mechanisms all act towards rendering the remediation process faster and expectedly reduce life-cycle costs.
Undisturbed Soil After Application of the AEF
Vibrational alignment or reordering of material to change impedance in flow direction.
Flow Direction I
Temporary increase in porosity due to particle agitation.
Dieintigration of organic or aggregate material blocking pore.
Cavitation (openings, bubbles) produced in clay/silt to increase porosity and permeability
Figure 2. Potential Effects of Acoustic Excitation on Porous Grain Framework, DOE Contract No. DE- AR21-94MC30360, Phase I.
Test Apparatus
Figure 4 is a schematic of the laboratory test apparatus. An electromechanical shaker was used to vibrate a test soil sample, approximately 1.5” diameter and 3.5” long. The sample is encased in a thin, heat-shrink mylar jacket between two end caps that are fitted with screens for fluid flow measurements.
The shaker and sample assembly are enclosed in a sealed chamber pressurized to
Increase in kinetic energy
volume, and pore pressure. increases temperature
Decrease in viscosity of fluid phases increases flow rate.
Increase in molecular movement causes disintigration and mobilization of sorbed contaminants.
nn Lower surface tension will allow stationary droplets to coalesce and flow.
Figure 3. Potential Effects of Acoustic Excitation on Pore Fluids, DOE Contract No. DE-AR21- 94MC30360, Phase I.
simulate soil stress at different depths. The wall of the chamber is a Plexiglas cylinder to allow continuous monitoring of the sample condition and the flow of fluids in the inlet and-outlet lines.
As the test sample is vibrated, strain in the sample is generated by the inertial loading of the sample due to its own mass and the mass of the top end cap. The sample is instrumented with dynamic pressure transducers, accelerometers, and thermocouples.
The apparatus is capable of generating frequencies between 50 Hz and 10 kHz, strains of 10” to greater than and confining pressures of 10 to 100 psi. .The tests were conducted using both manual and computer controls. A data acquisition system with a graphical software interface allowed acquiring, viewing, and storing the data.
L Figure 4. Schematic Cross-Sectional View of the
Laboratory Test Cell, DOE Contract No. DE-AR21- 94MC30360, Phase I.
Sample Materials and NAPL Surrogates
Four types of soil were tested (1) well- sorted, fine homogeneous sand, (2) poorly- sorted, heterogeneous sand with about 9% silt and clay, (3) silt, and (4) clay. Two NAPL surrogates were used during the testing, canola oil and Soltrol 220. At 70"F, canola oil and Soltrol 220 have a density of 0.9182 and 0. 0.789 g/mL, and a viscosity of 65 and 4.83 centipoise, respectively. These surrogates were chosen because they are relatively non- hazardous and non-toxic.
While both of these surrogates are less dense than water (i.e., LNAPLs), they may also provide a first approximation for denser than water (DNAPL) remediation. This is based upon the observation that Soltrol 130 was the most commonly used fluid by Wilson et al. (1990) in
their laboratory investigation of residual liquid organics. Based on this work Cohen and Mercer (1993, p. 4-19) in their evaluation of DNAPLs recommend Soltrol 130 as an ideal fluid for determining residual saturation for a porous media. The densities and viscosities of Soltrol 130 and 220 are comparable for the purposes of this investigation.
Laboratory Tests
Table 1 summarizes the laboratory tests conducted. Each series of tests included baseline conditions without acoustic excitation, and then excited conditions with acoustic excitation either at a single frequency or at a sequence of frequencies between 100 Hz and 10 kHz, and at multiple power levels in addition to the baseline condition. Confining pressures during testing were between 10 and 30 psi.
Table 1. Test Series Summary, DOE Contract No. DE-AR21-94MC30360, Phase I.
Ajax Sand X X X
Sill X
Qay X
Results
NAPL-Extraction Tests
The NAPL-extraction tests simulated a ground water-NAPL pump and treat operation. Acoustic excitation resulted in more than 70% improvement in NAPL-recovery relative to baseline conditions in the permeable sands tested. This high degree of recovery was demonstrated during optimization testing in the heterogeneous sand.
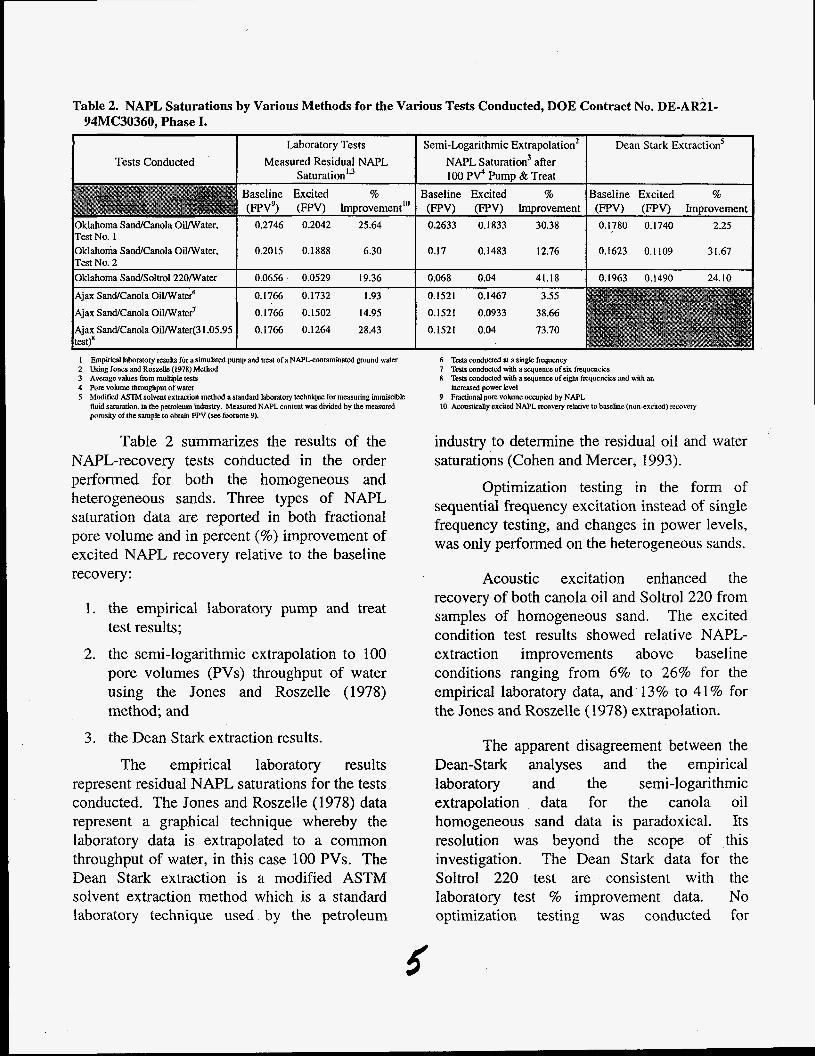
Table 2. NAPL Saturations by Various Methods for the Various Tests Conducted, DOE Contract No. DE-AR21- 94MC30360, Phase I.
Tests Conducted Measured Residual NAPL
Sand/Canola OiWater, 0.2015 0.1888 0.1483 12.76 0.1623 0.1 109
0.1766 0.1502 14.95 0.1521 0.0933 38.66 0.1521 0.04
I Empirical laboratory resub for a sunu!ated pump and Uea~ a la NAPLcontammated ground water 2 Usmg Jones and Roszek (1978) Method 3 Average values from mulupk tests 4 Pore volume throughput of water 5 Modified ASTM solvent e x w m method a standard laboratory technyue for medsunnp unmwibk
tluld satufahon m the petroleum industry Measured NAPL content wds divlded by the measured porosity of the sample to obtm FPV (see footnote Y)
Table 2 summarizes the results of the NAPL-recovery tests conducted in the order performed for both the homogeneous and heterogeneous sands. Three types of NAPL saturation data are reported in both fractional pore volume and in percent (%) improvement of excited NAPL recovery relative to the baseline recovery:
1. the empirical laboratory pump and treat test results;
2. the semi-logarithmic extrapolation to 100 pore volumes (PVs) throughput of water using the Jones and Roszelle (1978) method; and
3. the Dean Stark extraction results.
The empirical laboratory results represent residual NAPL saturations for the tests conducted. The Jones and Roszelle (1978) data represent a graphical technique whereby the laboratory data is extrapolated to a common throughput of water, in this case 100 PVs. The Dean Stark extraction is a modified ASTM solvent extraction method which is a standard laboratory technique used by the petroleum
6 Tests wnducted at a single frequency 7 Tests wnducted with a sequence of six frequencies R Tests conducted with a sequence of eight fnquencies and with an
increaserl power kvel Y Fractional pore vo lme occupied by NAPL 10 Acnusticany excited NAPL recovery relative 111 b a l i n e (nnn+xc&ed) recovery
industry to determine the residual oil and water saturations (Cohen and Mercer, 1993).
Optimization testing in the form of sequential frequency excitation instead of single frequency testing, and changes in power levels, was only performed on the heterogeneous sands.
Acoustic excitation enhanced the recovery of both canola oil and Soltrol220 from samples of homogeneous sand. The excited condition test results showed relative NAPL- extraction improvements above baseline conditions ranging from 6% to 26% for the empirical laboratory data, and 13% to 41% for the Jones and Roszelle (1978) extrapolation.
The apparent disagreement between the Dean-Stark analyses and the empirical laboratory and the semi-logarithmic extrapolation data for the canola oil homogeneous sand data is paradoxical. Its resolution was beyond the scope of this investigation. The Dean Stark data for the Soltrol 220 test are consistent with the laboratory test % improvement data. No optimization testing was conducted for
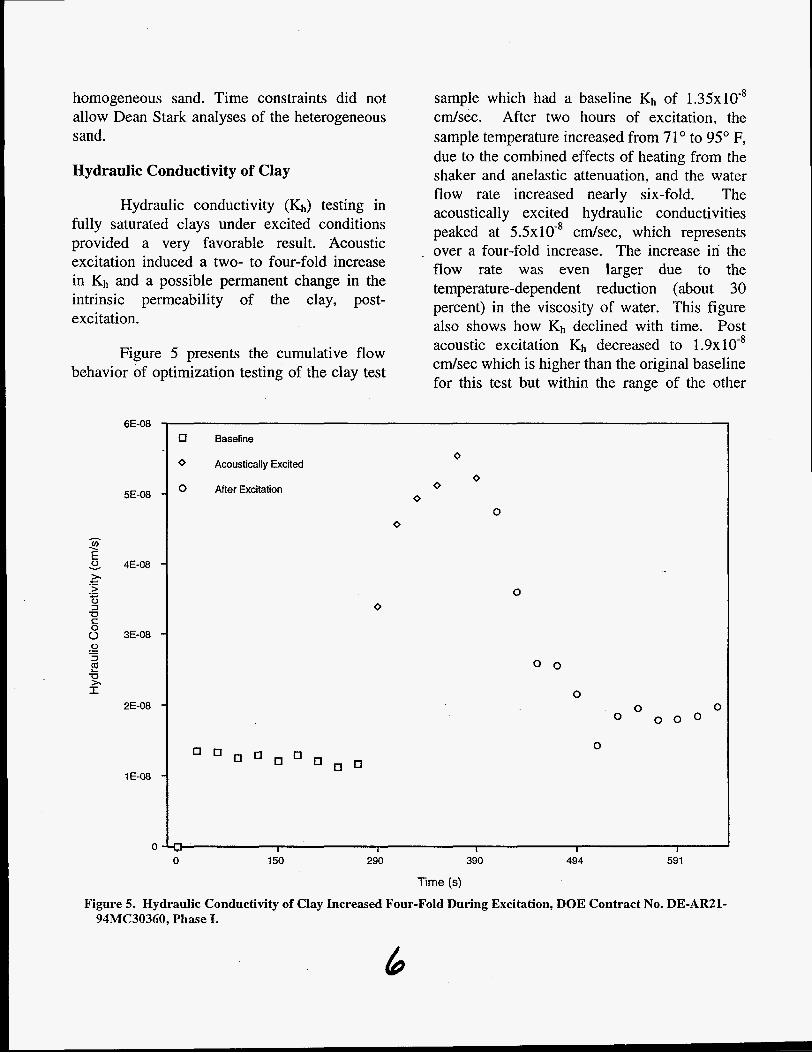
homogeneous sand. Time constraints did not sample which had a baseline Kh of 1.35x10-' allow Dean Stark analyses of the heterogeneous cdsec. After two hours of excitation, the sand. sample temperature increased from 71" to 95" F,
due to the combined effects of heating from the Hydraulic Conductivity of Clay shaker and anelastic attenuation, and the water
Hydraulic conductivity (Kh) testing in fully saturated clays under excited conditions provided a very favorable result. Acoustic excitation induced a two- to four-fold increase in Kh and a possible permanent change in the intrinsic permeability of the clay, post- excitation.
Figure 5 presents the cumulative flow behavior of optimization testing of the clay test
6E-08
5E-08
h
2 5 4E-08 >. > 0 3 U S 0
0 3
U 1. I
CI .- .- CI
0 3E-08 .- - 9
2E-08
1 E-08
0
flow rate increased nearly six-fold. The acoustically excited hydraulic conductivities peaked at 5 . 5 ~ 10" cdsec, which represents
. over a four-fold increase. The increase in the flow rate was even larger due to the temperature-dependent reduction (about 30 percent) in the viscosity of water. This figure also shows how Kh declined with time. Post acoustic excitation Kh decreased to 1 . 9 ~ 10'' cdsec which is higher than the original baseline for this test but within the range of the other
0 Baseline
0 Acoustically Excited
0 After Excitation
0
0
0
0 0
0 0
0
0 0
0
0
0 0 0 0 0 0
- LI I 1 I I I 0 150 290 390 494 59 1
Time (s)
Figure 5. Hydraulic Conductivity of Clay Increased Four-Fold During Excitation, DOE Contract No. DE-AR21- 94MC30360, Phase I.
baseline analyses. These data are suggestive, although not conclusive that the post-excitation intrinsic permeability of the clay was increased. Additional testing is required to investigate this effect.
Hydraulic Conductivity of Heterogeneous Sand
Acoustic excitation of fully saturated heterogeneous sand, produced large amounts of muddy water, and the hydraulic conductivity decreased apparently due to the plugging of pores by the mobilized fine-grained particles. During baseline testing, only clear effluent was produced. The mobilization of fines under acoustic excitation is consistent with the finding of Reddi et al. (1993, 1994) except that their work was done under atmospheric conditions. The mobilization of fines would be advantageous for remediation since contaminants tend to be sorbed on the fine- grained sediments. Additional testing will be required to optimize the production of fines while minimizing the tendency to plug pores (see discussion below).
Hydraulic Conductivity of Silt
The hydraulic conductivity testing of one silt sample provided promising results. The prepared sample had a baseline Kh of 9 .95~10-~ cdsec and a porosity near 43.5%.
During the baseline measurements, the effluent water was essentially clear. With excitation, milky water was produced, indicating that silt size particles were being mobilized and the Kh of the test sample decreased to 6 . 4 ~ 1 0 - ~ cdsec, or about 34% of the pre-excited value. This result is similar to the hydraulic conductivity testing in the heterogeneous sand. With continued excitation of the silt under high power and at a sequence of frequencies, a conductivity increase of about 10% was
suggested. It was beyond the scope of this investigation to pursue this promising trend but, these initial data suggests that fines can be mobilized while minimizing the hydraulic conductivity reduction.
Hydraulic Conductivity of Homogeneous Sand
Acoustic excitation of saturated homogeneous sand showed no discernible positive effects relative to baseline conditions. The overall Kh of the sand did decline suggesting some incremental consolidation of the material. This result stands in contrast to those reported by Reddi et al. (1993, 1994) who indicate Kh increases of several orders of magnitude with excitation. However, these authors also reported possible bypass betwwen their test cell wall and ultrasonic horn during their excited measurements.
Laboratory Strain Amplitudes
The ' laboratory tests described above show that acoustic excitation can (1) increase the NAPL-recovery from permeable soil, and (2) increase the Kh of low permeability soil. An obvious question is whether the acoustical levels required to develop these beneficial effects can be generated in-situ with available acoustic source technologies. To address this issue, estimates of the strain amplitudes developed in the laboratory tests were compared with strain amplitudes that can be generated with available source technologies.
Optimization Testing
Primarily two approaches were pursued for optimization testing ( 1) increasing acoustic power to the sample, and (2) subjecting the sample to a sequence of frequencies. Extremely encouraging results were obtained during clay
7
(Figure 5 ) and heterogeneous sand (Table 2) testing.
Field Deployment Strategy
The Phase I laboratory test results show that the beneficial effects of acoustic excitation are observed when the strain amplitudes are between approximately and These strain amplitudes are within the range that can be developed in-situ with existing source technology, especially if the sources are deployed using a phased array.
The complex geohydrological setting of contaminant plumes makes acoustical excitation of large volumes desirable. Also, given the high cost of installing wells, it is preferable to use a distributed array of acoustic sources. With a distributed array of sources, and:
1. by controlling the phase of the sources, high-power acoustical energy can be directed to various parts of the plume; and
2. by modifying the phase of the sources, high intensity acoustic energy can be focused and swept throughout the contaminant volume.
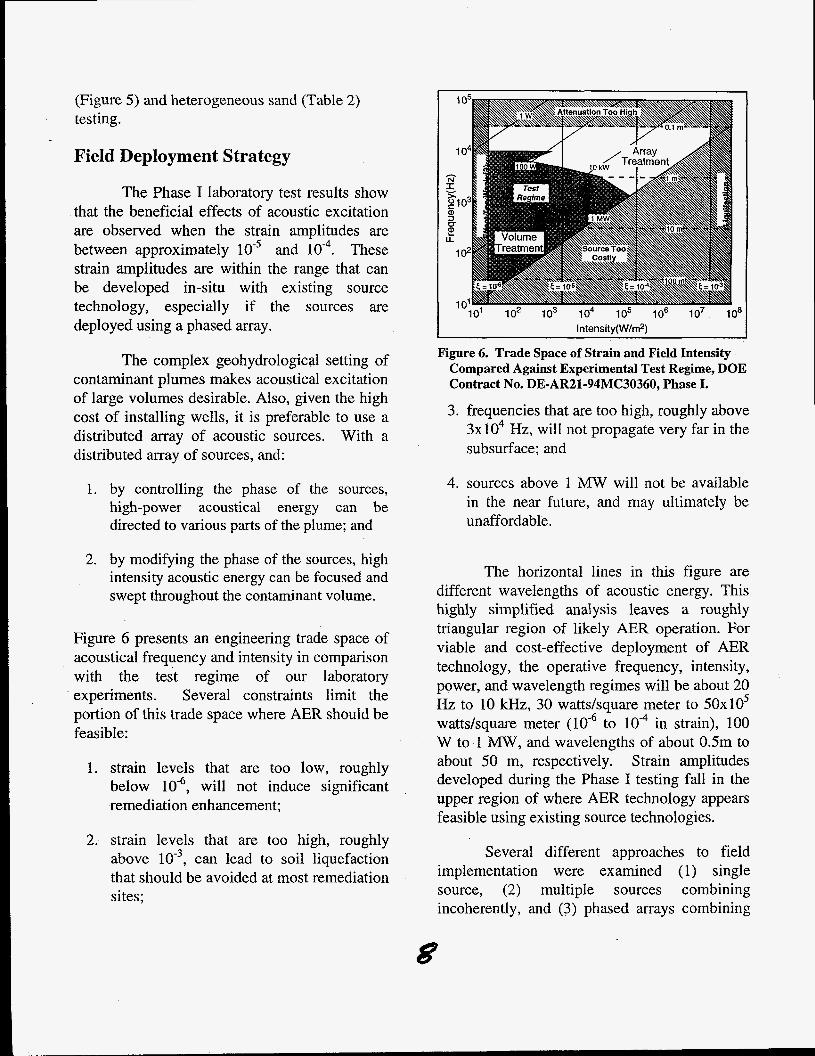
Figure 6 presents an engineering trade space of acoustical frequency and intensity in comparison with the test regime of our laboratory experiments. Several constraints limit the portion of this trade space where AER should be feasible:
1. strain levels that are too low, roughly below will not induce significant remediation enhancement;
2. strain levels that are too high, roughly above can lead to soil liquefaction that should be avoided at most remediation sites;
-10' i o2 io3 io4 io5 io6 io7 io8 Intensity(Wtm2)
Figure 6. Trade Space of Strain and Field Intensity Compared Against Experimental Test Regime, DOE Contract No. DE-AR21-94MC30360, Phase I.
3. frequencies that are too high, roughly above 3x10⁴ Hz, will not propagate very far in the subsurface; and
4. sources above 1 M W will not be available in the near future, and may ultimately be unaffordable.
The horizontal lines in this figure are different wavelengths of acoustic energy. This highly simplified analysis leaves a roughly triangular region of likely AER operation. For viable and cost-effective deployment of AER technology, the operative frequency, intensity, power, and wavelength regimes will be about 20 Hz to 10 kHz, 30 wattshquare meter to 5Ox1O5 watts/square meter to lo4 in strain), 100 W to 1 MW, and wavelengths of about 0.5m to about 50 m, respectively. Strain amplitudes developed during the Phase I testing fall in the upper region of where AER technology appears feasible using existing source technologies.
Several different approaches to field implementation were examined (1) single source, (2) multiple sources combining incoherently, and (3) phased arrays combining
coherently. The Phase I analysis considered only acoustical sources operating at the ground. surface, but there will be analogous results for subsurface sources.
With a single source, the intensity at any given point in the remediation domain is proportional to the power of the device. A single source is considered viable for field deployment for only volumetrically small remediation sites.
With multiple sources combining incoherently (analogous to the summation of light intensities from a set of light bulbs) the intensity at the center of the remediation domain is considered to be insufficient for AER deployment. In such a configuration, the intensity will scale linearly with the number of acoustical sources, and as the inverse square of the spatial dimension of the array. While multiple sources can cover larger remediation volumes than a single source, it is expected to be very expensive to generate the required acoustical intensities.
With phased arrays, that is multiple source arrays with identical frequencies and phases, constructive interference can be generated at a given region within the remediation domain potentially creating very high acoustical intensities. Phased arrays provide a high degree of flexibility in producing high intensity AEFs because the maximum local intensity is proportional to the power of the individual sources and the square of the number of sources, and inversely proportional to the spatial dimension of the array. Thus, it is more cost-effective, to divide the remediation domain into a larger number of relatively low power sources, rather than using a small number of high power sources.
Applications
The Phase I investigation has shown that AER technology can (1) significantly enhance the remediation of NAPLs in unconsolidated soils and ground water based on laboratory bench scale testing, and (2) be successfully deployed in the field. Phase I demonstrated that NAPL recovery enhancements with acoustic excitation relative to traditional pump and treat in excess of 70% for permeable homogeneous and heterogeneous sands, and markedly increased water flux through low permeability silt and clay. Based on the Phase I results, similar enhancements for removal of NAPL trapped in silt and clay are expected. Thus, the Phase I findings indicate that AER technology is applicable to unconsolidated soil remediation sites throughout the country.
It should be noted that the Phase I testing was conducted under drained conditions such that no significant buildup in pore pressure could be developed in the soil test samples beyond what was controlled by the test soil’s hydraulic conductivity. In the field, undrained coniditions will exist, consequently, there will be a much greater tendency to build-up pore pressure in the soil favoring the beneficial effects reported for AER technology.
AER technology appears to be contaminant insensitive in that it can be used to affect the permeability of low permeability sediments, and/or the mobility of contaminants. As such, it can be used to remediate fuel hydrocarbons, chlorinated hydrocarbons, radionuclides, or heavy metals.
AER technology is also considered a “piggy-back” methodology. It can be superimposed on both traditional remediation technologies (e.g., ground water pump and treat and its vadose zone equivalent, soil vapor
9
extraction), and most advanced remediation technologies (e.g., steam flooding, soil heating, surfactant flushing).
A significant reduction in unconsolidated soil cleanup time and cost is expected with the use of AER technology because (1) increasing the water flux through low permeability soils, the contaminant flux out of these soils is also increased, and (2) the faster the NAPL source term is removed, the faster a contaminated site can be remediated and returned to other uses.
Future Activities
Morgantown Energy Technology Center has accepted the acoustically enhanced remediation project Phase II recommendation. Phase II will focus on identifying the characteristics of a field deployable AER technology system based on (1) two- dimensional tank-scale testing of the phased array approach for vadose zone and ground water conditions contaminated with a chlorinated hydrocarbon DNAPL, and (2) two- and three-dimensional modeling of the fluid flow and contaminant transport behavior under baseline and excited conditions, and of the acoustical responses generated in the soil and ground water. Phase II will also address the sorbed and dissolved phases, and a field site for Phase ID testing will be identified. Phase II is excepted to be 10 months in duration.
Acknowledgments
We are thankful for the significant assistance and guidance provided by our former COR, Mr. R. McQuisten of the Laramie Project Office who recently retired, our current COR, Mr. Karl-Heinz Frohne at METC, our Contracting Specialist, Ms. R. Diane Manilla, also at METC, and Dr. Alan Browne of
Energetics, the support contractor at METC for the Research Opportunity Announcement (ROA) program. We also thank METC and DOE for making the ROA program possible. The Phase I period of performance was from July 1994 to October 1995.
References Cited
Cohen, R. M. and J. W. Mercer, 1993. DNAPL Site Evaluation, C. K. Smoley, Boca Raton, Florida.
Iovenitti, J. L., T. M. Rynne, J. W. Spencer, Jr., 1994, Acoustically Enhanced Remediation of Contaminated Soils and Ground water, proceedings of Opportunity’95 - Environmental Technology Through Smll Business Conference, Morgantown Energy Technology Center, p. 87- 99.
Jones, S . C. and W. 0. Roszelle, 1978. Graphical Techniques for Determining Relative Permeability from Displacement Experiments, Journal of Petroleum Technology, vol. 15, pp.
Feasibility of Ultrasonic Enhancement of Flow in Clayey Sands, Journal of Environmental Engineering, vol. 1 19, pp. 746-752.
Reddi, L., A. Hadim, R. N. Prabhushankar and F. Shah, 1994. Vibratory Extraction of Clay Fines From Subsurface, Journal of Environmental Engineering, vol. 120, pp. 1544- 1558.
Wilson, J. L., S. H. Conrad, W. R. Mason, W. Peplinski and E. Hagen, 1990. Laboratory Investigation of Residual Liquid Organics, U.S. Environmental Protection Agency,
807-817. Reddi, L., S . Berliner and K. Y. Lee, 1993.
EPA/600/6-90/004.