Embed Size (px)
Citation preview

tters 260 (2007) 407–418www.elsevier.com/locate/epsl
Earth and Planetary Science Le
Laboratory measurement of hydrodynamic saline dispersion within amicro-fracture network induced in granite
Nicholas W.A. Odling a,⁎, Stephen C. Elphick a, Philip Meredith b,Ian Main a, Bryne T. Ngwenya a
a School of Geosciences, University of Edinburgh, Grant. Inst. Geology, West Mains Rd., Edinburgh EH9 3JW, UKb Department of Earth Sciences, University College London, Gower St., London, WC1E 6BT, UK
Received 10 August 2006; received in revised form 11 May 2007; accepted 19 May 2007
Available onEditor: S. Spohn
line 26 May 2007
Abstract
We report the first measurements of hydrodynamic dispersion in a microfractured granite using a combination of noveltechniques. A fracture network was induced in a cylindrical plug of Ailsa Craig micro-granite by thermal stressing, to produce anisotropic network of fractures with an average aperture of ∼0.3 μm, a density of approximately 4×10⁴ fractures/mm3 and apermeability of 5.5×10⁻¹⁷ m2. After saturating the cores with 0.01 M NaCl solution a step in the concentration profile to 1 M wasadvected into the plug at flow rates of 0.07 to 2.13 cm3 h−1. The longitudinal electrical impedance of the plug was measuredcontinuously as the solute front advected through its length until the plug was saturated with the concentrated electrolyte. Analysisof the impedance versus time relationships allows the derivation of the longitudinal dispersion coefficient, DL, and hydrodynamicretardation, RH. The Peclet number–dispersion relationship for the micro-fracture network is very similar to that predicted forother, radically different, fracture networks. Thus dispersion may be more dependent on fracture connectivity and length thanfracture density and display a relationship similar to that shown by particle beds and clastic sandstones. The high retardation valuesobserved (2.2–4.9) reflect flow behaviour within a fracture network with a proportion of ‘blind’ sections, and demonstrates howsuch networks can slow the advance of conservative solute components.© 2007 Elsevier B.V. All rights reserved.
Keywords: saline flow; fracture network; impedance; experimental dispersion
⁎ Corresponding author. Tel.: +44 131 6508534; fax: +44 131 6683184.
E-mail addresses: [email protected] (N.W.A. Odling),[email protected] (S.C. Elphick), [email protected](P. Meredith), [email protected] (I. Main),[email protected] (B.T. Ngwenya).
0012-821X/$ - see front matter © 2007 Elsevier B.V. All rights reserved.doi:10.1016/j.epsl.2007.05.034
1. Introduction
The movement and dispersion of contaminants ingroundwater systems has been the focus of intensiveinvestigation for more than 30 years (see. Dagan andNeuman, 1997; Zimmermann and Main, 2004 for re-views). In an effort to maximise exploitation andpreservation of groundwater resources much of this efforthas concentrated on the description, quantification and
408 N.W.A. Odling et al. / Earth and Planetary Science Letters 260 (2007) 407–418
modelling of contaminant transport in shallow aquifersconsisting mainly of highly porous sediments. However,with recent proposals to site radioactive and toxic wasterepositories in crystalline rock formations (e.g. Bullen andMcCormick, 1998), there has been increasing interest ininvestigating the hydraulic properties of rocks wherepermeability is controlled by fracture networks rather thanflow within a porous matrix. To date, research into theseareas has concentrated on numerical modelling withrelatively few laboratory scale investigations on fracturenetworks in impermeable matrices. Grisak et al. (1980)measured ion breakthrough curves in large samples offractured glacial till containing two orthogonal fracturesets. They found non-Fickian dispersion and attributedthis to exchange and adsorption of ions within the porousmatrix of the till. Permeability related to pervasivedamage induced by thermal stressing has been used in aseries of experiments by Darot and co-workers e.g. Darotet al. (1992).
Most laboratory studies have concentrated on flow ina single fracture. For example, Durham and Bonner(1994) have investigated flow in a single fracture underload, and Neretnieks et al. (1982) examined tracermovement in a single natural fissure in a granitic sampleand found non-Fickian dispersion in non-sorbing tracers,ascribed to preferential channelling within the fractureplane.Moreno et al. (1985) also examined dispersion in asingle fracture in granite in an experiment very similar toNeretnieks et al. (1982) and concluded that non-sorbingtracers can be modelled well by both hydrodynamic andchannelling diffusive mechanisms. Despite these effortsto develop realistic theoretical models for flow infracture networks, predictive capabilities remain severe-ly limited as noted by Berkowitz and Scher (1997) andfor full review, Berkowitz (2002). There is, therefore, agreat need for laboratory scale studies both to establishthe hydraulic characteristics of fracture networks, andto provide data sets with which to test the efficacy oftheoretical models.
There are three main reasons why there is a paucity oflaboratory tests dealing with fracture networks.
First, samples of competent crystalline rock thatcontain homogeneously distributed fracture networksat laboratory sample scale are rare. Where naturallyfractured crystalline rocks do occur, the scale of thefracture systems is such that unmanageably large sam-ples are required to achieve a statistically homogeneousdomain. In addition, it is unlikely that the process ofsample collection, such as coring, will leave the fracturenetwork unmodified either by relaxation of the networkor blockage of fractures by debris from the collectionprocedure.
Second, the measurement of dispersion profilesrequires well-characterised experimental boundary con-ditions, which include true linear plug flow within thesample volume, and a well-defined initial condition,such as an instantaneous initial step change in fluidcomposition across the entire up-stream face of thesample. It is easy to demonstrate that the standardmethod of introducing fluid into a sample and collectingthe advected pore fluid via central axial ports, with orwithout feeder channels on platen faces, will not resultin radially symmetric plug flow along the sample axis.For this generally used experimental configuration, pathlength differences and slight pressure variations ensurethat axial flow directly from central platen inlet to outletdominates over flow down the periphery of the sampleplug, producing dispersion effects unrelated to, andpotentially masking, dispersion arising from within thesample fracture network.
Third, for a fractured sample to remain internallycohesive and competent, the volume percentage ofthe crack network must be low (e.g. b5%). This impliesthat, at the scale of typical laboratory test samples(∼100 cm3) the volume of fluid expressing the dis-persion profiles is very small. Dispersion effects beingsought from within the sample are potentially maskedby mixing and dispersion at the sample ends and withinthe fluid lines conveying the fluid to the point ofanalysis. Such effects can significantly degrade the truedispersion profile, and result in the final measuredprofile being a complex composite of dispersion fromthe sample and dispersion due to advection within thefluid lines.
Here, we report a novel series of techniques thatcircumvent the three problems outlined above. Byapplying impedance spectrometric measurement tech-niques to fluid flow within a specifically micro-fracturedcylindrical sample of granite, we have determinedchemical dispersion in the fracture network, andcompared the results with theoretical models for realand model fracture networks.
2. Methodology
2.1. Test material and sample preparation
The material used in this study to form the matrix forthe fracture network is Ailsa Craig microgranite (ACM)from the island of Ailsa Craig in the Firth of Clyde,Scotland. ACM has a porphyritic texture, with a fine-grained groundmass (mean grain size of 0.25 mm) andsparsely distributed microphenocrysts of alkali feldsparup to 1.5 mm. This material has been examined in detail

Fig. 1. a. A scanning electron micrograph of heat treated Ailsa Craig microgranite showing the fracture network (scale bar at bottom of photograph).The equivalent net of fractures used in the calculation of excluded volume, Vex.
Fig. 2. Schematic Hassler cell design modified to allow step changes inpore fluid and impedance measurements.
409N.W.A. Odling et al. / Earth and Planetary Science Letters 260 (2007) 407–418
by Clint et al. (2001), who have shown it to have, in itsnatural state, no pre-existing microcracks observable byoptical or scanning electron microscopy, either within orbetween grains. It has a primary porosity of 0.9%,mostly within the altered but unconnected feldsparmicrophenocrysts. The rock has virtually no secondaryfracture porosity and as a consequence has an ex-ceptionally low permeability (1.5×10⁻²³ m2), and avery low degree of P and S wave velocity anisotropy(less than the measurement accuracy of 1%).
A microfracture network was induced in samples ofACM by thermal stressing, using techniques developedby Clint et al. (2001). Cores of ACM, 38.4 mm indiameter and 90 mm long, were heated in a tube furnaceat 1 °C/min to 900 °C, whereupon the temperature washeld for approximately 1 h, after which it was decreasedat 1 °C/min to room temperature.
A scanning electron micrograph of a fracture surfaceof heat treated sample is shown in Fig. 1a. Analysis of aseries of such images shows that the average aperture ofthe induced fracture network is 0.3 μm. The fracturepattern is characteristic of fracture sets formed by tensilefailure. It is characterised by successive halving ofvolumes with each tension fracture nucleating approx-imately halfway along a previous fracture. This mech-anism gives fractures with a majority of intersections of‘T’ geometry (Fig. 1b). Clint et al. (2001) have shownthat although the P and S wave velocities in this type ofthermally stressed ACM decrease by an approximatefactor of two, there is no resultant anisotropy in eithervelocity, implying there is no preferred orientation in theinduced fracture network. This is confirmed by obser-vation of the thermal fracture patterns (Fig. 1a). Weassume, therefore, in the theoretical treatment to follow,that the fracture network is homogeneous and isotropic.
2.2. Experimental protocol
2.2.1. Pressure vesselFor the current experiments a 38.4 mm diameter by
90 mm long cylindrical core of heat-treated Ailsa Craigmicrogranite was placed in a specially modified Hasslercell, shown diagrammatically in Fig. 2, and cyclicallyflushed at different flow rates as detailed below. TheHassler cell consists of a confinement vessel with acentral tubular rubber jacket encasing the samplebetween the ends of a pair of load pistons. End load isapplied to the sample via the load pistons by an externalhydraulic ram within a straining frame, while a simul-taneous radial confining pressure is applied by hydrauliccompression of the central rubber tube within thepressure vessel. The experiments were carried out with

Fig. 3. a. Cutaway diagram of lower piston showing flow pathwayfacilitating rapid changes in fluid composition. Arrow shows the pathof flushing fluid from axial port across face of piston to peripheraldrain. b. Schematic section of upper piston showing the position ofgauze frit fluid exit channel and insulating sleeve allowing the piston toact as a sensing electrode.
410 N.W.A. Odling et al. / Earth and Planetary Science Letters 260 (2007) 407–418
the sample under a modest hydrostatic load of 2.5 MPa,sufficient to provide a seal between sample andconfining jacket whilst not significantly collapsing theinduced fracture network.
2.2.2. Inflow piston designThe inflow (lower) piston design, shown in Fig. 3a,
incorporated three elements to facilitate true plug flowthrough the sample, and enable an ‘instantaneous’ stepchange in inlet fluid composition to provide robustboundary conditions for the experiments. The pistonbody was machined with two fluid ports, a central axial
fluid access port and a second, peripheral drain conduit.Fluid movement between these ports was controlled byan overlying shallow distribution plate that allows thefluid to flow from the central port, across the face of thesample, and exit, via a peripheral circular channel, downthe off-axis drain port in the piston body. To allow thefluid to sweep efficiently across the front of the core thedistribution plate is separated from the core sample by athin layer of stainless steel woven mesh. As this layer ishighly permeable (porosity ∼50%) but of very lowvolume, a relatively small flow will rapidly sweep thefront face of the core. The high porosity of the mesh alsofacilitates access of the fluid to all of the core face,promoting plug flow within the fracture network. Beingthe same composition as the contiguous piston, thegauze is electrically its continuation, and piston andgauze can be considered a single functional unit. Thisstainless steel woven mesh layer can only be used at lowsample end loads.
2.2.3. Outflow piston designThe modified outflow (upper) piston is shown in
Fig. 3b. The piston has a single, axial fluid exit port, andis separated from the core sample by a layer of finestainless steel woven mesh to allow free exit of pore fluidfrom the core end. This minimises any tendency for flowfocusing in the core adjacent to the exit port in the upperpiston. To allow electrical measurements of the salinesaturated ACM cores, the upper piston was insulatedfrom the body of the steel pressure cell body by a plasticsleeve, and from the load frame by a plastic disc in theload stack. Thus impedance measurement between theinflow and outflow piston units measured solely theelectrical response of the fluid-saturated test core.
2.2.4. Pore fluid deliveryThe accurate measurement of dispersion profiles in
porous media requires that variations in the fluid flowrate be kept as low as possible. This constraint becomesincreasingly important as pore volume decreases. Tominimise variations in the flow rate, fluid was suppliedto the rig by an ISCO LC5000 syringe pump, actuatedby a stepper motor giving a flow variation of ≪±1%.
2.3. Impedance spectroscopy measurements
Impedance spectroscopy is a powerful method ofexamining the distribution of electrically conductivemedia within a rock sample. Particularly, it providesinformation on connectivity and tortuosity, as demon-strated, for example, in the study by Garrouch et al.(2001) on tortuosity in porous media.

Fig. 4. Impedance, |Z| plotted as a planar vector of real (Z′) andimaginary (Z″) components as a function of frequency from thebeginning of test B43. The inset shows the equivalent RC circuit withresistance and capacitance values.
411N.W.A. Odling et al. / Earth and Planetary Science Letters 260 (2007) 407–418
For a solution of moderate salt concentration, elec-trical conductance is proportional to salinity, and hencethe electrical resistance of a bulk saline sample isproportional to the sample length, and inversely pro-portional to cross-sectional area and fluid salinity. Forthe microfractured granite of this investigation, floodedwith saline solution, the overall conductivity of a suf-ficiently large sample can be represented by a randomnetwork of conductors corresponding to the conductivecontribution of each connected fluid-filled fracture with-in the network. The conductivity of the granite matrixitself is many orders of magnitude lower than that ofdilute NaCl solutions, and its contribution to overallconductivity can, therefore, be neglected.
For electrical measurement systems, it is convenientto consider electrical resistance or impedance, ratherthan its inverse, conductance. The saline-flooded frac-ture systems of the present samples can thus be re-presented by a hypothetical resistor network with valuesrelated to local fracture aperture and fluid salinity.Unfortunately, the DC resistivity of an ionic fluid cannotbe measured directly because ion drift toward eachelectrode generates a blocking counter-voltage. Rather,an AC measurement is required, where an alternatingvoltage is applied at the sample ends, and the resultantcurrent through the sample is measured. For a simpleresistor the drive voltage and resultant current would beexactly in phase, but real samples of the type discussedshow a small phase lag between voltage and current,arising from a small capacitative contribution within thefluid–rock–electrode system. The true resistive compo-nent can be calculated by examining the frequencydependence of the in and out-of-phase components ofimpedance, as discussed in Macdonald (1987), andcalculating the functionally equivalent simple resistor–capacitor (RC) network.
AC impedance measurements were made using aSolatron SI 1260 impedance/gain phase analyser con-nected across the sample via the upper and lower pistonsas discussed above. For each impedance measurementthe computer-controlled analyser applied a logarithmicsequence of AC voltages from 1 MHz to 1 Hz sampling10 points per decade. At each frequency the meanabsolute values of the impedance |Z| and the phaseangles (ϕ) between voltage and current were recordedover a one second period. Impedance data were recordedwith the Solatron Impedance Measurement Software(Version 1.3) and analysed using the software packageZView2. A typical frequency scan is shown in Fig. 4,with the calculated equivalent RC network values. Inthe following discussion we reserve the term ‘imped-ance’ for electrical impedance values measured by the
Solartron 1260, and ‘resistance’ for the equivalent RCelectrical resistances calculated from impedances viaZView2.
2.4. Experimental procedure
To measure the dispersion–time relationship for agiven flow rate the following procedure was followed.The core was first saturated with degassed 0.01 M NaClsolution and its impedance measured: flooding with lowsalinity fluid as an initial condition avoids the mathe-matical problems and measurement errors which wouldarise from the extremely high electrical resistance ofpure water. A very slow reverse flow (1 cm3/h) of the0.01 M NaCl fluid downward in the core was thenbegun, to block possible upflow into the sample. Thebottom piston drain was then opened and 1 M NaClsolution pumped rapidly across the bottom face of thecore to give a near-instantaneous change in the com-position of fluid at the inflow end of the core. The 1 MNaCl pump rate was then reduced to the flow raterequired for the experiment, the bottom piston drainvalve closed, and the upper piston drain opened, al-lowing the 1 M NaCl fluid to begin advecting into thecore. Impedance measurements were then made atsuitable intervals to achieve some 200 measurementsduring the advection of the concentrated salt frontupward within the core. As the 1 M NaCl front advectedup the core, replacing lower-salinity fluid, the imped-ance of the core dropped, and the run was ended when aconstant impedance value showed 1 M NaCl solutionhad completely flooded the core. During the run thefluid expressed from the core was collected to monitortotal fluid flux. At the end of each run the sample wasflushed continuously with the original 0.01 M NaCl

Fig. 5. Normalized impedance time curves for flow rates between 0.067 to 2.132 cm3 h−1 corresponding to average linear velocities between1.1×10−6 m s−1 and 3.5×10⁻⁵ m s−1.
412 N.W.A. Odling et al. / Earth and Planetary Science Letters 260 (2007) 407–418
solution for a minimum of 24 h, at which point a steadyhigh impedance value had been re-attained.
3. Results
3.1. Mean cross sectional area of the fracture networkand impedance–flow relationships
When loaded to 2.5 MPa confining pressure andsaturated with a 1 M NaCl solution the core has aresistance of 700 Ohms. This is equivalent to that of acylinder of 1 M NaCl solution 90 mm in length and4.6 mm in diameter. The average total aperture of theconnected fracture network is, therefore, 16.6 mm2, or1.4% of the cross-sectional area of the core. A truesample porosity of 5.3% was determined by weight losson drying after careful water saturation. Samplepermeability was measured as 5.5×10⁻¹⁷ m2.
Fig. 5 shows the resistance–time traces normalisedto an arbitary range between zero and one, obtainedwhen IM NaCl fluid is introduced into the core at
Table 1Summary of flow rates, dispersion and retardation values obtained for the te
Test Flow rate Average linear velocity Calculated linear velocity
(cm3/h) (cm/s) (cm/s)
B42 0.067 1.093×10⁻⁴ 2.25×10⁻⁵
B43 0.085 1.391×10⁻⁴ 3.30×10⁻⁵
B45 0.129 2.101×10⁻⁴ 5.35×10⁻⁵
B49 0.180 2.941×10⁻⁴ 8.00×10⁻⁵
B47 0.282 4.600×10⁻⁴ 2.10×10⁻⁴
B48 0.757 1.237×10⁻³ 4.20×10⁻⁴
B51 2.132 3.483×10⁻³ 1.10×10⁻³
flow rates varying from 0.067 to 2.132 cm3 h−1 cor-responding to average fluid velocities of 1.1×10⁻⁴
and 3.5×10⁻³ cm s−1 respectively, relative to theelectrically active cross-sectional area, with no tortuositycorrection (see Table 1). The curves are clearly dissimilarto the typical sigmoid curve of a compositional break-through curve and consist of an initial approximatelylinear fall followed by an asymptotic section where theresistance decreases less rapidly towards a steady statevalue. In the runs at high flow rate the initial drop inresistance ismore rapid and the asymptotic section shorterthan those of slower flow rates. The minor fluctuations inslope during the initial resistance drop at the slowest flowrates are attributed to small variations in pump deliveryrates at these low flow rates.
3.2. Interpretation of impedance time curves: a modelfor dispersion in the micro-fracture network
The shapes of the resistance–time curves are verydifferent to the classic composition–time ‘breakthrough’
sts described in this study
Dispersion Dispersionprecision
Pe=v(x)L /D DL /Dd Retardation
(cm2 s−1)
3.00×10⁻⁶ 5.00×10⁻⁸ 0.015 0.203 4.861.50×10−6 8.00×10⁻⁸ 0.022 0.101 4.215.2×10−6 1.3×10⁻⁶ 0.036 0.355 3.935.0×10−6 1.0×10⁻⁶ 0.054 0.338 3.682.75×10−5 2.0×10⁻⁷ 0.141 1.86 2.193.0×10−5 1.0×10⁻⁵ 0.234 2.03 2.945.5×10−5 1.5×10⁻⁵ 0.743 3.72 3.17

413N.W.A. Odling et al. / Earth and Planetary Science Letters 260 (2007) 407–418
curves, measuring fluid composition as it exits thesample. Impedance spectroscopy records the integratedelectrical contribution of the entire sample. Thus, tointerpret the resistance–time curves in terms of ad-vection and breakthrough of a solute front in the core,we develop a new model for the interpretation of theresistive response to advection. The electrical resistanceof a salt solution, at the concentrations used, is inverselyproportional to concentration, and the fracture networkcontaining the fluid is spatially homogeneous andisotropic at the measurement scale used. Therefore, theresistance response of the saline-saturated micro-fractured ACM can be modelled by a simple seriesresistor model, and the effective total resistance will bethe sum of concentration dependent contributions alongthe length of the core.
At any point (x) along the sample, the electricalresistance (Rx) will be related to fluid saline concentra-tion (Cx) through
Rx~1Cx
ð1Þ
It follows, therefore, that the bulk resistance of asample of length l will be the integral of incrementalresistances along its length:
Re ¼Z l
0Rxdx~
Z l
0
dxCx
ð2Þ
Thus, if the concentration profile can be representedby an analytical relationship between concentration, timeand distance, the impedance time response of a samplecan be predicted and compared against measurements.Many studies of dispersion have identified complex,non-Fickian dispersion behaviour in fluids advectingthrough fracture networks. However, in this first study ofimpedance response to dispersion we test our observa-tions against the assumption that the longitudinaldispersion of a solute front in the fracture networkobeys the simple advection-dispersion equation (ADE,Freeze and Cherry, 1979). The effective resistance attime (t), therefore, will be related to the integral of thesolution to the ADE for the given boundary conditionsalong the core with respect to length:
Re ¼ KZ l
0
dx
C02 erfc x�vxt=RH
2ffiffiffiffiffiffiffiffiffiffiDL=RH
p� �
þ exp vxlDL
� �erfc xþvxt=RH
2ffiffiffiffiffiffiffiffiffiDLRH
p� �� �
ð3Þ
with the initial and boundary conditions
Cðx; 0Þ ¼ 0; Cð0; tÞ ¼ C0; tN0; 0VxV l
where Cx is the concentration at x (x≤ l), C0 is the initialconcentration, l is the length of the sample, vx is theaverage longitudinal velocity. RH is the retardation(hydrodynamic), DL is the longitudinal dispersioncoefficient and t time. K is the relevant constant ofproportionality.
No analytic solution is available for Eq. (3), makinginversion for model parameters difficult. The resis-tance–time response for the experiments was, therefore,modelled in forward mode through numerical integra-tion, and application of a suitable integration constant tonormalise the resistance–time curves to unity at t=0. Asdetailed below, multiple computations with varyinginitial parameters were run to determine the best fit tothe observed resistance–time data and derive values forlongitudinal dispersion in the micro-fractured ACM.The quality of the fit, therefore, indicates how well theADE describes the dispersion caused by flow throughthis fracture network.
The form of the family of resistance–time curvesobtained in Fig. 5 is explained in Fig. 6, which showsmovement of electrically conductive fluid within asample, flowing with velocity V. A step profile in thefluid concentration is imposed at time t0, and advancesfrom left to right undergoing dispersion obeying the ADE.Prior to solute breakthrough at the right hand core end,impedance drops linearly with time because the concen-tration profile is always symmetric about the advectedinitial position (Fig. 6b). Once the concentration profile‘breaks out’ of the end of the core the response curvebecomes nonlinear (Fig. 6c), with form dictated by therelative rates of advection and diffusion. Finally, thesample becomes saturated with the new fluid composition(Fig. 6d), and the resistance of the sample trendsasymptotically to a constant value, from which the meanconnected aperture can be determined with confidence.
3.3. Example of fitting model to curve — derivation ofretardation, RH and longitudinal dispersion coefficientDL for experiment run B47 (flow rate 0.282 cm3 h−1)
Fig. 7 shows typical normalised impedance–timedata, in this instance for run B47, with two curvesderived by integration of the solution to the ADE usingdifferent values of DL. It is clear from these plots thatthe value for DL for run B47 lies between 2×10⁻⁵ and4×10−5 cm2 s−1, and that the critical information lies inthe nonlinear sections of the data. To establish the best

Fig. 6. A conceptual model for the impedance along a porous core through which an electrolyte is advecting (see text for details).
414 N.W.A. Odling et al. / Earth and Planetary Science Letters 260 (2007) 407–418
fit value for DL the square root of the sum of squares ofthe residuals between the observed and calculatedimpedance–time curves is calculated for each trialvalue of DL for a particular value of the retardation RH.An example is shown in Fig. 8a. The residuals are notrandomly distributed about the best-fit solution but varyslightly and systematically with time for each fit. Thebest bestfit solution was determined by minimising thesum of squares of the residuals across the entire curve.Fig. 8b shows how the sum of squares of the residualsvaries with trial values of DL. The clear minimum in thecurve allows the optimal value for DL to be estimated,and indicates the degree of precision for each fit. Therange in DL corresponding to ±0.1% in sum of squares
Fig. 7. Determination ofDL for B47 (linear flow rate 4.6×10⁻⁴ m s−1).
of residuals is quoted along with the minimum residualfit for each run in Table 1.
To obtain convergence between the observed imped-ance–time relationships and those derived from themodel, substantial values of the retardation term (RH) inthe ADE solution are required. In the present context, theretardation term RH does not arise from chemicalsorption/desorption processes, which is the commonhistorical usage of R in the classical solution of the ADE(Freeze and Cherry, 1979). Rather, it is a delay termpresumed to arise from hydrodynamic flow patterns inthe microfracture network. Clearly, it is conceptuallysimilar to delays arising from chemical processes in otherflow systems, but to clarify the mechanistic differencescausing the retardation process in the experimentsreported here, we use RH as the appropriate variable,signifying hydrodynamic retardation. Fig. 9 shows thatthe relationship between RH and fluid velocity requiredfor convergence is not random. As the average linearvelocity of the fluid rises, the implied retardation fallsrapidly to aminimum and then risesmore slowly towardshigher fluid velocities, as discussed below.
4. Discussion
As far as we are aware, this is the first study to reportmeasurements of longitudinal dispersion and retardation ina real fractured rock sample by impedance spectroscopy.Two recent studies have, however, modelled dispersion in

Fig. 9. Retardation (RH) of solute in response to different flow rates inmicro-fractured ACM.
Fig. 8. a. The residuals expressed as a percentage of the totalimpedance versus time. The residuals are not randomly distributedabout the mean value but vary systematically with time and socannot be used to calculate error bounds. b. Differences betweencalculated and observed impedance responses for a range in DL
(residuals) for run B47. A minimum in the curve shows that theADE most closely matches the observed impedance data for a DL
value of 2.8×10− 5 cm2 s−1.
415N.W.A. Odling et al. / Earth and Planetary Science Letters 260 (2007) 407–418
real and model fractures and relate the dispersion to scalarproperties of the network. Gonzalez-Garcia et al. (2000)serially sectioned a naturally fractured granite block(0.06 m3) to reconstruct the three-dimensional character-istics of a natural fracture network. Using random-walksimulations they predicted the dispersion that would occuras a result of flow through the fracture network in threemutually perpendicular directions. Huseby et al. (2001), ina more theoretical approach, also used the random walktechnique to determine the dispersion characteristics of amodel fracture network composed of amonodisperse arrayof intersecting hexagons. Both studies examine therelationship between the dispersion coefficient and fluidvelocity by defining a Peclet number (Pe) for the fracturesystem:
Pe ¼ VxL=DL ð4Þ
where Vx is the average interstitial velocity, L is a lengthscale defined as the average lateral size of a fracture andDL
is the longitudinal dispersion coefficient. Huseby et al.
(2001) defined L as the radius of the component circularfractures making up their network and it is thereforeexplicit in their study. In reconstructing the fracturenetwork in three dimensions, Gonzalez-Garcia et al.(2000) were able to establish the value of L bymeasurement for their network. The problem in thepresent study is to estimate adequately the appropriatevalue of L from the 2-D pattern of fractures observed inSEM micro-graphs. This problem is directly analogous tothat encountered in field-scale exposures where fracturesand joints networks are only seen as essentially 2-Dfracture patterns on near-planar exposure surfaces. Gon-zalez-Garcia et al. (2000) examined this problem bycomparing the measured characteristics of their networkwith those derived by assuming the fractures were ran-domly oriented disks of radius L. They report thatthe simple isotropic model provides a good estimate of Lto within a factor of two despite their network beingsignificantly anisotropic. As the fracture network inmicro-fractured ACM has a very low degree of anisotropy (Clintet al., 2001) an estimate ofL based on the application of theisotropic model should be even more robust.
An equivalent net of 12 fractures with 23 junctionswas derived from the fracture pattern observed from theSEM micrograph shown in Fig. 1b. By counting thenumber of junctions with other fractures, the averagenumber of junctions per fracture is 3.1. Because thenetwork is known to have a low degree of anisotropy itcan be assumed that these fracture characteristics arealso valid in the directions normal to the SEM micro-graph. This allows us to estimate the fracture density as3.79×104 fractures/mm3. If the network is modelled asan array of intersecting ‘penny-shaped’ disks the totalsurface area will be:
S ¼ Nfkr2: ð5Þwhere Nf is the number of fractures in the sample and ris the radius of the disks making up the fracture network.
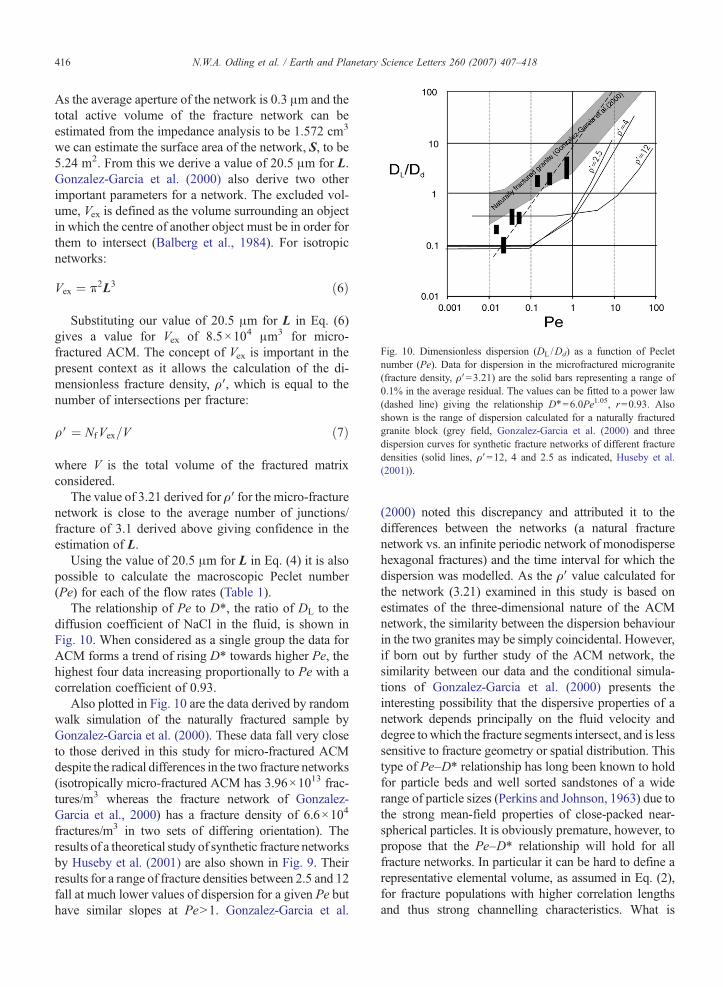
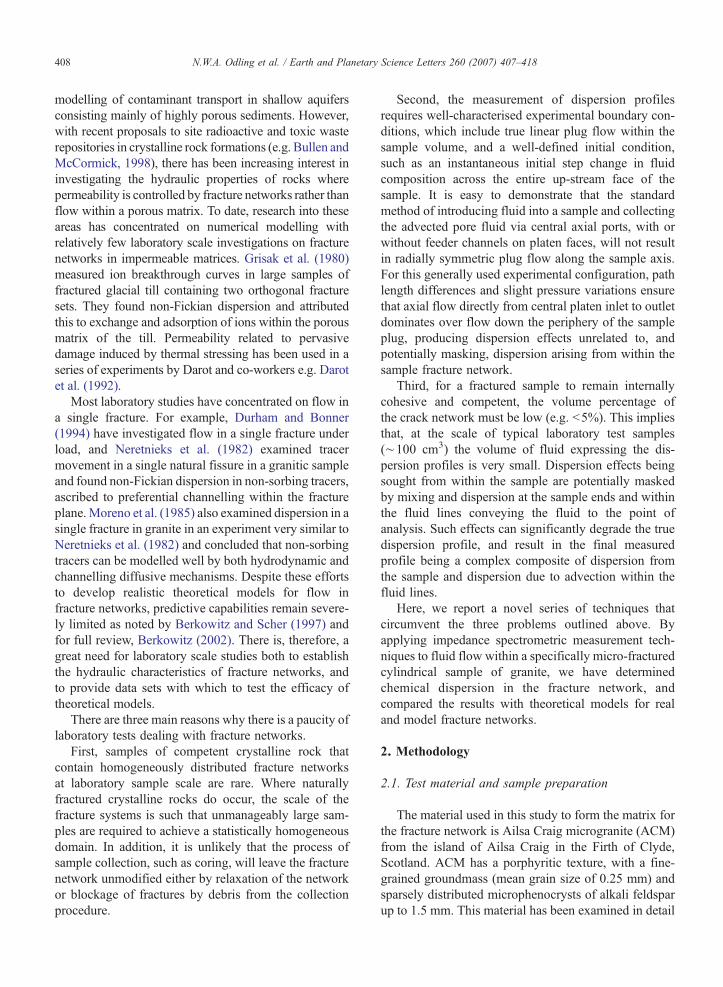
Fig. 10. Dimensionless dispersion (DL /Dd) as a function of Pecletnumber (Pe). Data for dispersion in the microfractured microgranite(fracture density, ρ′=3.21) are the solid bars representing a range of0.1% in the average residual. The values can be fitted to a power law(dashed line) giving the relationship D⁎=6.0Pe1.05, r=0.93. Alsoshown is the range of dispersion calculated for a naturally fracturedgranite block (grey field, Gonzalez-Garcia et al. (2000) and threedispersion curves for synthetic fracture networks of different fracturedensities (solid lines, ρ′=12, 4 and 2.5 as indicated, Huseby et al.(2001)).
416 N.W.A. Odling et al. / Earth and Planetary Science Letters 260 (2007) 407–418
As the average aperture of the network is 0.3 μm and thetotal active volume of the fracture network can beestimated from the impedance analysis to be 1.572 cm3
we can estimate the surface area of the network, S, to be5.24 m2. From this we derive a value of 20.5 μm for L.Gonzalez-Garcia et al. (2000) also derive two otherimportant parameters for a network. The excluded vol-ume, Vex is defined as the volume surrounding an objectin which the centre of another object must be in order forthem to intersect (Balberg et al., 1984). For isotropicnetworks:
Vex ¼ k2L3 ð6Þ
Substituting our value of 20.5 μm for L in Eq. (6)gives a value for Vex of 8.5×104 μm3 for micro-fractured ACM. The concept of Vex is important in thepresent context as it allows the calculation of the di-mensionless fracture density, ρ′, which is equal to thenumber of intersections per fracture:
qV¼ NfVex=V ð7Þ
where V is the total volume of the fractured matrixconsidered.
The value of 3.21 derived for ρ′ for the micro-fracturenetwork is close to the average number of junctions/fracture of 3.1 derived above giving confidence in theestimation of L.
Using the value of 20.5 μm for L in Eq. (4) it is alsopossible to calculate the macroscopic Peclet number(Pe) for each of the flow rates (Table 1).
The relationship of Pe to D⁎, the ratio of DL to thediffusion coefficient of NaCl in the fluid, is shown inFig. 10. When considered as a single group the data forACM forms a trend of rising D⁎ towards higher Pe, thehighest four data increasing proportionally to Pe with acorrelation coefficient of 0.93.
Also plotted in Fig. 10 are the data derived by randomwalk simulation of the naturally fractured sample byGonzalez-Garcia et al. (2000). These data fall very closeto those derived in this study for micro-fractured ACMdespite the radical differences in the two fracture networks(isotropically micro-fractured ACM has 3.96×10¹³ frac-tures/m3 whereas the fracture network of Gonzalez-Garcia et al., 2000) has a fracture density of 6.6×10⁴
fractures/m3 in two sets of differing orientation). Theresults of a theoretical study of synthetic fracture networksby Huseby et al. (2001) are also shown in Fig. 9. Theirresults for a range of fracture densities between 2.5 and 12fall at much lower values of dispersion for a given Pe buthave similar slopes at PeN1. Gonzalez-Garcia et al.
(2000) noted this discrepancy and attributed it to thedifferences between the networks (a natural fracturenetwork vs. an infinite periodic network of monodispersehexagonal fractures) and the time interval for which thedispersion was modelled. As the ρ′ value calculated forthe network (3.21) examined in this study is based onestimates of the three-dimensional nature of the ACMnetwork, the similarity between the dispersion behaviourin the two granites may be simply coincidental. However,if born out by further study of the ACM network, thesimilarity between our data and the conditional simula-tions of Gonzalez-Garcia et al. (2000) presents theinteresting possibility that the dispersive properties of anetwork depends principally on the fluid velocity anddegree towhich the fracture segments intersect, and is lesssensitive to fracture geometry or spatial distribution. Thistype of Pe–D⁎ relationship has long been known to holdfor particle beds and well sorted sandstones of a widerange of particle sizes (Perkins and Johnson, 1963) due tothe strong mean-field properties of close-packed near-spherical particles. It is obviously premature, however, topropose that the Pe–D⁎ relationship will hold for allfracture networks. In particular it can be hard to define arepresentative elemental volume, as assumed in Eq. (2),for fracture populations with higher correlation lengthsand thus strong channelling characteristics. What is
417N.W.A. Odling et al. / Earth and Planetary Science Letters 260 (2007) 407–418
clearly needed is to extend both the theoretical modellingand physical measurement of dispersion in a wide rangeof fracture networks under varying conditions to explorefurther whether this relationship is relatively simple, as inthe case of sandstones, or is more complex than theselimited results indicate.
NaCl, the solute chosen for the tests, is widely regardedas a conservative tracer and should not show significantretardation due to adsorption/desorption processes withinthe fracture network. However, de-convolution of thetime–impedance curves requires significant retardationvalues (Table 1) that are dependent on fluid velocity. Thehighest retardation value (4.9) occurs at the lowestaverage linear fluid velocity and falls steeply with in-creasing fluid velocity to a minimum of 2.9 at an averagelinear velocity of 2.0×10⁻⁴ cm s−1. From this point theretardation increases again at amoremodest rate to a valueof 3.2 at the highest fluid velocity of 1.1×10⁻³ cm s−1.This behaviour can be interpreted in terms of the networkcontaining a significant number of fractures that are not‘through connections’ and so do not contribute to thepermeability of the sample. At low fluid velocities,diffusion will cause significant loss of solute to these‘blind’ or stagnant sections of the network and thus slowthe rate of advance of the advection front. As the fluidvelocity rises, however, the rate of diffusive loss from thefront relative to its advection rate decreases, reducing theapparent retardation, as observed (Fig. 9). The subsequentincrease in retardation with further increase in fluidvelocity, however, cannot be assigned to diffusive loss.One possible explanation for this increase may be that theincreasing fluid velocity initiates eddies in the flow paths,both within individual fractures and in fracture sets withinthe network. This process would cause localised negativefluid velocities on many scales within the network thusdecreasing the average front velocity and increasing theapparent retention.
Huseby et al. (1997) have shown that the percolationthreshold in random isotropic networks takes place at adimensionless fracture density (ρ′) of 2.26±0.04. As theρ′ of micro-fractured ACM has value of 3.2 it is clearthat it is well above the percolation threshold and thuswell connected. Many numerical studies of both naturaland synthetic networks predict that non-Fickian disper-sion is to be expected from well connected networks andattribute this behaviour to a combination of channellingand dead space within the network (e.g. Moreno et al.,1988; Koudina et al., 1998; Huseby et al., 2001). Why,then, does the micro-fractured ACM show the appar-ently disparate characteristics of high solute retentioncombined with near Fickian dispersion? As the retentionrates are high it is clear that although the fracture net-
work is well connected it must also have a large fractionof dead-space within it and thus must exhibit flowchannelling. If, however, the fracture dead space isdistributed such that no part of it is distant from a ‘live’fracture then diffusion will ensure a rapid exchange ofsolute between it and a fluid flowing along the livefracture. In this case, rapid arrival and tailing in thebreakthrough behaviour typical of non-Fickian disper-sion will be minimal whilst retention will be substantial.As the correlation length of the fracture network is smallrelative to the core volume, however, the non-Fickiandispersion effects caused by channelling occur only on asmall scale. Thus the macro-dispersion will be the aver-age of local dispersions and thus will approach the‘ideal’ Fickian behaviour.
5. Conclusions
We have described novel measurements, based onimpedance spectroscopy, of dispersion in low porositymedia where conventional techniques are prone to in-strumental artefacts. The novel techniques we haveadopted alleviate the necessity for chemical microsampling and allow large numbers of measurements tobe made during the development of dispersion profiles.We have applied these techniques to thermally fracturedAilsa Craig micro-granite and report the first determi-nation of dispersion in a microfracture network. Ap-plying a simple assumption about the three-dimensionalnature of the network allows the results to be comparedto those of Gonzalez-Garcia et al. (2000) who modelleddispersion in a naturally fractured block of granite. De-spite large differences in geometry and density of thetwo fracture networks there is a striking similarity in thePeclet number–dispersion relationships and, in turn, tothose observed in particle bed experiments. As our dataare limited and derived, in part, from assumptions aboutthe 3-D nature of the network it is too early to claim asimple relationship between dispersion and Pecletnumber similar to that shown by particle beds. However,the data present the possibility that dispersion is de-pendent more on the fracture network connectivity thanthe spatial distribution, and that, at least for the relativelylow fracture density examined here, there is a simplerelationship between dispersion and Peclet number,similar to that known for particle beds and sandstones.The fracture network has been shown to exhibit sig-nificant levels of retardation which cannot be ascribed tosimple adsorption/desorption behaviour. The retardationis dependent on fluid velocity and it is suggested that, atlow fluid velocities, this is due to diffusive loss of soluteto ‘blind’ sections of the fracture network. Increasing

418 N.W.A. Odling et al. / Earth and Planetary Science Letters 260 (2007) 407–418
retardation towards higher fluid velocity may be due toback eddies in the flow within the network and thus maymark the onset of turbulent flow. Thus fracture networkssimilar to that studied here can have an interestingcombination of characteristics of dispersion similar tosandstones but with the ability to retard even thosecontaminants that are regarded to be unaffected by ad-sorption/desorption processes.
Acknowledgements
We gratefully acknowledge B. Berkowitz and twoanonymous reviewers whose helpful comments andobservations significantly improved an earlier version ofthis paper. This work was funded jointly by the NaturalEnvironment Research Council of the UK as part of theMicro-to-Macro Thematic Program and the EU grantEVK1-CT-2000-00062 ‘SALTRANS’.
References
Balberg, I., Anderson, C.H., Alexander, S., 1984. Excluded volume andits relation to the onset of percolation. Phys. Rev., B 3933–3943.
Berkowitz, B., 2002. Characterizing flow and transport in fracturedgeological media: a review. Adv. Water Resour. 25 (I8-12),861–884 (Aug–Dec).
Berkowitz, B., Scher, H., 1997. Anomalous transport in randomfracture networks. Phys. Rev. Lett. 79 (20), 4038–4041.
Bullen, D.B., McCormick, J.M., 1998. Disposing of the world's excessplutonium. Policy Stud. J. 26.4, 682–703.
Clint, O.C., Meredith, P.G., Main, I.G., 2001. Relation between crackdamage and permeability near the percolation threshold in a near-perfect crystalline rock. Geophys. Res. Abstr. 3, 346.
Dagan, G., Neuman, S.P. (Eds.), 1997. Subsurface Flow and Transport:A Stochastic Approach. Cambridge University Press, New York.
Darot, M., Gueguen, Baratin, M.-L., 1992. Permeability of thermallycracked granite. Geophys. Res. Lett. 19 (9), 869–872.
Durham, W.B., Bonner, B.P., 1994. Self-propping and fluid flow inslightly offset joints at high effective pressures. J. Geophys. Res.99 (B5), 9391–9399.
Freeze, R.A., Cherry, J.A., 1979. Groundwater. Prentice Hall, p. 79.Garrouch, A.A., Liaqat, A., Qasem, F., 2001. Using diffusion and
Electrical Measurements to assess toruosity of porous media. Ind.Eng. Chem. 40, 4363–4369.
Gonzalez-Garcia, R., Huseby, O., Thovert, J.-F., Ledesert, B., 2000.Three dimensional characterisation of a fractured granite andtransport properties. J. Geophys. Res., B 9, 21387–21401.
Grisak, G.E., Pickens, J.F., Cherry, J.A., 1980. Solute transportthrough fractured media 2. Column study of fractured Till. WaterResour. Res. 16 (4), 731–739.
Huseby, O., Thovert, J.-F., Adler, P.M., 1997. Dispersion in three-dimensional networks. J. Phys. A 30, 1415.
Huseby, O., Thovert, J.-F., Adler, P.M., 2001. Dispersion in three-dimensional networks. Phys. Fluids 13 (3), 594–615.
Koudina, N., Gonzalez-Garcia, R., Thovert, J.F., Adler, P., 1998.Permeability in three-dimensional fracture networks. Phys. Rev.,E Stat. Phys. Plasmas Fluids Relat. Interdiscip. Topics 57 (4),2103–2121.
Macdonald, J.R., 1987. Impedance Spectroscopy. John Wiley andSons.
Moreno, L., Neretnieks, I., Eriksen, T., 1985. Analysis of somelaboratory tracer runs in natural fissures. Water Resour. Res. 21 (7),951–958.
Moreno, L., Tsang, Y.W., Tsang, C.F., Hale, F.V., Neretnieks, I., 1988.Flow and tracer transport in a single fracture: a stochastic modeland its relation to some field observations. Water Resour. Res. 24,2033–2048.
Neretnieks, I., Eriksen, T., Tahtinen, P., 1982. Tracer movement in asingle fissure in granitic rock: some experimental results and theirinterpretation. Water Resour. Res. 18 (4), 849–858.
Perkins, T.K., Johnson, O.C., 1963. A review of diffusion anddispersion in porous media. Soc. Pet. Eng. J. 3, 70–84.
Zimmermann,R.,Main, I., 2004.Hydromechanical behaviour of fracturedrocks. In: Gueguen, Y., Bouteca, M. (Eds.), Mechanics of Fluid-Saturated Rocks. Elsevier Academic Press, London, pp. 363–422.