Embed Size (px)
Citation preview
Dissertation submitted to the Combined Faculties forthe Natural Sciences and for Mathematics of the
Ruperto-Carola University of Heidelberg, Germanyfor the degree of Doctor of Natural Sciences
Put forward byDiplom-Phys Thomas Jan PanderBorn in KrappitzOral examination: 13.05.2015

Laboratory ice multiplication experiments in levitatedmicrodroplets
Referees
Prof. Dr. Thomas Leisner Prof. Dr. Klaus Pfeilsticker

Abstract
Ice in clouds is an imporant factor for precipitation, the radiative properties and thelifetime of clouds. From the freezing of one cloud droplet, more than one ice particle mayresult. To investigate these so-called ice multiplication processes, experiments with singlelevitated droplets freezing at atmospherically relevant temperatures were conducted.Two potential processes were found: the fragmentation of a droplet’s ice shell undergrowing internal pressure and the emergence of bubbles on the ice surface. It has beenfound that solid particles in and on a freezing droplet promote ice multiplication whilesolubles inhibit it. A possible link to a highly effective ice multiplication mechanism, theHallett-Mossop process, is explored. Additionally, high-speed recordings of the potentialice multiplication processes and the freezing of droplets allowed for an analysis of thepropagation speed of ice in supercooled water. Furthermore, a technique for droplet sizemanipulation in pull-push type droplet generators is presented.
Eis spielt im Niederschlag, in den Strahlungseigenschaften und für die Lebenszeit vonWolken eine wichtige Rolle. Gefriert ein Wolkentropfen, kann dies zu mehr als einemEispartikel führen; dem liegen sogenannte Sekundäreisprozesse zugrunde. Um diese zuuntersuchen, wurden Gefrierexperimente an jeweils einzelnen levitierten Wolkentropfenunter atmosphärischen Temperaturen durchgeführt. Zwei potentielle Prozesse wurdenbeobachtet: einerseits das Zerbrechen der Eisschale um einen noch flüssigen Kern unterdem wachsenden Innendruck, andererseit das Auftreten von Blasen auf der gefrorenenTropfenoberfläche. Festpartikel im Volumen und auf der Oberfläche eines gefrieren-den Tropfens begünstigten Sekundäreisproduktion während lösliche Stoffe diese unter-drückten. Eine mögliche Verbindung zu einem hocheffektiven Sekundäreisprozess, demHallett-Mossop-Prozess, wurde untersucht. Durch Hochgeschwindigkeitsaufnahmen derSekundäreisprozesse und des Gefrierens von Tropfen konnte darüberhinaus die Ausbre-itungsgeschwindigkeit von Eis in unterkühltem Wasser gemessen werden. Im weiterenwurde eine Methode zur Tropfengrößenmanipulation bei Injektoren gefunden, welchenach dem ’pull-push’-Prinzip arbeiten.

Contents
Contents 5
1 Introduction 91.1 Motivation . . . . . . . . . . . . . . . . . . . . . . . . . . . . . . . . . . . 91.2 Cloud origins . . . . . . . . . . . . . . . . . . . . . . . . . . . . . . . . . 101.3 Radiative properties of clouds . . . . . . . . . . . . . . . . . . . . . . . . 111.4 Precipitation . . . . . . . . . . . . . . . . . . . . . . . . . . . . . . . . . 121.5 Ice formation in clouds . . . . . . . . . . . . . . . . . . . . . . . . . . . . 14
1.5.1 Homogeneous nucleation . . . . . . . . . . . . . . . . . . . . . . . 141.5.2 Heterogeneous nucleation . . . . . . . . . . . . . . . . . . . . . . . 151.5.3 Secondary ice processes . . . . . . . . . . . . . . . . . . . . . . . . 16
1.6 This thesis . . . . . . . . . . . . . . . . . . . . . . . . . . . . . . . . . . . 18
2 Theory 192.1 Water . . . . . . . . . . . . . . . . . . . . . . . . . . . . . . . . . . . . . 19
2.1.1 Bulk properties of water . . . . . . . . . . . . . . . . . . . . . . . 192.1.2 Water droplet freezing . . . . . . . . . . . . . . . . . . . . . . . . 222.1.3 Bubbles at an air-water interface . . . . . . . . . . . . . . . . . . 25
2.2 Aerosols . . . . . . . . . . . . . . . . . . . . . . . . . . . . . . . . . . . . 272.2.1 Particle behavior in air . . . . . . . . . . . . . . . . . . . . . . . . 272.2.2 Aerosol-substrate interaction . . . . . . . . . . . . . . . . . . . . . 302.2.3 Aerosol position on a water surface . . . . . . . . . . . . . . . . . 32
2.3 Electrodynamic balance . . . . . . . . . . . . . . . . . . . . . . . . . . . 332.3.1 Levitation of a single water droplet . . . . . . . . . . . . . . . . . 332.3.2 Compensation of gravity and air drag . . . . . . . . . . . . . . . . 332.3.3 Compensation of lateral movement . . . . . . . . . . . . . . . . . 332.3.4 Experimental realization . . . . . . . . . . . . . . . . . . . . . . . 35
6 Contents
3 Experimental setup and methods 373.1 Experimental setup . . . . . . . . . . . . . . . . . . . . . . . . . . . . . . 37
3.1.1 Electrodynamic balance and periphery . . . . . . . . . . . . . . . 373.1.2 Drop-on-demand injector . . . . . . . . . . . . . . . . . . . . . . . 39
3.2 Aerosol system . . . . . . . . . . . . . . . . . . . . . . . . . . . . . . . . 403.2.1 Aerosol sources . . . . . . . . . . . . . . . . . . . . . . . . . . . . 413.2.2 Aerosol size selection . . . . . . . . . . . . . . . . . . . . . . . . . 443.2.3 Aerosol number . . . . . . . . . . . . . . . . . . . . . . . . . . . . 45
3.3 Temperature correction . . . . . . . . . . . . . . . . . . . . . . . . . . . . 463.4 Methods . . . . . . . . . . . . . . . . . . . . . . . . . . . . . . . . . . . . 48
3.4.1 General experimental procedure . . . . . . . . . . . . . . . . . . . 483.4.2 Video evaluation . . . . . . . . . . . . . . . . . . . . . . . . . . . 49
4 Results 534.1 Droplet size manipulation . . . . . . . . . . . . . . . . . . . . . . . . . . 53
4.1.1 Single pulse variation . . . . . . . . . . . . . . . . . . . . . . . . . 544.1.2 Double pulse variation . . . . . . . . . . . . . . . . . . . . . . . . 544.1.3 W-shape pulse variation . . . . . . . . . . . . . . . . . . . . . . . 554.1.4 Triple pulse variation . . . . . . . . . . . . . . . . . . . . . . . . . 564.1.5 Pulse combinations in the EDB . . . . . . . . . . . . . . . . . . . 56
4.2 Ice propagation speed in a droplet . . . . . . . . . . . . . . . . . . . . . . 564.3 Fragmentations . . . . . . . . . . . . . . . . . . . . . . . . . . . . . . . . 61
4.3.1 PSL suspension experiments . . . . . . . . . . . . . . . . . . . . . 644.3.2 Kaolinite suspension experiments . . . . . . . . . . . . . . . . . . 654.3.3 Dilution and solution experiments . . . . . . . . . . . . . . . . . . 654.3.4 Rainwater experiments . . . . . . . . . . . . . . . . . . . . . . . . 674.3.5 SNOMAX suspension experiments . . . . . . . . . . . . . . . . . 684.3.6 Aerosol experiments . . . . . . . . . . . . . . . . . . . . . . . . . 694.3.7 Quantitative description of fragmentations . . . . . . . . . . . . . 70
4.4 Bubbles . . . . . . . . . . . . . . . . . . . . . . . . . . . . . . . . . . . . 724.4.1 PSL suspension experiments . . . . . . . . . . . . . . . . . . . . . 734.4.2 Kaolinite suspension experiments . . . . . . . . . . . . . . . . . . 744.4.3 Rainwater experiments . . . . . . . . . . . . . . . . . . . . . . . . 754.4.4 SNOMAX suspension experiments . . . . . . . . . . . . . . . . . 754.4.5 Aerosol experiments . . . . . . . . . . . . . . . . . . . . . . . . . 76
Contents 7
5 Discussion 775.1 Droplet size manipulation . . . . . . . . . . . . . . . . . . . . . . . . . . 77
5.1.1 Single pulse variation . . . . . . . . . . . . . . . . . . . . . . . . . 775.1.2 Double pulse variation . . . . . . . . . . . . . . . . . . . . . . . . 785.1.3 W-shape pulse variation . . . . . . . . . . . . . . . . . . . . . . . 785.1.4 Triple pulse variation . . . . . . . . . . . . . . . . . . . . . . . . . 785.1.5 Pulse combinations in the EDB . . . . . . . . . . . . . . . . . . . 79
5.2 Ice propagation speed in a droplet . . . . . . . . . . . . . . . . . . . . . . 795.2.1 Growth modi . . . . . . . . . . . . . . . . . . . . . . . . . . . . . 795.2.2 Ice propagation speed in supercooled water in the literature . . . 81
5.3 Fragmentations . . . . . . . . . . . . . . . . . . . . . . . . . . . . . . . . 825.3.1 The energy of fragments . . . . . . . . . . . . . . . . . . . . . . . 825.3.2 PSL suspension experiments . . . . . . . . . . . . . . . . . . . . . 835.3.3 Kaolinite suspension experiments . . . . . . . . . . . . . . . . . . 845.3.4 Dilution and solution experiments . . . . . . . . . . . . . . . . . . 855.3.5 SNOMAX suspension experiments . . . . . . . . . . . . . . . . . 865.3.6 Aerosol experiments . . . . . . . . . . . . . . . . . . . . . . . . . 87
5.4 Bubbles . . . . . . . . . . . . . . . . . . . . . . . . . . . . . . . . . . . . 885.4.1 On the phase of bubble fragments . . . . . . . . . . . . . . . . . . 885.4.2 PSL suspension experiments . . . . . . . . . . . . . . . . . . . . . 905.4.3 Kaolinite suspension experiments . . . . . . . . . . . . . . . . . . 905.4.4 SNOMAX suspension experiments . . . . . . . . . . . . . . . . . 915.4.5 Hematite aerosol experiments . . . . . . . . . . . . . . . . . . . . 915.4.6 Bubbles per bubble event . . . . . . . . . . . . . . . . . . . . . . 91
5.5 A possible link to the Hallett-Mossop process . . . . . . . . . . . . . . . 925.6 Fragmentations and bubbles in the literature . . . . . . . . . . . . . . . . 98
6 Summary 105
7 Appendix 1117.1 Experimental setup list . . . . . . . . . . . . . . . . . . . . . . . . . . . . 1117.2 Fragmentation frequencies in the literature . . . . . . . . . . . . . . . . . 113
Bibliography 117

Chapter 1
Introduction
1.1 Motivation
Climate \’kli - m@ t\
1. a region with particular weather patterns or conditions
2. the usual weather conditions in a particular place or region
3. the usual or most widespread mood or conditions in a place
Merriam-Webster 2014
Earth’s climate is a highly complex system. Climate science encompasses all sciencesbased on physical processes (as geology, medicine, biology, chemistry and physics itself)and humanities (as sociology, political science, psychology, agricultural science and eco-nomics); the arts reflect the definition of climate in their aesthetic grasp of the world.The understanding of climate is one of the great challenges faced by all scientists of todayand of tomorrow. Atmospheric research is the cornerstone of the physical description ofthe aspects most commonly associated with the concept of climate: the occurrence ofsolar radiation, wind and rain from the sky. Clouds are an integral part of this system asthey are the source of rain and the main reason for sun screening. The atmospheric watercirculation via clouds is of vigorous dynamic: the atmosphere contains ≈ 13 ∗ 1015kg ofwater (compared to ≈ 13, 5 ∗ 1021 kg in the oceans) which translates into an equivalentlayer on the earth surface of 25 mm. The average precipitation rate on earth is ≈ 1000mm/a, which means that the atmospheric water content is statistically exchanged fortytimes a year by solar radiation energy and heat energy stored in the earth [118]. Clouds
10 Introduction
originate from water condensation in the atmosphere in processes covering several kilo-meters in the vertical dimension and under geophysical conditions that may span wholecountries. This dynamic offers a versatile field of research, from diffusional processes tothe scale length of continents, from microseconds to months, from Antarctic cold to theheat of deserts. An adequate description of clouds, of their formation, dwell time in theatmosphere and their precipitation offers at the same time an insight into the fascinatingproperties of the substance most important for life on earth: water.
The following introduction seeks to contextualize the experiments conducted for thisthesis. The formation of clouds is briefly described, followed by the aspects of clouds inwhich ice plays a role - namely radiative properties and precipitation. The last sectiondeals with the processes involved in the freezing of cloud droplets, which is the subjectof this thesis, and leads to the questions that will be attempted to answer in this thesis.
1.2 Cloud origins
Clouds form when moist air is elevated to heights where, due to temperature decrease,water vapor pressure becomes sufficiently high so water condensates into droplets. Thepressure pdroplet over any droplet is described by the Köhler equation [59]. In the nota-tion of [156], the Köhler equation describes the equilibrium water vapor pressure ratioSdroplet = pdroplet/pw (pdroplet being the vapor pressure above the droplet surface and pw
the vapor pressure above a plane pure water surface at the same temperature) as
Sdroplet = K ∗ aw = e2Mwσs/RT ρwr ∗ e−φνns/nw . (1.1)
It consists of the Kelvin term K for the curvature and surface tension effect that in-creases pressure (see [138]) and a term aw for soluble materials in the droplet that lowersthe vapor pressure on the droplet surface. There are situations (high humidities and sol-uble gases) that require a “more complex” description [70], but mostly this formula issufficient for the description of cloud droplet formation. The surface- or Kelvin-term K
consists of the molecular weight Mw, the droplet’s surface tension σs and the density ρw
of water, the ideal gas constant R, the temperature T and droplet radius r. The wateractivity aw (or Raoult-term [116]) contains the osmotic coefficient φ which characterizesa solvent’s deviation from ideal behavior, the number of ions per solute molecule νion
and the number of moles of the solute ns and of solvent water nw. The number of molesof water ns implicitly leads to the droplet volume, so the Köhler equation may be ex-panded to an approximation of the form Sdroplet ≈ 1 + A/r − B/r3 with the coefficients
1.3 Radiative properties of clouds 11
A = 2Mwσs/RTρw and B = φνns/nw. If Sdroplet is calculated, it becomes apparentthat supersaturations with respect to water of many hundred percent are necessary tosustain droplets consisting of several hundred water molecules, which would result indroplets of a nanometer size, as A = O(10−9m) for tropospheric temperatures. Instead,cloud droplet nucleation takes place on aerosols which are in this case called ‘cloudcondensation nuclei’ (CCN). Both components of the Köhler equation can take aerosolproperties into account: their size reduces the curvature of a condensing droplet andthey may contain soluble materials, but the effect of aerosols is so pronounced that evenhydrophobic soot particles may serve as CCN with as little as 2% supersaturation (see[64]). So, under atmospheric conditions, water saturations close to unity are generallysufficient for cloud nucleation as aerosols are ubiquitous (e.g., 31800cm−3 on a rainy day[2]). Once cloud droplets are formed, they grow until they have reached an equilibriumwith the ambient water vapor pressure; this generally leads to a droplet size of 6-14µmas measured with satellites by [13]. For droplets in this size range, growth at water vaporpressures close to saturation becomes slow and their terminal falling velocities becomeimportant.
1.3 Radiative properties of clouds
Clouds are a central factor in the planetary albedo and thus in the global radiationbudget. The cloud formation mechanism under conditions given by the Köhler equationleads to interesting consequences with regards to aerosol-cloud interaction. An increasedaerosol concentration, e.g., sandstorms or anthropogenic pollution, will lead to an in-crease in cloud droplet concentration and a reduction in average cloud droplet size, asthe water vapor is distrubuted to more droplets. The consequence on cloud reflectanceis called the “Twomey effect”: “by increasing droplet concentration and thereby theoptical thickness of a cloud, pollution acts to increase the reflectance (albedo) of clouds;by increasing the absorption coefficient it acts to decrease the reflectance” [146]. “Al-though the changes [by the addition of man-made cloud nuclei] are small, the long-termeffect on climate can be profound” [145], and altogether “the [. . . ] brightening effectis the dominant one for global climate” [147]. The theory has been verified in, e.g.,[1]: “Twomey’s parameterization represents the trend of albedo changes with dropletconcentration remarkably well” and was assessed to cause global cooling, albeit with aconsiderable error margin [10]. It may be tempting to counteract global warming (see[57] for evidence) by exploiting the Twomey effect; there are “legal, political and ethicalquestions” [32], though, regarding the repercussions of large scale weather manipulation.
12 Introduction
For example, pumping several megatons of sulfur dioxide particles into the stratosphereevery year to act as CCN, which would be one of the most cost-efficient and feasiblemeasures, would lead to an increased planetary albedo. But it would also turn the at-mosphere more opaque, reducing the blueness of the sky, to add an aesthetic dimensionand cause for discussion to the consequences for vegetation and stratospheric chemistry.Another factor influencing the radiative properties of a cloud is its phase. Ice has arefractive indices different from water (see [69]), and in contrast to spherical droplets,the multitude of ice shapes “affect their density, terminal fall velocity, growth rate andradiative properties” [68].
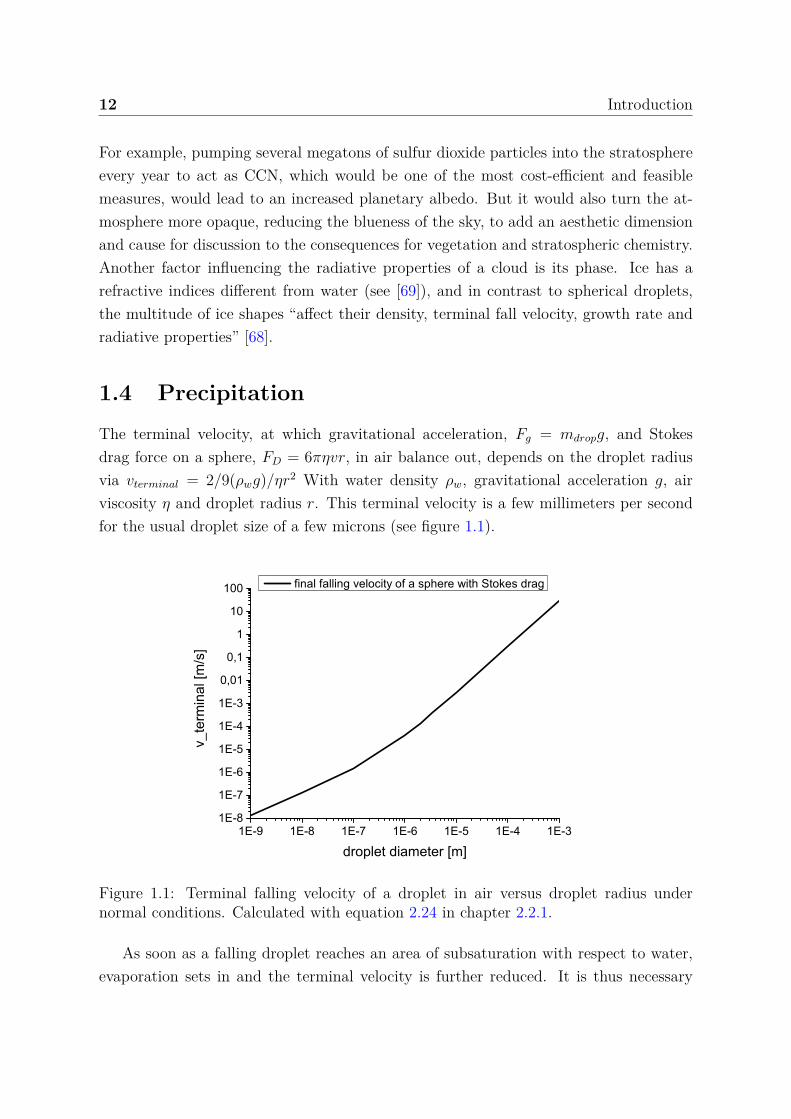
1.4 PrecipitationThe terminal velocity, at which gravitational acceleration, Fg = mdropg, and Stokesdrag force on a sphere, FD = 6πηvr, in air balance out, depends on the droplet radiusvia vterminal = 2/9(ρwg)/ηr2 With water density ρw, gravitational acceleration g, airviscosity η and droplet radius r. This terminal velocity is a few millimeters per secondfor the usual droplet size of a few microns (see figure 1.1).
1E-9 1E-8 1E-7 1E-6 1E-5 1E-4 1E-31E-8
1E-7
1E-6
1E-5
1E-4
1E-3
0,01
0,1
1
10
100
v_te
rmin
al [m
/s]
droplet diameter [m]
final falling velocity of a sphere with Stokes drag
Figure 1.1: Terminal falling velocity of a droplet in air versus droplet radius undernormal conditions. Calculated with equation 2.24 in chapter 2.2.1.
As soon as a falling droplet reaches an area of subsaturation with respect to water,evaporation sets in and the terminal velocity is further reduced. It is thus necessary
1.4 Precipitation 13
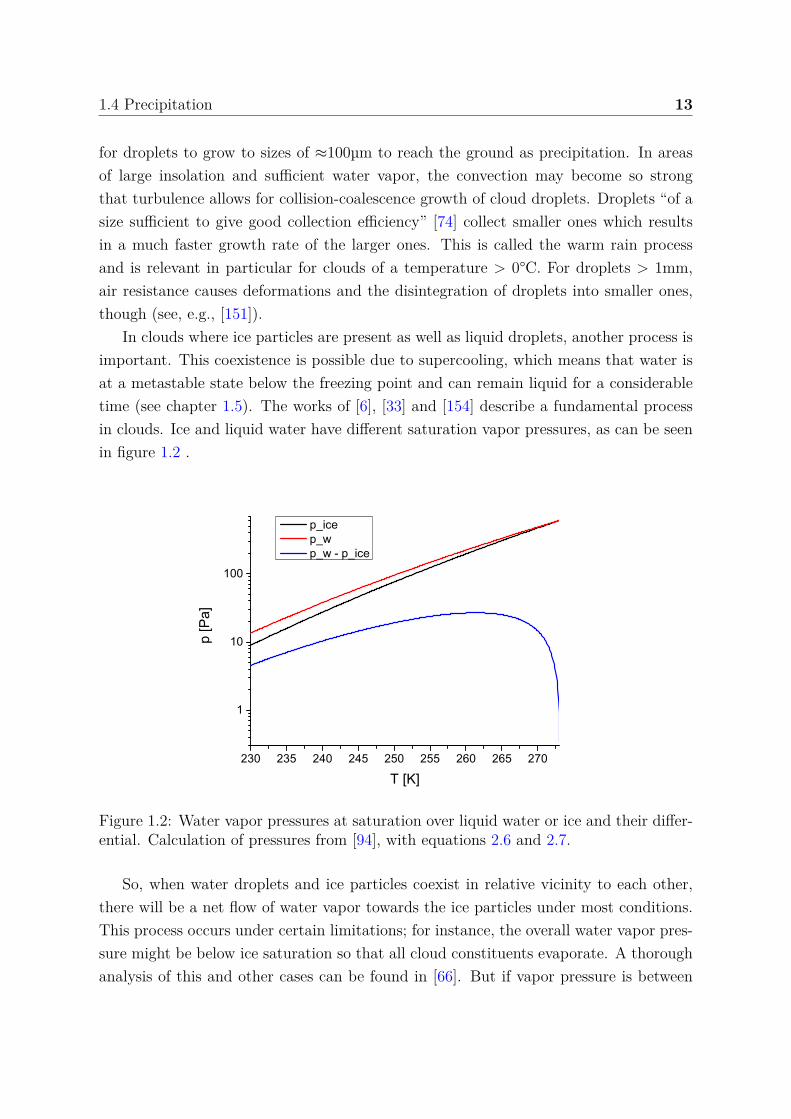
for droplets to grow to sizes of ≈100µm to reach the ground as precipitation. In areasof large insolation and sufficient water vapor, the convection may become so strongthat turbulence allows for collision-coalescence growth of cloud droplets. Droplets “of asize sufficient to give good collection efficiency” [74] collect smaller ones which resultsin a much faster growth rate of the larger ones. This is called the warm rain processand is relevant in particular for clouds of a temperature > 0°C. For droplets > 1mm,air resistance causes deformations and the disintegration of droplets into smaller ones,though (see, e.g., [151]).
In clouds where ice particles are present as well as liquid droplets, another process isimportant. This coexistence is possible due to supercooling, which means that water isat a metastable state below the freezing point and can remain liquid for a considerabletime (see chapter 1.5). The works of [6], [33] and [154] describe a fundamental processin clouds. Ice and liquid water have different saturation vapor pressures, as can be seenin figure 1.2 .
230 235 240 245 250 255 260 265 270
1
10
100
p [P
a]
T [K]
p_ice p_w p_w - p_ice
Figure 1.2: Water vapor pressures at saturation over liquid water or ice and their differ-ential. Calculation of pressures from [94], with equations 2.6 and 2.7.
So, when water droplets and ice particles coexist in relative vicinity to each other,there will be a net flow of water vapor towards the ice particles under most conditions.This process occurs under certain limitations; for instance, the overall water vapor pres-sure might be below ice saturation so that all cloud constituents evaporate. A thoroughanalysis of this and other cases can be found in [66]. But if vapor pressure is between
14 Introduction
the saturation pressure of water and ice for a given temperature, ice particles will growat the expense of the liquid droplets, gain mass and may reach terminal falling speedssufficiently high to reach the ground without complete prior evaporation, depending onthe temperature and water vapor concentration below the cloud. This is usually referredto as the Bergeron-Findeisen process.
In [122] it was discovered, during experiments which employed solid carbon dioxide(“dry ice”) to introduce ice particles into a freezing unit containing supercooled waterdroplets, that “whithin less than 10 seconds the supercooled cloud was completely con-verted to one of ice crystals”. Together with Bergeron-Findeisen process, the ’seeding’ ofsupercooled clouds “by dropping pellets of solid carbon dioxide into them” [132] from anaircraft has for a long time been a method to artificially induce precipitation, e.g., for thepurpose of removing clouds for the opening ceremony of the Beijing 2008 Olympic games([19]). Measurements in Israel suggest “little or no effect on total precipitation” [76],though. The Bergeron-Findeisen process does not give an explanation for the presenceof ice particles in a dominantly liquid cloud.
1.5 Ice formation in clouds
Ice particle in clouds can be attributed to three origination mechanisms: homogeneousnucleation, heterogeneous nucleation and secondary ice processes.
1.5.1 Homogeneous nucleation
Statistical density fluctuations in water below 0°C lead to the formation of ice-likemolecule clusters. Those clusters, also called ’ice embrios’, may continue to grow iftheir size is sufficiently large; below a certain size, the heat of fusion of additional watermolecules causes disaggregation of such clusters. It is possible to describe the nucleationof a spherical ice embrio in water with an nucleation energy barrier Φ that inhibits icenucleation at temperatures <0°C (see [110]) :
Φ = 4πr2INσI−W − (4πr3
IN)/3nI(µW − µI) (1.2)
with the ice nucleus radius rIN , the surface tension between water and ice σI−W , thenumber of water molecules in the nucleus nI and the difference between the chemicalpotentials of water and ice µW − µI . To create a water-ice surface, energy is necessary,while the conversion of water to ice is energetically favourable. It should be noted thatactual ice nuclei may have other shapes than spheres and that the property σI−W is
1.5 Ice formation in clouds 15
not easily measured (see [61]). Assuming knowledge of the actual height of Φ, energyand density fluctuations in supercooled water will lead to the appearance of a volumeelement in which this barrier is overcome and ice nucleation with subsequent freezing ofthe bulk volume takes place. The nucleation rate coefficient of a volume element JV (T )depends on the energy barrier and the temperature. The larger the bulk volume and thelonger the observation time, the lower the probability Pu of, e.g., a droplet to remainunfrozen:
Pu(t) = Pu(t0) ∗ e(−JV (T )∗V ∗t) (1.3)
It has been found by [30] that for droplets with a radius 19µm < a < 49µm, JV (−36, 1°C) =(2, 8±0, 15)∗106cm−3s−1 which they project to be true for all droplets larger than 1µm.
1.5.2 Heterogeneous nucleation
Above -36°C, JV quickly decreases ( JV (−33◦C) = 15cm−3s−1, JV (−34◦C) = 3000cm−3s−1,JV (−35◦C) = 2 ∗ 105cm−3s−1 in [108]), so homogeneous freezing of water droplets be-comes increasingly improbable if small droplet volumes are considered; yet water canconsistently be observed to freeze at 0°C. This is due to ice-active surfaces of materialsdifferent from ice itself. Several sub-mechanisms of heterogeneous freezing are distin-guished:
Deposition freezing: Ice nucleation from the gas phase onto a substrate or particle
Contact freezing: An ice-active surface (trivially ice itself) comes into contact with asupercooled water volume and causes freezing during this contact
Immersion freezing: The ice-active particle or material is immersed into the watervolume prior to supercooling
Condensation nucleation: Water condensates onto the substrate or particle whichnucleates ice at a certain point; arguably a subset of immersion freezing
These distinctions are not an end in themselves, as it has been found that, e.g., contactnucleation is more effective than immersion nucleation of the same particles at the sametemperature (e.g., [24, 77]), and it is claimed that “contact freezing [. . . ] can initiate iceformation at the highest temperatures” [71]; deposition freezing becomes important inthe water vapor pressure range between ice saturation and water saturation.
There is a broad spectrum of suitable surfaces and materials found in experimentsthat ranges from biogenic forest emissions [107], mineral dusts [95], pollen [113], fungalspores [112], ash from volcanic eruptions [133] to steroids [48] or alcohols arranged in
16 Introduction
monolayers [36]. From the considerations on cloud formation it is apparent that water-soluble or hygroscopic aerosols are most suitable to serve as CCN, but the freezingpoint depression of salts and acids [82] does influence their suitabiliy as ice nuclei (IN)negatively.
The most efficient ice nuclei known at the moment and of current interest are ofbiogenic origin, like bacterial proteins (isolated from bacterial cells by [158]), macro-molecules from pollen [5], fungal spores [105] or aerosols from volatile organic carbonemissions [152]. But those biological IN are “of minor importance on the global scale”for precipitation [54] due to their low concentration in the atmosphere.
More ubiquitous, mineral dusts have received a lot of attention in experiments incloud chambers [88], continuous flow diffusion chambers [120], electrodynamic balances[53], on cold stages [117], in aqueous suspensions [85] or environmental scanning electronmicroscopy [159]. E.g., feldspar particles have been claimed to “account for a large pro-portion of the ice nuclei in Earth’s atmosphere” [4]. Chemical aging of aerosols in theatmosphere may enhance their ice nucleation abilities (e.g., black carbon aerosols fromthe Eyjafjallajökull eruption 2010 [7]), and it has been speculated that precipitation overforests might lead to the release of ice-active aerosols such as fungal spores or pollen [56].
To predict the ice nucleation ability of a surface is one of the challenges of aerosoland cloud physics. “It is believed that silver iodide serves as a very effective nucleusbecause it very closely resembles ice in crystal structure” [153], but for many efficient icenuclei such an easy explanation found in the unit cell dimensions of their crystals wasnot found. So far, “no closed theoretical description of [heterogeneous ice nucleation]and the requirements for good ice nuclei is available”, although “numerous studies haveattempted to quantify the ice nucleation ability of different particles empirically in lab-oratory experiments.” [55].
One of the empirical quantifications in use today is the “ice-active site density” [97]which attributes the ability of ice nucleation at a given temperature to nucleating sitesthat have a certain probability to exist on a surface element of, for instance, an aerosol.
1.5.3 Secondary ice processes
Ice particle numbers in clouds are sometimes found to exceed ice nuclei numbers [11, 52],reportedly by a factor of up to 104 [93]. While particle shattering at inlets of measuringinstruments mounted on research planes has been found to be a source of ice particlenumber overestimation [67, 150], so-called secondary ice processes “may play a role in iceformation” [106] where homogeneous and heterogeneous nucleation of ice can’t explain
1.5 Ice formation in clouds 17
the ice particle number .
‘Secondary ice’, ‘ice enhancement’ or ‘ice multiplication’ processes denote mecha-nisms in which pre-existing ice (from homogeneous or heterogeneous freezing) createsmore ice by ice-ice or ice-water interaction. For instance, “a collision between twowhiskered ice crystals or between a whiskered crystal and a water drop could fracturemany of these fragile whiskers, with the consequent production of new ice nuclei.” [98],but “the generation of secondary particles by mechanical fracturing does not explain thepresence of large concentrations of ice crystals in relatively warm clouds” [148].
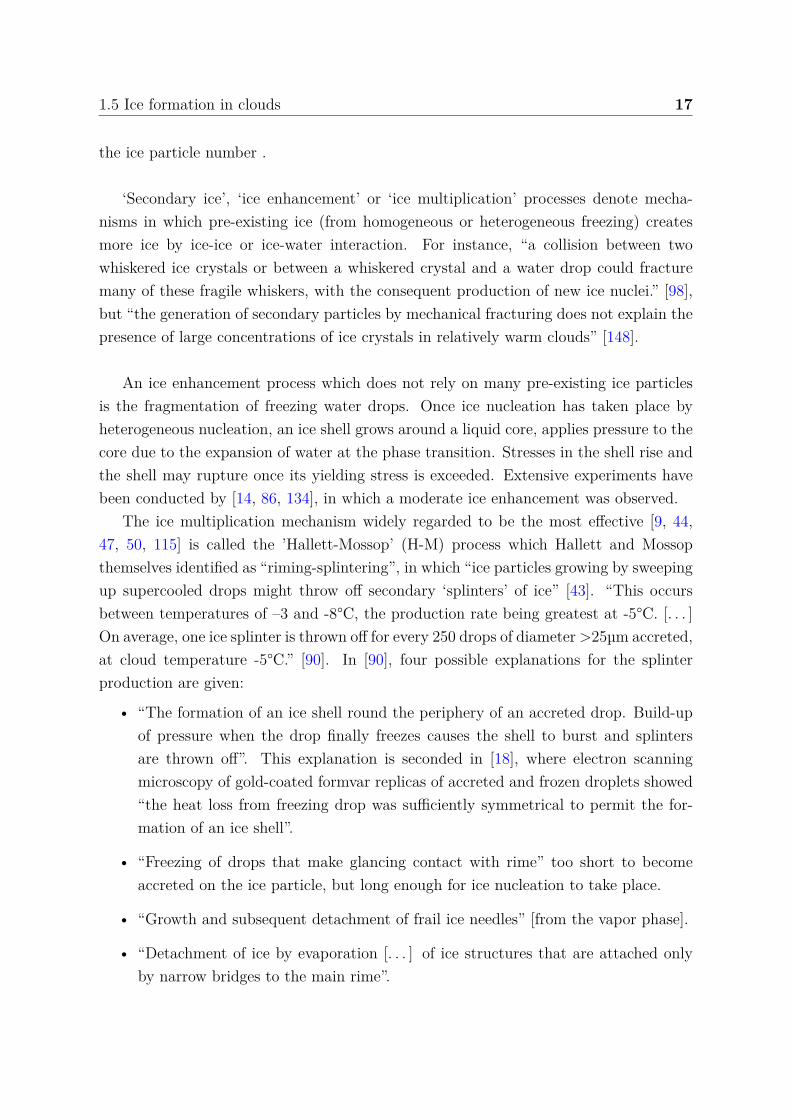
An ice enhancement process which does not rely on many pre-existing ice particlesis the fragmentation of freezing water drops. Once ice nucleation has taken place byheterogeneous nucleation, an ice shell grows around a liquid core, applies pressure to thecore due to the expansion of water at the phase transition. Stresses in the shell rise andthe shell may rupture once its yielding stress is exceeded. Extensive experiments havebeen conducted by [14, 86, 134], in which a moderate ice enhancement was observed.
The ice multiplication mechanism widely regarded to be the most effective [9, 44,47, 50, 115] is called the ’Hallett-Mossop’ (H-M) process which Hallett and Mossopthemselves identified as “riming-splintering”, in which “ice particles growing by sweepingup supercooled drops might throw off secondary ‘splinters’ of ice” [43]. “This occursbetween temperatures of –3 and -8°C, the production rate being greatest at -5°C. [. . . ]On average, one ice splinter is thrown off for every 250 drops of diameter >25µm accreted,at cloud temperature -5°C.” [90]. In [90], four possible explanations for the splinterproduction are given:
• “The formation of an ice shell round the periphery of an accreted drop. Build-upof pressure when the drop finally freezes causes the shell to burst and splintersare thrown off”. This explanation is seconded in [18], where electron scanningmicroscopy of gold-coated formvar replicas of accreted and frozen droplets showed“the heat loss from freezing drop was sufficiently symmetrical to permit the for-mation of an ice shell”.
• “Freezing of drops that make glancing contact with rime” too short to becomeaccreted on the ice particle, but long enough for ice nucleation to take place.
• “Growth and subsequent detachment of frail ice needles” [from the vapor phase].
• “Detachment of ice by evaporation [. . . ] of ice structures that are attached onlyby narrow bridges to the main rime”.
18 Introduction
It was claimed that “thermal gradients give stresses leading to an ice crack at about-5°C.”[27]; on the other hand “the mechanism for the process is still uncertain.” [15].Moreover, “it is very probable that key secondary ice production processes have notbeen identified outside of [the H-M processes] temperature range” (ibidem).
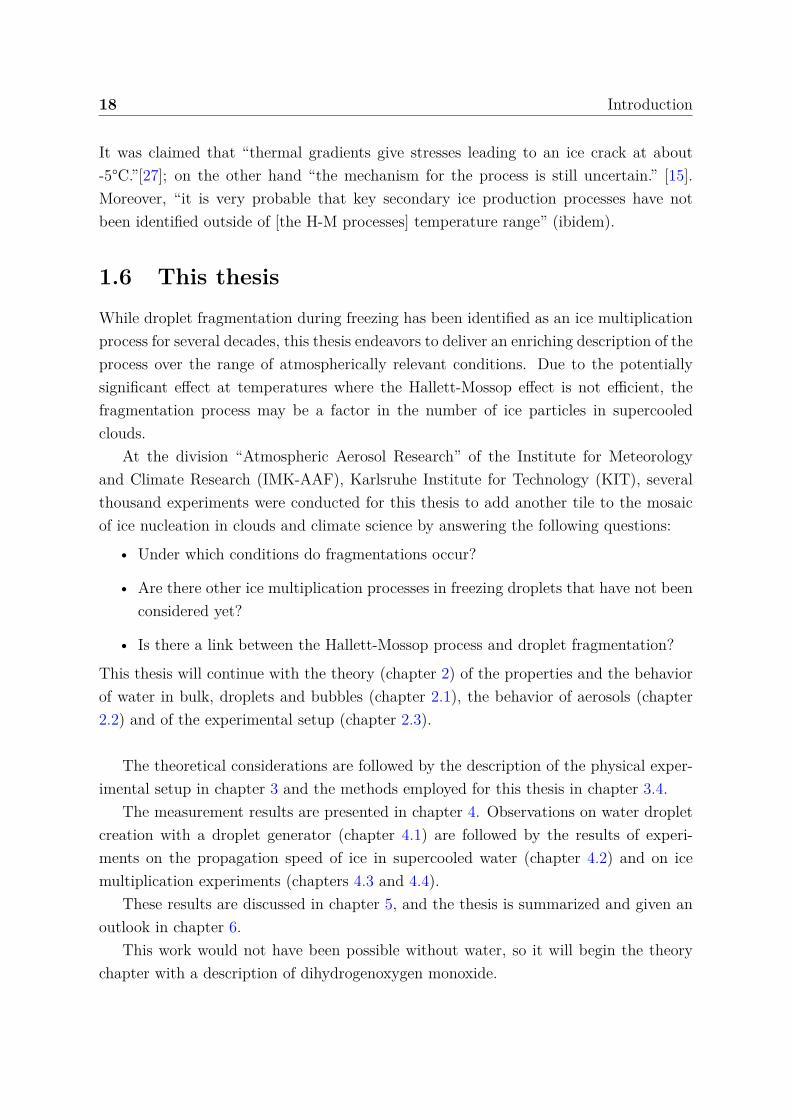
1.6 This thesisWhile droplet fragmentation during freezing has been identified as an ice multiplicationprocess for several decades, this thesis endeavors to deliver an enriching description of theprocess over the range of atmospherically relevant conditions. Due to the potentiallysignificant effect at temperatures where the Hallett-Mossop effect is not efficient, thefragmentation process may be a factor in the number of ice particles in supercooledclouds.
At the division “Atmospheric Aerosol Research” of the Institute for Meteorologyand Climate Research (IMK-AAF), Karlsruhe Institute for Technology (KIT), severalthousand experiments were conducted for this thesis to add another tile to the mosaicof ice nucleation in clouds and climate science by answering the following questions:
• Under which conditions do fragmentations occur?
• Are there other ice multiplication processes in freezing droplets that have not beenconsidered yet?
• Is there a link between the Hallett-Mossop process and droplet fragmentation?
This thesis will continue with the theory (chapter 2) of the properties and the behaviorof water in bulk, droplets and bubbles (chapter 2.1), the behavior of aerosols (chapter2.2) and of the experimental setup (chapter 2.3).
The theoretical considerations are followed by the description of the physical exper-imental setup in chapter 3 and the methods employed for this thesis in chapter 3.4.
The measurement results are presented in chapter 4. Observations on water dropletcreation with a droplet generator (chapter 4.1) are followed by the results of experi-ments on the propagation speed of ice in supercooled water (chapter 4.2) and on icemultiplication experiments (chapters 4.3 and 4.4).
These results are discussed in chapter 5, and the thesis is summarized and given anoutlook in chapter 6.
This work would not have been possible without water, so it will begin the theorychapter with a description of dihydrogenoxygen monoxide.
Chapter 2
Theory
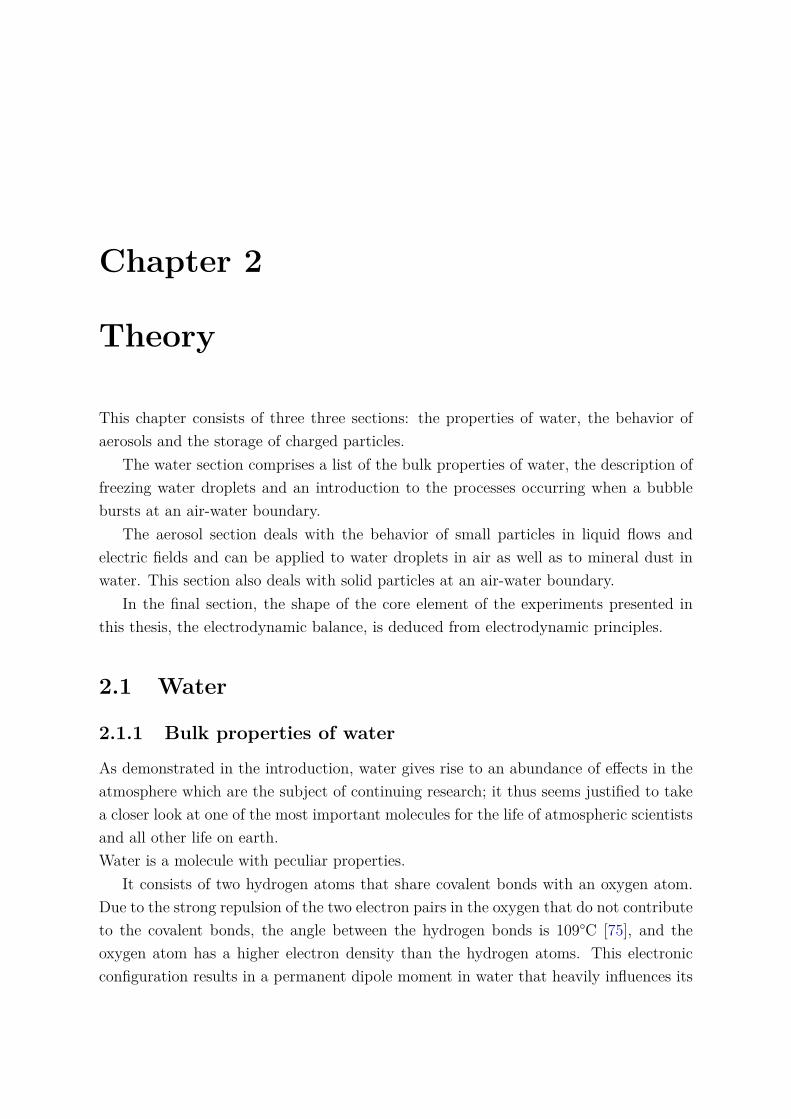
This chapter consists of three three sections: the properties of water, the behavior ofaerosols and the storage of charged particles.
The water section comprises a list of the bulk properties of water, the description offreezing water droplets and an introduction to the processes occurring when a bubblebursts at an air-water boundary.
The aerosol section deals with the behavior of small particles in liquid flows andelectric fields and can be applied to water droplets in air as well as to mineral dust inwater. This section also deals with solid particles at an air-water boundary.
In the final section, the shape of the core element of the experiments presented inthis thesis, the electrodynamic balance, is deduced from electrodynamic principles.
2.1 Water
2.1.1 Bulk properties of water
As demonstrated in the introduction, water gives rise to an abundance of effects in theatmosphere which are the subject of continuing research; it thus seems justified to takea closer look at one of the most important molecules for the life of atmospheric scientistsand all other life on earth.Water is a molecule with peculiar properties.
It consists of two hydrogen atoms that share covalent bonds with an oxygen atom.Due to the strong repulsion of the two electron pairs in the oxygen that do not contributeto the covalent bonds, the angle between the hydrogen bonds is 109°C [75], and theoxygen atom has a higher electron density than the hydrogen atoms. This electronicconfiguration results in a permanent dipole moment in water that heavily influences its
20 Theory
radiative properties and is, e.g., exploited in microwave heating [34]. Its boiling pointat 1 atmosphere pressure is 100°C, which is quite high compared to other molecules ofsimilar molar mass like CH4 (boiling point of -162°C) or similar constituents like H2S
(boiling point of -60,2°C). This phenomenon can be attributed to the relatively stronghydrogen bonds between individual water molecules in the liquid phase. A hydrogenbond is not a bond as in covalent or ionic bonds, where electrons are shared betweenatoms, but denotes a strong dipole-dipole attraction. It is stronger than a van derWaals interaction, which is based on induced dipoles, but weaker than an actual bondin a molecule. The effect of such hydrogen bonds may also be found, for instance, inhydrogen fluoride HF or ammonia NH3 (boiling point at 20°C or -33,3°C, respectively,taken from [79]) where hydrogen bonds are established intermittently - intermittentlymeans in the order of 10−12s in the case of water. Without these hydrogen bonds, waterwould only exist as a gas under earth conditions. With these bonds, water has the secondhighest specific heat capacity per mass (cp=4,2 J/(g*K) at standard conditions) of allheteroatomic molecules and a high heat of vaporization (Lv=2257 kJ/kg) and meltingheat (Lm=333,5 kJ/kg).
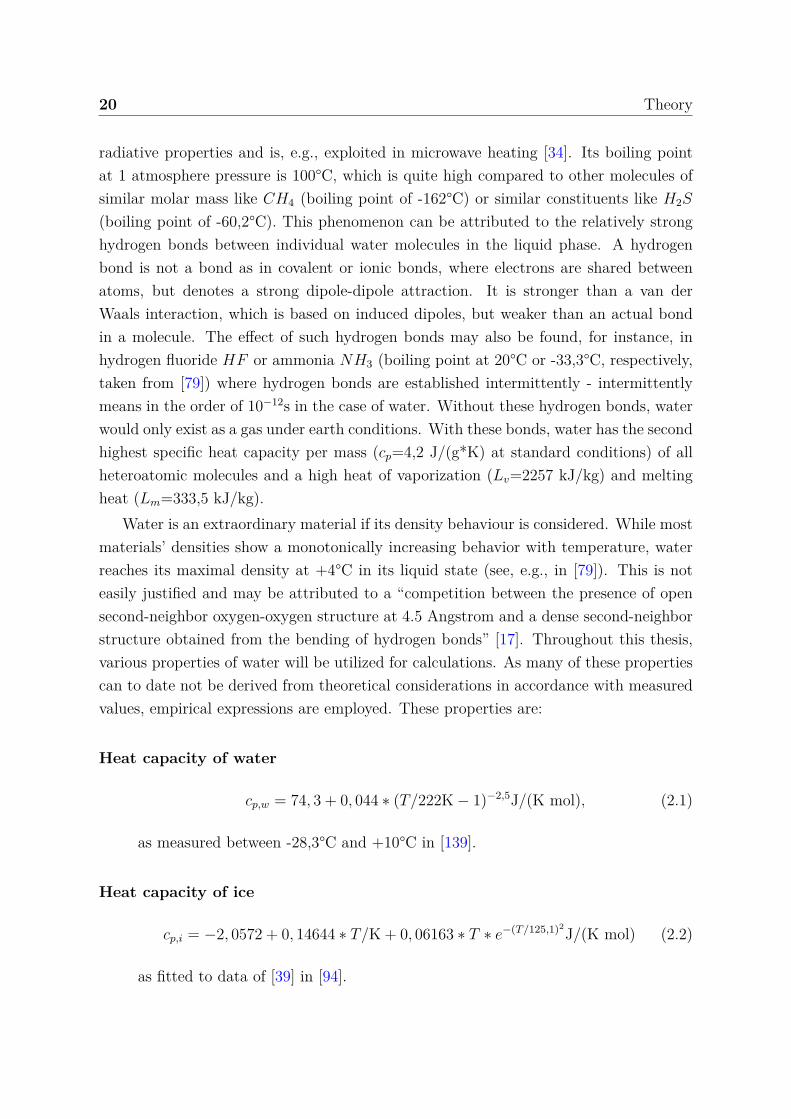
Water is an extraordinary material if its density behaviour is considered. While mostmaterials’ densities show a monotonically increasing behavior with temperature, waterreaches its maximal density at +4°C in its liquid state (see, e.g., in [79]). This is noteasily justified and may be attributed to a “competition between the presence of opensecond-neighbor oxygen-oxygen structure at 4.5 Angstrom and a dense second-neighborstructure obtained from the bending of hydrogen bonds” [17]. Throughout this thesis,various properties of water will be utilized for calculations. As many of these propertiescan to date not be derived from theoretical considerations in accordance with measuredvalues, empirical expressions are employed. These properties are:
Heat capacity of water
cp,w = 74, 3 + 0, 044 ∗ (T/222K − 1)−2,5J/(K mol), (2.1)
as measured between -28,3°C and +10°C in [139].
Heat capacity of ice
cp,i = −2, 0572 + 0, 14644 ∗ T/K + 0, 06163 ∗ T ∗ e−(T/125,1)2J/(K mol) (2.2)
as fitted to data of [39] in [94].
2.1 Water 21
Heat conductivity of ice
kice = 5, 20 − 11, 2 ∗ 10−3 ∗ T/K Wm K (2.3)
as fitted to data of [130] between 250K and 273,2K at atmospheric pressure ±10%.
Diffusivity of water vapor in air
Dv = 0, 211 ∗ (T/273, 15K)1,94 ∗ 10−4m/s2 (2.4)
as given in [110].
Vapor pressure over water
ln(pw/Pa) = 54, 842763 − 6763, 22KT
− 4, 210ln(T/K) + 3, 67 ∗ 10−4T/K
+ tanh(0, 0415(T/K − 218, 8))∗ (2.5)
(53, 878 − 1331, 22KT
− 9, 44523ln(T/K) + 0, 014025T/K) (2.6)
for 123K < T < 332Kas given in [94].
Vapor pressure over ice Ih (commonly found in nature)
pice = e28,9074−6143,7K/T Pa (2.7)
as given in [94].
Surface tension of water
σw = 235, 8 ∗ 10−3(647, 15K − T
647, 15K )1,256 ∗ (1 − 0, 625 ∗ 647, 15K − T
647, 15K )N/m (2.8)
as given in [149].
Density of supercooled water
ρw = 0, 99986 + 6, 690 ∗ 10−5 ∗ T∗ − 8, 486 + 10−6 ∗ T 2∗
+ 1, 518 ∗ 10−7 ∗ T 3∗ − 6, 9484 ∗ 10−9 ∗ T 4
∗
− 3, 6449 ∗ 10−10T 5∗ − 7, 497 ∗ 10−12 ∗ T 6
∗ g/cm3 (2.9)
with T∗ = T − 273, 15K as given in [46].
22 Theory
Latent heat of fusionLm = 333500 J/kg (2.10)
Melting point of water
Tm = 273, 16 − 7, 38 ∗ 10−8 ∗ p/Pa − 1, 55 ∗ 10−16(p/Pa)2 (2.11)
with T∗ = T − 273, 15K. Second grade polynomial fit to the data of [49].
Viscosity of water
ηw(p) = 2, 4055 ∗ 10−5exp(p ∗ 4, 42 ∗ 10−4bar−1+4753 J
mol–p ∗ 9, 565 ∗ 10−1 Jmol bar
8, 314 Jmol K(T − 139, 7K − p ∗ 1, 24 ∗ 10−2 K
bar)(2.12)
as given in [81].
For all equations, [p] = Pa and [T ] = K if not stated otherwise.
2.1.2 Water droplet freezing
The process of droplet nucleation in the atmosphere is described in chapter 1.2. Thefollowing considerations deal with the behavior of a droplet in which ice nucleation hastaken place.
2.1.2.1 First freezing step
Contact-free captured pure water droplets (see chapter 2.3) in the size range of 40-100 µm can be supercooled to -36°C [30] before the metastable water phase breaksdown after seconds due to statistical density fluctuations. Once this or ice nucleationby another source takes place (see chapter 1.5), ice propagates from this point. It “issupposed that only a fraction α of the total sites in the crystal surface are availablefor molecular attachment at a given undercooling” [51] which results in different iceshapes: a morphology diagram is presented in [125], and [126] found that there is a“temperature dependence of the fractal dimension df of the ice-crystal contour” in icepropagation experiments in supercooled water.
The propagation speed of ice in water is dependent on the temperature: the colderthe water, the faster the foremost tip of a dendrite grows. An overview of literaturepropagation speeds of ice in supercooled water vice, generally of the form vice = a∆T b
2.1 Water 23
with coefficients a and b for supercoolings ∆T , is given in table 5.1. [72] presented atheory of dendritic ice crystal growth based on diffusion of water molecules onto theice surface with the assumptions that the crystal is a paraboloid of revolution andsurface kinetics is infinitely fast. They proposed “that the maximum-velocity principleconventionally used in theories of dendritic crystal growth be replaced by a stabilitycriterion of the form viceρ
2 = constant, where vice is the growth velocity and ρ is thetip radius.” A comparison between theoretical and experimental ice propagation speedsshowed a good agreement for supercoolings lower than ≈8°C and an overestimation fordeeper temperatures for this supposedly “universal law of dendritic growth velocities”[73]. The measurements of [124] showed the same result; according to [127] the deviationin the “rate of molecular rearrangement at the interface from liquid state to solid state” is“caused by effect of surface kinetics”: the movement speed of water molecules is reducedat colder temperatures, solidification is slowed. The measurements by [87] suggest thatthe point at which ice growth becomes even slower with deeper temperatures is at -37°C.Depending on the observed volume, this first freezing step may be very fast; the timefor the first freezing step in a droplet of diameter 2a may be estimated with
t1 = 2a/vice, (2.13)
with vice being up to ≈ 0, 5m/s at -35°C (as measured in this thesis). Due to the releaseof latent heat, only a fraction
fice =Tmˆ
T
cp,w(T ′)/LmdT′ ≈ (Tm − T )/80K (2.14)
of a volume of supercooled water at the temperature T is turned into ice during thisgrowth, with the melting temperature of ice Tm = 273, 15K, the specific heat of water cp,w
and the latent heat of fusion Lm. For the remaining water volume Vliq = Vdrop ∗ (1−fice)to freeze, heat exchange with the environment has to take place.
2.1.2.2 Second freezing step
It is assumed that the subsequent heat exchange occurs via an ice-air interface which willbe true after a short time after the first freezing step is finished. For the calculations,described in more detail in [110], the droplet temperature is set at 0°C; temperatureequilibrium in the droplet can be assumed because of the fast conduction of heat inwater compared to air (kwater/kair = O(1000)). The heat Qcon,ice conducted through theice shell is assumed to be equal to the heat of fusion Qice of water turned into ice in the
24 Theory
droplet:
Qcon,ice = 4πkice(Tm–Ta) ar
a − r= 4πρwLm(1 − fice)r2 dr
dt= Qice, (2.15)
with the heat conductivity of ice kice, the droplet surface temperature Ta and the radialposition of the ice-water boundary r. The heat flow through the ice shell is in turnassumed to be equal to the heat loss Qcon,air to the environment by sublimation andheat conduction:
Qcon,ice = 4πkice(Tm–Ta) ar
a − r=
4πakair(Ta–T∞) + 4πaLsDv(ρv,a − ρv,∞) = Qcon,air. (2.16)
The vapor density difference ρv,a − ρv,∞ of water in air at the droplet surface and in afar-away distance ∞ can be approximated by the averaged vapor density temperaturegradient at ice saturation:
LsDv(ρv,a − ρv,∞) → LsDv(Ta–T∞)(dρv
dT)sat,i. (2.17)
Assuming such an environment, it follows that
kice(Tm–Ta) ar
a − r= (Ta–T∞)(kair + LsDv(dρv
dT)sat,i). (2.18)
Now Ta can be removed from the equations, and it follows
ρwLm(1−fice)Tm−T∞
(kair + LsDv)(dρv
dT)sat,i
r2
adrdt
= (1 − kair+LsDv( dρvdT
)sat,i
kice+ kair+LsDv( dρv
dT)sat,i
kice
ar)−1, (2.19)
with the rescalings y = r/a , m = kair+LsDv( dρvdT
)sat,i
kiceand t2 = ρwLm(1−fice)a2
3(Tm–T∞)(kair+LsDv( dρvdT
)sat,i)the equation becomes
3t0dy
dt= − 1
(1 − m)y2 + my. (2.20)
Integration to the total freezing time t2 ⇔ y = 1gives
t2 = t0(1 + m/2) ≈ t0, (2.21)
2.1 Water 25
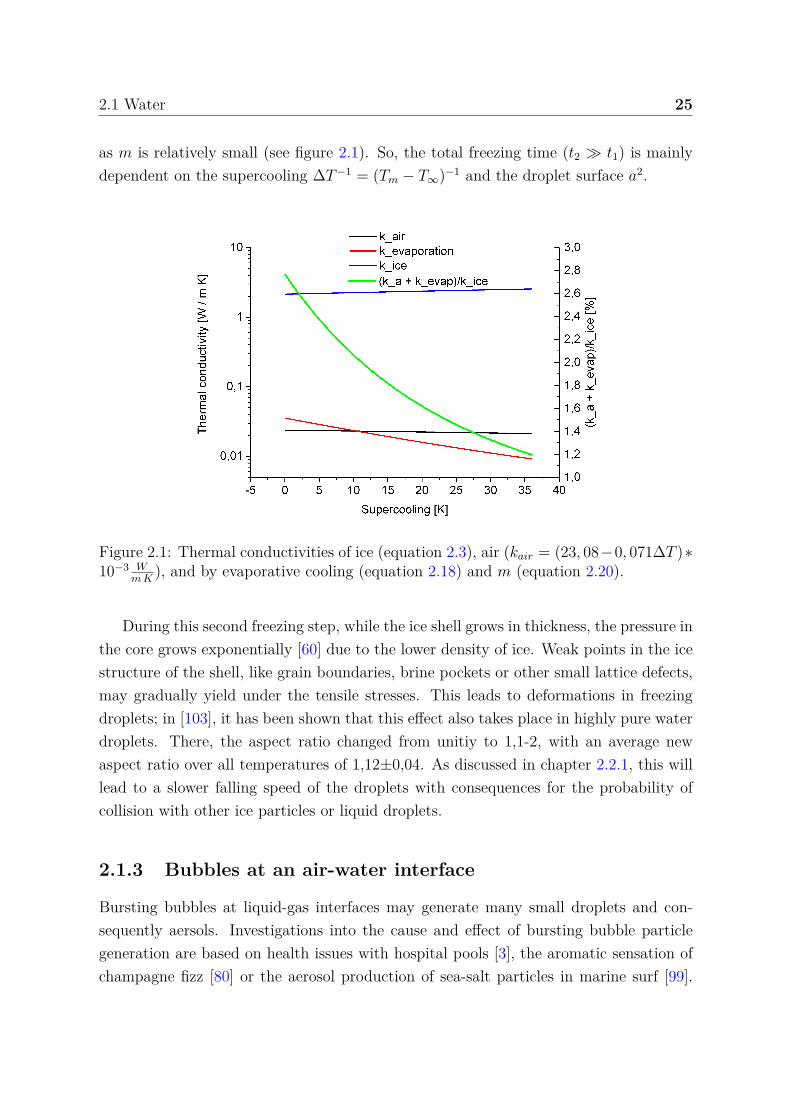
as m is relatively small (see figure 2.1). So, the total freezing time (t2 ≫ t1) is mainlydependent on the supercooling ∆T −1 = (Tm − T∞)−1 and the droplet surface a2.
Figure 2.1: Thermal conductivities of ice (equation 2.3), air (kair = (23, 08−0, 071∆T )∗10−3 W
m K), and by evaporative cooling (equation 2.18) and m (equation 2.20).
During this second freezing step, while the ice shell grows in thickness, the pressure inthe core grows exponentially [60] due to the lower density of ice. Weak points in the icestructure of the shell, like grain boundaries, brine pockets or other small lattice defects,may gradually yield under the tensile stresses. This leads to deformations in freezingdroplets; in [103], it has been shown that this effect also takes place in highly pure waterdroplets. There, the aspect ratio changed from unitiy to 1,1-2, with an average newaspect ratio over all temperatures of 1,12±0,04. As discussed in chapter 2.2.1, this willlead to a slower falling speed of the droplets with consequences for the probability ofcollision with other ice particles or liquid droplets.
2.1.3 Bubbles at an air-water interface
Bursting bubbles at liquid-gas interfaces may generate many small droplets and con-sequently aersols. Investigations into the cause and effect of bursting bubble particlegeneration are based on health issues with hospital pools [3], the aromatic sensation ofchampagne fizz [80] or the aerosol production of sea-salt particles in marine surf [99].
26 Theory
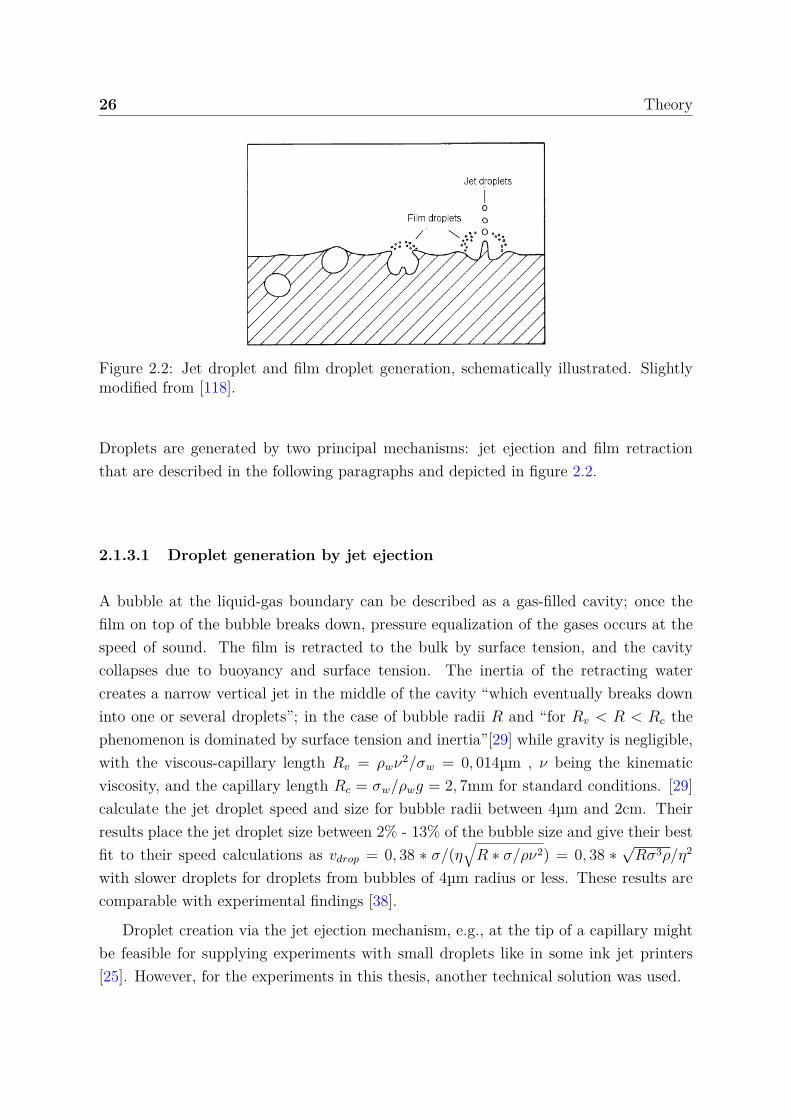
Figure 2.2: Jet droplet and film droplet generation, schematically illustrated. Slightlymodified from [118].
Droplets are generated by two principal mechanisms: jet ejection and film retractionthat are described in the following paragraphs and depicted in figure 2.2.
2.1.3.1 Droplet generation by jet ejection
A bubble at the liquid-gas boundary can be described as a gas-filled cavity; once thefilm on top of the bubble breaks down, pressure equalization of the gases occurs at thespeed of sound. The film is retracted to the bulk by surface tension, and the cavitycollapses due to buoyancy and surface tension. The inertia of the retracting watercreates a narrow vertical jet in the middle of the cavity “which eventually breaks downinto one or several droplets”; in the case of bubble radii R and “for Rv < R < Rc thephenomenon is dominated by surface tension and inertia”[29] while gravity is negligible,with the viscous-capillary length Rv = ρwν2/σw = 0, 014µm , ν being the kinematicviscosity, and the capillary length Rc = σw/ρwg = 2, 7mm for standard conditions. [29]calculate the jet droplet speed and size for bubble radii between 4µm and 2cm. Theirresults place the jet droplet size between 2% - 13% of the bubble size and give their bestfit to their speed calculations as vdrop = 0, 38 ∗ σ/(η
√R ∗ σ/ρν2) = 0, 38 ∗
√Rσ3ρ/η2
with slower droplets for droplets from bubbles of 4µm radius or less. These results arecomparable with experimental findings [38].
Droplet creation via the jet ejection mechanism, e.g., at the tip of a capillary mightbe feasible for supplying experiments with small droplets like in some ink jet printers[25]. However, for the experiments in this thesis, another technical solution was used.
2.2 Aerosols 27
2.1.3.2 Droplet generation by film retraction
Once a hole, reportedly of a “diameter [...] typically larger than the film thickness” h
[151] has nucleated in a bubble film of density ρ by density fluctuations in the film, thefilm edges retract towards the bulk under the surface tension σ with the Taylor-Culickretraction speed vT −C =
√2σ/ρh [137]. This rim’s mass increases while it expands,
resulting in a toroid shape, and its thickness varies sinusoidally along the rimline dueto a Rayleigh-Plateau instability which is, e.g., responsible for the break-up of waterfalls . Due to their inertia, the retraction speed of those thicker stretches of the filmis lower, or “surface tension is insufficient to keep bits of the rapidly advancing toroidfrom tearing loose” [131]: liquid ’fingers’ form from the rim and pinch off at certainlength, which is again caused by a Rayleigh-Plateau instability. These ligaments thenget aerosolized with a velocity tangential to the bubble curvature.Additionally, for largebubbles (in which the rim of the hole propagates over a distance> (ρ/ρa)h), it hasbeend observed that the film close to the rim may, “just like a flag edge flaps in the wind[be] successively accelerated on both sides perpendicularly to its plane, inducing filmthickness modulations and centrifuging liquid ligaments that finally pinch off to formthe observed spray”, which is based on a Kelvin-Helmholtz instability [151].
The mean drop size of film droplets from bubbles of radius R has been found to beproportional to R3/8h5/8 [78].
Another possible case has been shown by experiments and simulations by [8]. Inbubbles of η with Reynolds numbers Re = ρvT −CR/η > 1, air may get entrappedbetween the torus and the bubble film at the base and may form secondary bubblesfrom which new jet droplets and film droplets can result.
2.2 Aerosols
2.2.1 Particle behavior in air
An aersosol denotes a solid or liquid particle that is located in air (latin: aer – air,solutio – solution). While this may mean any cohesive matter apart from the solventgas, including large molecules like volatile organic compounds (VOCs) that may originatefrom plants to passenger airplanes, it generally refers to particles in the range of severalnanometers to fractions of millimeters. This is rooted in the dwelling time of particles ina volume of air before deposition, i.e. the removal of the particle to a surface takes place.For small particles (< 100nm), especially so-called secondary aerosols that nucleate fromsingle molecules and grow by agglomeration with other molecules (e.g., sulphur dioxide
28 Theory
with water), diffusion is the limiting process. For larger particles (> 1µm), generallyso-called primary aerosols which existed before becoming airborne (e.g., by updraftsin dust storms or volcanic eruptions), gravitational pull to the earth’s surface is thelimiting process. While earth’s gravitation exerts a force on all particles, their fallingspeed is limited by air resistance which may be calculated via the Stokes drag forcewhich describes the force on a moving sphere in a viscous medium:
Fd = −3πηairvdξ/CC (2.22)
with ηair being the air viscosity, v being the spherical particle’s velocity relative to theair and d its diameter. ξ is a correction factor for non-spherical particles in which case d
denotes the characteristic length of the particle; while there exist aerodynamic particleshapes that reduce air resistance in comparison to a sphere, generally ξ > 1. ξ can bea funtion of time, as the tumbling motion of a falling sheet of paper or a falling plateof styrofoam show. CC denotes the Cunningham slip correction [20], which accounts forthe fact that Stokes drag assumes a no-slip condition (v = 0) at the particle surface. ForKnudsen numbers Kn = λ/d > 0, 02, with λ being the free path length of air molecules,this assumption no longer holds true. The correction factor is
CC = 1 + 2λ/d ∗ (A1 + A2 ∗ exp(−A3d/λ)) (2.23)
with λ =67nm under normal conditions and A1 = 1, 257, A2 = 0, 400 and A3 = 1, 10[21]. CC exceeds 1, 05 for particles smaller than ≈ 3, 5µm. In the case of small Reynoldsnumbers Re = vL/ν < 1, with L being the characteristic length of the system (here:the particle diameter), v the flow speed of the liquid and ν being its kinematic viscosity,the flow can be assumed to be laminar, which means that turbulent resistance can beneglected; with a a kinematic viscosity of air ν = 1, 48×10−5m2/s at 1 atm and 25°C anda flow speed of 0, 1m/s, this is true for particles < 150µm. As Fd ∼ −v, there is a criticalsedimentation velocity vsed at which the gravitational force Fg = mg = π/6d3 ∗ ρpg ofa spherical particle of density ρp and its Stokes drag force cancel out. This velocity iscalculated by equalizing the gravitational force and the Stokes drag and solving for thespeed:
vsed = mgCC/(3πηξd) = ρpgCCd2/18η (2.24)
It is to be noted that η = η(p, T ) and CC(Kn) = Cc(Kn(p, T )), which becomes relevantfor atmospheric altitudes h higher than ≈ 5 km as the air pressure scales with p =p0exp(−h/h0), with the pressure at sea level p0 and the scale height h0 = 7, 31km for
2.2 Aerosols 29
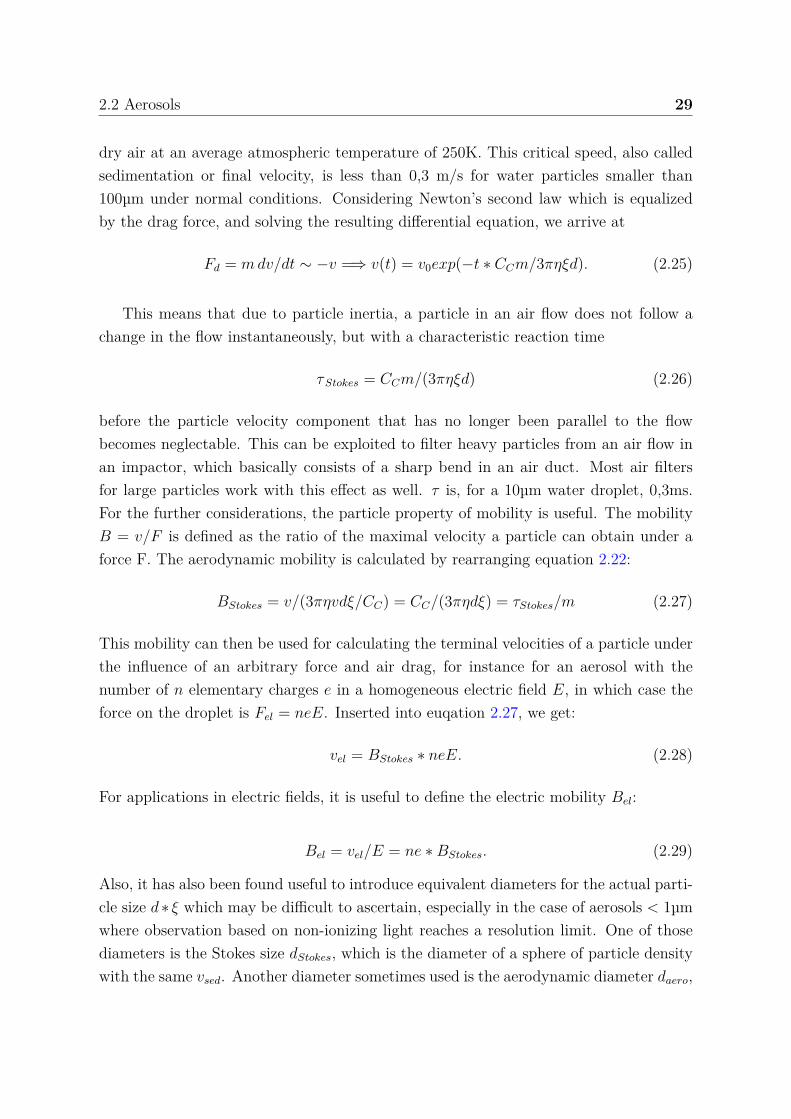
dry air at an average atmospheric temperature of 250K. This critical speed, also calledsedimentation or final velocity, is less than 0,3 m/s for water particles smaller than100µm under normal conditions. Considering Newton’s second law which is equalizedby the drag force, and solving the resulting differential equation, we arrive at
Fd = m dv/dt ∼ −v =⇒ v(t) = v0exp(−t ∗ CCm/3πηξd). (2.25)
This means that due to particle inertia, a particle in an air flow does not follow achange in the flow instantaneously, but with a characteristic reaction time
τStokes = CCm/(3πηξd) (2.26)
before the particle velocity component that has no longer been parallel to the flowbecomes neglectable. This can be exploited to filter heavy particles from an air flow inan impactor, which basically consists of a sharp bend in an air duct. Most air filtersfor large particles work with this effect as well. τ is, for a 10µm water droplet, 0,3ms.For the further considerations, the particle property of mobility is useful. The mobilityB = v/F is defined as the ratio of the maximal velocity a particle can obtain under aforce F. The aerodynamic mobility is calculated by rearranging equation 2.22:
BStokes = v/(3πηvdξ/CC) = CC/(3πηdξ) = τStokes/m (2.27)
This mobility can then be used for calculating the terminal velocities of a particle underthe influence of an arbitrary force and air drag, for instance for an aerosol with thenumber of n elementary charges e in a homogeneous electric field E, in which case theforce on the droplet is Fel = neE. Inserted into euqation 2.27, we get:
vel = BStokes ∗ neE. (2.28)
For applications in electric fields, it is useful to define the electric mobility Bel:
Bel = vel/E = ne ∗ BStokes. (2.29)
Also, it has also been found useful to introduce equivalent diameters for the actual parti-cle size d ∗ ξ which may be difficult to ascertain, especially in the case of aerosols < 1µmwhere observation based on non-ionizing light reaches a resolution limit. One of thosediameters is the Stokes size dStokes, which is the diameter of a sphere of particle densitywith the same vsed. Another diameter sometimes used is the aerodynamic diameter daero,
30 Theory
which describes a sphere with a density ρw = 103kg/m3 with the same vsed. By insertingthese diameters into equation 2.24, we get
vsed = mgCC(d)3πηξd
= ρpgCC(dStokes)d2Stokes
18η= ρwgCC(daero)d2
aero
18η(2.30)
or the identities
mCC(d)πξd
= ρpCC(dStokes)d2Stokes
6 = ρwCC(daero)d2aero
6 . (2.31)
2.2.2 Aerosol-substrate interaction
Apart from inertia or diffusion, an aerosol may also be attracted to another particleor a substrate via electric or phoretic forces. For charged particles, Coulomb attractionplays a role with the force FC = qpqs/4πϵ0ϵr
2ds, with the particle charge qp and substrate
charge qs, the particle-substrate distance rds and the vacuum and medium’s permittivityϵ0 and ϵ .
If a charged substrate is present, a dipole may be induced in the aerosol, causing anattractive dipole force. The force depends on the polarizability ϵp of the particle, whichis a measure of charge mobility on the particle surface, and its size dp. The charge on thesubstrate first induces the dipole in the particle which is then attracted to the substrate,which leads to a higher distance dependency than the usual Coulomb attraction. Thedipole force is given by
FDip = (ϵp − 1)(ϵp + 2)
d2pq2
s
16πϵ0r5ds
.
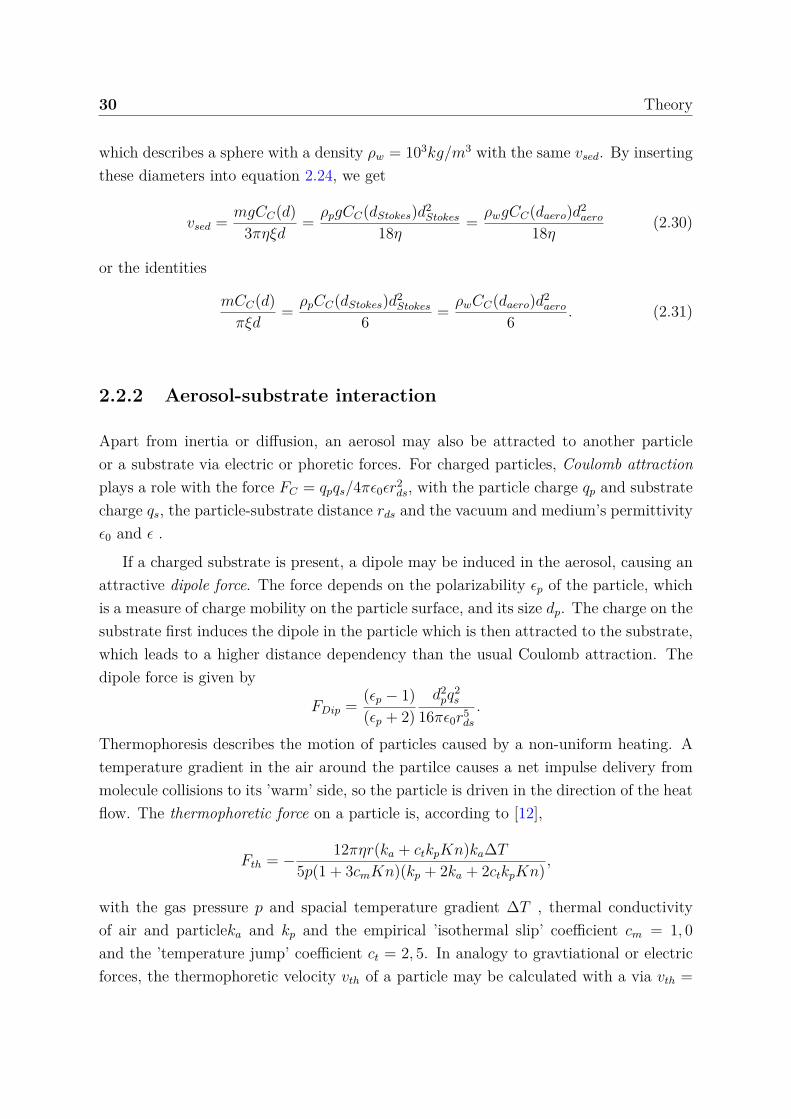
Thermophoresis describes the motion of particles caused by a non-uniform heating. Atemperature gradient in the air around the partilce causes a net impulse delivery frommolecule collisions to its ’warm’ side, so the particle is driven in the direction of the heatflow. The thermophoretic force on a particle is, according to [12],
Fth = − 12πηr(ka + ctkpKn)ka∆T
5p(1 + 3cmKn)(kp + 2ka + 2ctkpKn) ,
with the gas pressure p and spacial temperature gradient ∆T , thermal conductivityof air and particleka and kp and the empirical ’isothermal slip’ coefficient cm = 1, 0and the ’temperature jump’ coefficient ct = 2, 5. In analogy to gravtiational or electricforces, the thermophoretic velocity vth of a particle may be calculated with a via vth =
2.2 Aerosols 31
−((Bthka∆T )/p) with the mobility
Bth = 0, 4CC(ka + 2, 5kpKn)(1 + 3Kn)(kp + 2ka + 5kpKn) .
Finally, in a droplet-aerosol system, water vapor flow (or ’Stephan flow’) from or to thedroplet may cause drag in particles, the so-called diffusiophoretic force; according to[110], the diffusional drag force FDf on a particle in the proximity of a droplet due towater vapor flow is
FDf = −7, 15πηrDv∆ρv/CCρa
with the diffusivity of water vapor Dv , the water vapor density ρv and the air densityρa . The diffusional drag force is basically a modified Stokes drag force, in which thespeed of the flow is dictated by the diffusional flow from the droplet.
Considering all these forces together with the Stokes drag, for a charged droplet inan aerosol flow, the tracjectory x of a particle may be calculated via
mx = qpqs
4πϵ0ϵr2ds
+ (ϵp − 1)(ϵp + 2)
d2pq2
s
16πϵ0r5ds
− 12πηr(ka + ctkpKn)ka∆T
5p(1 + 3cmKn)(kp + 2ka + 2ctkpKn)
+ 0, 4CC(ka + 2, 5kpKn)(1 + 3Kn)(kp + 2ka + 5kpKn) − 7, 15πηrDv∆ρv
CCρa
− 3πηvdξ
CC
|v − ˙x| (2.32)
with the velocity vector v in the direction of the air flow and the velocity vector ˙x inthe direction of the particle movement. With this differential equation for the motion ofa particle, the collection efficiency of a droplet of radius rd in an aerosol stream may becalculated. Under the conditions of the experiments in this thesis, the phoretic forcesare negligible.
The collection efficiency is defined as ζ = πrc2/π(rd + rp)2 with the collection radius
rc. πr2c denotes the cross section of the air flow in which particles of radius rp are
collected by the droplet; attractive forces between particle and droplet enlarge this crosssection. For uncharged droplets and small particles, the efficiency may well be ≪ 1.Once the collection efficiency is calculated and the particle density in the flow Γp andthe air volume flow Ja are measured, the expected collection rate nc of particles hittingthe droplet per time can be calculated. The collection rate is given by the numberof particles passing through the effective cross section via the product of droplet crosssection, collection efficiency, particle density in the flow and air volume flow:
nc = πr2dζJaΓp. (2.33)
32 Theory
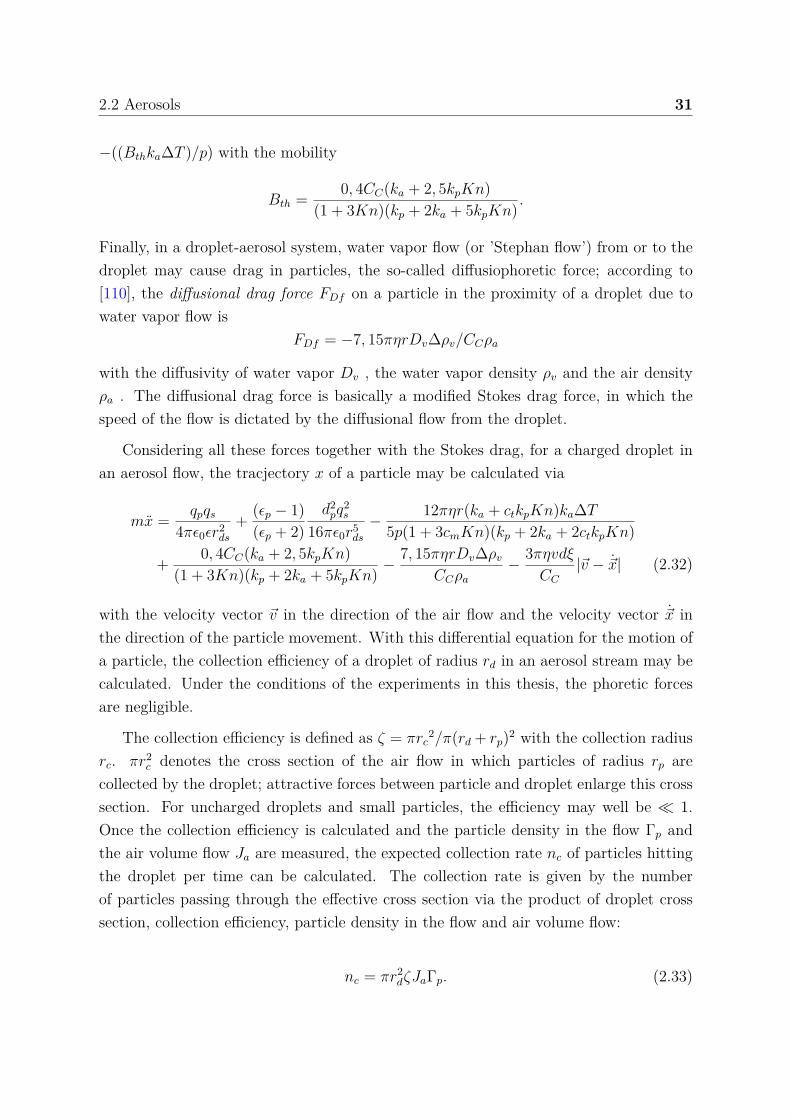
nc is subjected to statistical fluctuations in Γp , so the number of particles on a dropletis only nc ∗ t for large t.
2.2.3 Aerosol position on a water surface
Once an aerosol particle has hit a droplet, its position may be of interest – namely ifit stays on the surface or gets immersed into the droplet’s bulk volume. In general, theposition of a solid particle relative to an unperturbed water surface is governed by theYoung equation for the surface tensions which defines the contact angle 0 ≤ θc ≤ π:
σpw = σpa − σwa ∗ cos(θc) (2.34)
with the surface tensions between particle and water σpw, between particle and air σpa
and between water and air σwa . For curved water interfaces like droplets, „that equilib-rium contact angle is given by the Young’s equation, whereas the minimized adsorptionenergy is a function of curvature“ [65].
The contact angle may be observed, e.g., with an even substrate and a water droplet;θc is then the angle between the subtrate and the curvature of the droplet at the water-air-substrate interface line. There are more sophisticated methods for measuring thecontact angle, to be found, e.g., in the review on contact angles and adhesion by [40].According to [100], the depth h to which a massless spherical particle of radius r issubmersed relative to the water-air interface is given by
h = r ∗ (1 − sin(π
2 − θc)) (2.35)
with a water-particle-air interface line of radius r0 = r ∗ sin(θc). So, if only surfacetensions are considered, non-soluble or not completely wettable particles (θc < π ) remainat the water-air boundary. This effect is used by water striders, commonly also called’Jesus bugs’ (fam. Gerridae), to walk on water surfaces, or by mosquito larvae dwellingin water which stick to the water surface for breathing, two phenomena observable innature on ponds or lakes. This shows the surface tension to be a powerful effect, as hasalready been reported from experiments with gold foil in water by Galileo Galilei in 1612[28]. The water surface may be deformed by gravitational pull on the particle, whichleads to a variation in the particle position relative to the unperturbed water surface ofh′ = F ′/πσwa (see [100] for detailed derivation), with the force F ′ = Fg–Fb being thedifference between the gravitational force of the particle with density ρ, Fg = −4/3πr3ρg,
2.3 Electrodynamic balance 33
and the buoyancy force of the immersed fraction of the particle
Fb = ρwg(π/6)h(3r20 + h2) = ρwg(π/6) ∗ r3 ∗ (1 − cos(θc)) ∗ (3sin2(θc) + (1 − cos(θc))2)
which is calculated by assuming a spherical cap volume Vcap = (π/6)h(3r20 + h2) of the
particle being submersed in water of density ρw; for aerosol particles of, e.g., 300 nmdiameter and clay mineral source (ρ ≈ 2, 6g/cm3 [102]), this deformation is h′ ≪ 1nm.
2.3 Electrodynamic balance
2.3.1 Levitation of a single water droplet
For the following discussion, a mechanism for the levitation of single water droplets isdiscussed. While the physics apply to charged masses in general, the expression ’droplet’is used throughout these considerations. Presuming a droplet of mass m with charge q, asuperposition of two electric fields can achieve levitation. The subsequent argumentationfollows [103] and can be found in more detail in [119, 155].
2.3.2 Compensation of gravity and air drag
To prevent loss by gravity or the drag of an aerosol stream by the droplet, a quasi-static electric field E is well suited. The electric force Fe = qE of an electric fieldE on the droplet should be equal to the gravitational force of earth Fg and the dragforce of air of viscosity ηair, which is given by Stokes’ drag Fd for sufficiently slow airflows with Reynolds numbers Re = 2rv/νair ≪ 1 (kinematic viscosity of air of densityρair: νair = ηair/ρair, air velocity v) and droplets with a radius r small enough to keepspherical shape under the drag force:
Fe = qE = mg + 6πηrvr = Fg + Fd. (2.36)
An easy solution is given in the case of a plate capacitor, where E = U0/d for thepotential U0 and the distance d between the plates.
2.3.3 Compensation of lateral movement
A simple plate capacitor is unsuitable for the capture of moving droplets without exten-sive regulation mechanisms. Considerations on the desired properties of the potentiallead to a more sophisticated experimental setup. To keep a droplet in a stable position
34 Theory
x0, the resulting force on the droplet at this point has to be zero, while the potential hashave a minimum to make it an attracting point. This reasoning leads to the followingdifferential equations:
∇Φ(x0) = 0∆Φ(x0) > 0 (2.37)
An attractive charge at x0 would defeat the purpose of continued droplet storage due tocharge equalization, but an electrostatic field with the desired property ∆Φ(x0) = ρ/ϵ0
with charge density ρ and vacuum permittivity ϵ0 would violate the second condition.The solution for keeping both conditions is an electrodynamic field. For a sufficientlyhigh oscillation frequency ω, the large inertia of the droplet will prevent movementexceeding, e.g., half a droplet diameter. The droplet is then captured in a pseudo-potential that results from averaging the oscillations over time, which satisfies ∆Φ(x0) >
0 on the timescale greater than an oscillation period without violating ∆Φ(x0) = 0 atany given point in time. In an alternating field with an amplitude E0(z) along thedirection z, the movement equation of z is given by
mz = qE0(z)cos(ωt). (2.38)
z(t) may be split up into a ’slow’ part averaged over an oscillation period z (t) and afast oscillation part ζ(t), so
z(t) = z(t) + ζ(t) = ω
2π
t+2π/ωˆt
z(t′)dt′ + ζ0cos(ωt). (2.39)
For field inhomogeneities E(z) that are small on the scale of the amplitude ζ0, themovement equation can be series expanded into
mz = m¨z(t) + mζ(t) = qE(z, t) + qζ∂E(z, t)
∂z(2.40)
while neglecting higher orders.
In the case of small displacements, ζ(t) follows the alternating field at z , so
mζ(t) = qE(z, t) (2.41)
2.3 Electrodynamic balance 35
and consequentlyζ(t) = − q
mω2 E0(z)cos(ωt). (2.42)
The overall time average of force on the droplet is then, considering cos(ωt) = 0 andcos2(ωt) = 1
2 ,
mz = qE0(z)cos(ωt) − q2
mω2 E0(z)cos2(ωt)∂E(z, t)∂z
= −14
q2
mω2∂
∂zE2
0(z). (2.43)
This force is equal to the negative gradient of the corresponding potential, and thedeliberations are analogous in all space directions, so
Φ(¯x) = 14
q2
mω2 E20(¯x). (2.44)
One of the many potentials that satisfies the Laplace equation ∆Φ(x0) = 0 with x0 = O
is given by the quadrupole solution
Φ = Φ0(αx2 + βy2 + γz2) (2.45)
withα = β = −2γ. (2.46)
So,Φ(x, y, z) = αΦ0(x2 + y2 − 2z2) ⇐⇒ Φ(r, z) = αΦ0(r2 − 2z2). (2.47)
This potential can be generated by electrodes in the shape of the equipotential surfaceswhich is how it was realized in the experiments conducted in this thesis. There areseveral other possibilities to realize particle levitation with electrodynamic fields thatare presented in [22]. A closer look at the ramifications of this solution specifies theconditions under which stable storage in possible, e.g., what a ’sufficiently high oscillationfrequency ω’ or what the size of a droplet with ’large inertia’ is. Again, a more detaileddescription of the phase space of stabilizing conditions can be found in [119, 155].
2.3.4 Experimental realization
The infinitely large equipotential surfaces that solve equation 2.47 are realized in gold-covered brass with a diameter ≈ 5cm, a height z ≈ 2cm and α = 1/(r2
0) = 0, 5cm. Themiddle electrode has 8 equidistant drilling holes of 2mm diameter through the curvatureclosest to the center for droplet injection and observation, the top and bottom electrodes
36 Theory
have each one drilling hole of 3mm diameter through the curvature closest to the EDBcenter for aerosol streaming, ice nucleation and pressure equalization. Those drillingholes do not impede the intended electrode function. The top and bottom electrode areseparated from the middle electrode by a heat-conductive but electrically resistive ringof aluminum nitride to prevent spark gap conduction.
The experimental setup is discussed in more detail in the experimental section.
Chapter 3
Experimental setup and methods
In this chapter, the experimental setup is surveyed and the principal measurement meth-ods are described.
The section concerning the setup begins with the basic experimental setup for levi-tating single water droplets, as it was used in [103]. A closer look is given to the dropletgenerator that was used in the experiments. The experimental setup has been modi-fied to lead an aersosol stream by a captured water droplet, so the aerosol system isdescribed. Last in the setup section, and already on the threshhold to the methodssection, is a description of the temperature correction employed for the measurements.
The methods section begins with a description of the general experimental procedurewhich is followed by the techniques used to evaluate the recordings of freezing droplets.
3.1 Experimental setup
The basic setup of the experiments conducted in this thesis consisted of a droplet injec-tor and an electrodynamic balance (EDB) based on the principles laid out in [104] asformulated in chapter 2.3.
A detailed description of the setup can be found in [103].
3.1.1 Electrodynamic balance and periphery
The basic setup was used for experiments in which the freezing behavior in water sus-pensions of different compositions was investigated.
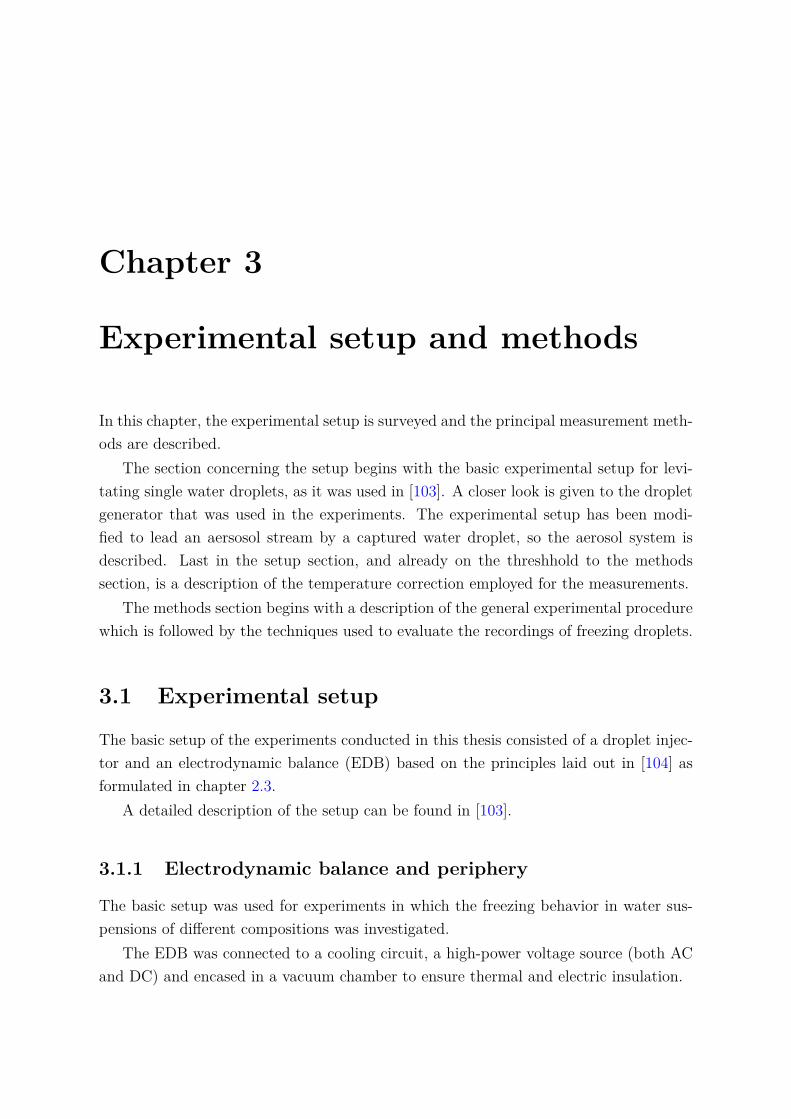
The EDB was connected to a cooling circuit, a high-power voltage source (both ACand DC) and encased in a vacuum chamber to ensure thermal and electric insulation.
38 Experimental setup and methods
Temperature was measured through temperature sensors in contact with the EDBelectrodes.
A CCD array measured the droplet position through the scattered light of a diodelaser illuminating the droplet. This scatter signal was used to regulate the dropletposition through variation of the voltages applied to the EDB electrodes. A CCD cameraat an angle of 90° to the laser beam could be used to measure the droplet diameter viaMie scattering.
A high-powered LED light source was used to illuminate the droplet for the high-speed camera. A microscope objective was employed to enlarge the image of a captureddroplet.
To ensure the option of ice nucleation in water droplets at any temperature, solidcarbon dioxide (“dry ice”) was placed above a chimney through the vacuum chamber tothe EDB center. The carbon dioxide sublimated, cooling laboratory air to temperaturesat which ice was nucleated. Only a slight oversaturation of carbon dioxide relativeto ordinary air was calculated for freezing droplets by this mode of ice nucleation. Acontrollable air flow was used to keep unwanted ice particles out of the EDB.
Droplets were injected from a dispenser placed close to the EDB through a channelin the vacuum chamber around the EDB.
A schematic of the setup is shown in figure 3.1, a list of details on the peripheralinstruments in table 7.1 in the appendix.
(a) Side view of the EDB and the peripheralinstruments.
(b) Top view of the EDB and the peripheralinstruments.
Figure 3.1: Basic setup of the experiments presented in this thesis. Components andtheir function described in chapter 3.1.1.
3.1 Experimental setup 39
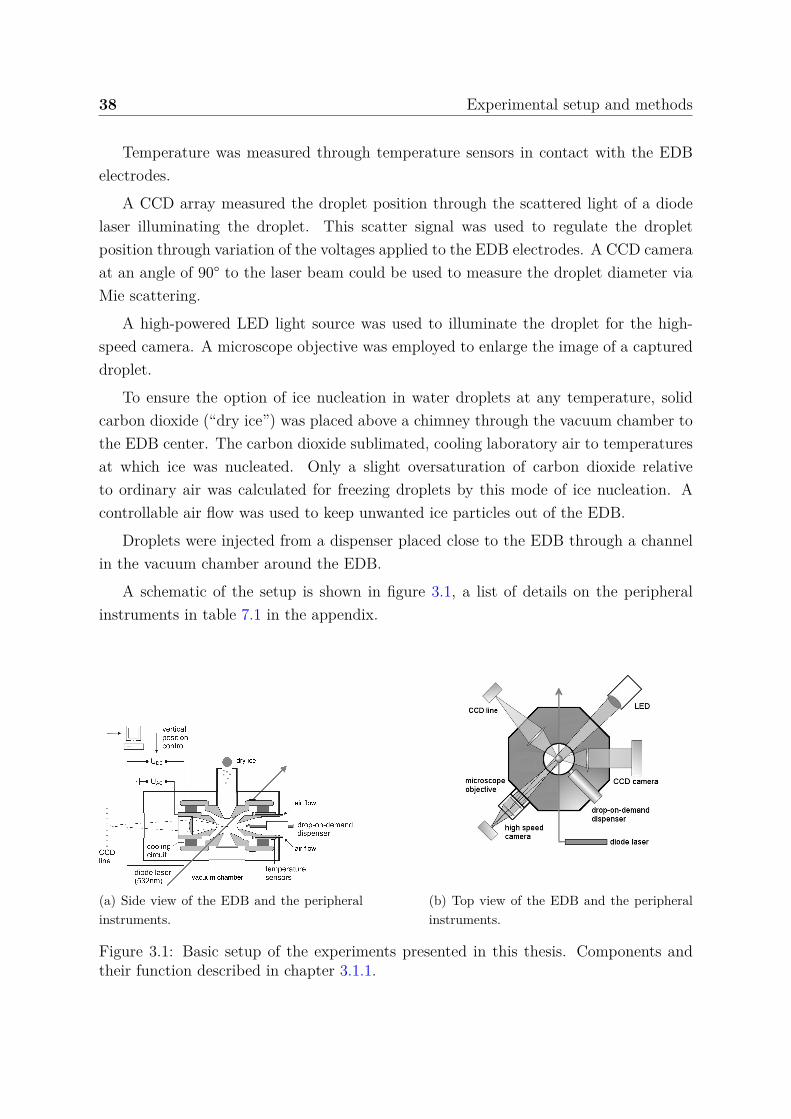
(a) Injector schematic. Reservoirand nozzle are etched into the sil-icon. From: [37]
(b) Diagram of the “pull-push” principle.Pressure wave symbolized on the left, pulseat the piezo crystal on the right. From: [157].
Figure 3.2: Injector shematic and working principle as described in chapter 3.1.2.
3.1.2 Drop-on-demand injector
For droplet creation in the presented experiments, a piezoelectric drop-on-demand in-jector (model SPIP by the company GeSim) was used that works with the so-called“fill-before-fire” or “pull-push principle” as described in detail in [157].
Such an injector essentially consists of a bigger liquid reservoir, a smaller reservoirclose to a piezoelectric element and a channel that leads to a nozzle (see figure 3.2a).
A voltage pulse applied to the piezoelectric element causes it to contract during therising edge of the pulse and generates low pressure in the smaller reservoir. This causesliquid to flow from the bigger reservoir and the channel towards the small reservoir. Theliquid meniscus at the nozzle is pulled into the channel which can be described as thestart of a sound wave that propagates through the channel and the small reservoir.
A pressure wave in a channel system may be reflected if the acoustic impendance Z
changes; Z = ρc/A, with the liquid’s density ρ, its acoustic speed c and the channel crosssection A. The reflection coefficient R and the transmission coefficient T depend on Z asR = (Z2 − Z1)/(Z1 + Z2) and T = 2Z2/(Z1 + Z2) . Assuming c remains constant for thegiven cross-sections Ai, in which case R = A1–A2/(A1 + A2) and T = 2A1/(A1 + A2),the sound wave is reflected at the bigger reservoir (as A2 ≫ A1, with R → −1 andT → 0), runs back to the channel and may push liquid through the nozzle. It shouldbe noted that the speed of sound depends on the compliance β = 1/K, with K beingthe channel material’s bulk modulus: ceff =
√c2
0/(1 + ρc20β); for a speed of sound of
40 Experimental setup and methods
c0 =1480 m/s (in water at 20°C), in a channel consisting of glass, the effective speed ceff
is only 3% lower than the speed of sound in bulk water, though. The effect may becomemore relevant in the case of e.g., graphite channels which have a lower bulk modulusthan glass. The geometry of an injector working according to the pull-push principleis such that the pressure wave from the piezocrystal’s contraction gets reflected backtoward the nozzle.
If the piezoelectric element is discharged in phase with this sound wave runningback, the two pressure waves interfere constructively which increases the flow throughthe nozzle. A diagram of the pressure waves together with the actuation signal at thepiezo crystal is shown in figure 3.2b.
In dependence from voltage, which corresponds to displaced liquid volume, risingtime of the voltage pulse and pulse width, a droplet may separate from the nozzle.With a well-chosen actuation signal, droplet size manipulation in a considerable rangeis possible without changing the injector geometry. To investigate the effect of differentactutation signals, an arbitrary waveform generator was used. The injector was mountedin a vertical position and the tip was observed with a CCD camera. Details on theequipment are listed in table 7.1. Measurements with a variety of signal forms arepresented in chapter 4.1 and discussed in chapter 4.1.
To be captured and stored in an EDB, the droplets from the injector needed to becharged. This was achieved by inducing charges in the water volume of the injector.The first method was placing a metal disc with a drilling hole in the middle close to thetip and applying several hundreds of volts to it, the second was putting the tip of theinjector close to the EDB and choosing the right phase in the alternating high voltagefor droplet ejection. Both methods were employed in the experiments of this thesis. Thesecond method was considered more elegant, but the phase had to be chosen with a highprecision to capture droplets and not have them accelerate onto one of the electrodes.
Due to the proximity of the injector to the EDB, the reservoir needed to be heatedlest freezing in the water destroyed the injector. To this end, a small resistance elementwas fixed to the top glass cover of the injector (see figure 3.2a) with teflon tape andheated by having a small current flow run through it.
3.2 Aerosol system
To broaden the scope of ice multiplication experiments, experiments in which aerosolsimpinge onto droplets were conducted.
To this end, the experimental setup laid out in chapter 3.1.1 was modified. The
3.2 Aerosol system 41
chimney in the top electrode (see figure 3.1a) was connected to a size-selecting aerosolsource with a three-way fitting, the bottom electrode was switched to a chimney whichwas connected to an aerosol counter. A more detailed description of the aerosol setupmay be found in [45].
The combination of an instrument capable of size-selecting from a polydisperse flow(a “classifier”) and a particle counter is called a scanning mobility particle sizer (SMPS).
3.2.1 Aerosol sources
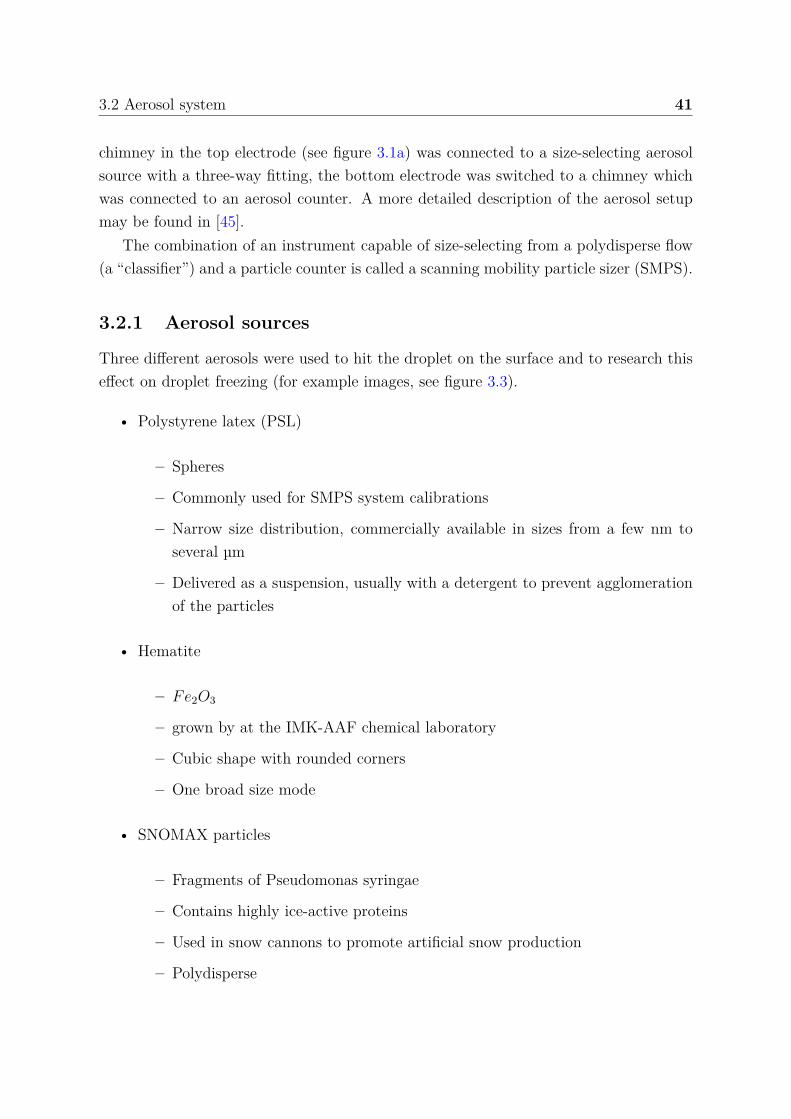
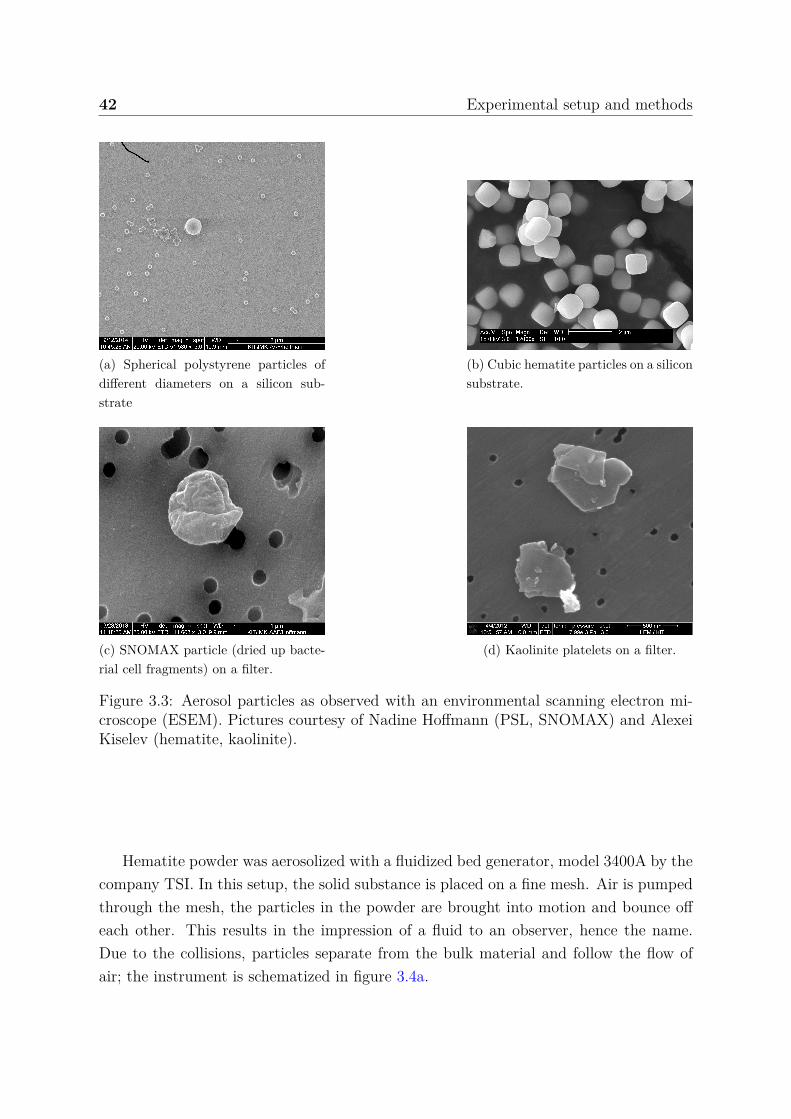
Three different aerosols were used to hit the droplet on the surface and to research thiseffect on droplet freezing (for example images, see figure 3.3).
• Polystyrene latex (PSL)
– Spheres
– Commonly used for SMPS system calibrations
– Narrow size distribution, commercially available in sizes from a few nm toseveral µm
– Delivered as a suspension, usually with a detergent to prevent agglomerationof the particles
• Hematite
– Fe2O3
– grown by at the IMK-AAF chemical laboratory
– Cubic shape with rounded corners
– One broad size mode
• SNOMAX particles
– Fragments of Pseudomonas syringae
– Contains highly ice-active proteins
– Used in snow cannons to promote artificial snow production
– Polydisperse
42 Experimental setup and methods
(a) Spherical polystyrene particles ofdifferent diameters on a silicon sub-strate
(b) Cubic hematite particles on a siliconsubstrate.
(c) SNOMAX particle (dried up bacte-rial cell fragments) on a filter.
(d) Kaolinite platelets on a filter.
Figure 3.3: Aerosol particles as observed with an environmental scanning electron mi-croscope (ESEM). Pictures courtesy of Nadine Hoffmann (PSL, SNOMAX) and AlexeiKiselev (hematite, kaolinite).
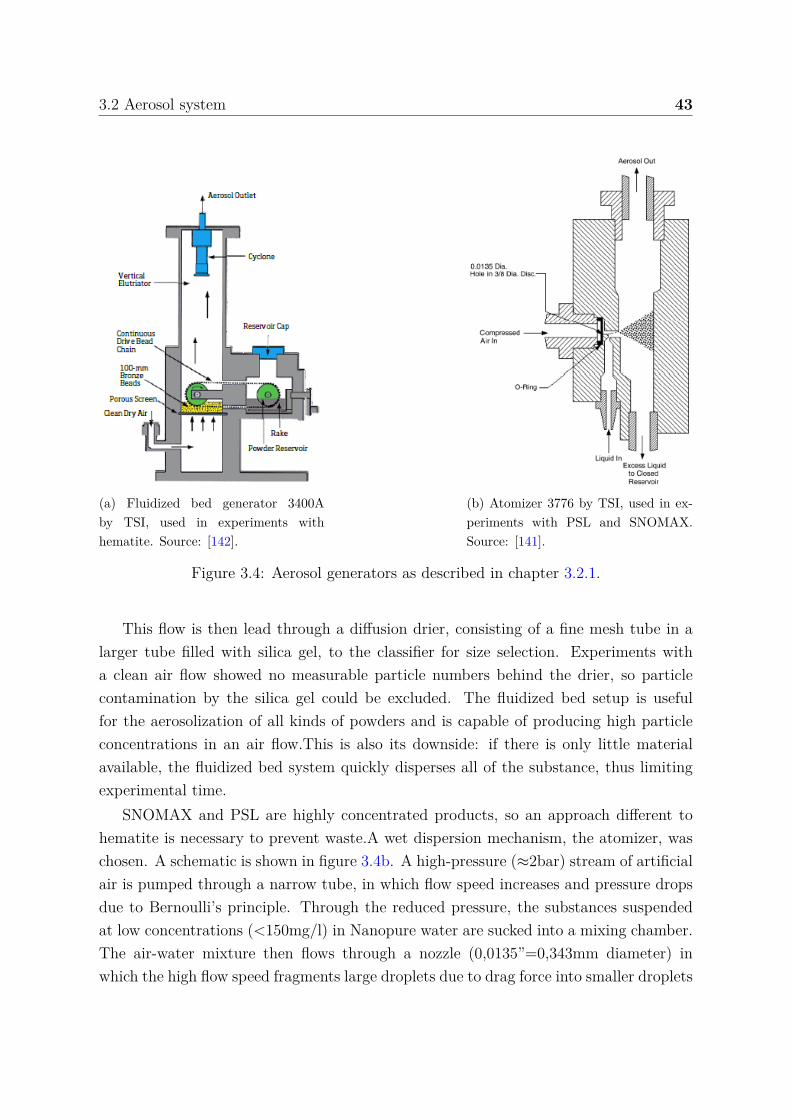
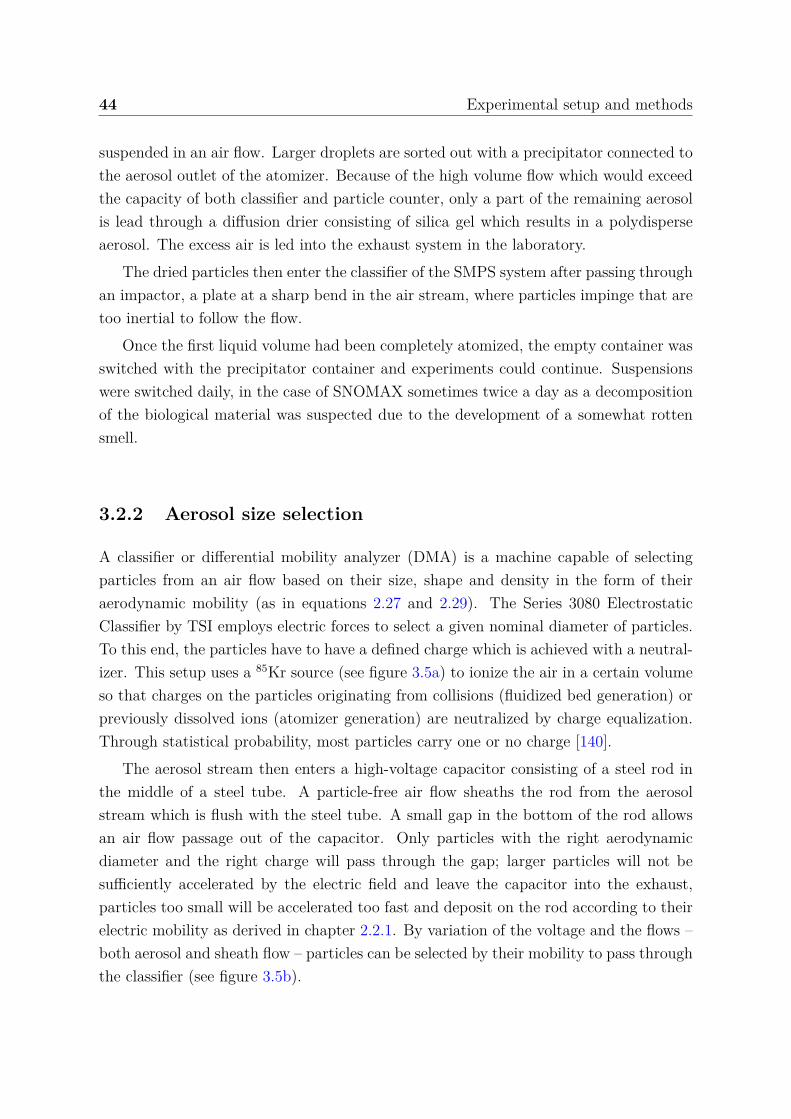
Hematite powder was aerosolized with a fluidized bed generator, model 3400A by thecompany TSI. In this setup, the solid substance is placed on a fine mesh. Air is pumpedthrough the mesh, the particles in the powder are brought into motion and bounce offeach other. This results in the impression of a fluid to an observer, hence the name.Due to the collisions, particles separate from the bulk material and follow the flow ofair; the instrument is schematized in figure 3.4a.
3.2 Aerosol system 43
(a) Fluidized bed generator 3400Aby TSI, used in experiments withhematite. Source: [142].
(b) Atomizer 3776 by TSI, used in ex-periments with PSL and SNOMAX.Source: [141].
Figure 3.4: Aerosol generators as described in chapter 3.2.1.
This flow is then lead through a diffusion drier, consisting of a fine mesh tube in alarger tube filled with silica gel, to the classifier for size selection. Experiments witha clean air flow showed no measurable particle numbers behind the drier, so particlecontamination by the silica gel could be excluded. The fluidized bed setup is usefulfor the aerosolization of all kinds of powders and is capable of producing high particleconcentrations in an air flow.This is also its downside: if there is only little materialavailable, the fluidized bed system quickly disperses all of the substance, thus limitingexperimental time.
SNOMAX and PSL are highly concentrated products, so an approach different tohematite is necessary to prevent waste.A wet dispersion mechanism, the atomizer, waschosen. A schematic is shown in figure 3.4b. A high-pressure (≈2bar) stream of artificialair is pumped through a narrow tube, in which flow speed increases and pressure dropsdue to Bernoulli’s principle. Through the reduced pressure, the substances suspendedat low concentrations (<150mg/l) in Nanopure water are sucked into a mixing chamber.The air-water mixture then flows through a nozzle (0,0135”=0,343mm diameter) inwhich the high flow speed fragments large droplets due to drag force into smaller droplets
44 Experimental setup and methods
suspended in an air flow. Larger droplets are sorted out with a precipitator connected tothe aerosol outlet of the atomizer. Because of the high volume flow which would exceedthe capacity of both classifier and particle counter, only a part of the remaining aerosolis lead through a diffusion drier consisting of silica gel which results in a polydisperseaerosol. The excess air is led into the exhaust system in the laboratory.
The dried particles then enter the classifier of the SMPS system after passing throughan impactor, a plate at a sharp bend in the air stream, where particles impinge that aretoo inertial to follow the flow.
Once the first liquid volume had been completely atomized, the empty container wasswitched with the precipitator container and experiments could continue. Suspensionswere switched daily, in the case of SNOMAX sometimes twice a day as a decompositionof the biological material was suspected due to the development of a somewhat rottensmell.
3.2.2 Aerosol size selection
A classifier or differential mobility analyzer (DMA) is a machine capable of selectingparticles from an air flow based on their size, shape and density in the form of theiraerodynamic mobility (as in equations 2.27 and 2.29). The Series 3080 ElectrostaticClassifier by TSI employs electric forces to select a given nominal diameter of particles.To this end, the particles have to have a defined charge which is achieved with a neutral-izer. This setup uses a 85Kr source (see figure 3.5a) to ionize the air in a certain volumeso that charges on the particles originating from collisions (fluidized bed generation) orpreviously dissolved ions (atomizer generation) are neutralized by charge equalization.Through statistical probability, most particles carry one or no charge [140].
The aerosol stream then enters a high-voltage capacitor consisting of a steel rod inthe middle of a steel tube. A particle-free air flow sheaths the rod from the aerosolstream which is flush with the steel tube. A small gap in the bottom of the rod allowsan air flow passage out of the capacitor. Only particles with the right aerodynamicdiameter and the right charge will pass through the gap; larger particles will not besufficiently accelerated by the electric field and leave the capacitor into the exhaust,particles too small will be accelerated too fast and deposit on the rod according to theirelectric mobility as derived in chapter 2.2.1. By variation of the voltage and the flows –both aerosol and sheath flow – particles can be selected by their mobility to pass throughthe classifier (see figure 3.5b).
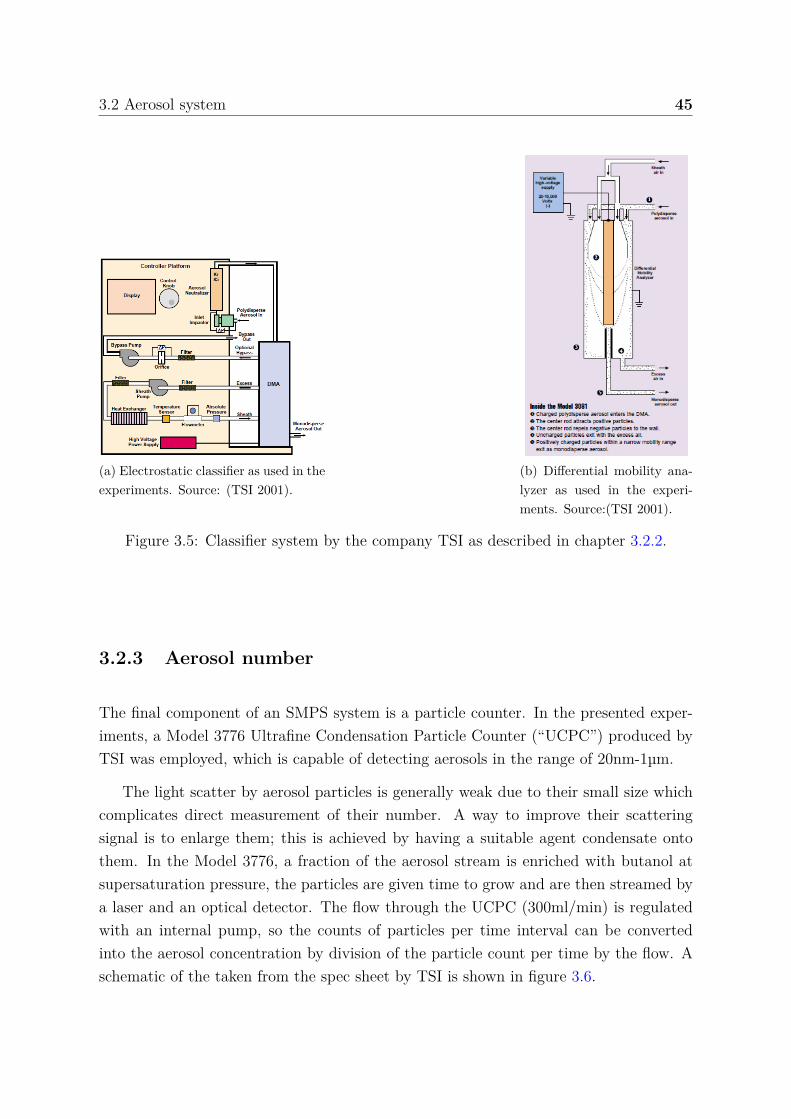
3.2 Aerosol system 45
(a) Electrostatic classifier as used in theexperiments. Source: (TSI 2001).
(b) Differential mobility ana-lyzer as used in the experi-ments. Source:(TSI 2001).
Figure 3.5: Classifier system by the company TSI as described in chapter 3.2.2.
3.2.3 Aerosol number
The final component of an SMPS system is a particle counter. In the presented exper-iments, a Model 3776 Ultrafine Condensation Particle Counter (“UCPC”) produced byTSI was employed, which is capable of detecting aerosols in the range of 20nm-1µm.
The light scatter by aerosol particles is generally weak due to their small size whichcomplicates direct measurement of their number. A way to improve their scatteringsignal is to enlarge them; this is achieved by having a suitable agent condensate ontothem. In the Model 3776, a fraction of the aerosol stream is enriched with butanol atsupersaturation pressure, the particles are given time to grow and are then streamed bya laser and an optical detector. The flow through the UCPC (300ml/min) is regulatedwith an internal pump, so the counts of particles per time interval can be convertedinto the aerosol concentration by division of the particle count per time by the flow. Aschematic of the taken from the spec sheet by TSI is shown in figure 3.6.
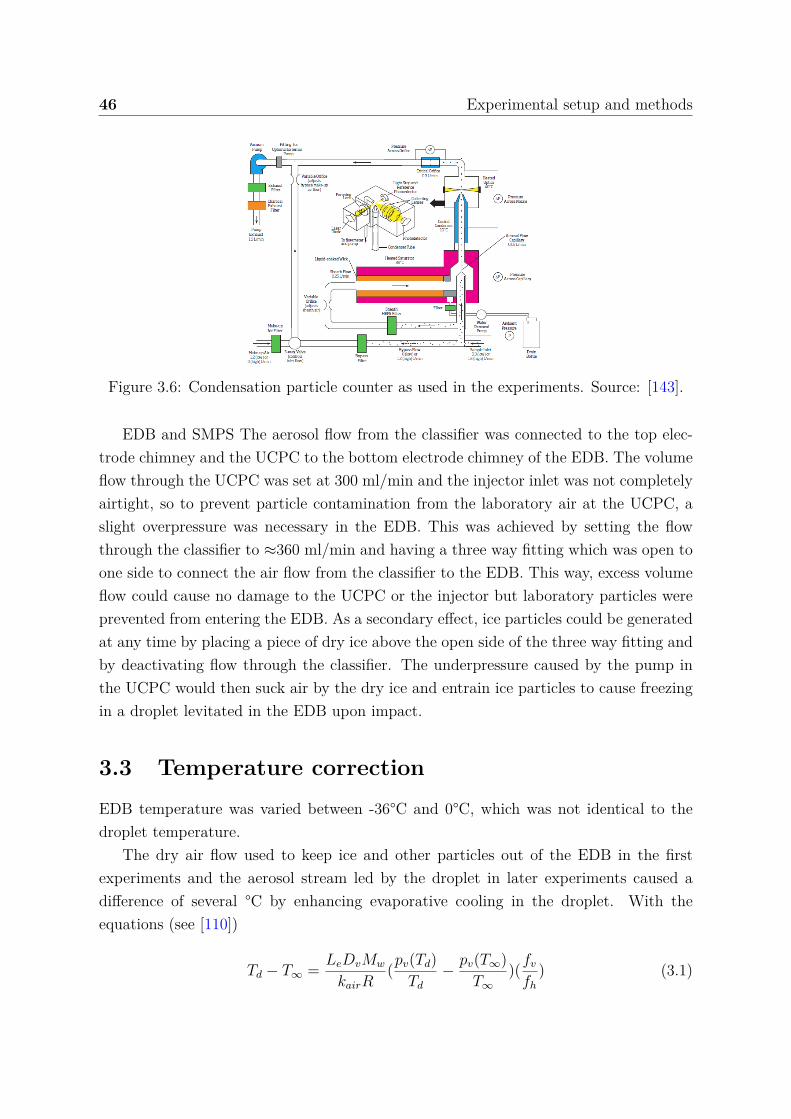
46 Experimental setup and methods
Figure 3.6: Condensation particle counter as used in the experiments. Source: [143].
EDB and SMPS The aerosol flow from the classifier was connected to the top elec-trode chimney and the UCPC to the bottom electrode chimney of the EDB. The volumeflow through the UCPC was set at 300 ml/min and the injector inlet was not completelyairtight, so to prevent particle contamination from the laboratory air at the UCPC, aslight overpressure was necessary in the EDB. This was achieved by setting the flowthrough the classifier to ≈360 ml/min and having a three way fitting which was open toone side to connect the air flow from the classifier to the EDB. This way, excess volumeflow could cause no damage to the UCPC or the injector but laboratory particles wereprevented from entering the EDB. As a secondary effect, ice particles could be generatedat any time by placing a piece of dry ice above the open side of the three way fitting andby deactivating flow through the classifier. The underpressure caused by the pump inthe UCPC would then suck air by the dry ice and entrain ice particles to cause freezingin a droplet levitated in the EDB upon impact.
3.3 Temperature correctionEDB temperature was varied between -36°C and 0°C, which was not identical to thedroplet temperature.
The dry air flow used to keep ice and other particles out of the EDB in the firstexperiments and the aerosol stream led by the droplet in later experiments caused adifference of several °C by enhancing evaporative cooling in the droplet. With theequations (see [110])
Td − T∞ = LeDvMw
kairR(pv(Td)
Td
− pv(T∞)T∞
)(fv
fh
) (3.1)
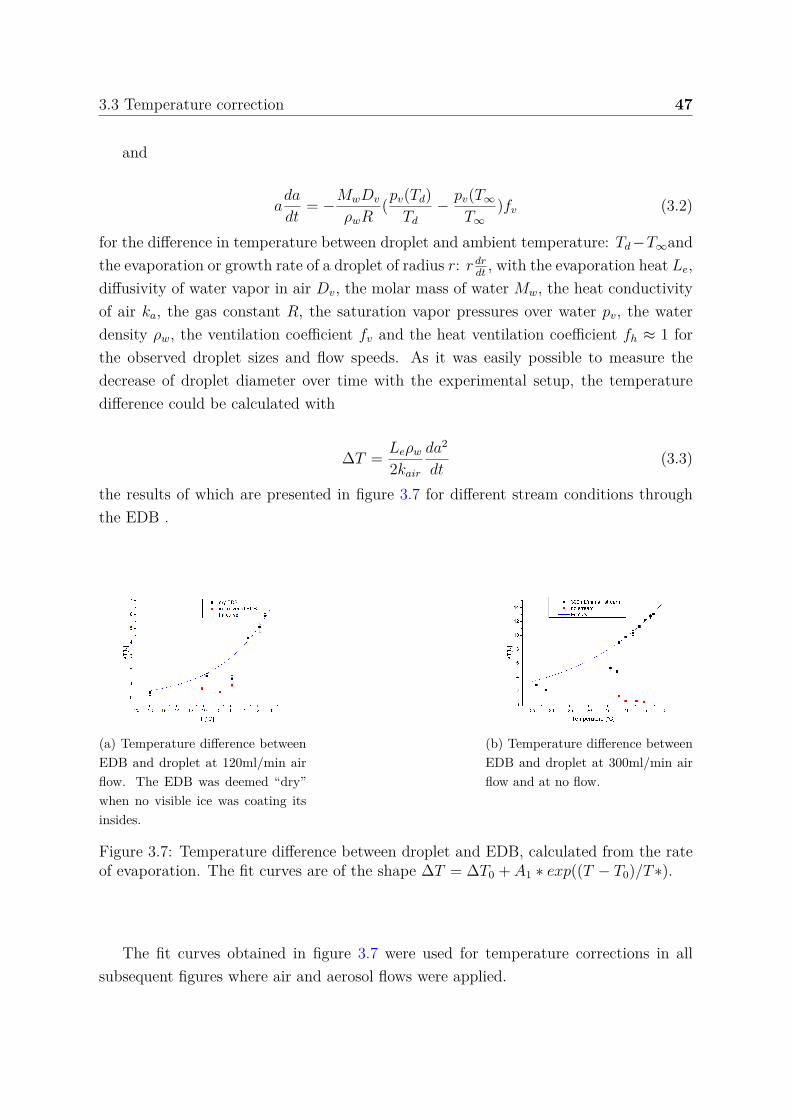
3.3 Temperature correction 47
and
ada
dt= −MwDv
ρwR(pv(Td)
Td
− pv(T∞
T∞)fv (3.2)
for the difference in temperature between droplet and ambient temperature: Td −T∞andthe evaporation or growth rate of a droplet of radius r: r dr
dt, with the evaporation heat Le,
diffusivity of water vapor in air Dv, the molar mass of water Mw, the heat conductivityof air ka, the gas constant R, the saturation vapor pressures over water pv, the waterdensity ρw, the ventilation coefficient fv and the heat ventilation coefficient fh ≈ 1 forthe observed droplet sizes and flow speeds. As it was easily possible to measure thedecrease of droplet diameter over time with the experimental setup, the temperaturedifference could be calculated with
∆T = Leρw
2kair
da2
dt(3.3)
the results of which are presented in figure 3.7 for different stream conditions throughthe EDB .
(a) Temperature difference betweenEDB and droplet at 120ml/min airflow. The EDB was deemed “dry”when no visible ice was coating itsinsides.
(b) Temperature difference betweenEDB and droplet at 300ml/min airflow and at no flow.
Figure 3.7: Temperature difference between droplet and EDB, calculated from the rateof evaporation. The fit curves are of the shape ∆T = ∆T0 + A1 ∗ exp((T − T0)/T∗).
The fit curves obtained in figure 3.7 were used for temperature corrections in allsubsequent figures where air and aerosol flows were applied.
48 Experimental setup and methods
3.4 Methods
3.4.1 General experimental procedure
The general procedure in the freezing experiments consisted of the following steps:
• Droplet injection
• Droplet capture in the EDB
• Short waiting time (several seconds) until droplet has reached temperature equi-librium with the ambient atmosphere
• Ice nucleation
– Contact nucleation via ice
∗ basic setup: the air flow through the EDB is briefly switched off so asmall number of ice crystals can enter the EDB center; the ice crystalswere nucleated by a piece of sublimating ice above a chimney in the topelectrode of the EDB
∗ aerosol setup: the air flow from the classifier is briefly switched off soice crystals are sucked into the EDB center by the internal pump of theparticle counter; same source of ice particles as in the basic setup
– Immersion nucleation via kaolinite or SNOMAX particles in injected droplets.The top chimney is closed in immersion experiments to prevent particle con-tamination from laboratory air
• Emptying, rinsing and refilling of the injector after half an hour of experiment-ing. It had been noticed in PSL suspension experiments that the fragmentationrate dropped after ≈45minutes which suggested particle depletion in the injector’sreservoir by sedimentation or Brownian motion to the injector walls
• Visual recognition of freezing in video recording
• Manual backwards triggering of video recording
• Examination of video
– Saving of video (several minutes)
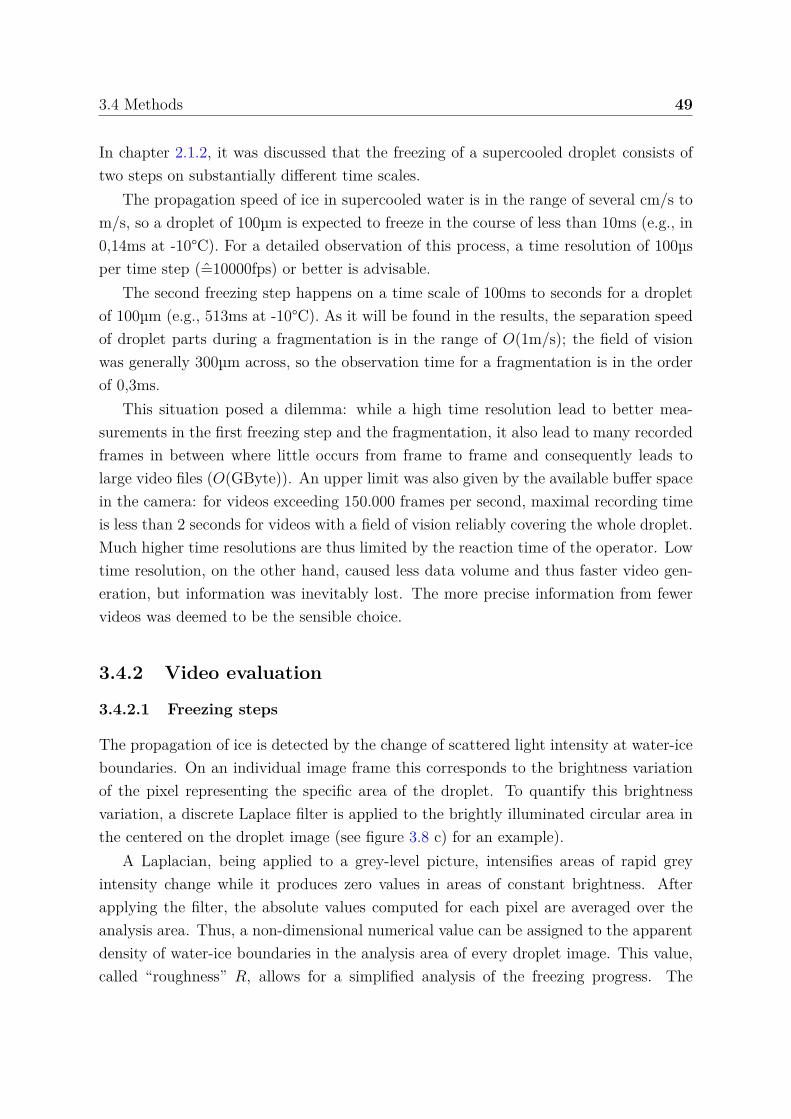
3.4 Methods 49
In chapter 2.1.2, it was discussed that the freezing of a supercooled droplet consists oftwo steps on substantially different time scales.
The propagation speed of ice in supercooled water is in the range of several cm/s tom/s, so a droplet of 100µm is expected to freeze in the course of less than 10ms (e.g., in0,14ms at -10°C). For a detailed observation of this process, a time resolution of 100µsper time step (=10000fps) or better is advisable.
The second freezing step happens on a time scale of 100ms to seconds for a dropletof 100µm (e.g., 513ms at -10°C). As it will be found in the results, the separation speedof droplet parts during a fragmentation is in the range of O(1m/s); the field of visionwas generally 300µm across, so the observation time for a fragmentation is in the orderof 0,3ms.
This situation posed a dilemma: while a high time resolution lead to better mea-surements in the first freezing step and the fragmentation, it also lead to many recordedframes in between where little occurs from frame to frame and consequently leads tolarge video files (O(GByte)). An upper limit was also given by the available buffer spacein the camera: for videos exceeding 150.000 frames per second, maximal recording timeis less than 2 seconds for videos with a field of vision reliably covering the whole droplet.Much higher time resolutions are thus limited by the reaction time of the operator. Lowtime resolution, on the other hand, caused less data volume and thus faster video gen-eration, but information was inevitably lost. The more precise information from fewervideos was deemed to be the sensible choice.
3.4.2 Video evaluation
3.4.2.1 Freezing steps
The propagation of ice is detected by the change of scattered light intensity at water-iceboundaries. On an individual image frame this corresponds to the brightness variationof the pixel representing the specific area of the droplet. To quantify this brightnessvariation, a discrete Laplace filter is applied to the brightly illuminated circular area inthe centered on the droplet image (see figure 3.8 c) for an example).
A Laplacian, being applied to a grey-level picture, intensifies areas of rapid greyintensity change while it produces zero values in areas of constant brightness. Afterapplying the filter, the absolute values computed for each pixel are averaged over theanalysis area. Thus, a non-dimensional numerical value can be assigned to the apparentdensity of water-ice boundaries in the analysis area of every droplet image. This value,called “roughness” R, allows for a simplified analysis of the freezing progress. The
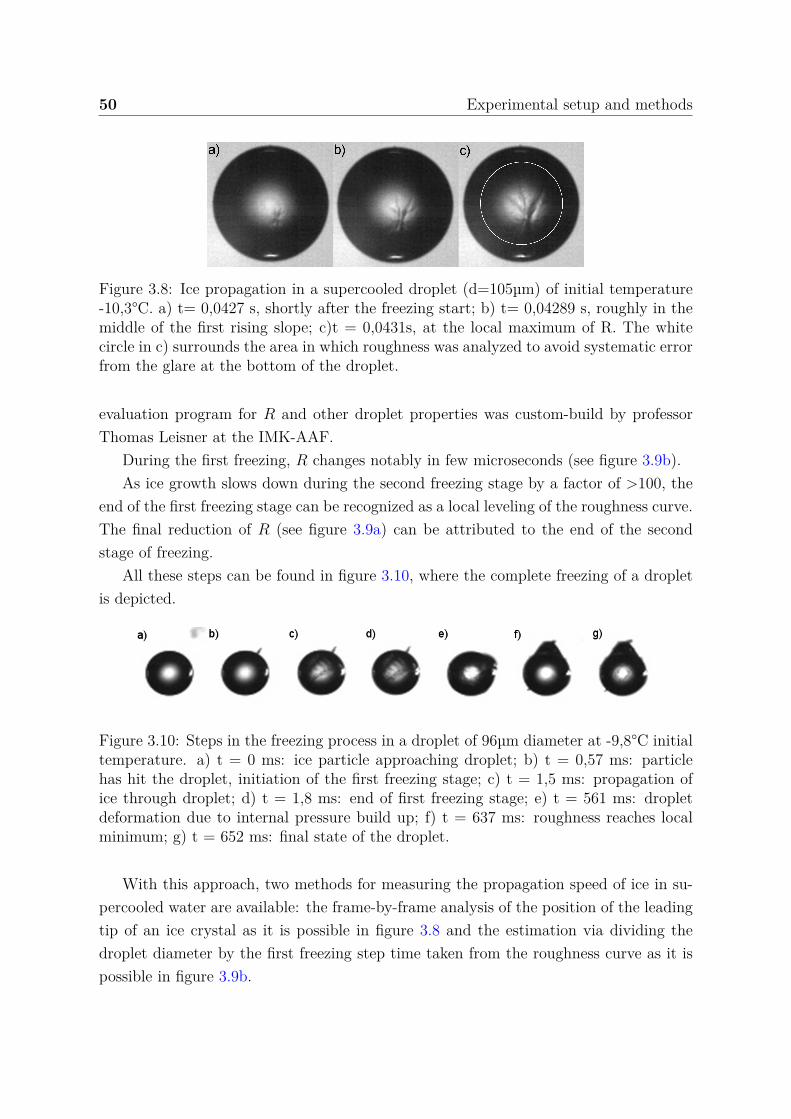
50 Experimental setup and methods
Figure 3.8: Ice propagation in a supercooled droplet (d=105µm) of initial temperature-10,3°C. a) t= 0,0427 s, shortly after the freezing start; b) t= 0,04289 s, roughly in themiddle of the first rising slope; c)t = 0,0431s, at the local maximum of R. The whitecircle in c) surrounds the area in which roughness was analyzed to avoid systematic errorfrom the glare at the bottom of the droplet.
evaluation program for R and other droplet properties was custom-build by professorThomas Leisner at the IMK-AAF.
During the first freezing, R changes notably in few microseconds (see figure 3.9b).As ice growth slows down during the second freezing stage by a factor of >100, the
end of the first freezing stage can be recognized as a local leveling of the roughness curve.The final reduction of R (see figure 3.9a) can be attributed to the end of the secondstage of freezing.
All these steps can be found in figure 3.10, where the complete freezing of a dropletis depicted.
Figure 3.10: Steps in the freezing process in a droplet of 96µm diameter at -9,8°C initialtemperature. a) t = 0 ms: ice particle approaching droplet; b) t = 0,57 ms: particlehas hit the droplet, initiation of the first freezing stage; c) t = 1,5 ms: propagation ofice through droplet; d) t = 1,8 ms: end of first freezing stage; e) t = 561 ms: dropletdeformation due to internal pressure build up; f) t = 637 ms: roughness reaches localminimum; g) t = 652 ms: final state of the droplet.
With this approach, two methods for measuring the propagation speed of ice in su-percooled water are available: the frame-by-frame analysis of the position of the leadingtip of an ice crystal as it is possible in figure 3.8 and the estimation via dividing thedroplet diameter by the first freezing step time taken from the roughness curve as it ispossible in figure 3.9b.
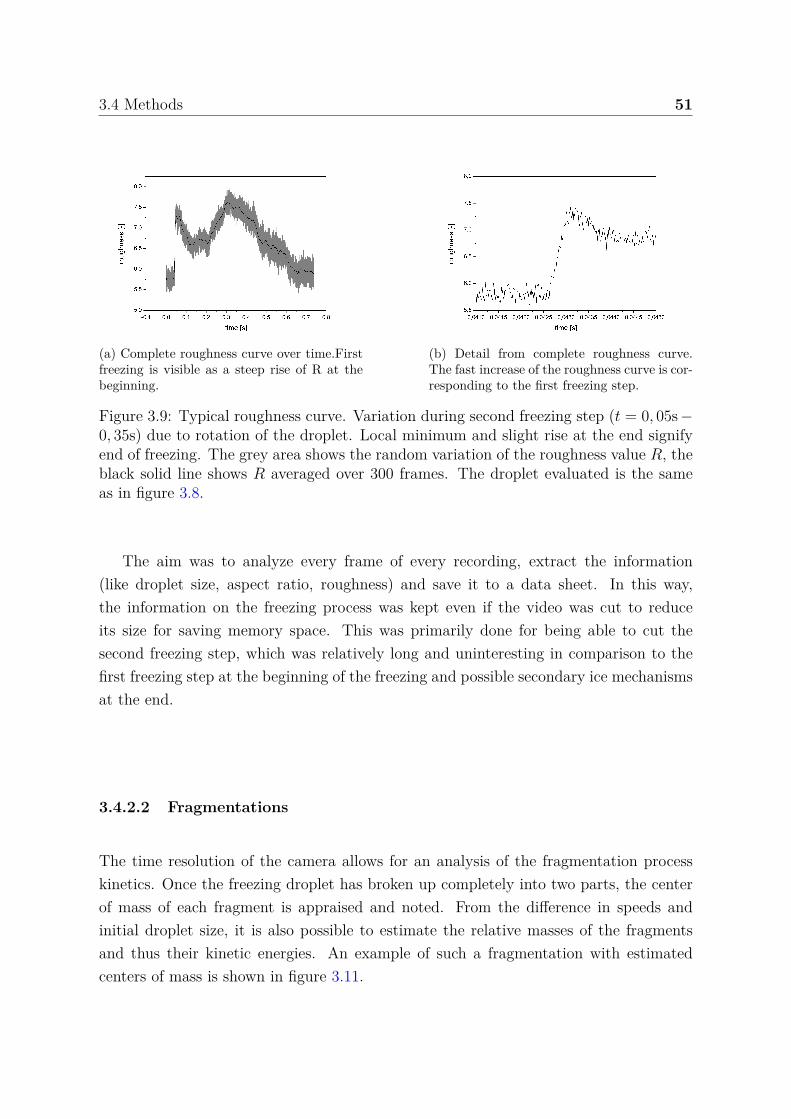
3.4 Methods 51
(a) Complete roughness curve over time.Firstfreezing is visible as a steep rise of R at thebeginning.
(b) Detail from complete roughness curve.The fast increase of the roughness curve is cor-responding to the first freezing step.
Figure 3.9: Typical roughness curve. Variation during second freezing step (t = 0, 05s −0, 35s) due to rotation of the droplet. Local minimum and slight rise at the end signifyend of freezing. The grey area shows the random variation of the roughness value R, theblack solid line shows R averaged over 300 frames. The droplet evaluated is the sameas in figure 3.8.
The aim was to analyze every frame of every recording, extract the information(like droplet size, aspect ratio, roughness) and save it to a data sheet. In this way,the information on the freezing process was kept even if the video was cut to reduceits size for saving memory space. This was primarily done for being able to cut thesecond freezing step, which was relatively long and uninteresting in comparison to thefirst freezing step at the beginning of the freezing and possible secondary ice mechanismsat the end.
3.4.2.2 Fragmentations
The time resolution of the camera allows for an analysis of the fragmentation processkinetics. Once the freezing droplet has broken up completely into two parts, the centerof mass of each fragment is appraised and noted. From the difference in speeds andinitial droplet size, it is also possible to estimate the relative masses of the fragmentsand thus their kinetic energies. An example of such a fragmentation with estimatedcenters of mass is shown in figure 3.11.
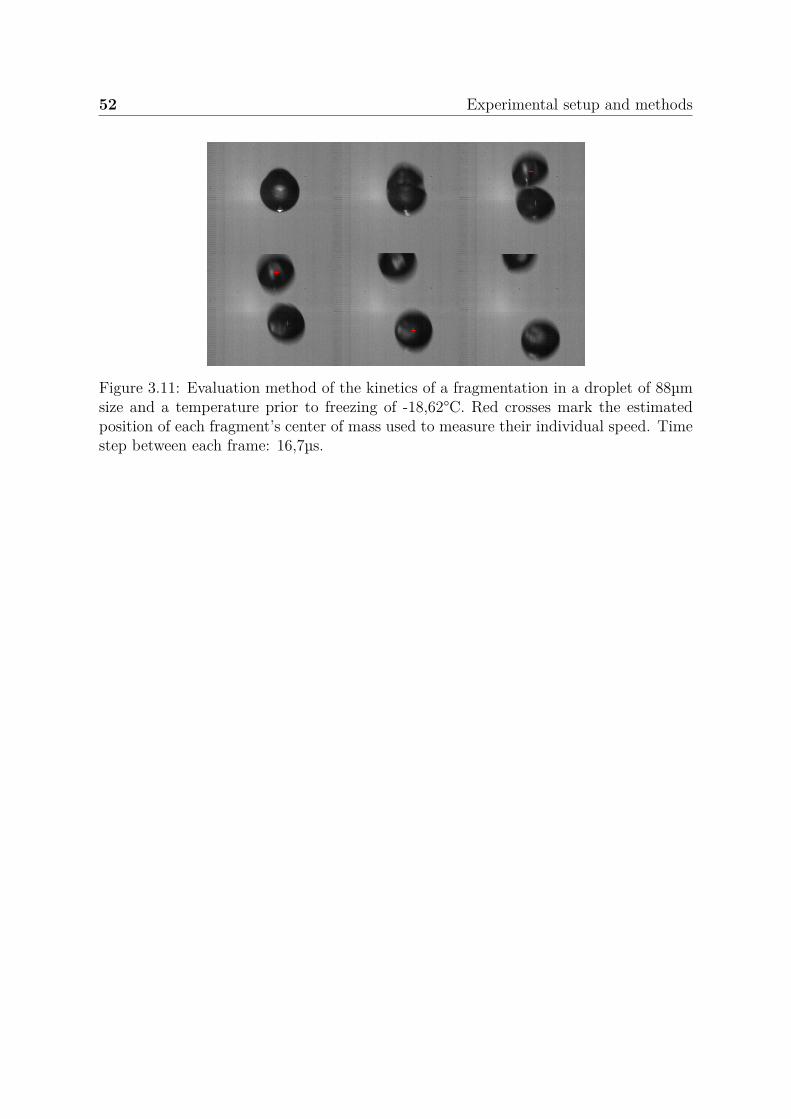
52 Experimental setup and methods
Figure 3.11: Evaluation method of the kinetics of a fragmentation in a droplet of 88µmsize and a temperature prior to freezing of -18,62°C. Red crosses mark the estimatedposition of each fragment’s center of mass used to measure their individual speed. Timestep between each frame: 16,7µs.
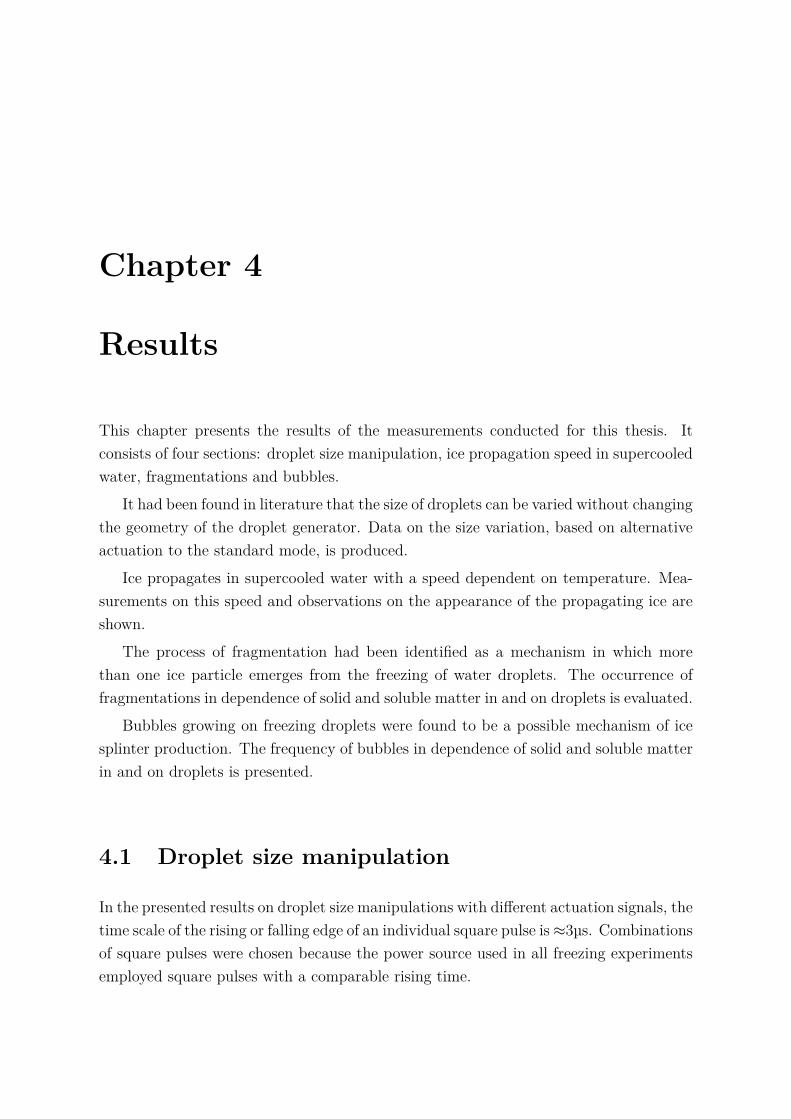
Chapter 4
Results
This chapter presents the results of the measurements conducted for this thesis. Itconsists of four sections: droplet size manipulation, ice propagation speed in supercooledwater, fragmentations and bubbles.
It had been found in literature that the size of droplets can be varied without changingthe geometry of the droplet generator. Data on the size variation, based on alternativeactuation to the standard mode, is produced.
Ice propagates in supercooled water with a speed dependent on temperature. Mea-surements on this speed and observations on the appearance of the propagating ice areshown.
The process of fragmentation had been identified as a mechanism in which morethan one ice particle emerges from the freezing of water droplets. The occurrence offragmentations in dependence of solid and soluble matter in and on droplets is evaluated.
Bubbles growing on freezing droplets were found to be a possible mechanism of icesplinter production. The frequency of bubbles in dependence of solid and soluble matterin and on droplets is presented.
4.1 Droplet size manipulation
In the presented results on droplet size manipulations with different actuation signals, thetime scale of the rising or falling edge of an individual square pulse is ≈3µs. Combinationsof square pulses were chosen because the power source used in all freezing experimentsemployed square pulses with a comparable rising time.
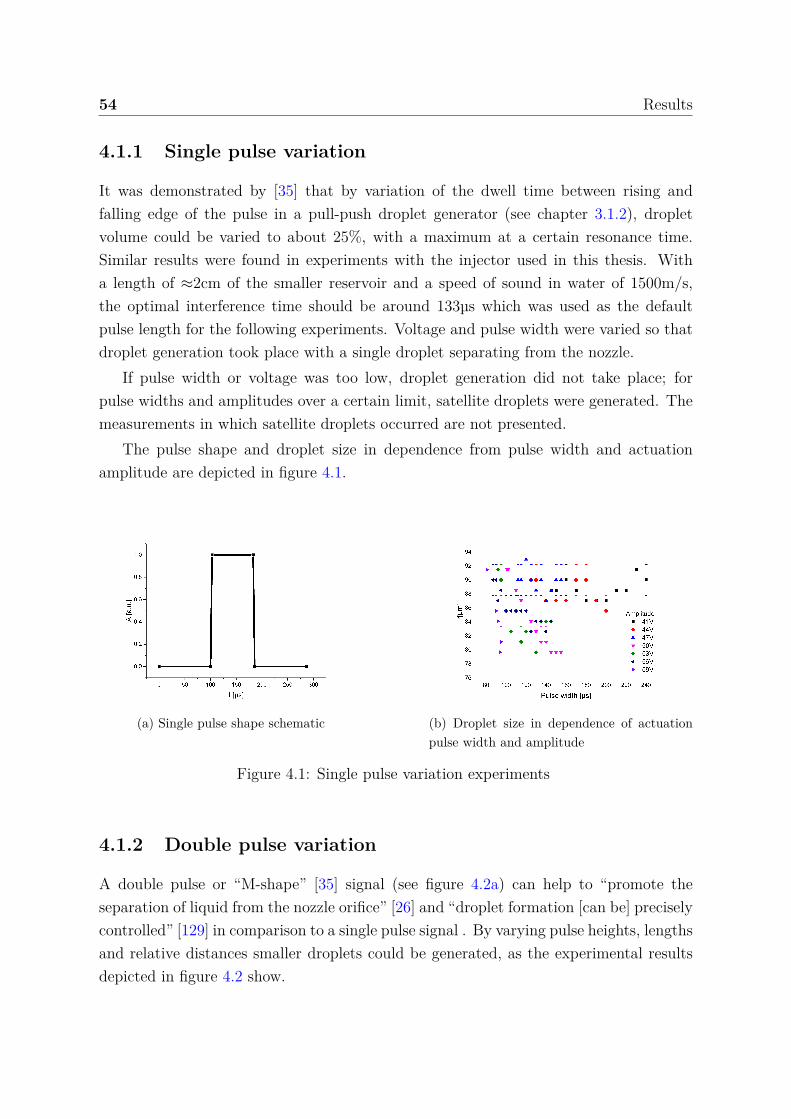
54 Results
4.1.1 Single pulse variation
It was demonstrated by [35] that by variation of the dwell time between rising andfalling edge of the pulse in a pull-push droplet generator (see chapter 3.1.2), dropletvolume could be varied to about 25%, with a maximum at a certain resonance time.Similar results were found in experiments with the injector used in this thesis. Witha length of ≈2cm of the smaller reservoir and a speed of sound in water of 1500m/s,the optimal interference time should be around 133µs which was used as the defaultpulse length for the following experiments. Voltage and pulse width were varied so thatdroplet generation took place with a single droplet separating from the nozzle.
If pulse width or voltage was too low, droplet generation did not take place; forpulse widths and amplitudes over a certain limit, satellite droplets were generated. Themeasurements in which satellite droplets occurred are not presented.
The pulse shape and droplet size in dependence from pulse width and actuationamplitude are depicted in figure 4.1.
(a) Single pulse shape schematic (b) Droplet size in dependence of actuationpulse width and amplitude
Figure 4.1: Single pulse variation experiments
4.1.2 Double pulse variation
A double pulse or “M-shape” [35] signal (see figure 4.2a) can help to “promote theseparation of liquid from the nozzle orifice” [26] and “droplet formation [can be] preciselycontrolled” [129] in comparison to a single pulse signal . By varying pulse heights, lengthsand relative distances smaller droplets could be generated, as the experimental resultsdepicted in figure 4.2 show.
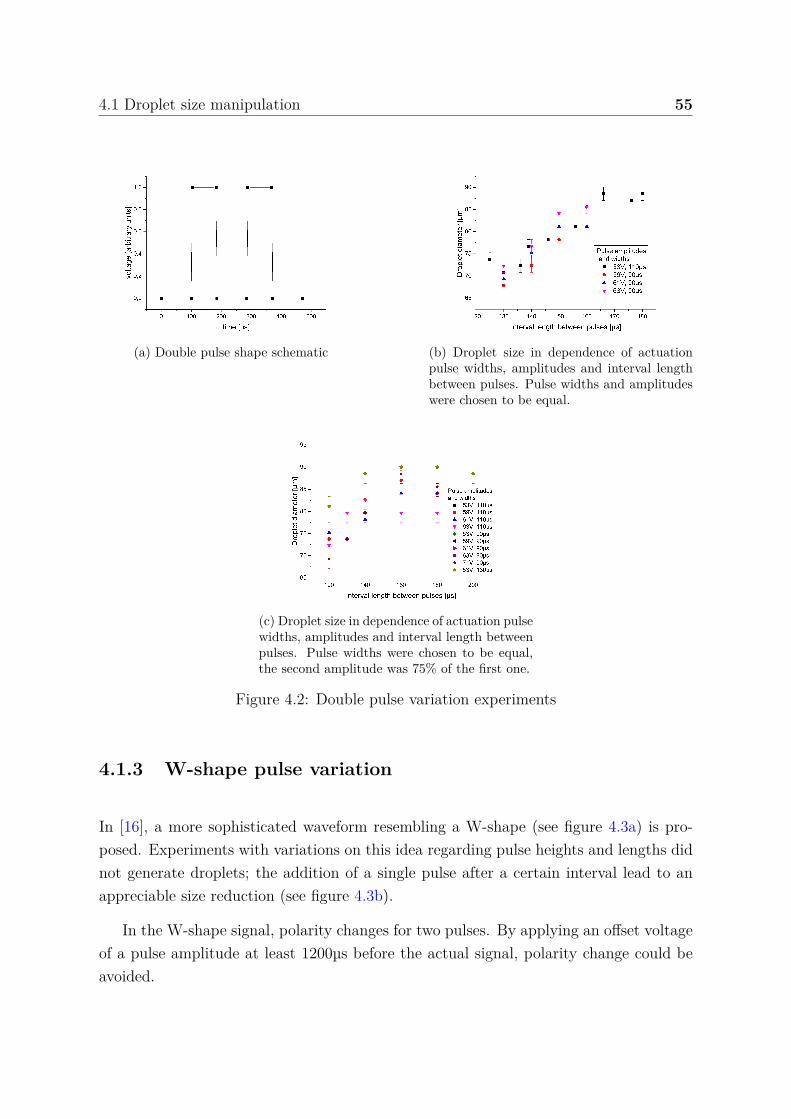
4.1 Droplet size manipulation 55
(a) Double pulse shape schematic (b) Droplet size in dependence of actuationpulse widths, amplitudes and interval lengthbetween pulses. Pulse widths and amplitudeswere chosen to be equal.
(c) Droplet size in dependence of actuation pulsewidths, amplitudes and interval length betweenpulses. Pulse widths were chosen to be equal,the second amplitude was 75% of the first one.
Figure 4.2: Double pulse variation experiments
4.1.3 W-shape pulse variation
In [16], a more sophisticated waveform resembling a W-shape (see figure 4.3a) is pro-posed. Experiments with variations on this idea regarding pulse heights and lengths didnot generate droplets; the addition of a single pulse after a certain interval lead to anappreciable size reduction (see figure 4.3b).
In the W-shape signal, polarity changes for two pulses. By applying an offset voltageof a pulse amplitude at least 1200µs before the actual signal, polarity change could beavoided.
56 Results
(a) W-pulse shape schematic (b) Droplet size in dependence of actuation pulse amplitudes andtime interval between W-shape and single afterpulse. Negativepulse widths at maximal amplitude of 88µs, positive pulse widthat maximal amplitude in W-shape of 120µs, single pulse width of98µs.
Figure 4.3: W-shape pulse variation experiments
4.1.4 Triple pulse variation
There was no justification for triple pulse actuation from literature, the experimentspresented in figure 4.4 were conducted out of curiosity.
4.1.5 Pulse combinations in the EDB
To complete the experiment series, actuation signals that allowed for size variation wereapplied to an injector at an EDB at a temperature of -18°C. Five signals were chosen tomeasure their effect under actual experimental conditions: a single pulse signal, threetriple pulse signals for both smaller and larger droplets and a W-shape signal as detailedin table 4.1 and shown in figure 4.5a. Amplitudes were varied so droplet capture waspossible. The results of the measurements are depicted in figure 4.5.
4.2 Ice propagation speed in a dropletThe high-speed recordings of freezing droplets had a sufficient time resolution to measurethe propagation speed of ice in supercooled water. For a description of the evaluation
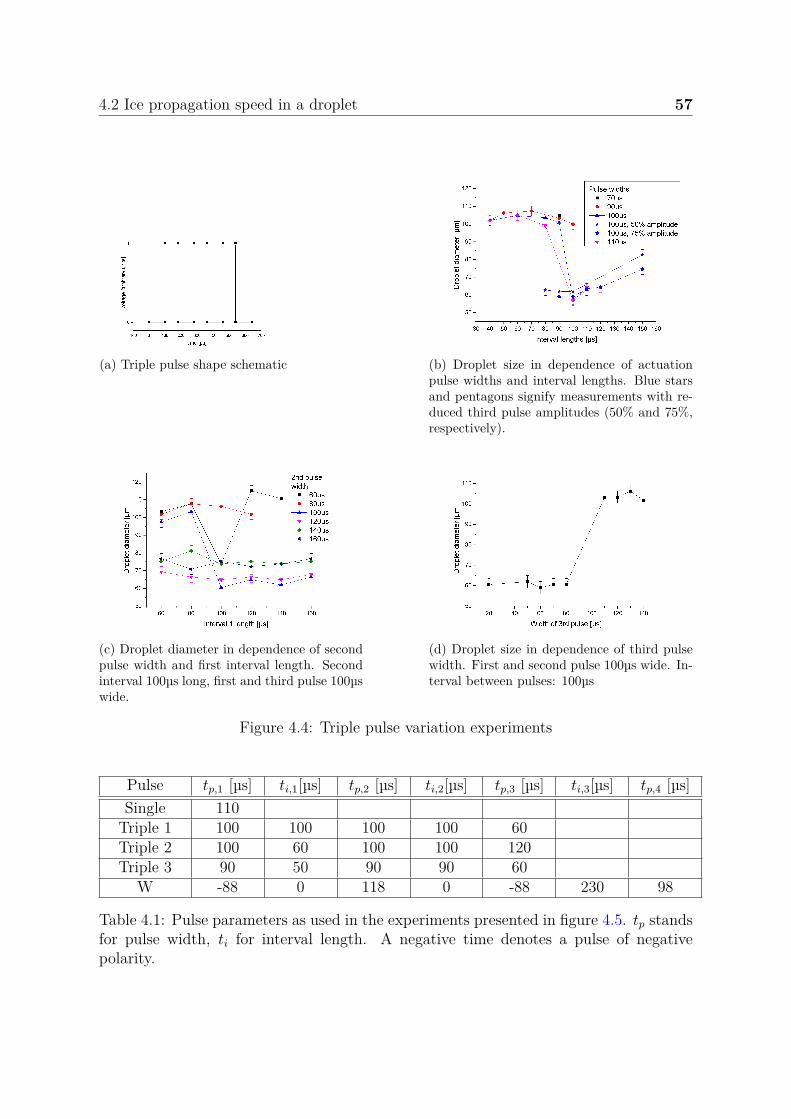
4.2 Ice propagation speed in a droplet 57
(a) Triple pulse shape schematic (b) Droplet size in dependence of actuationpulse widths and interval lengths. Blue starsand pentagons signify measurements with re-duced third pulse amplitudes (50% and 75%,respectively).
(c) Droplet diameter in dependence of secondpulse width and first interval length. Secondinterval 100µs long, first and third pulse 100µswide.
(d) Droplet size in dependence of third pulsewidth. First and second pulse 100µs wide. In-terval between pulses: 100µs
Figure 4.4: Triple pulse variation experiments
Pulse tp,1 [µs] ti,1[µs] tp,2 [µs] ti,2[µs] tp,3 [µs] ti,3[µs] tp,4 [µs]Single 110
Triple 1 100 100 100 100 60Triple 2 100 60 100 100 120Triple 3 90 50 90 90 60
W -88 0 118 0 -88 230 98
Table 4.1: Pulse parameters as used in the experiments presented in figure 4.5. tp standsfor pulse width, ti for interval length. A negative time denotes a pulse of negativepolarity.
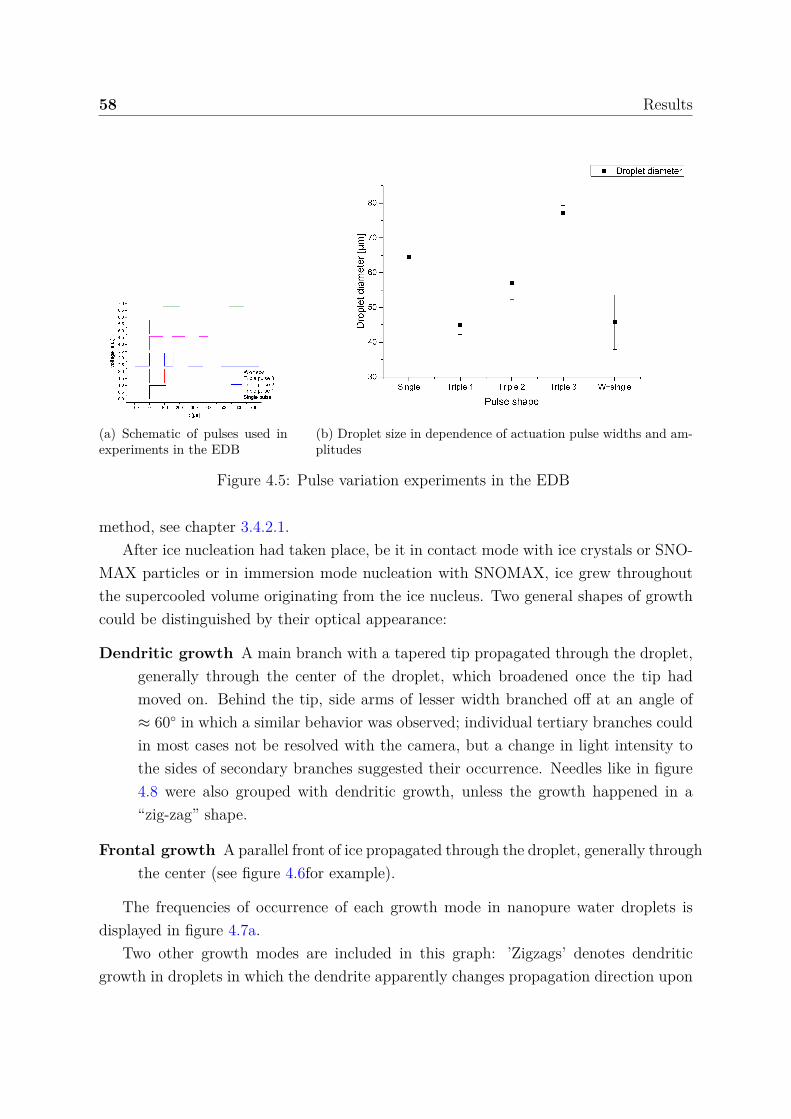
58 Results
(a) Schematic of pulses used inexperiments in the EDB
(b) Droplet size in dependence of actuation pulse widths and am-plitudes
Figure 4.5: Pulse variation experiments in the EDB
method, see chapter 3.4.2.1.After ice nucleation had taken place, be it in contact mode with ice crystals or SNO-
MAX particles or in immersion mode nucleation with SNOMAX, ice grew throughoutthe supercooled volume originating from the ice nucleus. Two general shapes of growthcould be distinguished by their optical appearance:
Dendritic growth A main branch with a tapered tip propagated through the droplet,generally through the center of the droplet, which broadened once the tip hadmoved on. Behind the tip, side arms of lesser width branched off at an angle of≈ 60◦ in which a similar behavior was observed; individual tertiary branches couldin most cases not be resolved with the camera, but a change in light intensity tothe sides of secondary branches suggested their occurrence. Needles like in figure4.8 were also grouped with dendritic growth, unless the growth happened in a“zig-zag” shape.
Frontal growth A parallel front of ice propagated through the droplet, generally throughthe center (see figure 4.6for example).
The frequencies of occurrence of each growth mode in nanopure water droplets isdisplayed in figure 4.7a.
Two other growth modes are included in this graph: ’Zigzags’ denotes dendriticgrowth in droplets in which the dendrite apparently changes propagation direction upon
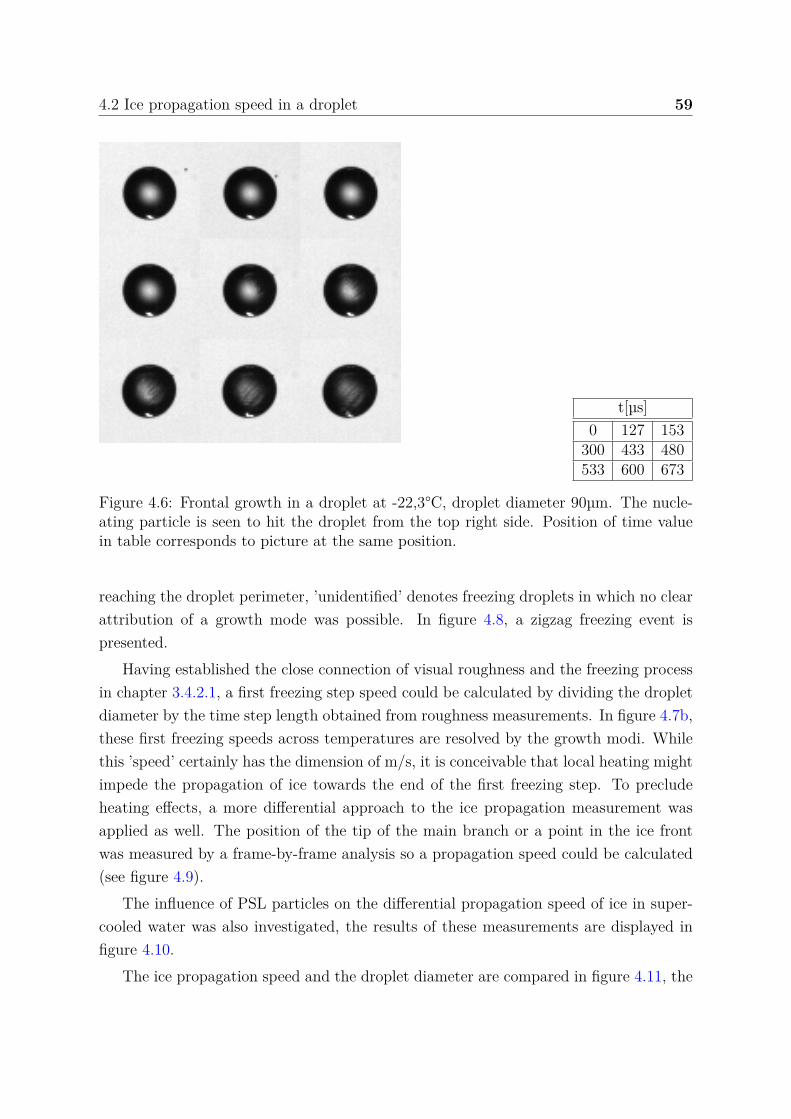
4.2 Ice propagation speed in a droplet 59
t[µs]0 127 153
300 433 480533 600 673
Figure 4.6: Frontal growth in a droplet at -22,3°C, droplet diameter 90µm. The nucle-ating particle is seen to hit the droplet from the top right side. Position of time valuein table corresponds to picture at the same position.
reaching the droplet perimeter, ’unidentified’ denotes freezing droplets in which no clearattribution of a growth mode was possible. In figure 4.8, a zigzag freezing event ispresented.
Having established the close connection of visual roughness and the freezing processin chapter 3.4.2.1, a first freezing step speed could be calculated by dividing the dropletdiameter by the time step length obtained from roughness measurements. In figure 4.7b,these first freezing speeds across temperatures are resolved by the growth modi. Whilethis ’speed’ certainly has the dimension of m/s, it is conceivable that local heating mightimpede the propagation of ice towards the end of the first freezing step. To precludeheating effects, a more differential approach to the ice propagation measurement wasapplied as well. The position of the tip of the main branch or a point in the ice frontwas measured by a frame-by-frame analysis so a propagation speed could be calculated(see figure 4.9).
The influence of PSL particles on the differential propagation speed of ice in super-cooled water was also investigated, the results of these measurements are displayed infigure 4.10.
The ice propagation speed and the droplet diameter are compared in figure 4.11, the
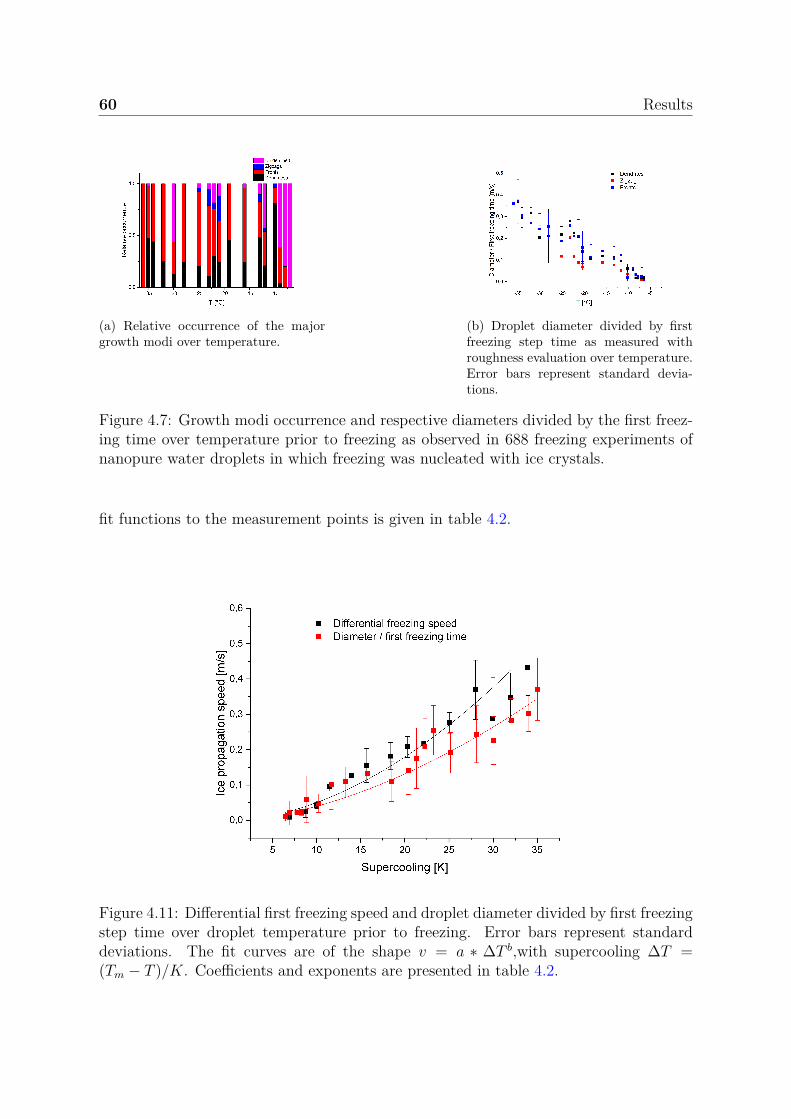
60 Results
(a) Relative occurrence of the majorgrowth modi over temperature.
(b) Droplet diameter divided by firstfreezing step time as measured withroughness evaluation over temperature.Error bars represent standard devia-tions.
Figure 4.7: Growth modi occurrence and respective diameters divided by the first freez-ing time over temperature prior to freezing as observed in 688 freezing experiments ofnanopure water droplets in which freezing was nucleated with ice crystals.
fit functions to the measurement points is given in table 4.2.
Figure 4.11: Differential first freezing speed and droplet diameter divided by first freezingstep time over droplet temperature prior to freezing. Error bars represent standarddeviations. The fit curves are of the shape v = a ∗ ∆T b,with supercooling ∆T =(Tm − T )/K. Coefficients and exponents are presented in table 4.2.
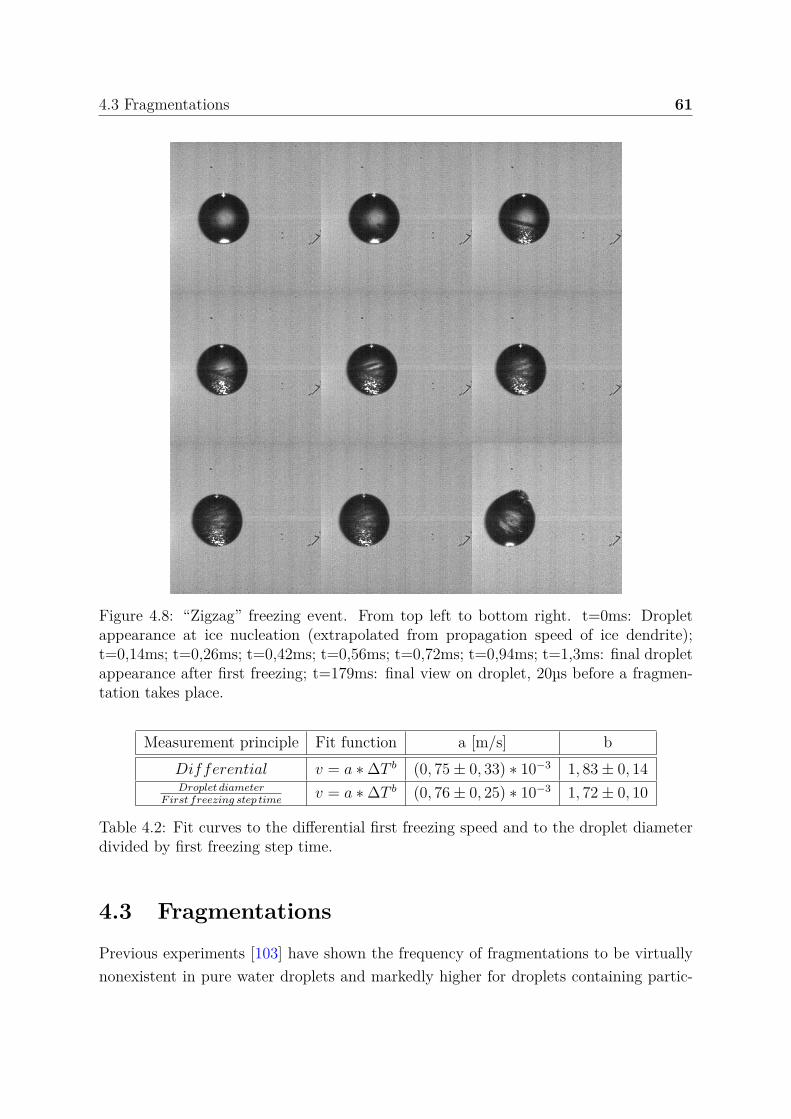
4.3 Fragmentations 61
Figure 4.8: “Zigzag” freezing event. From top left to bottom right. t=0ms: Dropletappearance at ice nucleation (extrapolated from propagation speed of ice dendrite);t=0,14ms; t=0,26ms; t=0,42ms; t=0,56ms; t=0,72ms; t=0,94ms; t=1,3ms: final dropletappearance after first freezing; t=179ms: final view on droplet, 20µs before a fragmen-tation takes place.
Measurement principle Fit function a [m/s] bDifferential v = a ∗ ∆T b (0, 75 ± 0, 33) ∗ 10−3 1, 83 ± 0, 14Droplet diameter
F irst freezing step timev = a ∗ ∆T b (0, 76 ± 0, 25) ∗ 10−3 1, 72 ± 0, 10
Table 4.2: Fit curves to the differential first freezing speed and to the droplet diameterdivided by first freezing step time.
4.3 Fragmentations
Previous experiments [103] have shown the frequency of fragmentations to be virtuallynonexistent in pure water droplets and markedly higher for droplets containing partic-
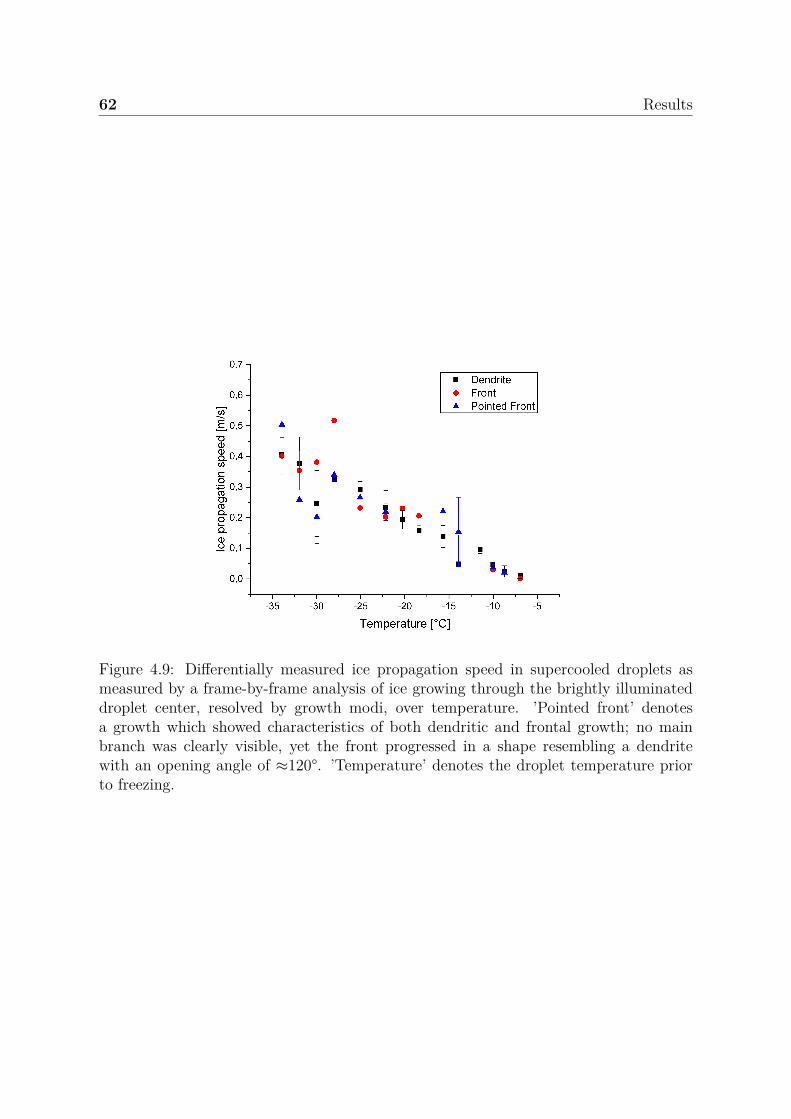
62 Results
Figure 4.9: Differentially measured ice propagation speed in supercooled droplets asmeasured by a frame-by-frame analysis of ice growing through the brightly illuminateddroplet center, resolved by growth modi, over temperature. ’Pointed front’ denotesa growth which showed characteristics of both dendritic and frontal growth; no mainbranch was clearly visible, yet the front progressed in a shape resembling a dendritewith an opening angle of ≈120°. ’Temperature’ denotes the droplet temperature priorto freezing.
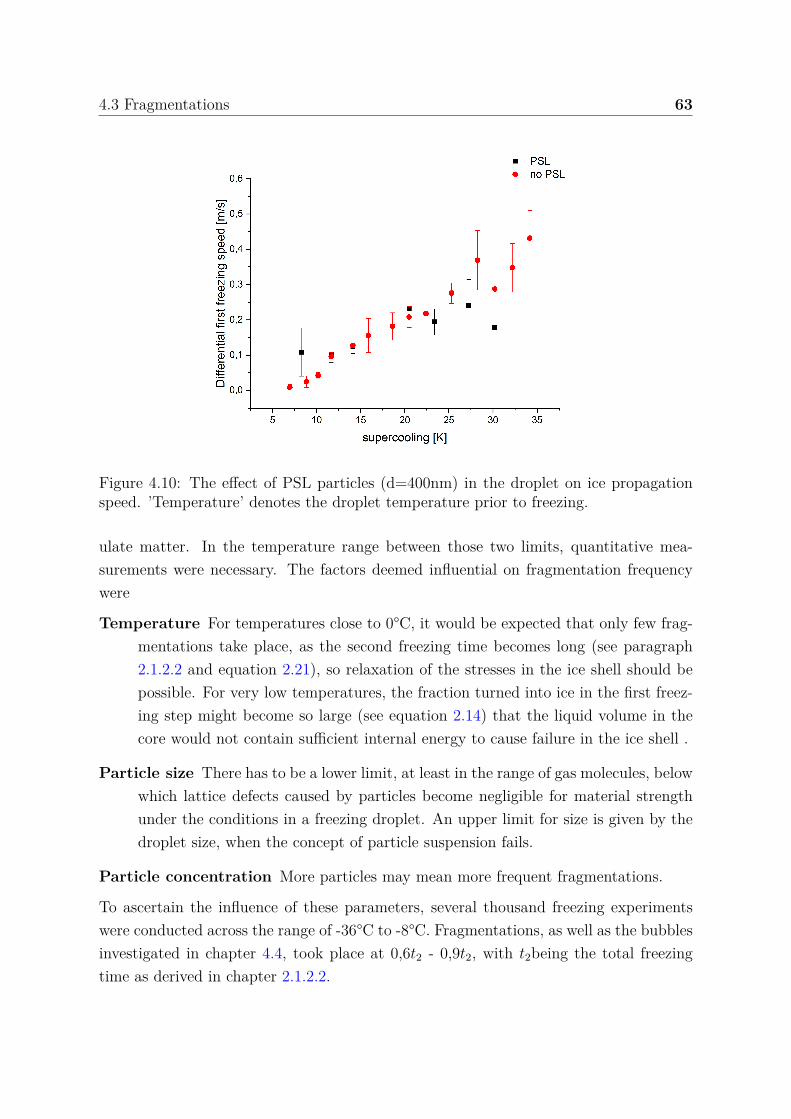
4.3 Fragmentations 63
Figure 4.10: The effect of PSL particles (d=400nm) in the droplet on ice propagationspeed. ’Temperature’ denotes the droplet temperature prior to freezing.
ulate matter. In the temperature range between those two limits, quantitative mea-surements were necessary. The factors deemed influential on fragmentation frequencywere
Temperature For temperatures close to 0°C, it would be expected that only few frag-mentations take place, as the second freezing time becomes long (see paragraph2.1.2.2 and equation 2.21), so relaxation of the stresses in the ice shell should bepossible. For very low temperatures, the fraction turned into ice in the first freez-ing step might become so large (see equation 2.14) that the liquid volume in thecore would not contain sufficient internal energy to cause failure in the ice shell .
Particle size There has to be a lower limit, at least in the range of gas molecules, belowwhich lattice defects caused by particles become negligible for material strengthunder the conditions in a freezing droplet. An upper limit for size is given by thedroplet size, when the concept of particle suspension fails.
Particle concentration More particles may mean more frequent fragmentations.
To ascertain the influence of these parameters, several thousand freezing experimentswere conducted across the range of -36°C to -8°C. Fragmentations, as well as the bubblesinvestigated in chapter 4.4, took place at 0,6t2 - 0,9t2, with t2being the total freezingtime as derived in chapter 2.1.2.2.
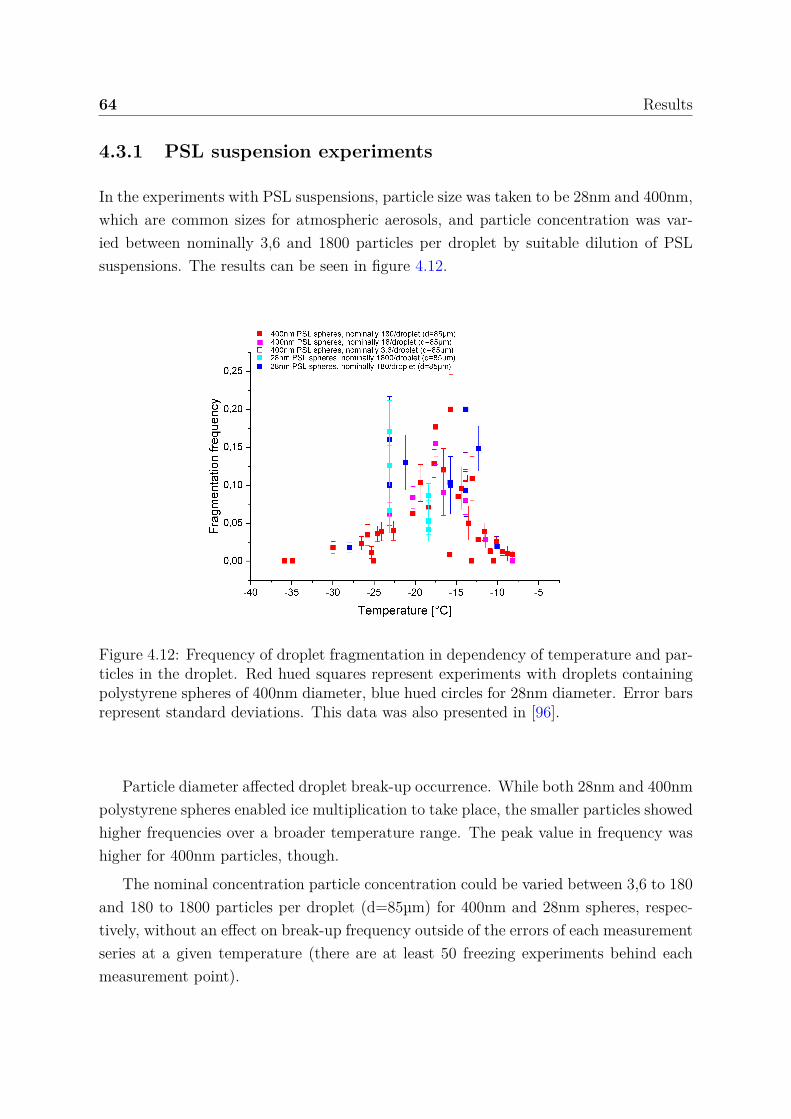
64 Results
4.3.1 PSL suspension experiments
In the experiments with PSL suspensions, particle size was taken to be 28nm and 400nm,which are common sizes for atmospheric aerosols, and particle concentration was var-ied between nominally 3,6 and 1800 particles per droplet by suitable dilution of PSLsuspensions. The results can be seen in figure 4.12.
Figure 4.12: Frequency of droplet fragmentation in dependency of temperature and par-ticles in the droplet. Red hued squares represent experiments with droplets containingpolystyrene spheres of 400nm diameter, blue hued circles for 28nm diameter. Error barsrepresent standard deviations. This data was also presented in [96].
Particle diameter affected droplet break-up occurrence. While both 28nm and 400nmpolystyrene spheres enabled ice multiplication to take place, the smaller particles showedhigher frequencies over a broader temperature range. The peak value in frequency washigher for 400nm particles, though.
The nominal concentration particle concentration could be varied between 3,6 to 180and 180 to 1800 particles per droplet (d=85µm) for 400nm and 28nm spheres, respec-tively, without an effect on break-up frequency outside of the errors of each measurementseries at a given temperature (there are at least 50 freezing experiments behind eachmeasurement point).
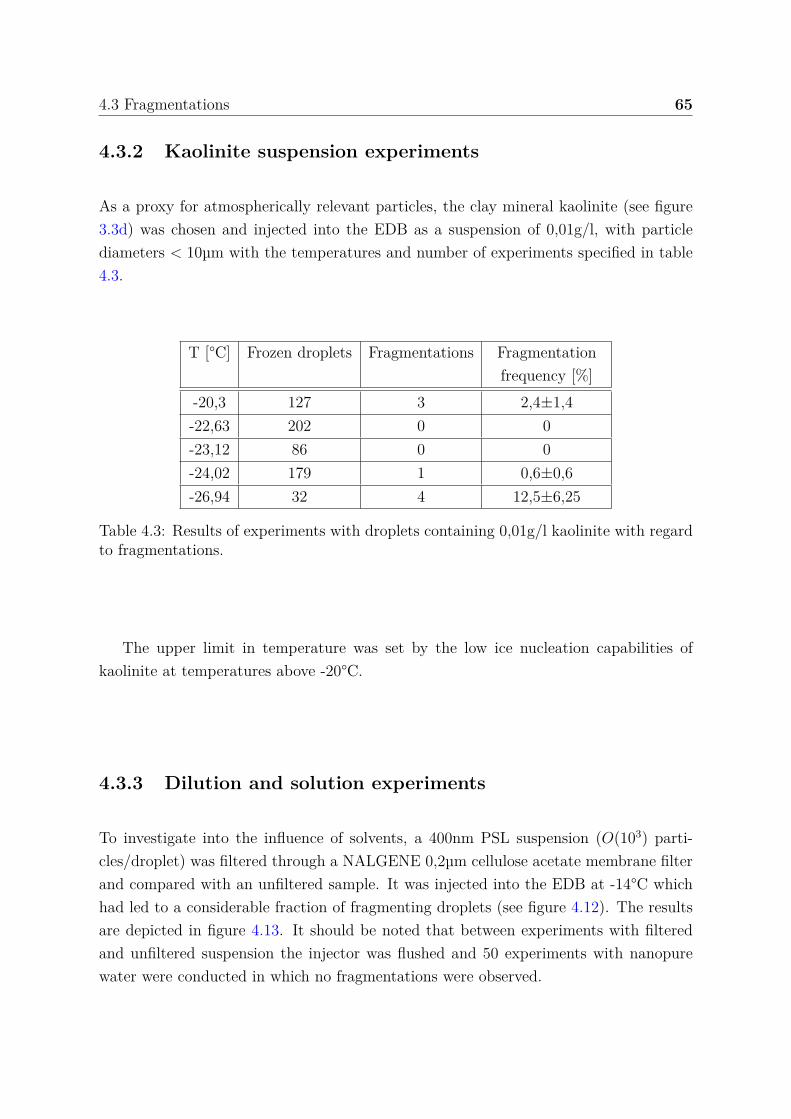
4.3 Fragmentations 65
4.3.2 Kaolinite suspension experiments
As a proxy for atmospherically relevant particles, the clay mineral kaolinite (see figure3.3d) was chosen and injected into the EDB as a suspension of 0,01g/l, with particlediameters < 10µm with the temperatures and number of experiments specified in table4.3.
T [°C] Frozen droplets Fragmentations Fragmentationfrequency [%]
-20,3 127 3 2,4±1,4-22,63 202 0 0-23,12 86 0 0-24,02 179 1 0,6±0,6-26,94 32 4 12,5±6,25
Table 4.3: Results of experiments with droplets containing 0,01g/l kaolinite with regardto fragmentations.
The upper limit in temperature was set by the low ice nucleation capabilities ofkaolinite at temperatures above -20°C.
4.3.3 Dilution and solution experiments
To investigate into the influence of solvents, a 400nm PSL suspension (O(103) parti-cles/droplet) was filtered through a NALGENE 0,2µm cellulose acetate membrane filterand compared with an unfiltered sample. It was injected into the EDB at -14°C whichhad led to a considerable fraction of fragmenting droplets (see figure 4.12). The resultsare depicted in figure 4.13. It should be noted that between experiments with filteredand unfiltered suspension the injector was flushed and 50 experiments with nanopurewater were conducted in which no fragmentations were observed.
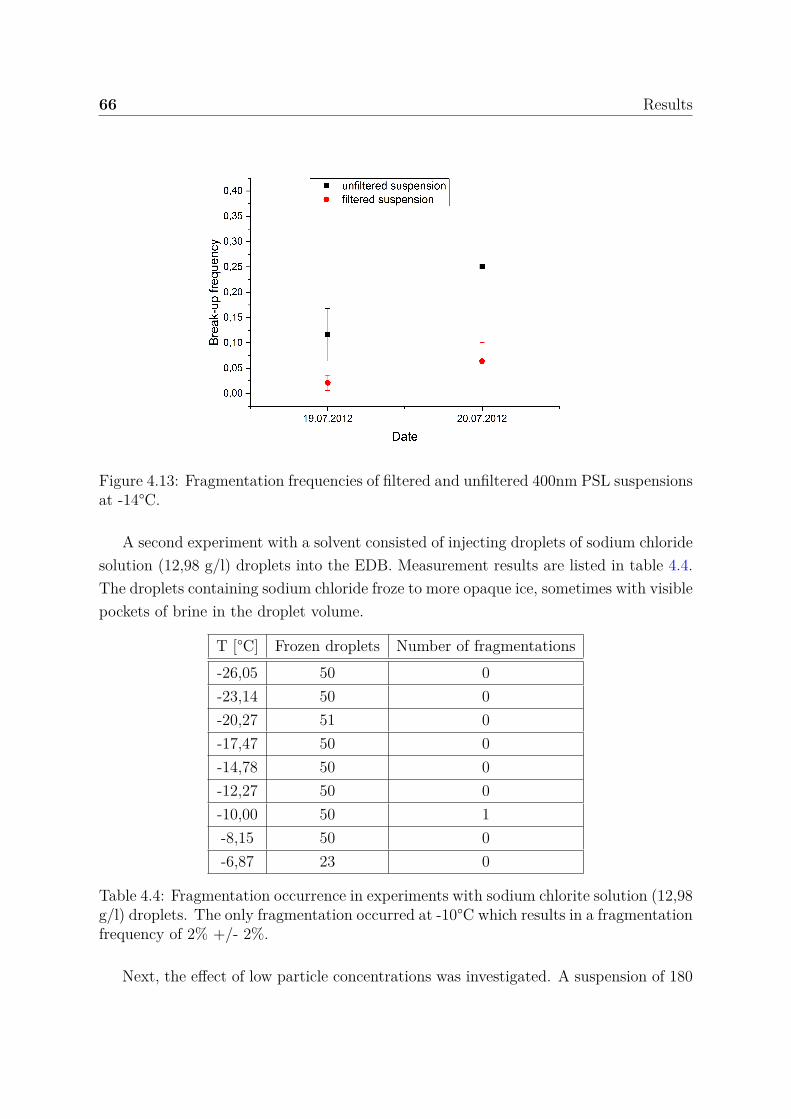
66 Results
Figure 4.13: Fragmentation frequencies of filtered and unfiltered 400nm PSL suspensionsat -14°C.
A second experiment with a solvent consisted of injecting droplets of sodium chloridesolution (12,98 g/l) droplets into the EDB. Measurement results are listed in table 4.4.The droplets containing sodium chloride froze to more opaque ice, sometimes with visiblepockets of brine in the droplet volume.
T [°C] Frozen droplets Number of fragmentations-26,05 50 0-23,14 50 0-20,27 51 0-17,47 50 0-14,78 50 0-12,27 50 0-10,00 50 1-8,15 50 0-6,87 23 0
Table 4.4: Fragmentation occurrence in experiments with sodium chlorite solution (12,98g/l) droplets. The only fragmentation occurred at -10°C which results in a fragmentationfrequency of 2% +/- 2%.
Next, the effect of low particle concentrations was investigated. A suspension of 180
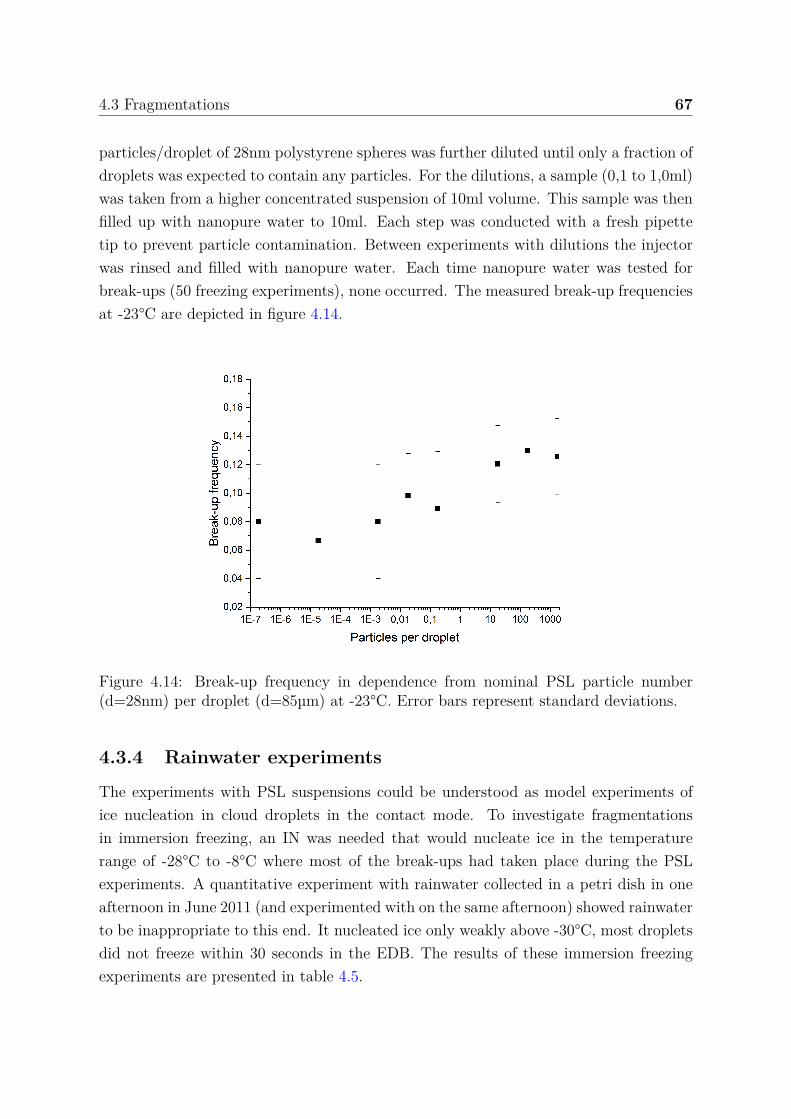
4.3 Fragmentations 67
particles/droplet of 28nm polystyrene spheres was further diluted until only a fraction ofdroplets was expected to contain any particles. For the dilutions, a sample (0,1 to 1,0ml)was taken from a higher concentrated suspension of 10ml volume. This sample was thenfilled up with nanopure water to 10ml. Each step was conducted with a fresh pipettetip to prevent particle contamination. Between experiments with dilutions the injectorwas rinsed and filled with nanopure water. Each time nanopure water was tested forbreak-ups (50 freezing experiments), none occurred. The measured break-up frequenciesat -23°C are depicted in figure 4.14.
Figure 4.14: Break-up frequency in dependence from nominal PSL particle number(d=28nm) per droplet (d=85µm) at -23°C. Error bars represent standard deviations.
4.3.4 Rainwater experiments
The experiments with PSL suspensions could be understood as model experiments ofice nucleation in cloud droplets in the contact mode. To investigate fragmentationsin immersion freezing, an IN was needed that would nucleate ice in the temperaturerange of -28°C to -8°C where most of the break-ups had taken place during the PSLexperiments. A quantitative experiment with rainwater collected in a petri dish in oneafternoon in June 2011 (and experimented with on the same afternoon) showed rainwaterto be inappropriate to this end. It nucleated ice only weakly above -30°C, most dropletsdid not freeze within 30 seconds in the EDB. The results of these immersion freezingexperiments are presented in table 4.5.
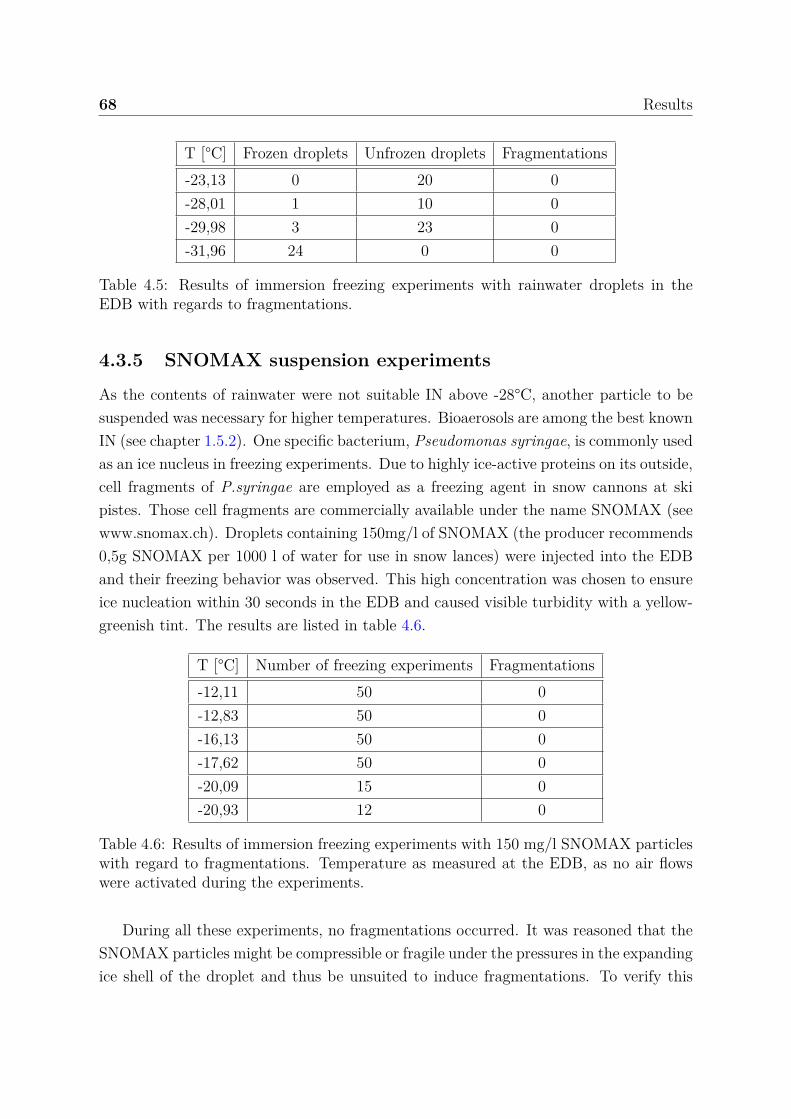
68 Results
T [°C] Frozen droplets Unfrozen droplets Fragmentations-23,13 0 20 0-28,01 1 10 0-29,98 3 23 0-31,96 24 0 0
Table 4.5: Results of immersion freezing experiments with rainwater droplets in theEDB with regards to fragmentations.
4.3.5 SNOMAX suspension experiments
As the contents of rainwater were not suitable IN above -28°C, another particle to besuspended was necessary for higher temperatures. Bioaerosols are among the best knownIN (see chapter 1.5.2). One specific bacterium, Pseudomonas syringae, is commonly usedas an ice nucleus in freezing experiments. Due to highly ice-active proteins on its outside,cell fragments of P.syringae are employed as a freezing agent in snow cannons at skipistes. Those cell fragments are commercially available under the name SNOMAX (seewww.snomax.ch). Droplets containing 150mg/l of SNOMAX (the producer recommends0,5g SNOMAX per 1000 l of water for use in snow lances) were injected into the EDBand their freezing behavior was observed. This high concentration was chosen to ensureice nucleation within 30 seconds in the EDB and caused visible turbidity with a yellow-greenish tint. The results are listed in table 4.6.
T [°C] Number of freezing experiments Fragmentations-12,11 50 0-12,83 50 0-16,13 50 0-17,62 50 0-20,09 15 0-20,93 12 0
Table 4.6: Results of immersion freezing experiments with 150 mg/l SNOMAX particleswith regard to fragmentations. Temperature as measured at the EDB, as no air flowswere activated during the experiments.
During all these experiments, no fragmentations occurred. It was reasoned that theSNOMAX particles might be compressible or fragile under the pressures in the expandingice shell of the droplet and thus be unsuited to induce fragmentations. To verify this
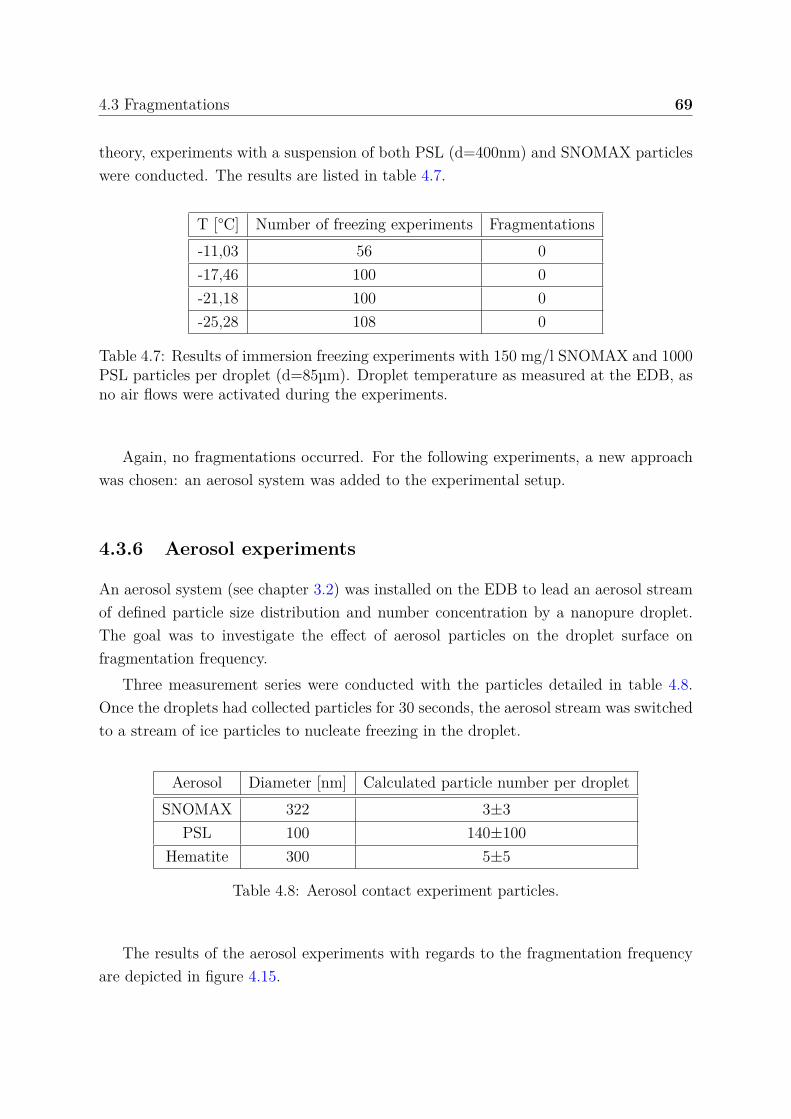
4.3 Fragmentations 69
theory, experiments with a suspension of both PSL (d=400nm) and SNOMAX particleswere conducted. The results are listed in table 4.7.
T [°C] Number of freezing experiments Fragmentations-11,03 56 0-17,46 100 0-21,18 100 0-25,28 108 0
Table 4.7: Results of immersion freezing experiments with 150 mg/l SNOMAX and 1000PSL particles per droplet (d=85µm). Droplet temperature as measured at the EDB, asno air flows were activated during the experiments.
Again, no fragmentations occurred. For the following experiments, a new approachwas chosen: an aerosol system was added to the experimental setup.
4.3.6 Aerosol experiments
An aerosol system (see chapter 3.2) was installed on the EDB to lead an aerosol streamof defined particle size distribution and number concentration by a nanopure droplet.The goal was to investigate the effect of aerosol particles on the droplet surface onfragmentation frequency.
Three measurement series were conducted with the particles detailed in table 4.8.Once the droplets had collected particles for 30 seconds, the aerosol stream was switchedto a stream of ice particles to nucleate freezing in the droplet.
Aerosol Diameter [nm] Calculated particle number per dropletSNOMAX 322 3±3
PSL 100 140±100Hematite 300 5±5
Table 4.8: Aerosol contact experiment particles.
The results of the aerosol experiments with regards to the fragmentation frequencyare depicted in figure 4.15.
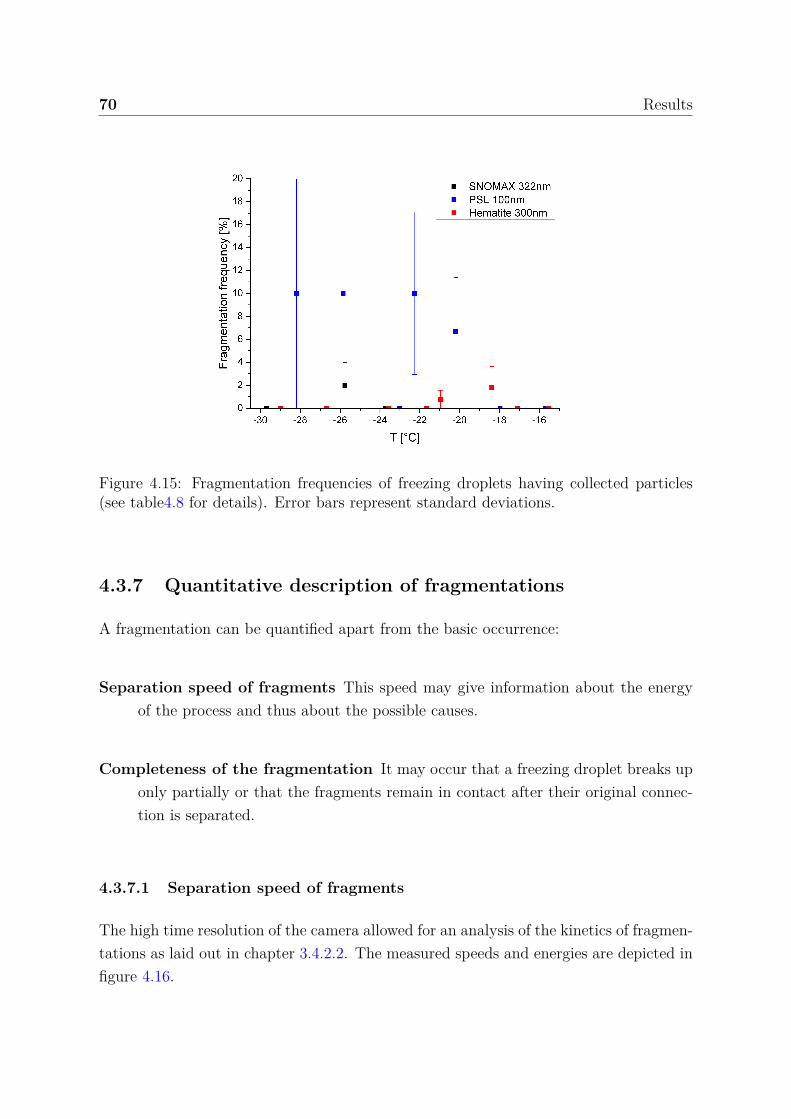
70 Results
Figure 4.15: Fragmentation frequencies of freezing droplets having collected particles(see table4.8 for details). Error bars represent standard deviations.
4.3.7 Quantitative description of fragmentations
A fragmentation can be quantified apart from the basic occurrence:
Separation speed of fragments This speed may give information about the energyof the process and thus about the possible causes.
Completeness of the fragmentation It may occur that a freezing droplet breaks uponly partially or that the fragments remain in contact after their original connec-tion is separated.
4.3.7.1 Separation speed of fragments
The high time resolution of the camera allowed for an analysis of the kinetics of fragmen-tations as laid out in chapter 3.4.2.2. The measured speeds and energies are depicted infigure 4.16.
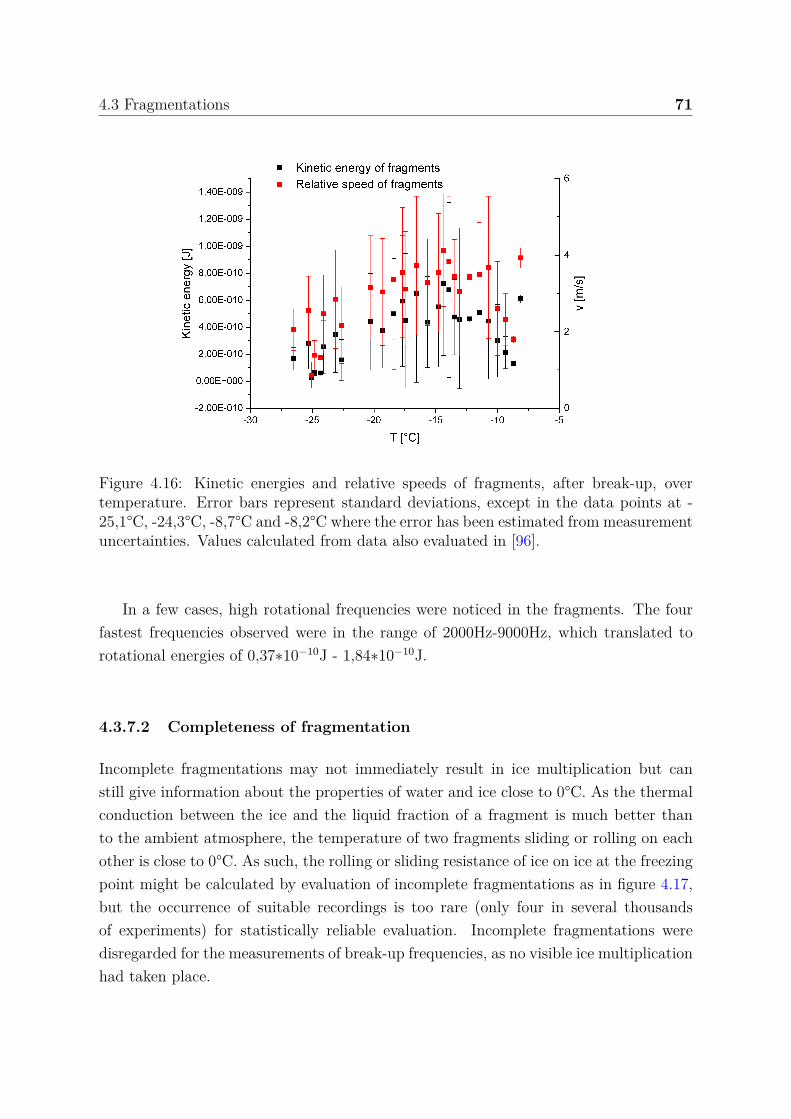
4.3 Fragmentations 71
Figure 4.16: Kinetic energies and relative speeds of fragments, after break-up, overtemperature. Error bars represent standard deviations, except in the data points at -25,1°C, -24,3°C, -8,7°C and -8,2°C where the error has been estimated from measurementuncertainties. Values calculated from data also evaluated in [96].
In a few cases, high rotational frequencies were noticed in the fragments. The fourfastest frequencies observed were in the range of 2000Hz-9000Hz, which translated torotational energies of 0,37∗10−10J - 1,84∗10−10J.
4.3.7.2 Completeness of fragmentation
Incomplete fragmentations may not immediately result in ice multiplication but canstill give information about the properties of water and ice close to 0°C. As the thermalconduction between the ice and the liquid fraction of a fragment is much better thanto the ambient atmosphere, the temperature of two fragments sliding or rolling on eachother is close to 0°C. As such, the rolling or sliding resistance of ice on ice at the freezingpoint might be calculated by evaluation of incomplete fragmentations as in figure 4.17,but the occurrence of suitable recordings is too rare (only four in several thousandsof experiments) for statistically reliable evaluation. Incomplete fragmentations weredisregarded for the measurements of break-up frequencies, as no visible ice multiplicationhad taken place.
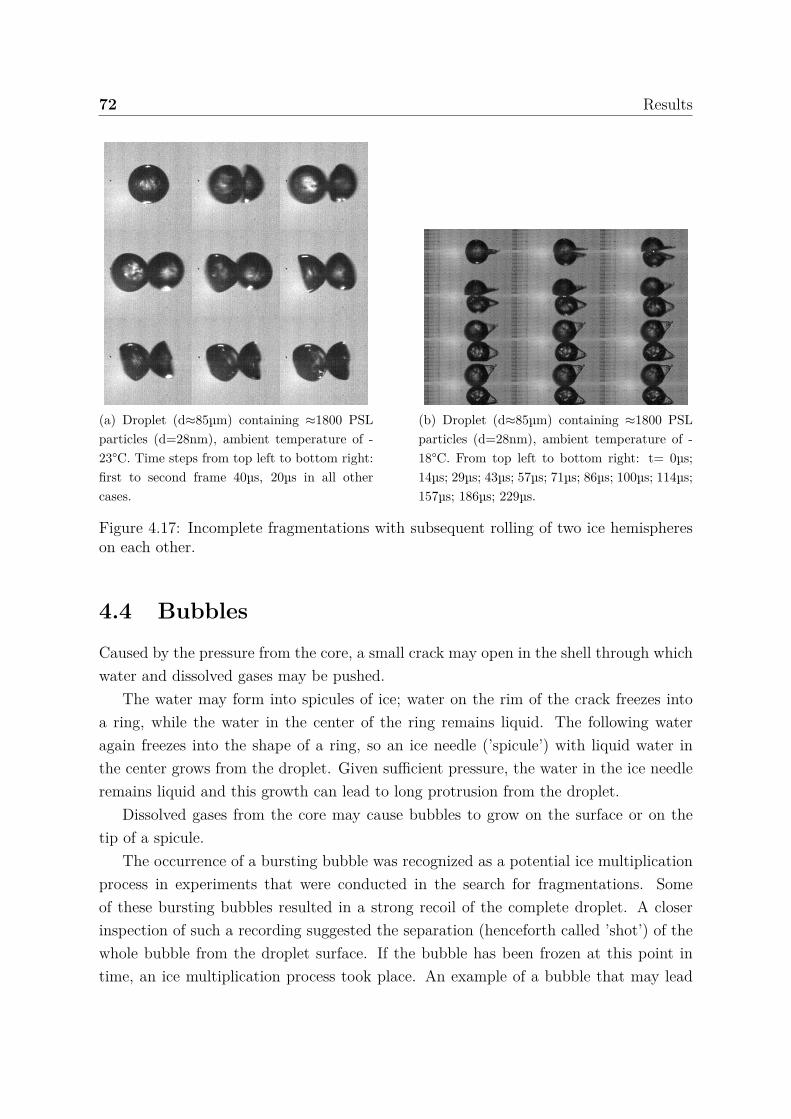
72 Results
(a) Droplet (d≈85µm) containing ≈1800 PSLparticles (d=28nm), ambient temperature of -23°C. Time steps from top left to bottom right:first to second frame 40µs, 20µs in all othercases.
(b) Droplet (d≈85µm) containing ≈1800 PSLparticles (d=28nm), ambient temperature of -18°C. From top left to bottom right: t= 0µs;14µs; 29µs; 43µs; 57µs; 71µs; 86µs; 100µs; 114µs;157µs; 186µs; 229µs.
Figure 4.17: Incomplete fragmentations with subsequent rolling of two ice hemisphereson each other.
4.4 Bubbles
Caused by the pressure from the core, a small crack may open in the shell through whichwater and dissolved gases may be pushed.
The water may form into spicules of ice; water on the rim of the crack freezes intoa ring, while the water in the center of the ring remains liquid. The following wateragain freezes into the shape of a ring, so an ice needle (’spicule’) with liquid water inthe center grows from the droplet. Given sufficient pressure, the water in the ice needleremains liquid and this growth can lead to long protrusion from the droplet.
Dissolved gases from the core may cause bubbles to grow on the surface or on thetip of a spicule.
The occurrence of a bursting bubble was recognized as a potential ice multiplicationprocess in experiments that were conducted in the search for fragmentations. Someof these bursting bubbles resulted in a strong recoil of the complete droplet. A closerinspection of such a recording suggested the separation (henceforth called ’shot’) of thewhole bubble from the droplet surface. If the bubble has been frozen at this point intime, an ice multiplication process took place. An example of a bubble that may lead
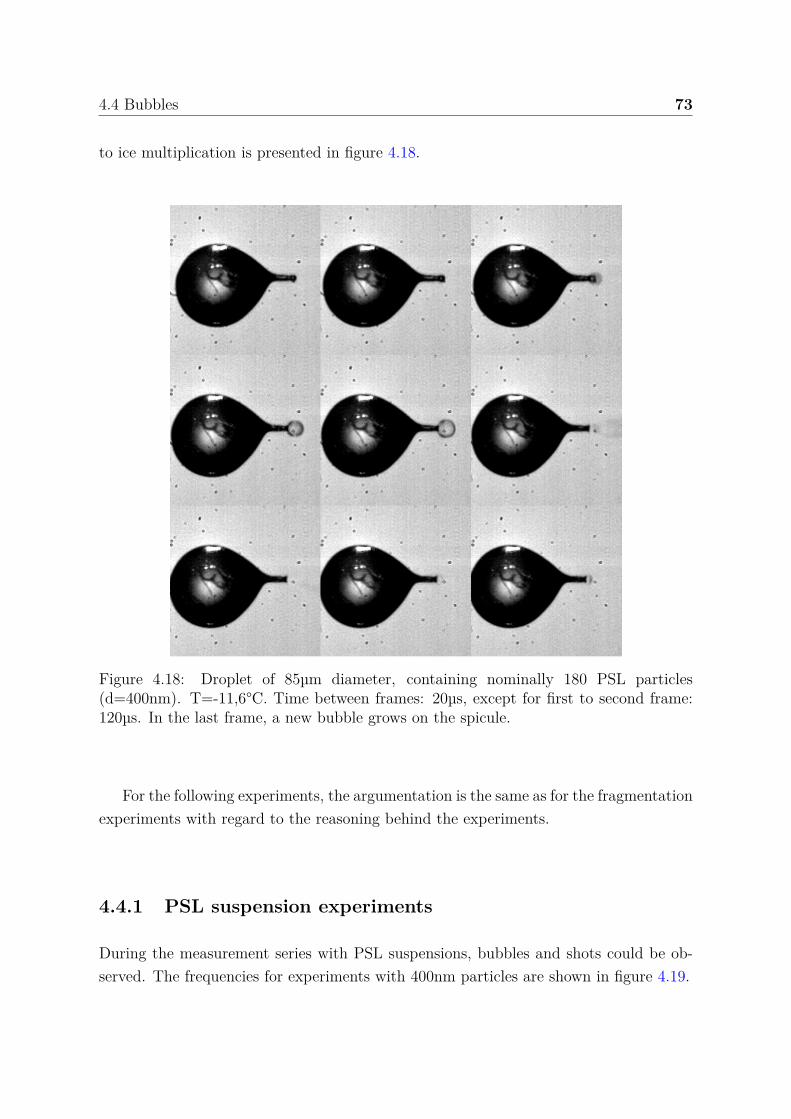
4.4 Bubbles 73
to ice multiplication is presented in figure 4.18.
Figure 4.18: Droplet of 85µm diameter, containing nominally 180 PSL particles(d=400nm). T=-11,6°C. Time between frames: 20µs, except for first to second frame:120µs. In the last frame, a new bubble grows on the spicule.
For the following experiments, the argumentation is the same as for the fragmentationexperiments with regard to the reasoning behind the experiments.
4.4.1 PSL suspension experiments
During the measurement series with PSL suspensions, bubbles and shots could be ob-served. The frequencies for experiments with 400nm particles are shown in figure 4.19.
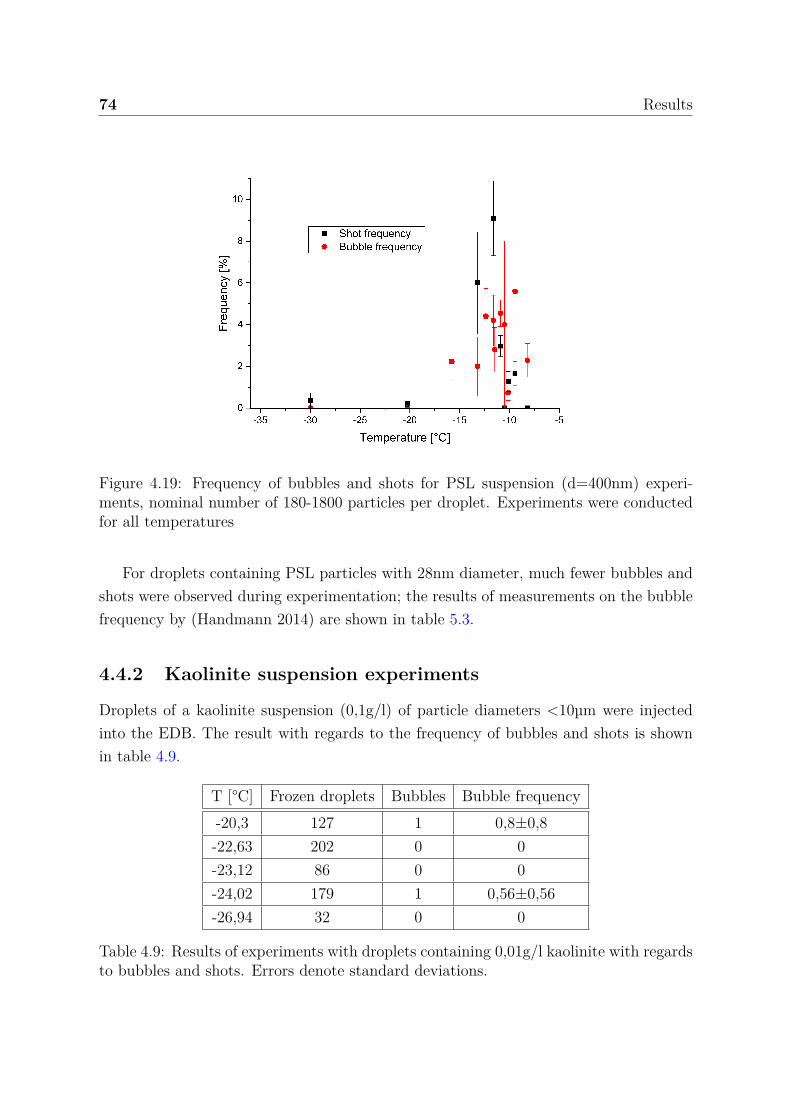
74 Results
Figure 4.19: Frequency of bubbles and shots for PSL suspension (d=400nm) experi-ments, nominal number of 180-1800 particles per droplet. Experiments were conductedfor all temperatures
For droplets containing PSL particles with 28nm diameter, much fewer bubbles andshots were observed during experimentation; the results of measurements on the bubblefrequency by (Handmann 2014) are shown in table 5.3.
4.4.2 Kaolinite suspension experiments
Droplets of a kaolinite suspension (0,1g/l) of particle diameters <10µm were injectedinto the EDB. The result with regards to the frequency of bubbles and shots is shownin table 4.9.
T [°C] Frozen droplets Bubbles Bubble frequency-20,3 127 1 0,8±0,8-22,63 202 0 0-23,12 86 0 0-24,02 179 1 0,56±0,56-26,94 32 0 0
Table 4.9: Results of experiments with droplets containing 0,01g/l kaolinite with regardsto bubbles and shots. Errors denote standard deviations.
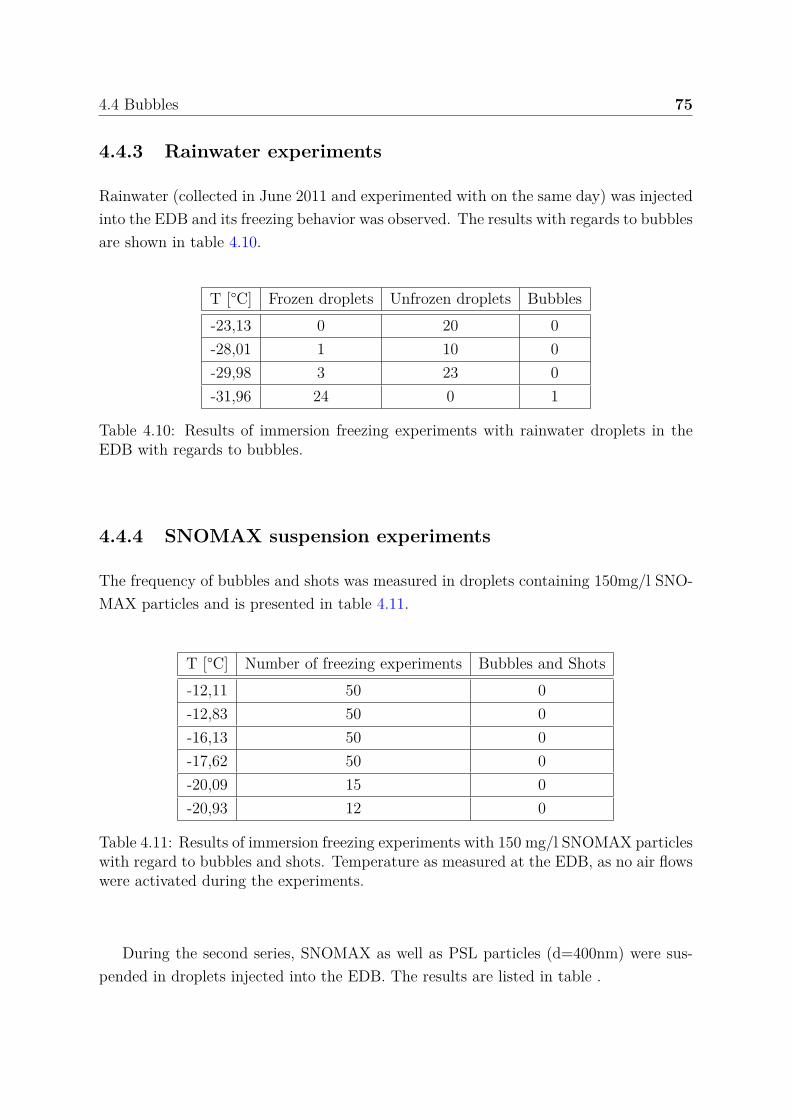
4.4 Bubbles 75
4.4.3 Rainwater experiments
Rainwater (collected in June 2011 and experimented with on the same day) was injectedinto the EDB and its freezing behavior was observed. The results with regards to bubblesare shown in table 4.10.
T [°C] Frozen droplets Unfrozen droplets Bubbles-23,13 0 20 0-28,01 1 10 0-29,98 3 23 0-31,96 24 0 1
Table 4.10: Results of immersion freezing experiments with rainwater droplets in theEDB with regards to bubbles.
4.4.4 SNOMAX suspension experiments
The frequency of bubbles and shots was measured in droplets containing 150mg/l SNO-MAX particles and is presented in table 4.11.
T [°C] Number of freezing experiments Bubbles and Shots-12,11 50 0-12,83 50 0-16,13 50 0-17,62 50 0-20,09 15 0-20,93 12 0
Table 4.11: Results of immersion freezing experiments with 150 mg/l SNOMAX particleswith regard to bubbles and shots. Temperature as measured at the EDB, as no air flowswere activated during the experiments.
During the second series, SNOMAX as well as PSL particles (d=400nm) were sus-pended in droplets injected into the EDB. The results are listed in table .
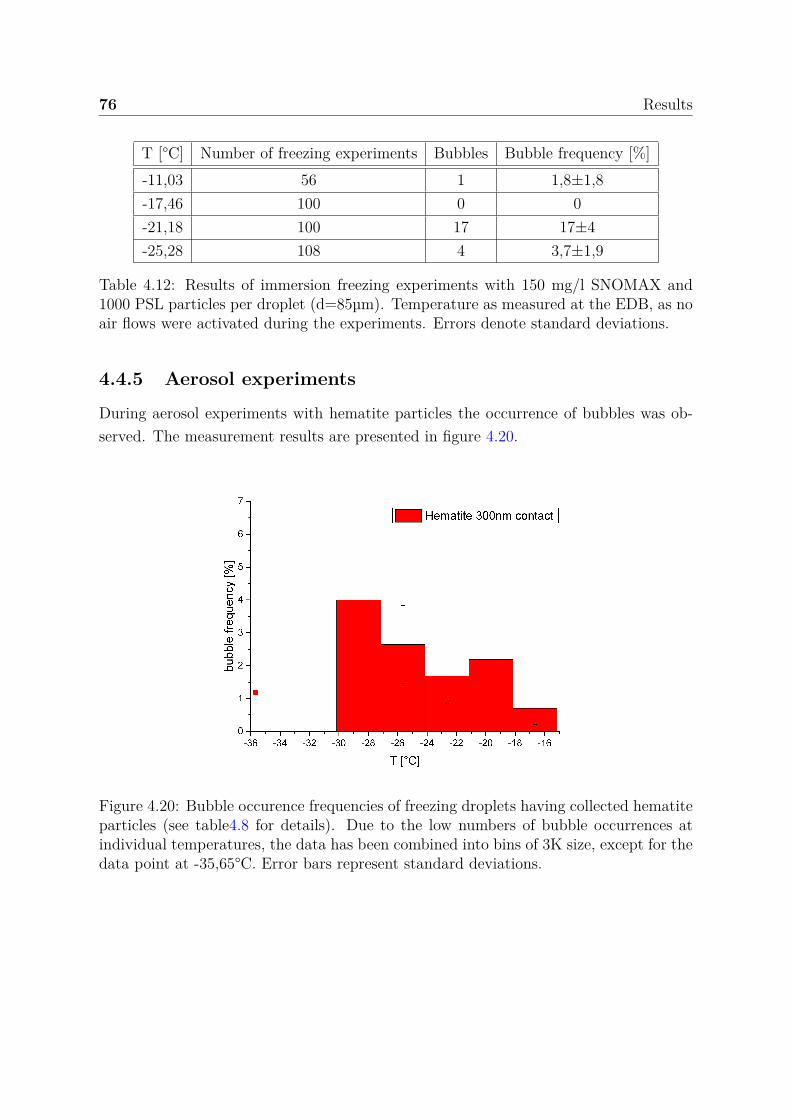
76 Results
T [°C] Number of freezing experiments Bubbles Bubble frequency [%]-11,03 56 1 1,8±1,8-17,46 100 0 0-21,18 100 17 17±4-25,28 108 4 3,7±1,9
Table 4.12: Results of immersion freezing experiments with 150 mg/l SNOMAX and1000 PSL particles per droplet (d=85µm). Temperature as measured at the EDB, as noair flows were activated during the experiments. Errors denote standard deviations.
4.4.5 Aerosol experiments
During aerosol experiments with hematite particles the occurrence of bubbles was ob-served. The measurement results are presented in figure 4.20.
Figure 4.20: Bubble occurence frequencies of freezing droplets having collected hematiteparticles (see table4.8 for details). Due to the low numbers of bubble occurrences atindividual temperatures, the data has been combined into bins of 3K size, except for thedata point at -35,65°C. Error bars represent standard deviations.
Chapter 5
Discussion
In this chapter, the results presented in the previous chapter are discussed.The observations on droplet size manipulation are critically evaluated for their ap-
plicability under experimental conditions.Consecutively, the results of fragmentation and bubble experiments are discussed
with attention to the materials different from water that were present in or on thedroplets during the experiments.
A possible link of fragmentations and bubbles to another ice multiplication mecha-nism, the Hallett-Mossop process, is explored.
The chapter ends with a critical review of the measurement results in comparison tothe literature.
5.1 Droplet size manipulation
5.1.1 Single pulse variation
Over a certain voltage (in these experiments, it was 50V), smaller droplets could begenerated with longer pulse widths (see figure 4.1b). The voltage may vary from injectorto injector, especially since new injectors tend to be operative at lower voltages thanold ones. A reduction to 80µm/90µm ≈ 89% in diameter was achieved, with a referencediameter dref of 90µm for this and the following experiments.
Single droplet pulse is not recommended for droplet size variation as it relies tooheavily on employing higher amplitudes which generally means faster droplets. Thismay impede droplet capture in the EDB.
78 Discussion
5.1.2 Double pulse variation
For a double pulse actuation signal (figure 4.2a), a droplet size reduction to 75µm/90µm ≈83% could be achieved (see figure 4.2). A further reduction by setting the second pulseheight to 75% of the first one was not observed.
In both experiment series, the droplet size showed a linear behavior with intervallength ti between the minimal interval length ti,min, below which reliable droplet gener-ation was not possible, and a maximal interval length ti,max beyond which the referencediameter was produced. This means that for ti ∈ [ti,min; ti,max], the droplet diametershould be continuously variable between the minimal droplet size fraction δ to 100%droplet size via
d(ti) = δ ∗ dref + (1−δ)dref
ti,max−ti,minti = 70µm + ti ∗ 0, 57µm
µs
for the presented results.Therefore double pulse variation offers a reliable way of limited droplet size variation.
5.1.3 W-shape pulse variation
A droplet size reduction to 57, 5µm/90µm ≈ 64% was measured with a suitable W-shapepulse signal (figure 4.3a) actuation. For the longest interval (ti = 260µs) between theW-shape and the single afterpulse, the droplet was ≈ 9µm larger than for shorter intervaltimes. For interval lengths between 200µs-240µs, the droplet sizes were the same in therange of errors.
The W-shape signal has the disadvantage of polarity change which can not be easiliyrealized in the power source employed in this experiment. The result may be interestingin the field of injector research in general but is of limited use for further experimentsat the experimental setup described in this thesis.
5.1.4 Triple pulse variation
The measurements with triple pulse actuation (figure 4.4) showed the most versatiledroplet size variation. Both droplet enlargement to 105µm/90µm ≈ 117% (figure 4.4b)reference size and reduction to 60µm/90µm ≈ 67% (figure 4.4d) reference size wereachieved.
In contrast to the results of double pulse actuation (discussed in chapter 5.1.2), thesize could not be varied continuously across the whole range. Instead, there were twodroplet size modes separated by a size gap: a mode of smaller droplets (60µm-80µm)and a mode of larger droplet around 105µm.
5.2 Ice propagation speed in a droplet 79
The data for large droplets are too closely grouped to see a trend with pulse widths.For the smaller mode, a trend for smaller droplets with shorter second pulse lengths isvisible, but only for longer first interval lengths (ti,1 ≥ 100µs).
Generally speaking, the following effects of pulse variations on droplet size werefound: shorter first and second pulses (figures4.4b, and 4.4c), longer third pulses (figure4.4d) and shorter intervals (figure 4.4b) lead to larger droplets, while the opposite is truefor smaller droplets.
5.1.5 Pulse combinations in the EDB
The measurement series on droplet was completed by measurements under workingconditions at the EDB, which meant that it was cooled down to a typical experimentaltemperature (-18°C). The results in figure 4.5b show the effect of several pulse shapeson droplet size; droplets in the range of d=(61 ± 16)µm = 61µm ± 26% with a referencesize of 64µm for single pulse actuation could be generated.
For the experiments at the EDB, no temperature control was included in the heatingmechanism of the injector’s reservoir, so the size difference of droplets to the previousexperiments is most likely caused by rapid droplet evaporation before capture. Thisleads to the conclusion that temperature control of the reservoir might offer an easyalternative to pulse shape variation. 1The limits lie in the temperature durability of theinjector and the liquid that is injected into the EDB.
Triple pulse signals were found to be just as suitable for droplet size reduction asa W-shape signal was, but with the advantage of consisting only of pulses of the samepolarity and the possibility of creating larger droplets as well.
At the IMK-AAF, Jens Nadolny modified the droplet capture and storage program ofthe EDB experiments to include the possibility for multiple pulse actuation with variableinterval lengths and pulse widths.
5.2 Ice propagation speed in a droplet
5.2.1 Growth modi
The distinction between dendritic growth, frontal growth and “zigzag” growth was jus-tified by their optical appearance in the droplet.
1Jens Nadolny at the IMK-AAF has since written a program with which the temperature of theheating element can be controlled.
80 Discussion
It may be argued that the distinction between planar and dendritic growth is onlybased on the orientation of the ice crystal growing in the droplet: a number of closelyspaced side branches of a dendrite might be conceived as planar growth if they allpropagate with the same speed through supercooled water, or a front of ice may appearas a needle if its orientation happened to be perpendicular to the plane of observation.
A previous investigation into the morphology of ice in supercooled water by [125]showed that, depending on temperature, different growth types are prevalent. Theyclaimed that at 12-21K supercooling, the fastest growth occurs in the shape of plateletswith a growth rate of the ice grain tip of v = 0, 18 ∗ 10−3∆T 2m/s, and that branched,dendritic or needle- like structures from 0,1-16 K supercooling propagate with v =0, 5 ∗ 10−3∆T 1,2. This has not been found in the experiments of this thesis: in the rangeof their errors, the propagation speeds of dendritically and frontally growing ice crystalsare the same (see figures 4.7b and 4.9).
It is noteworthy that the experiments of [125] were conducted on a much largerlengthscale of at least several mm, as have most other experiments that observed icepropagation in supercooled water. It has been documented by [128] that the size of acrystal may influence the further growth stability with regards to shape, so a comparisonto other studies about the shape of the crystals may be difficult.
For “zigzag” growth, a tendency for roughly two times longer first freezing steps incomparison to dendritic growth and planar growth (figure 4.7b) was measured. It seemsunlikely that this ice propagation occurred on the surface and not through the bulk ofthe droplet because this would require a curvature in the growing crystal, although itwould account for a longer freezing step time: the path around a droplet is by a factor ofπ longer than through a droplet. The explanation is more likely rooted in the shape ofgrowing ice in general. For a given ice crystal in supercooled water, two of three spatialdirections relative to the crystal orientation exhibit faster growth than the third one(see [84]). It may be assumed that the needle-like ice growth in figure 4.8 is actually anice crystal growing in a plane perpendicular to the plane of observation; so, once thiscrystal meets the water-air boundary, further growth can temporarily only occur in theslower direction. As soon as ice has propagated in the slow growth direction slightlyabove or below this plane of ice, fast propagation can take over again with a tilt relativeto the first plane because of the stronger temperature gradient at a certain distance tothe previously frozen water.
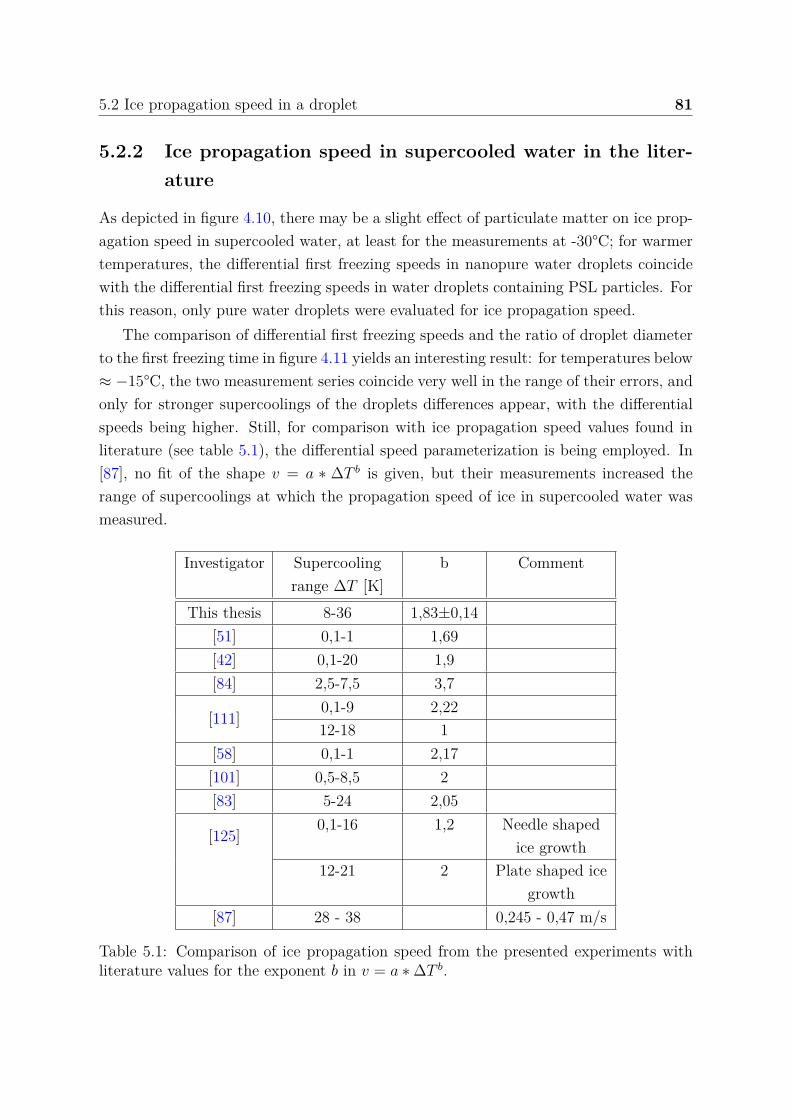
5.2 Ice propagation speed in a droplet 81
5.2.2 Ice propagation speed in supercooled water in the liter-ature
As depicted in figure 4.10, there may be a slight effect of particulate matter on ice prop-agation speed in supercooled water, at least for the measurements at -30°C; for warmertemperatures, the differential first freezing speeds in nanopure water droplets coincidewith the differential first freezing speeds in water droplets containing PSL particles. Forthis reason, only pure water droplets were evaluated for ice propagation speed.
The comparison of differential first freezing speeds and the ratio of droplet diameterto the first freezing time in figure 4.11 yields an interesting result: for temperatures below≈ −15°C, the two measurement series coincide very well in the range of their errors, andonly for stronger supercoolings of the droplets differences appear, with the differentialspeeds being higher. Still, for comparison with ice propagation speed values found inliterature (see table 5.1), the differential speed parameterization is being employed. In[87], no fit of the shape v = a ∗ ∆T b is given, but their measurements increased therange of supercoolings at which the propagation speed of ice in supercooled water wasmeasured.
Investigator Supercoolingrange ∆T [K]
b Comment
This thesis 8-36 1,83±0,14[51] 0,1-1 1,69[42] 0,1-20 1,9[84] 2,5-7,5 3,7
[111]0,1-9 2,2212-18 1
[58] 0,1-1 2,17[101] 0,5-8,5 2[83] 5-24 2,05
[125]0,1-16 1,2 Needle shaped
ice growth12-21 2 Plate shaped ice
growth[87] 28 - 38 0,245 - 0,47 m/s
Table 5.1: Comparison of ice propagation speed from the presented experiments withliterature values for the exponent b in v = a ∗ ∆T b.
82 Discussion
Their measurements are, in the range of errors, consistent with the fit to the data inthis thesis. The measured exponent in v = a ∗ ∆T b is slightly lower than most previousmeasurements (see table 5.1). This may be linked to the fact that the supercoolings ofthis thesis’ measurements exceeded the previous experiments by a several degrees on theone hand and to the upper temperature limit on the other: due to evaporative cooling, nomeasurements were made above -5°C. For a complete formula for the propagation speedof ice in supercooled water, these measurements would be necessary, especially if thefact is considered that the highest exponents in literature were fitted to measurementsthat covered higher temperatures. Observations at warm droplet temperatures close to0°C could be realized by adding water vapor to the air and aerosol stream, but thatwould mean that ice would grow in the EDB which would limit the experimentationtime before the EDB would have to be defrosted.
It actually has been observed that the air flow that passes through the flow con-troller decreases over time, especially at cold temperatures, which is caused by ice inthe air ducts through the EDB electrodes (see figure 3.1a). This situation would beexacerbated by adding even more water vapor to the flow, but at warm temperatures,the experimentation time might be sufficient for first freezing speed measurements.
For the aerosol flow, adding water vapor might lead to droplet nucleation. If the pointof aerosol experiments is to investigate aerosols in contact with the droplet surface, theammount of water would have to be well-controlled to prevent droplet nucleation; butit might be useful to have a calculable number of droplets, each containing one aerosolparticle, to impinge on a droplet. With ice-active aerosols, the position of particlesimmersed in a droplet might be learned from observing the point of ice nucleation.Having droplets containing particles hit a larger droplet might also lead to immersionfreezing measurements with a lower level of uncertainty of particle surface. But climatechamber experiments like the AIDA [89] or the upcomming AIDA-2 at the IMK-AAFare better suited for immersion freezing experiments due to the large number of dropletsthat can be observed at the same time for statistically reliable statements.
5.3 Fragmentations
5.3.1 The energy of fragments
One of the experimental boundary conditions is the electric charge that allows for dropletlevitation and is generally not found in cloud droplets or ice particles outside of severelightning storms. It is thus necessary to compare the potential energy Eel that derives
5.3 Fragmentations 83
from charge repulsion to the kinetic and rotational energies of a fragmenting freezingdroplet to estimate the atmospheric relevance of break-ups. A simple approximation isgiven by two charges of half the droplet’s total charge q in a distance of half a dropletdiameter d, which is given by Eel = 1
8πϵϵ0
(q/2)2
dwith the vacuum permittivity ϵ0 and
the assumption of a permittivity ϵ = 1 for air. For a typical charge of q = 15Me− =2, 4∗10−12C and d = 80µm, the potential electric energy ammounts to Eel = 7, 6∗10−11J
. The typical kinetic energy of a fragmenting droplet was in the order of Ekin =4 ∗ 10−10J (see 4.16), the largest rotational energies measured were in the order ofErot = 1, 84∗10−10J at fragment rotations of up to 9000Hz. This discrepancy in energiesleads to the conclusion that the influence of the electric charge on the droplet is of minor,if any, importance to the fragmentation process.
5.3.2 PSL suspension experiments
The largest number of experiments was conducted with droplets containing PSL particlesof two diameters (28nm and 400nm) at nominal particle concentrations per droplet(calculated for a diameter of 85µm ) ranging from 3,6 to 1800. Freezing was causedby ice crystals impinging onto the droplet surface, so contact nucleation took place. Itmay be argued that the mode of nucleation is of no consequence to the occurrence offragmentations; the process that is identified to be the cause, that is, the pressure buildup in a liquid core surrounded by an ice shell, is independent of the way ice is nucleatedin the first freezing step. Once an ice shell has grown around the spongy ice-watermixture in the core, pressure rises and the ice in the core is melted (see equation 2.11).So, any structural differences that might have existed between ice nucleated by contactfreezing or immersion freezing are expected to have vanished at the point in the freezingprocess when fragmentations take place, at least if the bulk volume of the droplet isconsidered.
In figure 4.12, it is noticeable that the particle numbers per droplet seem to be ofno effect on the fragmentation frequency in the range of the standard deviations of themeasurements for each particle size. The conclusion is that there is a saturation numberof particles in a droplet beyond which the frequency of fragmentations stays constant.In this sense, the measured values represent the upper limit of ice multiplication byfragmentation for the given droplet size and particles in the droplet.
It is reasonable to assume that fragmentations occur with comparable frequencies forparticle sizes between 28nm and 400nm. The theory brought forward in this thesis isthat the particles function as lattice defects in the ice at which cracks can nucleate oncethe pressure from the core is high enough, and neither is a particle diameter of 28nm
84 Discussion
the lower limit nor is a particle diameter of 400nm the upper limit.A close look at figure 4.12 reveals several data points (e.g., at -15°C) which show
a much lower fragmentation frequency than data points in adjacent temperature in-tervals. The reason for this probably lies in an experimental boundary condition: inlong experiment series exceeding 45 minutes with the same injector, fragmentation fre-quency reduced over time until no more fragmentations could be observed, no matterthe frequency at the beginning of a measurement series. This can be attributed to atime-dependent depletion of particles caused by sedimentation and Brownian motion inthe injector. In experiments after the effect of reduced fragmentation over time wasrecognized, the experimental time was reduced to a maximum of 30 minutes.
5.3.3 Kaolinite suspension experiments
In experiments with suspensions of the clay mineral kaolinite at sizes smaller than 10µmfragmentations were observed. The measured fragmentation frequencies were lower thanin PSL experiments at the same temperatures except for the measurements at -26,94°C.The small number of experiments (4 fragmentations in 32 freezing experiments) leadsto an error of 50% on the frequency, though. Notably, there were no fragmentationsat -22,63°C and -23,12°C, but at temperatures both higher and lower. Assuming thesame effects at work as in the experiments with PSL particles, one would not expecta complete suppression of fragmentation between two temperatures at which break-upsoccurred. The lack of ice multiplication at these two temperatures may be explainedwith sedimentation in the liquid reservoir of the injector or in the injector itself; thespecific weight of kaolinite is 2,63 times higher than of water, so it has a considerableterminal falling velocity which leads to a depletion of kaolinite in the injector and conse-quently the droplets. Assuming a reservoir thickness of 500µm, kaolinite spheres largerthan 1µm sediment out in less than 6 minutes; platelets of 100µm would need morethan nine and a half hours for the whole distance, though, so it may be assumed thataggregation of smaller particles to clusters or onto larger particles has taken place. Thisis quite common for clay minerals and can be seen under an environmental scanningelectron microscope (figure 3.3d).
While it is interesting to see fragmentations in droplets containing atmosphericallyrelevant particles, the rough classification of size distribution and consequently parti-cle number per droplet allows for little more than the qualitative confirmation of thefragmentations.
5.3 Fragmentations 85
5.3.4 Dilution and solution experiments
The effects of solutes on the occurrence of fragmentations has been investigated.In the first experiment, a PSL solution of 400nm particles has been filtered through
a cellulose acetat filter with a filter size of nominally 200nm, so all particles were ex-pected to be removed after the solution has passed the filter. The measurements showa reduction in fragmentation frequency by a factor of ≈5 (see figure 4.13). If dissolvedmaterials in the suspension aside from PSL were the sole cause of fragmentations, noreduction in break-up occurrence would have been found. If, on the other hand, only thepresence of particles in a droplet are expected to promote fragmentation, there shouldbe no fragmentations whatsoever in suspensions filtered for particles. It may thus bepossible that the combination of particles and solutes is the answer to the question whatcauses fragmentations. It seems more likely, though, that the filter used is not completelyeffective at removing particles of double the nominal filtering size. This conclusion willhave to be considered in future experiments with filtered suspensions.
A second experiment for the influence of solutes was conducted with a sodium chloridesolution of 12,98g/l, which is roughly comparable with sea water (which contains ≈30g/l). During several hundred experiments across temperatures at which fragmentationshad been observed in PSL solutions (see table 4.4), only one droplet break-up at -8°C wasobserved. For the number of conducted experiments, this would lead to a fragmentationfrequency of 2% +/- 2%. As in all experiments in the EDB, a particle contaminationin the droplet could not be excluded with certainty, so the fragmentation might beinfluenced by a random particle. But even if only water and sodium chloride werepresent in the droplet at the moment of fragmentation, the frequency is still much lowerthan with particles present during experiments with PSL suspensions. The observedhigher opacity and brine pockets in the frozen droplet point to a more porous structurewhich should reduce the probability of a fragmentation because of the reduced stabilityof the ice shell. The process of fragmentation is based on a stable ice shell up to thepoint when a failure at one point in the material leads to crack propagation on thescale of the whole droplet; if material failure occurs locally before the tensile stresses aresufficient for fracture in adjacent volume elements, or a pocket of brine is reached, crackpropagation stops and fragmentation does not occur. The gradual failure of such weakspots are likely to prevent pressure build-up to a level at which the whole shell breaks.
These deliberations are supported by [91], in which the “addition of ammonia isthought to weaken the ice structure, thus allowing pressure to be relieved by deforma-tion or cracking without ejection of splinters”. [14, 86] found similar results with sodiumchloride solutions (see chapter 5.6).
86 Discussion
The measurements of fragmentation frequencies in droplets containing polystyrenespheres suggested that the number of particles in the droplet has no influence beyond acertain point. To appraise this thesis, a dilution experiment was conducted up to a pointat which nominally one in a million droplets would be expected to contain a particle. Theresults (see figure 4.14) showed a slight trend of reduction of fragmentation frequency thethinner solutions became, but the ranges of errors would also allow for all measurementsto yield a constant break-up frequency of ≈10%. An explanation may be found in aneffect which reduces the efficiency of the dilution process, meaning more particles arecarried over during a dilution than expected from the ration of the sample and thebulk mixing volume. One of these effects may lie in the behavior of PSL particles ata water-air boundary. As laid out in chapter 2.2.3, particles smaller than 5µm have atendency to remain at the boundary, even if they are wettable and have specific weightsconsiderably higher than those of water. At the moment a pipette passes through thewater surface in a container of solution, a fraction of this surface and consequently ofthe particles is entrained into the pipette, so the actual concentration of particles after adilution may be higher than calculated from the ratios of sample volume and new bulkmixing volume. A second possibility lies in the shelf life of polystyrene particles: theymay deteriorate in time and break down into smaller particles, and the surfactants inthe suspension used to keep the polystyrene spheres from coagulating may aggregateon those fragments or form new particles by themselves. This interpretation leads tothe question of how small particles in a droplet can be before fragmentation no longeroccurs; the particles were only 28nm of diameter to begin with which is only about twoorders of magnitude larger than a water molecule.
So, the problem of the critical number of particles in a droplet to cause fragmentationis unsolved, especially with regards to the question if a single particle might be sufficientfor a break-up.
5.3.5 SNOMAX suspension experiments
While the experiments with rainwater in the EDB (table 4.5) did not show fragmen-tations, the measurements illustrated the scarcity of ice nuclei in atmospheric aerosols.Only at -31,96°C, all droplets (d=80µm) froze through nucleation by immersed particles,which includes particles collected during the precipitation from the lower troposphere.
The experiment series with SNOMAX suspensions led to a surprising result. With150 mg/l, heterogeneous ice nucleation in each droplet occurred within 30 seconds, butno fragmentations were observed (see table 4.6). The same was true for immersion

5.3 Fragmentations 87
freezing experiments with droplets containing both 150 mg/l SNOMAX and ≈ 1000PSL(d=400nm) particles.
These results may be linked to the considerations concerning sodium chloride freezingexperiments. The high concentration of SNOMAX was chosen to ensure heterogeneousice nucleation in all droplets within 30 seconds; for e.g., 75 mg/l SNOMAX, this wasnot the case. While the high concentration allowed for reliable freezing nucleation, therewas the downside of solubles in the droplet that may have had a weakening effect on theice shell, so fragmentation was suppressed. The same argumentation can be applied todroplets that also contained PSL particles.
5.3.6 Aerosol experiments
After expanding the experimental setup with an SMPS system (see chapter 3.2), particles(see projected particle number per droplet in table 4.8) were collected on the droplet for30 seconds before freezing was nucleated with ice particles. The results are presentedin figure 4.15 for the three aerosols involved. The first noticeable fact is the occurrenceof fragmentations. Following the theoretical considerations in chapter 2.2.3, particlescollected by the droplet should remain on its surface. This is reflected in the submersiondepths of aerosols given in table 5.2.
Aerosol diameter [nm] θc[°] submersion depth [nm] source for θc
PSL 145 86 67 [144]Hematite 300 47 48 [123]
Table 5.2: Contact angles θc and submersion depths of the aerosols employed in thisthesis, calculated with equation 2.35.
This means that the minimal lattice defect caused by the particle fraction that issubmersed is sufficient to facilitate crack nucleation during freezing and promote frag-mentation.
Within their error bars, the fragmentation frequencies for aerosoluted PSL particlescoincide with the measurements of immersed PSL particles (see figure 4.12), but therewere also measurement points at -22,7°C,-18,4°C and -16,6°C where no fragmentationswere observed. The most likely explanation lies in the number of particles collected.The deviations in particles collected per droplet from the expectancy value are 71%, soit is well possible that too few experiments were conducted at those temperatures as toobserve fragmentations with a good probability. Still, in the range of errors, it seems
88 Discussion
that 40-140 PSL particles on a droplet surface may cause fragmentation of the dropletduring freezing.
Only few fragmentations were observed which led to low fragmentation frequencies inexperiments with SNOMAX (one fragmentation at -25,76°C, with an expected numberof SNOMAX particles of 3±3 on the droplet) and hematite particles (one fragmentationeach at -21°C and at -18,38°C, with an expected number of hematite particles of 5±5 onthe droplet). SNOMAX is used as an ice nucleus for snow cannons on ski pistes, but theaerosol did not nucleate ice in most experiments. The reason is that only ≈10% of allparticles of 300nm carry a protein group capable of ice nucleation at warm temperatures(> 12°C).
It has been established that pure water droplets exhibit virtually no fragmentationsin [103] across the temperature range investigated in this thesis, a fact that repeat-edly has been used to examine the injector for residual particles between experimentswith different suspensions. And while the statistical basis is small, the consequence ofthese aerosol measurements is that 1-6 particles (for SNOMAX) and 1-10 particles (forhematite) respectively on a droplet surface may be sufficient to cause fragmentation dur-ing freezing. This is of relevance for atmospheric conditions, as drizzle drops levitated inupdrafts may collect entrained aerosols and small droplets, which each contain at leastone aerosol particle unless they have nucleated onto pure salt particles.
5.4 Bubbles
5.4.1 On the phase of bubble fragments
Bursting bubbles are a phenomenon of global importance as sea spray aerosols contributeto the aerosol concentration in marine areas (for a review of the aerosol fluxes, see [23]).This contribution results from residuals of dried film and jet droplets.
In this thesis, bubbles growing on freezing water droplets were observed and theirfrequency was measured in dependence of temperature and particulate matter on andin the droplet. A detailed look into the properties these bubbles is to be found in [45]who worked at the same experimental setup.
As the focus of the experiments lay on ice multiplication processes, the questionarises whether bursting bubbles produce ice or not.
5.4 Bubbles 89
5.4.1.1 The phase of shots
In the case of shots, meaning visible fragments of the bubble separating from the freezingdroplet at high speeds, it seems clear that ice multiplication has taken place.
Previous measurements and theoretical calculations in the literature (laid out inchapter 2.1.3) give an insight into the mechanisms involved in droplet generation bybursting bubbles and the properties of these droplets.
Firstly, the the retraction of the liquid bubble film after a hole has nucleated needsto occur; this has not been observed in the events called shots.
Secondly, the size of the fragment seems to be identical to the bubble itself, althoughthe fast motion of the fragments blurred their image. Film droplets and jet droplets aremuch smaller than the bubble itself.
In addition to the insights from literature on bubbles, there is the observation that thebubble seems to keep its shape points after separation from the bubble. As an estimatefor the time a free bubble would need to contract to a droplet, the bubble radius R
can be divided by the Taylor-Culick speed vT −C =√
2σ/ρh for retracting films whichleads to a time scale for the bubble contraction. Even for bubbles of 10µm diameterand 3µm thickness, which is well in excess of any bubbles observed for this thesis, thiscontraction time would be 2µs which is much shorter than the time between two framesin the investigated recordings.
These arguments lead to the conclusion that shots consist of ice.It is argued that a liquid bubble, inflated by dissolved gases pushed through a channel
in the shell, freezes by contact with the ice shell on which it grew. Once enough dissolvedgases get pushed through the channel, the ice breaks at its weakest point, which just atthe foot of the bubble (established in [78]), and the ice bubble is propelled away by bothgas pressure and electrostatic repulsion. The force on the frozen bubble caused by thegases from the core is by several orders of magnitude larger than the Coulomb repulsion,so this process is not limited to charged droplets.
5.4.1.2 The phase of bursting bubble fragments
If a bubble bursts before ice nucleation has taken place, only liquid, if any, droplets areejected.
For small bubbles, it may be possible that shots take place without visible ejectionof fragments or a recoil in the droplet. But as the recoil of a confirmed shot on thedroplet has generally been noticeable, it seems doubtful if most bursting bubbles createdsecondary ice.
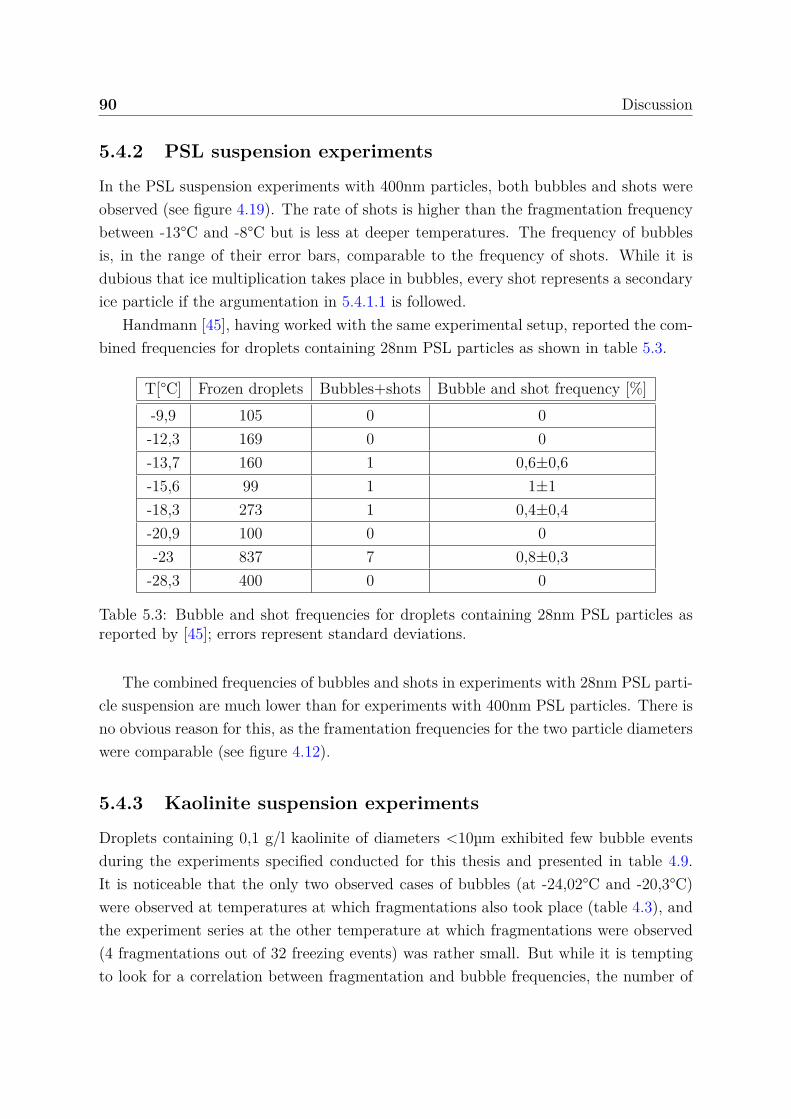
90 Discussion
5.4.2 PSL suspension experiments
In the PSL suspension experiments with 400nm particles, both bubbles and shots wereobserved (see figure 4.19). The rate of shots is higher than the fragmentation frequencybetween -13°C and -8°C but is less at deeper temperatures. The frequency of bubblesis, in the range of their error bars, comparable to the frequency of shots. While it isdubious that ice multiplication takes place in bubbles, every shot represents a secondaryice particle if the argumentation in 5.4.1.1 is followed.
Handmann [45], having worked with the same experimental setup, reported the com-bined frequencies for droplets containing 28nm PSL particles as shown in table 5.3.
T[°C] Frozen droplets Bubbles+shots Bubble and shot frequency [%]-9,9 105 0 0-12,3 169 0 0-13,7 160 1 0,6±0,6-15,6 99 1 1±1-18,3 273 1 0,4±0,4-20,9 100 0 0-23 837 7 0,8±0,3
-28,3 400 0 0
Table 5.3: Bubble and shot frequencies for droplets containing 28nm PSL particles asreported by [45]; errors represent standard deviations.
The combined frequencies of bubbles and shots in experiments with 28nm PSL parti-cle suspension are much lower than for experiments with 400nm PSL particles. There isno obvious reason for this, as the framentation frequencies for the two particle diameterswere comparable (see figure 4.12).
5.4.3 Kaolinite suspension experiments
Droplets containing 0,1 g/l kaolinite of diameters <10µm exhibited few bubble eventsduring the experiments specified conducted for this thesis and presented in table 4.9.It is noticeable that the only two observed cases of bubbles (at -24,02°C and -20,3°C)were observed at temperatures at which fragmentations also took place (table 4.3), andthe experiment series at the other temperature at which fragmentations were observed(4 fragmentations out of 32 freezing events) was rather small. But while it is temptingto look for a correlation between fragmentation and bubble frequencies, the number of
5.4 Bubbles 91
counted fragmentations and bubbles is too small to make reliable statements on thissubject from the kaolinite suspension experiment series.
5.4.4 SNOMAX suspension experiments
For droplets containing 150mg/l SNOMAX particles, neither bubbles nor shots wereobserved in the temperature range from -12°C to -21°C (table 4.11). This might beattributed to a weakening effect of solubles on the ice shell, so no cracks form that reachfrom the liquid core to the atmosphere; pressure is relieved through internal cracks ordeformations.
For droplets containing both 150mg/l SNOMAX particles and ≈1000 PSL (d=400nm)particles, this argument fails, as bubbles were observed with a frequency maximum of17±4% at -21°C (table 4.12). Apparently, the weakening effect on the ice caused bysolubles in the SNOMAX suspension can not prevent the occurrence of cracks from thecore to the shell promoted by the presumed lattice defects caused by the PSL particles.
In comparison to the results regarding fragmentations discussed in chapter 5.3.5 thereis a clear difference; while fragmentations were apparently suppressed by the SNOMAXsuspension under the experimental conditions, bubbles were not. Following this argu-mentation, this means that bubbles require a less pronounced pressure build-up in thefreezing water core.
5.4.5 Hematite aerosol experiments
Freezing droplets that had collected few (≈ 1-10) hematite particles from an aerosolstream exhibited bubbles (see figure 4.20). This result is just as remarkable as the oc-currence of fragmentations discussed in chapter 5.3.6, as the particles are only submersedfor a fraction of their diameter (table 5.2) - yet their presence promotes cracks in thedroplet’s ice shell. While there were no shots observed, and the occurrence of bubblesdoes not necessarily mean ice multiplication, this is certainly interesting from the pointof material science. Again, this may mean that larger (≈300µm) droplets in updraftsmay cause ice enhancement once they freeze.
5.4.6 Bubbles per bubble event
Handmann [45] reported that during each event in which bubbles or shots were observed,2 - 6 bubbles or shots were counted. This means that “shot” events have the potentialto be an effective ice multiplication mechanism and might mean ice multiplication if
92 Discussion
bubbles produce ice. The probability of this happening in the atmosphere might be low,though, as the air pressure and consequently the gas concentration in freezing dropletsdecreases with height. Less gas in the droplet would probably also mean less bubblesand shots. For droplets below 3km altitude, though, the gas content is larger than 2/3of the gas content at 1 atmosphere, so multiple shots and bubbles might still be possible.
5.5 A possible link to the Hallett-Mossop processThe observations in the droplet evaporation speeds showed a shift in the temperaturemeasured at the EDB and the temperature in the droplet (see figure 3.7). All othermeasurements had to be calibrated for this effect, which led to a measurement gap forexperiments with dry ice nucleations between -8°C and 0°C (figure 3.7a) for experimentswith a low flow through the EDB (PSL suspensions nucleated with dry ice). For highflow experiments (PSL suspensions nucleated with SNOMAX particles size-selected witha classifier), this gap lay between -16°C and 0°C (figure 3.7b). In experiments whereno flow was applied (SNOMAX, illite suspension immersion freezing experiments), thetemperature shift was small (figure 3.7b).
While the temperature range in which fragmentations took place most frequently,that is between -22°C and -12°C, was generally covered experimentally, the lack of mea-surements at warmer temperatures is regrettable insofar as the Hallett-Mossop process,generally regarded to be the most effective ice multiplication process, is claimed to occurin the range of -8°C to -3°C (see figure 5.1).
In following experiments, it was found that “on average, one secondary ice crystal isproduced for every 250 drops ≥24µm diameter accreted at a temperature −5 ± 0, 5°C.”[90]. ”Later it was found that the cloud should also contain small drops . 12µm di-ameter.” [92]. The Hallett-Mossop process does not take place in single droplets but isdependent on a small droplet impinging onto a larger ice particle, the so-called rimer.Heat conduction from the small droplet is
1. not symmetric
2. much faster for a given temperature
It can be argued that the heat conduction to the ice does not dominate the secondfreezing step completely but that an appreciable fraction of heat is conducted throughthe droplet surface in contact with air, so that there still is a surrounding ice shellgrowing into a liquid core with a faster growth component from the direction of the areain contact with the rimer.
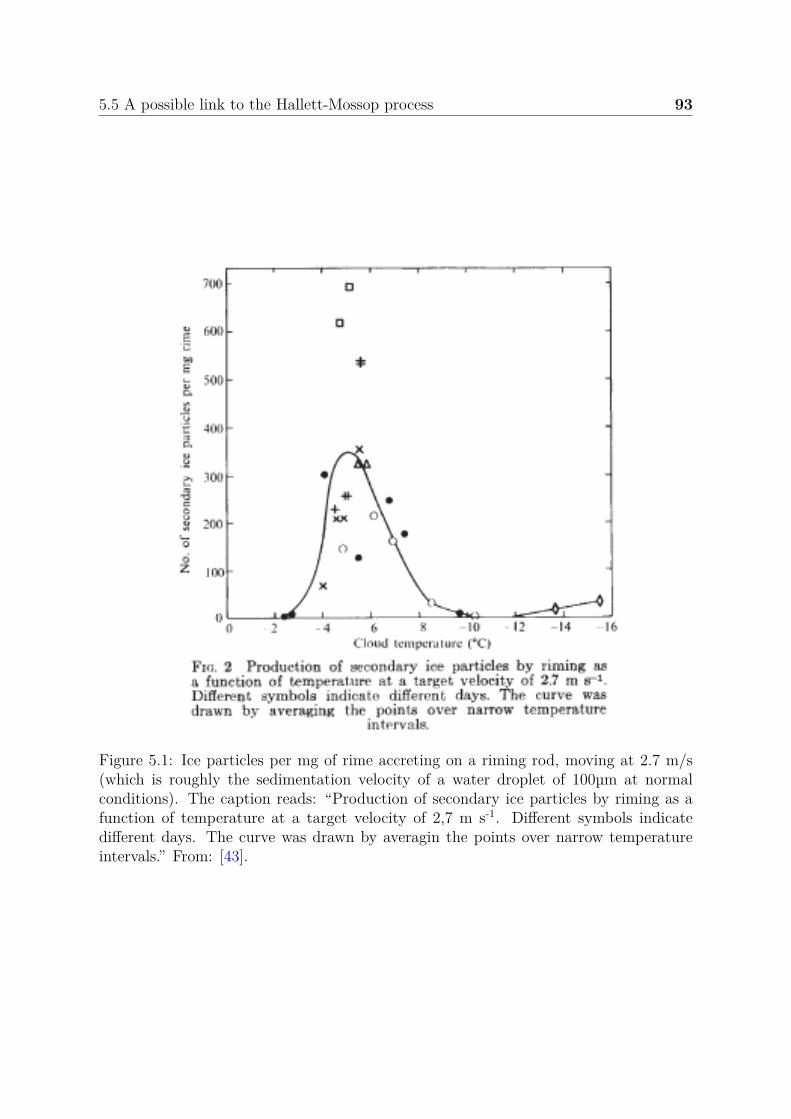
5.5 A possible link to the Hallett-Mossop process 93
Figure 5.1: Ice particles per mg of rime accreting on a riming rod, moving at 2.7 m/s(which is roughly the sedimentation velocity of a water droplet of 100µm at normalconditions). The caption reads: “Production of secondary ice particles by riming as afunction of temperature at a target velocity of 2,7 m s-1. Different symbols indicatedifferent days. The curve was drawn by averagin the points over narrow temperatureintervals.” From: [43].
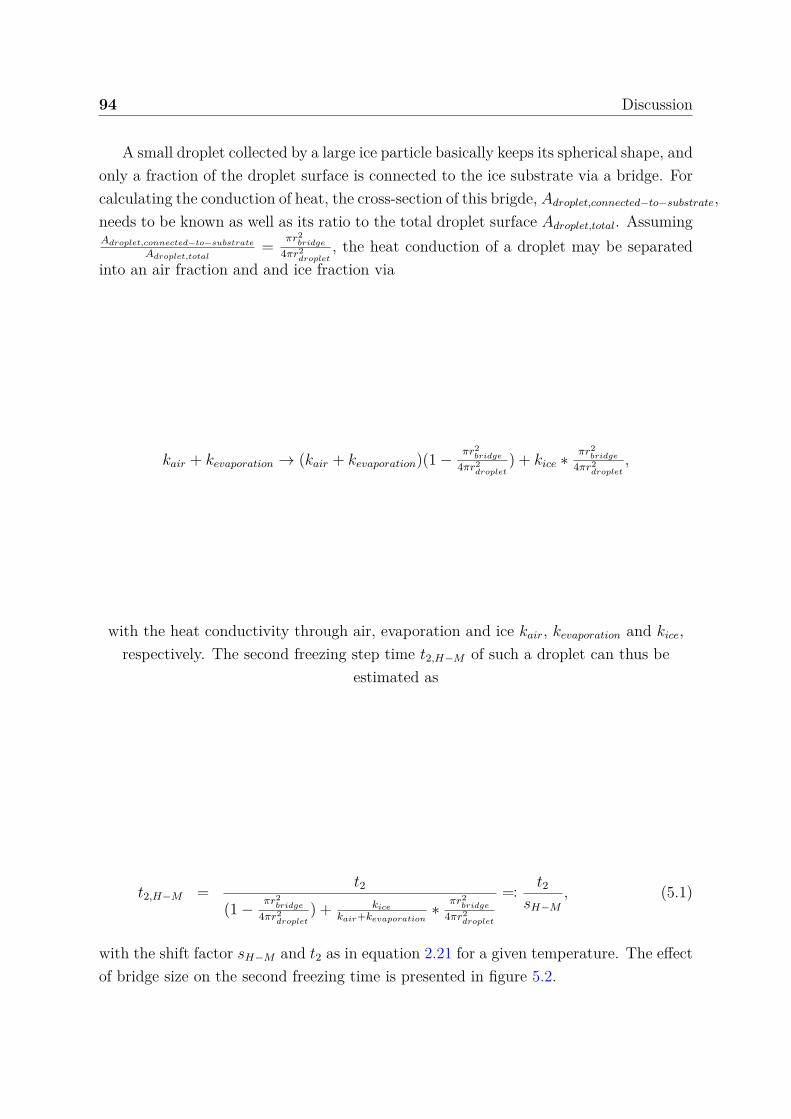
94 Discussion
A small droplet collected by a large ice particle basically keeps its spherical shape, andonly a fraction of the droplet surface is connected to the ice substrate via a bridge. Forcalculating the conduction of heat, the cross-section of this brigde, Adroplet,connected−to−substrate,needs to be known as well as its ratio to the total droplet surface Adroplet,total. AssumingAdroplet,connected−to−substrate
Adroplet,total= πr2
bridge
4πr2droplet
, the heat conduction of a droplet may be separatedinto an air fraction and and ice fraction via
kair + kevaporation → (kair + kevaporation)(1 − πr2bridge
4πr2droplet
) + kice ∗ πr2bridge
4πr2droplet
,
with the heat conductivity through air, evaporation and ice kair, kevaporation and kice,respectively. The second freezing step time t2,H−M of such a droplet can thus be
estimated as
t2,H−M = t2
(1 − πr2bridge
4πr2droplet
) + kice
kair+kevaporation∗ πr2
bridge
4πr2droplet
=: t2
sH−M
, (5.1)
with the shift factor sH−M and t2 as in equation 2.21 for a given temperature. The effectof bridge size on the second freezing time is presented in figure 5.2.
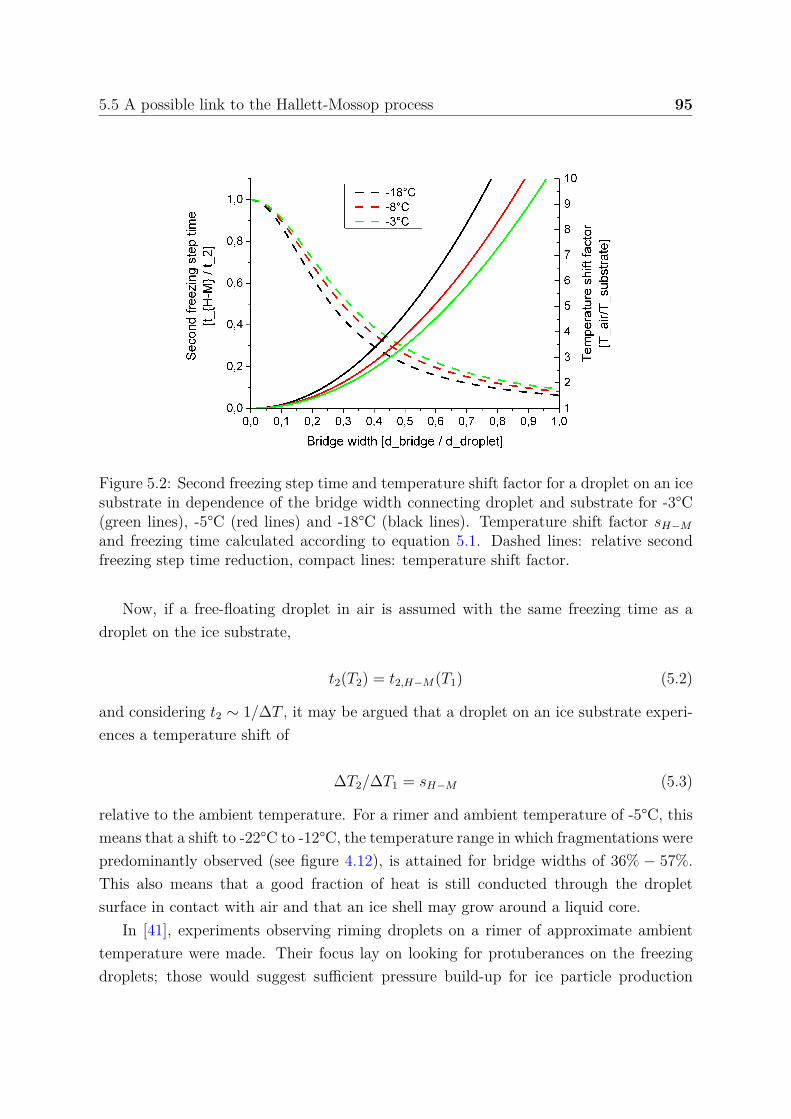
5.5 A possible link to the Hallett-Mossop process 95
Figure 5.2: Second freezing step time and temperature shift factor for a droplet on an icesubstrate in dependence of the bridge width connecting droplet and substrate for -3°C(green lines), -5°C (red lines) and -18°C (black lines). Temperature shift factor sH−M
and freezing time calculated according to equation 5.1. Dashed lines: relative secondfreezing step time reduction, compact lines: temperature shift factor.
Now, if a free-floating droplet in air is assumed with the same freezing time as adroplet on the ice substrate,
t2(T2) = t2,H−M(T1) (5.2)
and considering t2 ∼ 1/∆T , it may be argued that a droplet on an ice substrate experi-ences a temperature shift of
∆T2/∆T1 = sH−M (5.3)
relative to the ambient temperature. For a rimer and ambient temperature of -5°C, thismeans that a shift to -22°C to -12°C, the temperature range in which fragmentations werepredominantly observed (see figure 4.12), is attained for bridge widths of 36% − 57%.This also means that a good fraction of heat is still conducted through the dropletsurface in contact with air and that an ice shell may grow around a liquid core.
In [41], experiments observing riming droplets on a rimer of approximate ambienttemperature were made. Their focus lay on looking for protuberances on the freezingdroplets; those would suggest sufficient pressure build-up for ice particle production
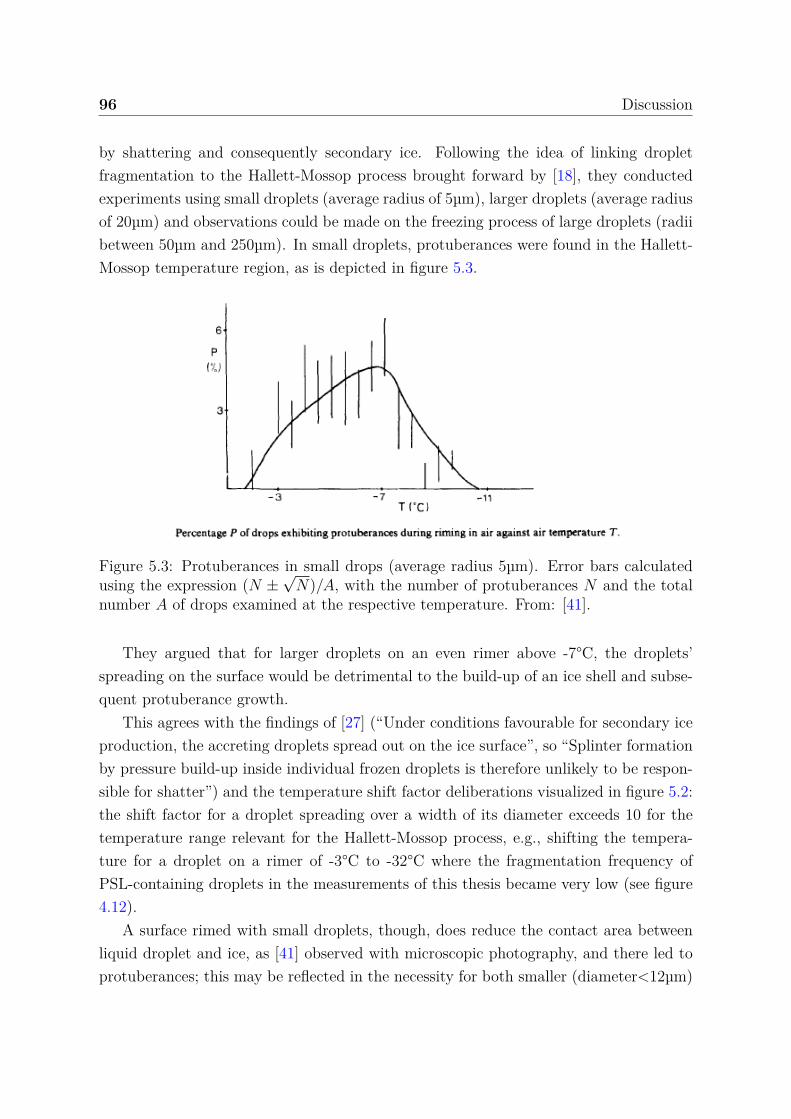
96 Discussion
by shattering and consequently secondary ice. Following the idea of linking dropletfragmentation to the Hallett-Mossop process brought forward by [18], they conductedexperiments using small droplets (average radius of 5µm), larger droplets (average radiusof 20µm) and observations could be made on the freezing process of large droplets (radiibetween 50µm and 250µm). In small droplets, protuberances were found in the Hallett-Mossop temperature region, as is depicted in figure 5.3.
Figure 5.3: Protuberances in small drops (average radius 5µm). Error bars calculatedusing the expression (N ±
√N)/A, with the number of protuberances N and the total
number A of drops examined at the respective temperature. From: [41].
They argued that for larger droplets on an even rimer above -7°C, the droplets’spreading on the surface would be detrimental to the build-up of an ice shell and subse-quent protuberance growth.
This agrees with the findings of [27] (“Under conditions favourable for secondary iceproduction, the accreting droplets spread out on the ice surface”, so “Splinter formationby pressure build-up inside individual frozen droplets is therefore unlikely to be respon-sible for shatter”) and the temperature shift factor deliberations visualized in figure 5.2:the shift factor for a droplet spreading over a width of its diameter exceeds 10 for thetemperature range relevant for the Hallett-Mossop process, e.g., shifting the tempera-ture for a droplet on a rimer of -3°C to -32°C where the fragmentation frequency ofPSL-containing droplets in the measurements of this thesis became very low (see figure4.12).
A surface rimed with small droplets, though, does reduce the contact area betweenliquid droplet and ice, as [41] observed with microscopic photography, and there led toprotuberances; this may be reflected in the necessity for both smaller (diameter<12µm)
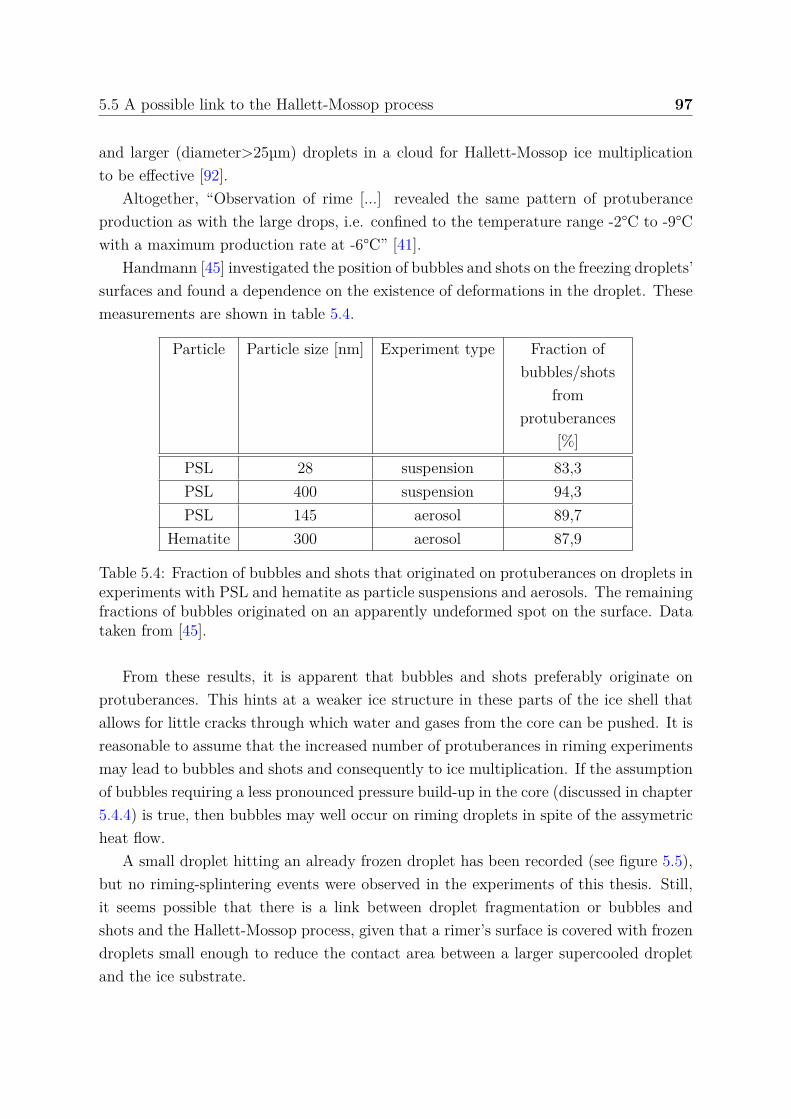
5.5 A possible link to the Hallett-Mossop process 97
and larger (diameter>25µm) droplets in a cloud for Hallett-Mossop ice multiplicationto be effective [92].
Altogether, “Observation of rime [...] revealed the same pattern of protuberanceproduction as with the large drops, i.e. confined to the temperature range -2°C to -9°Cwith a maximum production rate at -6°C” [41].
Handmann [45] investigated the position of bubbles and shots on the freezing droplets’surfaces and found a dependence on the existence of deformations in the droplet. Thesemeasurements are shown in table 5.4.
Particle Particle size [nm] Experiment type Fraction ofbubbles/shots
fromprotuberances
[%]PSL 28 suspension 83,3PSL 400 suspension 94,3PSL 145 aerosol 89,7
Hematite 300 aerosol 87,9
Table 5.4: Fraction of bubbles and shots that originated on protuberances on droplets inexperiments with PSL and hematite as particle suspensions and aerosols. The remainingfractions of bubbles originated on an apparently undeformed spot on the surface. Datataken from [45].
From these results, it is apparent that bubbles and shots preferably originate onprotuberances. This hints at a weaker ice structure in these parts of the ice shell thatallows for little cracks through which water and gases from the core can be pushed. It isreasonable to assume that the increased number of protuberances in riming experimentsmay lead to bubbles and shots and consequently to ice multiplication. If the assumptionof bubbles requiring a less pronounced pressure build-up in the core (discussed in chapter5.4.4) is true, then bubbles may well occur on riming droplets in spite of the assymetricheat flow.
A small droplet hitting an already frozen droplet has been recorded (see figure 5.5),but no riming-splintering events were observed in the experiments of this thesis. Still,it seems possible that there is a link between droplet fragmentation or bubbles andshots and the Hallett-Mossop process, given that a rimer’s surface is covered with frozendroplets small enough to reduce the contact area between a larger supercooled dropletand the ice substrate.
98 Discussion
In spite of the doubts of the phase of particles generated by bubbles, bubbles andshots seem to be more likely, as fragmentation lead to distinct deformations that wouldmost certainly have been reported if they were observed.
5.6 Fragmentations and bubbles in the literatureThe data of [14, 86, 134, 136] discussed in the following section can be found in theappendix.
All their experiments employed a droplet generator, using water. [136] gave a closerspecification: “Once distilled and deionized water drops (which were confirmed to su-percool down to -25∼-30°C)”. From the freezing temperature, is is apparent that therestill must have been particulate matter in the droplets, meaning potential lattice de-fects that promote fragmentations according to the insights of this thesis. So, wheneverthose authors speak of “water”, it may be assumed that there was a unknown ammountof small particles in the droplets. Like in the experiments for this thesis, freezing wasnucleated with ice particles by all authors.
In [86], the fragmentation frequencies of droplets in dependence of droplet size, nu-cleation temperature and air temperature were measured. On the subject of fragmenta-tions, they state that “this explosive rupture of the frozen drop almost always producedlarge numbers of splinters.” Their fragmentation frequencies are generally larger thanthe ones reported in this thesis. This may have to do with the nucleation temperature ofthe droplets in their experiment which was close to 0°C in the cases when they measuredthe highest ice particle production per droplet. In the experiments conducted for thisthesis, droplet temperature was at ambient temperature or lower when ice nucleationoccurred, which means that a higher fraction of the droplet is turned to ice in the firstfreezing step. Regarding the higher fragmentation frequencies in the measurements of[86], this seems to be an important factor for the occurrence of fragmentation and wouldexplain the decrease of fragmentations towards low (∼-36°C) temperatures.
They also reported to have generally observed more splinters in droplets exhibitingspike-like protuberances. Together with the findings of [45] (see table 5.4 in chapter5.5), this means that there is a correlation between bubbles and shots and ice splinterproduction via droplet deformations. It is possible that shots occurred during theseexperiments or that bubbles do lead to ice particles and ice multiplication.
In [86], it is furthermore reported that “while no discernible changes were producedwhen distilled water was replaced with tap water or by 10-3[molar concentration] saltsolutions, drops of a 0,2[molar concentration] solution of sodium chloride showed no
5.6 Fragmentations and bubbles in the literature 99
distortion, produced no spikes and only an occasional splinter when nucleated at either-12°C or 0°C.”
This observation is consistent with the measurements of fragmentation frequencies independence of solubles discussed in chapters 5.3.4 and 5.3.5, but not with the occurrenceof bubbles on droplets containing SNOMAX and PSL particles discussed in chapter 5.4.4.Smaller cracks reaching from the droplet core to the outside apparently still can nucleateif sufficiently large lattice defects in the form of solid particles are present in the shell.
Unfortunately, no observations were made on the occurrence of bubbles on dropletscontaining sodium chloride in this thesis.
The high fragmentation frequencies of the measurements of [86] have been attributedto a contamination of the droplets with carbon dioxide or by the thermal inequilibriumby [31], who found no fragmentations but found one in ten freezing droplets of 1mmdiameter ejecting an ice splinter in experiments “at equilibrium in ordinary air at atmo-spheric pressure at temperatures from 0 to -17C [. Those droplets] often cracked duringfreezing and formed spikes and protrusions, but [they] were never observed to shatter”.
A high concentration of carbon dioxide would indeed lead to an increase of the num-ber of bubbles from a drop and probably to more shots once there is a crack is in the shellthat reaces from the core to the atmosphere. The fact remains that splinter productionwas observed in the absence of shattering, even if the number of splinters is far higherthan it would be under atmospheric conditions.The measurements of [14] are summed up with: “roughly 10 per cent of droplets between50 and 120µ radius shatter when nucleated with ice crystals at temperatures between-5°C and -15°C and allowed to freeze in free fall.” (that is, between 6%-9% for dropletin the diameter range of 100µm-180µm), which is comparable to the maximal fragmen-tation rates of this thesis at these temperatures (see figure 4.12). They also investigatedthe influence of sodium chloride on fragmentation frequency and found a decrease infrequency with concentration: “at -10°C, using droplets in the larger size range (90-120µradius) [...] the [droplet] percentage shattering was 7 per cent for the 10-4 M solutionand 1 per cent for the 10-3M solution” compared to 18 percent for water without addedsodium chloride. This, again, is consistent with the reasoning in chapter 5.3.4.
In the measurements of [136], droplet temperature was close to air temperature anddroplet sizes between 75µm-175µm, both of which is comparable for the experiments inthis thesis (d=85µm). The fragmentation in these conditions are shown in table 5.5.
100 Discussion
Temperature [°C] Fragmentationfrequency [%]
-6 17-15,9 37-24,4 2
Table 5.5: Measurement results for droplets in the size range of 75µm-175µm withnucleation temperature ≈ air temperature. Data taken from [136].
The fragmentation frequencies they report are both slightly lower (at -24,4) and bya factor of ≈2 higher (warmer temperatures) than the frequencies of PSL suspensionsmeasured for this thesis. In later experiments, [134] conducted experiments in whichfreezing was nucleated in droplets not in thermal equilibrium with the surrounding air.In general, higher fragmentation frequencies were observed than in [136] where the sameexperimental apparatus was employed. This fact, as in the discussion in [86], hints atthe importance of the fraction turned into ice during the first freezing step, which isgoverned by the droplet temperature at the time of nucleation, for fragmentation. Ahigh temperature difference between the droplet and the ambient air is highly unlikelyunder non-laboratory conditions, though, so the relevance of these measurements foratmospheric clouds seems limited.
In [63], the investigations centered on hailstone embryos, i.e., the ice particle of thecore of a hailstone. The core of a hailstone is necessarilly a frozen drop.
It might be argued that the reason for this droplet’s freezing is either an ice-activeaerosol or an ice particle, but the mechanism of hailstone growth requires an ice particlelarge enough to collect large liquid water droplets that form layers of liquid around the iceand freeze subsequently. This is reflected in the structure of a hailstone, which is revealedif the cross-section is examined (figure 5.4). They found, of 452 frozen drop embryos,13% were broken pieces: “usually hemisphere, sometimes other portions”. They foundfew cases of fragments called ’incomplete fragmentations’ in this thesis (chapter 4.3.7.2):“While cracking and discrete breaking are common, both spike formation and crackingwith displacement of the pieces but without complete separation are extremely rare.”Unfortunately, they did not report the weather conditions under which the hailstoneswere collected, but a fragmentation frequency of ∼13% has been observed for a varietyof conditions (figures 4.12, 4.3, 4.14) in this thesis.
One of the latest laboratory experiments was conducted by [109]. They found that“depending on the drop surface temperature, up to 42% of the drops frozen by contactnucleation with a clay aerosol transformed into ice particles with surface breaks that
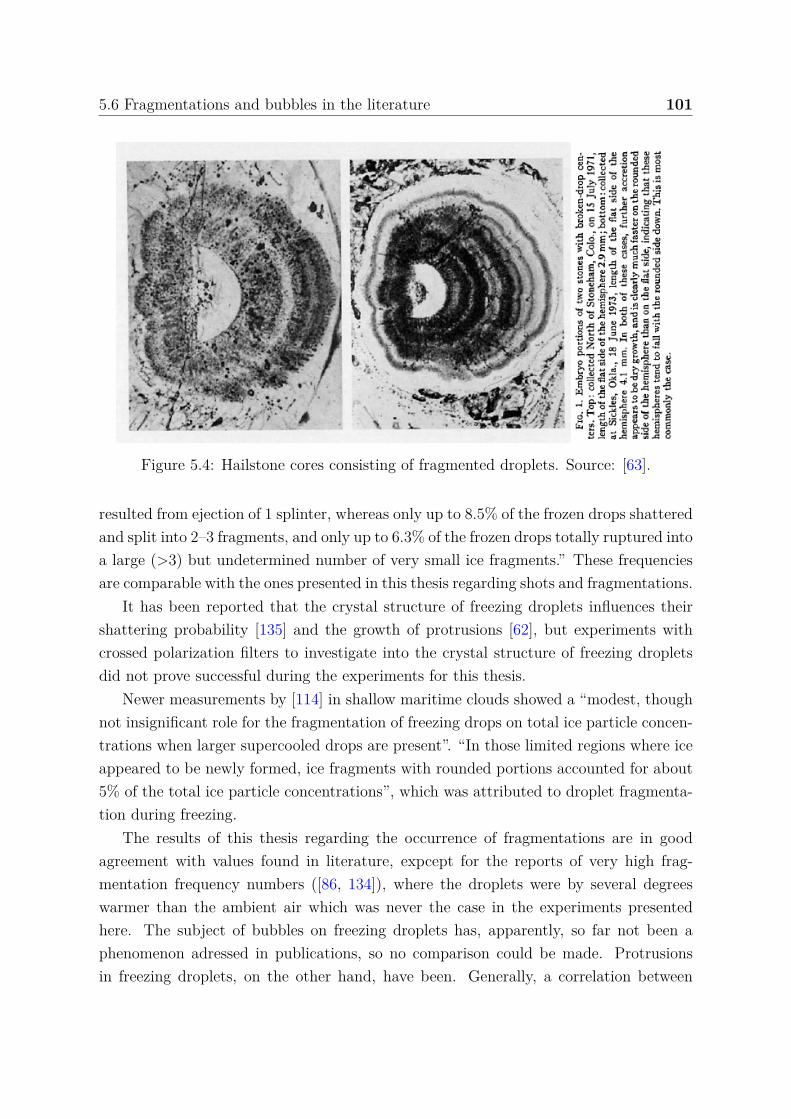
5.6 Fragmentations and bubbles in the literature 101
Figure 5.4: Hailstone cores consisting of fragmented droplets. Source: [63].
resulted from ejection of 1 splinter, whereas only up to 8.5% of the frozen drops shatteredand split into 2–3 fragments, and only up to 6.3% of the frozen drops totally ruptured intoa large (>3) but undetermined number of very small ice fragments.” These frequenciesare comparable with the ones presented in this thesis regarding shots and fragmentations.
It has been reported that the crystal structure of freezing droplets influences theirshattering probability [135] and the growth of protrusions [62], but experiments withcrossed polarization filters to investigate into the crystal structure of freezing dropletsdid not prove successful during the experiments for this thesis.
Newer measurements by [114] in shallow maritime clouds showed a “modest, thoughnot insignificant role for the fragmentation of freezing drops on total ice particle concen-trations when larger supercooled drops are present”. “In those limited regions where iceappeared to be newly formed, ice fragments with rounded portions accounted for about5% of the total ice particle concentrations”, which was attributed to droplet fragmenta-tion during freezing.
The results of this thesis regarding the occurrence of fragmentations are in goodagreement with values found in literature, expcept for the reports of very high frag-mentation frequency numbers ([86, 134]), where the droplets were by several degreeswarmer than the ambient air which was never the case in the experiments presentedhere. The subject of bubbles on freezing droplets has, apparently, so far not been aphenomenon adressed in publications, so no comparison could be made. Protrusionsin freezing droplets, on the other hand, have been. Generally, a correlation between
102 Discussion
droplet deformations and ice splinter number was reported; together with the correla-tion between protuberances and bubbles found by [45], a correlation between bubblesand splinter production is possible. But before the nature of particles from burstingbubbles on freezing droplets is determined, this has to remain a speculation.
Most of the experiments on ice multiplication based on single freezing droplets thatare reported were conducted in the 1960s and ’70s. The research of conditions underwhich the Hallett-Mossop process operates was never quite discontinued (e.g., [121]),but no description of the actual process responsible for “riming-splintering” has beenfound in the research for this thesis.
It is the author’s opinion, based on the considerations laid out in chapters 5.5 and5.6, there is a connection between the Hallett-Mossop process and the ice multiplicationprocesses in single freezing droplets described in this thesis.
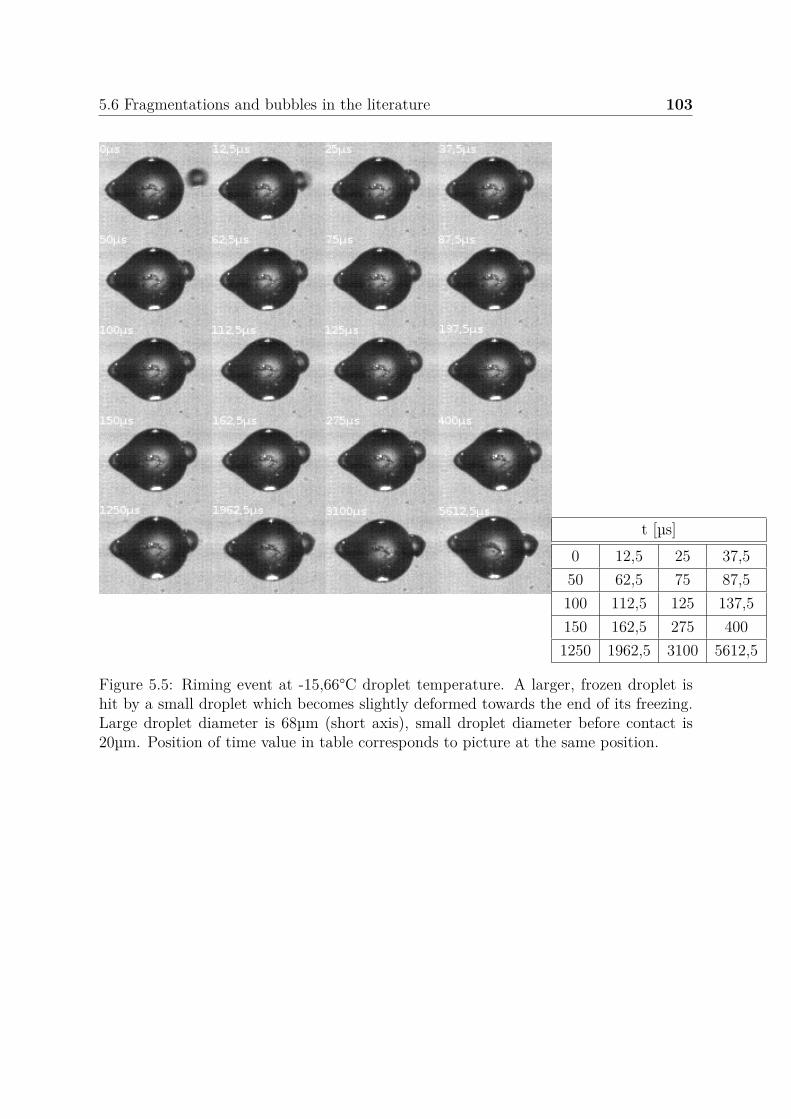
5.6 Fragmentations and bubbles in the literature 103
t [µs]0 12,5 25 37,550 62,5 75 87,5100 112,5 125 137,5150 162,5 275 4001250 1962,5 3100 5612,5
Figure 5.5: Riming event at -15,66°C droplet temperature. A larger, frozen droplet ishit by a small droplet which becomes slightly deformed towards the end of its freezing.Large droplet diameter is 68µm (short axis), small droplet diameter before contact is20µm. Position of time value in table corresponds to picture at the same position.

Chapter 6
Summary
For this thesis, experiments have been conducted at the division ’Atmospheric AerosolResearch’ of the Institute for Meteorology and Climate Research (IMK-AAF), KarlsruheInstitute for Technology (KIT). The aim of these experiments has been to find the con-ditions under which ice multiplication takes place, which in this case means the sheddingof ice particles in single freezing water droplets. To this end, water droplets of (78±22)µm were levitated in an electrodynamic balance which was cooled to temperatures from0°C to -36°C.
It had been found before that such pure water droplets show virtually no ice mul-tiplication during freezing [103], so the experiment focused on droplets containing solidparticles. It was reasoned that particles would serve as lattice defects in the growing iceshell of a droplet and might promote the nucleation of cracks under the pressure growingin the liquid core due to the lower density of ice.
Indeed, cracks in the shell were observed to lead to two ice multiplication processes:
Fragmentation Under high pressure in the core, and consequently high stresses in theice surrounding the core, the ice shell breaks on the scale of the droplet diameter.The fragments separate at relative speeds of up to 4m/s (figure 4.16) which cannotbe explained by electrostatic repulsion of the fragments. During a fragmentation,small ice splinters might have been ejected as well, but have not been observeddue to limits of the camera resolution.
Bubbles A smaller crack reaching from the liquid core to the shell boundary with airmay form. Through this channel, water and gases dissolved in the droplet arepushed to the outside where bubbles form. In a subset of such events, ’shots’ ofbubble fragments were observed that consisted of ice, while for most bubbles theexistence or phase of ejected particles remained unknown (rationale for this given
106 Summary
in chapter 5.4.1).
Two strategies were followed to introduce particles in- or onto droplets: suspensionexperiments and aerosol experiments.
For the suspension experiments, polystyrene spheres (’PSL’), the clay mineral kaoli-nite, bacterial cell fragments (’SNOMAX’) or sodium chloride were mixed with purewater. The polystyrene spheres were chosen because of their defined size and because ofthe assumption that the particle number per droplet would be well-defined. Kaolinitewas chosen as a proxy for mineral dusts in the atmosphere. Sodium chloride was usedto investigate the influence of solubles, rainwater was used as a proxy for cloud droplets.SNOMAX was employed because it is a material capable of ice nucleation at tempera-tures warmer than -20°C, in contrast to kaolinite which did not nucleate ice above -28°C;in all other experiments, ice was nucleated with small ice particles impinging onto thedroplets.
In the aerosol experiments, particles were collected on pure water droplets. Theparticles collected were either polystyrene spheres, hematite particles or SNOMAX par-ticles.
The effect of the individual particles and solubles are presented in table 6.1 for theoccurence of fragmentations and in table 6.2 for bubbles.
In experiments with solubles (rain water, sodium chloride and SNOMAX), the frag-mentation frequency was reduced to almost zero. The bubble frequency was higher,especially in the measurements with SNOMAX and PSL particles in droplets. It hasbeen discussed in this thesis (chapter 5.3.4) that solubles reduce the strength of ice andthus prevent larger cracks from occurring; the shell yields gradually in smaller incre-ments which prevents higher pressure build-up. In the case of bubbles, smaller cracksreaching from the droplet core to the outside apparently still can nucleate if sufficientlylarge lattice defects in the form of solid particles are present in the shell.
Together with the findings of [45], who observed 2-6 individual bubbles during eachbubble event, bubbles may lead to more ice splinters than fragmentations. Results re-garding ice multiplication in single freezing droplets found in literature and discussedin chapter 5.6 point to splinter production in the absence of fragmentation, which maymean that bubbles do create ice.
In this thesis, a link between fragmentations and bubbles to the Hallett-Mossop pro-cess (see [43]), a highly effective ice multiplication process between -8°C and -3°C, hasbeen explored. The Hallett-Mossop process, also called ’riming-splintering’, takes placeon an large ice particle covered in fine rime on which droplets of diameters larger than
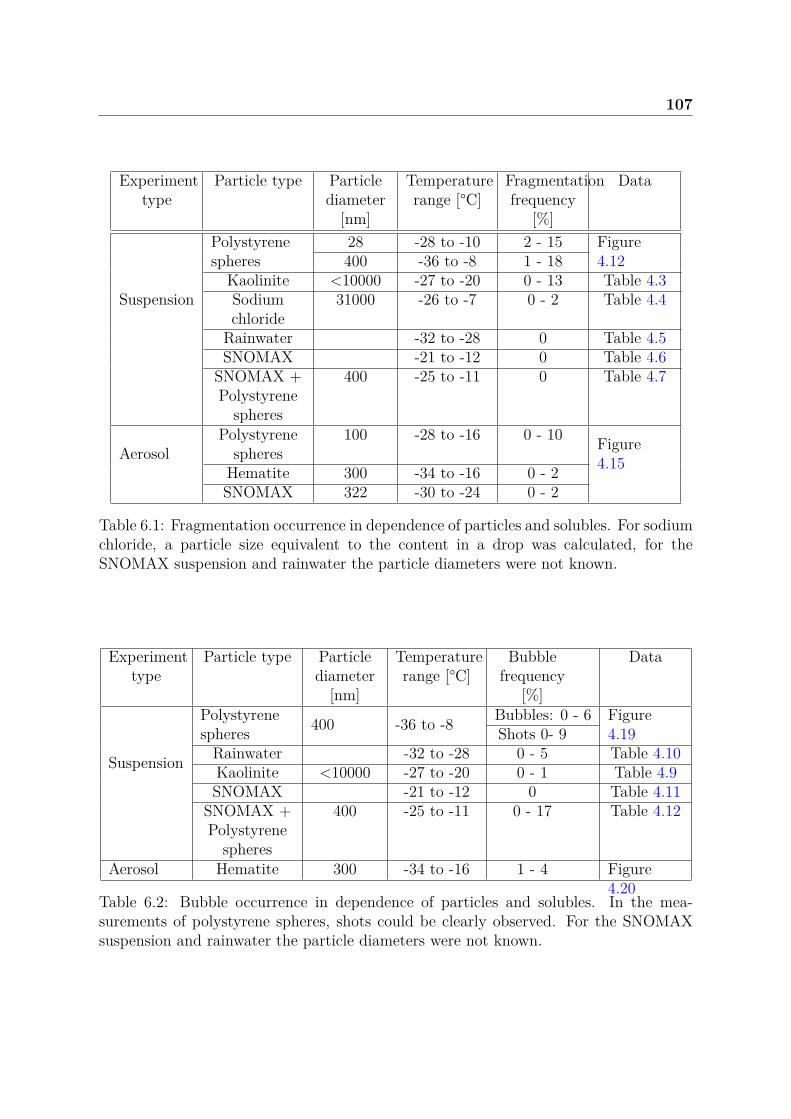
107
Experimenttype
Particle type Particlediameter
[nm]
Temperaturerange [°C]
Fragmentationfrequency
[%]
Data
Suspension
Polystyrenespheres
28 -28 to -10 2 - 15 Figure4.12400 -36 to -8 1 - 18
Kaolinite <10000 -27 to -20 0 - 13 Table 4.3Sodiumchloride
31000 -26 to -7 0 - 2 Table 4.4
Rainwater -32 to -28 0 Table 4.5SNOMAX -21 to -12 0 Table 4.6
SNOMAX +Polystyrene
spheres
400 -25 to -11 0 Table 4.7
AerosolPolystyrene
spheres100 -28 to -16 0 - 10 Figure
4.15Hematite 300 -34 to -16 0 - 2SNOMAX 322 -30 to -24 0 - 2
Table 6.1: Fragmentation occurrence in dependence of particles and solubles. For sodiumchloride, a particle size equivalent to the content in a drop was calculated, for theSNOMAX suspension and rainwater the particle diameters were not known.
Experimenttype
Particle type Particlediameter
[nm]
Temperaturerange [°C]
Bubblefrequency
[%]
Data
Suspension
Polystyrenespheres 400 -36 to -8 Bubbles: 0 - 6 Figure
4.19Shots 0- 9Rainwater -32 to -28 0 - 5 Table 4.10Kaolinite <10000 -27 to -20 0 - 1 Table 4.9SNOMAX -21 to -12 0 Table 4.11
SNOMAX +Polystyrene
spheres
400 -25 to -11 0 - 17 Table 4.12
Aerosol Hematite 300 -34 to -16 1 - 4 Figure4.20
Table 6.2: Bubble occurrence in dependence of particles and solubles. In the mea-surements of polystyrene spheres, shots could be clearly observed. For the SNOMAXsuspension and rainwater the particle diameters were not known.
108 Summary
the rime impinge (a description of the physics involved in this process has not beenfound, though). In calculations in chapter 5.5, it has been shown that the heat flow of adroplet connected to a larger rimer via a connection smaller than the droplet diametercauses a decrease in the freezing time of the droplet. This time decrease was interpretedas being equivalent to a temperature decrease, relative to the rimer’s temperature, in adroplet in air. This decrease can shift the temperature range of the Hallett-Mossop pro-cess into the temperature range in which fragmentations and bubbles were most frequentin the experiments in this thesis, depending on the connecting area between droplet andrimer. In [41], the occurrence of protuberances on frozen droplets on a rimed surfacein the Hallett-Mossop temperature range is reported, and [45] found a correlation be-tween protuberances and bubbles across temperatures from -36°C to -8°C (table 5.4)in freezing droplets. These three insights together lead to the conclusion that the icemultiplication effect of the Hallett-Mossop process may be caused by bubbles or shotsfrom riming larger droplets on a finely rimed ice surface.
Generally, the complete freezing process from ice nucleation to the end was recorded,unless the droplet was removed from the field of vision by fragmentation. This allowed forthe analysis of the first freezing step time and the propagation speed of ice in supercooledwater in dependence of droplet temperature T and melting temperature of water Tm. Inthis thesis, the propagation speed vice between -34°C and -7°C has been measured to bevice = (0, 75 ± 0, 33) ∗ 10−3(Tm−T
K )1,83±0,14m/s which is in good agreement with literaturemeasurements and spans the widest range of temperature with the same experimentalsetup.
A series of experiments on droplet actuation lead to the discovery of actuation sig-nals with which the droplet size of the piezoelectric droplet injector could be variedfrom the standard diameter of 90µm to the range of 60µm-105µm without changing theinjector’s geometry. Instead of the usual single pulse signal, a combined signal of threesuccessive pulses allowed for these size manipulation (see chapter 5.1.4). In experimentsin the cooled environment of the electrodynamic balance it turned out that the heatingapplied to the injector to prevent ice damage caused evaporation in the droplet beforecapture. The droplet size was reduced from a reference size of 90µm to 64µm, and therange of diameters generated with suitable triple pulse signals became 45µm-77µm. Thisprompts the conclusion that injector heating control might offer a much easier way ofproducing smaller water droplets. Pulse variation might be relevant for experiments withheat-sensitive fluids and suspensions or for expanding the limits of droplet variation bytemperature control.
109
Three questions were asked at the beginning of this thesis. Answers have been found:
• Under which conditions do fragmentations occur?
– Fragmentations were observed in droplets with diameters of ≈ 85µm contain-ing solid particles, but not high concentration of solubles. While fragmen-tations occurred over the temperature range of -30°C to -8°C, fragmentationfrequencies >5% took place in the range of -23°C to -13°C in experimentswith polystyrene spheres (d=28nm and 400nm) suspended in the observeddroplets. In experiments with potentially larger particles (kaolinite), a frag-mentation frequency of 13% could be observed at -27°C droplet temperature.Fragmentations may also occur if the particles are at the water-air boundaryof the droplet before freezing.
• Are there other ice multiplication processes in freezing droplets that have not beenconsidered yet?
– Water and gases of a freezing droplet’s core may be pushed through a crackin the shell to the outside where the may shed splinters upon freezing. Therewas a series with suspensions of polystyrene spheres (d=400nm) in which thephase of bubbles shed from a droplet could be identified as ice; for most othermeasurements, it is not clear if ice multiplication took place.
• Is there a link between the Hallett-Mossop process and droplet fragmentation?
– Fragmentations require a high pressure in a freezing droplet which is bestachieved with a symmetrically growing ice shell. This makes it improbablethat freezing droplets sitting on a rimer fragment, as the heat flow to the rimernecessarily leads to an asymmetric heat flow and consequently to asymmet-ric ice shell growth. The contact area between droplet and rimer plays animportant role for this asymmetry. A small contact area might allow for thegrowth of an ice shell from the remaining droplet surface, which exchangesheat with the ambient air, that becomes strong enough for the build-up ofhigh pressures necessary for fragmentation. On the other hand, there is a re-ported correlation between ice splinter production and protrusions, and thereis a reported correlation between protrusions and bubbles. Following this lineof thought, bubbles emerging from freezing droplets may be the cause of ice
110 Summary
multiplication in the Hallett-Mossop process, which might link the presentedlaboratory experiments in this thesis to the rapid increase in ice crystals inclouds occasionally observed in field studies.
These results may be of use in further research on the mechanisms of ice multiplication.The measurements on actuation signal variation in the droplet injector may be useful forinvestigating into the droplet size dependency of ice multiplication processes, but mightprove useful for other applications (e.g., cold stage experiments) as well.
The idea of connecting bubble emergence from freezing droplets to the Hallett-Mossop process is, as of now, little more than a substantiated conjecture. A life ob-servation of riming would be a difficult but rewarding experiment to assay the truth ofthis idea. Any experiments that prove this conjecture wrong are just as welcome as aconfirmation would be, as that would mean that the work in the research field of icemultiplication continues. For decades, few experiments have been conducted on thissubject, and it is high time the hiatus ended. Just the same has been said the convenersof the Secondary ice multiplication Symposium in Manchester, 3rd - 4th of November2015 in their invitation:
“The time is now ripe to review our progress in understanding secondary ice multi-plication and suggest new ways forward.”
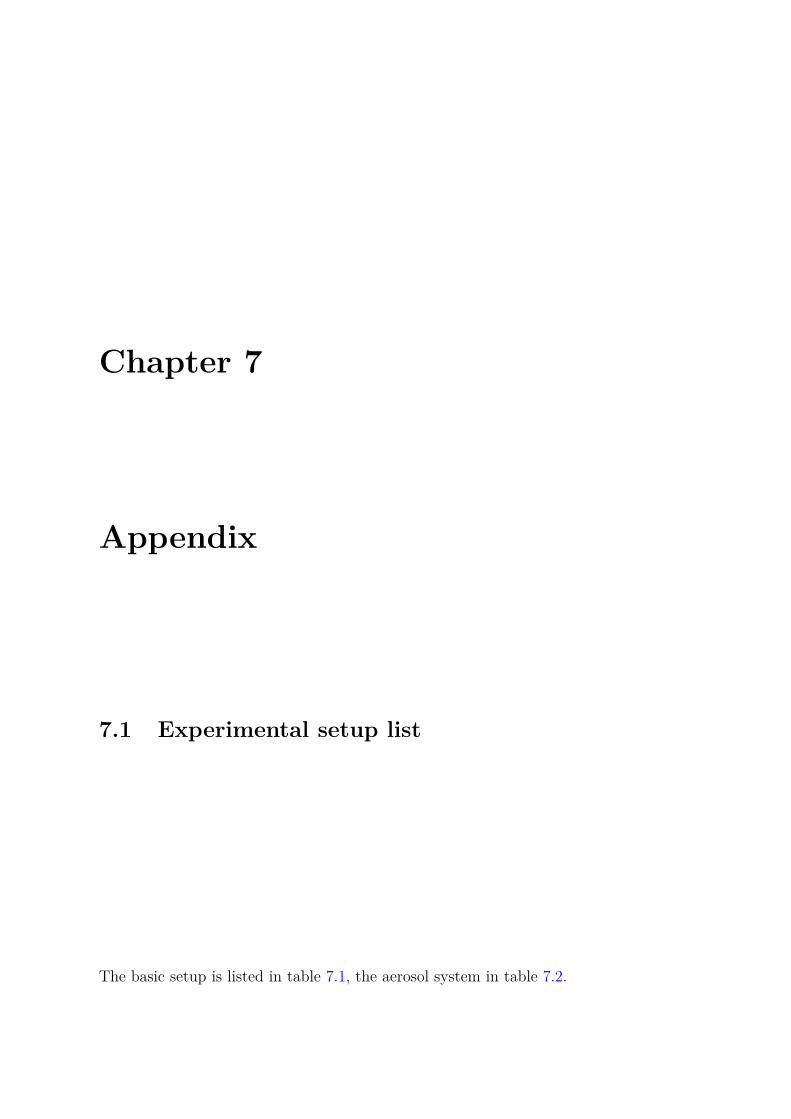
Chapter 7
Appendix
7.1 Experimental setup list
The basic setup is listed in table 7.1, the aerosol system in table 7.2.
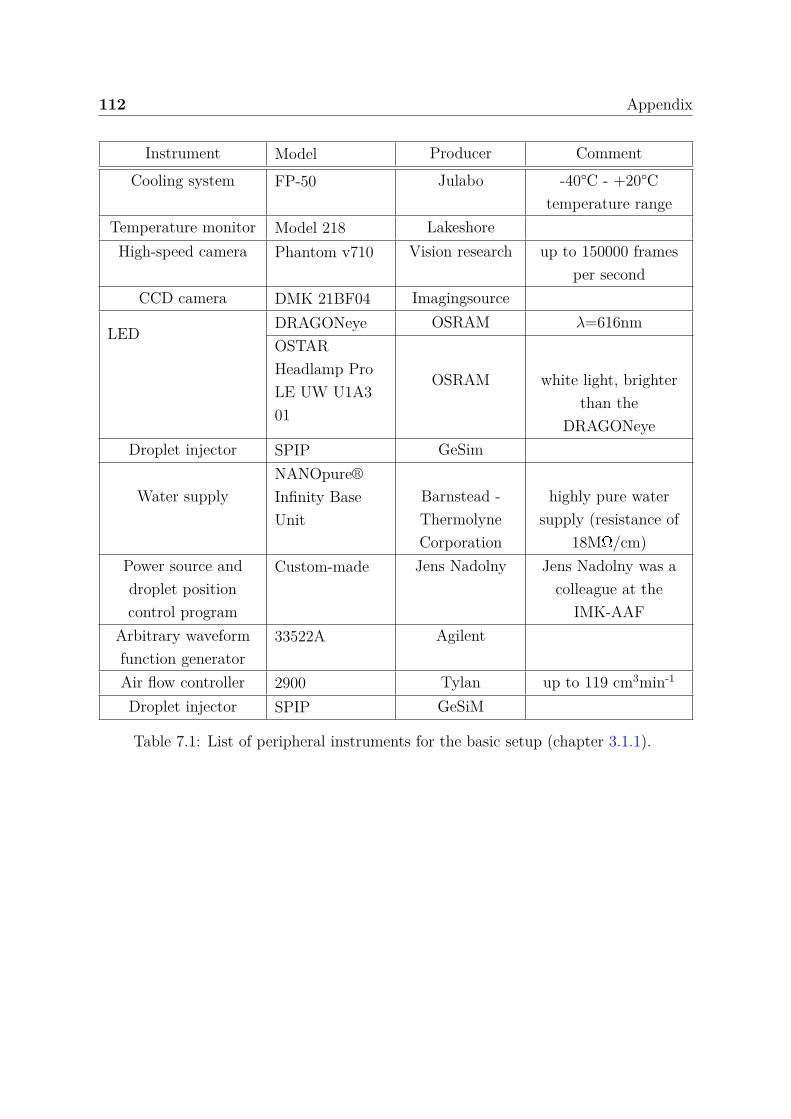
112 Appendix
Instrument Model Producer CommentCooling system FP-50 Julabo -40°C - +20°C
temperature rangeTemperature monitor Model 218 LakeshoreHigh-speed camera Phantom v710 Vision research up to 150000 frames
per secondCCD camera DMK 21BF04 Imagingsource
LED DRAGONeye OSRAM λ=616nmOSTARHeadlamp ProLE UW U1A301
OSRAM white light, brighterthan the
DRAGONeyeDroplet injector SPIP GeSim
Water supplyNANOpure®Infinity BaseUnit
Barnstead -ThermolyneCorporation
highly pure watersupply (resistance of
18MW/cm)Power source anddroplet positioncontrol program
Custom-made Jens Nadolny Jens Nadolny was acolleague at the
IMK-AAFArbitrary waveformfunction generator
33522A Agilent
Air flow controller 2900 Tylan up to 119 cm3min-1
Droplet injector SPIP GeSiM
Table 7.1: List of peripheral instruments for the basic setup (chapter 3.1.1).
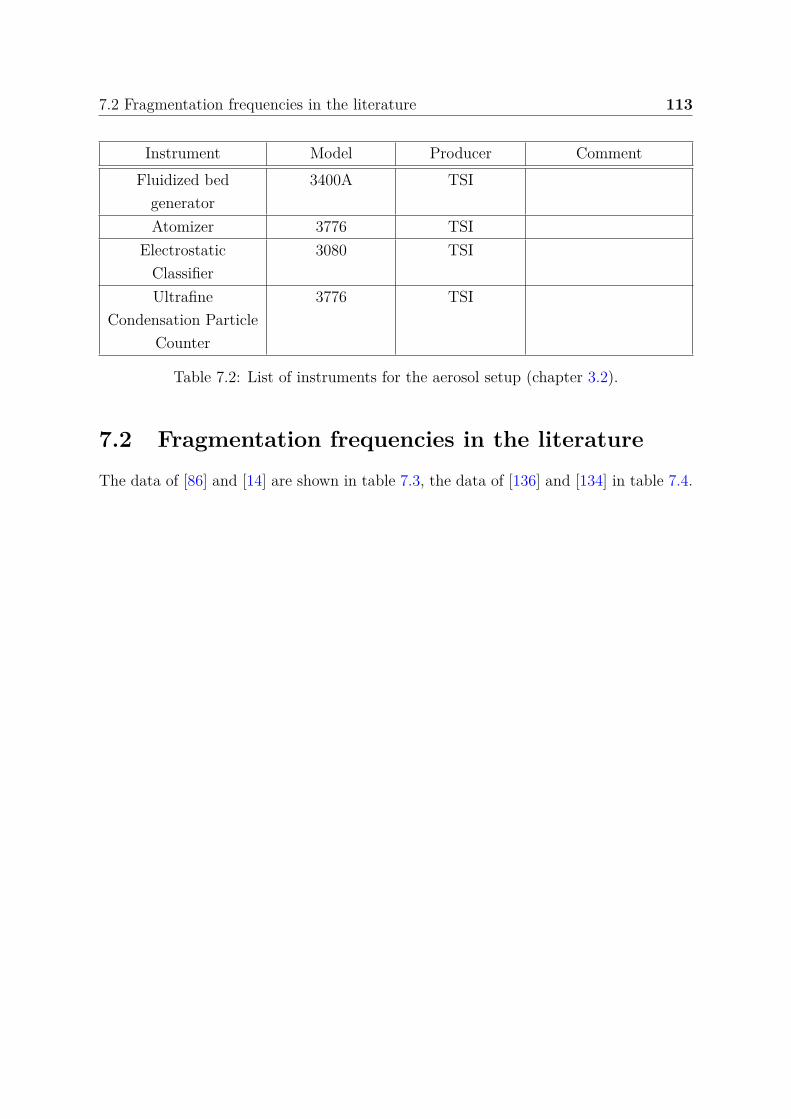
7.2 Fragmentation frequencies in the literature 113
Instrument Model Producer CommentFluidized bed
generator3400A TSI
Atomizer 3776 TSIElectrostatic
Classifier3080 TSI
UltrafineCondensation Particle
Counter
3776 TSI
Table 7.2: List of instruments for the aerosol setup (chapter 3.2).
7.2 Fragmentation frequencies in the literatureThe data of [86] and [14] are shown in table 7.3, the data of [136] and [134] in table 7.4.
114 Appendix
InvestigatorD
ropl
etdi
amet
er[µ
m]
Nuc
leat
ion
tem
pera
ture
[°C]
Air
tem
pera
ture
[°C]
Prot
uber
ance
frequ
ency
[%]
Frag
men
tatio
nfre
quen
cy[%
]
Aver
age
splin
ter
num
ber
per
drop
Comment
[86]
1000
0 -2 72 29 -
“Large droplets, ofmillimetre size, weresuspended from the endof a fine, shellac-coatedthermocouple [...].Smaller droplets, of order100µ diameter, were hungfrom the underside offine, horizontallymounted amyl-acetatefibres.”
-1 -10 91 47 54-1 -10 83 44 --2 -15 57 21 --2 -20 67 39 --4 -10 40 22 27-7 -10 8 6 15-9 -17 0 0 4-13 -15 few
smallspikes
0 4-14 -20 0 4-16 -25 0 6
300 -400
-1 -10 90 40 --1 -12 100 27 40-2 -20 70 20 --15 -20 0 6 5
100 -150
-2 -15 39 15 --5 -15 27 12 14-15 -15 7 1 3
80 -120
0 -5 51 25 -0 -6 60 35 22
30 -80
0 -5 57 26 -0 -6 43 27 --5 -6 - 11 8
[14]
160 -240
-5 6-10 18
-10 710-4M sodium chloride
solution
-10 110-3M sodium chloride
solution-15 14
100 -180
-5 9-10 7-15 6
Table 7.3: Fragmentation frequencies in the literature I
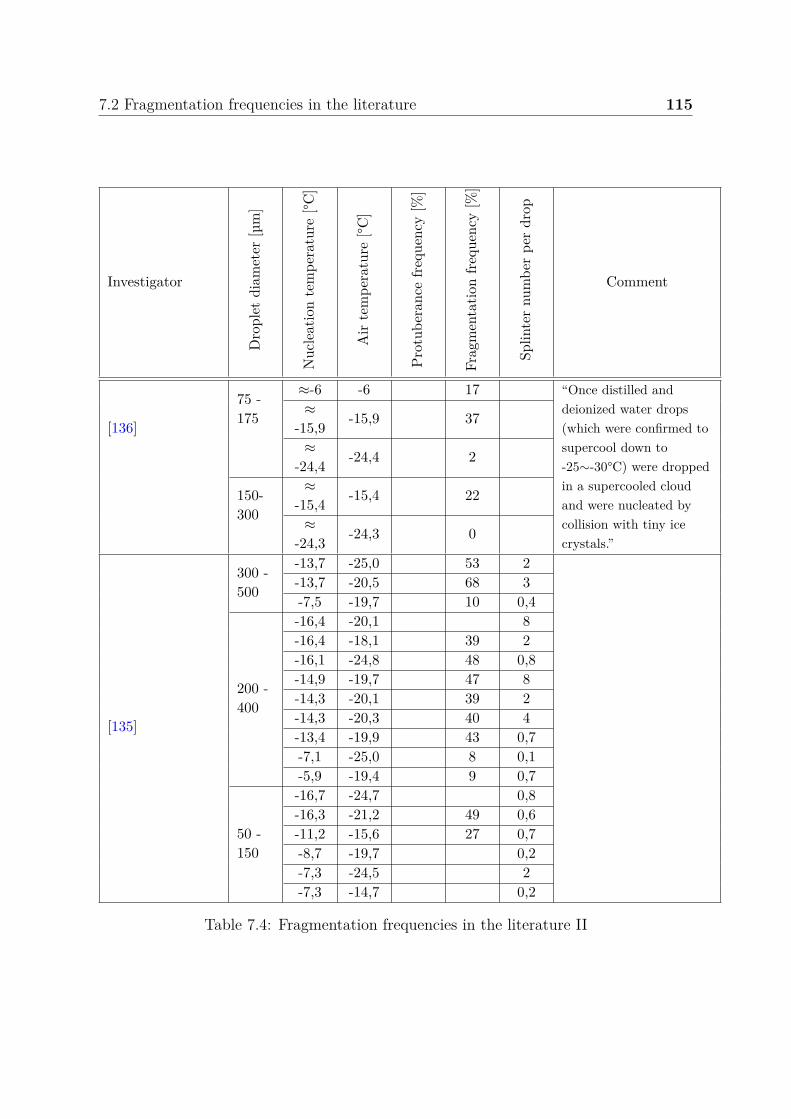
7.2 Fragmentation frequencies in the literature 115
Investigator
Dro
plet
diam
eter
[µm
]
Nuc
leat
ion
tem
pera
ture
[°C]
Air
tem
pera
ture
[°C]
Prot
uber
ance
frequ
ency
[%]
Frag
men
tatio
nfre
quen
cy[%
]
Splin
ter
num
ber
per
drop
Comment
[136]
75 -175
≈-6 -6 17 “Once distilled anddeionized water drops(which were confirmed tosupercool down to-25∼-30°C) were droppedin a supercooled cloudand were nucleated bycollision with tiny icecrystals.”
≈-15,9 -15,9 37
≈-24,4 -24,4 2
150-300
≈-15,4 -15,4 22
≈-24,3 -24,3 0
[135]
300 -500
-13,7 -25,0 53 2-13,7 -20,5 68 3-7,5 -19,7 10 0,4
200 -400
-16,4 -20,1 8-16,4 -18,1 39 2-16,1 -24,8 48 0,8-14,9 -19,7 47 8-14,3 -20,1 39 2-14,3 -20,3 40 4-13,4 -19,9 43 0,7-7,1 -25,0 8 0,1-5,9 -19,4 9 0,7
50 -150
-16,7 -24,7 0,8-16,3 -21,2 49 0,6-11,2 -15,6 27 0,7-8,7 -19,7 0,2-7,3 -24,5 2-7,3 -14,7 0,2
Table 7.4: Fragmentation frequencies in the literature II

Bibliography
[1] Andrew S. Ackerman, Owen B. Toon, Jonathan P. Taylor, Doug W. Johnson,Peter V. Hobbs, and Ronald J. Ferek. Effects of Aerosols on Cloud Albedo: Eval-uation of Twomeys Parameterization of Cloud Susceptibility Using Measurementsof Ship Tracks. Journal of the Atmospheric Sciences, 57(16):2684–2695, August2000.
[2] John Aitken. On the number of dust particles in the atmosphere. Nature, 37:428–430, 1888.
[3] Largus T Angenent, Scott T Kelley, Allison St Amand, Norman R Pace, andMark T Hernandez. Molecular identification of potential pathogens in water andair of a hospital therapy pool. Proceedings of the National Academy of Sciences ofthe United States of America, 102(13):4860–4865, 2005.
[4] James D. Atkinson, Benjamin J. Murray, Matthew T. Woodhouse, Thomas F.Whale, Kelly J. Baustian, Kenneth S. Carslaw, Steven Dobbie, Daniel O/’Sullivan,and Tamsin L. Malkin. The importance of feldspar for ice nucleation by mineraldust in mixed-phase clouds. Nature, 498(7454):355–358, 2013.
[5] S. Augustin, S. Hartmann, B. Pummer, H. Grothe, D. Niedermeier, T. Clauss,J. Voigtländer, L. Tomsche, H. Wex, and F. Stratmann. Immersion freezing ofbirch pollen washing water. Atmos. Chem. Phys. Discuss., 12(12):32911–32943,2012.
[6] Tor Bergeron. On the Physics of Cloud Precipitation. 1935.
[7] Heinz Bingemer, Holger Klein, Martin Ebert, Werner Haunold, Ulrich Bundke,Thomas Herrmann, Konrad Kandler, Dörthe Müller-Ebert, Stephan Weinbruch,and Anna Judt. Atmospheric ice nuclei in the Eyjafjallajökull volcanic ash plume.Atmospheric Chemistry and Physics, 12(2):857–867, 2012.
118 Bibliography
[8] James C. Bird, Rielle de Ruiter, Laurent Courbin, and Howard A. Stone. Daughterbubble cascades produced by folding of ruptured thin films. Nature, 465(7299):759–762, 2010.
[9] Alan M. Blyth and John Latham. Development of ice and precipitation in NewMexican summertime cumulus clouds. Quarterly Journal of the Royal Meteorolog-ical Society, 119(509):91–120, 1993.
[10] Olivier Boucher and Ulrike Lohmann. The sulfate-CCN-cloud albedo effect. TellusSeries B-Chemical and Physical Meteorology, 47(3):281–300, 1995.
[11] Roscoe R. Braham. What is the Role of Ice in Summer Rain-Showers? Journalof the Atmospheric Sciences, 21(6):640–645, November 1964.
[12] James R. Brock. On the theory of thermal forces acting on aerosol particles.Journal of Colloid Science, 17(8):768–780, 1962.
[13] Francois-Marie Bréon, Didier Tanré, and Sylvia Generoso. Aerosol Effect on CloudDroplet Size Monitored from Satellite. Science, 295(5556):834–838, February 2002.
[14] J. L. Brownscombe and Thorndike.Ns. Freezing and Shattering of Water Dropletsin Free Fall. Nature, 220(5168):687–&, 1968.
[15] W. Cantrell and A. Heymsfield. Production of ice in tropospheric clouds - Areview. Bulletin of the American Meteorological Society, 86(6):795–+, June 2005.
[16] Alvin U. Chen and Osman A. Basaran. A new method for significantly reducingdrop radius without reducing nozzle radius in drop-on-demand drop production.Physics of Fluids, 14(1):L1–L4, 2002.
[17] Chul Hee Cho, Surjit Singh, and G. Wilse Robinson. An Explanation of theDensity Maximum in Water. Physical Review Letters, 76(10):1651–1654, 1996.
[18] T. W. Choularton, J. Latham, and B. J. Mason. Possible Mechanism of Ice SplinterProduction during Riming. Nature, 274(5673):791–792, 1978.
[19] Clifford Coonan. How Beijing used rockets to keep opening ceremony dry. TheIndependent, November 2008.
[20] E. Cunningham. On the Velocity of Steady Fall of Spherical Particles throughFluid Medium, volume 83. March 1910.
Bibliography 119
[21] C. N. Davies. Definitive equations for the fluid resistance of spheres. Proceedingsof the Physical Society, 57(4):259, 1945.
[22] E James Davis. A history of single aerosol particle levitation. Aerosol Science andTechnology, 26(3):212–254, 1997.
[23] Gerrit de Leeuw, Edgar L. Andreas, Magdalena D. Anguelova, C. W. Fairall,Ernie R. Lewis, Colin O’Dowd, Michael Schulz, and Stephen E. Schwartz. Pro-duction flux of sea spray aerosol. Reviews of Geophysics, 49(2):RG2001, 2011.
[24] K. Diehl, S. Matthias-Maser, R. Jaenicke, and S. K. Mitra. The ice nucleatingability of pollen:: Part II. Laboratory studies in immersion and contact freezingmodes. Atmospheric Research, 61(2):125–133, 2002.
[25] Gerald A Domoto and Aron Sereny. Thermal ink jet printer with droplet ejectionby bubble collapse. 1986.
[26] Hongming Dong, Wallace W. Carr, and Jeffrey F. Morris. An experimental studyof drop-on-demand drop formation. Physics of Fluids, 18(7):072102–16, 2006.
[27] Ya Yi Dong and John Hallett. Droplet accretion during rime growth and theformation of secondary ice crystals. Quarterly Journal of the Royal MeteorologicalSociety, 115(485):127–142, 1989.
[28] Stillman Drake and Galileo Galilei. Cause, Experiment and Science: a GalileanDialogue Incorporating a New English Translation of Galileo’s Bodies that StayAtop Water, Or Move in it. Chicago: University of Chicago Press, 1981.
[29] Laurent Duchemin, Stéphane Popinet, Christophe Josserand, and Stéphane Za-leski. Jet formation in bubbles bursting at a free surface. Physics of Fluids (1994-present), 14(9):3000–3008, 2002.
[30] Denis Duft and Thomas Leisner. Laboratory evidence for volume-dominated nu-cleation of ice in supercooled water microdroplets. Atmospheric Chemistry andPhysics, 4(7):1997–2000, 2004.
[31] James Eugene Dye and PV Hobbs. The influence of environmental parameters onthe freezing and fragmentation of suspended water drops. Journal of the Atmo-spheric Sciences, 25(1):82–96, 1968.
120 Bibliography
[32] J. Feichter and T. Leisner. Climate engineering: A critical review of approaches tomodify the global energy balance. The European Physical Journal Special Topics,176(1):81–92, September 2009.
[33] W Findeisen. Die kolloidmeteorologischen Vorgänge bei der Niederschlagsbildung.Meteor. Z, 55:121–133, 1938.
[34] C.J. G. Method and apparatus for heating dielectric materials, 1939.
[35] H. Y. Gan, Shan Xuechuan, T. Eriksson, B. K. Lok, and Y. C. Lam. Re-duction of droplet volume by controlling actuating waveforms in inkjet printingfor micro-pattern formation. Journal of Micromechanics and Microengineering,19(5):055010, 2009.
[36] Michal Gavish, Ronit Popovitz-Biro, Meir Lahav, and Leslie Leiserowitz. Ice Nu-cleation by Alcohols Arranged in Monolayers at the Surface of Water Drops. Sci-ence, 250(4983):973–975, 1990.
[37] GESIM. Nanolitre Dosage Piezoelectric Microdispensers. Product information,2014.
[38] Elisabeth Ghabache, Arnaud Antkowiak, Christophe Josserand, and Thomas Séon.On the physics of fizziness: How bubble bursting controls droplets ejection. Physicsof Fluids (1994-present), 26(12):–, 2014.
[39] WF Giauque and JW Stout. The Entropy of Water and the Third Law of Thermo-dynamics. The Heat Capacity of Ice from 15 to 273° K. Journal of the AmericanChemical Society, 58(7):1144–1150, 1936.
[40] Robert J Good. Contact angle, wetting, and adhesion: a critical review. Journalof adhesion science and technology, 6(12):1269–1302, 1992.
[41] D. J. Griggs and T. W. Choularton. Freezing modes of riming droplets with ap-plication to ice splinter production. Quarterly Journal of the Royal MeteorologicalSociety, 109(459):243–253, 1983.
[42] J. Hallett. Experimental Studies of the Crystallization of Supercooled Water.Journal of the Atmospheric Sciences, 21(6):671–682, November 1964.
[43] J. Hallett and S. C. Mossop. Production of Secondary Ice Particles during RimingProcess. Nature, 249(5452):26–28, 1974.
Bibliography 121
[44] John Hallett, Robert I Sax, Dennis Lamb, and AS Murty. Aircraft measurementsof ice in Florida cumuli. Quarterly Journal of the Royal Meteorological Society,104(441):631–651, 1978.
[45] Patricia Vera Klara Handmann. Laboruntersuchungen zur Dynamik derSekundäreisbildung. Diploma thesis, Karlsruhe, 2013.
[46] D. E. Hare and C. M. Sorensen. The density of supercooled water. II. Bulk samplescooled to the homogeneous nucleation limit. The Journal of Chemical Physics,87(8):4840–4845, 1987.
[47] Raymond L. Harris-Hobbs and William A. Cooper. Field Evidence SupportingQuantitative Predictions of Secondary Ice Production Rates. Journal of the At-mospheric Sciences, 44(7):1071–1082, April 1987.
[48] R. B. Head. Steroids as Ice Nucleators. Nature, 191(479):1058–&, 1961.
[49] Stephen J Henderson and Robin J Speedy. Melting temperature of ice at positiveand negative pressures. Journal of Physical Chemistry, 91(11):3069–3072, 1987.
[50] Andrew Heymsfield and Paul Willis. Cloud Conditions Favoring Secondary IceParticle Production in Tropical Maritime Convection. Journal of the AtmosphericSciences, 71(12):4500–4526, December 2014.
[51] W. B. Hillig and D. Turnbull. Theory of Crystal Growth in Undercooled PureLiquids. Journal of Chemical Physics, 24(4):914–914, 1956.
[52] Peter V. Hobbs and Arthur L. Rangno. Ice Particle Concentrations in Clouds.Journal of the Atmospheric Sciences, 42(23):2523–2549, December 1985.
[53] N. Hoffmann, A. Kiselev, D. Rzesanke, D. Duft, and T. Leisner. Experimentalquantification of contact freezing in an electrodynamic balance. Atmos. Meas.Tech., 6(9):2373–2382, 2013.
[54] C. Hoose, J. E. Kristjánsson, and S. M. Burrows. How important is biologi-cal ice nucleation in clouds on a global scale? Environmental Research Letters,5(2):024009, 2010.
[55] C. Hoose and O. Möhler. Heterogeneous ice nucleation on atmospheric aerosols: areview of results from laboratory experiments. Atmos. Chem. Phys., 12(20):9817–9854, 2012.
122 Bibliography
[56] J. A. Huffman, A. J. Prenni, P. J. DeMott, C. Pöhlker, R. H. Mason, N. H.Robinson, J. Fröhlich-Nowoisky, Y. Tobo, V. R. Després, E. Garcia, D. J. Gochis,E. Harris, I. Müller-Germann, C. Ruzene, B. Schmer, B. Sinha, D. A. Day, M. O.Andreae, J. L. Jimenez, M. Gallagher, S. M. Kreidenweis, A. K. Bertram, andU. Pöschl. High concentrations of biological aerosol particles and ice nuclei duringand after rain. Atmospheric Chemistry and Physics, 13(13):6151–6164, July 2013.
[57] Ipcc. Summary for Policymakers. In C. B. Field, V. R. Barros, D. J. Dokken,K. J. Mach, M. D. Mastrandrea, T. E. Bilir, M. Chatterjee, K. L. Ebi, Y. O.Estrada, R. C. Genova, B. Girma, E. S. Kissel, A. N. Levy, S. MacCracken, P. R.Mastrandrea, and L. L. White, editors, Climate Change 2014: Impacts, Adap-tation, and Vulnerability. Part A: Global and Sectoral Aspects. Contribution ofWorking Group II to the Fifth Assessment Report of the Intergovernmental Panelon Climate Change, pages 1–32. Cambridge University Press, Cambridge, UnitedKingdom, and New York, NY, USA, 2014.
[58] J. P. Kallungal and A. J. Barduhn. Growth-Rate of an Ice Crystal in SubcooledPure Water. Aiche Journal, 23(3):294–303, 1977.
[59] Hilding Köhler. The nucleus in and the growth of hygroscopic droplets. Transac-tions of the Faraday Society, 32:1152–1161, 1936.
[60] W D King and N H Fletcher. Pressures and stresses in freezing water drops.Journal of Physics D: Applied Physics, 6(18):2157, 1973.
[61] Charles A. Knight. Spiral Air Bubbles in Ice. Nature, 214(5095):1324–1325, 1967.
[62] Charles A. Knight. An exploratory study of ice-cube spikes. Journal of Glaciology,51(173):191–200, 2005.
[63] Charles A. Knight and Nancy C. Knight. Drop Freezing in Clouds. Journal of theAtmospheric Sciences, 31(4):1174–1176, May 1974.
[64] Kirsten A Koehler, Paul J DeMott, Sonia M Kreidenweis, Olga B Popovicheva,Markus D Petters, Christian M Carrico, Elena D Kireeva, Tatiana D Khokhlova,and Natalia K Shonija. Cloud condensation nuclei and ice nucleation activity ofhydrophobic and hydrophilic soot particles. Physical Chemistry Chemical Physics,11(36):7906–7920, 2009.
[65] S Komura, Y Hirose, and Y Nonomura. Adsorption of colloidal particles to curvedinterfaces. The Journal of Chemical Physics, 124(24):241104, 2006.
Bibliography 123
[66] A. Korolev. Limitations of the wegener-bergeron-findeisen mechanism in the evolu-tion of mixed-phase clouds. Journal of the Atmospheric Sciences, 64(9):3372–3375,September 2007.
[67] A. Korolev and G. A. Isaac. Shattering during sampling by OAPs and HVPS. PartI: Snow particles. Journal of Atmospheric and Oceanic Technology, 22(5):528–542,May 2005.
[68] A. V. Korolev, G. A. Isaac, and J. Hallett. Ice particle habits in Arctic clouds.Geophysical Research Letters, 26(9):1299–1302, 1999.
[69] Linhong Kou, Daniel Labrie, and Petr Chylek. Refractive Indices of Water and Icein the 0.65-to 2.5- mu m Spectral Range. Applied Optics, 32(19):3531–3540, 1993.
[70] Ari Laaksonen, Pekka Korhonen, Markku Kulmala, and Robert J. Charlson. Modi-fication of the Köhler Equation to Include Soluble Trace Gases and Slightly SolubleSubstances. Journal of the Atmospheric Sciences, 55(5):853–862, March 1998.
[71] L. A. Ladino, O. Stetzer, and U. Lohmann. Contact freezing: a review. Atmos.Chem. Phys. Discuss., 13(3):7811–7869, 2013.
[72] J. S. Langer and H. Mullerkrumbhaar. Stability Effects in Dendritic Crystal-Growth. Journal of Crystal Growth, 42(Dec):11–14, 1977.
[73] J. S. Langer, R. F. Sekerka, and T. Fujioka. Evidence for a universal law ofdendritic growth rates. Journal of Crystal Growth, 44(4):414–418, 1978.
[74] Irving Langmuir. THE PRODUCTION OF RAIN BY A CHAIN REACTION INCUMULUS CLOUDS AT TEMPERATURES ABOVE FREEZING. Journal ofMeteorology, 5(5):175–192, October 1948.
[75] Christophe Lécuyer. Water on Earth. Wiley-ISTE, 2013.
[76] Zev Levin, Noam Halfon, and Pinhas Alpert. Reassessment of rain enhancementexperiments and operations in Israel including synoptic considerations. Atmo-spheric Research, 97(4):513–525, 2010.
[77] Zev Levin and Saul A. Yankofsky. Contact Versus Immersion Freezing of FreelySuspended Droplets by Bacterial Ice Nuclei. Journal of Climate and Applied Me-teorology, 22(11):1964–1966, November 1983.
124 Bibliography
[78] Henri Lhuissier and Emmanuel Villermaux. Bursting bubble aerosols. Journal ofFluid Mechanics, 696:5–44, 2012.
[79] D.R. Lide and Chemical Rubber Company. CRC Handbook of Chemistry andPhysics. CRC Press, 1998.
[80] Gérard Liger-Belair, Clara Cilindre, Régis D Gougeon, Marianna Lucio, IstvanGebefügi, Philippe Jeandet, and Philippe Schmitt-Kopplin. Unraveling differentchemical fingerprints between a champagne wine and its aerosols. Proceedings ofthe National Academy of Sciences, 106(39):16545–16549, 2009.
[81] ER Likhachev. Dependence of water viscosity on temperature and pressure. Tech-nical Physics, 48(4):514–515, 2003.
[82] E. Loomis. On the Freezing-points of Dilute Solutions. I. Physical Review (SeriesI), 1(3):199–213, 1893.
[83] Y. J. Lu, W. J. Xie, and B. B. Wei. Rapid growth of ice dendrite in acousticallylevitated and highly undercooled water. Chinese Physics Letters, 19(10):1543–1546, October 2002.
[84] W. C. Macklin and B. F. Ryan. Habits of Ice Grown in Supercooled Water andAqueous Solutions. Philosophical Magazine, 14(130):847–&, 1966.
[85] C. Marcolli, S. Gedamke, T. Peter, and B. Zobrist. Efficiency of immersion modeice nucleation on surrogates of mineral dust. Atmos. Chem. Phys., 7(19):5081–5091, 2007.
[86] BJ Mason and J Maybank. The fragmentation and electrification of freezing waterdrops. Quarterly Journal of the Royal Meteorological Society, 86(368):176–185,1960.
[87] John P McCloskey and Jens OM Karlsson. Temporally resolved imaging of icenucleation and growth in highly supercooled water. pages 195–196. IEEE, 2012.
[88] O. Möhler, P. R. Field, P. Connolly, S. Benz, H. Saathoff, M. Schnaiter, R. Wagner,R. Cotton, M. Krämer, A. Mangold, and A. J. Heymsfield. Efficiency of thedeposition mode ice nucleation on mineral dust particles. Atmos. Chem. Phys.,6(10):3007–3021, 2006.
Bibliography 125
[89] O. Möhler, O. Stetzer, S. Schaefers, C. Linke, M. Schnaiter, R. Tiede, H. Saathoff,M. Krämer, A. Mangold, P. Budz, P. Zink, J. Schreiner, K. Mauersberger,W. Haag, B. Kärcher, and U. Schurath. Experimental investigation of homo-geneous freezing of sulphuric acid particles in the aerosol chamber AIDA. Atmos.Chem. Phys., 3(1):211–223, 2003.
[90] S. C. Mossop. Production of Secondary Ice Particles during Growth of Graupel byRiming. Quarterly Journal of the Royal Meteorological Society, 102(431):45–57,1976.
[91] S. C. Mossop. The Mechanism of Ice Splinter Production during Riming. Geo-physical Research Letters, 7(2):167–169, 1980.
[92] S. C. Mossop. Microphysical Properties of Supercooled Cumulus Clouds in Whichan Ice Particle Multiplication Process Operated. Quarterly Journal of the RoyalMeteorological Society, 111(467):183–198, 1985.
[93] S. C. Mossop, A. Ono, and E. R. Wishart. Ice Particles in Maritime Clouds nearTasmania. Quarterly Journal of the Royal Meteorological Society, 96(409):487–&,1970.
[94] D. M. Murphy and T. Koop. Review of the vapour pressures of ice and supercooledwater for atmospheric applications. Quarterly Journal of the Royal MeteorologicalSociety, 131(608):1539–1565, 2005.
[95] B. J. Murray, D. O’Sullivan, J. D. Atkinson, and M. E. Webb. Ice nucleationby particles immersed in supercooled cloud droplets. Chemical Society Reviews,41(19):6519–6554, 2012.
[96] Kai-Uwe Nerding. Statistik und Dynamik der Fragmentation von Wolkentröpfchen- Statistics and dynamics of cloud droplet fragmentation. Bachelor thesis, Karl-sruher Institut für Technologie (KIT), Karlsruhe, October 2011.
[97] Monika Niemand, Ottmar Möhler, Bernhard Vogel, Heike Vogel, Corinna Hoose,Paul Connolly, Holger Klein, Heinz Bingemer, Paul DeMott, Julian Skrotzki,and Thomas Leisner. A Particle-Surface-Area-Based Parameterization of Immer-sion Freezing on Desert Dust Particles. Journal of the Atmospheric Sciences,69(10):3077–3092, October 2012.
126 Bibliography
[98] Odencran.Fk, W. S. Mcewan, P. Stamand, and W. G. Finnegan. Mechanism forMultiplication of Atmospheric Ice Crystals - Apparent Charge Distribution onLaboratory Crystals. Science, 160(3834):1345–&, 1968.
[99] C. D. O’Dowd and G. De Leeuw. Marine aerosol production: a review of thecurrent knowledge. Philosophical Transactions of the Royal Society a-MathematicalPhysical and Engineering Sciences, 365(1856):1753–1774, July 2007.
[100] M. Oettel and S. Dietrich. Colloidal Interactions at Fluid Interfaces . Langmuir,24(4):1425–1441, February 2008.
[101] K. Ohsaka and E. H. Trinh. Apparatus for measuring the growth velocity ofdendritic ice in undercooled water. Journal of Crystal Growth, 194(1):138–142,November 1998.
[102] V. I. Osipov. Density of clay minerals. Soil Mechanics and Foundation Engineering,48(6):231–240, January 2012.
[103] Thomas Jan Pander. Gefrierverhalten unterkühlter Wolkentropfen. Diploma the-sis, Ruprecht-Karls-Universität Heidelberg, 2011.
[104] W. Paul and M. Raether. Das Elektrische Massenfilter. Zeitschrift Fur Physik,140(3):262–273, 1955.
[105] Stéphan Pouleur, Claude Richard, Jean-Guy Martin, and Hani Antoun. Ice Nu-cleation Activity in Fusarium acuminatum and Fusarium avenaceum. Applied andEnvironmental Microbiology, 58(9):2960–2964, September 1992.
[106] A. J. Prenni, P. J. DeMott, C. Twohy, M. R. Poellot, S. M. Kreidenweis, D. C.Rogers, S. D. Brooks, M. S. Richardson, and A. J. Heymsfield. Examinations of iceformation processes in Florida cumuli using ice nuclei measurements of anvil icecrystal particle residues. Journal of Geophysical Research-Atmospheres, 112(D10),May 2007.
[107] A. J. Prenni, M. D. Petters, S. M. Kreidenweis, C. L. Heald, S. T. Martin, P. Ar-taxo, R. M. Garland, A. G. Wollny, and U. Poschl. Relative roles of biogenicemissions and Saharan dust as ice nuclei in the Amazon basin. Nature Geoscience,2(6):401–404, June 2009.
[108] H. R. Pruppacher. A New Look at Homogeneous Ice Nucleation in SupercooledWater Drops. Journal of the Atmospheric Sciences, 52(11):1924–1933, June 1995.
Bibliography 127
[109] H. R. Pruppacher and R. J. Schlamp. A wind tunnel investigation on ice multi-plication by freezing of waterdrops falling at terminal velocity in air. Journal ofGeophysical Research, 80(3):380–386, January 1975.
[110] Hans R. Pruppacher, James D. Klett, and Pao K. Wang. Microphysics of Cloudsand Precipitation. Aerosol Science and Technology, 28(4):381–382, January 1998.
[111] Pruppach.Hr. Interpretation of Experimentally Determined Growth Rates of IceCrystals in Supercooled Water. Journal of Chemical Physics, 47(5):1807–&, 1967.
[112] B. G. Pummer, L. Atanasova, H. Bauer, J. Bernardi, I. S. Druzhinina, J. Fröhlich-Nowoisky, and H. Grothe. Spores of many common airborne fungi reveal noice nucleation activity in oil immersion freezing experiments. Biogeosciences,10(12):8083–8091, 2013.
[113] B. G. Pummer, H. Bauer, J. Bernardi, S. Bleicher, and H. Grothe. Suspendablemacromolecules are responsible for ice nucleation activity of birch and coniferpollen. Atmos. Chem. Phys., 12(5):2541–2550, 2012.
[114] Arthur L. Rangno. Fragmentation of Freezing Drops in Shallow Maritime FrontalClouds. Journal of the Atmospheric Sciences, 65(4):1455–1466, April 2008.
[115] Arthur L. Rangno and Peter V. Hobbs. Ice particles in stratiform clouds in theArctic and possible mechanisms for the production of high ice concentrations.Journal of Geophysical Research: Atmospheres, 106(D14):15065–15075, 2001.
[116] FM Raoult. General law of the vapor pressure of solvents. Comptes Rendus,104:1430–3, 1887.
[117] P. Roberts and J. Hallett. A laboratory study of the ice nucleating properties ofsome mineral particulates. Quarterly Journal of the Royal Meteorological Society,94(399):25–34, 1968.
[118] W Roedel and T Wagner. Physik unserer Umwelt: Die Atmosphäre. SpringerLink:Bücher. 2011.
[119] Daniel Rzesanke. Laborexperimente zum Einfluss elektrischer Ladungen aufWolkenprozesse. PhD thesis, Technische Universität Ilmenau, 2012.
[120] Abdus Salam, Ulrike Lohmann, Brian Crenna, Glen Lesins, Peter Klages, DavidRogers, Rishad Irani, Andrew MacGillivray, and Matthew Coffin. Ice Nucleation
128 Bibliography
Studies of Mineral Dust Particles with a New Continuous Flow Diffusion Chamber.Aerosol Science and Technology, 40(2):134–143, February 2006.
[121] C. P. R. Saunders and A. S. Hosseini. A laboratory study of the effect of velocityon Hallett-Mossop ice crystal multiplication. Atmospheric Research, 59-60(0):3–14,2001.
[122] Vincent J. Schaefer. The Production of Ice Crystals in a Cloud of SupercooledWater Droplets. Science, 104(2707):457–459, November 1946.
[123] Jianying Shang, Markus Flury, James B Harsh, and Richard L Zollars. Comparisonof different methods to measure contact angles of soil colloids. Journal of Colloidand Interface Science, 328(2):299–307, 2008.
[124] A. A. Shibkov, Y. I. Golovin, M. A. Zheltov, A. A. Korolev, and A. A. Leonov.Morphology diagram of nonequilibrium patterns of ice crystals growing in super-cooled water. Physica a-Statistical Mechanics and Its Applications, 319:65–79,March 2003.
[125] A. A. Shibkov, Y. I. Golovin, M. A. Zheltov, A. A. Korolev, and A. A. Vlasov.Kinetics and morphology of nonequilibrium growth of ice in supercooled water.Crystallography Reports, 46(3):496–502, May 2001.
[126] A. A. Shibkov, M. A. Zheltov, A. A. Korolev, A. A. Kazakov, and A. A. Leonov.Effect of surface kinetics on the dendritic growth of ice in supercooled water.Crystallography Reports, 49(6):1056–1063, November 2004.
[127] AA Shibkov, MA Zheltov, AA Korolev, AA Kazakov, and AA Leonov. Crossoverfrom diffusion-limited to kinetics-limited growth of ice crystals. Journal of CrystalGrowth, 285(1):215–227, 2005.
[128] W. Shimada and Y. Furukawa. Pattern formation of ice crystals during free growthin supercooled water. Journal of Physical Chemistry B, 101(32):6171–6173, August1997.
[129] Pyungho Shin, Jaeyong Sung, and Myeong Ho Lee. Control of droplet formationfor low viscosity fluid by double waveforms applied to a piezoelectric inkjet nozzle.Microelectronics Reliability, 51(4):797–804, 2011.
[130] Glen A. Slack. Thermal conductivity of ice. Physical Review B, 22(6):3065–3071,1980.
Bibliography 129
[131] Donald E Spiel. On the births of film drops from bubbles bursting on seawatersurfaces. Journal of Geophysical Research: Oceans (1978-2012), 103(C11):24907–24918, 1998.
[132] P. Squires and E. J. Smith. The Artificial Stimulation of Precipitation by Meansof Dry Ice. Australian Journal of Chemistry, 2(2):232–245, 1949.
[133] I. Steinke, O. Möhler, A. Kiselev, M. Niemand, H. Saathoff, M. Schnaiter,J. Skrotzki, C. Hoose, and T. Leisner. Ice nucleation properties of fine ashparticles from the Eyjafjallajökull eruption in April 2010. Atmos. Chem. Phys.,11(24):12945–12958, 2011.
[134] C. Takahashi and A. Yamashita. Production of Ice Splinters by the Freezing ofWater Drops in Free Fall. Journal of the Meteorological Society of Japan. Ser. II,55(1):139–141, 1977.
[135] Chuji Takahashi. Relation between the Deformation and the Crystalline Natureof Frozen Water Drops. Journal of the Meteorological Society of Japan. Ser. II,54(6):448–453, 1976.
[136] Chuji Takahashi and A. Yamashita. Shattering of frozen water drops in a super-cooled cloud. Journal of the Meteorological Society of Japan, 1970.
[137] Geoffrey Taylor. The Dynamics of Thin Sheets of Fluid. III. Disintegration ofFluid Sheets, volume 253. December 1959.
[138] William Thomson. LX. On the equilibrium of vapour at a curved surface of liq-uid. The London, Edinburgh, and Dublin Philosophical Magazine and Journal ofScience, 42(282):448–452, 1871.
[139] E. Tombari, C. Ferrari, and G. Salvetti. Heat capacity anomaly in a large sampleof supercooled water. Chemical Physics Letters, 300(5-6):749–751, February 1999.
[140] TSI. Model 3080-Series Electrostatic Classifiers. Product information, 2001.
[141] TSI. Model 3076 Constant Output Atomizer. Manual, 2005.
[142] TSI. FLUIDIZED BED AEROSOL GENERATOR MODEL 3400a. Product in-formation, 2014.
[143] TSI. ULTRAFINE CONDENSATION PARTICLE COUNTER MODEL 3776.Product information, 2014.
130 Bibliography
[144] Hiroshi Tsuji, Hiroko Satoh, Shigeki Ikeda, Yasuhito Gotoh, and Junzo Ishikawa.Contact angle lowering of polystyrene surface by silver-negative-ion implantationfor improving biocompatibility and introduced atomic bond evaluation by XPS.Nuclear Instruments and Methods in Physics Research Section B: Beam Interac-tions with Materials and Atoms, 141(1-4):197–201, 1998.
[145] S. Twomey. Pollution and the planetary albedo. Atmospheric Environment (1967),8(12):1251–1256, 1974.
[146] S. Twomey. Influence of Pollution on Shortwave Albedo of Clouds. Journal of theAtmospheric Sciences, 34(7):1149–1152, 1977.
[147] S. A. Twomey, M. Piepgrass, and T. L. Wolfe. An assessment of the impact of pol-lution on global cloud albedo. Tellus Series B-Chemical and Physical Meteorology,36B(5):356–366, 1984.
[148] Larry Vardiman. The Generation of Secondary Ice Particles in Clouds by Crystal-Crystal Collision. Journal of the Atmospheric Sciences, 35(11):2168–2180, Novem-ber 1978.
[149] N. B. Vargaftik, B. N. Volkov, and L. D. Voljak. International Tables of the SurfaceTension of Water. Journal of Physical and Chemical Reference Data, 12(3):817–820, 1983.
[150] G. Vidaurre and J. Hallett. Particle Impact and Breakup in Aircraft Measurement.Journal of Atmospheric and Oceanic Technology, 26(5):972–983, May 2009.
[151] Emmanuel Villermaux and Benjamin Bossa. Single-drop fragmentation determinessize distribution of raindrops. Nature Physics, 5(9):697–702, 2009.
[152] Annele Virtanen, Jorma Joutsensaari, Thomas Koop, Jonna Kannosto, Pasi Yli-Pirila, Jani Leskinen, Jyrki M. Makela, Jarmo K. Holopainen, Ulrich Poschl,Markku Kulmala, Douglas R. Worsnop, and Ari Laaksonen. An amorphous solidstate of biogenic secondary organic aerosol particles. Nature, 467(7317):824–827,2010.
[153] B. Vonnegut. The Nucleation of Ice Formation by Silver Iodide. Journal of AppliedPhysics, 18(7):593–595, 1947.
[154] Alfred Wegener. Thermodynamik der Atmosphäre. JA Barth, 1911.
Bibliography 131
[155] Christiane Wender. Eiskristallwachstum aus der Gasphase auf elektrodynamischlevitierten Einzelpartikeln. PhD thesis, Ruprecht-Karls-Universität Heidelberg,2012.
[156] Heike Wex, Frank Stratmann, David Topping, and Gordon McFiggans. The Kelvinversus the Raoult Term in the Köhler Equation. Journal of the Atmospheric Sci-ences, 65(12):4004–4016, December 2008.
[157] Herman Wijshoff. The dynamics of the piezo inkjet printhead operation. PhysicsReports, 491(4-5):77–177, 2010.
[158] P K Wolber, C A Deininger, M W Southworth, J Vandekerckhove, M van Montagu,and G J Warren. Identification and purification of a bacterial ice-nucleation pro-tein. Proceedings of the National Academy of Sciences, 83(19):7256–7260, October1986.
[159] Frank Zimmermann, Stephan Weinbruch, Lothar Schütz, Heiko Hofmann, Mar-tin Ebert, Konrad Kandler, and Annette Worringen. Ice nucleation properties ofthe most abundant mineral dust phases. Journal of Geophysical Research: Atmo-spheres, 113(D23):D23204, 2008.

Acknowledgements
I’d like to thank professor Thomas Leisner for giving me the opportunity to write this thesis. Workingunder his guidance has been a great experience, as he unites a phenomenal understanding of physics,a fine instinct for experimental work problems and solutions and a quick mind with care for his PhDstudents. He gave me the freedom to play with amazing pieces of equipment in the direction I saw fitand was always interested in the developments of my work.I’d like to thank all my colleagues at the IMK-AAF for all the good years. I appreciated the goodatmosphere at the institute, knowing that one cannot take the feeling of a community at the workplacefor granted. I’d specifically like to thank my colleagues at the Paul trap laboratory, it has been apleasure to work alongside them and to exchange ideas and sometimes idle banter.I’d like to thank Daniel Rzesanke, who convinced me to do my diploma thesis at the KIT, for his creativeenergy at all times and for showing me that critically reading papers is a scientist’s duty. I’d like to thankChristiane Wender for showing me the ropes at the beginning, for letting me know what experimentalwork means and for the secret to good pizza baking. I’d like to thank Alexei Kiselev for being thebest laboratory superintendent I ever had and could wish for, both with regard to his knowledge onexperimental work and his ability to become an expert in new fields of atmospheric research and to sharethat knowledge. I’d like to thank Jens Nadolny for his invaluable tech support in everything aroundthe electrodynamic balance, the good times at the game evenings and, of course, for Bud Spencer andTerence Hill movies. I’d like to thank Kai-Uwe Nerding for the time, energy and interest he investedinto the work at the Paul trap laboratory. I’d like to thank Patricia Handmann for the great work wecould do together, for the parties and for the horse stories. I’d like to thank Andreas Peckhaus forsharing the office with me, for the dry humor and the excursions into philosophical playgrounds. I’dlike to thank Denis Duft for always having an open ear in matters of science and not-exactly-science.I’d like to thank Nadine for being a nice and open co-laboratorist and for lending a helping hand intimes of experimental difficulties.I’d like to thank Harald Saathoff and Ottmar Möhler for their advice over the years, I’d like to thankSchorsch Scheurig for his technical help in situations of need and for his humor, I’d like to thank BettyKranz for listening and for her wisdom, I’d like to thank Frank Schwarz for the fresh air breaks wetook together and I’d like to thank Susanne Bolz for being a great organisator and helping me in manysituations.I’d like to thank my brother for supporting me in the last days of my thesis. Thank you, Martin! I’dlike to thank my parents, Susanne and Christoph, and my grandparents, Margarete and Heinz Schittko.Without you, I would neither be there, nor would I be where I am today. Thank you for always believingin me and supporting me!And I thank you, Julia, my love, for the incredible support you are to me by being you.
Eidesstattliche Versicherung gemäß § 8 der Promotionsordnung für die Natur-wissenschaftlich - Mathematische Gesamtfakultät der Universität Heidelberg/ Sworn Affidavit according to § 8 of the doctoral degree regulations of theCombined Faculty of Natural Sciences and Mathematics
1. Bei der eingereichten Dissertation zu dem Thema / The thesis I have submittedentitled ’Laboratory ice multiplication experiments on single levitated microdroplets’handelt es sich um meine eigenständig erbrachte Leistung / is my own work.
2. Ich habe nur die angegebenen Quellen und Hilfsmittel benutzt und mich keinerunzulässigen Hilfe Dritter bedient. Insbesondere habe ich wörtlich oder sinngemäß ausanderen Werken übernommene Inhalte als solche kenntlich gemacht. / I have only usedthe sources indicated and have not made unauthorised use of services of a third party.Where the work of others has been quoted or reproduced, the source is always given. 3.
Die Arbeit oder Teile davon habe ich bislang nicht an einer Hochschule des In- oderAuslands als Bestandteil einer Prüfungs- oder Qualifikationsleistung vorgelegt. / I havenot yet presented this thesis or parts thereof to a university as part of an examinationor degree.
4. Die Richtigkeit der vorstehenden Erklärungen bestätige ich. / I confirm that thedeclarations made above are correct.
5. Die Bedeutung der eidesstattlichen Versicherung und die strafrechtlichen Folgeneiner unrichtigen oder unvollständigen eidesstattlichen Versicherung sind mir bekannt./ I am aware of the importance of a sworn affidavit and the criminal prosecution incase of a false or incomplete affidavit Ich versichere an Eides statt, dass ich nach bestemWissen die reine Wahrheit erklärt und nichts verschwiegen habe. / I affirm that theabove is the absolute truth to the best of my knowledge and that I have not concealedanything.
(Ort, Datum/Place, date) (Thomas Jan Pander)