Embed Size (px)
Citation preview
Laboratory-Generated Aerosols as Transfer Standards to Characterize
Smoke Detector Performance Xiaoliang Wanga, Judith C. Chowa, and John G. Watsona,
Marit E. Meyerb, Gary Ruffb, and David L. Urbanb, John Eastonc, Gordon Bergerd, Paul D. Mudgette
aDesert Research InstitutebNASA Glenn Research Center
cCase Western Reserve UniversitydUniversities Space Research Association
eNASA Johnson Space Center
38thAAAR Conference October 5-9, 2020
Background
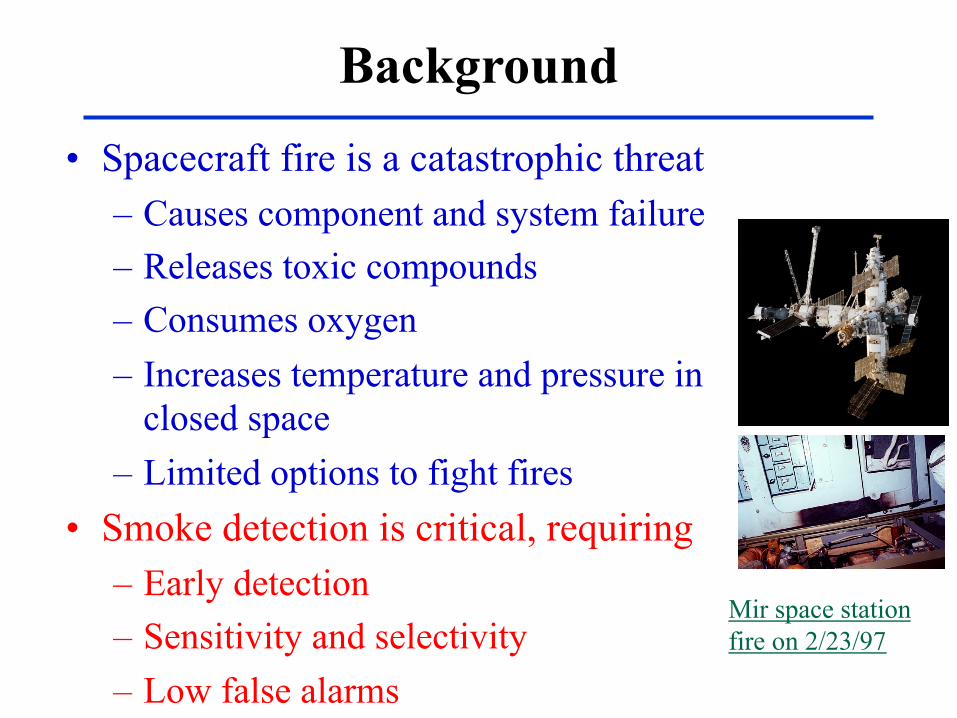
• Spacecraft fire is a catastrophic threat– Causes component and system failure– Releases toxic compounds – Consumes oxygen– Increases temperature and pressure in
closed space – Limited options to fight fires
• Smoke detection is critical, requiring– Early detection– Sensitivity and selectivity– Low false alarms
Mir space station fire on 2/23/97
Motivation
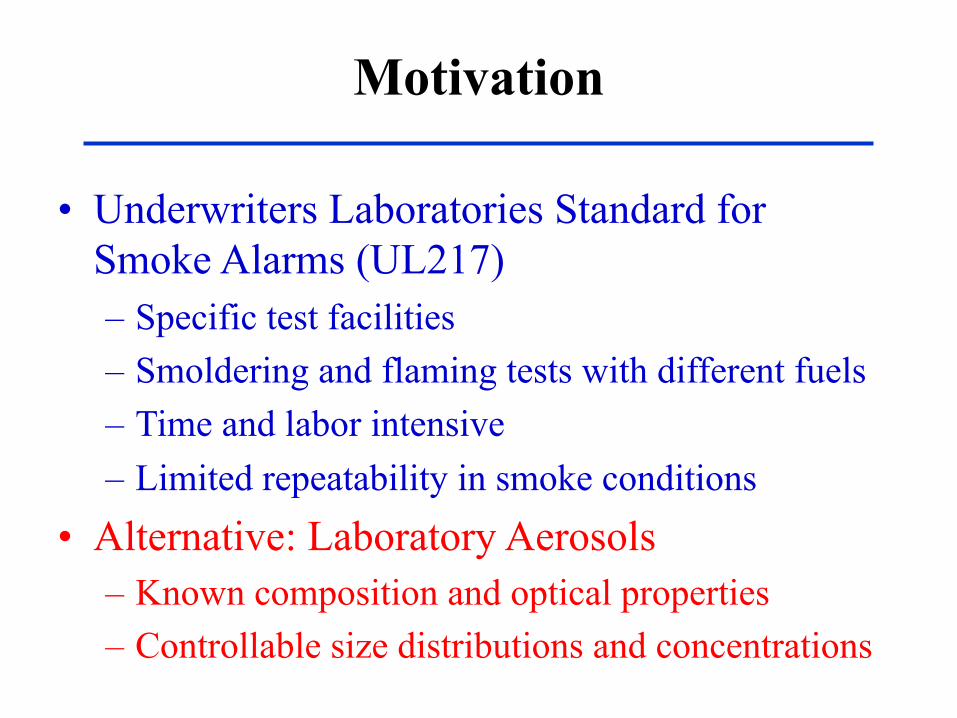
• Underwriters Laboratories Standard for Smoke Alarms (UL217)– Specific test facilities– Smoldering and flaming tests with different fuels– Time and labor intensive– Limited repeatability in smoke conditions
• Alternative: Laboratory Aerosols– Known composition and optical properties– Controllable size distributions and concentrations

Study Objectives
• Evaluate a method to test smoke detectors using reference aerosols
• Characterize smoke detector responses to reference and combustion aerosols
• Determine the feasibility of using reference aerosols to predict smoke detector responses to different smoke aerosols
Reference Aerosols
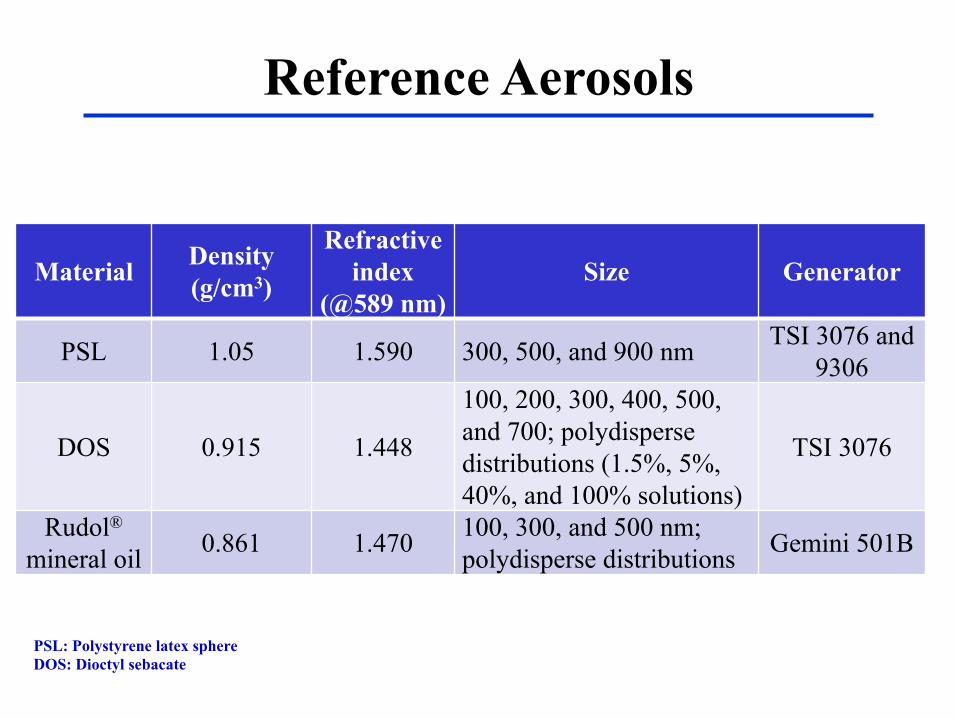
Material Density(g/cm3)
Refractive index
(@589 nm)Size Generator
PSL 1.05 1.590 300, 500, and 900 nm TSI 3076 and 9306
DOS 0.915 1.448
100, 200, 300, 400, 500, and 700; polydisperse distributions (1.5%, 5%, 40%, and 100% solutions)
TSI 3076
Rudol®
mineral oil 0.861 1.470 100, 300, and 500 nm; polydisperse distributions Gemini 501B
PSL: Polystyrene latex sphereDOS: Dioctyl sebacate
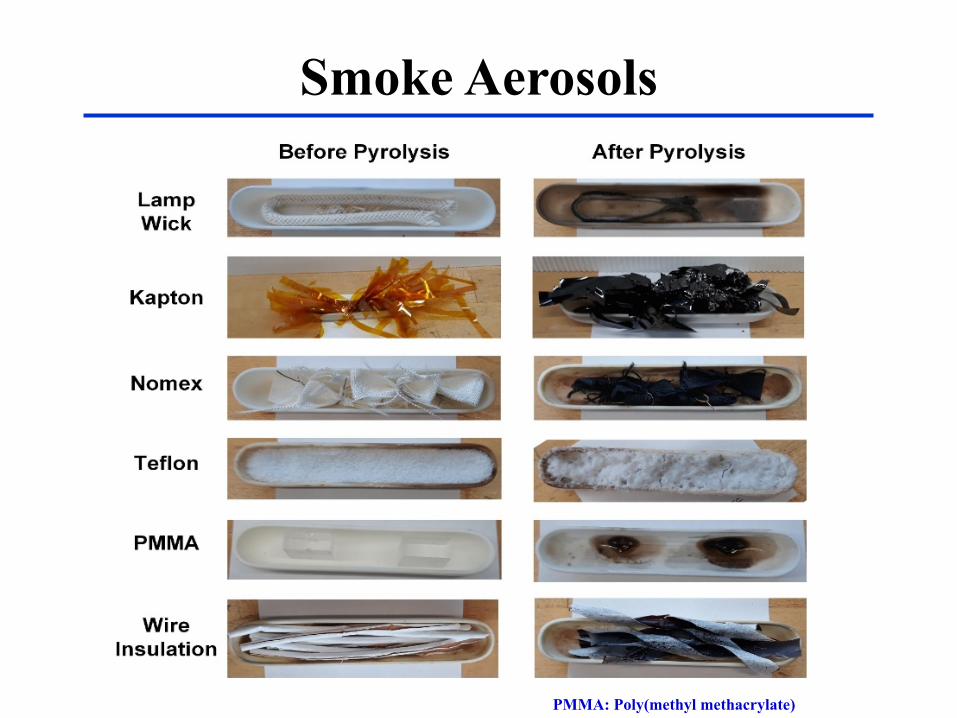
Smoke Aerosols
PMMA: Poly(methyl methacrylate)

Experimental Setup
TSI 9306 Six-Jet Atomizer
Gemini 501BSmoke Detector
Tester
TSI 3076 Atomizer
Smoke Chamber
PressureBalance
Mixing Fan
Smoke Detectors
DustTrak DRX (TSI Model 8534 ; PM1, PM2.5,
PM4, PM10, PM15)
SMPS (TSI Model 3938; Size distribution:
~0.01-0.7 µm)
WCPC (TSI Model 3787; Particle number concentration)
Electrostatic Classifier
(TSI Model 3080)
Photo-diode
ObscurationMeter
Dryer
DryerVentFilter
Vent
Valve
Vent to Roof
KiddeScatter
KiddeIonization
CSP
Dilution Bridge
Neutralizer
Tube Furnace for Smoke Aerosol
Generation
ISS ScatteringSmoke Detector
STS Ionization Smoke Detector
IonZG
HEPAPurge
Air
HEPA CSP: Commercial Space Prototype smoke detectorIonZG: A commercial Kidde ionization smoke detectorISS: International Space StationSTS: Space Transport System

Reference Aerosol Size Distributions
0.0
0.5
1.0
1.5
2.0
2.5
3.0
3.5
10 100 1000
Parti
cle
Num
ber S
ize
Dis
tribu
tion
Nor
mal
ized
by
Tota
l Con
cent
ratio
n dN
/dlo
gDp,
uni
tless
Particle Diameter Dp, nm
5/14/2019
5/17/2019
Mineral Oil
0.0
0.5
1.0
1.5
2.0
2.5
10 100 1000
Parti
cle
Num
ber S
ize
Dis
tribu
tion
Nor
mal
ized
by
Tota
l Con
cent
ratio
n dN
/dlo
gDp,
uni
tless
Particle Diameter Dp, nm
1.5% DOS5% DOS40% DOS100% DOS
Dioctyl sebacate (DOS)
Mineral oil particles generated by the smoke tester on two separate days had similar size distributions.
Atomizing DOS solutions by the TSI 3076 atomizer allowed adjusting particle size distribution.

Smoke Detector Responses to Mineral Oil Particles
y = 0.0094x + 0.954y = 0.0112x + 0.9316y = 0.011x + 0.9615
0.8
1.2
1.6
2.0
2.4
2.8
3.2
0 50 100 150 200
CSP
, V
DRX PM2.5 Mass Concentration, mg/m3
(a) Polydisperse Mineral Oil Particles: CSP vs. PM2.5
5/14/20195/17/20195/23/2019
y = 0.1356x - 0.1486y = 0.1492x - 0.0388y = 0.1329x - 0.2125
-2
2
6
10
14
18
22
26
30
0 50 100 150 200
Obs
cura
tion,
%/m
DRX PM2.5 Mass Concentration, mg/m3
(b) Polydisperse Mineral Oil Particles: Obscuration vs. PM2.5
5/14/20195/17/20195/23/2019
1.5
2.0
2.5
3.0
3.5
4.0
4.5
5.0
0 50 100 150 200
Ion
ZG, V
DRX PM2.5 Mass Concentration, mg/m3
(c) Polydisperse Mineral Oil Particles: IonZG vs. PM2.5
5/14/20195/17/20195/23/2019
0.0
2.0
4.0
6.0
8.0
0 50 100 150 200
ISS
Scat
ter,
V
DRX PM2.5 Mass Concentration, mg/m3
(d) Polydisperse Mineral Oil Particles: ISS Scatter vs. PM2.5
5/17/20195/23/2019
Scattering detectors (CSP, obscuration meter, and ISS scatter detector) signals increased with DRX concentration (before saturation). Ionization detector (IonZG) signal decreased with DRX concentration. Responses were repeatable on three test days.

Smoke Detector Responses to DOS Particles
The smoke detector vs. DRX linear regression slope increased slightly with particle size for CSP and obscuration meter. The IonZG is more sensitive to smaller particles.
0.9
1.2
1.5
1.8
2.1
2.4
0 20 40 60 80
CSP
, V
DRX PM2.5 Mass Concentration, mg/m3
(a) Polydisperse DOS Particles : CSP vs. PM2.5
100% DOS40% DOS5% DOS1.5% DOS
-2
2
6
10
14
18
22
26
30
0 20 40 60 80
Obs
cura
tion,
%/m
DRX PM2.5 Mass Concentration, mg/m3
(b) Polydisperse DOS Particles: Obscuration vs. PM2.5
100% DOS40% DOS5% DOS1.5% DOS
2.0
2.5
3.0
3.5
4.0
4.5
5.0
0 20 40 60 80
Ion
ZG, V
DRX PM2.5 Mass Concentration, mg/m3
(c) Polydisperse DOS Particles: IonZG vs. PM2.5
100% DOS40% DOS5% DOS1.5% DOS

Smoke Evolution
Example time series of a lamp wick test. One gram of lamp wick was added to the tube furnace heated to 200 °C. All instruments responded to the smoke concentration changes. The fuel boat was taken out at ~1500 s and the smoke chamber was purged slowly starting from ~1560 s.
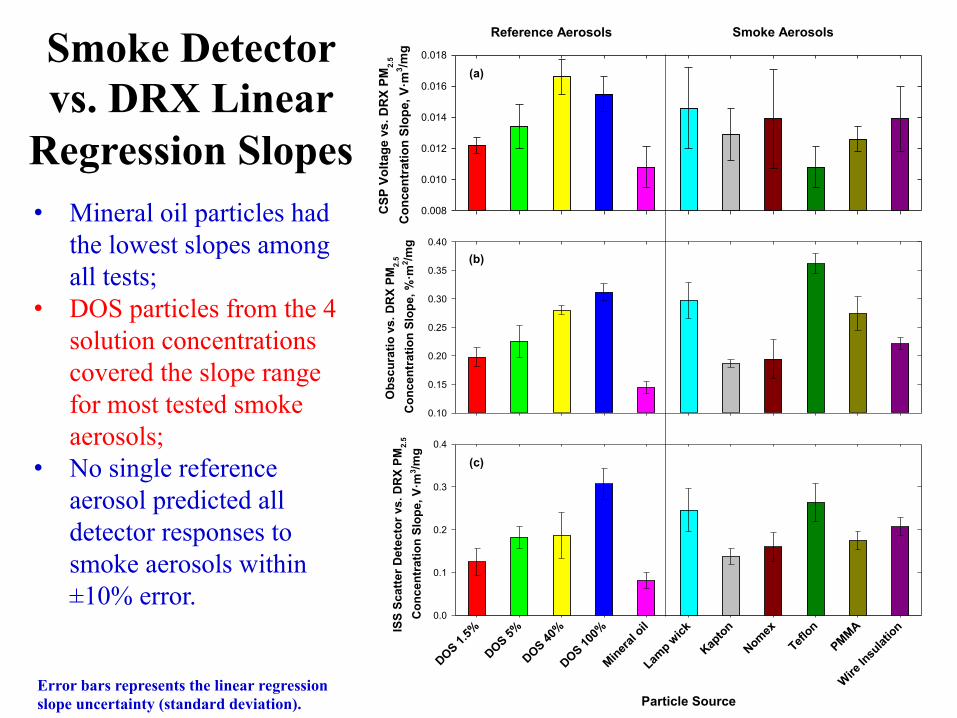
Smoke Detector vs. DRX Linear
Regression Slopes• Mineral oil particles had
the lowest slopes among all tests;
• DOS particles from the 4 solution concentrations covered the slope range for most tested smoke aerosols;
• No single reference aerosol predicted all detector responses to smoke aerosols within ±10% error.
Particle Source
DOS 1.5%
DOS 5%
DOS 40%
DOS 100%
Mineral o
il
Lamp w
ick
Kapton
NomexTefl
onPMMA
Wire In
sulat
ionISS
Scat
ter D
etec
tor v
s. D
RX
PM2.
5
Con
cent
ratio
n Sl
ope,
V·m
3 /mg
0.0
0.1
0.2
0.3
0.4
Obs
cura
tio v
s. D
RX
PM2.
5 C
once
ntra
tion
Slop
e, %
·m2 /m
g0.10
0.15
0.20
0.25
0.30
0.35
0.40
(b)
(c)
CSP
Vol
tage
vs.
DR
X PM
2.5
Con
cent
ratio
n Sl
ope,
V·m
3 /mg
0.008
0.010
0.012
0.014
0.016
0.018
(a)
Reference Aerosols Smoke Aerosols
Error bars represents the linear regression slope uncertainty (standard deviation).
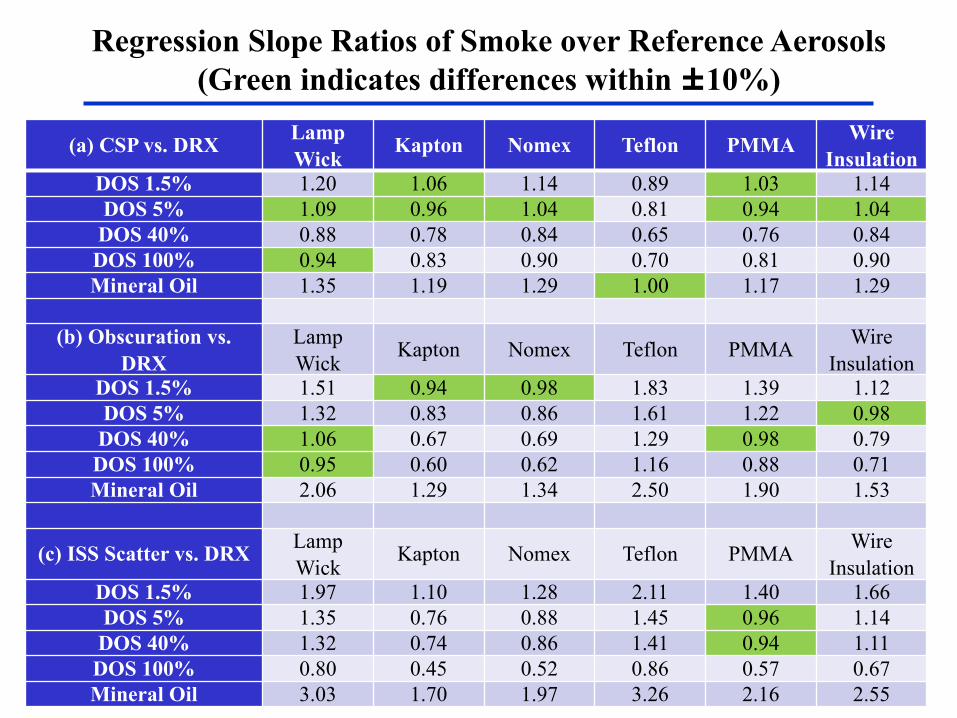
Regression Slope Ratios of Smoke over Reference Aerosols(Green indicates differences within ±10%)
(a) CSP vs. DRX LampWick Kapton Nomex Teflon PMMA Wire
InsulationDOS 1.5% 1.20 1.06 1.14 0.89 1.03 1.14DOS 5% 1.09 0.96 1.04 0.81 0.94 1.04
DOS 40% 0.88 0.78 0.84 0.65 0.76 0.84DOS 100% 0.94 0.83 0.90 0.70 0.81 0.90Mineral Oil 1.35 1.19 1.29 1.00 1.17 1.29
(b) Obscuration vs. DRX
LampWick Kapton Nomex Teflon PMMA Wire
InsulationDOS 1.5% 1.51 0.94 0.98 1.83 1.39 1.12DOS 5% 1.32 0.83 0.86 1.61 1.22 0.98
DOS 40% 1.06 0.67 0.69 1.29 0.98 0.79DOS 100% 0.95 0.60 0.62 1.16 0.88 0.71Mineral Oil 2.06 1.29 1.34 2.50 1.90 1.53
(c) ISS Scatter vs. DRX LampWick Kapton Nomex Teflon PMMA Wire
InsulationDOS 1.5% 1.97 1.10 1.28 2.11 1.40 1.66DOS 5% 1.35 0.76 0.88 1.45 0.96 1.14
DOS 40% 1.32 0.74 0.86 1.41 0.94 1.11DOS 100% 0.80 0.45 0.52 0.86 0.57 0.67Mineral Oil 3.03 1.70 1.97 3.26 2.16 2.55
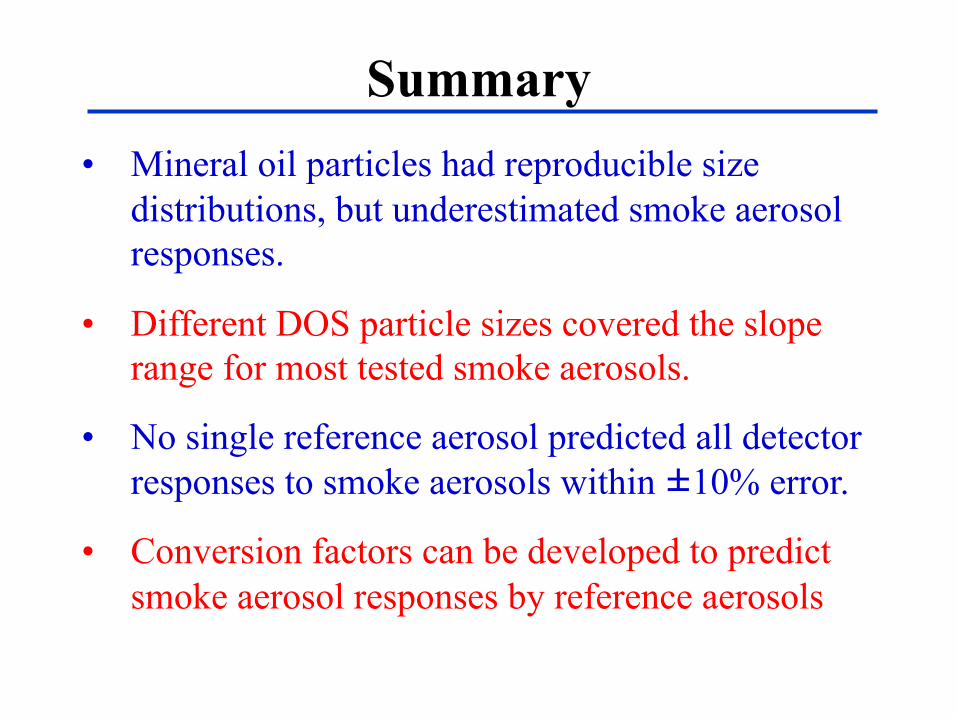
Summary• Mineral oil particles had reproducible size
distributions, but underestimated smoke aerosol responses.
• Different DOS particle sizes covered the slope range for most tested smoke aerosols.
• No single reference aerosol predicted all detector responses to smoke aerosols within ±10% error.
• Conversion factors can be developed to predict smoke aerosol responses by reference aerosols

Acknowledgements
Ø NASA Saffire ProgramØ Universities Space Research Association (USRA)
Contract No. NNC13BA10BØ HX5 Contract No. DRIN20D03Ø NASA EPSCoR Research CAN Grant No.
80NSSC19M0152.
Reference:
Wang et al. (2020). "Spacecraft Smoke Detector Characterization with Reference and Smoke Aerosols." 50th International Conference on Environmental Systems, July 12-16, 2020. https://ttu-ir.tdl.org/handle/2346/86366