Embed Size (px)
Citation preview
1
College of American Pathologists
Laboratory Accreditation Program
Laboratory General Checklist: How to Validate a New Test
D. Robert Dufour, MD, FCAP, FACBConsultant, Veterans Affairs Medical Center, Washington DC
Emeritus Professor of Pathology, George Washington UniversitySeptember 17, 2008
Copyright © 2008 College of American Pathologists (CAP). All rights are reserved. Participants are permitted to duplicate the materials for educational use only within their own institution. These materials may not be used for commercial purposes or altered in any way.
2
Learning Objectives
• As a result of participating in this activity, you will be able to:– Describe the necessary steps to validating
new test performance– Assure that all steps are performed for all
new methods introduced into your laboratory
3
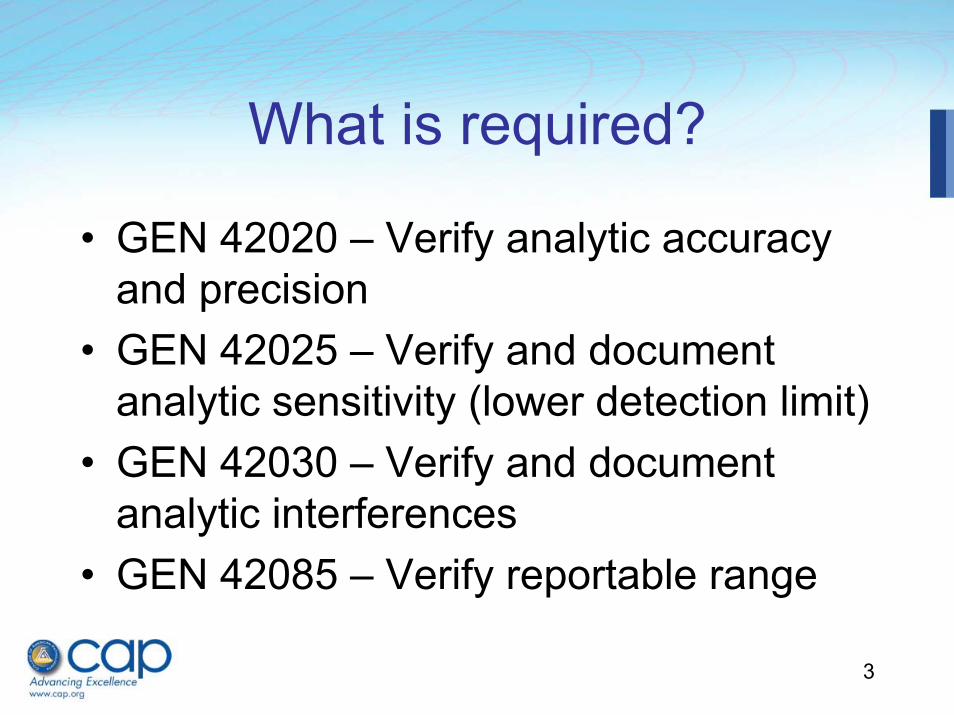
What is required?
• GEN 42020 – Verify analytic accuracy and precision
• GEN 42025 – Verify and document analytic sensitivity (lower detection limit)
• GEN 42030 – Verify and document analytic interferences
• GEN 42085 – Verify reportable range
4
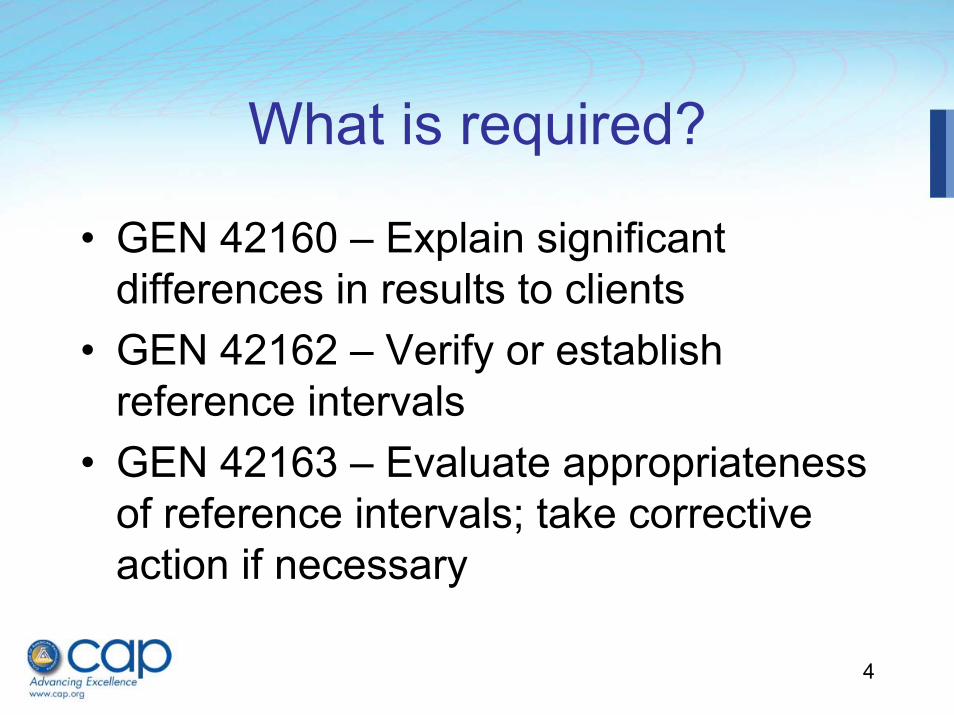
What is required?
• GEN 42160 – Explain significant differences in results to clients
• GEN 42162 – Verify or establish reference intervals
• GEN 42163 – Evaluate appropriateness of reference intervals; take corrective action if necessary
5
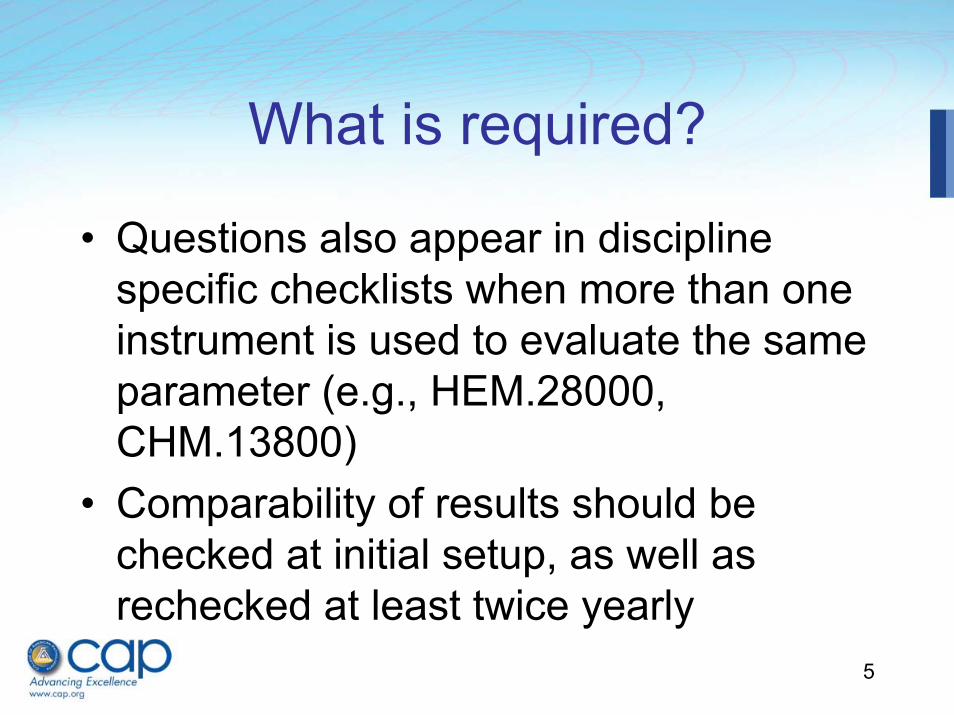
What is required?
• Questions also appear in discipline specific checklists when more than one instrument is used to evaluate the same parameter (e.g., HEM.28000, CHM.13800)
• Comparability of results should be checked at initial setup, as well as rechecked at least twice yearly
6
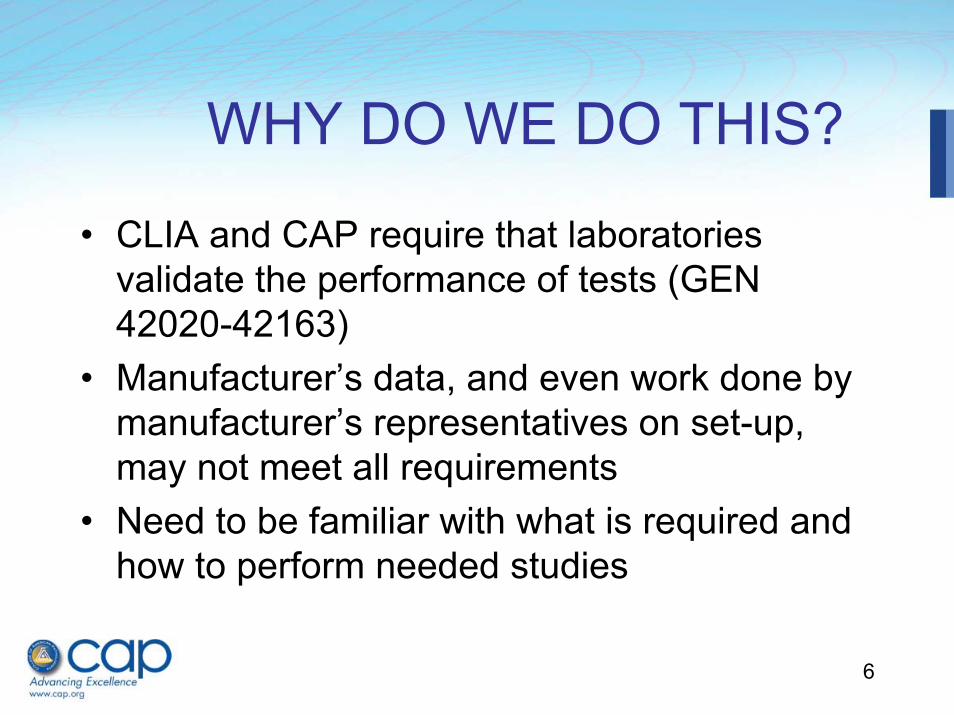
WHY DO WE DO THIS?
• CLIA and CAP require that laboratories validate the performance of tests (GEN 42020-42163)
• Manufacturer’s data, and even work done by manufacturer’s representatives on set-up, may not meet all requirements
• Need to be familiar with what is required and how to perform needed studies
7
What is Required?
• Checklist indicates that, for unmodified FDA cleared tests, can use manufacturer’s or published information for some of these
• However, lab must verify data on accuracy, precision, and reportable range, as well as reference intervals
8
Analytic Accuracy• Agreement between test result and
“true” result• Can be done in two main ways:
– Comparison of results between new method and “reference” method
– Results using new method on certified reference materials (Recovery)
• First approach almost always used
9
Method Comparison• Simplest procedure involves testing 20
samples that span the entire testing range (but do not exceed measurement range) (CLSI-EP15-A2)
• Run samples by both new and comparative method (your current method, reference method)
• Evaluate bias (difference between new, comparative method) in one of several ways
10
Method Comparison• Calculate average bias (difference between
your result and comparison method); is this within allowable limits?
• Review standard texts (Tietz, Kaplan and Pesce) for clinically allowable limits of difference (for example, for albumin, clinically allowable bias 0.06 g/dL; round to 0.1), also check CLIA limits
• Average is poorest way to compare tests
11
Method Comparison• This same approach can be used to
compare two methods currently in use; needs to be done at least every 6 months
• We run 10 samples on both instruments, compare results to clinically allowable bias; if each acceptable, approve comparison study
12
Method Comparison• Can compare using linear regression
analysis; while better than average bias, relatively insensitive to biases in only part of the measurement range
• Standard software (e.g., Excel) can plot linear regression and calculate regression equation; ideally, slope = 1, intercept = 0, r = 0.99
13
Method Comparison• Slope = proportional bias; often related to
calibration differences between methods• Intercept = constant bias; may be related to
calibration or set point issues• r = how close points are to the line drawn; low
r may indicate inadequate range of values studied, individual samples with interferences, or poor correlation between methods; need to exclude any outliers and repeat
14
0
100
200
300
400
500
600
700
800
0 100 200 300 400 500
pO2 Radiometer
pO2
Gem
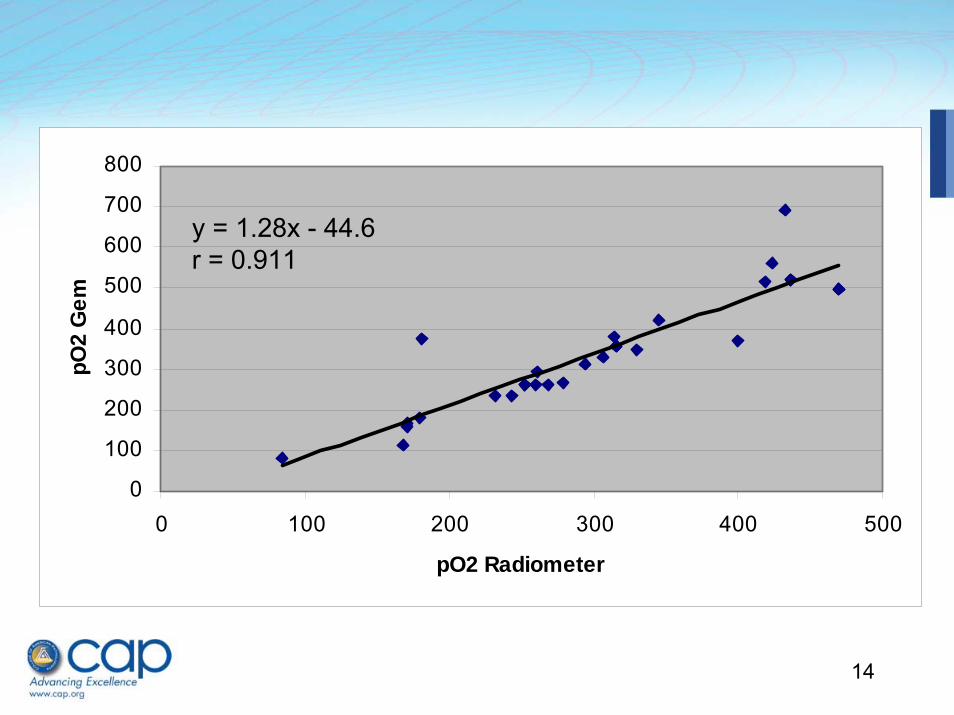
y = 1.28x - 44.6r = 0.911
15
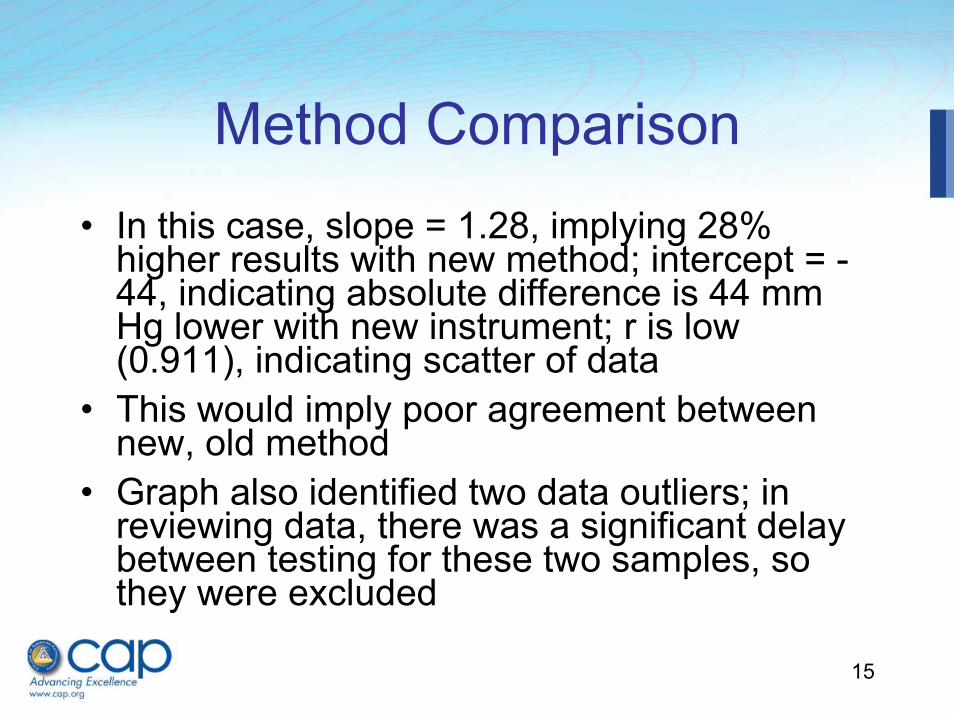
Method Comparison• In this case, slope = 1.28, implying 28%
higher results with new method; intercept = -44, indicating absolute difference is 44 mm Hg lower with new instrument; r is low (0.911), indicating scatter of data
• This would imply poor agreement between new, old method
• Graph also identified two data outliers; in reviewing data, there was a significant delay between testing for these two samples, so they were excluded
16
Method Comparison
• A better approach is to prepare bias plots (difference between results versus value from comparison method); difference (in %) should be similar at all values; can also be done in Excel
• Difference at extremes indicates need to consider that measurement range needs to be tightened, or that other approaches to assure correlation are needed.
17
-120.00
-100.00
-80.00
-60.00
-40.00
-20.00
0.00
20.00
40.00
0 100 200 300 400 500
pO2 Reference
pO2
Diffe
renc
e (%
)
18
Method Comparison
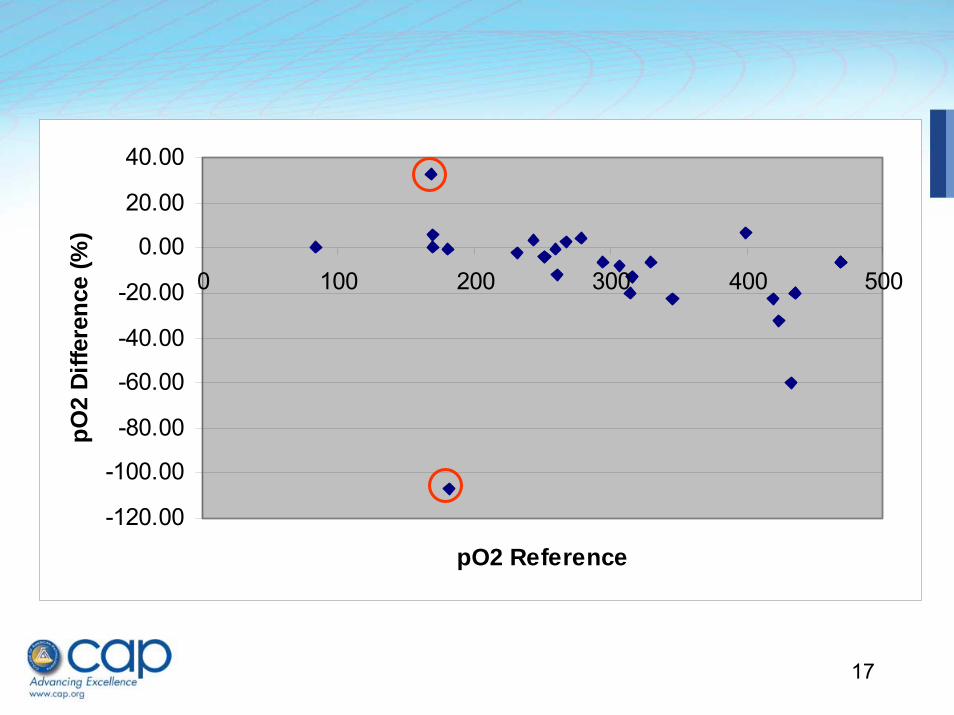
• Data in bias plot show no difference in pO2 up to values of 300 mm Hg
• At pO2 over 300, however, there is a clear negative bias with new method; thus, should not report pO2 > 300 (yet)
• Need to proceed to analytical measurement range studies to see if problem is with new method or current method
19
Method Comparison Problems
• When data suggest a bias, a larger study is needed (typically 100 samples)
• CLSI EP9-A2 provides suggested sample selection criteria and more elaborate interpretation information than provided in EP15-A2
20
Method Comparison Problems• We recently brought a new instrument from
same manufacturer in house• Correlation study for BUN seemed to show
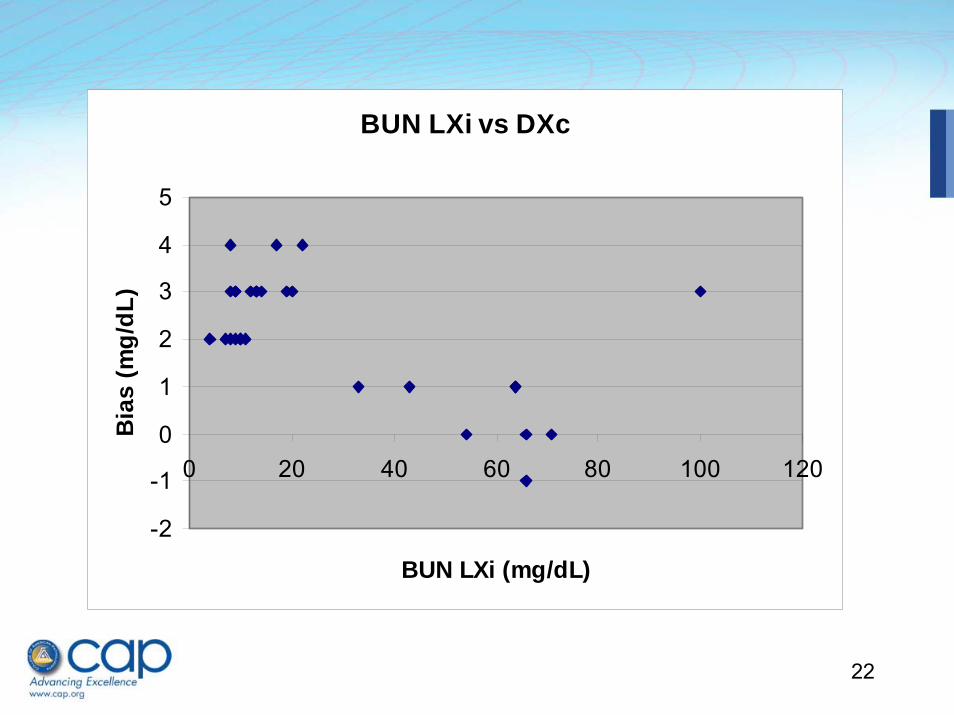
good agreement (next slide)• Inspection of results and bias plot, however,
showed that while results were comparable at high values, they were significantly higher with the new method at values in the reference range and slightly above
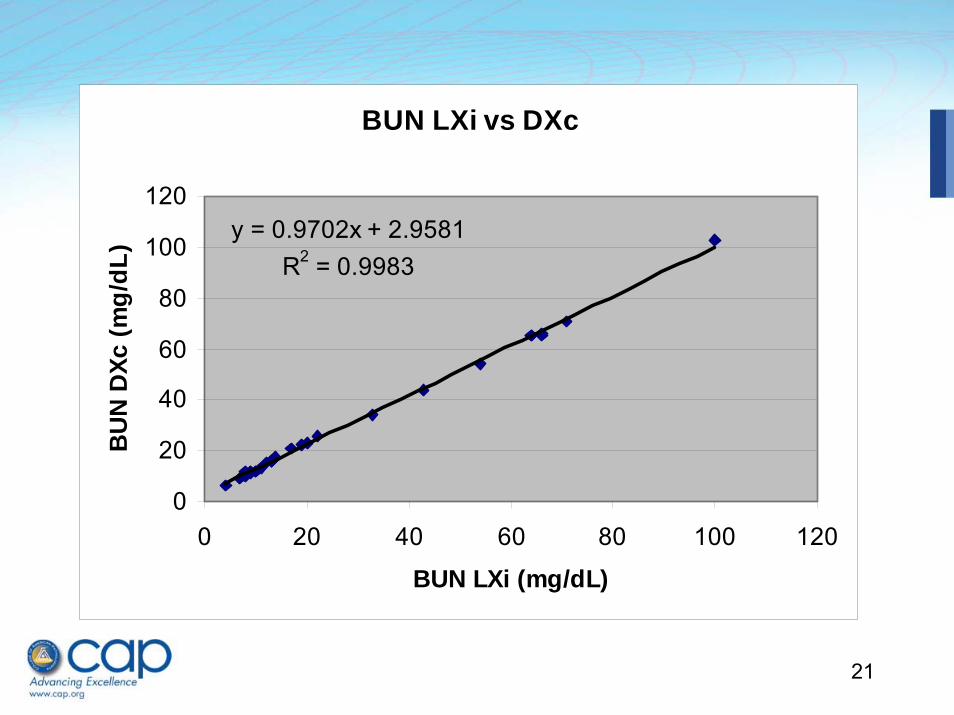
21
BUN LXi vs DXc
y = 0.9702x + 2.9581R2 = 0.9983
0
20
40
60
80
100
120
0 20 40 60 80 100 120
BUN LXi (mg/dL)
BU
N D
Xc (m
g/dL
)
22
BUN LXi vs DXc
-2
-1
0
1
2
3
4
5
0 20 40 60 80 100 120
BUN LXi (mg/dL)
Bia
s (m
g/dL
)
23
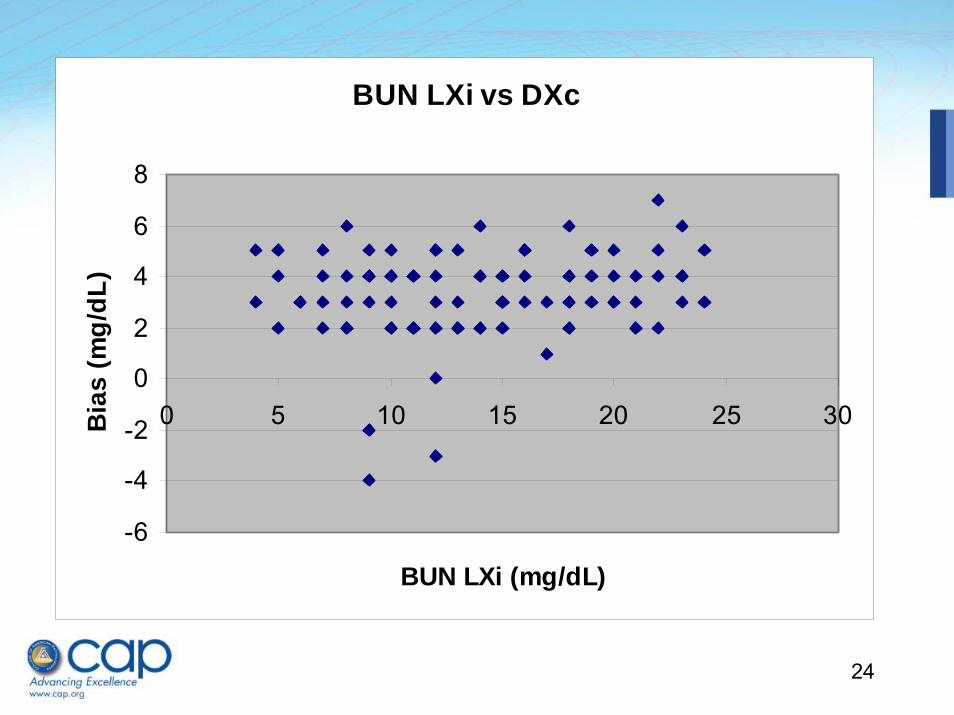
Method Comparison Problems
• What should be done?• Requires a more careful study to
evaluate the extent of the bias and suggest approaches to fix it
• We performed bias study with 100 samples having BUN below 25 mg/dLby our current assay
24
BUN LXi vs DXc
-6
-4
-2
0
2
4
6
8
0 5 10 15 20 25 30
BUN LXi (mg/dL)
Bia
s (m
g/dL
)
25
Method Comparison Problems
• Results showed a constant bias of about 4 mg/dL (average) in this range
• Evaluated new lot of calibrator – same findings
• Adjusted set point of instrument and re-tested; results now within allowable bias at values < 30 mg/dL
• Must remember to take out correction when performing proficiency testing!!!
26
Verify Precision
• Precision is repeatability• Analyze repeatedly, determine variation• CLSI protocol (EP15-A2) suggests two levels,
run 3 times per run for 5 days (15 replicates in all)
• Use a spreadsheet to calculate s.d. for the measurements, compare to manufacturer’s claim; if higher, need to evaluate for cause
27
Verify Precision• Ideally take samples with clinically important
results (e.g., for TSH, should select low and high values, not both in reference range)
• Compare precision to clinically acceptable variation (as described earlier) to assure meets clinical needs
• For samples that are not stable, need to adjust protocol; may not be able to test long term precision using patient samples, may have to use controls or calibrators that have been stabilized
28
Verify Analytic Sensitivity
• Also called lower detection limit• Involves two steps: determination of values
obtained with blank samples, and values obtained with low level positive samples
• Blank samples often use the zero calibrator for an assay, as it can be difficult to find samples truly missing the substance of interest
29
Verify Analytic Sensitivity• Low level positive samples identified at or only
slightly above the manufacturer’s stated analytical sensitivity; for uncommon tests, may need to contact another laboratory doing the test for help in finding low positive samples
• CLSI EP17-A describes actual procedure– Run 20 blanks; if < 3 exceed stated blank value, accept that
value– Run 20 low patient samples near the detection limit; if at
least 17 are above the blank value, the detection limit is verified
30
Verify Analytic Interferences• No approved protocol for performing this task• Most commonly, involves listing stated
interferences from manufacturer, and evaluating samples in correlation studies for differences (outliers), investigation of causes of interference
• Often difficult to determine exact cause of interference except for common causes (hemolysis, lipemia, icterus, related compounds)
31
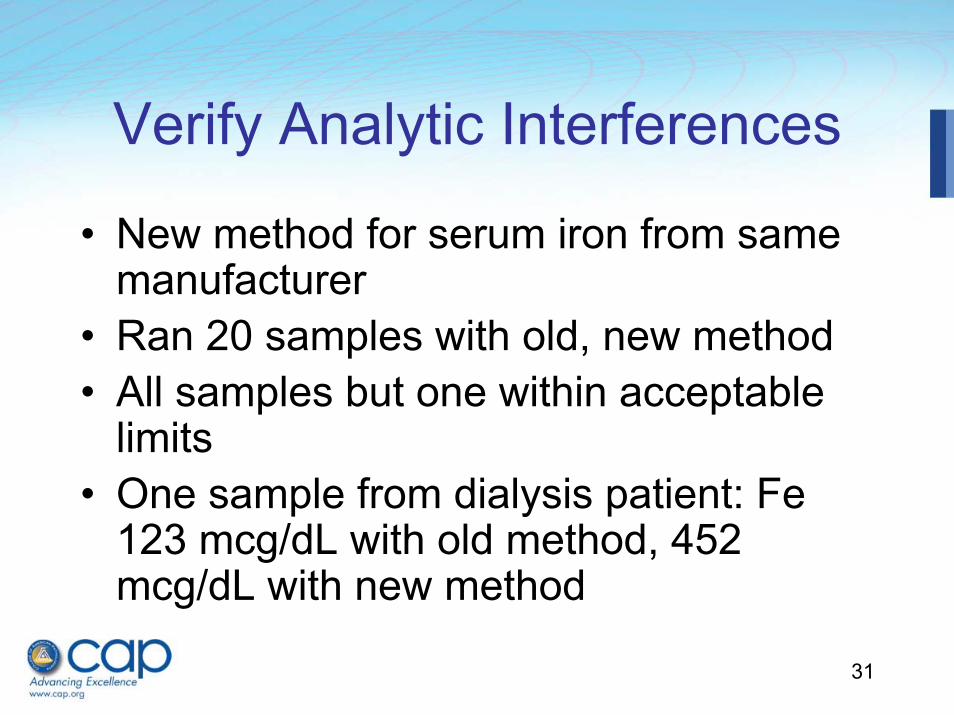
Verify Analytic Interferences
• New method for serum iron from same manufacturer
• Ran 20 samples with old, new method• All samples but one within acceptable
limits• One sample from dialysis patient: Fe
123 mcg/dL with old method, 452 mcg/dL with new method
32
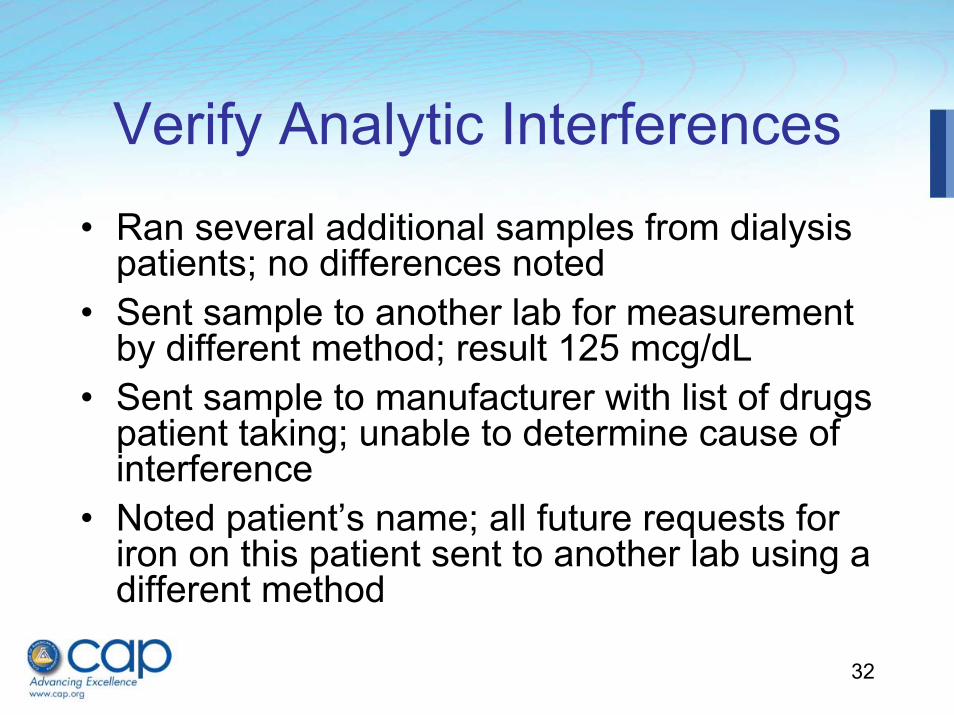
Verify Analytic Interferences• Ran several additional samples from dialysis
patients; no differences noted• Sent sample to another lab for measurement
by different method; result 125 mcg/dL• Sent sample to manufacturer with list of drugs
patient taking; unable to determine cause of interference
• Noted patient’s name; all future requests for iron on this patient sent to another lab using a different method
33
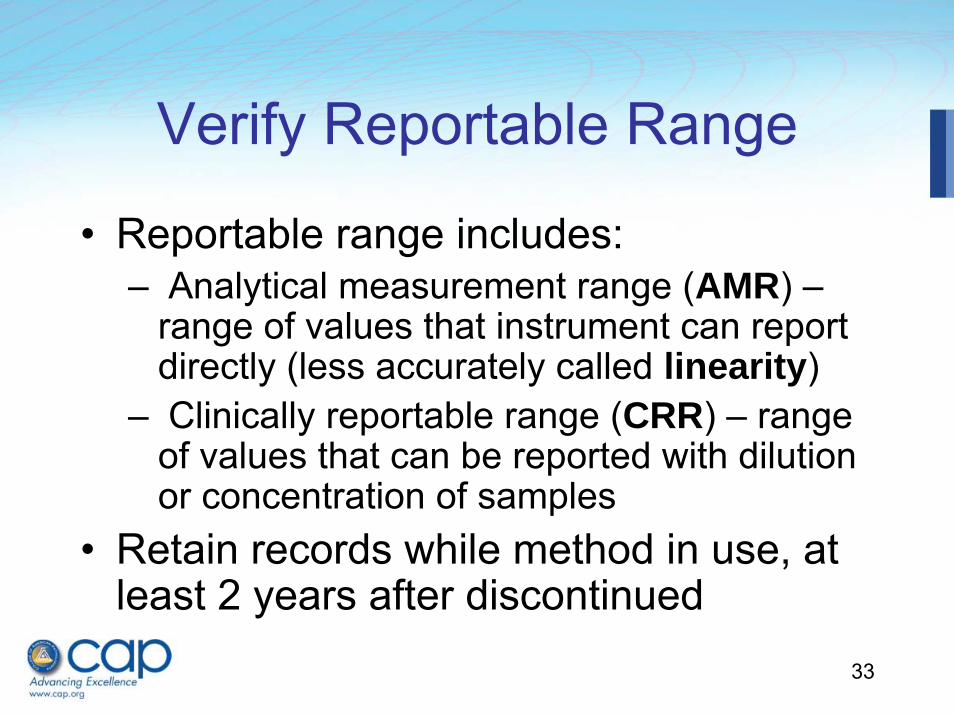
Verify Reportable Range
• Reportable range includes:– Analytical measurement range (AMR) –
range of values that instrument can report directly (less accurately called linearity)
– Clinically reportable range (CRR) – range of values that can be reported with dilution or concentration of samples
• Retain records while method in use, at least 2 years after discontinued
34
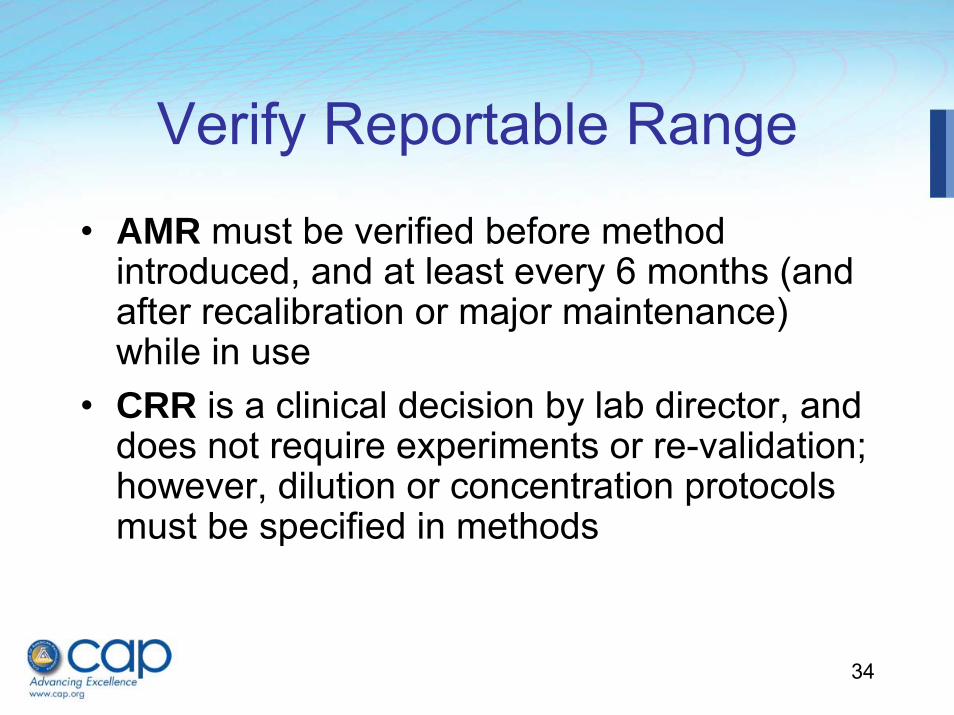
Verify Reportable Range
• AMR must be verified before method introduced, and at least every 6 months (and after recalibration or major maintenance) while in use
• CRR is a clinical decision by lab director, and does not require experiments or re-validation; however, dilution or concentration protocols must be specified in methods
35
AMR Verification
• Must include three levels (low, midpoint, high)
• Can use commercial linearity materials, PT or patient samples with known results, standards or calibrators
• Can also be done by calibration verification if three samples that span measurement range used
36
AMR Verification• Lab must specify criteria for
acceptability (can be as absolute values or percent differences); should be specific for each method, based on clinical criteria, as discussed earlier
• More formal protocols for linearity evaluation are found in CLSI EP6-A, but are not required
37
Practical Example• If no commercial material available, will
need to create own materials• Select high, low sample; can mix to create
mid-point sample• If high above measurement limit, do
dilution with low sample to create level near limit
• If stable, can aliquot, freeze for future use
38
Reference Limits
• Not required for laboratory to establish its own reference limits, but must verify that limits it uses are appropriate for patient population served
• Should review how any published limits were established before considering whether to try to adopt them
39
Adopted Reference Limits
• Manufacturer suggested• Reference laboratory• Published articles• Neighboring laboratory• Previous reference limits in own lab
40
Reference Limits
• Validation protocol outlined in CLSI C28-A2
• Select 20 representative healthy individuals and do test; if ≤ 2 outside proposed limits, validated
• If > 2 outside, can repeat with another 20, and accept if ≤ 2 outside (not worth repeat if > 5 outside proposed limits)
41
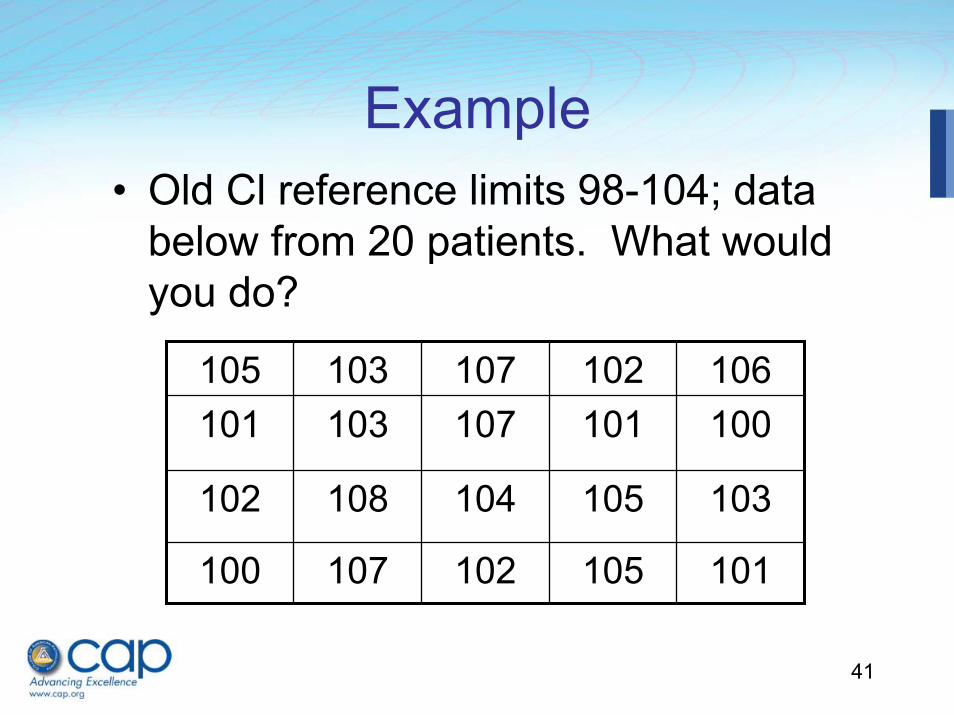
105 103 107 102 106101 103 107 101 100
102 108 104 105 103
100 107 102 105 101
Example• Old Cl reference limits 98-104; data
below from 20 patients. What would you do?
42
Reference Limits
• If not validated, will need to establish own reference limits
• Briefly, need 120 individuals (200 if does not follow gaussian distribution) to be confident in accuracy
• Need to have criteria for exclusion (may differ for certain tests)
43
Summary
• While many steps are involved in method validation, not all have to be performed by the laboratory
• Lab must verify accuracy, precision, AMR, CRR, and reference intervals before methods are adopted (and must be signed by lab director)
44
Summary
• Simple protocols are provided to perform these steps, but more formal procedures are available in CLSI documents
• Most critical step is having good criteria established for what is acceptable, based on patient care needs
45
Resources
• CAP Laboratory General Checklist• CLSI EP5-A2: Evaluation of Precision
Performance of Quantitative Measurement Methods (2004)
• CLSI EP6-A: Evaluation of the Linearity of Quantitative Measurement Procedures: A Statistical Approach (2003)
46
Resources
• CLSI EP9-A2: Method Comparison and Bias Estimation Using Patient Samples (2002)
• CLSI EP10-A3: Preliminary Evaluation of Quantitative Clinical Laboratory Measurement Procedures (2006)
47
Resources• CLSI EP15-A2: User Verification of
Performance for Precision and Trueness (2005)
• CLSI EP17-A: Protocols for Determination of Limits of Detection and Limits of Quantitation (2004)
• CLSI C28-A2: How to Define and Determine Reference Intervals in the Clinical Laboratory (2000)
49
Questions?
50
Past Audioconferences• Missed part/all of an audioconference?• Want to hear it again?• Want to tell a co-worker?• Virtual Library of Past Audioconferences
– Available 24/7 on www.cap.org 4 weeks post session (see Attachment A for steps on how to access post audioconferences).
– Laboratory Improvement and Accreditation tab– Preparing to Inspect
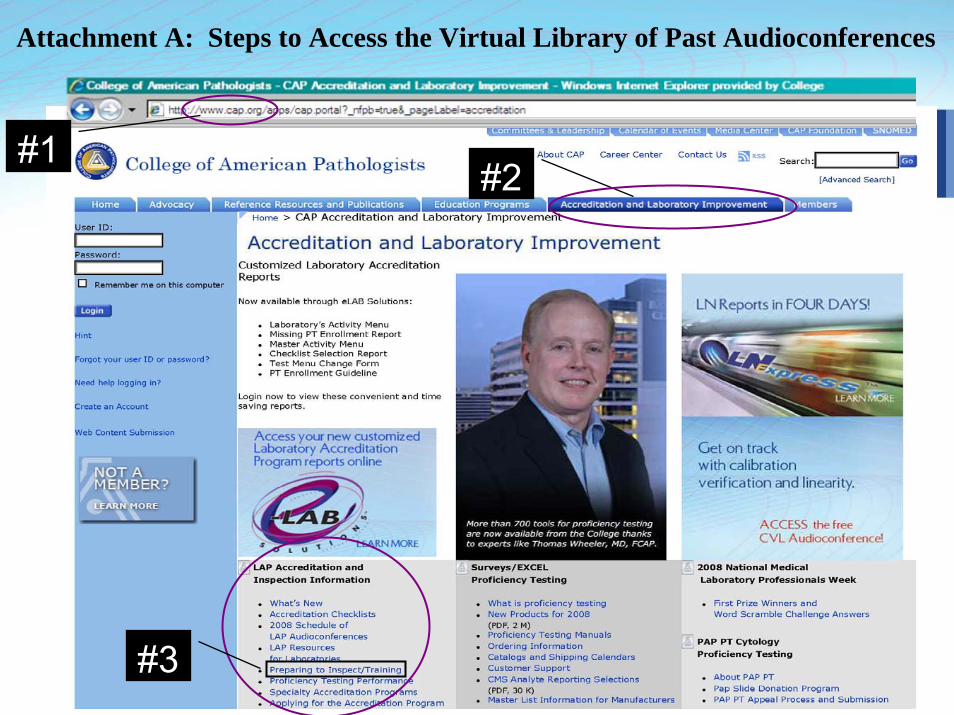
51#3
#2#1
Attachment A: Steps to Access the Virtual Library of Past Audioconferences