Embed Size (px)
Citation preview
TECHNICAL REPORT DOCUMENTATION PAGE
I. Report Number 2. Government Accession No. 3. Recipient's Catalog No.
FHWA/TX-94/1332-1 4. Title and Subtitle 5. Report Uate
December 1993 LABORATORY EVALUATION OF CRUMB-RUBBER MODIFIED (CRM) BINDERS AND MIXTURES 6. Performing Organization Code
7. Author(s) 8. Perfonmng Organization Report No.
Cindy K. Estakhri, Sekhar Rebala, and Dallas Little
9. Performing Organization Name and Address
Texas Transportation Institute The Texas A&M University System Colleqe Station, Texas 77843-3135
12. Sponsoring Agency Name and Address
Texas Department of Transportation Research and Technology Transfer Office P. 0. Box 5080 Austin, Texas 78763-5080
15. Supplementary Notes
Research Report 1332-1 10. Work Unit No.
11. Contract or Grant No.
Study No. 0-1332 13. Type of Report and Period Covered
Interim: September 1992 - October 1993 14. Sponsoring Agency (',ode
Research performed in cooperation with the Texas Department of Transportation and the U.S. Department of Transportation, Federal Highway Administration.
Research Study Title: Short-Term Guidelines to Improve Asphalt-Rubber Pavements 16. Abstract
CRM binders were fabricated in the laboratory and evaluated according to ten different binder tests. Some of the test procedures routinely used for CRM binders were determined to have no apparent relationship to mixture properties or field performance. The SHRP binder tests were also used to characterize CRM binders. The SHRP direct tension test and, to a lesser degree, the force-ductility test appear to measure CRM binder characteristics, which are attributed to improved cracking performance in CRM mixtures.
Nine CRM mixtures were evaluated using AAMAS characterization procedures: four wetprocess mixtures, four dry-process mixtures, and one control mix. It was determined that CRM has the potential to significantly improve the fatigue and thermal cracking performance of asphalt concrete pavements, but only when the wet method is used and the binder is properly designed. The dry process should produce mixtures with reduced propensity for rutting, but may have an adverse effect on cracking.
Although state DOTs must comply with the existing legislative requirements, tire rubber, as any additive, should be used whenever possible to address a given mixture deficiency or expected deficiency in a given situation.
17. Key Words
Crumb Rubber Modifier, CRM, Recycled Tire Rubber, Asphalt Rubber, Modified Binders, Modified Asphalt Concrete
18. Distribution Statement
No restrictions. This document is available to the public through NTIS: National Technical Information Service 5285 Port Royal Road Springfield, Virginia 22161.
19. Security ClassiL(or this n:port) 20. Security Classif.(0£ this page) 21. No. or I ages 22. !'nee
Unclassified Unclassified 270
.Form Out I' 1700.7 (8·72)

LABORATORY EVALUATION OF CRUMB-RUBBER MODIFIED (CRM) BINDERS AND MIXTURES
by
Cindy K. Estakhri, P.E. Assistant Research Engineer
Texas Transportation Institute
Sekhar Rebala Graduate Research Assistant
Texas Transportation Institute
and
Dallas N. Little, P.E. Research Engineer
Texas Transportation Institute
Research Report 1332-1 Research Study Number 0-1332
Research Study Title: Short-Term Guidelines to Improve Asphalt-Rubber Pavements
Sponsored by the Texas Department of Transportation
In Cooperation with U.S. Department of Transportation
Federal Highway Administration
December 1993
TEXAS TRANSPORT A TI ON INSTITUTE The Texas A&M University System College Station, Texas 77843-3135

IMPLEMENTATION STATEMENT
The goal of this study is to provide short-term guidelines to improve the performance
of hot mix asphalt pavements which have been modified with crumb rubber. This report
documents partial completion of this goal. Mixture design procedures, test procedures, and
material properties of CRM binders and mixtures have been evaluated.
The findings of this study indicate that crumb rubber can be incorporated into hot
mix asphalt concrete without having a detrimental effect on pavement performance (when
the mixture is designed and placed properly). The findings also indicate that crumb-rubber
modified binders may be designed to produce asphalt mixtures that inhibit cracking.
Implementation of these research results will aid the Texas Department of
Transportation, as well as other state DOTs, in meeting the requirements of the lntermodal
Surface Transportation Efficiency Act of 1991 (ISTEA). ISTEA provides for a minimum
utilization requirement for asphalt pavement containing crumb rubber modifier as a
percentage of the total tons of asphalt laid in such state.
Further recommendations regarding guidelines and specifications will be provided in
this study's subsequent research report: 1332-2F.
v

DISCIAIMER
The contents of this report reflect the views of the authors who are responsible for
the facts and the accuracy of the data presented herein. The contents do not necessarily
reflect the official view or policies of the Texas Department of Transportation (TxDOT),
or the Federal Highway Administration (FHWA). This report does not constitute a
standard, specification, or regulation, nor is it intended for construction, bidding, or permit
purposes.
vii

TABLE OF CONTENTS
Page List of Figures ...................................................... x1
List of Tables . . . . . . . . . . . . . . . . . . . . . . . . . . . . . . . . . . . . . . . . . . . . . . . . . . . . . xvii
Summary . . . . . . . . . . . . . . . . . . . . . . . . . . . . . . . . . . . . . . . . . . . . . . . . . . . . . . . xxvn
Chapter 1 Summary and Conclusions . . . . . . . . . . . . . . . . . . . . . . . . . . . . . . . . . . . . . 1
Chapter 2 Laboratory Evaluation of Binders ............................... 7
2.1 Penetration ............................................... 10 2.2 Ring and Ball Softening Point . . . . . . . . . . . . . . . . . . . . . . . . . . . . . . . . . 12 2.3 Ductility . . . . . . . . . . . . . . . . . . . . . . . . . . . . . . . . . . . . . . . . . . . . . . . . . 13 2.4 Force Ductility ............................................ 17 2.5 Brookfield Viscosity ........................................ 21 2.6 Elastic Recovery ........................................... 23 2.7 Resiliency . . . . . . . . . . . . . . . . . . . . . . . . . . . . . . . . . . . . . . . . . . . . . . . . 23 2.8 SHRP Binder Specification and Binder Tests ...................... 25
Chapter 3 Mixture Design . . . . . . . . . . . . . . . . . . . . . . . . . . . . . . . . . . . . . . . . . . . . 35
3.1 Selection of Materials . . . . . . . . . . . . . . . . . . . . . . . . . . . . . . . . . . . . . . . 36 3.2 Mixture Design for Dense-Graded Mixtures . . . . . . . . . . . . . . . . . . . . . . . 37 3.3 Tex 232-F Mix Design for CMHB CRM Mixtures .................. 43
Chapter 4 Mixture Performance Evaluation . . . . . . . . . . . . . . . . . . . . . . . . . . . . . . . 49
4.1 Rutting .................................................. 49 4.2 Fatigue Cracking . . . . . . . . . . . . . . . . . . . . . . . . . . . . . . . . . . . . . . . . . . . 79 4.3 Moisture Damage . . . . . . . . . . . . . . . . . . . . . . . . . . . . . . . . . . . . . . . . . . 88 4.4 Thermal Cracking .......................................... 91 4.5 Disintegration . . . . . . . . . . . . . . . . . . . . . . . . . . . . . . . . . . . . . . . . . . . . . 93 4.6 Summary of Mixture Evaluation ............................... 96
References . . . . . . . . . . . . . . . . . . . . . . . . . . . . . . . . . . . . . . . . . . . . . . . . . . . . . . . 101
Appendix A Laboratory Data for Control Mixture (Conventional Type D Mix, No Ruhher) . . . . . . . . . . . . . . . . . . . . . . . . . . . . . . . . . 103
ix
TABLE OF CONTENTS (continued)
Page
Appendix B Laboratory Data for DGF Mixture (Dense-Graded, Type D Mixture with Fine Rubber) . . . . . . . . . . . . . . . . . . . . . . . . 115
Appendix C Laboratory Data for DGC Mixture (Dense-Graded, Type D Mixture with Coarse Rubber) . . . . . . . . . . . . . . . . . . . . . . 133
Appendix D Laboratory Data for 10%FW Mixture (10% Fine Rubber, by Weight of Asphalt, via Wet Method) . . . . . . . . . . . . . . . . . . 153
Appendix E Laboratory Data for 18%FW Mixture (18% Fine Rubber, by Weight of Asphalt, via Wet Method) . . . . . . . . . . . . . . . . . . 167
Appendix F Laboratory Data for 10%CW Mixture (10% Coarse Rubber, by Weight of Asphalt, via Wet Method) ................ 177
Appendix G Laboratory Data for 18%CW Mixture (18% Coarse Rubber, by Weight of Asphalt, via Wet Method) . . . . . . . . . . . . . . . . 195
Appendix H Laboratory Data for l8%CD Mixture ( 18% Coarse Rubber, by Weight of Asphalt, via Dry Method) ................ 209
Appendix I Laboratory Data for 18%FD Mixture (18% Fine Rubber, by Weight of Asphalt, via Dry Method) 221
Appendix J Description of AAMAS and Preparation Samples for Testing . . . . . . . 233
x
LIST OF FIGURES
Page
Figure 2. L Penetration at 77°F (25°C), 100 g, 5 sec. for Control and
CRM Binders . . . . . . . . . . . . . . . . . . . . . . . . . . . . . . . . . . . . . . . . . . . 11
Figure 2.2. Penetration at 39.2°F (4°C), 200 g, 5 sec. for Control and
Figure 2.3.
Figure 2.4.
Figure 2.5.
Figure 2.6.
CRM Binders . . . . . . . . . . . . . . . . . . . . . . . . . . . . . . . . . . . . . . . . . . . 11
Ring and Ball Softening Point of Control and CRM Binders . . . . . . . . 12
Ductility at 77°F (25°C) of Control Asphalt Cement and Asphalt
Cement Modified with Different Concentrations of Fine and
Coarse CRM . . . . . . . . . . . . . . . . . . . . . . . . . . . . . . . . . . . . . . . . . . . 15
Ductility of CRM Binders as Compared with Other Modified Binders 16
Ductility at 39.2°F (4°C) of CRM Binders Modified with Different
Concentrations of Fine and Coarse CRM . . . . . . . . . . . . . . . . . . . . . . 16
Figure 2.7. Ductility Retention of CRM Binders Modified with Different
Concentrations of Fine and Coarse CRM ...................... 17
Figure 2.8. Maximum Stress in the Force Ductility Test for CRM Binders . . . . . . 19
Figure 2.9. Maximum Strain at Failure in the Force Ductility Test for
CRM Binders ........................................... 19
Figure 2.10 Area Under the Stress-Strain Curve in the Force Ductility Test
for CRM Binders (Total Energy Required to Cause Sample Failure) 20
Figure 2.11. Brookfield Viscosity for a CRM Binder (-#80 Mesh CRM at 18 Percent)
Tested According to Two Different Protocols ................... 21
Figure 2.12. Brookfield Viscosity for Asphalt and CRM Binders of Different
Particle Sizes at 175°C Measured According to TII Protocol ....... 22
Figure 2. 13. Resiliency for Control and CRM Binders . . . . . . . . . . . . . . . . . . . . . . 25
Figure 2.14. Bending Beam Rheometer Stiffness Data for Control and CRM
Binders Before and After PAV Aging . . . . . . . . . . . . . . . . . . . . . . . . 30
XI
LIST OF FIGURES (continued)
Page
Figure 2.15. Direct Tension Test Results for Control and CRM Binders After
Figure 3.1.
Figure 3.2.
Figure 3.3.
Figure 3.4.
Figure 3.5.
Figure 3.6.
Figure 3.7.
Figure 4.1.
Figure 4.2.
Figure 4.3.
Figure 4.4.
Figure 4.5.
Figure 4.6.
Figure 4.7.
Figure 4.8.
Figure 4.9.
Figure 4.10.
PAV Aging (Tests Performed at 5°F (-l5°C) ................... 32
Tex-C-14 Mix Design for Type D Control Mix .................. 38
Tex C-14 Mix Design for Dense-Graded Mix with 0.8% Fine Rubber
by Weight of the Aggregate ................................ 40
Tex-C-14 Mix Design for Dense-Graded Mix with 0.8% Coarse Rubber
by Weight of the Aggregate ................................ 40
Mix Design for Dense-Graded Mix with 0.5% Fine Rubber by Weight
of the Aggregate . . . . . . . . . . . . . . . . . . . . . . . . . . . . . . . . . . . . . . . . 41
Mix Design for Dense-Graded Mix with 0.5% Coarse Rubber by Weight
of the Aggregate . . . . . . . . . . . . . . . . . . . . . . . . . . . . . . . . . . . . . . . . 41
Flow Chart for TxDOT CRM Mix Design, Tex-232-F . . . . . . . . . . . . . 44
Volume of +#10 Size Fraction for All Nine Mixes ............... 47
Control and CRM Mixtures - AAMAS Chart for Asphaltic
Concrete Mixture Rutting Potential for Surface
Layers of Asphaltic Concrete Pavements ....................... 51
Influence of Creep Stress Intensity On Creep Rate ............... 50
Stages of Creep . . . . . . . . . . . . . . . . . . . . . . . . . . . . . . . . . . . . . . . . . 53
Static Creep Deformation Versus Time of Loading for
Type D, Control Mix . . . . . . . . . . . . . . . . . . . . . . . . . . . . . . . . . . . . . 55
Static Creep Deformation Versus Time of Loading for DGF Mix 56
Static Creep Deformation Versus Time of Loading for DGC Mix 57
Static Creep Deformation Versus Time of Loading for 10%FW Mix .. 58
Static Creep Deformation Versus Time of Loading for 10%CW Mix 59
Static Creep Deformation Versus Time of Loading for 18%FW Mix 60
Static Creep Deformation Versus Time of Loading for 18%CW Mix .. 61
XII
Figure 4.11.
Figure 4.12.
LIST OF FIGURES (continued)
Page
Static Creep Deformation Versus Time of Loading for 18%FD Mix 62
Static Creep Deformation Versus Time of Loading for 18%CD Mix 63
Figure 4.13. Repeated Load and Static Creep Strain Versus Time of Loading
for Type D, Control Mix . . . . . . . . . . . . . . . . . . . . . . . . . . . . . . . . . . . 68
Figure 4.14. Repeated Load and Static Creep Strain Versus Time of Loading
for DGF Mix . . . . . . . . . . . . . . . . . . . . . . . . . . . . . . . . . . . . . . . . . . . 69
Figure 4.15. Repeated Load and Static Creep Strain Versus Time of Loading
for DGC Mix . . . . . . . . . . . . . . . . . . . . . . . . . . . . . . . . . . . . . . . . . . . 70
Figure 4.16. Repeated Load and Static Creep Strain Versus Time of Loading
for 10%FW Mix . . . . . . . . . . . . . . . . . . . . . . . . . . . . . . . . . . . . . . . . . 71
Figure 4.17. Repeated Load and Static Creep Strain Versus Time of Loading
for 10%CW Mix . . . . . . . . . . . . . . . . . . . . . . . . . . . . . . . . . . . . . . . . . 72
Figure 4.18. Repeated Load and Static Creep Strain Versus Time of Loading
for 18%FW Mix ......................................... 73
Figure 4.19. Repeated Load am.I Static Creep Strain Versus Time of Loading
for 18%CW Mix ......................................... 74
Figure 4.20. Repeated Load and Static Creep Strain Versus Time of Loading
for 18o/oFD Mix ......................................... 75
Figure 4.21. Repeated Load and Static Creep Strain Versus Time of Loading
for 18%CD Mix . . . . . . . . . . . . . . . . . . . . . . . . . . . . . . . . . . . . . . . . . 76
Figure 4.22. Control and CRM Mixtures - AAMAS Chart for Indirect Tensile
Strains Versus Resilient Modulus ............................ 80
Figure 4.23. Indirect Tensile Strength and Strain at Failure at 41°F (S°C)
for Control and CRM Mixtures . . . . . . . . . . . . . . . . . . . . . . . . . . . . . 82
Figure 4.24. Indirect Tensile Strength and Strain at Failure at 77°F (25°C)
for Control and CRM Mixtures . . . . . . . . . . . . . . . . . . . . . . . . . . . . . . 84
Xlll
LIST OF FIGURES (continued)
Page
Figure 4.25. Indirect Tensile Strength and Strain at Failure at
104 °F ( 40°C) for Control and CRM Mixtures . . . . . . . . . . . . . . . . . . 85
Figure 4.26. Control and CRM Mixtures - AAMAS Chart for Resilient
Modulus Versus Temperature ............................... 87
Figure 4.27. Tensile Strength Ratio for Control and CRM Mixtures
at 77°F (25°C) .......................................... 89
Figure 4.28. Resilient Modulus Ratio for Control and CRM Mixtures
at 77°F (25°C) .......................................... 90
Appendix A Laboratory Data for Control Mix
Figure AL Control Mix, Type D . . . . . . . . . . . . . . . . . . . . . . . . . . . . . . . . . . . . 107
Appendix B Laboratory Data for DGF Mixture
Figure Bl. Type D Mix Design with 0.2% Fine CRM . . . . . . . . . . . . . . . . . . . . . 119
Figure B2. Type D Mix Design with 0.8% Fine CRM . . . . . . . . . . . . . . . . . . . . . 122
Figure B3. Type D Mix Design with 0.5% Fine CRM . . . . . . . . . . . . . . . . . . . . . 125
Appendix C Laboratory Data for DGC Mixture
Figure Cl. Type D Mix Design with 0.2% Coarse CRM . . . . . . . . . . . . . . . . . . . 137
Figure C2. Type D Mix Design with 0.8% Coarse CRM . . . . . . . . . . . . . . . . . . . 140
Figure C3. Type D Mix Design with 0.5% Coarse CRM . . . . . . . . . . . . . . . . . . . 143
Appendix D Laboratory Data for 10%FW Mixture
Figure DI. Density versus Volume of + # 10, 5% Binder and 10% CRM . . . . . . . 158
Figure D2. Density versus Volume of+ #10, 10% CRM ................... 159
XIV
LIST OF FIGURES (continued)
Page
Appendix E Laboratory Data for 18%FW Mixture
Figure El.
Figure E2.
Density versus Volume of + #10, 5% Binder and 18% CRM . . . . . . . 172
Density versus Volume of + #10, 18% CRM . . . . . . . . . . . . . . . . . . . 173
Appendix F Laboratory Data for 10%CW Mixture
Figure Fl.
Figure F2.
Density versus Volume of + #10, 5% Binder and 10% CRM . . . . . . . 186
Density versus Volume of + #10, 10% CRM . . . . . . . . . . . . . . . . . . . 187
Appendix G Laboratory Data for 18%CW Mixture
Figure Gl. Density versus Volume of +#10, 5% Binder and 18% CRM ....... 200
Figure 02. Density versus Volume of +#10, 18% CRM ................... 201
Appendix H Laboratory Data for 18%CD Mixture
Figure Hl. Density versus Volume of +#10 ............................ 212
Appendix I Laboratory Data for 18%FD Mixture
Figure 11. Density versus Volume of + #10 ............................ 224
xv

Table 2.1.
Table 2.2.
Table 2.3.
Table 2.4.
Table 2.5.
Table 2.6.
Table 2.7.
Table 3.1.
Table 4.1.
Table 4.2.
Table 4.3.
Table 4.4.
Table 4.5.
LIST OF TABLES
Page
Penetration Data for Control and CRM Binders . . . . . . . . . . . . . . . . . 10
Ductility of Binders Measured at 77°F (25°C) and 5 cm per minute . . 14
Ductility of Binders Measured at 39.2°F ( 4 °C) and 5 cm per minute . . 14
Summary of Force-Ductility Data at 39.2°F (4°C) and 5 cm per minute
for CRM Binders ........................................ 18
Resiliency Test Data for Control and CRM Binders at 77°F (25 °C) . . 24
Strategic Highway Research Program (SHRP) Binder Specification . . . 26
Properties of Control and CRM Binders as Measured with the
Bending Beam Rheometer Before and After PAV Aging (All
Tests Performed at -15°C) ................................. 30
Type D Mix with Varying Dry Rubber Contents ................. 42
Uniaxial Static Creep Data for Control and Crumb Rubber Mixtures 54
Uniaxial Repeated Load Creep Data for Control and Crumb
Rubber Mixtures . . . . . . . . . . . . . . . . . . . . . . . . . . . . . . . . . . . . . . . . 77
Ranking of Laboratory Mixtures Based on Total Strain at the
Test Perio<.l for Both Static and Repeated Load Creep Tests . . . . . . . . 78
Tensile Creep modulus (3,600 sec) and Indirect Tensile Strength
at 41°F (S°C) for Control and Crumb Rubber Modified Mixtures .... 93
Material Properties Used to Evaluate Disintegration Potential
of Control and Crumb Rubber Modified Mixtures ................ 95
Appendix A Laboratory Data for Control Mix
Table Al. Standard Texas Type D Gradation Blended with 10% Field Sand 105
Table A2. Summary of Mix Design Data .............................. 106
Table A3. Summary of the Static Creep Test Data for Control Mix . . . . . . . . . . 108
xvii
LIST OF TABLES (continued)
Table A4. AAMAS Test Results for Unconditioned Specimens at 41°F.
Page
109
Table AS. AAMAS Test Results for Unconditioned Specimens at 77°F . . . . . . . 109
Table A6. AAMAS Test Results for Unconditioned Specimens at 104 °F . . . . . . 110
Table A 7. AAMAS Test Results for Moisture Conditioned Specimens
Tested at 77°F . . . . . . . . . . . . . . . . . . . . . . . . . . . . . . . . . . . . . . . . . 110
Table A8. AAMAS Test Results for Environmental Aged/Hardened Specimens
Tested at 41 °F for Set 1 . . . . . . . . . . . . . . . . . . . . . . . . . . . . . . . . . . 111
Table A9. AAMAS Test Results for Environmental Aged/Hardened Specimens
Tested at 41°F for Set 2 .................................. 111
Table AlO. AAMAS Test Results for Traffic Densified Samples Tested at
104°FforSetl ........................................ 112
Table Al 1. AAMAS Test Results for Traffic Densified Samples Tested at
104 °F for Set 2 . . . . . . . . . . . . . . . . . . . . . . . . . . . . . . . . . . . . . . . . 112
Table A12. AAMAS Test Results for Traffic Densified Samples Tested at
104°FforSet3 ........................................ 113
Appendix B Laboratory Data for DGF Mixture
Table B 1. Standard Texas Type D Gradation Blended with 10% Field Sand
Table B2.
Table B3.
Table 84.
and 0.2% Fine CRM . . . . . . . . . . . . . . . . . . . . . . . . . . . . . . . . . . . . 117
Summary of Mix Design Data for 0.2% Fine CRM by Weight of
Aggregate ............................................ 118
Standard Texas Type D Gradation Blended with 10% Field Sand
and 0.8% Fine CRM . . . . . . . . . . . . . . . . . . . . . . . . . . . . . . . . . . . . 120
Summary of Mix Design Data for 0.8% Fine CRM by
Weight of Aggregate . . . . . . . . . . . . . . . . . . . . . . . . . . . . . . . . . . . . 121
xviii
Table BS.
Table B6.
Table B7.
Table BS.
Table B9.
Table BlO.
Table Bl 1.
Table B12.
Table Bl3.
Table B14.
Table BlS.
LIST OF TABLES (Continued)
Page
Standard Texas Type D Gradation Blended with 10% Field Sand and
0.5% Fine CRM . . . . . . . . . . . . . . . . . . . . . . . . . . . . . . . . . . . . . . . . 123
Summary of Mix Design Data for 0.5% Fine CRM by Weight of
Aggregate . . . . . . . . . . . . . . . . . . . . . . . . . . . . . . . . . . . . . . . . . . . . 124
Standard Texas Type D Gradation Blended with 10% Field Sand
and 0.7% Fine CRM . . . . . . . . . . . . . . . . . . . . . . . . . . . . . . . . . . . . 126
Summary of Mix Design Data for 0.7% Fine CRM by
Weight of Aggregate . . . . . . . . . . . . . . . . . . . . . . . . . . . . . . . . . . . . 127
Summary of Static Creep Test Data for Control Mix with Optimum
Fine CRM Content (0.5% by Weight of Aggregate) ............. 127
AAMAS Test Results for Unconditioned Specimens at 41°F. . . . . . . 109
AAMAS Test Results for Unconditioned Specimens at 77°F . . . . . . . 109
AAMAS Test Results for Unconditioned Specimens at 104°F ...... 110
AAMAS Test Results for Moisture Conditioned Specimens
Tested at 77°F . . . . . . . . . . . . . . . . . . . . . . . . . . . . . . . . . . . . . . . . . 110
AAMAS Test Results for Environmental Aged/Hardened Specimens
Testedat41°FforSetl .................................. 111
AAMAS Test Results for Environmental Aged/Hardened Specimens
Tested at 41°F for Set 2 . . . . . . . . . . . . . . . . . . . . . . . . . . . . . . . . . . 111
Table B16. AAMAS Test Results for Traffic Densified Samples Tested at
104 ° F for Set 1 . . . . . . . . . . . . . . . . . . . . . . . . . . . . . . . . . . . . . . . . 112
Table Bl7. AAMAS Test Results for Traffic Densified Samples Tested at
104°F for Set 2 . . . . . . . . . . . . . . . . . . . . . . . . . . . . . . . . . . . . . . . . 112
Table Bl8. AAMAS Test Results for Traffic Densified Samples Tested at
104°F for Set 3 ........................................ 113
XIX
LIST OF TABLES (Continued)
Page
Appendix C Laboratory Data for DGC Mixture
Table Cl. Standard Texas Type D Gradation Blended with 10% Field Sand
and 0.2% Coarse CRM . . . . . . . . . . . . . . . . . . . . . . . . . . . . . . . . . . . 135
Table C2. Summary of Mix Design Data for 0.2% Coarse CRM by Weight of
Aggregate . . . . . . . . . . . . . . . . . . . . . . . . . . . . . . . . . . . . . . . . . . . . 136
Table C3. Standard Texas Type D Gradation Blended with 10% Field Sand
and 0.8% Coarse CRM . . . . . . . . . . . . . . . . . . . . . . . . . . . . . . . . . . . 138
Table C4. Summary of Mix Design Data for 0.8% Coarse CRM by
Weight of Aggregate . . . . . . . . . . . . . . . . . . . . . . . . . . . . . . . . . . . . 139
Table CS. Standard Texas Type D Gradation Blended with 10% Field
Sand and 0.5% Coarse CRM . . . . . . . . . . . . . . . . . . . . . . . . . . . . . . 141
Table C6. Summary of Mix Design Data for 0.5% Coarse CRM by
Weight of Aggregate . . . . . . . . . . . . . . . . . . . . . . . . . . . . . . . . . . . . 142
Table C7. Standard Texas Type D Gradation Blended with 10% Field
Sand and 0.6% Coarse CRM . . . . . . . . . . . . . . . . . . . . . . . . . . . . . . 144
Table C8. Summary of Mix Design Data for 0.6% Coarse CRM by
Weight of Aggregate . . . . . . . . . . . . . . . . . . . . . . . . . . . . . . . . . . . . 144
Table C9. Standard Texas Type D Gradation Blended with 10%
Field Sand and 0.7% Coarse CRM . . . . . . . . . . . . . . . . . . . . . . . . . . 145
Table ClO. Summary of Mix Design Data for 0.7% Coarse CRM by
Weight of Aggregate . . . . . . . . . . . . . . . . . . . . . . . . . . . . . . . . . . . . 145
Table Cl 1. Summary of Static Creep Test Data for Control Mix with Optimum
Coarse CRM Content (0.5% by Weight of Aggregate) . . . . . . . . . . . . 146
Table Cl2. AAMAS Test Results for Unconditioned Specimens at 41°F. . . . . . . 147
Table C13. AAMAS Test Results for Unconditioned Specimens at 77°F . . . . . . . 147
xx
LIST OF TABLES (Continued)
Page
Table C14. AAMAS Test Results for Unconditioned Specimens at 104 °F . . . . . . 148
Table C15. AAMAS Test Results for Moisture Conditioned Specimens
Tested at 77°F . . . . . . . . . . . . . . . . . . . . . . . . . . . . . . . . . . . . . . . . . 148
Table C16. AAMAS Test Results for Environmental Aged/Hardened Specimens
Tested at 41°F for Set 1 . . . . . . . . . . . . . . . . . . . . . . . . . . . . . . . . . . 149
Table C17. AAMAS Test Results for Environmental Aged/Hardened Specimens
Tested at 41°F for Set 2 . . . . . . . . . . . . . . . . . . . . . . . . . . . . . . . . . . 149
Table Cl8. AAMAS Test Results for Traffic Densified Samples Tested at
104 °F for Set I . . . . . . . . . . . . . . . . . . . . . . . . . . . . . . . . . . . . . . . . 150
Table C19. AAMAS Test Results for Traffic Densified Samples Tested at
104 °F for Set 2 . . . . . . . . . . . . . . . . . . . . . . . . . . . . . . . . . . . . . . . . 150
Table C20. AAMAS Test Results for Traffic Densified Samples Tested at
104 °F for Set 3 . . . . . . . . . . . . . . . . . . . . . . . . . . . . . . . . . . . . . . . . 151
Appendix D Laboratory Data for 10%FW Mixture
Table DI. Gradation for Various Fractions of +#10 Size to -#10 Size ....... 155
Table D2. Summary of Densities of the Trial Batches Described in Table DI . . 157
Table D3.
Table D4.
Table D5.
Table D6.
Table D7.
Table D8.
Table D9.
Summary of Trials to Achieve 97% Density . . . . . . . . . . . . . . . . . . . 157
Final Gradation for Evaluation of Mixture Using AAMAS . . . . . . . . 160
Summary of Static Creep Test Data for 10% (Passing #80
Size Ruhher) . . . . . . . . . . . . . . . . . . . . . . . . . . . . . . . . . . . . . . . . . . 161
AAMAS Test Results for Unconditioned Specimens at 41°F. . . . . . . 162
AAMAS Test Results for Unconditioned Specimens at 77°F . . . . . . . 162
AAMAS Test Results for Unconditioned Specimens at 104 °F . . . . . . 163
AAMAS Test Results for Moisture Conditioned Specimens
Tested at 77°F . . . . . . . . . . . . . . . . . . . . . . . . . . . . . . . . . . . . . . . . . 163
XXI
LIST OF TABLES (Continued)
Page
Table DlO. AAMAS Test Results for Environmental Aged/Hardened Specimens
Tested at 41°F for Set 1 . . . . . . . . . . . . . . . . . . . . . . . . . . . . . . . . . . 164
Table Dl 1. AAMAS Test Results for Environmental Aged/Hardened Specimens
Tested at 41 °F for Set 2 . . . . . . . . . . . . . . . . . . . . . . . . . . . . . . . . . . 164
Table D12. AAMAS Test Results for Traffic Densified Samples Tested at
104 °F for Set 1 . . . . . . . . . . . . . . . . . . . . . . . . . . . . . . . . . . . . . . . . 165
Table D13. AAMAS Test Results for Traffic Densified Samples Tested at
104°F for Set 2 ........................................ 165
Table D14. AAMAS Test Results for Traffic Densified Samples Tested at
104°F for Set 3 ........................................ 166
Appendix E Laboratory Data for 18%FW Mixture
Table El. Gradation for Various Fractions of +#10 Size to -#10 Size ....... 169
Table E2. Summary of Densities of the Trial Batches Described in Table El . . 171
Table E3.
Table E4.
Table ES.
Table E6.
Table E7.
Table ES.
Table E9.
Table ElO.
Summary of Trials to Achieve 97% Density . . . . . . . . . . . . . . . . . . . 171
Final Gradation for Evaluation of Mixture Using AAMAS ........ 174
Summary of Static Creep Test Data for 18% (Passing #80
Size Rubber) . . . . . . . . . . . . . . . . . . . . . . . . . . . . . . . . . . . . . . . . . . 175
AAMAS Test Results for Unconditioned Specimens at 41°F ....... 176
AAMAS Test Results for Unconditioned Specimens at 77°F ....... 176
AAMAS Test Results for Unconditioned Specimens at 104 °F . . . . . . 177
AAMAS Test Results for Moisture Conditioned Specimens
Tested at 77°F . . . . . . . . . . . . . . . . . . . . . . . . . . . . . . . . . . . . . . . . . 177
AAMAS Test Resu Its for Environmental Aged/Hardened Specimens
Tested at 41°F for Set l .................................. 178
XXll
LIST OF TABLES (Continued)
Page
Table El 1. AAMAS Test Results for Environmental Aged/Hardened Specimens
Tested at 41°F for Set 2 . . . . . . . . . . . . . . . . . . . . . . . . . . . . . . . . . . 178
Table E12. AAMAS Test Results for Traffic Densified Samples Tested at
104 °F for Set 1 . . . . . . . . . . . . . . . . . . . . . . . . . . . . . . . . . . . . . . . . 179
Table E13. AAMAS Test Results for Traffic Densified Samples Tested at
104°FforSet2 ........................................ 179
Table E14. AAMAS Test Results for Traffic Densified Samples Tested at
104 °F for Set 3 . . . . . . . . . . . . . . . . . . . . . . . . . . . . . . . . . . . . . . . . 180
Appendix F Laboratory Data for 10%CW Mixture
Table Fl. Gradation for Various Fractions of + # 10 Size to -# 10 Size 183
Table F2.
Table F3.
Table F4.
Table FS.
Table F6.
Table F7.
Table F8.
Table F9.
Table FlO.
Table Fl 1.
Summary of Densities of the Trial Batches Described in Table Fl . . . 185
Summary of Trials to Achieve 97% Density . . . . . . . . . . . . . . . . . . . 185
Final Gradation for Evaluation of Mixture Using AAMAS . . . . . . . . 188
Summary of Static Creep Test Data for 18% (Passing #80
Size Rubber) . . . . . . . . . . . . . . . . . . . . . . . . . . . . . . . . . . . . . . . . . . 189
AAMAS Test Results for Unconditioned Specimens at 41 °F. . . . . . . 190
AAMAS Test Results for Unconditioned Specimens at 77°F . . . . . . . 190
AAMAS Test Results for Unconditioned Specimens at 104°F ...... 191
AAMAS Test Results for Moisture Conditioned Specimens
Tested at 77°F . . . . . . . . . . . . . . . . . . . . . . . . . . . . . . . . . . . . . . . . . 191
AAMAS Test Results for Environmental Aged/Hardened Specimens
Tested at 41°f for Set 1 . . . . . . . . . . . . . . . . . . . . . . . . . . . . . . . . . . 192
AAMAS Test Results for Environmental Aged/Hardened Specimens
Tested at 41 °F for Set 2 . . . . . . . . . . . . . . . . . . . . . . . . . . . . . . . . . . 192
XXlll
LIST OF TABLES (Continued)
Page
Table F12. AAMAS Test Results for Traffic Densified Samples Tested at
104 °F for Set 1 . . . . . . . . . . . . . . . . . . . . . . . . . . . . . . . . . . . . . . . . 193
Table F13. AAMAS Test Results for Traffic Densified Samples Tested at
104 °F for Set 2 . . . . . . . . . . . . . . . . . . . . . . . . . . . . . . . . . . . . . . . . 193
Table F14. AAMAS Test Results for Traffic Densified Samples Tested at
104°F for Set 3 . . . . . . . . . . . . . . . . . . . . . . . . . . . . . . . . . . . . . . . . 194
Appendix G Laboratory Data for 18%CW Mixture
Table Gl. Gradation for Various Fractions of +#10 Size to -#10 Size 197
Table G2.
Table G3.
Table G4.
Table GS.
Table G6.
Table G7.
Table G8.
Table G9.
Table GlO.
Table Gll.
Table G12.
Summary of Densities of the Trial Batches Described in Table G 1 . . 199
Summary of Trials to Achieve 97% Density . . . . . . . . . . . . . . . . . . . 199
Final Gradation for Evaluation of Mixture Using AAMAS ........ 202
Summary of Static Creep Test Data for 18% (Passing #10
Size Rubber) . . . . . . . . . . . . . . . . . . . . . . . . . . . . . . . . . . . . . . . . . . 203
AAMAS Test Results for Unconditioned Specimens at 41°F. . ..... 204
AAMAS Test Results for Unconditioned Specimens at 77°F . . . . . . . 204
AAMAS Test Results for Unconditioned Specimens at 104 °F ...... 205
AAMAS Test Results for Moisture Conditioned Specimens
Tested at 77°F . . . . . . . . . . . . . . . . . . . . . . . . . . . . . . . . . . . . . . . . . 205
AAMAS Test Results for Environmental Aged/Hardened Specimens
Tested at 41 °F for Set I . . . . . . . . . . . . . . . . . . . . . . . . . . . . . . . . . . 206
AAMAS Test Results for Environmental Aged/Hardened Specimens
Tested at 41°F for Set 2 .................................. 206
AAMAS Test Results for Traffic Densified Samples Tested at
104 °F for Set I . . . . . . . . . . . . . . . . . . . . . . . . . . . . . . . . . . . . . . . . 207
XXIV
LIST OF TABLES (Continued)
Page
Table G 13. AAMAS Test Results for Traffic Densified Samples Tested at
104°F for Set 2 ........................................ 207
Table Gl4. AAMAS Test Results for Traffic Densified Samples Tested at
104 °F for Set 3 ........................................ 208
Appendix H Laboratory Data for 18%CD Mixture
Table Hl. Summary of Trials to Achieve 97% Density ................... 211
Table H2. Final Gradation for Evaluation of Mixture Using AAMAS ........ 213
Table H3. Summary of Static Creep Test Data for 18% (Passing #10 Size) .... 214
Table H4. AAMAS Test Results for Unconditioned Specimens at 41°F. . ..... 215
Table H5. AAMAS Test Results for Unconditioned Specimens at 77°F ....... 215
Table H6. AAMAS Test Results for Unconditioned Specimens at 104°F ...... 216
Table H7. AAMAS Test Results for Moisture Conditioned Specimens
Tested at 77°F ......................................... 216
Table H8. AAMAS Test Results for Environmental Aged/Hardened Specimens
Tested at 41°F for Set 1 .................................. 217
Table H9. AAMAS Test Results for Environmental Aged/Hardened Specimens
Tested at 41°F for Set 2 .................................. 217
Table HlO. AAMAS Test Results for Traffic Densified Samples Tested at
104°F for Set 1 ........................................ 218
Table Hl 1. AAMAS Test Results for Traffic Densified Samples Tested at
104°FforSet2 ........................................ 218
Table Hl2. AAMAS Test Results for Traffic Densified Samples Tested at
104°FforSet3 ........................................ 219
xxv
LIST OF TABLES (Continued)
Page
Appendix I Laboratory Data for 18%FD Mixtures
Table 11. Summary of Trials to Achieve 97% Density ................... 223
Table 12. Final Gradation for Evaluation of Mixture Using AAMAS ........ 225
Table 13. Summary of Static Creep Test Data for 18% {Passing #80 Size) .... 226
Table 14. AAMAS Test Results for Unconditioned Specimens at 41°f. . . . . . . 227
Table 15. AAMAS Test Results for Unconditioned Specimens at 77°F ....... 227
Table 16. AAMAS Test Results for Unconditioned Specimens at 104 °F . . . . . . 228
Table 17. AAMAS Test Results for Moisture Conditioned Specimens
Tested at 77°F . . . . . . . . . . . . . . . . . . . . . . . . . . . . . . . . . . . . . . . . . 228
Table IS. AAMAS Test Results for Environmental Aged/Hardened Specimens
Tested at 41°F for Set 1 . . . . . . . . . . . . . . . . . . . . . . . . . . . • . . . . . . 229
Table 19. AAMAS Test Results for Environmental Aged/Hardened Specimens
Tested at 41°F for Set 2 . . . . . . . . . . . . . . . . . . . . . . . . . . . . . . . . . . 229
Table 110. AAMAS Test Results for Traffic Densified Samples Tested at
104 °F for Set 1 . . . . . . . . . . . . . . . . . . . . . . . . . . . . . . . . . . . . . . . . 230
Table 111. AAMAS Test Results for Traffic Densified Samples Tested at
104 °F for Set 2 . . . . . . . . . . . . . . . . . . . . . . . . . . . . . . . . . . . . . . . . 230
Table 112. AAMAS Test Results for Traffic Densified Samples Tested at
104 °F for Set 3 ........................................ 231
XXVJ
SUMMARY
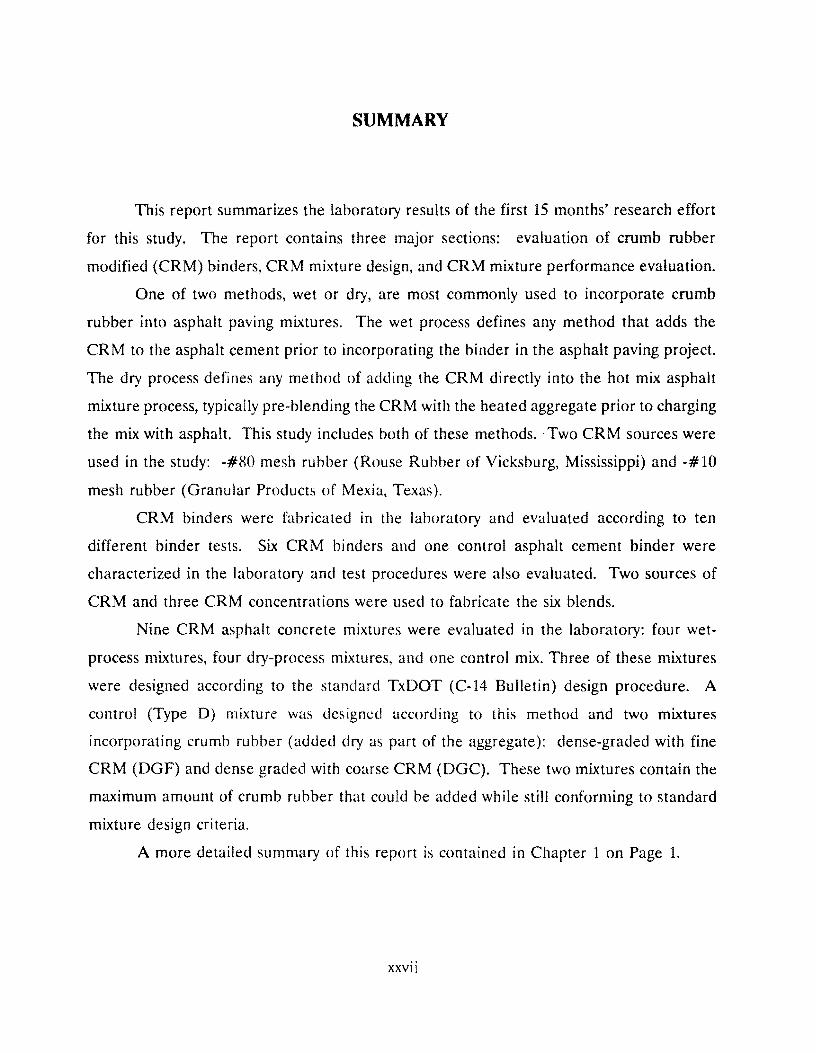
This report summarizes the laboratory results of the first 15 months' research effort
for this study. The report contains three major sections: evaluation of crumb rubber
modified (CRM) binders, CRM mixture design, and CRM mixture performance evaluation.
One of two methods, wet or dry, are most commonly used to incorporate crumb
rubber into asphalt paving mixtures. The wet process defines any method that adds the
CRM to the asphalt cement prior to incorporating the binder in the asphalt paving project.
The dry process defines any method of adding the CRM directly into the hot mix asphalt
mixture process, typically pre-blending the CRM with the heated aggregate prior to charging
the mix with asphalt. This study includes both of these methods. ·Two CRM sources were
used in the study: -#80 mesh rubber (Rouse Rubber of Vicksburg, Mississippi) and ·#10
mesh rubber (Granular Products of Mexia, Texas).
CRM binders were fabricated in the laboratory and evaluated according to ten
different binder tests. Six CRM hinders and one control asphalt cement binder were
characterized in the laboratory and test procedures were also evaluated. Two sources of
CRM and three CRM concentrations were used to fabricate the six blends.
Nine CRM asphalt concrete mixtures were evaluated in the laboratory: four wet·
process mixtures, four dry-process mixtures, and one control mix. Three of these mixtures
were designed according to the standard TxDOT (C-14 Bulletin) design procedure. A
control (Type D) mixture was designed according to this method and two mixtures
incorporating crumb rubber (added dry as part of the aggregate): dense-graded with fine
CRM (DGF) and dense graded with coarse CRM (DGC). These two mixtures contain the
maximum amount of crumb rubber that could he added while still conforming to standard
mixture design criteria.
A more detailed summary of this report is contained in Chapter 1 on Page 1.
xxvii

1
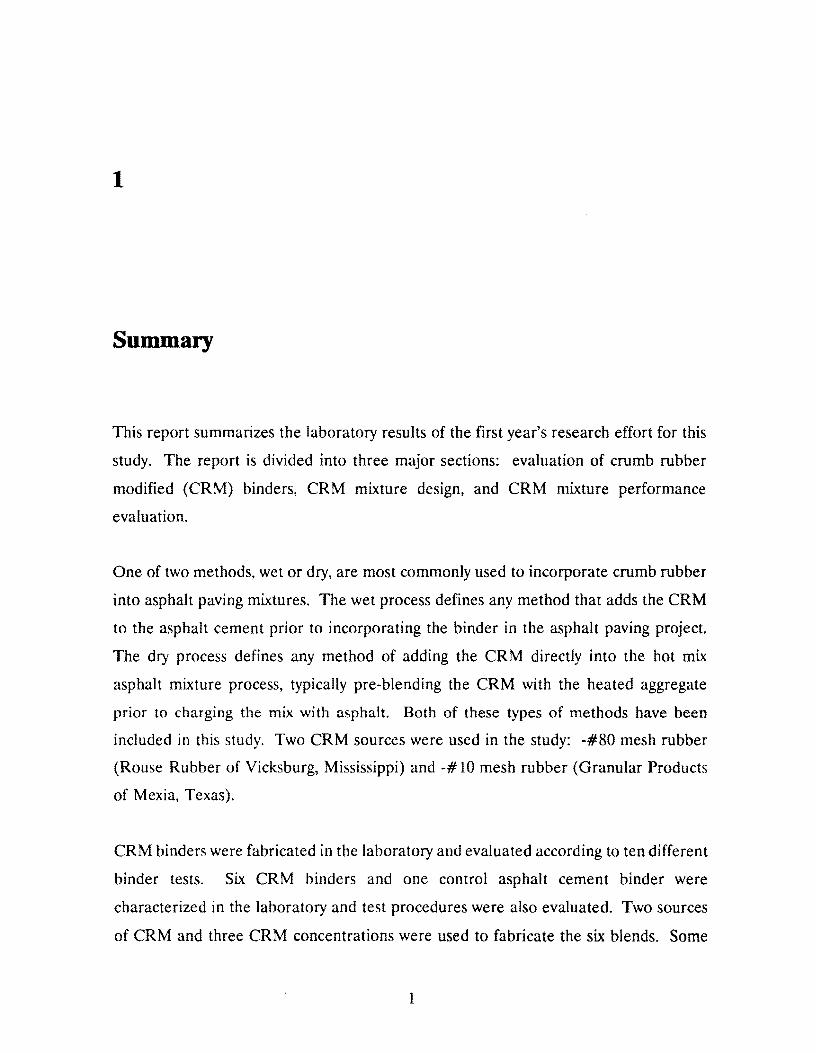
Summary
This report summarizes the laboratory results of the first year's research effort for this
study. The report is divided into three major sections: evaluation of crumb rubber
modified (CRM) binders, CRM mixture design, and CRM mixture performance
evaluation.
One of two methods, wet or dry, are most commonly used to incorporate crumb rubber
into asphalt paving mixtures. The wet process defines any method that adds the CRM
to the asphalt cement prior to incorporating the binder in the asphalt paving project.
The dry process defines any method of adding the CRM directly into the hot mix
asphalt mixture process, typically pre-blending the CRM with the heated aggregate
prior to charging the mix with asphalt. Both of these types of methods have been
included in this study. Two CRM sources were used in the study: -#80 mesh rubber
(Rouse Rubber of Vicksburg, Mississippi) and -# 10 mesh rubber (Granular Products
of Mexia, Texas).
CRM binders were fabricated in the laboratory and evaluated according to ten different
binder tests. Six CRM binders and one control asphalt cement binder were
characterized in the laboratory and test procedures were also evaluated. Two sources
of CRM and three CRM concentrations were used to fabricate the six blends. Some
1
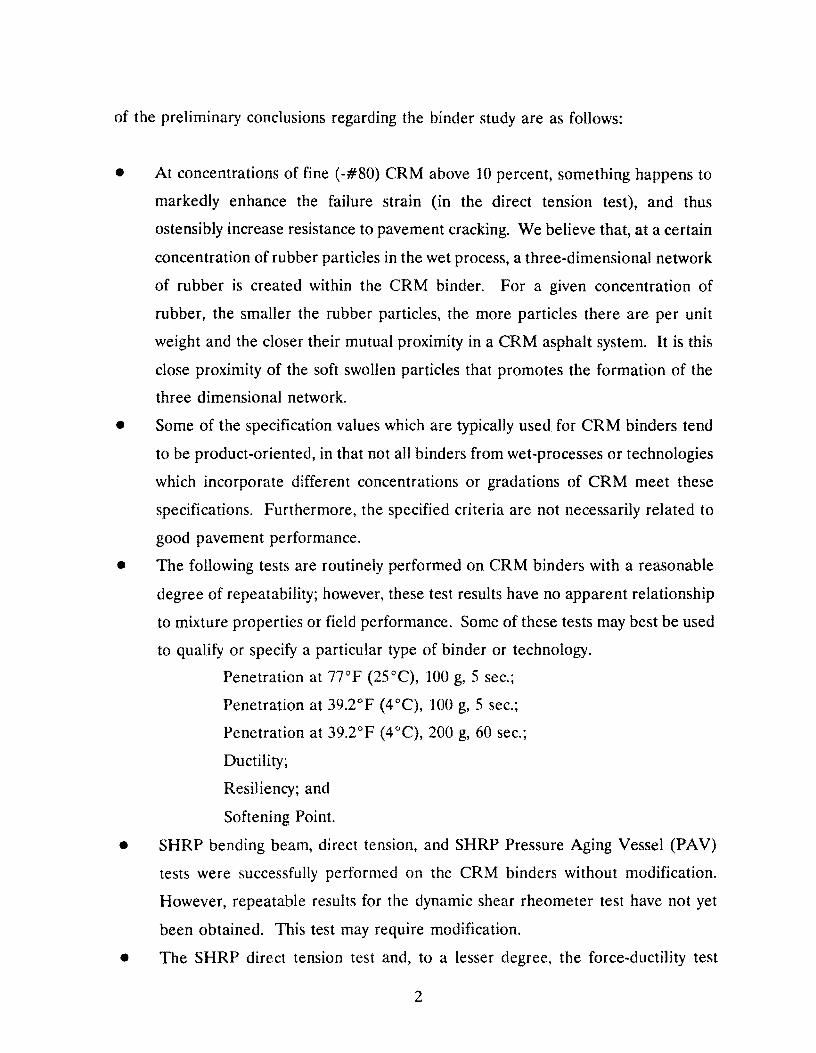
of the preliminary conclusions regarding the binder study are as follows:
• At concentrations of fine (-#80) CRM above 10 percent, something happens to
markedly enhance the failure strain (in the direct tension test), and thus
ostensibly increase resistance to pavement cracking. We believe that, at a certain
concentration of rubber particles in the wet process, a three-dimensional network
of rubber is created within the CRM binder. For a given concentration of
rubber, the smaller the rubber particles, the more particles there are per unit
weight and the closer their mutual proximity in a CRM asphalt system. It is this
close proximity of the soft swollen particles that promotes the formation of the
three dimensional network.
• Some of the specification values which are typically used. for CRM binders tend
to be product-oriented, in that not all binders from wet-processes or technologies
which incorporate different concentrations or gradations of CRM meet these
specifications. Furthermore, the specified criteria are not necessarily related to
good pavement performance.
• The following tests are routinely performed on CRM binders with a reasonable
degree of repeatability; however, these test results have no apparent relationship
to mixture properties or field performance. Some of these tests may best be used
to qualify or specify a particular type of binder or technology.
Penetration at 77°F (25°C), 100 g, 5 sec.;
Penetration at 39.2°F (4 °C), 100 g, 5 sec.;
Penetration at 39.2°F (4°C), 200 g, 60 sec.;
Ductility;
Resiliency; and
Softening Point.
• SHRP bending beam, direct tension, and SHRP Pressure Aging Vessel (PAV)
tests were successfully performed on the CRM binders without modification.
However, repeatable results for the dynamic shear rheometer test have not yet
been obtained. This test may require modification.
• The SHRP direct tension test and, to a lesser degree, the force-ductility test
2
appear to measure CRM binder characteristics which are attributed to improved
cracking performance in CRM mixtures.
• Viscosity of CRM binders may be measured with the Brookfield viscometer with
reliability; however, a strict adherence to a specified test protocol is required.
This test may also be used as a quality control test for monitoring CRM
concentration.
Nine CRM asphalt concrete mixtures were evaluated in the laboratory: four wet
process mixtures, four dry-process mixtures, and one control mix. Three of these
mixtures were designed according to the standard TxDOT (C-14 Bulletin) design
procedure. A control (Type D) mixture was designed according to this method and two
mixtures incorporating crumb rubber (added dry as part of the aggregate): dense
graded with fine CRM (DGF) and dense graded with coarse CRM (DGC). These two
mixtures contain the maximum amount of crumb rubber that could be added while still
conforming to standard mixture design criteria. The optimum amount of rubber which
could be incorporated in these dense-graded mixtures was about 0.5 percent by weight
of the aggregate. This would be equivalent to about 10 percent rubber by weight of
the asphalt.
Six of the mne mixtures evaluated in the laboratory were designed according to
TxDOTs recently developed mixture design procedure for asphalt-rubber mixtures.
These mixtures are gap-graded and similar in gradation to a stone matrbHype mixture.
These six different mixtures include both wet and dry processes for adding the crumb
rubber to the mix. Rubber concentration was varied, and for comparison purposes all
rubber concentrations are expressed as a percent by weight of the asphalt, whether a
dry or wet process was used. Another variable included here is the size of the rubber:
fine (-#80 mesh) or coarse (-# 10 mesh). These six mixtures are designated as follows:
• 10%FW (10% fine rubber, by weight of asphalt, via wet process),
• 10%CW (10% coarse rubber, by weight of asphalt, via wet process),
• 18%FW (18% fine rubber, by weight of asphalt, via wet process),
3
• 18%CW (18% coarse rubber, by weight of asphalt, via wet process),
• 18%FD (18% fine rubber, by weight of asphalt, via dry process), and
• 18%CD (18% coarse rubber, by weight of asphalt, via dry process).
Some of the preliminary conclusions regarding the mixture study are listed below.
• Field performance of dense-graded mixtures containing CRM has generally been
poor; however, the concentration of rubber in these mixtures has been at levels
of 18% (by weight of asphalt) or greater. Results from this laboratory study
indicate that acceptable performance may be obtained with CRM in dense
graded mixtures at lower concentrations of rubber (no more than 10% by weight
of asphalt). The dense-graded laboratory mixtures evaluated in this study
contained CRM added dry, as part of the aggregate.
• TxDOT's (volumetric) mixture design procedure for asphalt-rubber mixes
generally produces mixtures that can be considered very rut resistant. This
method can be used to incorporate rubber of any size or process (wet or dry).
It is particularly effective for larger concentrations of rubber (10% or more, by
weight of asphalt).
• CRM can be incorporated into hot-mix asphalt concrete in any way (dry or wet,
coarse or fine) without having a detrimental effect on rutting performance as long
as the mixture is designed properly.
• CRM has the potential to significantly improve the fatigue and thermal cracking
performance of asphalt concrete pavements, but only when the wet method is
used and the binder is properly designed. A significant improvement in fatigue
and thermal cracking characteristics was observed with one particular mixture:
18%FW. This data is also strongly supported by some of the binder properties
for this blend, in particular, the direct tension test on the binder at 14°F (-l0°C).
It is believed that this improved performance is related to the concentration and
distribution of the rubber particles in the binder. It is expected that the optimum
concentration of rubber particles occurs at a lower level for the fine rubber than
4
for the coarser rubber. This improved performance may be observed with the
coarser CRM but would occur at a concentration level higher than 18% which
was the maximum level evaluated thus far in this study.
The wet process should produce asphalt mixtures (if properly designed) that inhibit
cracking and may inhibit rutting. The dry process, on the other hand, should produce
mixtures with reduced propensity for rutting but may have adverse effects on cracking.
In the dry process, the rubber exists as discrete particles. Discrete particles in asphalt
will normally intensify the propensity for cracking but may enhance rutting resistance.
Although state DOTs must comply with the existing legislative requirements, tire
rubber, as any additive, should be used, whenever possible, to address a given mixture
deficiency or expected deficiency in a given situation. That is, if a mixture normally
performs satisfactorily, additional funds should not be expended on unnecessary
additives. When polymer additives, including tire rubber, are used to reduce cracking,
they should be blended with asphalts softer than the usual grade. On the contrary,
when these materials are used to reduce rutting, they should most likely be used to
stiffen the asphalt grade that normally produces the rutting mix.
5

2
Laboratory Evaluation of Binders
The objectives of the binder laboratory study were: (1) to prepare crumb rubber
modified binders for use in the mixture study; (2) to characterize these crumb rubber
modified binders; (3) to determine what test procedures are appropriate for CRM
binders (in particular as related to mixture properties); and ( 4) to develop test protocol.
Final recommendations regarding all of these objectives will be made in the final
report; however, this chapter discusses preliminary analyses.
Binders were fabricated in the laboratory using a torque-fork mixer. A laboratory
mixer of this type was first used for crumb rubber binder blending in 1977 (Pavlovich
et al. 1979). The system consists of a constant speed motor with stirrer assembly which
is capable of recording torque changes as load varies on the stirrer. The resulting
apparatus is a rotational viscometer which can measure relative changes in fluid
viscosity during mixing. Also, this device uses a mixing propeller for agitation and is
primarily intended to be a mixer.
Two sources of CRM and three CRM concentrations were used to fabricate CRM
7
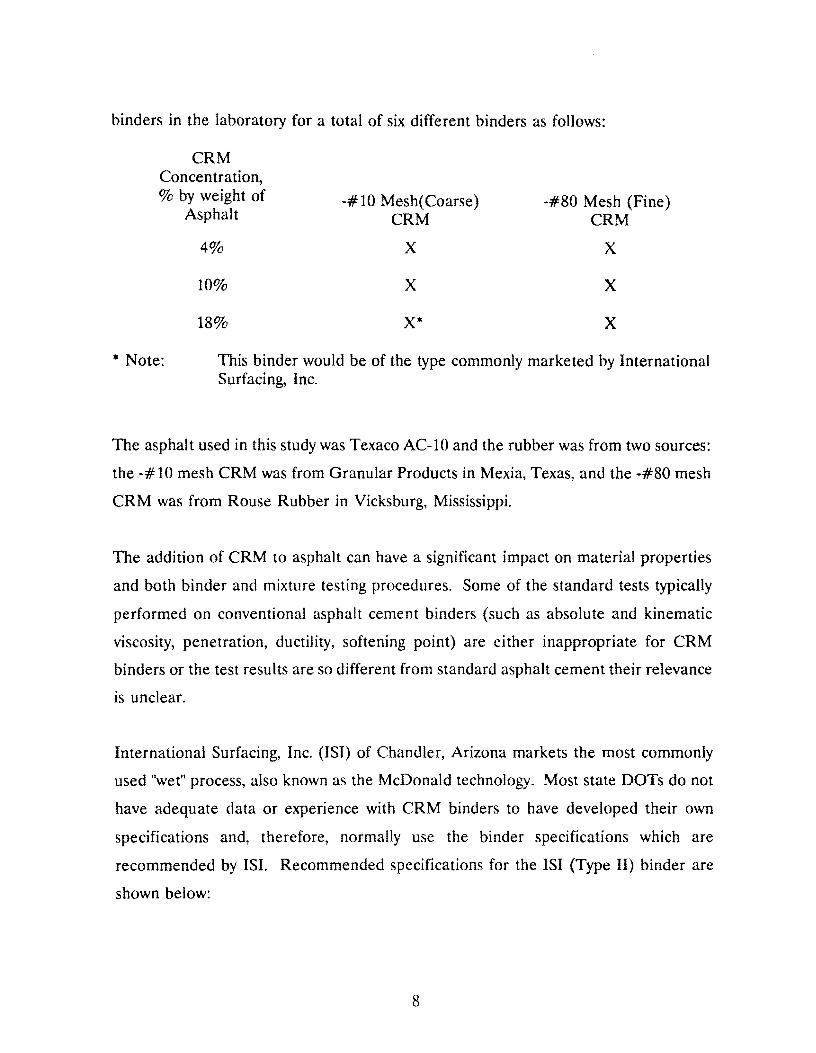
binders in the laboratory for a total of six different binders as follows:
CRM Concentration, % by weight of -#10 Mesh(Coarse) -#80 Mesh (Fine)
Asphalt CRM CRM
4% x x
10% x x
18% X* x
* Note: This binder would be of the type commonly marketed by International Surfacing, Inc.
The asphalt used in this study was Texaco AC-10 and the rubber was from two sources:
the -# 10 mesh CRM was from Granular Products in Mexia, Texas, and the -#80 mesh
CRM was from Rouse Rubber in Vicksburg, Mississippi.
The addition of CRM to asphalt can have a significant impact on material properties
and both binder and mixture testing procedures. Some of the standard tests typically
performed on conventional asphalt cement binders (such as absolute and kinematic
viscosity, penetration, ductility, softening point) are either inappropriate for CRM
binders or the test results are so different from standard asphalt cement their relevance
is unclear.
International Surfacing, Inc. (ISI) of Chandler, Arizona markets the most commonly
used "wet" process, also known as the McDonald technology. Most state DOTs do not
have adequate data or experience with CRM binders to have developed their own
specifications and, therefore, normally use the binder specifications which are
recommended by ISL Recommended specifications for the ISi (Type II) binder are
shown below:
8
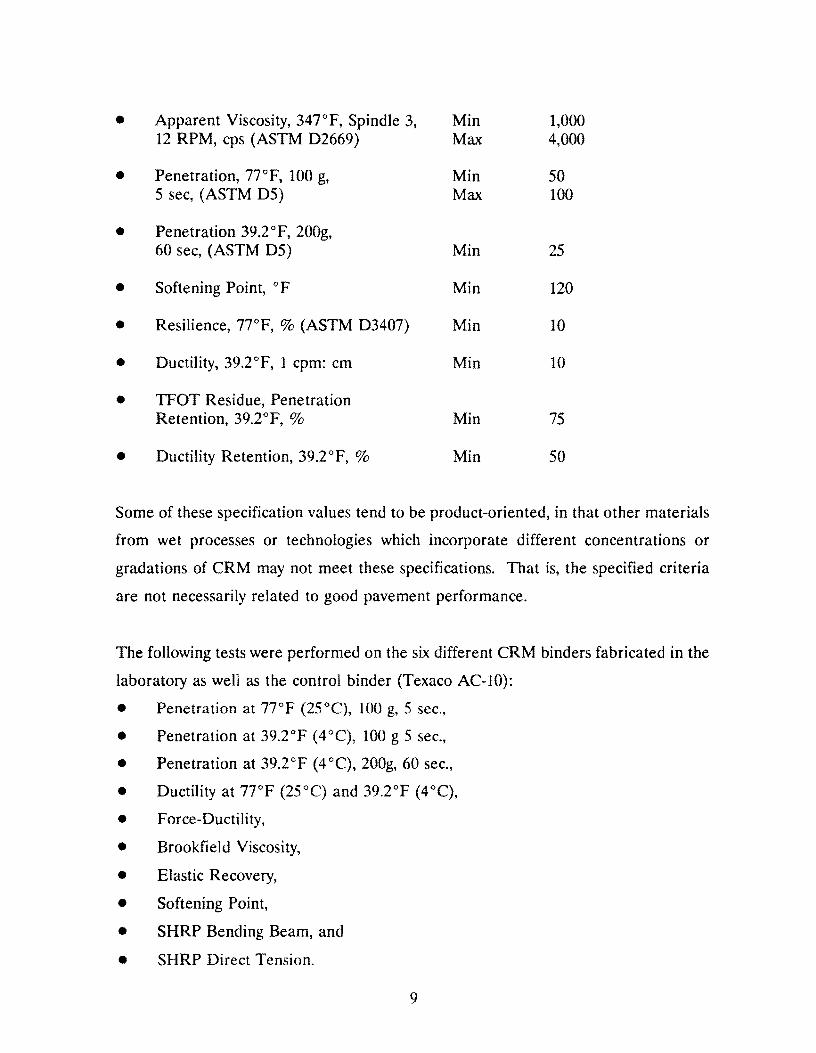
• Apparent Viscosity, 347°F, Spindle 3, Min 1,000 12 RPM, cps (ASTM D2669) Max 4,000
• Penetration, 77°F, 100 g, Min 50 5 sec, (ASTM D5) Max 100
• Penetration 39.2°F, 200g, 60 sec, (ASTM D5) Min 25
• Softening Point, °F Min 120
• Resilience, 77°F, % (ASTM D3407) Min 10
• Ductility, 39.2°F, 1 cpm: cm Min 10
• TFOT Residue, Penetration Retention, 39.2°F, % Min 75
• Ductility Retention, 39.2°F, % Min 50
Some of these specification values tend to be product-oriented, in that other materials
from wet processes or technologies which incorporate different concentrations or
gradations of CRM may not meet these specifications. That is, the specified criteria
are not necessarily related to good pavement performance.
The following tests were performed on the six different CRM binders fabricated in the
laboratory as well as the control binder (Texaco AC-10):
• Penetration at 77°F (25°C), 100 g, 5 sec.,
• Penetration at 39.2°F (4°C), 100 g 5 sec.,
• Penetration at 39.2°F ( 4 °C), 200g, 60 sec.,
• Ductility at 77°F (25°C) and 39.2°F (4°C),
• Force-Ductility,
• Brookfield Viscosity,
• Elastic Recovery,
• Softening Point,
• SHRP Bending Beam, and
• SHRP Direct Tension.
9
The above tests were performed in triplicate on each binder and a discussion of these
test results follows.
2.1 Penetration
The penetration test is an empirical measure of asphalt consistency. In this test,
a container of asphalt cement is brought to a standard test temperature in a
temperature·controlled water bath. A prescribed needle is allowed to bear on the
surface of the asphalt cement for a specified time period. The distance, in units of 0.1
mm, that the needle penetrates into the asphalt cement is the penetration
measurement. Penetration measurements on control and crumb rubber modified
binders are shown in Table 2.1.
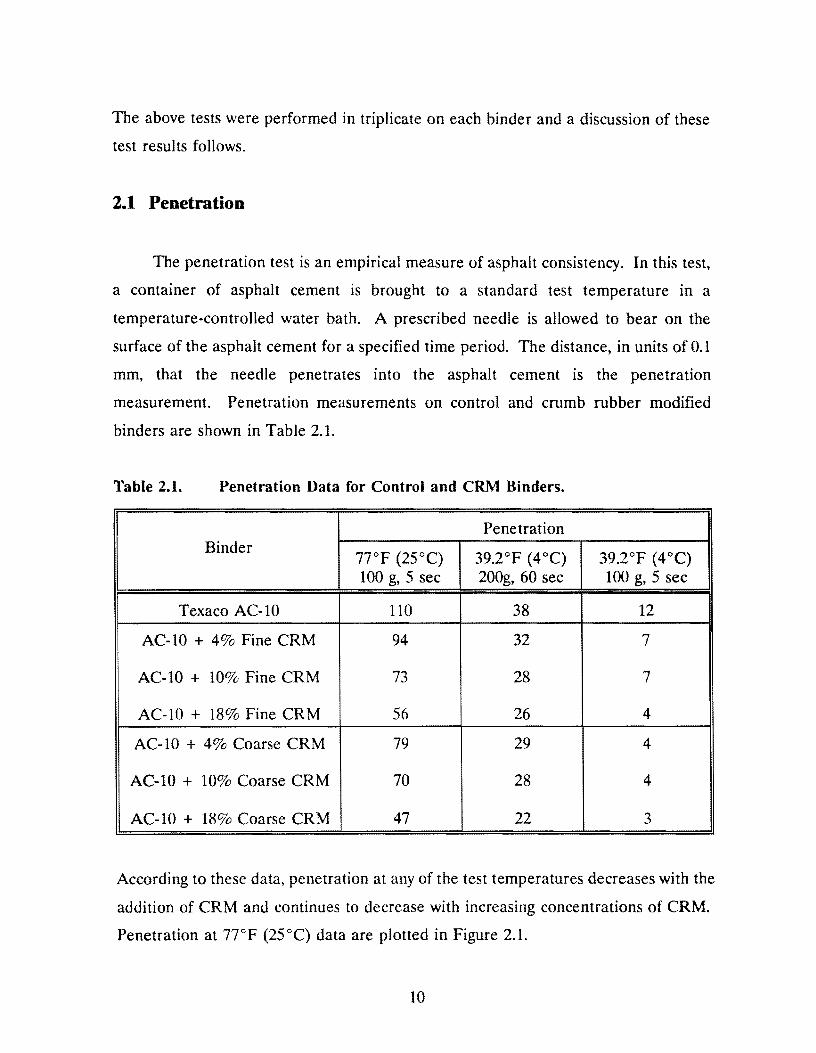
Table 2.1. Penetration Data for Control and CRM Binders.
Penetration Binder
77°F (25°C) 39.2°F (4°C) 39.2°F (4°C) 100 g, 5 sec 200g, 60 sec 100 g, 5 sec
Texaco AC-10 110 38 12
AC-10 + 4% Fine CRM 94 32 7
AC-10 + 10% Fine CRM 73 28 7
AC-10 + 18% Fine CRM 56 26 4
AC-10 + 4% Coarse CRM 79 29 4
AC-10 + 10% Coarse CRM 70 28 4
AC-10 + 18% Coarse CRM 47 22 3
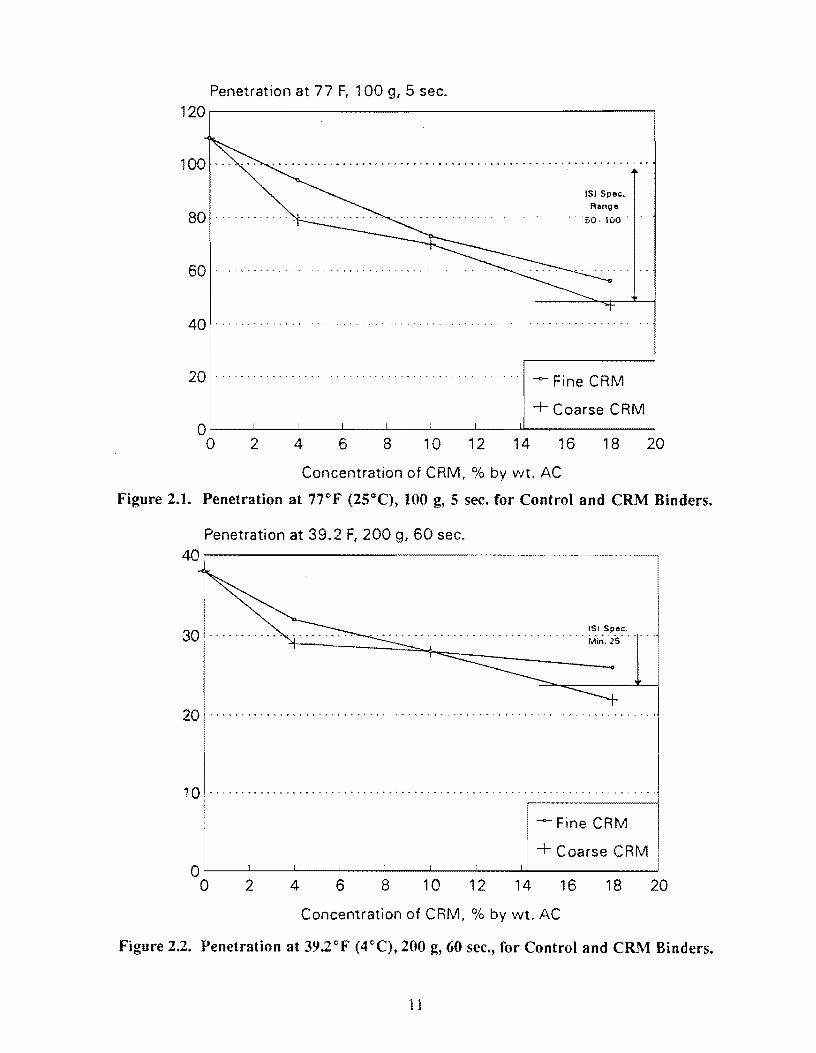
According to these data, penetration at any of the test temperatures decreases with the
addition of CRM and continues to decrease with increasing concentrations of CRM.
Penetration at 77°F (25°C) data are plotted in Figure 2.1.
10
Penetration at 77 F, 100 g, 5 sec. 120.--~~~~~~~~~~~~~~~~~~~~--,
ISJ Spec. Range
80 50-100 .
60 .......................... .
40 ·············· ..
20 •.................
o1 0 2 4 6 8 10 12 14 16 18 20
Concentration of CRM, % by wt. AC
Figure 2.1. Penetration at 77°F (25°C), 100 g, 5 sec. for Control and CRM Binders.
Penetration at 39.2 F, 200 g, 60 sec. 40~~~~~~~~~~~~~~~~~~~~~~~--
20 .............................................................. .
10 ............................................................... .
--Fine CRM
+Coarse CRM Q'--~--'--~----'-~~-'--~-"-~--"~~-'-~---'-'~~~~~~--'
0 2 4 6 8 1 0 1 2 14 16 1 8 20
Concentration of CRM, % by wt. AC
Figure 2.2. Penetration at 39.2°F (4°C), 200 g, 60 sec., for Control and CRM Binders.
11
According.to the ISI Guide Specification (Type II), the penetration at 77°F (25°C) for
asphalt-rubber binders which contain 15 to 20 percent rubber by weight of the mix
should be between 50 and 100. All of the CRM binders except one (18% Coarse
CRM) met this specification.
Penetration at 39.2 °F ( 4 °C) data is shown in Figure 2.2 along with the ISi Guide
Specification. Again, all of the binders except one (18% Coarse CRM) met the
specification.
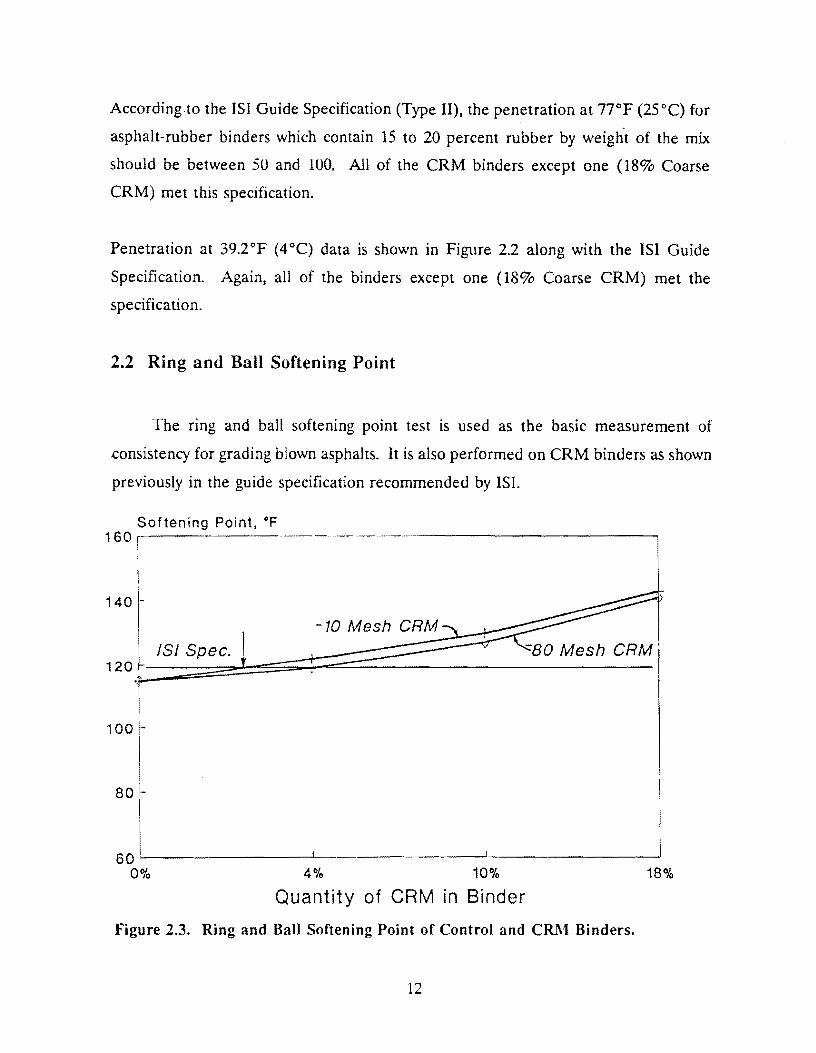
2.2 Ring and Ball Softening Point
The ring and ball softening point test is used as the basic measurement of
.consistency for grading blown asphalts. It is also performed on CRM binders as shown
previously in the guide specification recommended by ISL
Softening Point, •F 1so~~~--~~-~----~--~-~-~--~~~~~~~~~~~~_,
140 -
100
80
SQ'--~~~~~~~----''---~~~-·-~~~~~~~~~~~~~
0% 4% 10% 18%
Quantity of CRM in Binder
Figure 2.3. Ring and Ball Softening Point of Control and CRM Binders.
12
The softening point of CRM asphalt binders is higher than that of unmodified binder
as shown in Figure 2.3 and is affected by both rubber size and concentration. Note that
all of the CRM binders met the ISi specification.
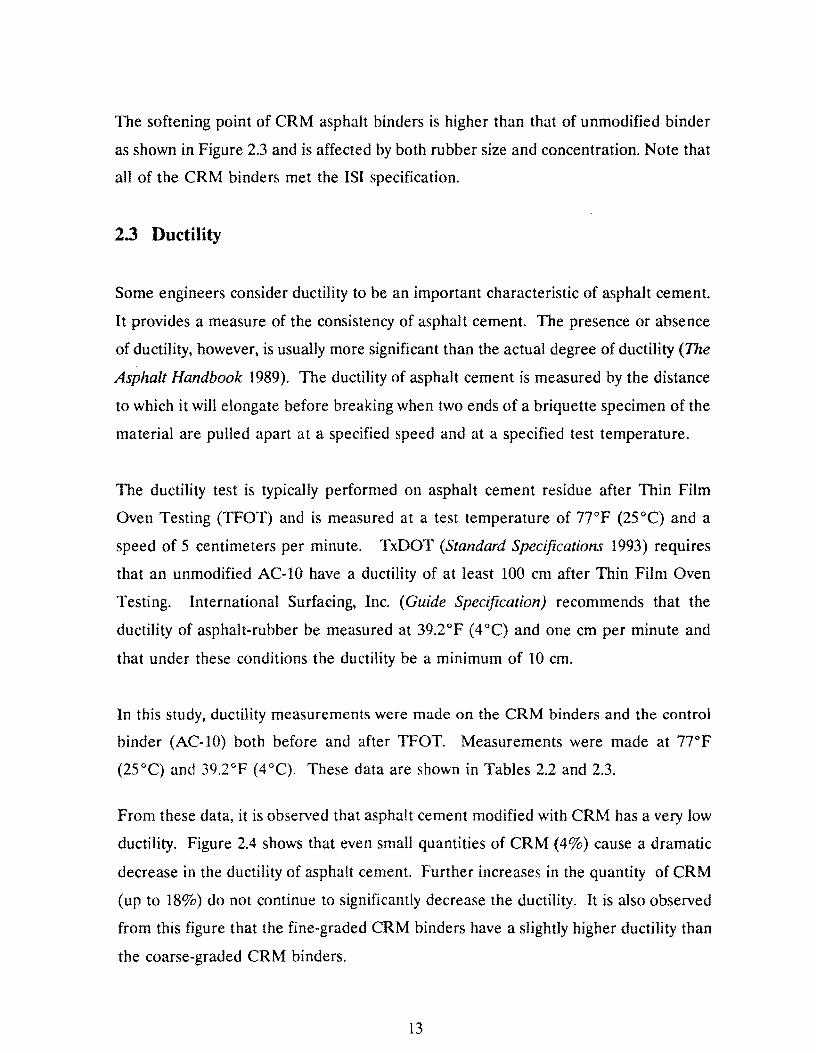
2.3 Ductility
Some engineers consider ductility to be an important characteristic of asphalt cement.
It provides a measure of the consistency of asphalt cement. The presence or absence
of ductility, however, is usually more significant than the actual degree of ductility (The
Asphalt Handbook 1989). The ductility of asphalt cement is measured by the distance
to which it will elongate before breaking when two ends of a briquette specimen of the
material are pulled apart at a specified speed and at a specified test temperature.
The ductility test is typically performed on asphalt cement residue after Thin Film
Oven Testing (TFOT) and is measured at a test temperature of 77°F (25°C) and a
speed of 5 centimeters per minute. TxDOT (Standard Specifications 1993) requires
that an unmodified AC-10 have a ductility of at least 100 cm after Thin Film Oven
Testing. International Surfacing, Inc. (Guide Specification) recommends that the
ductility of asphalt-rubber be measured at 39.2°F ( 4 °C) and one cm per minute and
that under these conditions the ductility be a minimum of 10 cm.
In this study, ductility measurements were made on the CRM binders and the control
binder (AC-10) both before and after TFOT. Measurements were made at 77°F
(25°C) and 39.2°F (4°C). These data are shown in Tables 2.2 and 2.3.
From these data, it is observed that asphalt cement modified with CRM has a very low
ductility. Figure 2.4 shows that even small quantities of CRM ( 4%) cause a dramatic
decrease in the ductility of asphalt cement. Further increases in the quantity of CRM
(up to 18%) do not continue to significantly decrease the ductility. It is also observed
from this figure that the fine-graded CRM binders have a slightly higher ductility than
the coarse-graded CRM binders.
13
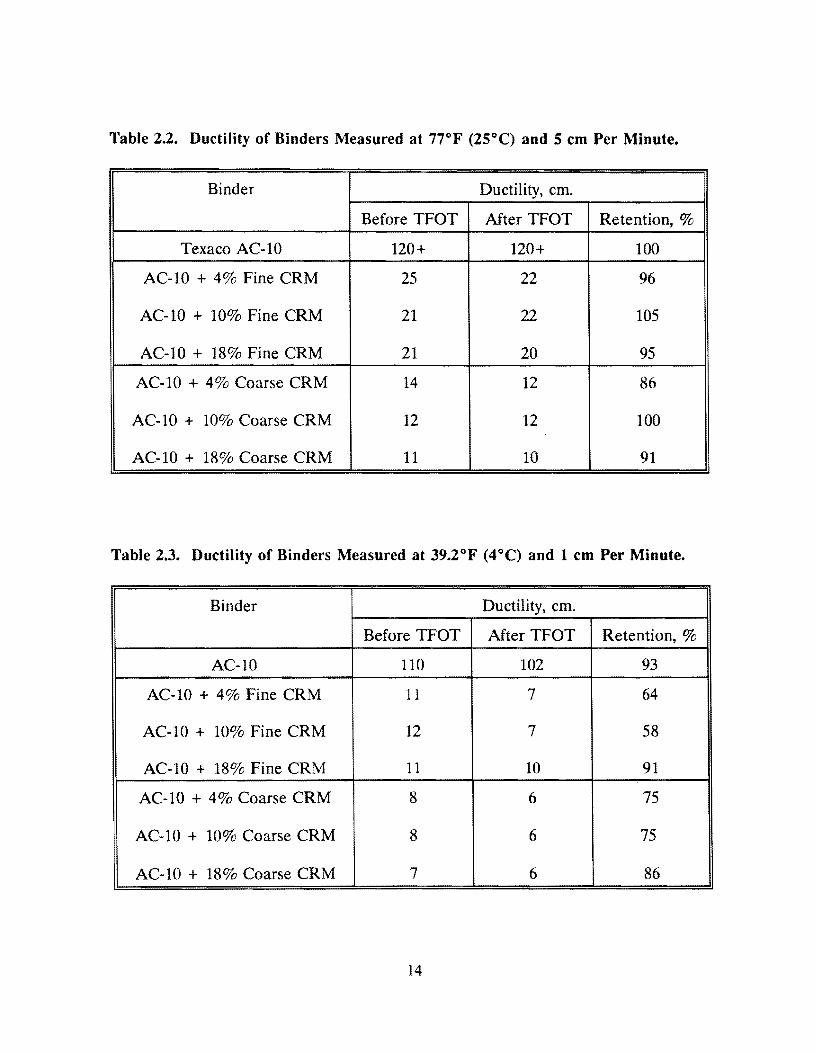
Table 2.2. Ductility of Binders Measured at 77°F (25°C) and 5 cm Per Minute.
Binder Ductility, cm.
Before TFOT After TFOT Retention, %
Texaco AC-10 120+ 120+ 100
AC-10 + 4% Fine CRM 25 22 96
AC-10 + 10% Fine CRM 21 22 105
AC-10 + 18% Fine CRM 21 20 95
AC-10 + 4% Coarse CRM 14 12 86
AC-10 + 10% Coarse CRM 12 12 100
AC-10 + 18% Coarse CRM 11 10 91
Table 2.3. Ductility of Binders Measured at 39.2°F (4°C) and 1 cm Per Minute.
Binder Ductility, cm.
Before TFOT After TFOT Retention, %
AC-10 110 102 93
AC-10 + 4% Fine CRM 11 7 64
AC-10 + 10% Fine CRM 12 7 58
AC-10 + 18% Fine CRM 11 10 91
AC-10 + 4% Coarse CRM 8 6 75
AC-10 + 10% Coarse CRM 8 6 75
AC-10 + 18% Coarse CRM 7 6 86
14
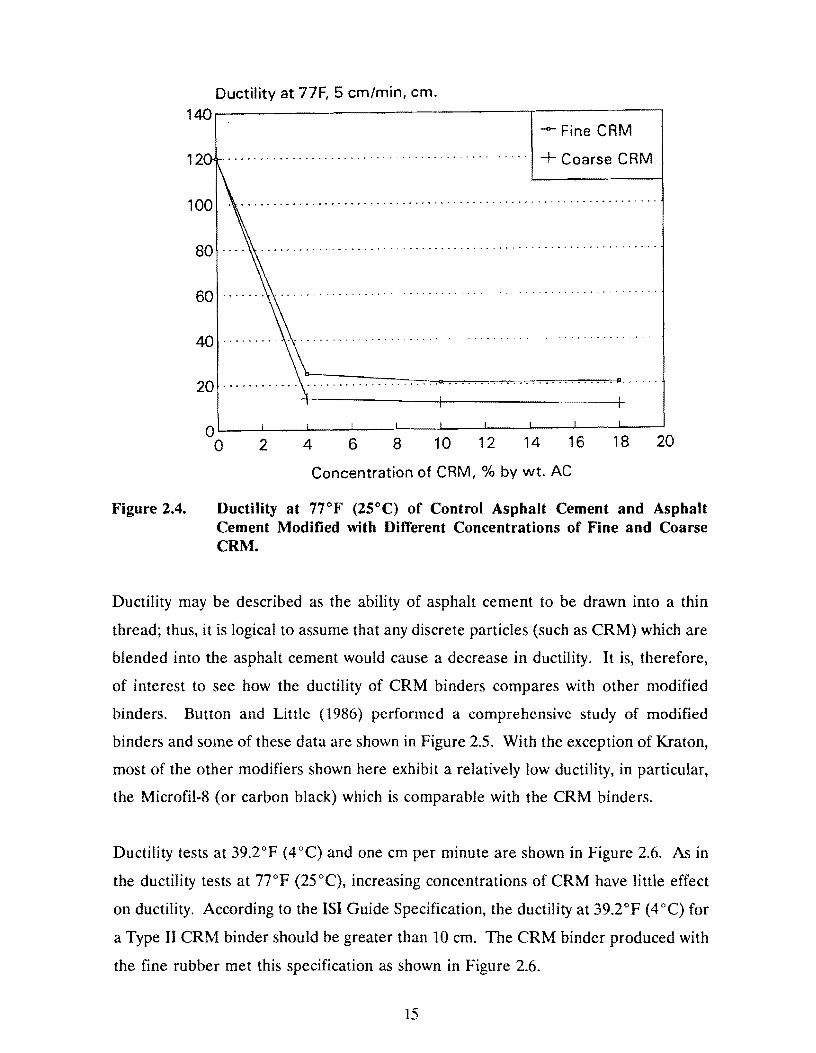
Figure 2.4.
Ductility at 77F, 5 cm/min, cm. 140.--~~~~~~~~~~~~~-.~~~~~---,
-- Fine CRM
12 · · · · · · · · · · · · · · · · · · · · · · · · · · · · · · · · · · · · · · · · · · · · · +Coarse CRM
~ . . ..................................... - . . . . . . . . . . ... .
80
60
40
20 .......... *" ....................................... ~ .............. .
Concentration of CRM, % by wt. AC
Ductility at 77°F (25°C) of Control Asphalt Cement and Asphalt Cement Modified with Different Concentrations of Fine and Coarse CRM.
Ductility may be described as the ability of asphalt cement to be drawn into a thin
thread; thus, it is logical to assume that any discrete particles (such as CRM) which are
blended into the asphalt cement would cause a decrease in ductility. It is, therefore,
of interest to see how the ductility of CRM binders compares with other modified
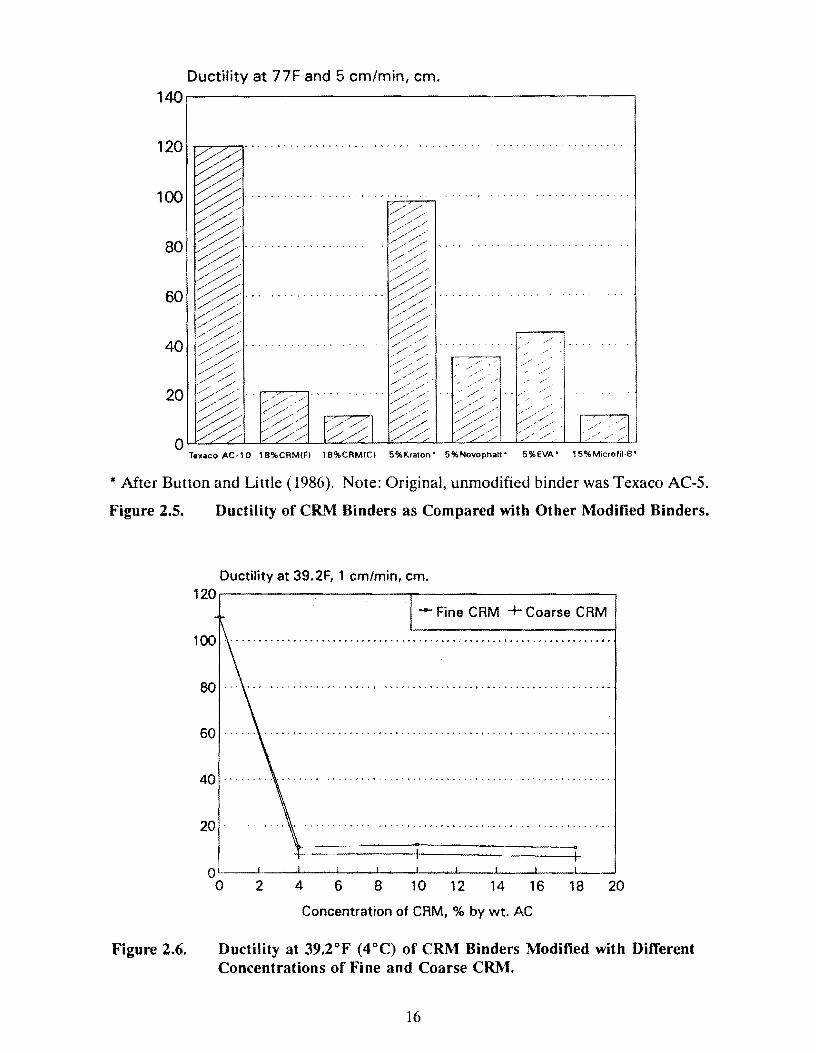
binders. Button and Little (1986) performed a comprehensive study of modified
binders and some of these data are shown in Figure 2.5. With the exception of Kraton,
most of the other modifiers shown here exhibit a relatively low ductility, in particular,
the Microfil-8 (or carbon black) which is comparable with the CRM binders.
Ductility tests at 39.2°F (4 °C) and one cm per minute are shown in Figure 2.6. As in
the ductility tests at 77°F (25°C), increasing concentrations of CRM have little effect
on ductility. According to the ISi Guide Specification, the ductility at 39.2°F (4 °C) for
a Type II CRM binder should be greater than 10 cm. The CRM binder produced with
the fine rubber met this specification as shown in Figure 2.6.
15
Ductility at 77F and 5 cm/min, cm. 140~~~~~~~~~~~~~~~~~~~~~~~
120
100 ...............
~ 80~····················
% 60 ~·· ............ .
0'~ /~~ 40 ~/ .............. . /,./ ///·
~;:;:; 20 ;/:~ ~
o~_,c_..::;_J..........l,;__.:.:........::._.__c::._~"""'--'--":..........:--"'-_.__-""---'--"---'--'-"-'--"--'--'-"--~'"--'-'
Texaco AC·IO 18%CRM(F) 18%CRM(Cl 5%Kraton' 5%Novophalt' 5%EVA' 15%Microfil·8'
*After Button and Little (1986). Note: Original, unmodified binder was Texaco AC-5.
Figure 2.5. Ductility of CRM Binders as Compared with Other Modified Binders.
Figure 2.6.
Ductility at 39.2F, 1 cm/min, cm. 120.--~~~~~~~~~....--~~~~~~~~~---.
-- Fine CRM +Coarse CRM
100 ................................................................... .
60 ......................... , ........................................ .
60 .............................................................. ..
40 ................................................................ ..
20 ·•··· ....................................................... .
0'--~"--~...._._~_._~_,_~_._~_......~__..~__..__~,____,
0 2 4 6 8 10 12 14 16 18 20
Concentration of CRM, % by wt. AC
Ductility at 39.2°F (4°C) of CRM Binders Modified with Different Concentrations of Fine and Coarse CRM.
16
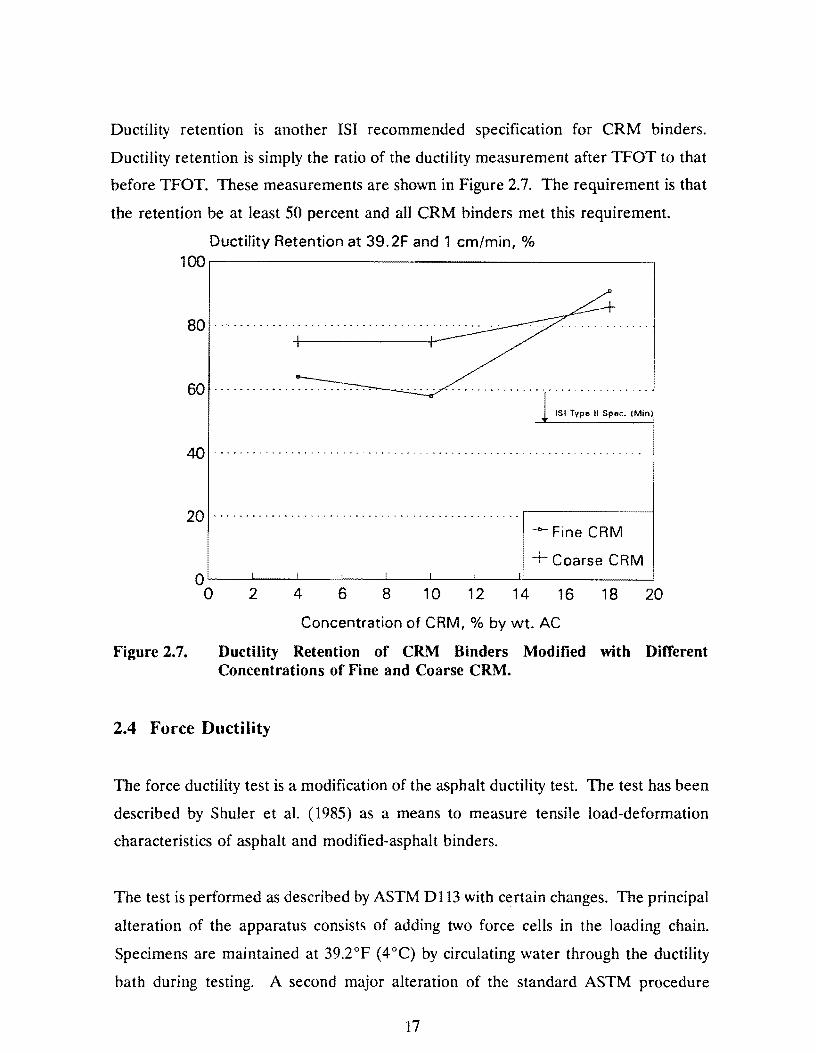
Ductility retention is another ISI recommended specification for CRM binders.
Ductility retention is simply the ratio of the ductility measurement after TFOT to that
before TFOT. These measurements are shown in Figure 2.7. The requirement is that
the retention be at least 50 percent and all CRM binders met this requirement.
Ductility Retention at 39.2F and 1 cm/min, % 100,.--~~~~~~~~~~~~~~~~~~~~~~
80 ·········································· ..
ISi Type II Spec. IMin)
40 ......................................................... ..
20 ···················· ········· ................. . --<>-Fine CRM
Coarse CRM 0'--~-'-~--'-~~-'-~-'-~---J'--~-'-~----1.J~~~~~~--'
0
Figure 2.7.
2 4 6 8 10 12 14 16 18 20
Concentration of CRM, % by wt. AC
Ductility Retention of CRM Binders Modified with Different Concentrations of Fine and Coarse CRM.
2.4 Force Ductility
The force ductility test is a modification of the asphalt ductility test. The test has been
described by Shuler et al. (1985) as a means to measure tensile load-deformation
characteristics of asphalt and modified-asphalt binders.
The test is performed as described by ASTM Dl 13 with certain changes. The principal
alteration of the apparatus consists of adding two force cells in the loading chain.
Specimens are maintained at 39.2°F (4°C) by circulating water through the ductility
bath during testing. A second major alteration of the standard ASTM procedure
17
involves the test specimen shape. The mold is modified to produce a test specimen
with a 1-square centimeter cross-sectional area for a distance of approximately 3
centimeters.
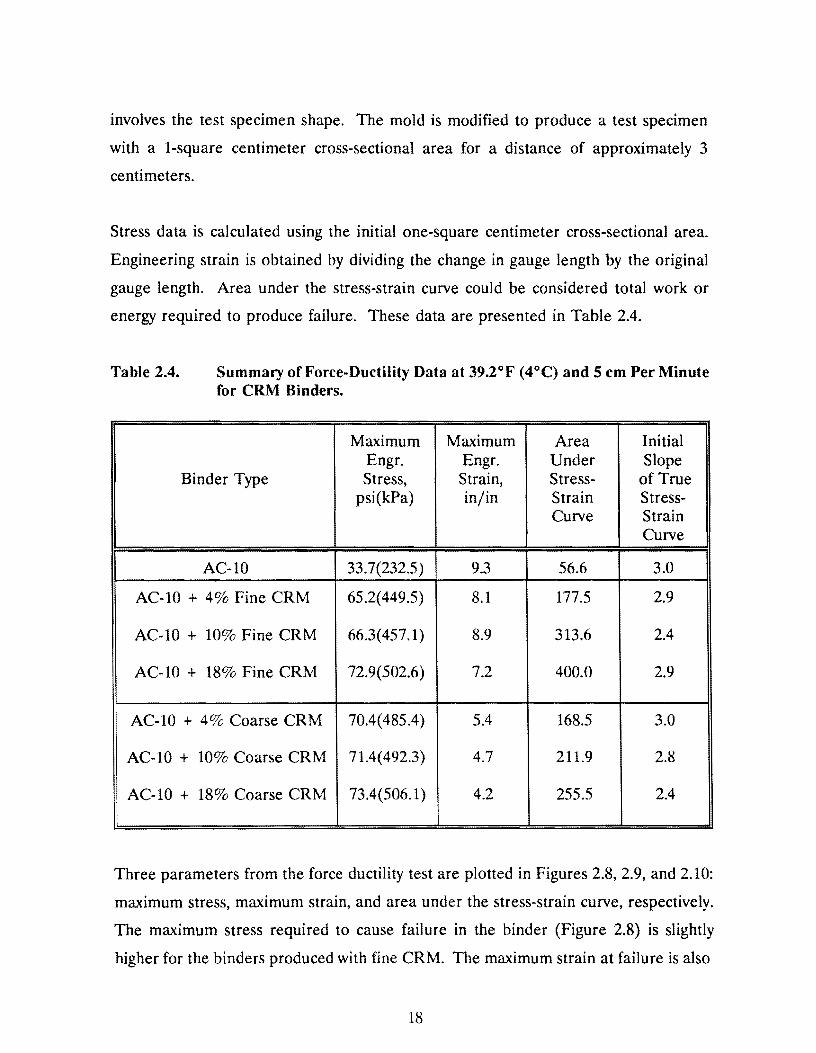
Stress data is calculated using the initial one-square centimeter cross-sectional area.
Engineering strain is obtained by dividing the change in gauge length by the original
gauge length. Area under the stress-strain curve could be considered total work or
energy required to produce failure. These data are presented in Table 2.4.
Table 2.4. Summary of Force-Ductility Data at 39.2°F (4°C) and 5 cm Per Minute for CRM Binders.
Maximum Maximum Area Initial Engr. Engr. Under Slope
Binder Type Stress, Strain, Stress- of True psi(kPa) in/in Strain Stress-
Curve Strain Curve
AC-10 33.7(232.5) 9.3 56.6 3.0
AC-10 + 4% Fine CRM 65.2(449.5) 8.1 177.5 2.9
AC-10 + 10% Fine CRM 66.3( 457 .1) 8.9 313.6 2.4
AC-10 + 18% Fine CRM 72.9(502.6) 7.2 400.0 2.9
AC-10 + 4% Coarse CRM 70.4(485.4) 5.4 168.5 3.0
AC-10 + 10% Coarse CRM 71.4(492.3) 4.7 211.9 2.8
AC-10 + 18% Coarse CRM 73.4(506.1) 4.2 255.5 2.4
Three parameters from the force ductility test are plotted in Figures 2.8, 2.9, and 2.10:
maximum stress, maximum strain, and area under the stress-strain curve, respectively.
The maximum stress required to cause failure in the binder (Figure 2.8) is slightly
higher for the binders produced with fine CRM. The maximum strain at failure is also
18
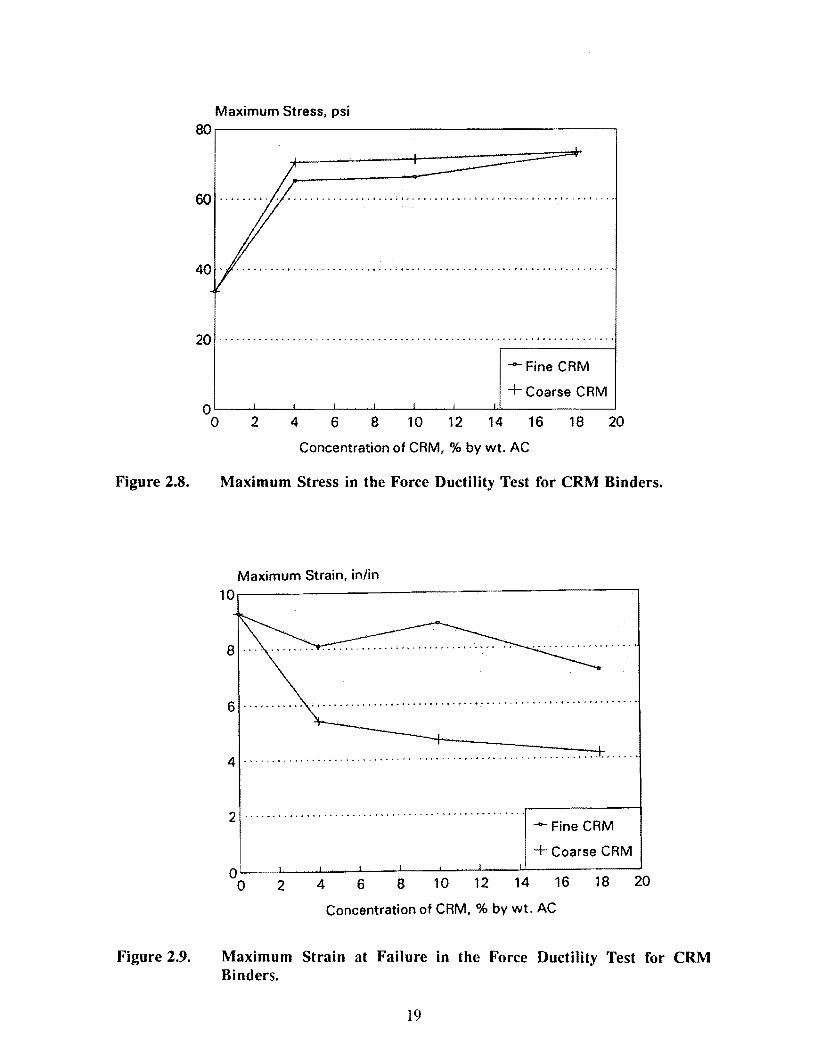
Figure 2.8.
Figure 2.9.
Maximum Stress, psi so~~~~~~~~~~~~~~~~~~~~~-.
60 ....... ' ........... ; ......... ; ·~· ................................... .
40 . . ................................................................ '.
20 ................ , .................................................... .
......... Fine CAM
+coarse CAM o~~..__~_._~~~~~-....~__..~~~~~~~~~
0 2 4 6 8 10 12 14 16 18 20
Concentration of CAM, % by wt. AC
Maximum Stress in the Force Ductility Test for CRM Binders.
Maximum Strain, in/in 10~~~--~~~~~~~~-,-~~~~~~-:---:-i
6 ........... ··························································
4 ............................ .. • ~ ••••• # ~ ••• ~ • • • • • • • • • • ••••••••• " ..... ~
2 . . . . . . . . . . . . . . . . . . . . . . . . . . . . . . . . . . . . . . . . . . . . . . . . . ......... Fine CAM
+Coarse CAM
Concentration of CAM, % by wt. AC
Maximum Strain at Failure in the Force Ducti1ity Test for CRM Binders.
19
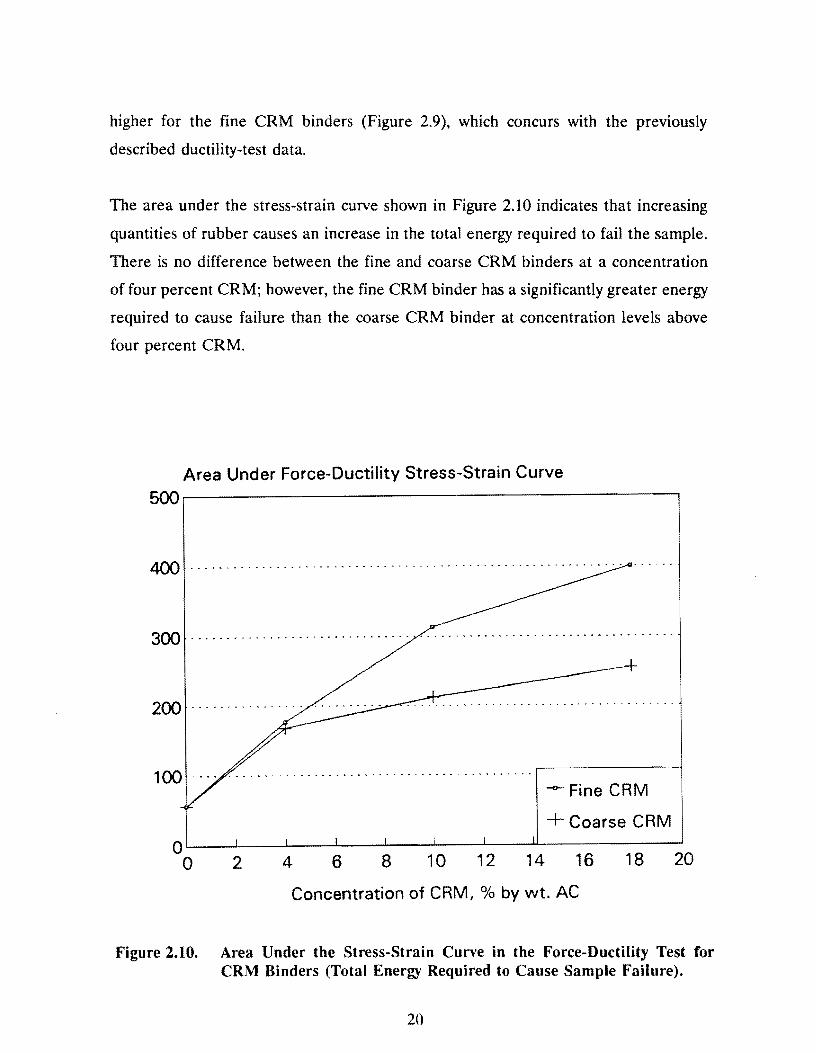
higher for the fine CRM binders (Figure 2.9), which concurs with the previously
described ductility-test data.
The area under the stress-strain curve shown in Figure 2.10 indicates that increasing
quantities of rubber causes an increase in the total energy required to fail the sample.
There is no difference between the fine and coarse CRM binders at a concentration
of four percent CRM; however, the fine CRM binder has a significantly greater energy
required to cause failure than the coarse CRM binder at concentration levels above
four percent CRM.
Area Under Force-Ductility Stress-Strain Curve 500---------------------------------------------,
400 .................... ······· ················· ·············· ..... .
300 ·······························
100 ............................................ . _,,_Fine CRM
+Coarse CRM QL_ __ .,L_ __ _J_ __ _i_ __ --1. ____ .__ __ ..J_ __ _JJ_ __________ ___.
0 2 4 6 8 1 0 1 2 14 16 18 20
Concentration of CRM, % by wt. AC
Figure 2.10. Area Under the Stress-Strain Curve in the Force-Ductility Test for CRM Binders (Total Energy Required to Cause Sample Failure).
20
2.5 Brookfield Viscosity
Viscosity of crumb rubber modified binders is typically performed using a Brookfield
rotational viscometer. Standard absolute and kinematic viscosity tests for asphalt
cements which employ a capillary viscometer are not appropriate for crumb rubber
modified binders since rubber particles interfere with laminar flow through the
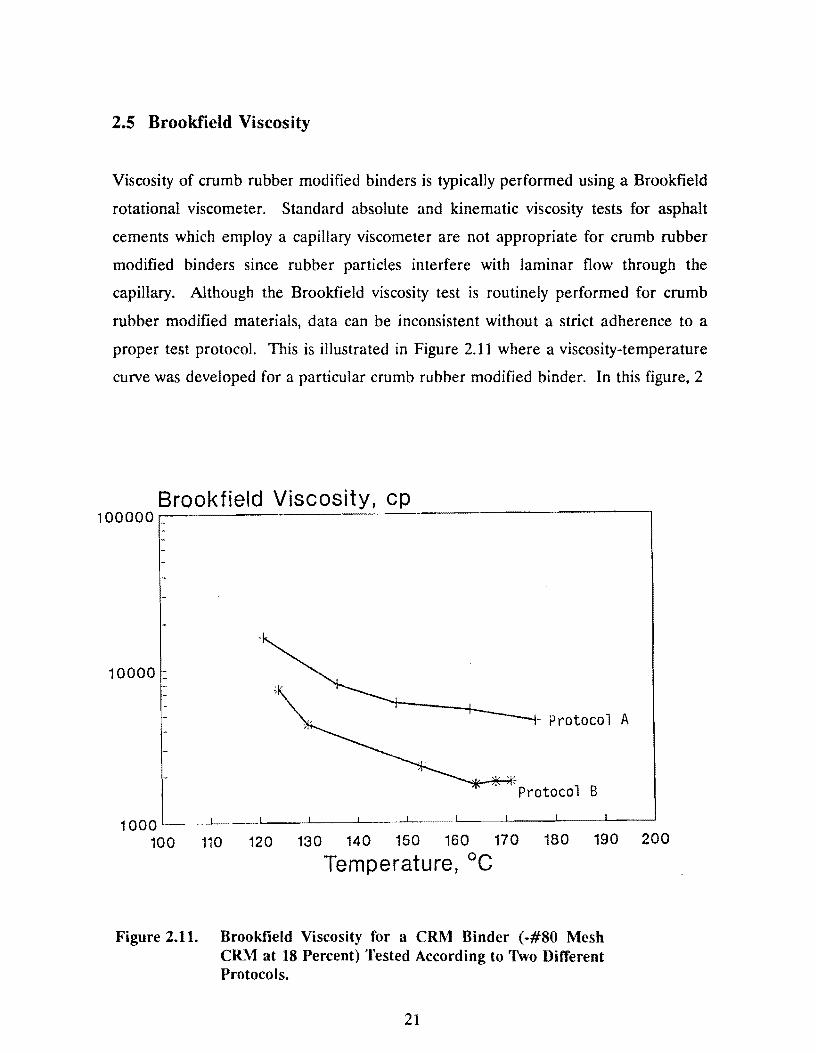
capillary. Although the Brookfield viscosity test is routinely performed for crumb
rubber modified materials, data can be inconsistent without a strict adherence to a
proper test protocol. This is illustrated in Figure 2.11 where a viscosity-temperature
cuive was developed for a particular crumb rubber modified binder. In this figure, 2
Brookfield Viscosity, cp 100000 -
10000 -
1000 100 110 120 130 140 150 160 170
Temperature, °C
- Protocol A
Protocol B
180 190
Figure 2.11. Brookfield Viscosity for a CRM Binder ( -#80 Mesh CRM at 18 Percent) Tested According to Two Different Protocols.
21
200
significantly different curves were obtained for the same binder. The difference
between the 2 curves is caused by slight changes in the test protocol for the
development of each curve. For example, viscosity measurements were made for 1
curve as the temperature of the binder was increasing, and for the other curve
measurements were made as the temperature of binder was decreasing. In any case,
it appears that temperature control is a key factor in obtaining consistent Brookfield
viscosity results. It is also very important to agitate the binder prior to each
measurement, to minimize discrepancies caused from the CRM settling to the bottom
of the test beaker.
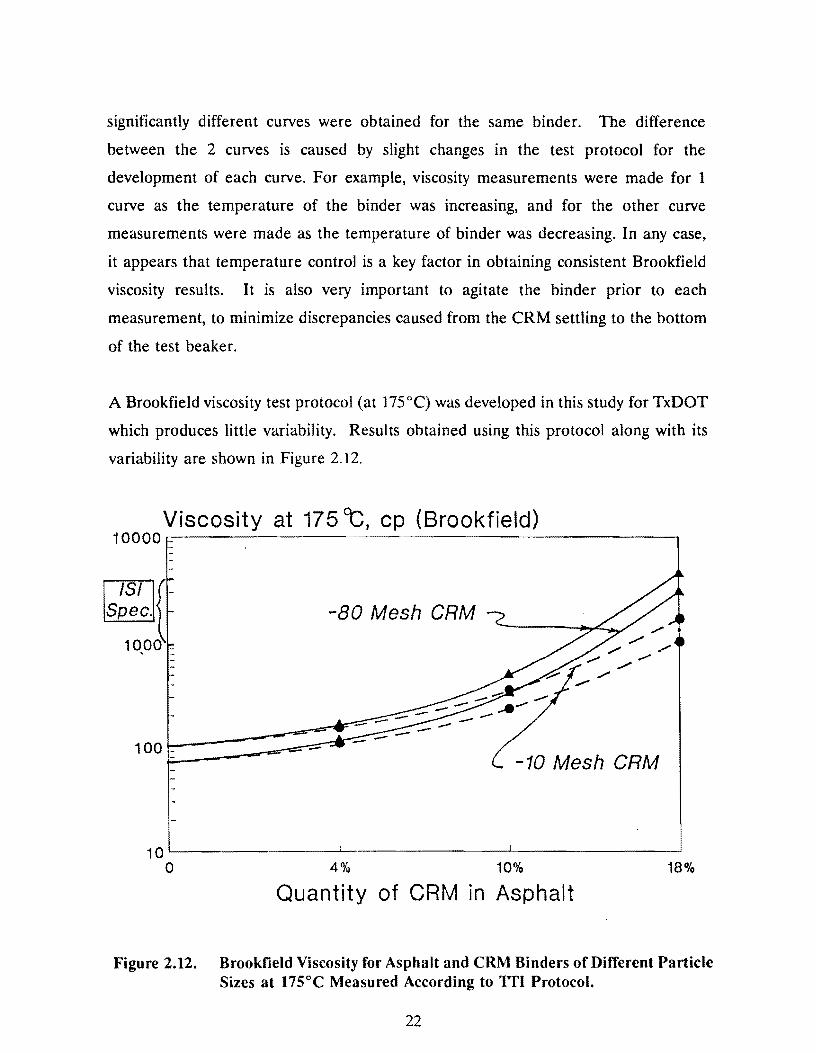
A Brookfield viscosity test protocol (at 175°C) was developed in this study for TxDOT
which produces little variability. Results obtained using this protocol along with its
variability are shown in Figure 2.12.
Viscosity at 175 CC, cp (Brookfield) 10000~-~~~~~~~~~~~~~~~~~~~~~--.
-80 Mesh CRM
-10 Mesh CRM
10'--~--~~-~~~--'~-~~~~~~~-'---~~~~~~~~-'
0 4% 10% 18%
Quantity of CRM in Asphalt
Figure 2.12. Brookfield Viscosity for Asphalt and CRM Binders of Different Particle Sizes at 175°C Measured According to Tri Protocol.
22
2.6. Elastic Recovery
The elastic recovery test was developed for use with polymer-modified binders but is
not a widely used or widely accepted test for bituminous binders. The test is
performed using the standard ductility test equipment and specimen molds. The test
is performed at 50°F ( l0°C) and at a rate of pull of 5 cm/min. The specimen is
elongated to 20 centimeters and maintained here for 5 minutes. The specimen is then
cut in half and allowed to recover for one hour. At the end of 1 hour the ductilometer
is retracted until the two broken ends of the specimen touch. The total distance the
specimen recovers is reported as the elastic recovery.
All of the CRM binders tested (4, 10, and 18% coarse CRM and 4, 10, and 18% fine
CRM binders) broke prior to reaching 20 centimeters. Therefore, elastic recovery
could not be measured for these CRM binders according to this procedure.
2.7. Resiliency
A resiliency test was performed on control and CRM Binders according to ASTM
Dl 754. This test was included in the testing program because it is incorporated in the
guide specifications for asphalt-rubber binders set forth by International Surfacing, Inc.
The resiliency test is primarily used for bituminous hot-poured types of joint sealants
for portland cement concrete and asphaltic concrete pavements.
The test equipment is the same as for the penetration test except the penetration
needle is replaced with a ball penetration tool. The ball penetration tool is allowed
to penetrate the bituminous specimen for five seconds and the reading is recorded as
P. Without returning the dial pointer to zero, the ball is pressed down an additional
100 (P + 100) at a uniform rate in 10 seconds. The tool is held here for an additional
five seconds during which time the dial is re-zeroed. The clutch is then released, and
the specimen is allowed to recover for 20 seconds, and the final dial reading is
23
recorded as F. The recovery is computed as follows:
Recovery, % = P + 100 - F.
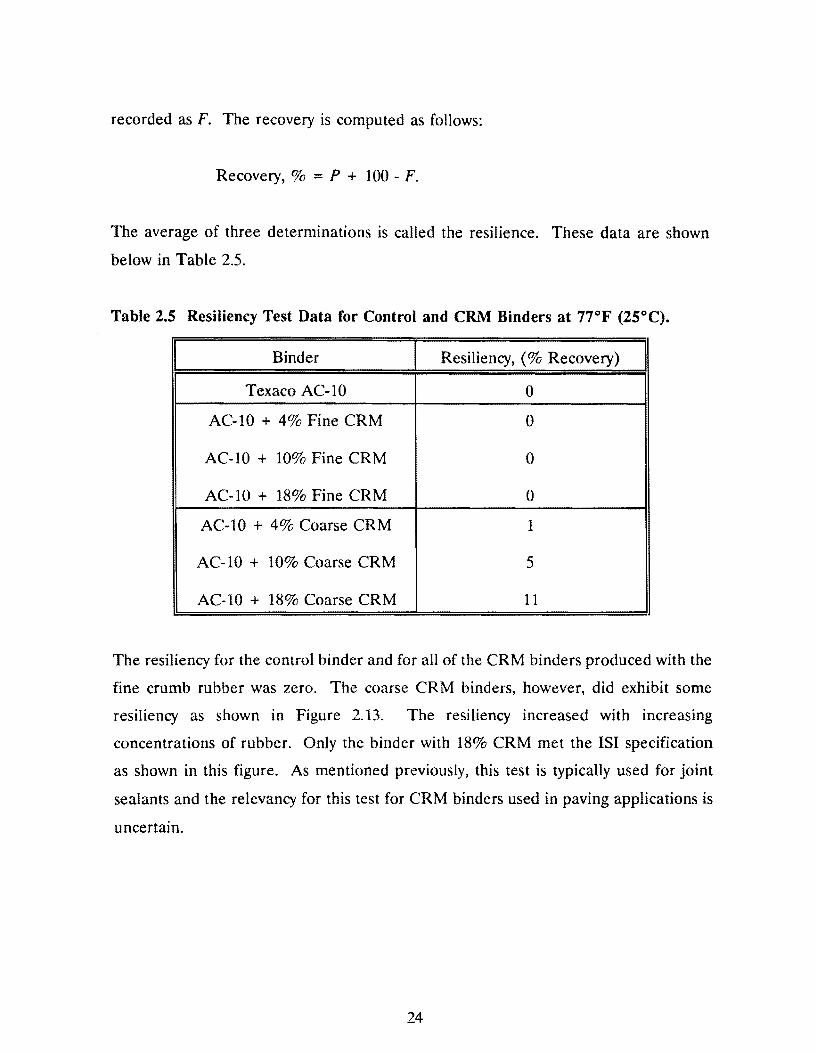
The average of three determinations is called the resilience. These data are shown
below in Table 2.5.
Table 2.S Resiliency Test Data for Control and CRM Binders at 77°F (2S°C).
I Binder I Resiliency, (% Recovery) I Texaco AC-10 0
AC-10 + 4% Fine CRM 0
AC-10 + 10% Fine CRM 0
AC-10 + 18% Fine CRM 0
AC-10 + 4% Coarse CRM 1
AC-10 + 10% Coarse CRM 5
AC-10 + 18% Coarse CRM 11
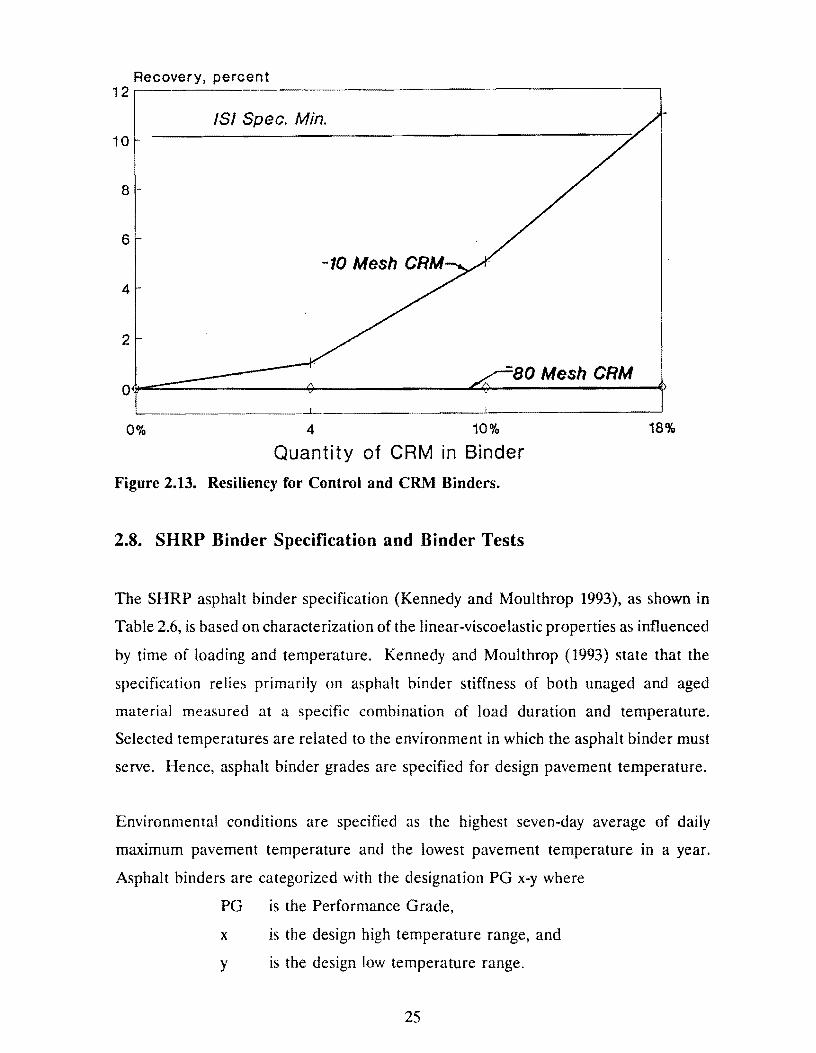
The resiliency for the control binder and for all of the CRM binders produced with the
fine crumb rubber was zero. The coarse CRM binders, however, did exhibit some
resiliency as shown in Figure 2.13. The resiliency increased with increasing
concentrations of rubber. Only the binder with 18% CRM met the ISi specification
as shown in this figure. As mentioned previously, this test is typically used for joint
sealants and the relevancy for this test for CRM binders used in paving applications is
uncertain.
24
Recovery, percent 12 ·~~~
/SI Spec. Min. 10
8
6
4
2
-BO Mesh CRM
~~- ....l_~~~~~~~~--1-~~~~~~~~----'
0% 4 10% 18%
Quantity of CAM in Binder
Figure 2.13. Resiliency for Control and CRM Binders.
2.8. SHRP Binder Specification and Binder Tests
The SHRP asphalt binder specification (Kennedy and Moulthrop 1993), as shown in
Table 2.6, is based on characterization of the linear-viscoelastic properties as influenced
by time of loading and temperature. Kennedy and Moulthrop (1993) state that the
specification relies primarily on asphalt binder stiffness of both unaged and aged
material measured at a specific combination of load duration and temperature.
Selected temperatures are related to the environment in which the asphalt binder must
serve. Hence, asphalt binder grades are specified for design pavement temperature.
Environmental conditions are specified as the highest seven-day average of daily
maximum pavement temperature and the lowest pavement temperature in a year.
Asphalt binders are categorized with the designation PG x-y where
PG is the Performance Grade,
x is the design high temperature range, and
y is the design low temperature range.
25
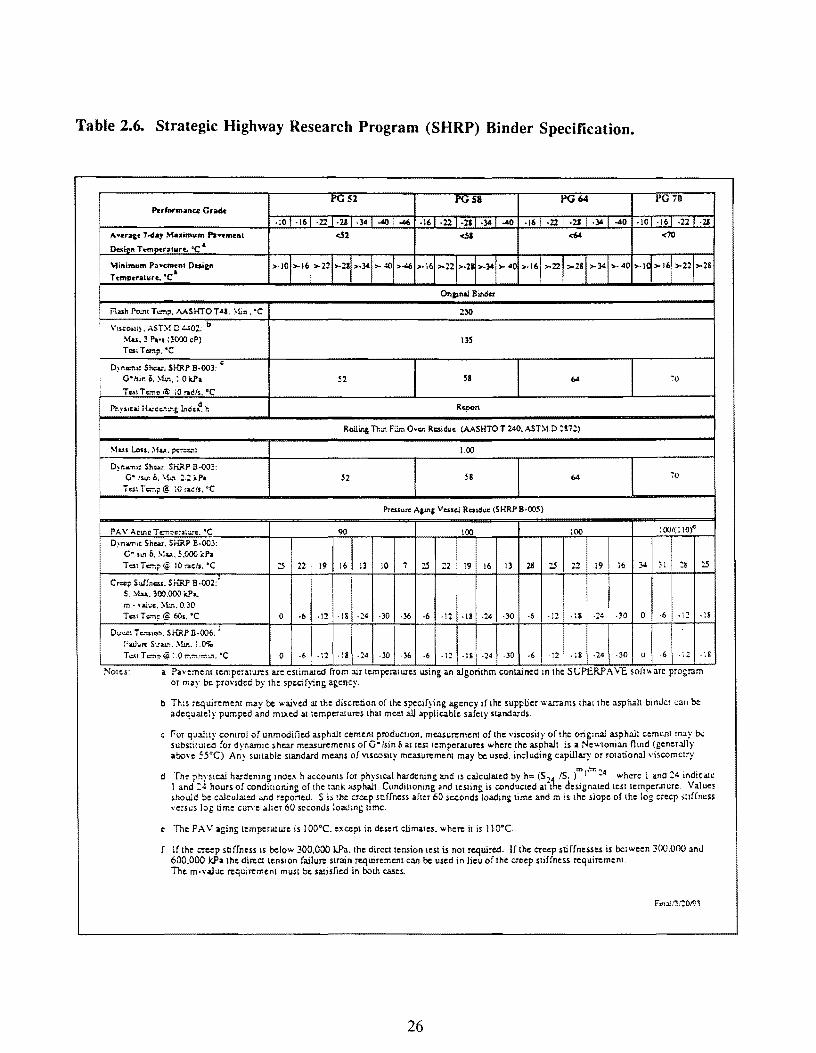
Table 2.6. Strategic Highway Research Program (SHRP) Binder Specification.
I
PGS2 ruS8 PG64 PG70 P.rrnrm .. nu Crai:Mo
.;o ·16 ·22 ·2& .34 ""° : .116 ·16 ·22 ·211 .34 -40 ·16 ·22 ·21 .34 -40 ·10 ·16 ·22 ·21
A•tra&c '-cl•y Maximum Pa•~menl <Sl <.SI <6' <70
O .. ien Tm.Ptcraturt. 'C •
~inimum P:a•cm:nt Ou.i1n >·JD >16 >221>-211>-34 >-~ >-46 >·16 >22 >·2 >-34 > 40 >·16 >-22 >21 >34 >-40 >-I >16 >22 >28 Tcmp~raturc~ •c
On11Nl Binder
i'l,..h Po1J1t T=?· AASHTOT48: \lin. 'C 230
\'t><e>»t}. AST"! D '-=02: b !>iu. ~ Po•• ('.;000 cP) 135 TouTc:r:ip. •c
Dyn•:'l'lic Sheu. SHRP B-003: c
Q•111n o. \tin. ;,Okl'a S2 58 64 :-o Test T=e <a ;o ,..~,._ •c
~y11cai it•.rcc:.;~~s L"lcieR. h Rcpon
Reiling ThiJI Film Oven Rcoiduc (AASHTO T 240. AST:--1.0 :snJ
~l&ss Lou. ~1 .... per:::.": LOO
D!""""' Sh...,. SHRP ll-003: Q• 1•11: b. \l:..i. :.: i.Po S2 SS 64 i!.l
Tcsi 1·=.p@ :o '"els, 'C
Prcuun: Aging Vcuel RC1tduc (SHRP B-OOS)
PA\' A1nr.e Te.";"':t:-C:"a~;.:..-c. •c 90 100 100 !001(! !Of
Dyn•rmc Sh....,, SHRP B-003:
C" "" 6. ~l.u, S .000 i:.Pa Test T=?@ JO :-.els. •c ~ 22 19 16 13 iO 1 2.S 22 19 16 13 28 2.S 22 19 16 :;.i ; I ~~ 25
Creep Suf!ncss. SHRP B-002/ s. :-1.u. 300.000 ;;.p._ m . •"1"•· '.1:.n. 0. :io Tc>tT=;o@ 6C11. 'C 0 ·6 ~12 ·IS .:;4 .30 ·36 -6 ·12 .u -24 -30 -6 . !2 -lS ·2• i -30 0 ·6 ·l:? -16
D11cc: Tc.~"on, SH:RP ll·006: 1
-61-12 F..Jun: S""'-"· '.lln. LO~
':s T 4.:.'!..I T c.-n? &. : or..~,.~-!..'\, l;lc 0 . ~ 8 ~24 .Jo ·36 -6 • 1 ~ .a ·24 -30 -6 • 12 .:s ·'2>4 .;o 0 .6 .;2
Notes: a Pavement tcmpe:-a.tur:s ~ esuma1cd from au temperatures using an algonthm contained m the Sl.i"PERP.'\ VE rnft" arc program or may be provided by the spe!:lf~~ng agency.
b Th:s :-equiremem may be waived ai the discretion of the spec1f}ing agency if 1he supplier wa.--:-ams that the asphalt binder t:an be adequately pumped and mi.xed al temperaiures that meet :ill applicable safely standards.
c For quality comrol of unmodified asph.llt cement producnon. measurement of the viscosity of the original asphalt cement m:iy b~ subs:i;u:ed for dynamic shear measurements of G• !sin li at test tempera1ures where the asphalt is a Newtonian f1md (gener:illy a!x;l\'e 55,C). Any sunable standard means ofvucosity measurement may be used. including capilla:·y or rotational ,·iscomctry.
mlj:r: "4 " d The ph~·sical hardening mde., h accounts for physical hardening lllld 1s calcuhued by h= (S, !S. ) • where l and .;4 indica1c l and :4 hours of condiuonini; of the t:ink asphalt. Condiuoning and testing is conducted at'the designated test temper:nure. Values should be ca.lculaied "1!d reponetl. Si.> the creep soffness after 60 seconds loading lime and mis the slope of the log creep rnffm:ss ''e~sus log time cur"e after 60 secontls loading time.
e The PAV aging tcmperaiure is J00°C. excep1 in desert clima1cs. when: i1 is J l0°C.
lfthc creep stiffness is below 300.000 k.Pa. the direct tension 1est is not required. lfthe creep stiffnesses is be1ween 300.000 and 600.000 k.Pa the direct tension failure strain requirement c:ui be used in lieu of the creep stiffness requirement. The m·\'a.luc requirement must be satisfied in both cases.
Ftn:i.lf.l/W/93
26
Hence, an asphalt binder PG 58-34 would meet the specification for a design high
pavement temperature up to 58°C (136.4°F) and a design low temperature warmer
than -34 °C (-29.2°F) (Huber 1993). Required asphalt binder properties are designed
to maximize beneficial effects of the binder with respect to permanent deformation,
fatigue cracking, and low temperature cracking within the specified environmental
conditions (Kennedy and Moulthrop 1993).
The following rheological properties are measured as part of the specification
(Anderson and Kennedy 1993):
• Tenderness - tank material with a minimum value
of G* /sino measured at the maximum pavement
temperature.
• Rutting - RTFOT residue with a minimum value
of G* /sino measured at the maximum pavement
temperature.
• Thennal cracking - Pressure Aging Vessel (PAV)
residue with a maximum value of stiffness and a
minimum value for the slope of the log stiffness
versus log time curve measured at the minimum
pavement design temperature plus 18°F (10°C).
In addition, a lower limit on the strain to failure
at the minimum pavement design temperature is
specified.
• Fatigue - PAV residue with a maximum value of
G*sino measured at the intermediate pavement
temperature.
The G* and sino parameters used in evaluating tenderness, rutting and fatigue are
measured using a dynamic shear rheometer. In this test, a thin film of asphalt binder
(0.04 in to 0.08) ( 1 to 2 mm) is place<l between two parallel plates and tested in
torsion.
27
The plates are oscillated, and the maximum torque, angular deflection, and phase angle
are recorded. When the plate deflection is greatest at the maximum applied torque,
the material is said to be perfectly elastic, and the phase angle is zero. When the
applied torque is zero at the maximum deflection point, the material is a perfect
viscous fluid, and the phase angle is 90°.
King (1993) describes the specifications as follows: "To control rutting, the complex
modulus (G*) and the phase angle (o) are measured at the maximum pavement service
temperature. In the SHRP binder specification, the modulus term (G* /sino) must be
greater than 2.2 kPa. This value represents the materials resistance to pure viscous
flow, the most relevant binder property relating to permanent deformation. To control
fatigue, the complex modulus and the phase angle are measured at the average
pavement service temperature. In the SHRP binder specification, G*sino must be less
than 5.0 MPa."
Efforts to measure properties of asphalt binders modified with crumb rubber using the
dynamic oscillatory shear rheometer are unsuccessful thusfar in this study. As
described previously, a very thin sample of binder (0.04 to 0.08 in.) (1 to 2 mm) is used
in the test procedure. The crumb rubber itself often exceeds this dimension causing
erroneous test results. While the spacing between the plates may be increased, efforts
to perform this test thus far are producing inconsistent results.
Thermal cracking is evaluated on the binder residue from the pressure aging vessel
(PAV). The PAV simulates what happens to the binder during long-term aging.
SHRP specifies a maximum stiffness at low temperature after accelerated aging to
resist thermal cracking. Stiffness is evaluated using the bending beam rheometer. For
this study, all tests were performed at 5 °F (-15 °C) using the bending beam rheometer.
In this test, a beam of asphalt binder is loaded in the center.
28
The deflection of the beam is measured for 240 seconds. A computer collects the data,
calculates the stiffness (S) at various loading times, and calculates the slope (m) of the
log stiffness versus log time curve. The stiffness after 60 seconds loading time, and the
slope are the reported data.
At low temperatures, asphalt binder becomes very stiff and strain intolerant and
researchers have related cracking resulting from a single low-temperature excursion to
the stiffness of the asphalt cement at the cracking temperature (Anderson and Kennedy
1993). The temperature at which cracking occurs in this mechanism is referred to as
the limiting stiffness temperature. The limiting stiffness temperature is simply the
pavement temperature at which a certain stiffness value is reached after a specified
loading time; at temperatures below this, the pavement will experience thermal
cracking. The low test temperature in the specification is at the critical temperature,
in this case, minimum pavement temperature plus 18°F (10°C). Test results from the
bending beam rheometer are shown in Table 2.7.
According to the SHRP specification, the bending beam test is to be performed on the
PAV residue; however, for research purposes, this test was performed on both the
original binders and the PAV residue. Each test value shown in Table 2.7 for original
binders represents the average of five tests and after PAV represents an average of 2
tests. SHRP requires that the stiffness after PAV be less than 43,511 psi (300 MPa)
and the slope of the log stiffness-log time curve be greater than 0.30.
The bending beam stiffness data are plotted in Figure 2.14. The dashed lines in Figure
2.14 represent binders produced with the fine CRM (-80 mesh) and the solid lines
represent binders produced with the coarse CRM (-10 mesh). Intuitively, one might
expect the CRM binders to be stiffer than neat asphalt cement; however, in the
bending beam test, this is not the case. Generally, as rubber content increases, the
stiffness decreases. Recall that this test is performed at 5 °F (-15 °C) and the
temperature susceptibility of crumb rubber is much less than that of asphalt cement.
29
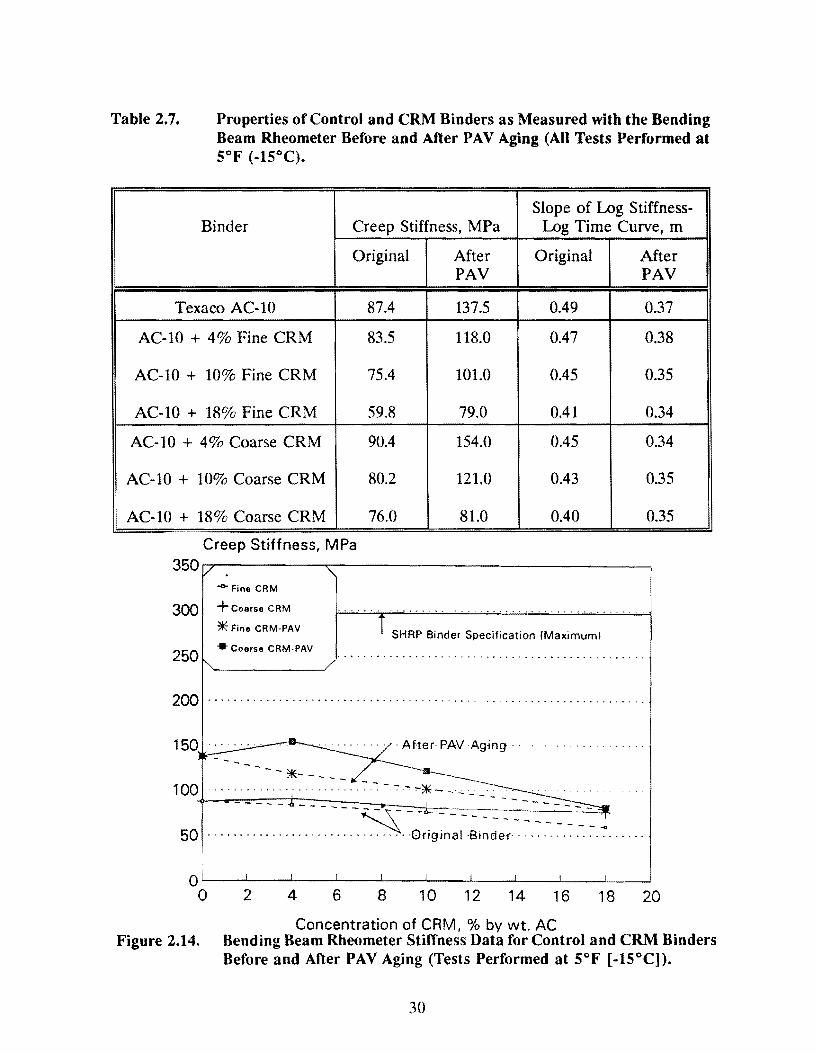
Table 2.7. Properties of Control and CRM Binders as Measured with the Bending Beam Rheometer Before and After PAV Aging (All Tests Performed at 5°F (-15°C).
Slope of Log Stiffness-Binder Creep Stiffness, MPa Log Time Curve, m
Original After Original After PAV PAV
Texaco AC-10 87.4 137.5 0.49 0.37
AC-10 + 4% Fine CRM 83.5 118.0 0.47 0.38
AC-10 + 10% Fine CRM 75.4 101.0 0.45 0.35
AC-10 + 18% Fine CRM 59.8 79.0 0.41 0.34
AC-10 + 4% Coarse CRM 90.4 154.0 0.45 0.34
AC-10 + 10% Coarse CRM 80.2 121.0 0.43 0.35
AC-10 + 18% Coarse CRM 76.0 81.0 0.40 0.35
Creep Stiffness, MPa 350~~~~~--..,~~~~~~~~~~~~~~~
...,_Fine CRM
300 +coarse CRM
*Fine CRM·PAV SHRP Binder Specification !Maximum~
250 •Coarse CRM-PAV
200 ·······················
· · · · ·After· PAV Aging · ·
- - *- - -100 .................... -: .. -: .-: - - ·""' '""* - -· "'- - _. ~
- ---- ------~--_:_ __ ------~~-~~-a 50 · · · · · · · · · · · · · · · · · · · · · · · · ········Original Binder·············· ... · ...
0'--~...._~......_~--'-~~'--~...._~_._~__,_~--l'--~..l_~~
0 2 4 6 8 10 12 14 16 18 20
Concentration of CRM, % by wt. AC Figure 2.14. Bending Beam Rheometer Stiffness Data for Control and CRM Binders
Before and After PAV Aging (Tests Performed at 5°F [-15°C]).
30
Therefore, the higher the concentration of CRM, the lower the temperature
susceptibility of the binder at low temperatures.
One might also expect that the finer gradation of crumb rubber would produce a stiffer
binder than the coarser CRM. Again, the reverse is true in this test procedure. This
may be attributed to the fact that the asphalt film thickness is greater for the coarse
CRM than for the fine CRM thereby producing a greater stiffness.
One may assume, from this data, that if the neat asphalt cement meets the SHRP
specification, then a binder made with crumb rubber added to that asphalt cement will
also meet the specification. Note that the Texaco AC-10 (shown as 0% CRM in Figure
2.14) and, of course, all of the CRM binders have stiffness values well below the
specification maximum of 43,511 psi (300 MPa).
If the creep stiffness is below 43,511 psi (300 MPa), the direct tension test is not
required on the PAV-aged binder; however, this test was performed on the PAV-aged
control and CRM binders for research purposes. The direct tension test measures how
much the binder can be stretched before it breaks. A minimum 1 % elongation (failure
strain) in the direct tension test at the given temperature will qualify a binder for a
grade it may not pass with the bending beam.
Direct tension tests were performed on the control and CRM binders after aging in the
PAV and these results are shown in Figure 2.15. Each data point represents an
average of four tests. According to SHRP specifications, because all of these binders
passed the bending beam test, direct tension testing was not required. Surprisingly,
however, all of the binders except the 18% fine CRM binder failed the direct tension
specification requirement.
Note that at concentrations of fine rubber above 10%, something happens to markedly
enhance failure strain (and thus ostensibly increase resistance to pavement cracking).
31
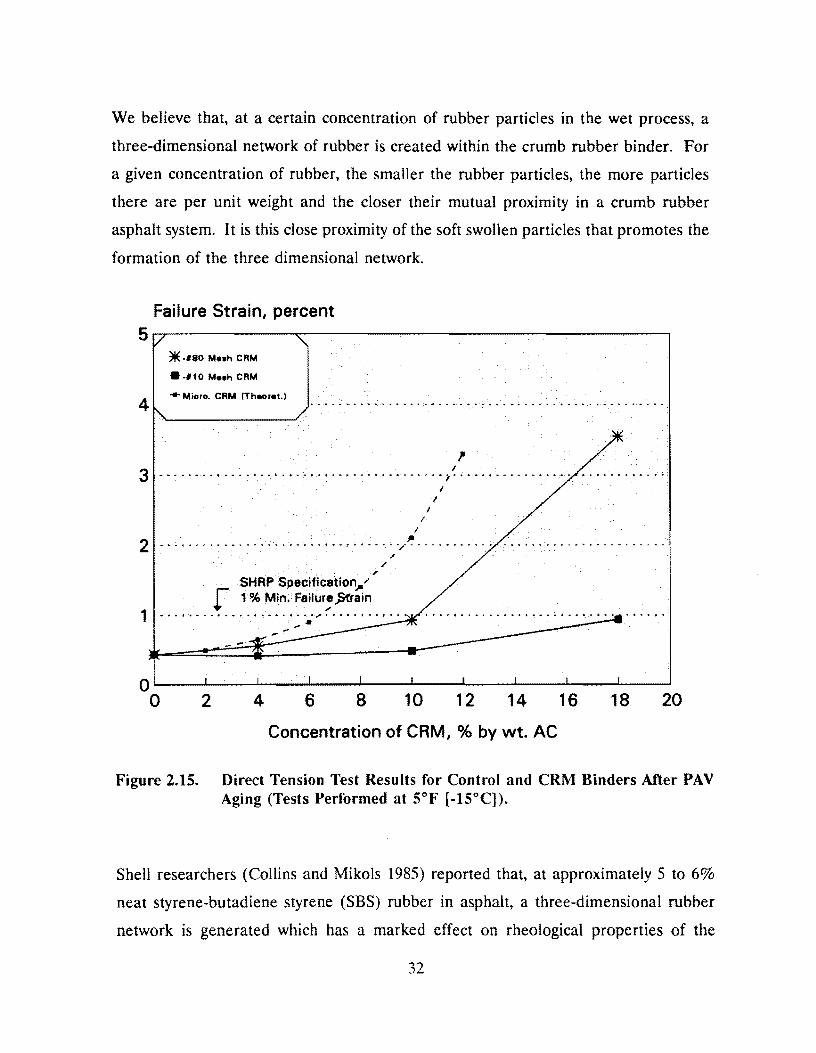
We believe that, at a certain concentration of rubber particles in the wet process, a
three-dimensional network of rubber is created within the crumb rubber binder. For
a given concentration of rubber, the smaller the rubber particles, the more particles
there are per unit weight and the closer their mutual proximity in a crumb rubber
asphalt system. It is this close proximity of the soft swollen particles that promotes the
formation of the three dimensional network.
Failure Strain, percent 5.....,..~~~~~~--..~~~~~~~~~~~~~~~---~~~--.
4
*·180 MHn CRM
•·110 M••h CRM
.. Micro. CRM ITn•or•t.)
I
I I
I I
2 .. ' ... . ·~ . . . . . . . . . . . . .. . . . ' ; ... ' ...... ,,. . . . . . . . . . . . . /
/'
1
SHRP Specification..,." f 1 % Min. Failur~ ,.Strain
--0'------'-------'-~--.__ ___ _.... _____ ....._ _____ ..__ ___ __._ ______ _._ ______ ....._ ___ __,
0 2 4 6 8 10 1 2 14 16 18 20
Concentration of CRM, % by wt. AC
Figure 2.15. Direct Tension Test Results for Control and CRM Binders After PAV Aging (Tests Performed at 5°F [-IS°C]).
Shell researchers (Collins and Mikols 1985) reported that, at approximately 5 to 6%
neat styrene-butadiene styrene (SBS) rubber in asphalt, a three-dimensional rubber
network is generated which has a marked effect on rheological properties of the
32
modified binder. Based on this fact and the data in Figure 2.15, it is surmised that if
tire rubber particles could be reduced to microscopic sizes (as when neat SBS is melted
and blended into asphalt), the three-dimensional network of tire rubber would be
formed at a concentration near 6%.
33

3
Mixture Design
Two methods were used for designing crumb rubber mixtures for further laboratory
characterization: TxDOT's standard method of mixture design (Bulletin C-14) and TxDOT's
method for designing crumb rubber mixtures (Tex-232-F).
Current thinking by most asphalt technologists is that asphalt mixtures containing CRM
should be gap-graded. The formulation used by TxDOT for crumb rubber mixtures is
termed coarse-matrix, high-binder (CMHB). Many of the premature failures which have
occurred with crumb rubber mixtures have been associated with dense-graded aggregate
systems. It is believed that, in a dense-graded mixture, the CRM interferes with the
development of interparticle friction which is needed to transfer the surface loading to the
underlying structure. On the other hand, the CMHB mixture is designed such that the CRM
fills the available voids thereby maintaining stone-to-stone contact.
One of the simplest and most economical methods of incorporating CRM into asphalt
mixtures is by using a generic dry process: adding the CRM to the mixture as part of the
aggregate rather than preblending it with the asphalt cement. This process was evaluated
along with dense-graded aggregates. It is believed that one of the main problems with using
CRM in dense-graded mixtures is that the concentration of CRM has typically been too high
for this type of gradation (18% CRM or more, by weight of the binder). Therefore,
35
standard mixture design procedures (C-14) were used to determine how much CRM could
be added to a Type D mixture (dry) still maintaining all requirements associated with
standard mixture design (acceptable air voids and Hveem stability values).
Dense-graded mixtures were designed using two different gradations of CRM (-#10 mesh
and -#80 mesh) and varying the concentration of CRM. Three concentrations of CRM
were evaluated: 0.2, 0.5 and 0.8% CRM by weight of the aggregate. Of these 3
concentrations, it was determined that 0.5 percent was the optimum concentration of CRM
for these dense-graded mixtures, as will be discussed further. Expressing the CRM
concentration in terms of asphalt content, it is about 10% by weight of the asphalt for the -
#80 CRM and 7% for the -#10 CRM. These mixtures were then characterized using
AAMAS (Von Quintus et al. 1991).
Tex-232-F is a volumetric design procedure for designing coarse-matrix, high-binder
(CHMB) crumb rubber mixtures. This procedure was used to design mixtures that
corresponded with the binders produced in the binder study as well as two other generic dry
mixtures. A discussion of these mixture designs is contained in this chapter.
3.1 Selection of Materials
The aggregates used for the mixture designs included a crushed limestone and field sand.
Care was taken to eliminate the influence of aggregate properties in the evaluation process;
therefore, aggregate from the same source was used for all the mixes. The crushed
limestone was from Gifford Hill in New Braunfels. Limestone screenings were from Texas
Crushed Stone in Georgetown and the field sand was from a local source near Hearne,
Texas. Specific gravities of the aggregate are as follows:
Bulk specific gravity of coarse limestone
Bulk specific gravity of limestone screenings
Bulk specific gravity of field sand
36
2.554,
2.443, and
2.551.
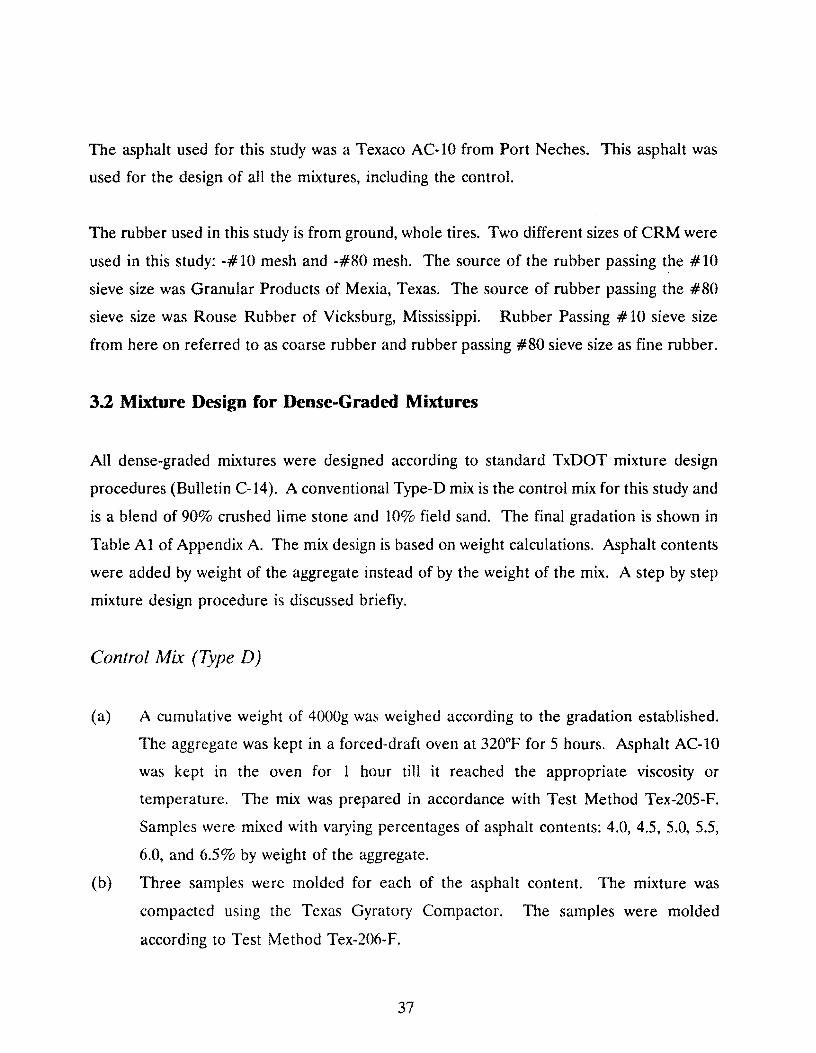
The asphalt used for this study was a Texaco AC-10 from Port Neches. This asphalt was
used for the design of all the mixtures, including the control.
The rubber used in this study is from ground, whole tires. Two different sizes of CRM were
used in this study: -# 10 mesh and -#80 mesh. The source of the rubber passing the # 10
sieve size was Granular Products of Mexia, Texas. The source of rubber passing the #80
sieve size was Rouse Rubber of Vicksburg, Mississippi. Rubber Passing # 10 sieve size
from here on referred to as coarse rubber and rubber passing #80 sieve size as fine rubber.
3.2 Mixture Design for Dense-Graded Mixtures
All dense-graded mixtures were designed according to standard TxDOT mixture design
procedures (Bulletin C-14). A conventional Type-D mix is the control mix for this study and
is a blend of 90% crushed lime stone and 10% field sand. The final gradation is shown in
Table Al of Appendix A. The mix design is based on weight calculations. Asphalt contents
were added by weight of the aggregate instead of by the weight of the mix. A step by step
mixture design procedure is discussed briefly.
Control Mix (Type D)
(a) A cumulative weight of 4000g was weighed according to the gradation established.
The aggregate was kept in a forced-draft oven at 320°F for 5 hours. Asphalt AC-10
was kept in the oven for 1 hour till it reached the appropriate viscosity or
temperature. The mix was prepared in accordance with Test Method Tex-205-F.
Samples were mixed with varying percentages of asphalt contents: 4.0, 4.5, 5.0, 5.5,
6.0, and 6.5% by weight of the aggregate.
(b) Three samples were molded for each of the asphalt content. The mixture was
compacted using the Texas Gyratory Compactor. The samples were molded
according to Test Method Tex-206-F.
37
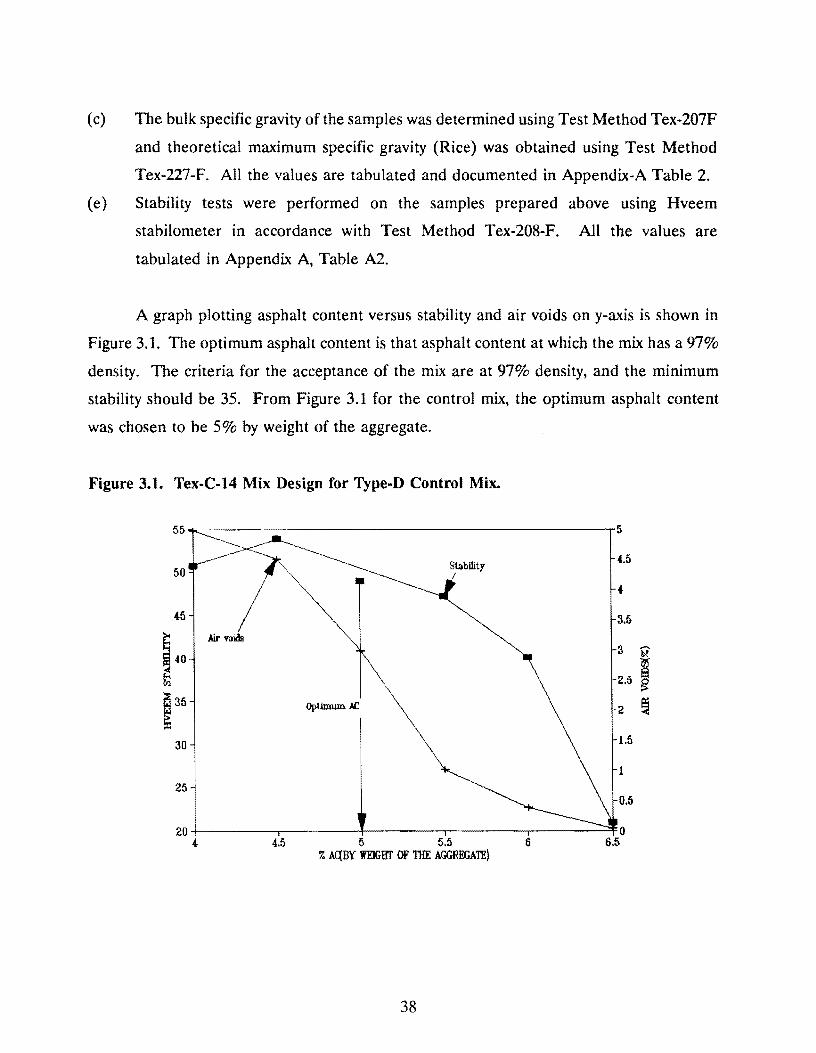
(c) The bulk specific gravity of the samples was determined using Test Method Tex-207F
and theoretical maximum specific gravity (Rice) was obtained using Test Method
Tex-227-F. All the values are tabulated and documented in Appendix-A Table 2.
( e) Stability tests were performed on the samples prepared above using Hveem
stabilometer in accordance with Test Method Tex-208-F. All the values are
tabulated in Appendix A, Table AZ.
A graph plotting asphalt content versus stability and air voids on y-axis is shown in
Figure 3.1. The optimum asphalt content is that asphalt content at which the mix has a 97%
density. The criteria for the acceptance of the mix are at 97% density, and the minimum
stability should be 35. From Figure 3.1 for the control mix, the optimum asphalt content
was chosen to be 5% by weight of the aggregate.
Figure 3.1. Tex-C-14 Mix Design for Type-D Control Mix.
Optimum>£
30 1.5
1
25 0.5
20+1 ~~~~~~~~-t-~~~~...--~~~-.-~~~----'~ 4 4.5 5 5.5 6
% AqBY WflGBT OF 11IE AGGRffiATE)
38
Addition of CRM to Dense-Graded Mixtures
As described earlier, the task here was to determine the optimum rubber content that can
be added dry in the dense graded mix with little or no changes to the gradation. In order
to achieve that, it seemed logical to replace the sand with the equivalent volume amount
of CRM. For the coarse rubber, equivalent volume of field sand retained on #80 sieve was
replaced and for the fine rubber, equivalent volume of #200 was replaced. Initially 0.2%
CRM, by weight of aggregate, was added to the mix. Conventional mix design procedures
were then followed, as previously described, for both fine and coarse CRM mixtures. The
results are tabulated in Appendix B and C respectively. There was a very little change in
stability and optimum asphalt content between these CRM mixtures and the control mix.
The next step was to increase the rubber content in the mix: 0.8% dry rubber by weight of
the mix was then added and the mix design procedure was repeated. Both fine and coarse
rubber mixes failed to meet the requirements i.e., minimum stability of 35 at optimum
density of 97%. Also, significant "swelling" of the samples was observed at this
concentration and this was substantiated by high air voids. Results are tabulated in
Appendices B and C. The relationships between stability, density and % AC contents are
plotted in Figures 3.2 and 3.3.
The above procedure was repeated with 0.5% rubber by weight of the aggregate. These 2
mixes (with coarse and fine rubber) meet the requirements for stability and density as
illustrated in Figures 3.4 and 3.5.
39
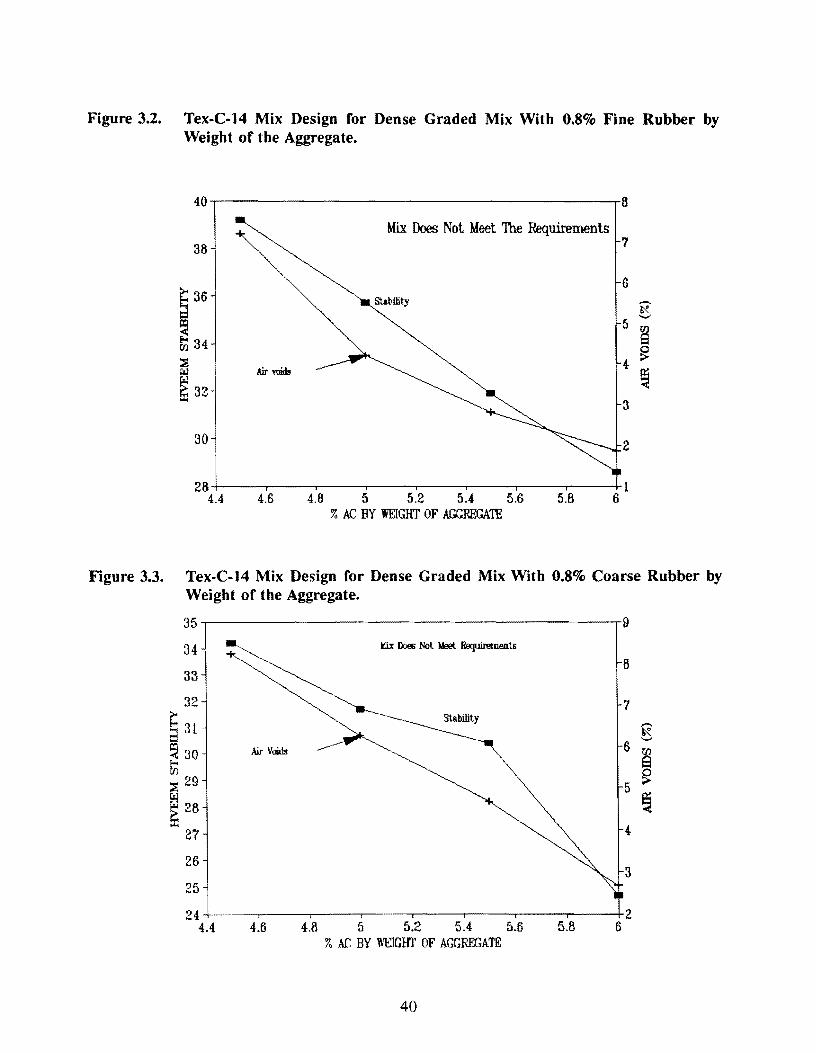
Figure 3.2. Tex-C-14 Mix Design for Dense Graded Mix With 0.8% Fine Rubber by Weight of the Aggregate.
40 8
Mix Does Not Meet The Requirements 36 7
~ 36
6
R' -~ 5 ~ &'j 34
::2 4 ~ w Air voilb ~ ~ 32
3
30 2
26 1 4.4. 4.6 4.8 5 5.2 5.( 5.6 5.B 6
3 AC BY WEIGIIT OF AGGREGATE
Figure 3.3. Tex-C-14 Mix Design for Dense Graded Mix With 0.8% Coarse Rubber by Weight of the Aggregate.
35.--~~~~~~~~~~~~~~~~~~~~-..-9
34
33
32
~ 31 C3 ~ 30 tii ::a 29 w ~ 28
27
26
25
8
7
Air Voids
3
24+-~---,.~~-r-~~.-~-.~~---,-~~,.-~---..,.~~-1-2
4.4 4.6 4.8 5 5.2 5.4 5.6 5.8 6 3 AC BY WEIGIIT OF AGGREGATE
40
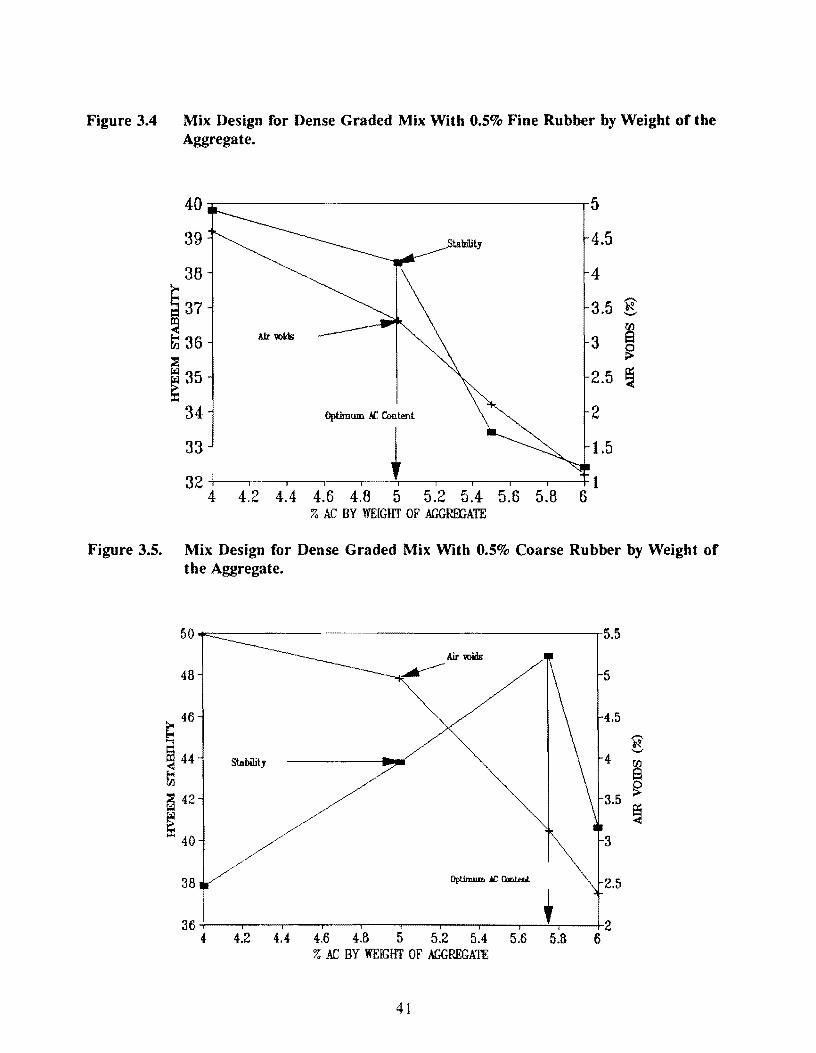
Figure 3.4 Mix Design for Dense Graded Mix With 0.5% Fine Rubber by Weight of the Aggregate.
40 5
39 4.5
36 4
§ 37 3.5 -~ -~ Air voids 8 ti) 36 3
~ )1
~ 35 2.5 ~ 34 Optlmum i£ U:>ntent 2
33 i 1.5
32 1 4 4.2 4.4 4.6 4.8 5 5.2 5.4 5.6 5.8 6
3 AC BY WElGIIT OF AGGRffiATE
Figure 3.5. Mix Design for Dense Graded Mix With 0.5% Coarse Rubber by Weight of the Aggregate.
50 5.5
48 5
~ 46 4.5 ,......_
~ 44 ~ "-..F
St.ability 4 UJ
tn 9
~ 42 3.5 ~
~ ~ 40 3
38 Optimum JC llmtellt 2.5
36 t 2 4 4.2 4:.4 4.6 4.8 5 5.2 5.4 5.6 5.8 6
7. AC BY WEIGfIT OF AGGREGATE
41
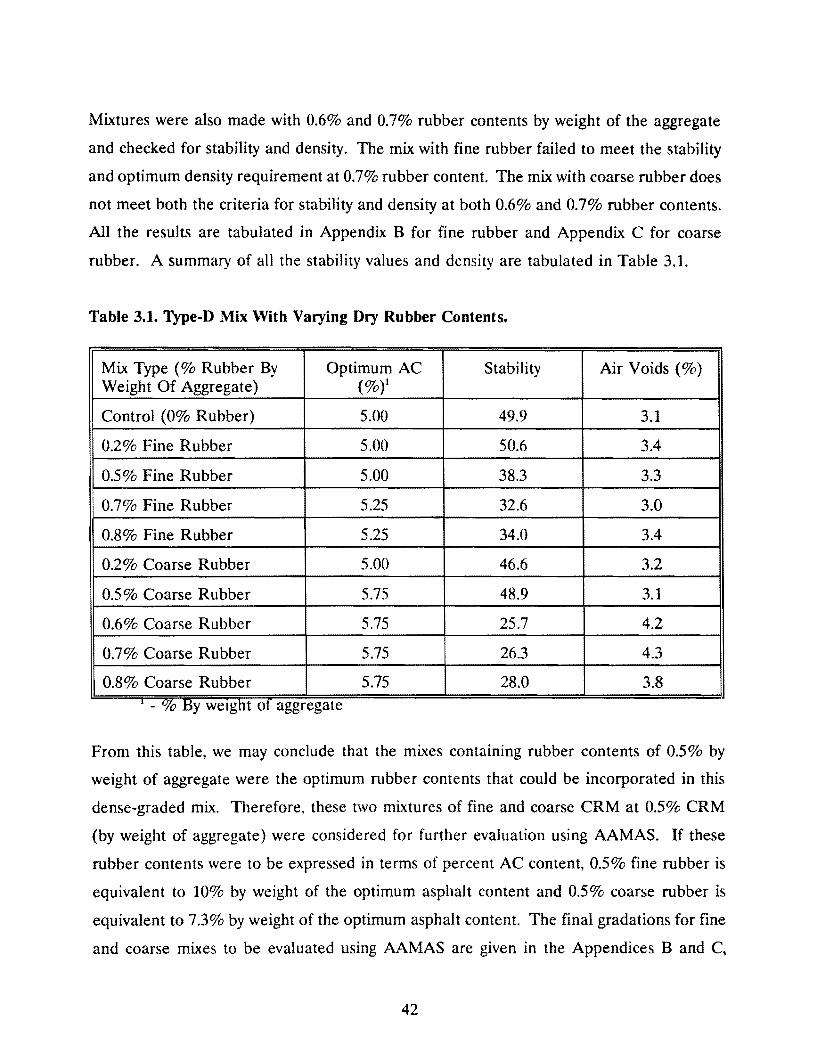
Mixtures were also made with 0.6% and 0.7% rubber contents by weight of the aggregate
and checked for stability and density. The mix with fine rubber failed to meet the stability
and optimum density requirement at 0.7% rubber content. The mix with coarse rubber does
not meet both the criteria for stability and density at both 0.6% and 0.7% rubber contents.
All the results are tabulated in Appendix B for fine rubber and Appendix C for coarse
rubber. A summary of all the stability values and density are tabulated in Table 3.1.
Table 3.1. Type-D Mix With Varying Dry Rubber Contents.
Mix Type(% Rubber By Optimum AC Stability Air Voids(%) Weight Of Aggregate) (%)'
Control (0% Rubber) 5.00 49.9 3.1
0.2% Fine Rubber 5.00 50.6 3.4
0.5% Fine Rubber 5.00 38.3 3.3
0.7% Fine Rubber 5.25 32.6 3.0
0.8% Fine Rubber 5.25 34.0 3.4
0.2% Coarse Rubber 5.00 46.6 3.2
0.5 % Coarse Rubber 5.75 48.9 3.1
0.6% Coarse Rubber 5.75 25.7 4.2
0.7% Coarse Rubber 5.75 26.3 4.3
0.8% Coarse Rubber 5.75 28.0 3.8
' - <ro B' we1 :ht of a y g re ate gg g
From this table, we may conclude that the mixes containing rubber contents of 0.5% by
weight of aggregate were the optimum rubber contents that could be incorporated in this
dense-graded mix. Therefore, these two mixtures of fine and coarse CRM at 0.5% CRM
(by weight of aggregate) were considered for further evaluation using AAMAS. If these
rubber contents were to be expressed in terms of percent AC content, 0.5% fine rubber is
equivalent to 10% by weight of the optimum asphalt content and 0.5% coarse rubber is
equivalent to 7.3% by weight of the optimum asphalt content. The final gradations for fine
and coarse mixes to be evaluated using AAMAS are given in the Appendices B and C,
42
respectively.
3.3 Tex-232-F Mix Design for CMHB CRM Mixtures
Preblending CRM and asphalt prior to incorporation into the hot-mix is known as a "wet"
process. The blending process is explained in detailed in the second chapter. If rubber is
added directly to the aggregate it is called as dry process. Initially it was decided to design
the mixes with rubber contents of 4%, 10% and 18% by weight of the asphalt content;
however, draindown with the 4% CRM binder was excessive, and this binder was eliminated
from the mixture experiment. Two generic dry mixtures were also designed according to this
procedure: 18% fine CRM and 18% coarse CRM (by weight of the asphalt). For
comparison purposes, the dry CRM concentrations are expressed herein as a percentage of
the asphalt.content. These dry mixes are also designed according to Test Method Tex-232-F
and evaluated using AAMAS. Mixture design using Tex-232-F is explained briefly in the
following paragraphs.
This mixture design procedure may be broadly divided into two steps. The first step is to
blend the aggregates and, using varying ratios of coarse to fine aggregates, to obtain the
volume of aggregate retained on # 10 sieve size that yields the maximum density. The
second step is to achieve a 97 ±0.2% density by varying the volume of + # 10 sieve size
material and/ or varying binder content. A flow chart of the mix design procedure is shown
in Figure 3.6.
43
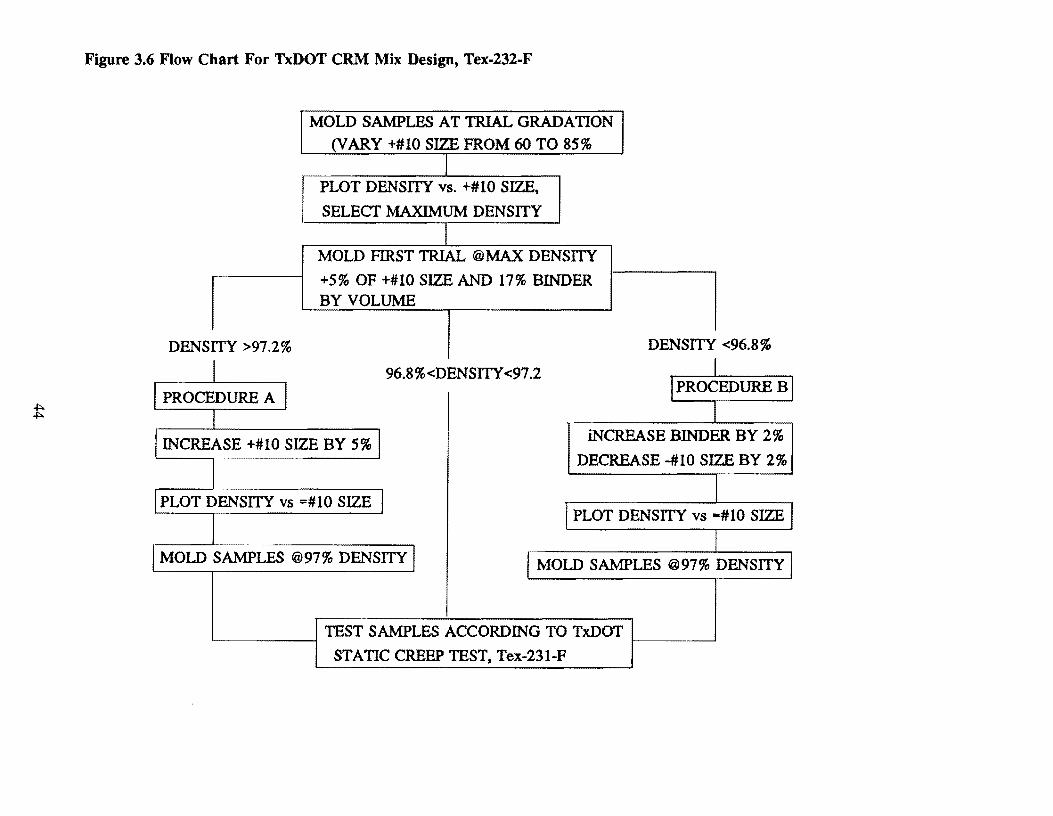
Figure 3.6 Flow Chart For TxDOT CRM Mix Design, Tex-232-F
DENSITY >97.2%
PROCEDURE A
MOLD SAMPLES AT TRIAL GRADATION (VARY +#10 SIZE FROM 60 TO 85%
PLOT DENSITY vs. +#10 SIZE,
SELECT MAXIMUM DENSITY
MOLD FIRST TRIAL @MAX DENSITY
+5% OF +#10 SIZE AND 17% BINDER BY VOLUME
96.8%<DENSITY <97.2
DENSITY <96.8%
PROCEDUREB
INCREASE +#10 SIZE BY 5% iNCREASE BINDER BY 2%
DECREASE-#10 SIZE BY 2%
PLOT DENSITY vs =#10 SIZE PLOT DENSITY vs •#10 SIZE
MOLD SAMPLES @97% DENSITY MOLD SAMPLES @97% DENSITY
TEST SAMPLES ACCORDING TO TxDOT ~-----1 t----~
STATIC CREEP TEST, Tex-231-F
The design criteria for this mix design are listed below:
(a) Minimum voids in the mineral aggregate (VMA) = 20%;
(b) Optimum laboratory molded density = 97%;
(c) Minimum volume of the binder = 17%;
(d) Minimum volume of coarse aggregate (retained on #10 sieve) = optimum volume
of coarse aggregate + 5% (as determined from the density verses volume of coarse
aggregate curve);
( e) Percent aggregate passing #200 sieve = 6%.
STEP 1. To Achieve A Volume Of +#10 Aggregate at Maximum Density
• A sieve analysis was performed and grading factors were determined. Using these
grading factors, trial gradations were found for all six fractions of + # 10 to -# 10 size
material. The fractions are 60/40; 65/35; 70/30; 75/25; 80/20 and 85/15 by weight
of the aggregate.
• Each gradation consisting of the above fractions was mixed with 5% binder. For the
sample preparation, the aggregate and the binder were heated to a temperature of
325 ±5°F in a forced-draft oven. The binder was stirred well before mixing with the
aggregate in order to a have a uniform distribution of the rubber particles. Then the
aggregate and the binder were mixed using a mechanical mixer according to Test
Method Tex-205-F.
• After blending, the mix was kept in a forced-draft oven at 250±5°F till it reached this
temperature. Then 3 samples were molded using the Texas gyratory compactor in
accordance with Test Method Tex-206-F. The samples were left in the molds for 2
hours to eliminate any expansion of the sample due to the rebound of the rubber
particles.
• Theoretical maximum specific gravity was determined in accordance with Tex-227-F.
Also bulk specific gravity and relative density were determined in accordance with
Tex-207-F. A graph was plotted between the volume of aggregate retained on #10
sieve and the relative density. From this plot, the volume and the gradation are
found for the mix that has maximum relative density. All the values are tabulated
and plotted. These tables and graphs are presented in Appendices D through I.
45
STEP 2. To Achieve A Gradation That Has An Optimum Density Of 97±0.2%.
• To the volume fraction determined in step one, 5% of the volume was added to the
+ # 10 sieve size and reduced correspondingly for the -# 10 sieve size. The volume
of the binder was increased to 17%, and then samples were molded as previously
described.
• If the density is between 97 +0.2%, the gradation is acceptable.
• If the density is more than 97±0.2%, 5% (volume) of the + #10 size material is
added.
• If the density is less than 97%, 2% binder is added to the mix and the -#10 size
material is reduced by 2%.
The above steps should be followed until acceptable density is achieved. All the trials for
each mix are presented in the Appendices D through I. The final gradations for all the
mixtures are shown here, as well. These mixtures were then evaluated using AAMAS.
For the dry CRM mixtures, step 1 of this procedure was skipped. This was based on an
assumption that the final aggregate gradation would not be very different whether the
rubber was added dry or wet. However, it was observed that there was some difference in
the gradation as shown in Figure 3.7. This figure shows the amount of material retained on
#10 sieve (by weight) for each mix. All the samples that satisfied the density requirement
of 97 ±0.2% were tested for static creep in accordance with Test Method Tex-231-F. The
test results are tabulated in the appendices.
46
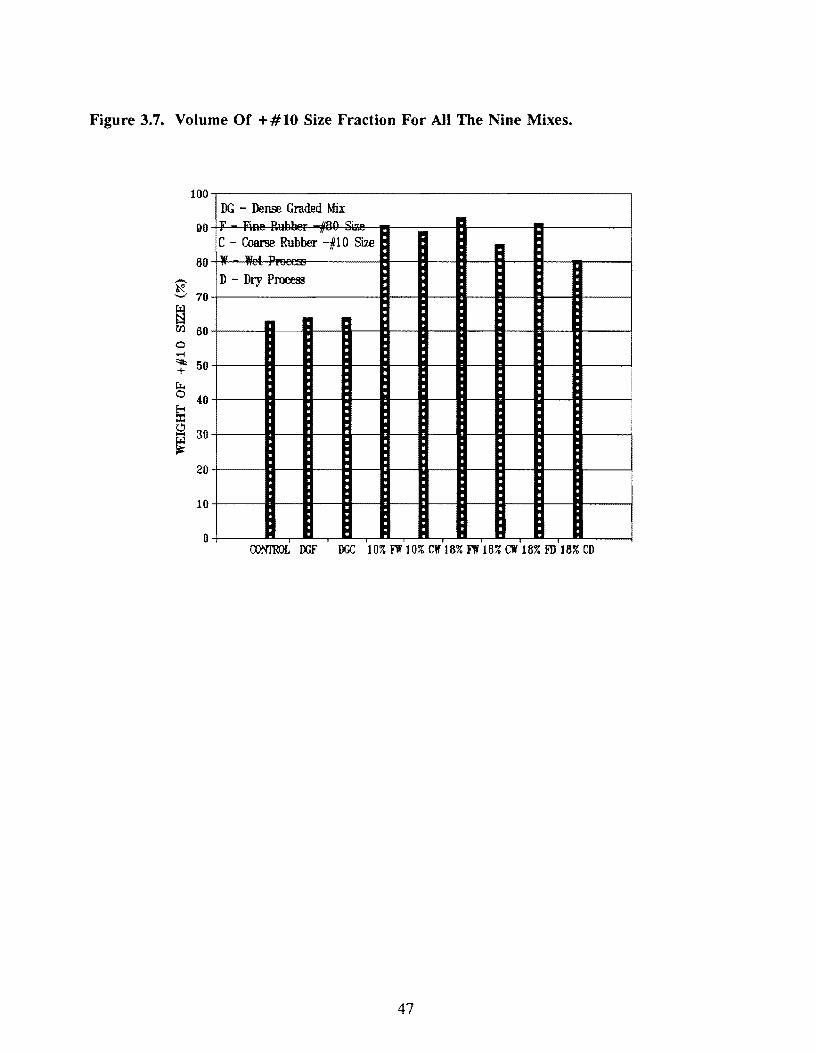
Figure 3.7. Volume Of +#10 Size Fraction For All The Nine Mixes.
100 DG - Dense Graded Mix
90 1:' = n .LL. 110{\ ,.,..
- - II -
C - Coarse Rubber -#10 Size
80 w .. , ..... .a--~
-~ .._, 70 D - Dry Process
~ lfJ 60 0 .... "II:: 50 + r:i:. 0 40
~ g 30 ~
20
10
0 CX>r'ilROL OOF DGC 103FW10%CWl8%FW1B%CW1!13IDl8%CD
47

4
Mixture Performance Evaluation
There are four pavement distresses, resulting from load or environmental conditions,
which are believed to be the most important with respect to reductions in serviceability
and in asphalt pavement performance: fatigue cracking, thermal cracking, permanent
deformation, and moisture damage (Von Quintus et al. 1991). Laboratory evaluations
were performed in accordance with AAMAS test procedures. Appendix J contains a
description of AAMAS as well as a discussion on the preparation of samples. The
following is a discussion of individual test results as well as how these results are
related to these four types of distresses. Individual test results are discussed herein and
all of the data are tabulated in the appendices.
4.1 Rutting
Two types of rutting can occur in asphaltic concrete pavements. These are (1) one
dimensional densification and (2) the lateral movement or plastic flow of asphalt
concrete. The more severe premature rutting failures and distortion of asphaltic
concrete materials are related to lateral flow and loss of shear strength in the mix,
rather than densification (Von Quintus et al. 1991).
One method of evaluating rutting potential was developed by Mahboub and Little
( 1988) and is recommended for use by AAMAS as a "rough" guideline for mixture
evaluation. This method is a graphical solution whereby uniaxial creep data can be
49
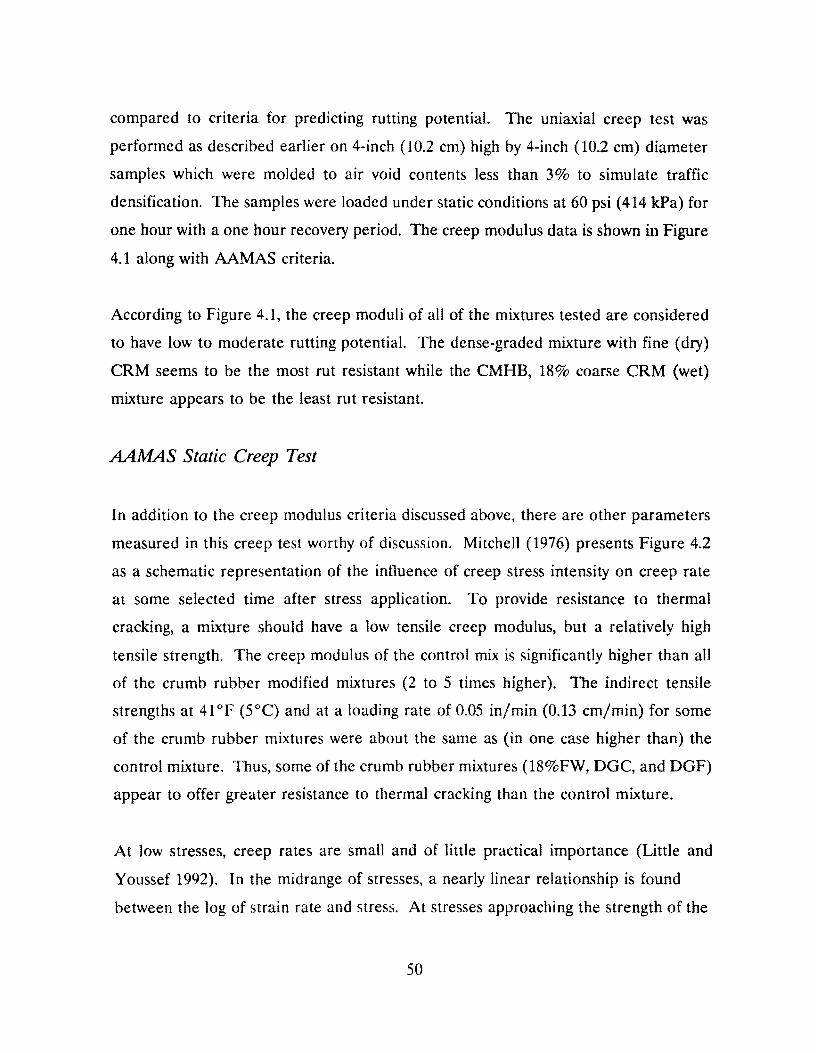
compared to criteria for predicting rutting potential. The uniaxial creep test was
performed as described earlier on 4-inch (10.2 cm) high by 4-inch (10.2 cm) diameter
samples which were molded to air void contents less than 3% to simulate traffic
densification. The samples were loaded under static conditions at 60 psi ( 414 kPa) for
one hour with a one hour recovery period. The creep modulus data is shown in Figure
4.1 along with AAMAS criteria.
According to Figure 4.1, the creep moduli of all of the mixtures tested are considered
to have low to moderate rutting potential. The dense-graded mixture with fine (dry)
CRM seems to be the most rut resistant while the CMHB, 18% coarse CRM (wet)
mixture appears to be the least rut resistant.
AAMAS Static Creep Test
In addition to the creep modulus criteria discussed above, there are other parameters
measured in this creep test worthy of discussion. Mitchell ( 1976) presents Figure 4.2
as a schematic representation of the influence of creep stress intensity on creep rate
at some selected time after stress application. To provide resistance to thermal
cracking, a mixture should have a low tensile creep modulus, but a relatively high
tensile strength. The creep modulus of the control mix is significantly higher than all
of the crumb rubber modified mixtures (2 to 5 times higher). The indirect tensile
strengths at 41°F (5°C) and at a loading rate of 0.05 in/min (0.13 cm/min) for some
of the crumb rubber mixtures were about the same as (in one case higher than) the
control mixture. Thus, some of the crumb rubber mixtures (18%FW, DGC, and DGF)
appear to offer greater resistance to thermal cracking than the control mixture.
At low stresses, creep rates are small and of little practical importance (Little and
Youssef 1992). In the midrange of stresses, a nearly linear relationship is found
between the log of strain rate and stress. At stresses approaching the strength of the
50
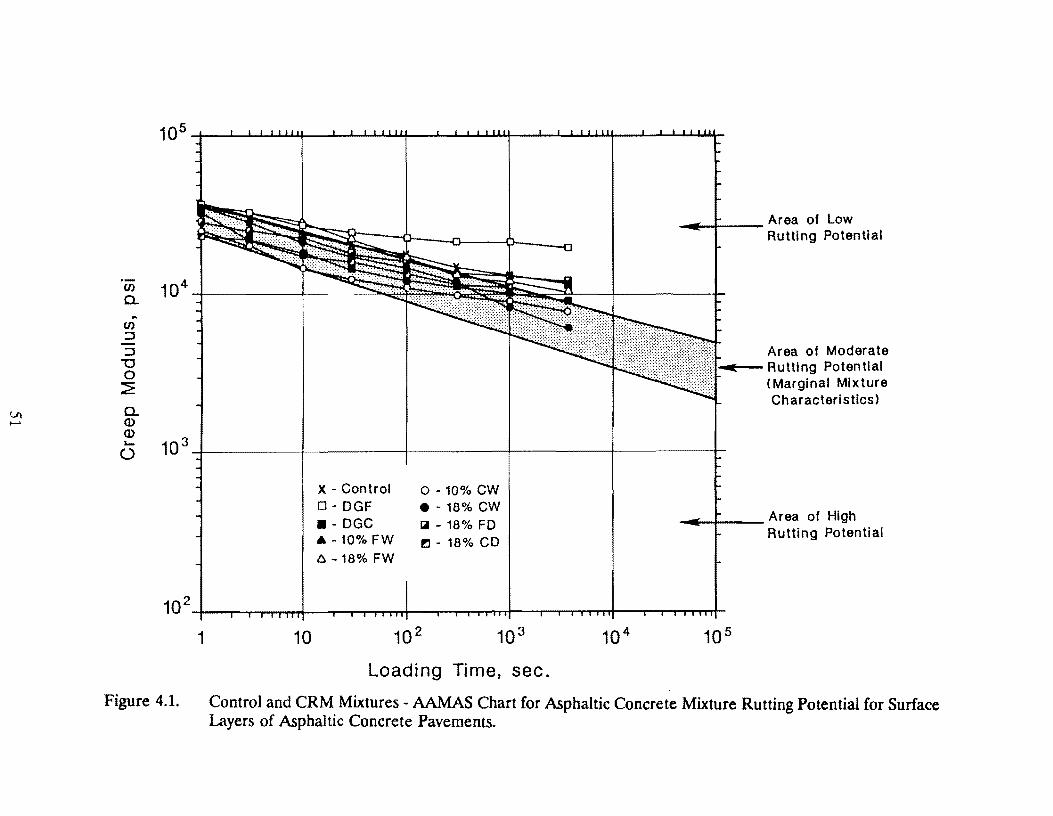
(J)
a. ~
(J) :::::I
:::::I "'O 0 ~
lll a. ....... Q)
Q) "'-
(.)
1
Figure 4.1.
x - Control o - 10% CW D - DGF e - i8% CW • - DGC Iii - 18% FD A - 10% FW 1!1 - 18% CD o-i8%FW
10 10 3
Loading Timet sec.
-.:....-r-- Area of Low Rutting Potential
Area of Moderate '?<:}:!f:}:{:::::;:;1-....:...-- Rutting Potential
<Marginal Mixture Characteristics>
_,,.:....+-- Area of High Rutting Potential
10 5
Control and CRM Mixtures - AAMAS Chart for Asphaltic Concrete Mixture Rutting Potential for Surface Layers of Asphaltic Concrete Pavements.
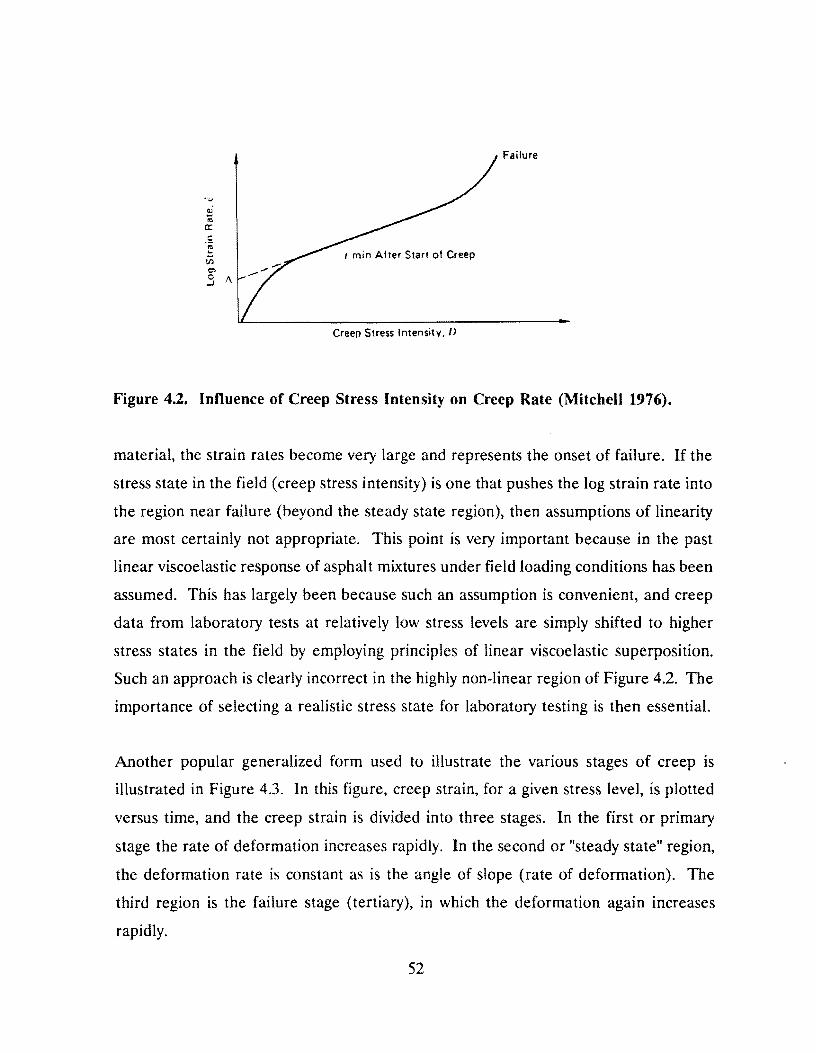
Failure
t min After Start of Creep
Creep Stress Intensity, I>
Figure 4.2. Influence of Creep Stress Intensity on Creep Rate (Mitchell 1976).
material, the strain rates become very large and represents the onset of failure. If the
stress state in the field (creep stress intensity) is one that pushes the log strain rate into
the region near failure (beyond the steady state region), then assumptions of linearity
are most certainly not appropriate. This point is very important because in the past
linear viscoelastic response of asphalt mixtures under field loading conditions has been
assumed. This has largely been because such an assumption is convenient, and creep
data from laboratory tests at relatively low stress levels are simply shifted to higher
stress states in the field by employing principles of linear viscoelastic superposition.
Such an approach is clearly incorrect in the highly non-linear region of Figure 4.2. The
importance of selecting a realistic stress state for laboratory testing is then essential.
Another popular generalized form used to illustrate the various stages of creep is
illustrated in Figure 4.3. In this figure, creep strain, for a given stress level, is plotted
versus time, and the creep strain is divided into three stages. In the first or primary
stage the rate of deformation increases rapidly. In the second or "steady state" region,
the deformation rate is constant as is the angle of slope (rate of deformation). The
third region is the failure stage (tertiary), in which the deformation again increases
rapidly.
52
Failure
Transient or Steady State or
Primary
Strain
Time
Figure 4.3. Stages of Creep (Mitchell 1976).
The relationship between creep strain and logarithm of time may actually be linear,
concave upward, or concave downward. A linear relationship is often assumed for
engineering applications because of its simplicity in analysis. However, there is no
fundamental "law" of behavior to dictate one form or another.
Use of the uniaxial creep test to define the stability and rut susceptibility of asphalt
concrete mixtures has long been a popular approach because of its relative simplicity
and because of the logical ties between the creep test and permanent deformation in
asphalt concrete pavements. The major difficulty in developing criteria associated with
the creep test by which to evaluate the rutting potential of asphalt concrete mixtures
is in relating this criteria to field performance. This is true for all types of lab testing
which must be correlated to field results. However, even without the benefit of
correlations between lab creep tests and field results, it is evident that a stable and rut
resistant mixture should not demonstrate tertiary creep if tested under stresses and at
temperatures in the laboratory which simulate actual field conditions (Little and
53
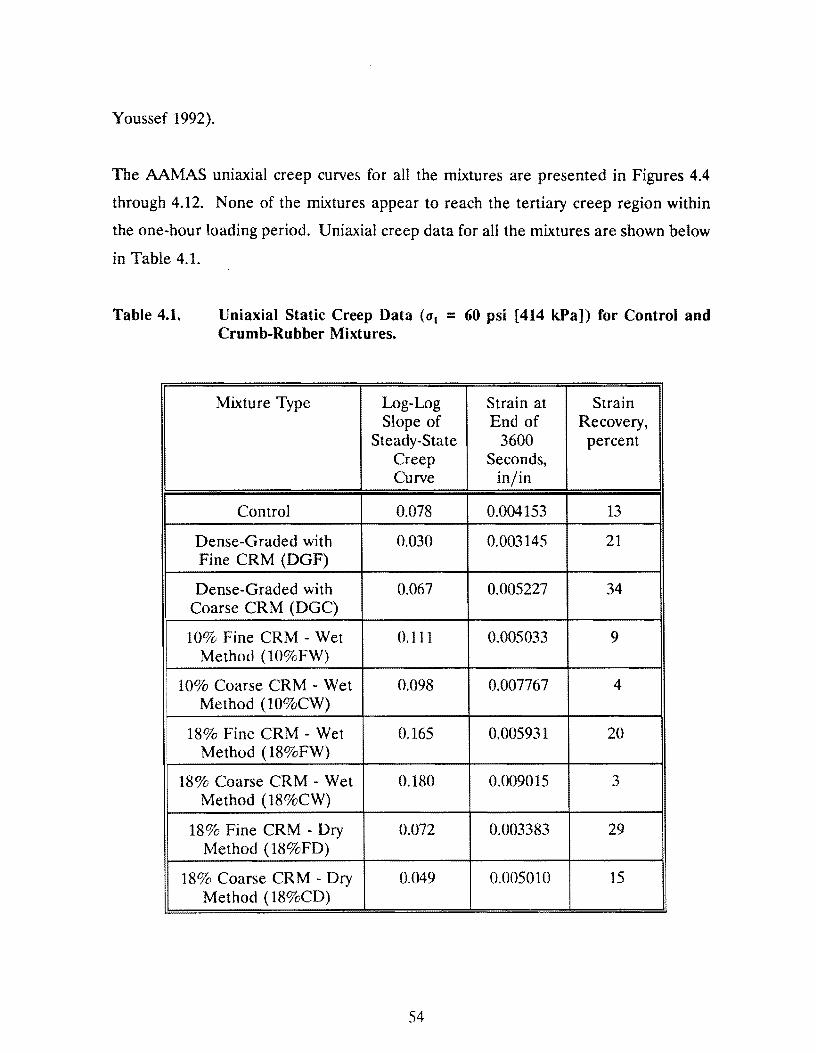
Youssef 1992).
The AAMAS uniaxial creep curves for all the mixtures are presented in Figures 4.4
through 4.12. None of the mixtures appear to reach the tertiary creep region within
the one-hour loading period. Uniaxial creep data for all the mixtures are shown below
in Table 4.1.
Table 4.1. Uniaxial Static Creep Data (u1 = 60 psi [414 k.Pa]) for Control and Crumb-Rubber Mixtures.
Mixture Type Log-Log Strain at Strain Slope of End of Recovery,
Steady-State 3600 percent Creep Seconds, Curve in/in
Control 0.078 0.004153 13
Dense-Graded with 0.030 0.003145 21 Fine CRM (DGF)
Dense-Graded with 0.067 0.005227 34 Coarse CRM (DGC)
10% Fine CRM - Wet 0.111 0.005033 9 Method ( 10%FW)
10% Coarse CRM - Wet 0.098 0.007767 4 Method (10%CW)
18% Fine CRM - Wet 0.165 0.005931 20 Method ( 18%FW)
18% Coarse CRM - Wet 0.180 0.009015 3 Method (18%CW)
18% Fine CRM - Dry 0.072 0.003383 29 Method ( 18%FD)
18% Coarse CRM - Dry 0.049 0.005010 15 Method ( 18%CD)
54
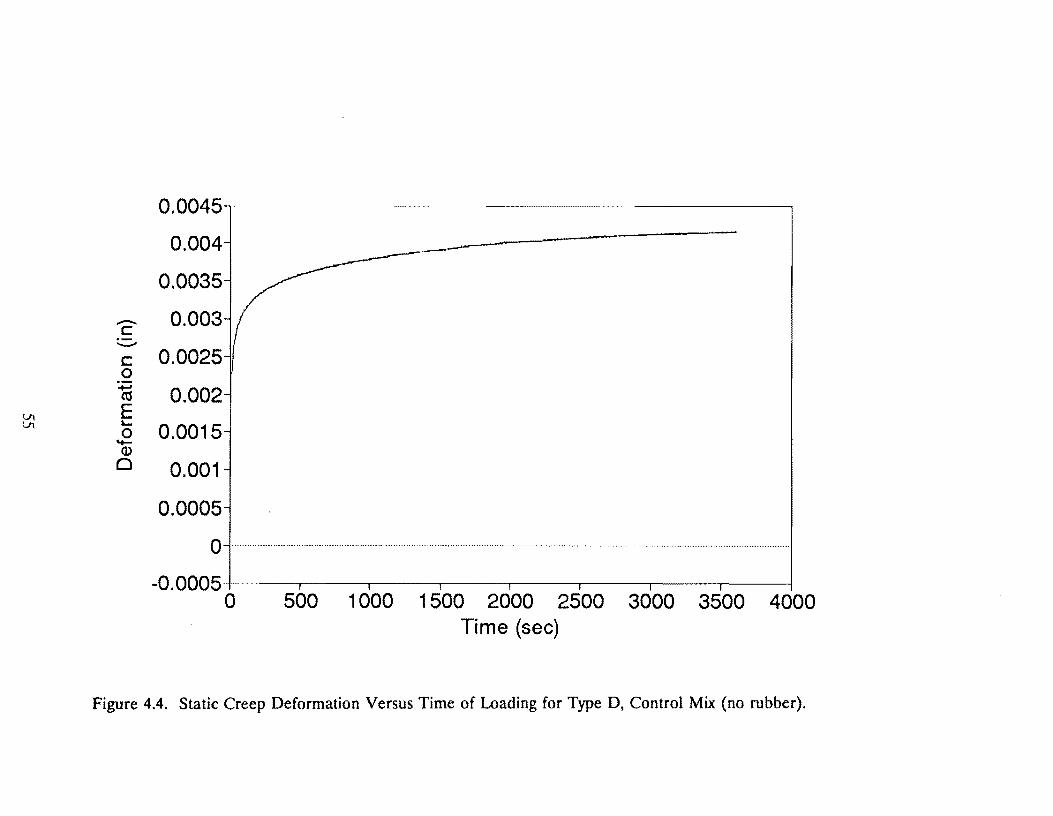
0.0045
0.004
0.0035
- 0.003 c ............
c 0.0025 0
1u 0.002 E "- 0.0015 0 ~ Q)
0 0.001
0.0005
0 ......................................................................................................................................... .
-0. 0005-r-···········-------.--------.---.----.-----.----,-----.-----l 0 500 1000 1500 2000 2500 3000 3500 4000
Time (sec)
Figure 4.4. Static Creep Deformation Versus Time of Loading for Type D, Control Mix (no rubber).
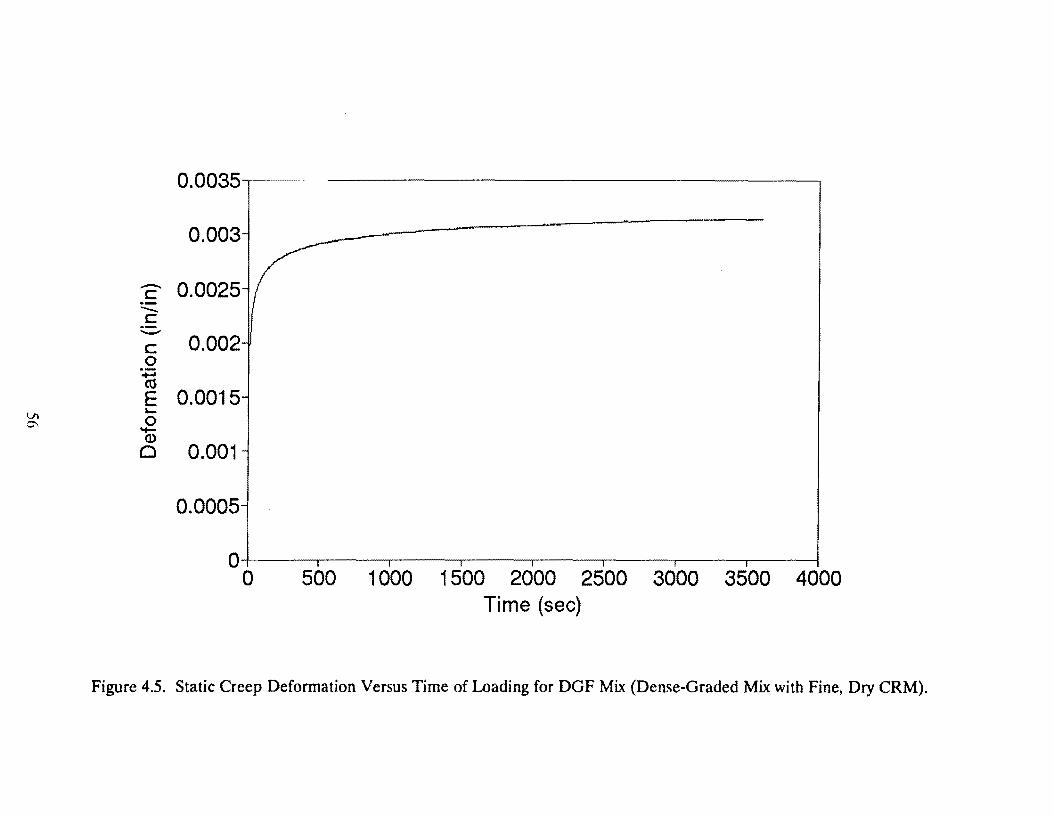
0.0035
0.003-
- 0.0025-c --c -c 0.002-0
1U E 0.0015-"-0 ....... Q)
0 0.001-
0.0005-
0 I I I I I I I
0 500 1000 1500 2000 2500 3000 3500 4000 Time (sec)
Figure 4.5. Static Creep Deformation Versus Time of Loading for DGF Mix (Dense-Graded Mix with Fine, Dry CRM).
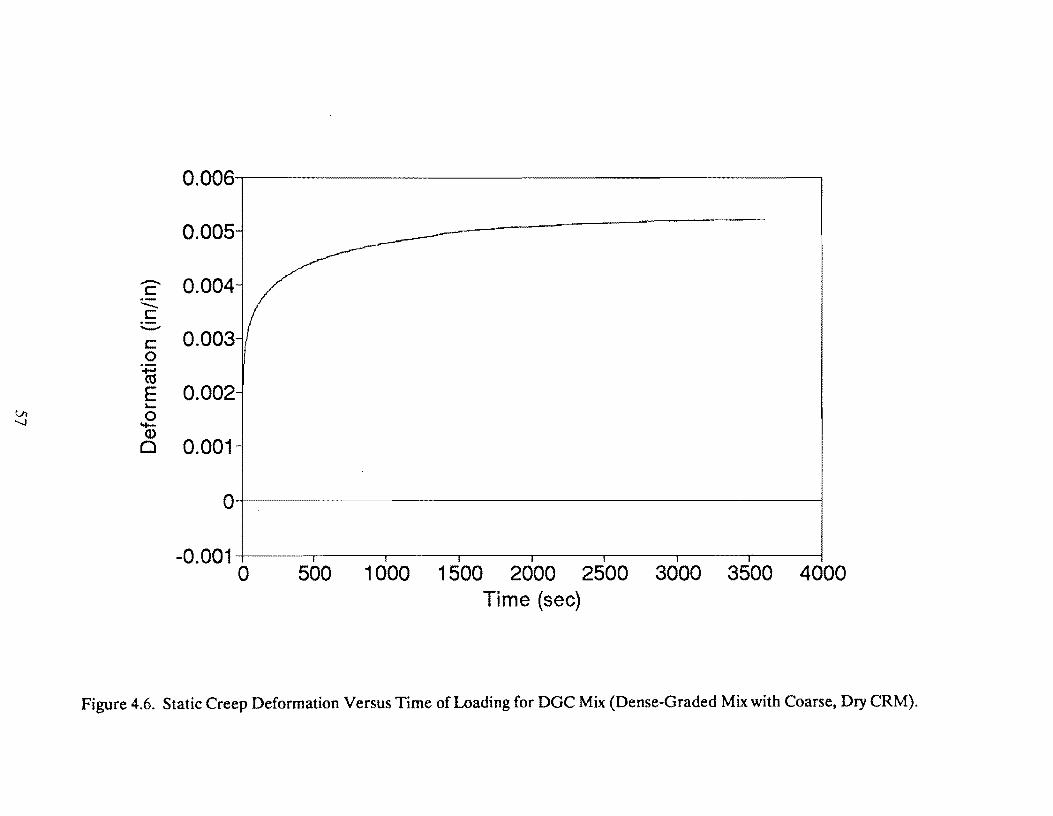
-c: -...... c: -c: 0
1u E a... 0
"+-Q)
0
0.006
0.005
0.004
0.003
0.002
0.001
0
-0.001 0 500 1000 1500 2000 2500 3000 3500 4000
Time (sec)
Figure 4.6. Static Creep Deformation Versus Time of Loading for DGC Mix (Dense-Graded Mix with Coarse, Dry CRM).
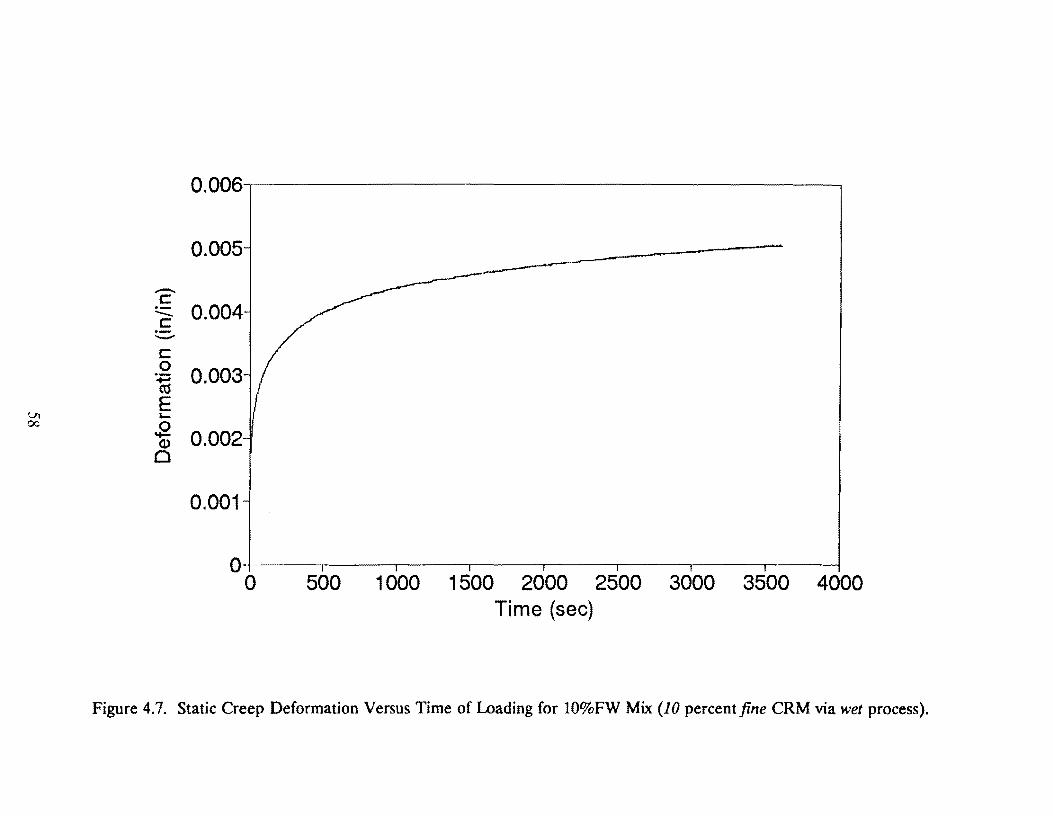
Vi oc
-c --c -c 0
."t;i E ..... 0 -(1)
0
0.006-.--------------------....
0.005
0.004
0.003
0.002
0.001
O+-~~-.-~~-r-~~-.-~~-.-~~--.-~~----.-~~--.---~--1
0 500 1000 1500 2000 2500 3000 3500 4000 Time (sec)
Figure 4.7. Static Creep Deformation Versus Time of Loading for 10%FW Mix (10 percent fine CRM via wet process).
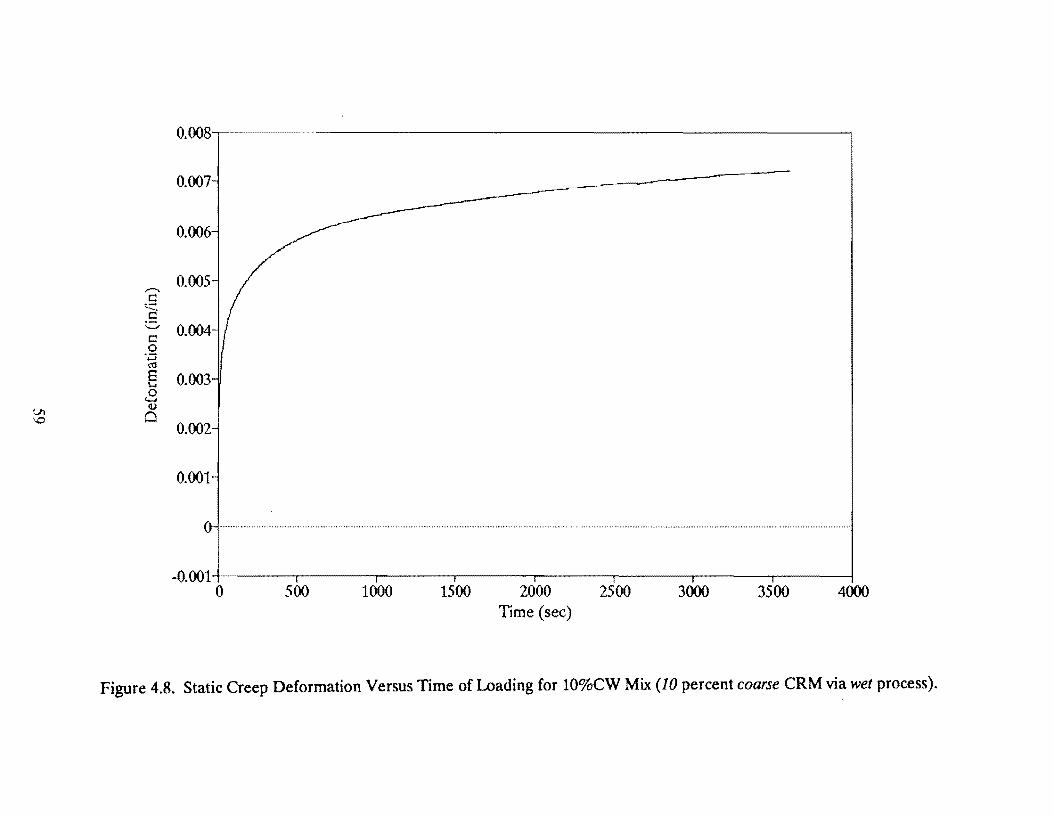
Vl l.O
,,,.....,. c
<.::::'. c
;.:::::, c 0
·.::; ro 8 I-. 0 ...... v 0
0.008
0.007
0.006
0.005
0.004
0.003
0.002
0.001
-0.001-t-----,----.----.----,.-------.---~------_J 0 500 1000 1500 2000
Time (sec) 2500 3000 3500 4000
Figure 4.8. Static Creep Deformation Versus Time of Loading for 10%CW Mix (10 percent coarse CRM via wet process).
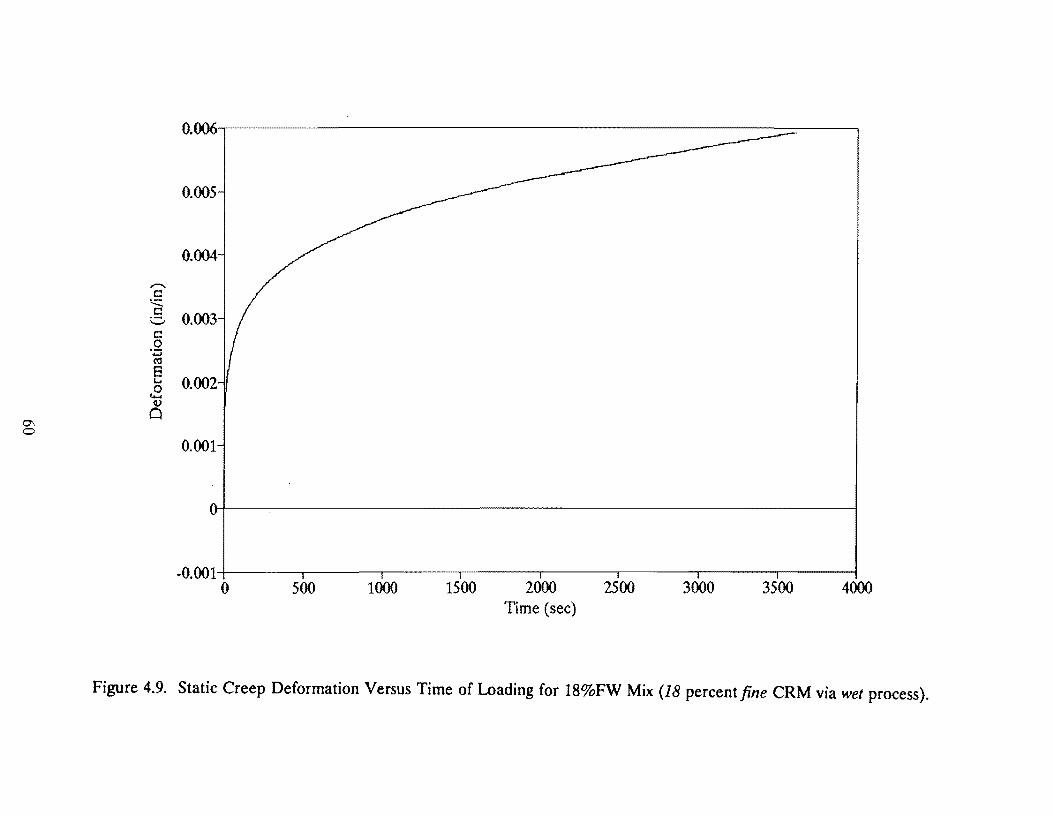
0.005
0.004
,.-.... C!
:.:::::. C! 0.003 v C! 0
·:::::; co 8
0.002 L.. 0
I+...! v a-, a 0
0.001
-O.OOl-1-0 ___ 500~--1--.000 ___ 15.-00 ___ 2-r000 ___ 25100 ___ 3100_0 ___ 35100 __ _,4000
Time (sec)
Figure 4.9. Static Creep Deformation Versus Time of Loading for 18%FW Mix (18 percent.fine CRM via wet process).
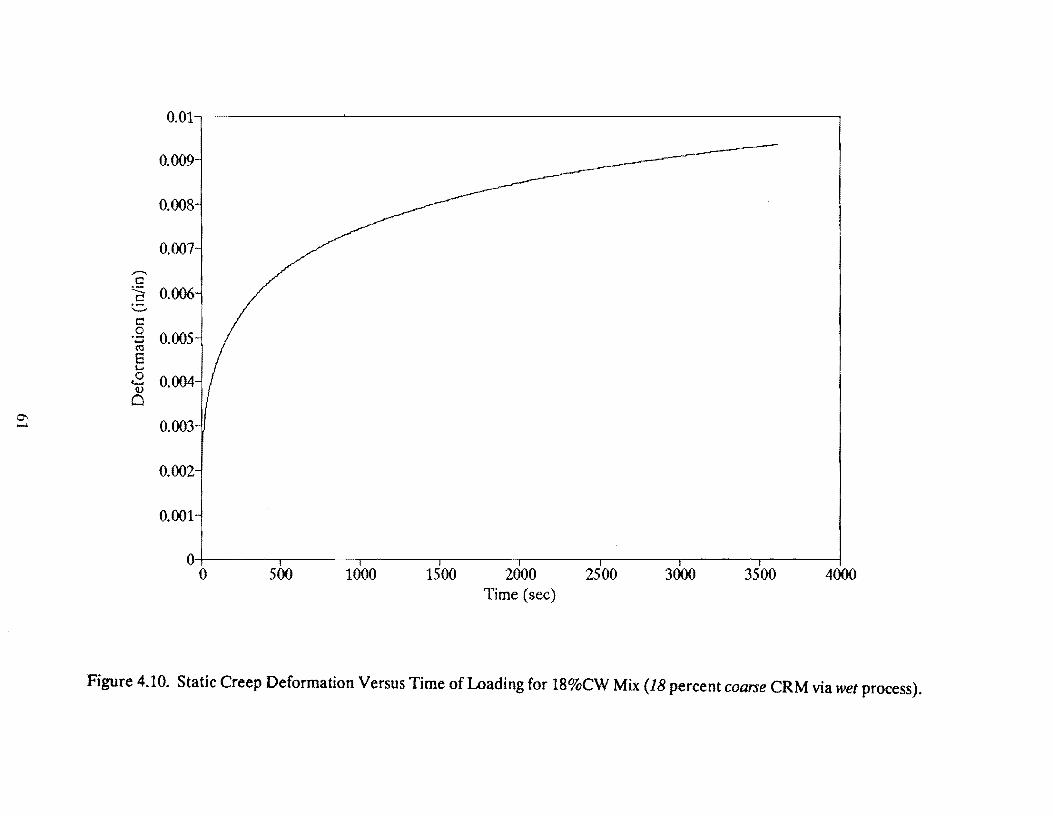
0.01
0.009
0.008
0.007 ,.........,, c:: ~ 0.006 c :.::..-c 0
0.005 ·;:::; ro 8 s.... 0 0.004 ....... Q.)
Cl
0.003
0.002
0.001
0 0 500 1000 1500 2000
Time (sec) 2500 3000 3500 4000
Figure 4.10. Static Creep Deformation Versus Time of Loading for 18%CW Mix (18 percent coarse CRM via wet process).
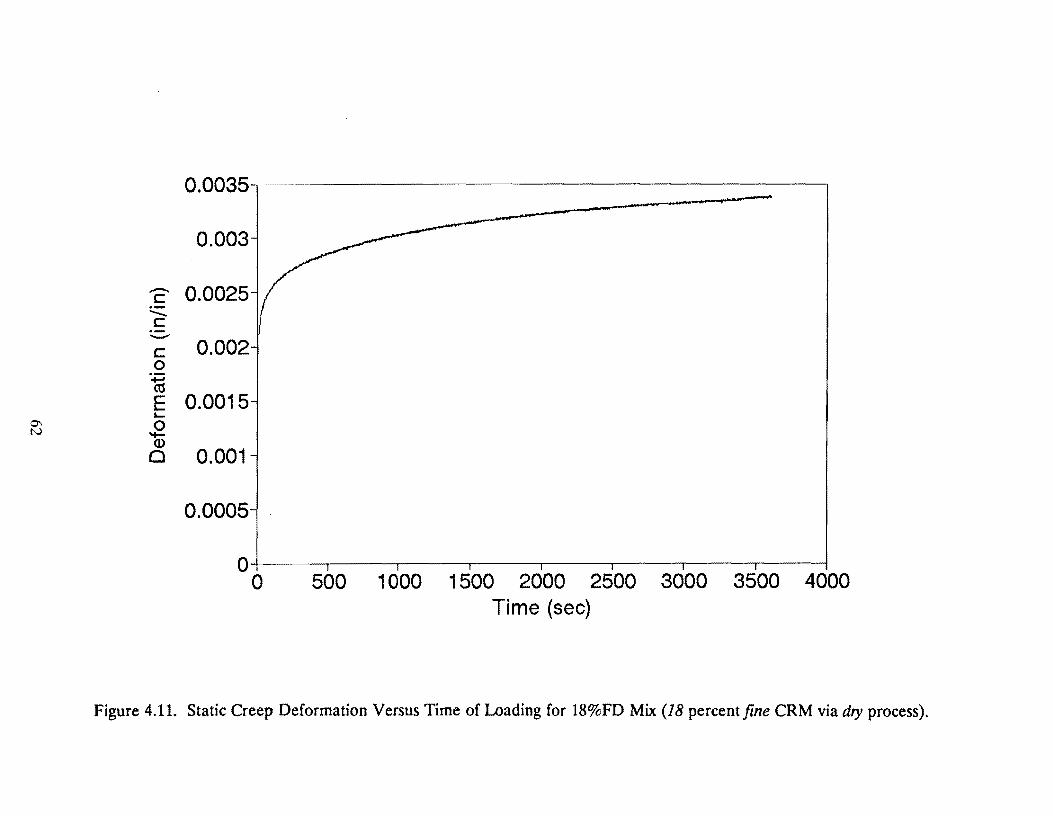
0.0035
0.003
- 0.0025 c :.::::::. c -c 0.002 0
1a E 0.0015 ..... 0 ..... <D
0 0.001
0.0005
0 0 500 1000 1500 2000 2500 3000 3500 4000
Time (sec)
Figure 4.11. Static Creep Deformation Versus Time of Loading for 18%FD Mix (18 percent fine CRM via dry process).
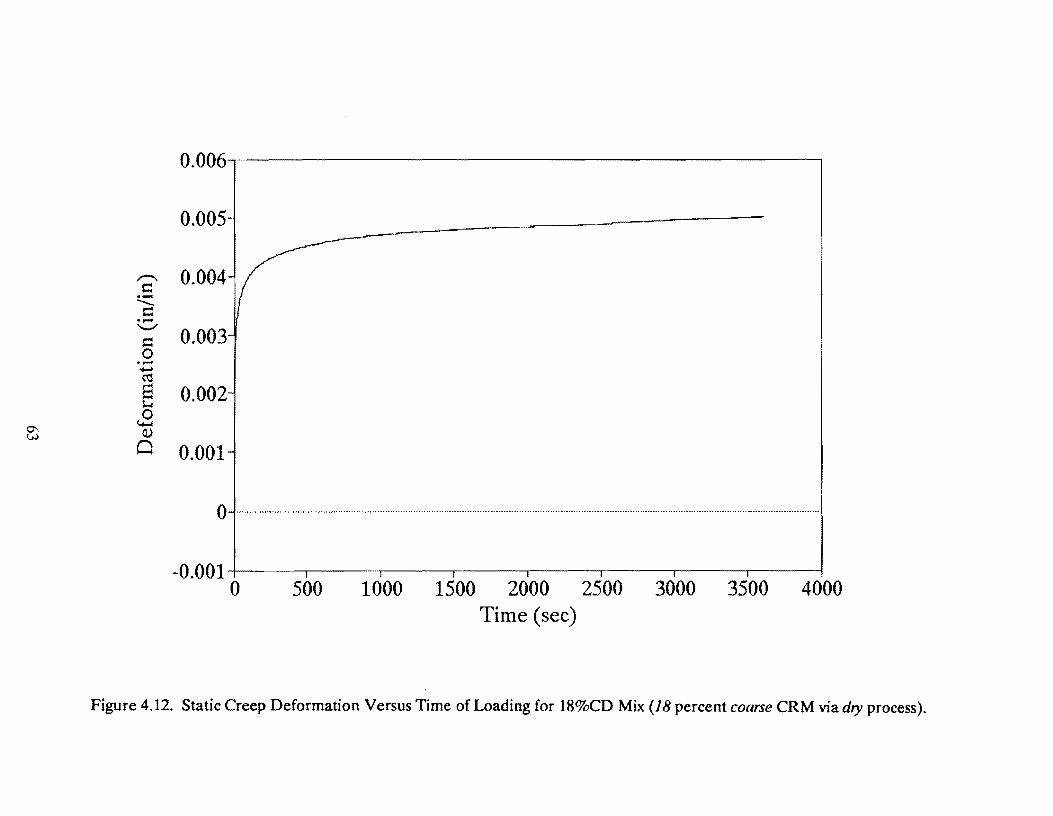
0.006---------------------.,
0.005-
,,-.... 0.004-c:: ·--.... c:: ·-'-"' 0.003-c:: 0 ·-........ ("a
8 0.002-1-1 0
°' (,j....t
w Q)
a 0.001-
0-··········· .. ····················· ............................................................................................................................................................................................. ..
-0.001-1-~~~l~~~-.--l~~~,~~---,.--------~,--------.,---~---,.--~----4
0 500 1000 1500 2000 2500 3000 3500 4000 Time (sec)
Figure 4.12. Static Creep Deformation Versus Time of Loading for 18%CD Mix (18 percent coarse CRM via dry process).
A log·log slope of the creep versus time of loading curve (as shown in Table 4.1) of
less than 0.25 is indicative of a mixture which will not become unstable (reach tertiary
creep) within the testing period of 3,600 seconds (Little and Youssef 1992). All of the
mixtures shown here have a slope less than 0.25. When observing the curves in Figures
4.4 through 4.12 and the slope data in Table 4.1, it does appear that some mixtures
have significantly higher slopes than others. However, each of these slopes represents
an average of three tests and a statistical analysis performed on these data revealed
that none of these mixtures are significantly different from each other in terms of slope
of the creep curve in the steady·state region.
The resilience offered by the aggregate and crumb rubber matrix should be considered
if practicable in order to evaluate the permanent deformation potential of the mixture.
Probably the most direct and simplest way to account for the effects of the
aggregate/crumb rubber matrix on the resilience or "recoverability" of the mixture is
by performing a recovery test immediately following the creep test. This allows one
to judge the effects of the resilience or "recoverability" of the aggregate/crumb rubber
matrix on the performance of the entire mixture.
After the 1-hour loading period in the creep test, there is a 1-hour recovery period.
The percent strain recovered at the end of the 1-hour recovery is shown in Table 4.1.
It appears, from this data. that the 2 dense-graded CRM mixtures (DGF and DGC)
which have a similar gradation as the control have a much better recovery than the
control. The dense-graded/fine CRM mixture had a higher creep stiffness at 3,600
seconds than the dense-graded/coarse CRM mixture. However, the dense
graded/coarse CRM mixture had a better recovery. Of the CMHB rubber mixtures,
all but three ( 10%FW, 10%CW, and 18% CW) had a better recovery than the control
mixture.
Based on the total strain at the end of the test, the mixtures were grouped into three
categories in order to rank the mixtures from best to worst. The following criteria were
arbitrarily selected for categorizing the mixtures using the total strain at the end of the
64
static creep test:
Category 1
Category 2
Category 3
Total strain < 0.005 in/in,
Total strain between 0.005 and 0.0075 in/in, and
Total strain between 0.0075 and 0.0010 in/in.
Based on these criteria the laboratory mixtures can be categorized as follows (Category
1 mixtures being the best in terms of total strain at one hour):
Category 1:
Category 2:
Category 3:
18%FD (18% Fine CRM - Dry Method),
DGF (Dense-Graded with Fine CRM),
Control (Type D - no rubber);
18%CD (18% Coarse CRM - Dry Method),
10%FW (10% Fine CRM - Wet Method),
DGC (Dense-Graded with Coarse CRM),
18%FW ( 18% Fine CRM - Wet Method); and
10%CW (10% Coarse CRM - Wet Method),
18%CW (18% Coarse CRM - Wet Method).
It should again be emphasized that these criteria were arbitrarily selected in order to
rank the mixtures for comparison with each other. The criteria is not related to field
performance. In fact, based on AAMAS criteria in Figure 4.1, all of the mixtures
above except 2 (10%CW and 18%CW) have a modulus at 1 hour loading considered
to provide for low rutting potential. The 10%CW and 18%CW mixtures would be
considered to have marginal mixture characteristics.
Repeated Load Uniaxial Creep Testing
The repeated load uniaxial creep test was performed to more closely simulate wheel
65
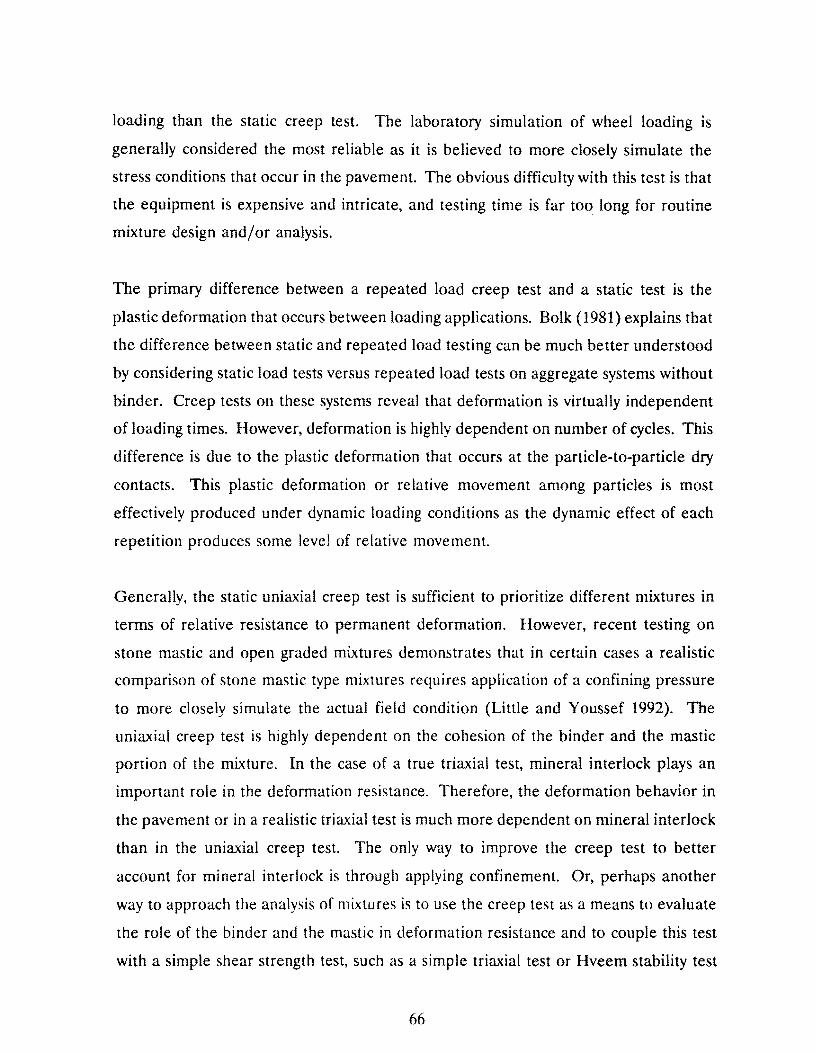
loading than the static creep test. The laboratory simulation of wheel loading is
generally considered the most reliable as it is believed to more closely simulate the
stress conditions that occur in the pavement. The obvious difficulty with this test is that
the equipment is expensive and intricate, and testing time is far too long for routine
mixture design and/ or analysis.
The primary difference between a repeated load creep test and a static test is the
plastic deformation that occurs between loading applications. Bolk (1981) explains that
the difference between static and repeated load testing can be much better understood
by considering static load tests versus repeated load tests on aggregate systems without
binder. Creep tests on these systems reveal that deformation is virtually independent
of loading times. However, deformation is highly dependent on number of cycles. This
difference is due to the plastic deformation that occurs at the particle-to-particle dry
contacts. This plastic deformation or relative movement among particles is most
effectively produced under dynamic loading conditions as the dynamic effect of each
repetition produces some level of relative movement.
Generally, the static uniaxial creep test is sufficient to prioritize different mixtures in
terms of relative resistance to permanent deformation. However, recent testing on
stone mastic and open graded mixtures demonstrates that in certain cases a realistic
comparison of stone mastic type mixtures requires application of a confining pressure
to more closely simulate the actual field condition (Little and Youssef 1992). The
uniaxial creep test is highly dependent on the cohesion of the binder and the mastic
portion of the mixture. In the case of a true triaxial test, mineral interlock plays an
important role in the deformation resistance. Therefore, the deformation behavior in
the pavement or in a realistic triaxial test is much more dependent on mineral interlock
than in the uniaxial creep test. The only way to improve the creep test to better
account for mineral interlock is through applying confinement. Or, perhaps another
way to approach the analysis of mixtures is to use the creep test as a means to evaluate
the role of the binder and the mastic in deformation resistance and to couple this test
with a simple shear strength test, such as a simple triaxial test or Hveem stability test
66
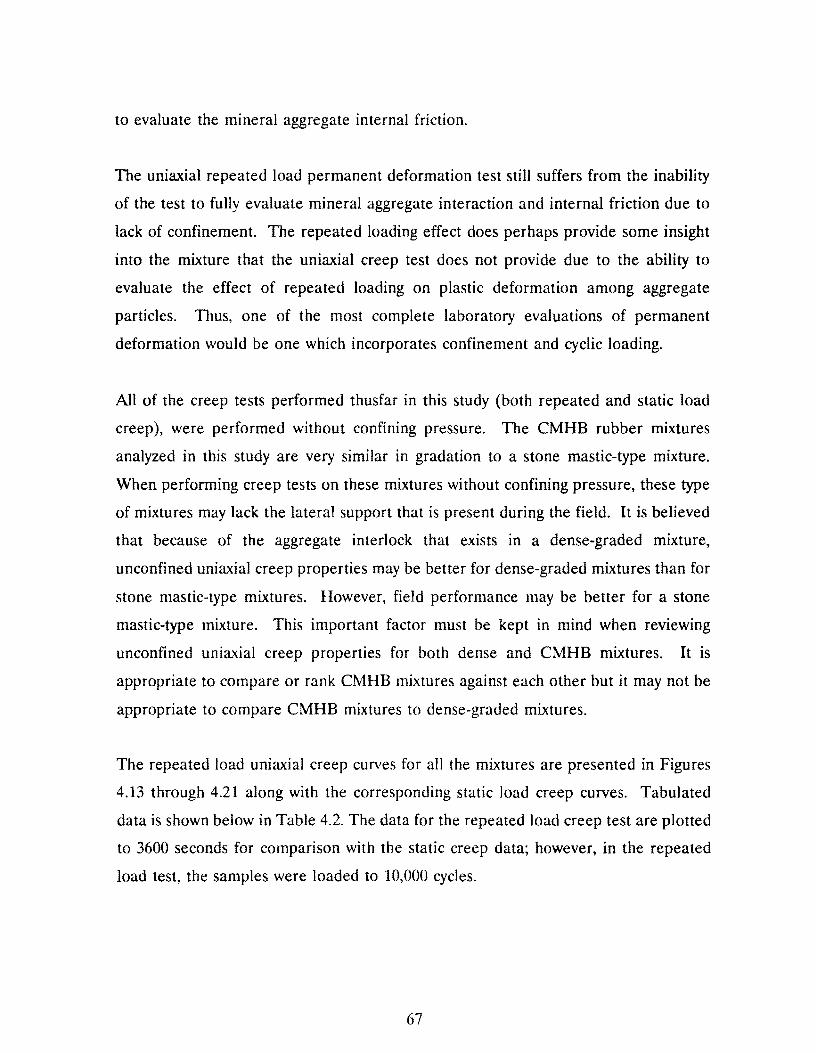
to evaluate the mineral aggregate internal friction.
The unia.xial repeated load permanent deformation test still suffers from the inability
of the test to fully evaluate mineral aggregate interaction and internal friction due to
lack of confinement. The repeated loading effect does perhaps provide some insight
into the mixture that the unia.xial creep test does not provide due to the ability to
evaluate the effect of repeated loading on plastic deformation among aggregate
particles. Thus, one of the most complete laboratory evaluations of permanent
deformation would be one which incorporates confinement and cyclic loading.
All of the creep tests performed thusfar in this study (both repeated and static load
creep), were performed without confining pressure. The CMHB rubber mixtures
analyzed in this study are very similar in gradation to a stone mastic-type mixture.
When performing creep tests on these mixtures without confining pressure, these type
of mixtures may lack the lateral support that is present during the field. It is believed
that because of the aggregate interlock that exists in a dense-graded mixture,
unconfined uniaxial creep properties may be better for dense-graded mixtures than for
stone mastic-type mixtures. However, field performance may be better for a stone
mastic-type mixture. This important factor must be kept in mind when reviewing
unconfined uniaxial creep properties for both dense and CMHB mixtures. It is
appropriate to compare or rank CMHB mixtures against each other but it may not be
appropriate to compare CMHB mixtures to dense-graded mixtures.
The repeated load uniaxial creep curves for all the mixtures are presented in Figures
4.13 through 4.21 along with the corresponding static load creep curves. Tabulated
data is shown below in Table 4.2. The data for the repeated load creep test are plotted
to 3600 seconds for comparison with the static creep data; however, in the repeated
load test, the samples were loaded to 10,000 cycles.
67
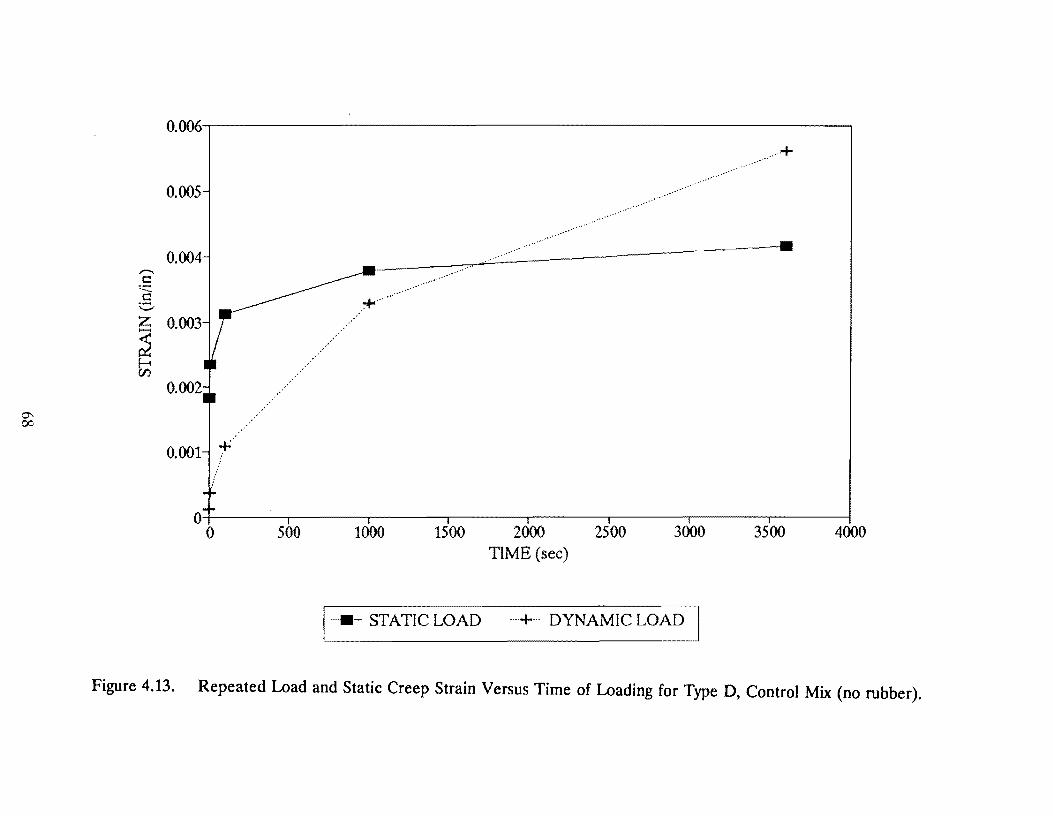
-. c
::.:::::. c c z .......
~ ~
0.005
0.004
0.003
0.002
+· 0.001
01~0=------~_:_-,--~~--.-~~--,~~~.-~~---.~~~3000~~~3-5roo-:--~-4~000 500 1000 1500 2000 2500 TIME (sec)
j-11- STATIC LOAD ···+ .. DYNAMIC LOAD
Figure 4.13. Repeated Load and Static Creep Strain Versus Time of Loading for Type D, Control Mix (no rubber).
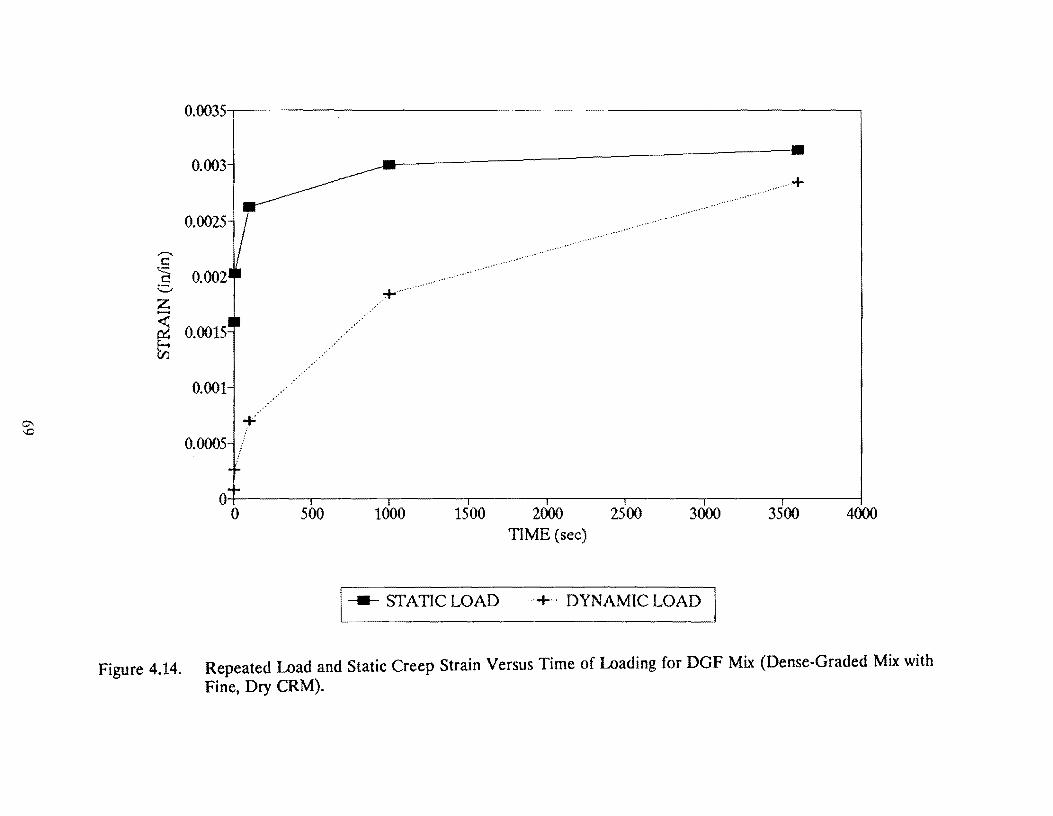
0.0035 . ..,---------------------------
0.003
0.0025
........._ c
<.::::'. c 0.002 c,
z
~ 0.0015
0.001
0.0005
500
.. ··
1000
..... · .....
....... -·
1500 2000 2500 TIME (sec)
3000
1---STATICLOAD --·+·-- DYNAMICLOAD
.. +
3500 4000
Figure 4.14. Repeated Load and Static Creep Strain Versus Time of Loading for DGF Mix (Dense-Graded Mix with Fine, Dry CRM).
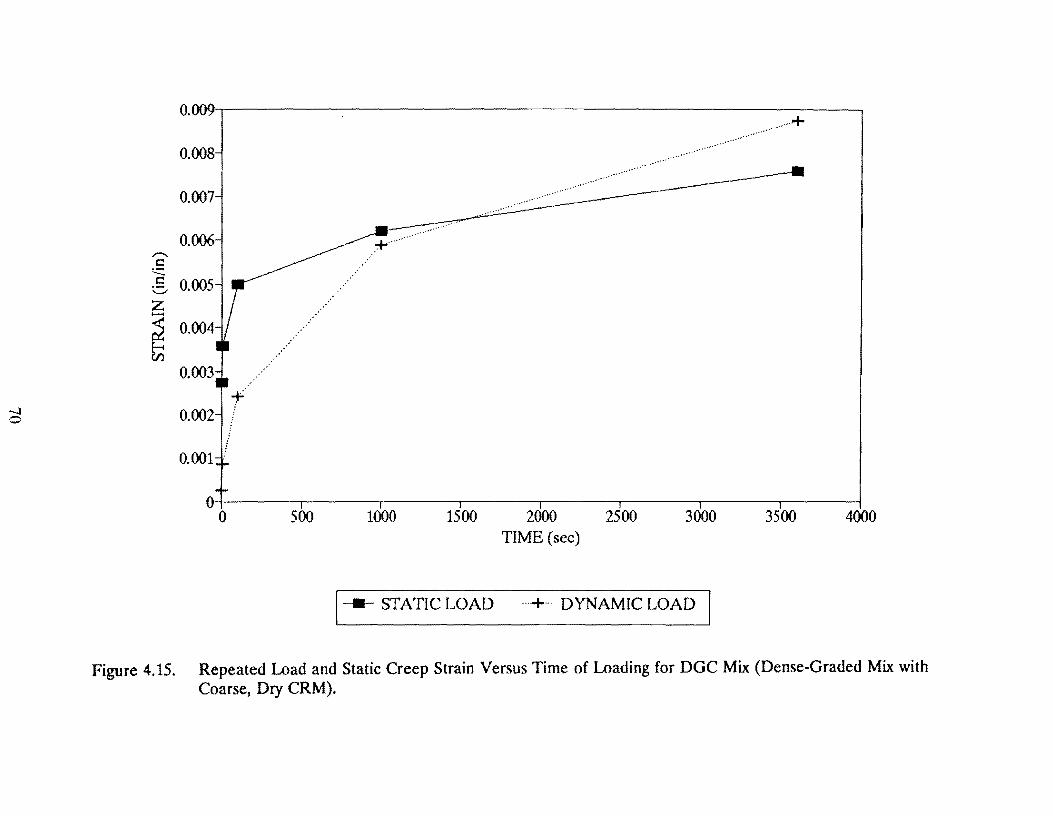
-.J 0
,,....... c:
:.:::: c: v z -~ tn
0.009
0.008
0.007
0.006
0.005
0.004
0.003
0.002
0.001 f
O-t-~~--,r-~~-.-~~~-.--~~----r~~~-.-~~~~~~~~~~~
0 500 1000 1500 2000 TIME (sec)
2500 3000
1--- STATIC LOAD --+ .. DYNAMIC LOAD
3500 4000
Figure 4.15. Repeated Load and Static Creep Strain Versus Time of Loading for DGC Mix (Dense-Graded Mix with Coarse, Dry CRM).
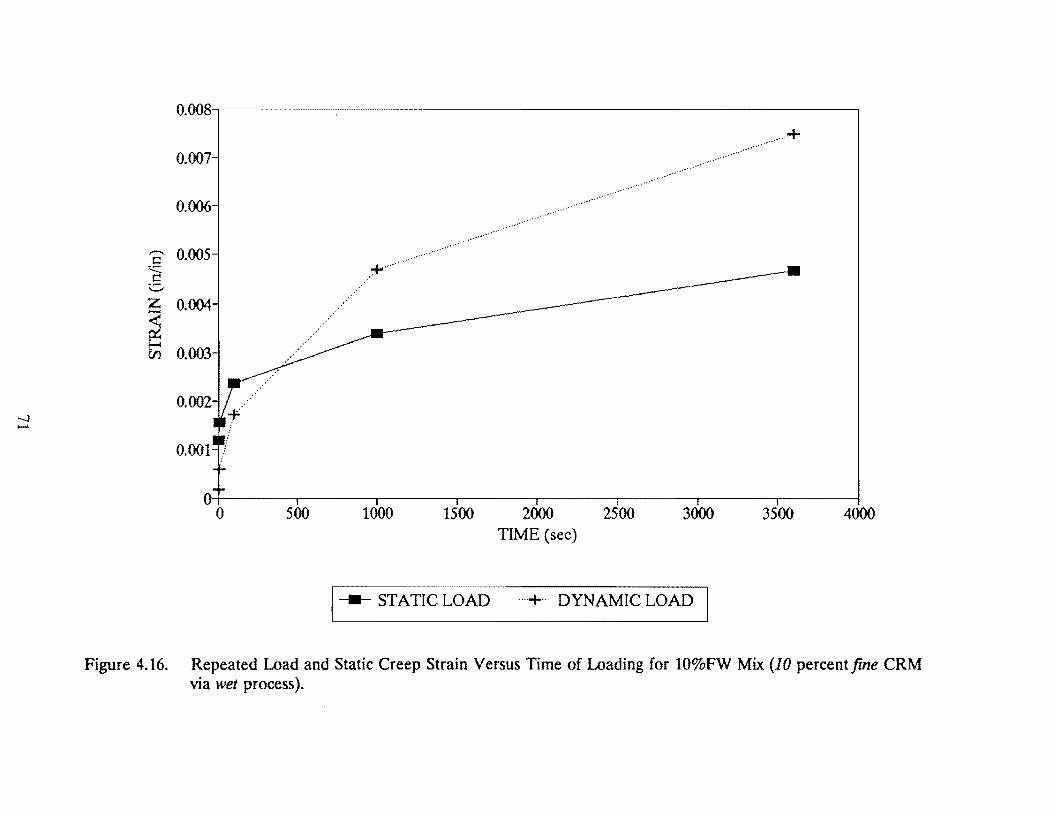
......]
.......
0.008 ... +
.. ··· 0.007 .......
.. ···· ....
, .. -· 0.006
....
,,.--. 0.005 c: ::..::::::. • c: v z 0.004 -~ E--4 0.003 ff)
0.002
0.001
0 0 500 1000 1500 2000 2500 3000 3500 4000
TIME (sec)
1--- STATIC LOAD .... +··· DYNAMIC LOAD
Figure 4.16. Repeated Load and Static Creep Strain Versus Time of Loading for 10%FW Mix (JO percentfine CRM via wet process).
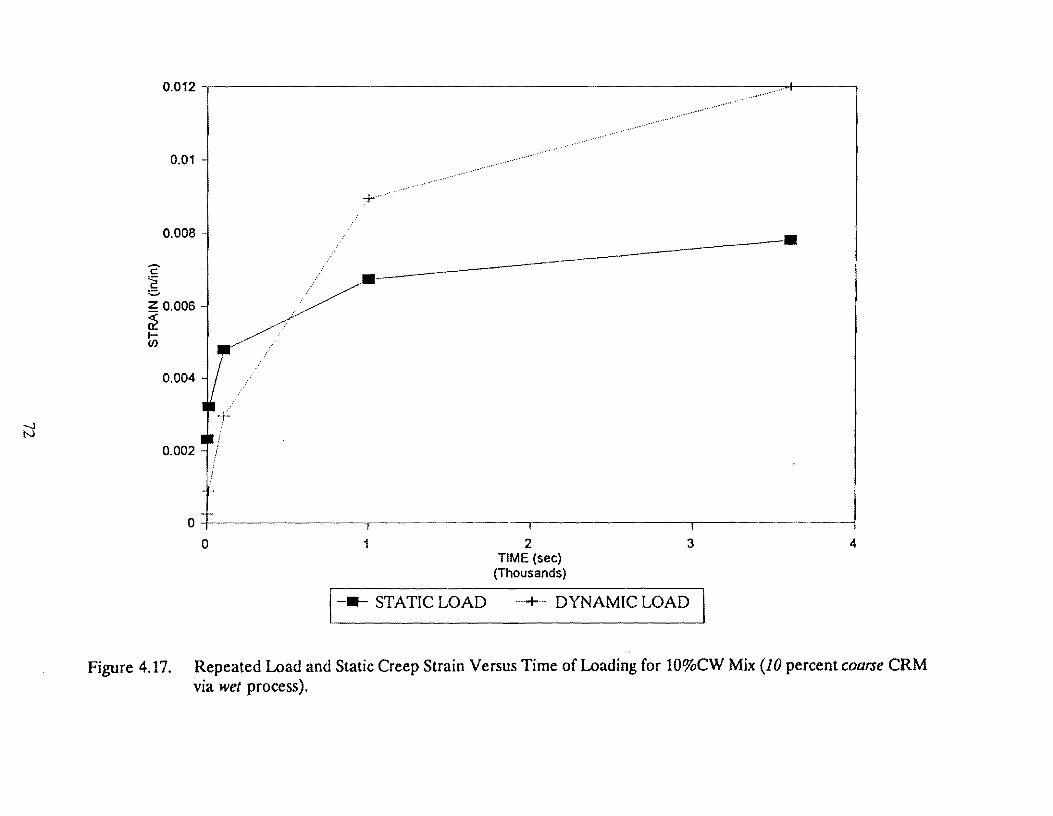
-J N
0.012 -.------------------------------....J----~
0.01
0.008 • -c /
" • c :;::.
~ 0.006
~ I-(/)
0.004
0.002
0-+---------.----------.--~------~-------~
0 2 3 4 TIME (sec)
(Thousands)
1-•- STATIC LOAD .... +··· DYNAMIC LOAD
Figure 4.17. Repeated Load and Static Creep Strain Versus Time of Loading for 10%CW Mix (10 percent coarse CRM via wet process).
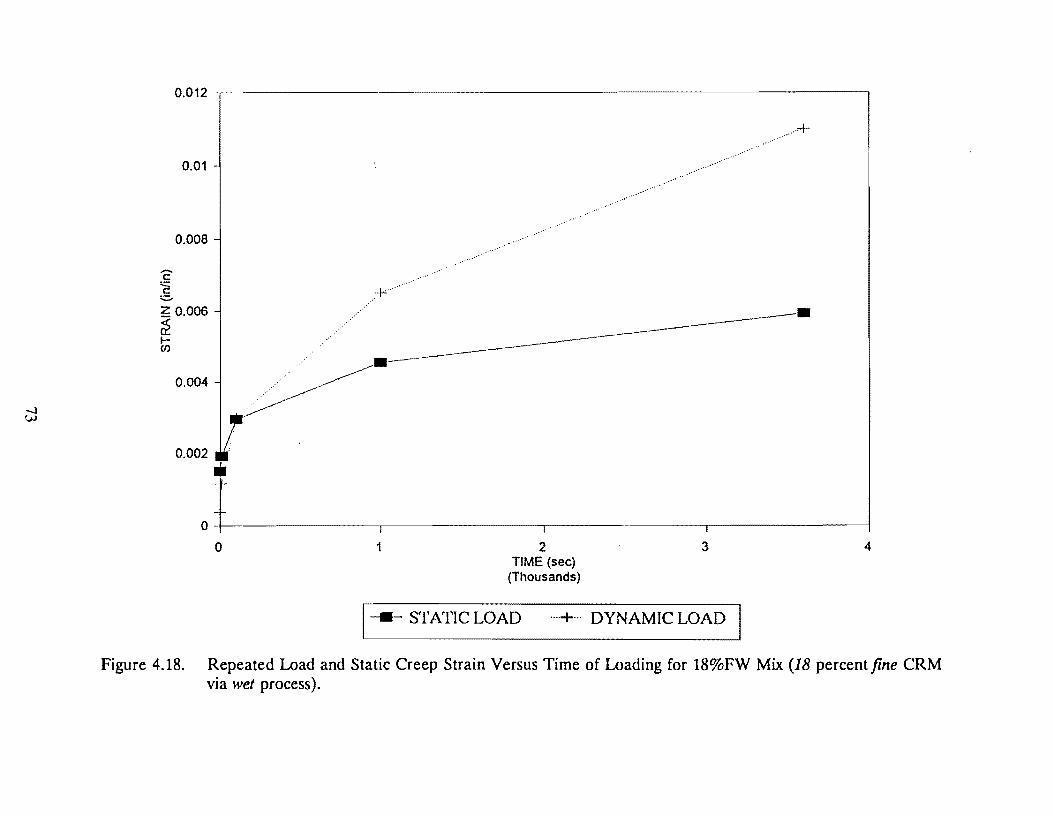
0.012 ~--------------------------------------,
0.01
0.008 ............. ·"'
~ 0.006 • ~ I-en
0.004 ~-0.002
ol~-~~~---0 1 2
TIME (sec) (Thousands)
3
1--- STATIC LOAD ... + ... DYNAMIC LOAD
4
Figure 4.18. Repeated Load and Static Creep Strain Versus Time of Loading for 18%FW Mix (18 percent fine CRM via wet process).
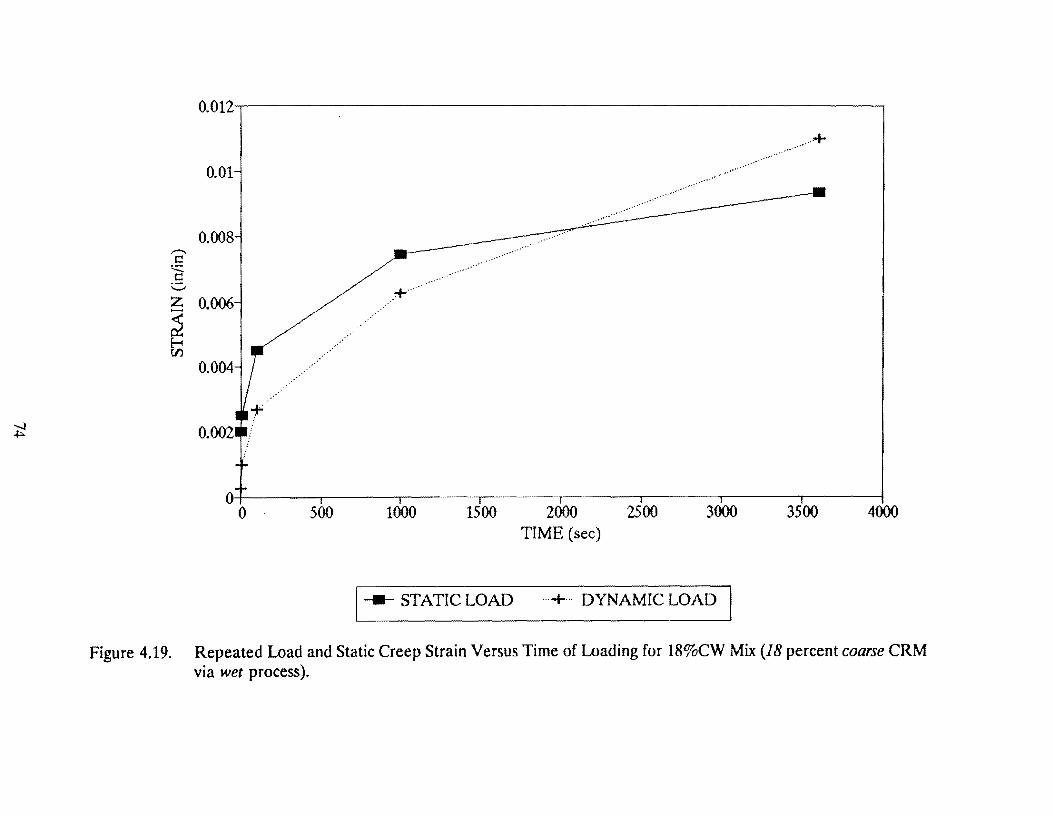
-...,) ~
,.,-.. C!
' C!
-=-z ......
~ f-1 ti)
0.012.----------------------------------.
..... .+
0.01 .. ···"
0.008
.... ...... 0.006
+· ..
0.004
0.002
o~~~~~~~~~~~~~~~~~~~~~~~~~~~~~~~
0 500 1000 1500 2000 TIME (sec)
2500 3000
1-11- STATIC LOAD .. + ... DYNAMIC LOAD
3500 4000
Figure 4.19. Repeated Load and Static Creep Strain Versus Time of Loading for 18%CW Mix (18 percent coarse CRM via wet process).
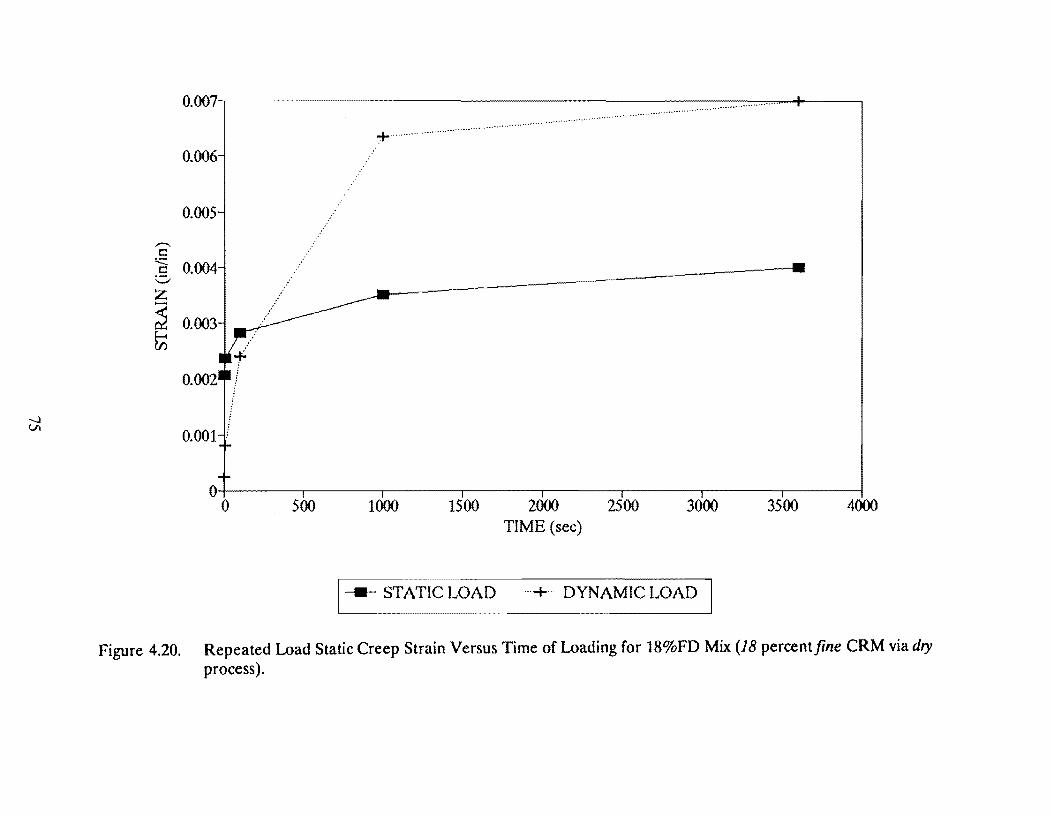
0.006
0.005
,,.-.. c: ~ 0.004 ~
0.001
01-r-~~----,,---~~---.-~~~-.,..-~~--,r--~~-,-~~~~~~~~~~-l
0 500 1000 1500 2000 TIME (sec)
2500 3000
1--- STATIC LOAD ... + .. DYNAMIC LOAD
3500 4000
Figure 4.20. Repeated Load Static Creep Strain Versus Time of Loading for 18%FD Mix (18 percent fine CRM via dry process).
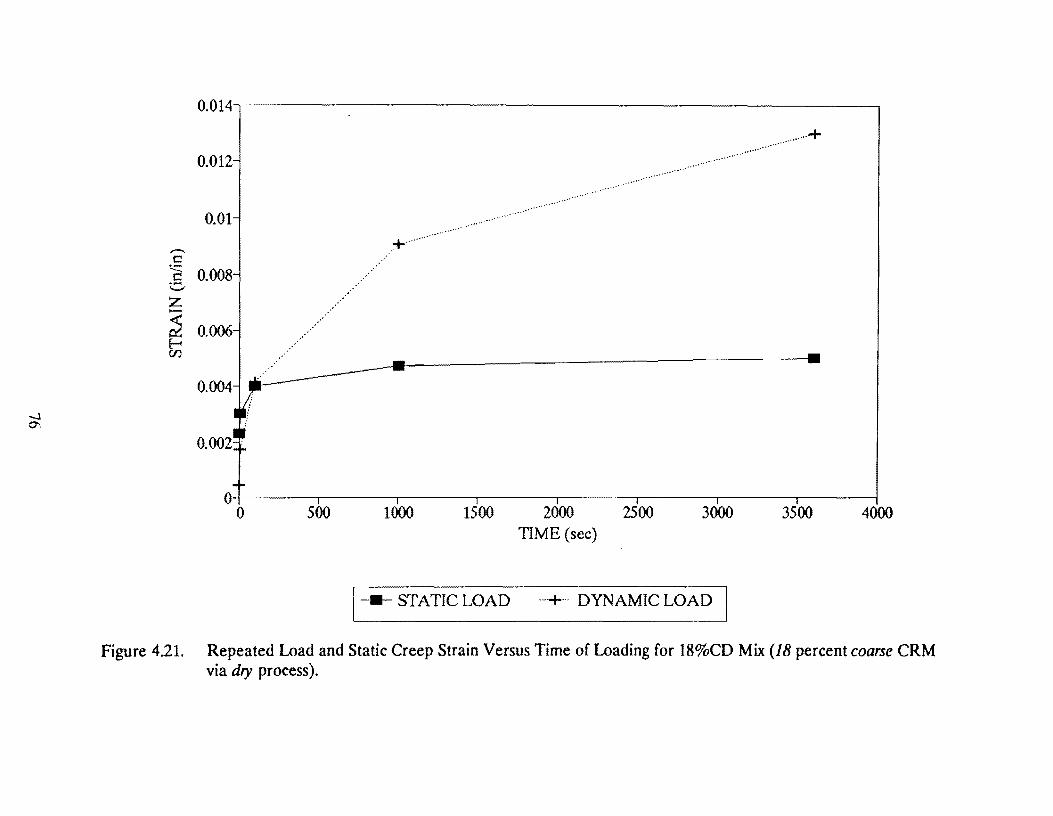
-.J ~
,,.....,. c
:..::::: c v z ,_.
~ ~
0.014.-------------------------------.
0.012
0.01
0.008
0.006
0.004
0.002.
0-f-------,,------.-----.-----.----,-----,.-----.----i 0 500 1000 1500 2000
TIME (sec) 2500 3000
1--- STATIC LOAD ... + ... DYNAMIC LOAD
3500 4000
Figure 4.21. Repeated Load and Static Creep Strain Versus Time of Loading for 18%CD Mix (18 percent coarse CRM via dry process).
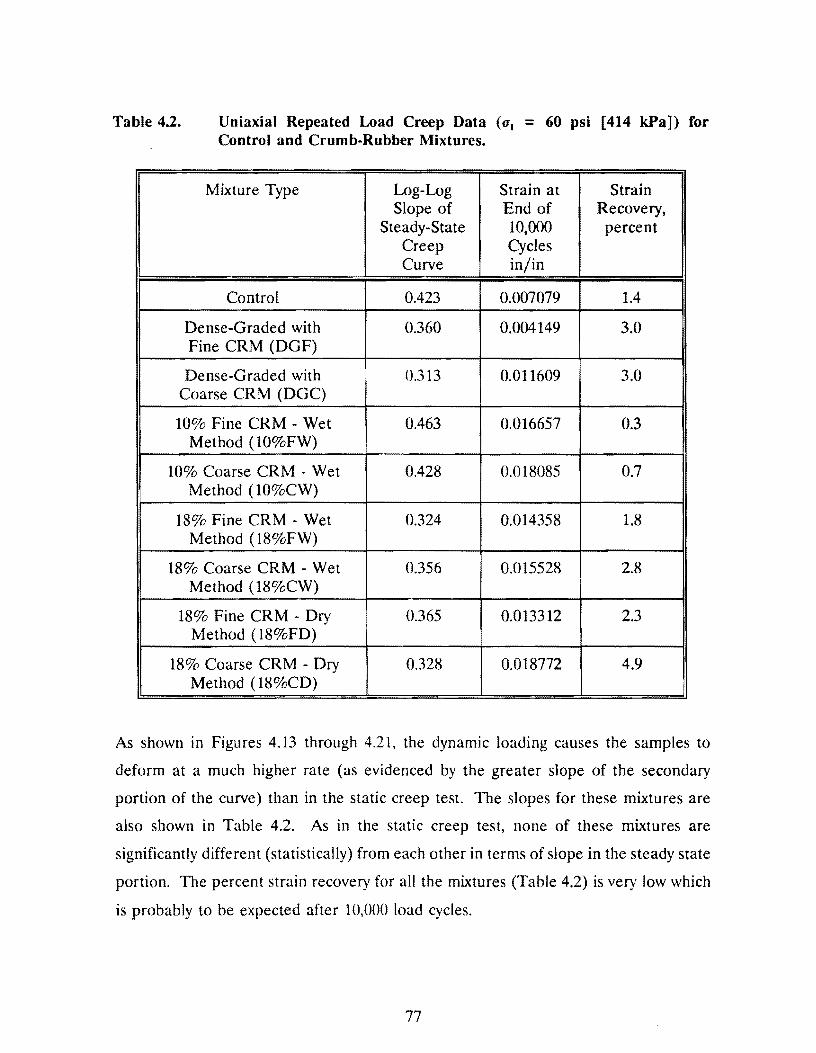
Table 4.2. Uniaxial Repeated Load Creep Data (u1 = 60 psi [414 kPa]) for Control and Crumb-Rubber Mixtures.
Mixture Type Log-Log Strain at Strain Slope of End of Recovery,
Steady-State 10,000 percent Creep Cycles Curve in/in
Control 0.423 0.007079 1.4
Dense-Graded with 0.360 0.004149 3.0 Fine CRM (DGF)
Dense-Graded with 0.313 0.011609 3.0 Coarse CRM (DGC)
10% Fine CRM - Wet 0.463 0.016657 0.3 Method ( 10%FW)
10% Coarse CRM - Wet 0.428 0.018085 0.7 Method ( 10%CW)
18% Fine CRM - Wet 0.324 0.014358 1.8 Method ( 18%FW)
18% Coarse CRM - Wet 0.356 0.015528 2.8 Method (18%CW)
18% Fine CRM - Dry 0.365 0.013312 2.3 Method ( 18%FD)
18% Coarse CRM - Dry 0.328 0.018772 4.9 Method ( 18%CD)
As shown in Figures 4.13 through 4.21, the dynamic loading causes the samples to
deform at a much higher rate (as evidenced by the greater slope of the secondary
portion of the curve) than in the static creep test. The slopes for these mixtures are
also shown in Table 4.2. As in the static creep test, none of these mixtures are
significantly different (statistically) from each other in terms of slope in the steady state
portion. The percent strain recovery for all the mixtures (Table 4.2) is very low which
is probably to be expected after 10,000 load cycles.
77
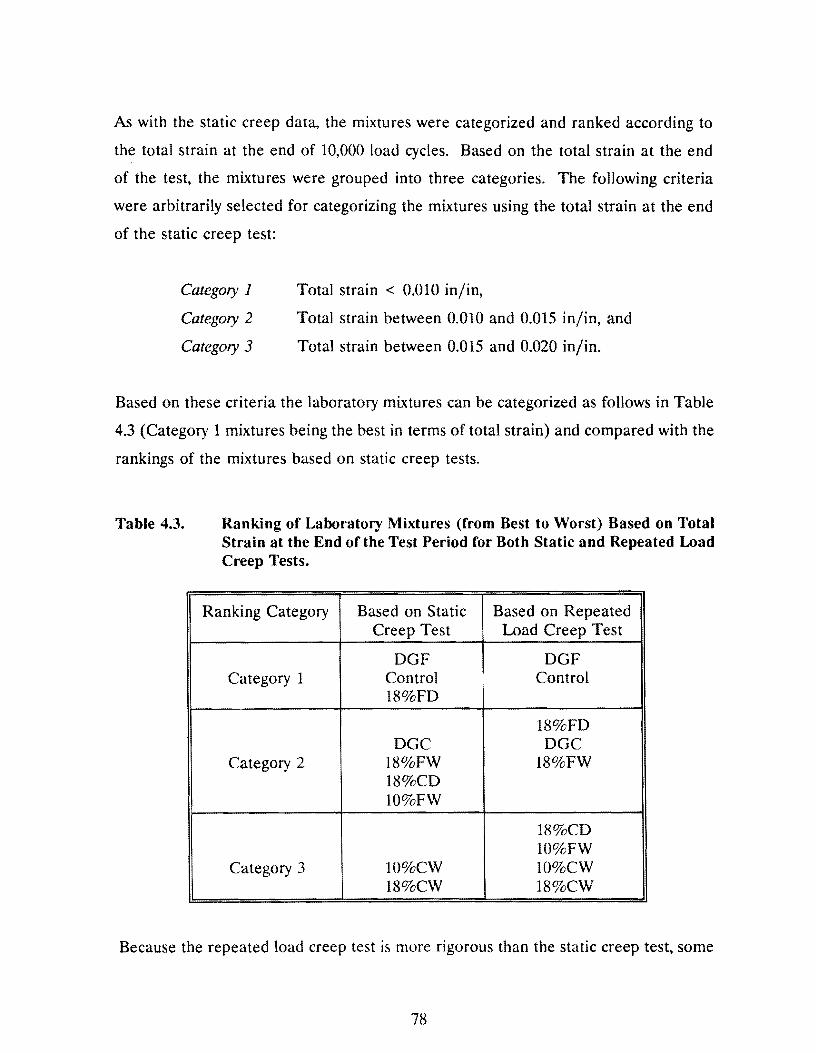
As with the static creep data, the mixtures were categorized and ranked according to
the total strain at the end of 10,000 load cycles. Based on the total strain at the end
of the test, the mixtures were grouped into three categories. The following criteria
were arbitrarily selected for categorizing the mixtures using the total strain at the end
of the static creep test:
Category 1
Category 2
Category 3
Total strain < 0.010 in/in,
Total strain between 0.010 and 0.015 in/in, and
Total strain between 0.015 and 0.020 in/in.
Based on these criteria the laboratory mixtures can be categorized as follows in Table
4.3 (Category 1 mixtures being the best in terms of total strain) and compared with the
rankings of the mixtures based on static creep tests.
Table 4.3. Ranking of Laboratory Mixtures (from Best to Worst) Based on Total Strain at the End of the Test Period for Both Static and Repeated Load Creep Tests.
Ranking Category Based on Static Based on Repeated Creep Test Load Creep Test
DGF DGF Category 1 Control Control
18%FD
18%FD DGC DGC
Category 2 18%FW 18%FW 18%CD 10%FW
18%CD 10%FW
Category 3 10%CW 10%CW 18%CW 18%CW
Because the repeated load creep test is more rigorous than the static creep test, some
78
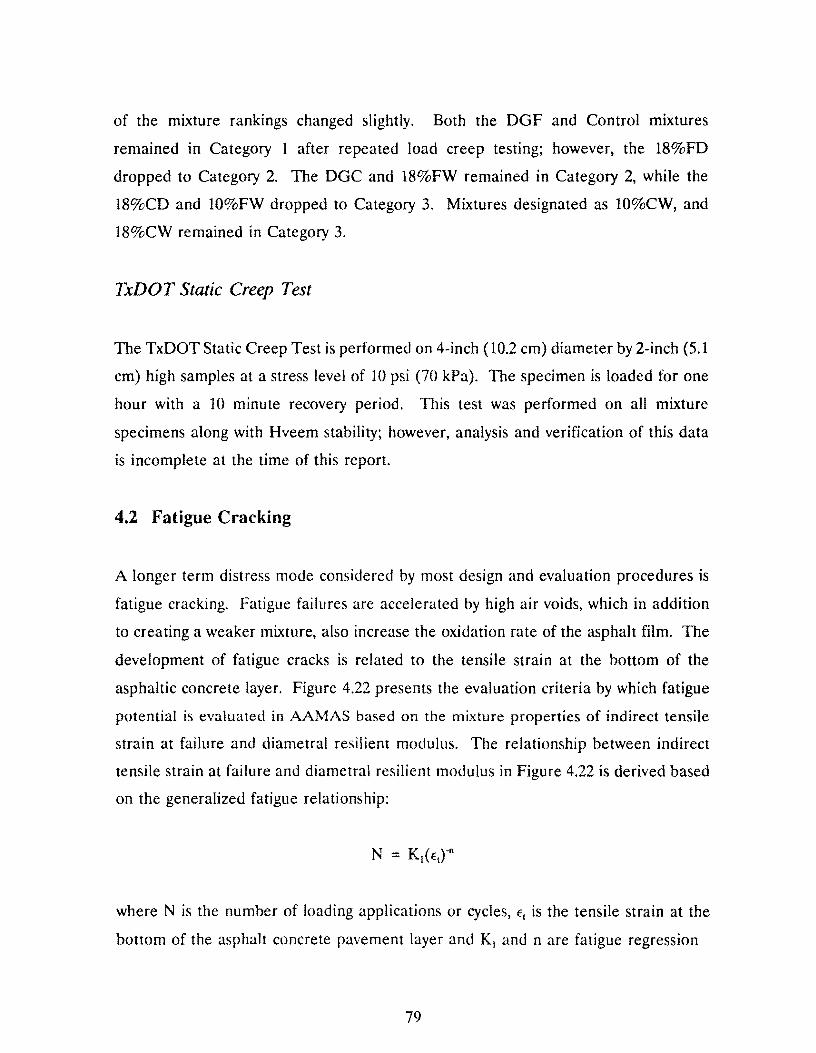
of the mixture rankings changed slightly. Both the DGF and Control mixtures
remained in Category 1 after repeated load creep testing; however, the 18%FD
dropped to Category 2. The DGC and 18%FW remained in Category 2, while the
18%CD and 10%FW dropped to Category 3. Mixtures designated as 10%CW, and
18%CW remained in Category 3.
TxDOT Static Creep Test
The TxDOT Static Creep Test is performed on 4-inch (10.2 cm) diameter by 2-inch (5.1
cm) high samples at a stress level of 10 psi (70 kPa). The specimen is loaded for one
hour with a 10 minute recovery period. This test was performed on all mixture
specimens along with Hveem stability; however, analysis and verification of this data
is incomplete at the time of this report.
4.2 Fatigue Cracking
A longer term distress mode considered by most design and evaluation procedures is
fatigue cracking. Fatigue failures are accelerated by high air voids, which in addition
to creating a weaker mixture, also increase the oxidation rate of the asphalt film. The
development of fatigue cracks is related to the tensile strain at the bottom of the
asphaltic concrete layer. Figure 4.22 presents the evaluation criteria by which fatigue
potential is evaluated in AAMAS based on the mixture properties of indirect tensile
strain at failure and diametral resilient modulus. The relationship between indirect
tensile strain at failure and diametral resilient modulus in Figure 4.22 is derived based
on the generalized fatigue relationship:
where N is the number of loading applications or cycles, e1 is the tensile strain at the
bottom of the asphalt concrete pavement layer and K1 and n are fatigue regression
79
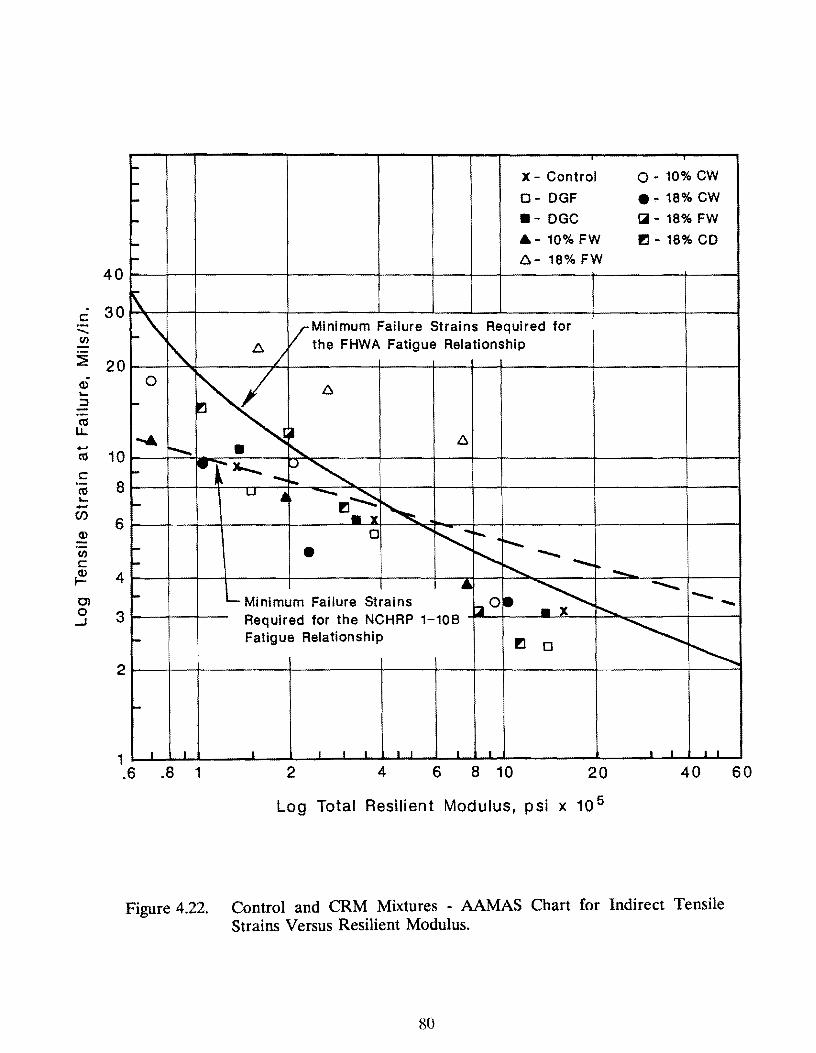
. c -CIJ
:E Q) .... ::J
m LL. .._. m c ·-m .... .._.
Cf)
Q)
CIJ c ~ 0) 0 -'
-- x - Control o- 10% cw
- 0- DGF .,. 18% cw ... •- DGC tiil - 18% FW
.... A- 10% FW !I - 18% CD
- C::.- 18% FW 40
-30
20
10
8
6
4
3
2
' ~\ VMinimum Failure Strains Required for
r'\. lJ. J the FHWA Fatigue Relationship
0
K C::. ....
...... I C::. ........... • ' .... .~ .... )C......,.
~' ' -u .. -~ .... !I-.......;: ~ • y
0 '"" - ... ~.
" .... • ~ ... ~ .......... ..._"'
~ ~ .. > ............ .... ...... Minimum Failure Strains ..........
~o • l'-o..._ ......
Required for the NCHRP 1-108
~ - Fatigue Relationship !I 0 ~
...
1 I I I I I I I I I I I I I I
.6 .8 1 2 4 6 8 10 20 40 60
Log Total Resilient Modulus, psi x 10 5
Figure 4.22. Control and CRM Mixtures - AAMAS Chart for Indirect Tensile Strains Versus Resilient Modulus.
80
constants.
For purposes of AAMAS, the standard mixture is the dense-graded asphaltic concrete
placed at the AASHTO Road Test. The fatigue curves from NCHRP 1-lOB (Finn et
al. 1977) were developed from these data, which have been used in other research and
design studies (Rauhut et al. 1984, Austin Research Engineers, Inc. 1975). Figure 4.22
shows two relationships between the total resilient modulus and indirect tensile strain
at failure for the standard mixture. The difference is that the NCHRP 1-lOB assumed
a constant slope of the fatigue curves, whereas the FHW A study varied the slope of the
fatigue curves.
If the total resilient modulus and indirect tensile strains at failure for a particular
mixture plot above the standard mixture (FHWA fatigue curve is recommended), it is
assumed that the mixture has better fatigue resistance than the standard mixture (Von
Quintus et al. 1991 ). From Figure 4.22, it appears that all of the mixtures except one
have about the same fatigue potential and are inferior to the standard mix in terms of
fatigue resistance potential as characterized by the FHWA relationship. This means
that most of the crumb rubber modified mixtures tested in this study are more fatigue
susceptible than the AAMAS standard mixture but may not be any more susceptible
than conventional dense-graded Type D mixtures currently used in Texas. The mixture
produced with 18% fine CRM by the wet method has a significantly better fatigue
resistance than the others.
Indirect Tensile Tests
Indirect tensile strength tests were performed at 41 °F (5 °C), 77°F (25 °C) and 104 °F
( 40°C). Figure 4.23 shows the indirect tensile strengths and failure strains at 41°F
(S°C). The tensile strength of the control mixture which is a dense graded mix is 120
psi (827 kPa). The addition of dry fine and coarse rubber to a dense graded mixture
(DGF and DGC) did not cause a decrease in the tensile strength. Tensile strength and
failure strain data at 41°F (5 °C) for all three dense graded mixtures (Control, DGF,
81
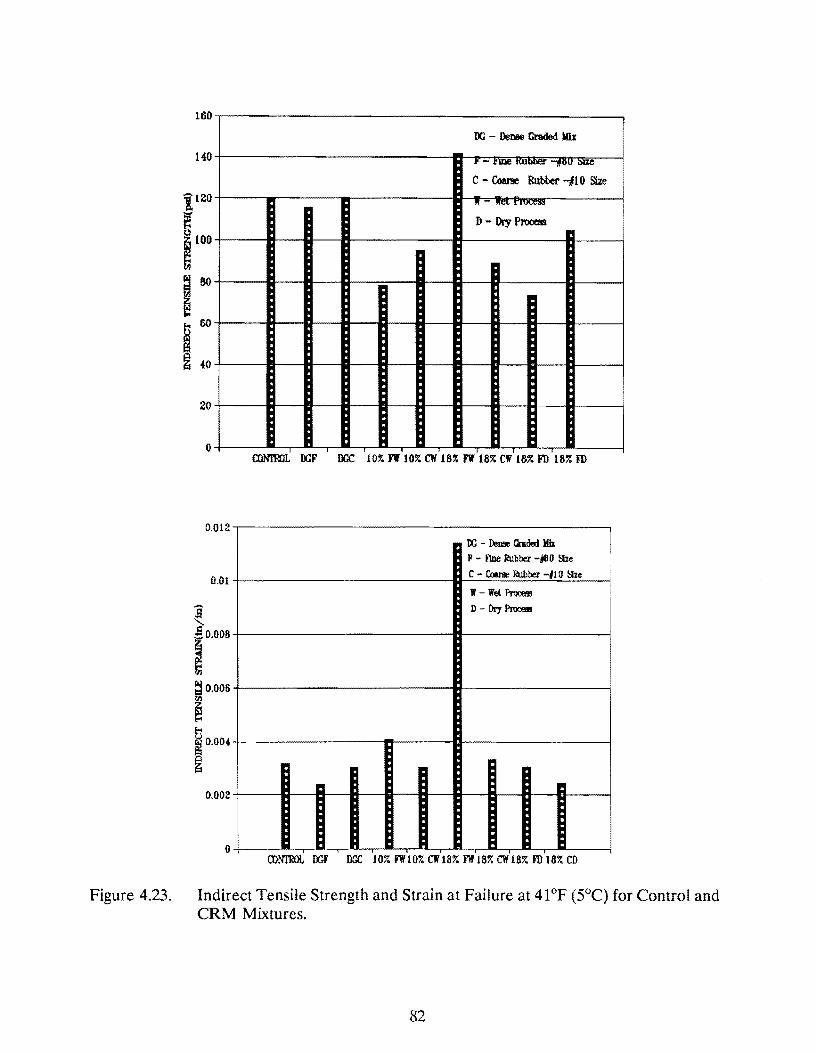
Figure 4.23.
160 !
DC Dense Graded Mi.I
140 r - r we ti.Ul>llCI. -,,011 """'
C - Come Rubber -#10 Si2e
.. - """ • '""";» D - Dry Process
20
0 I I ' • CONTmL DCF DGC 10% n to3 cw 1sr. n 1ar. cw 1s3 rn 1ar. rn
0.012 IX: - Deuse Graded Hh I JI - ~ Rubber -j80 !he
0.01 C -~ Rubber -#10 !he
1f - Wet ProoE!ls
D - Dry Proceas ~ !o.ooe
~ ~ 0.006 Ul
~ ~ ().004
~ 0.002
0 a:>N'lmL n;r DGC 107. FW 107. cw 18r.J'1f 187. cw 18% rn 13%CD
Indirect Tensile Strength and Strain at Failure at 41°F (5°C) for Control and CRM Mixtures.
82
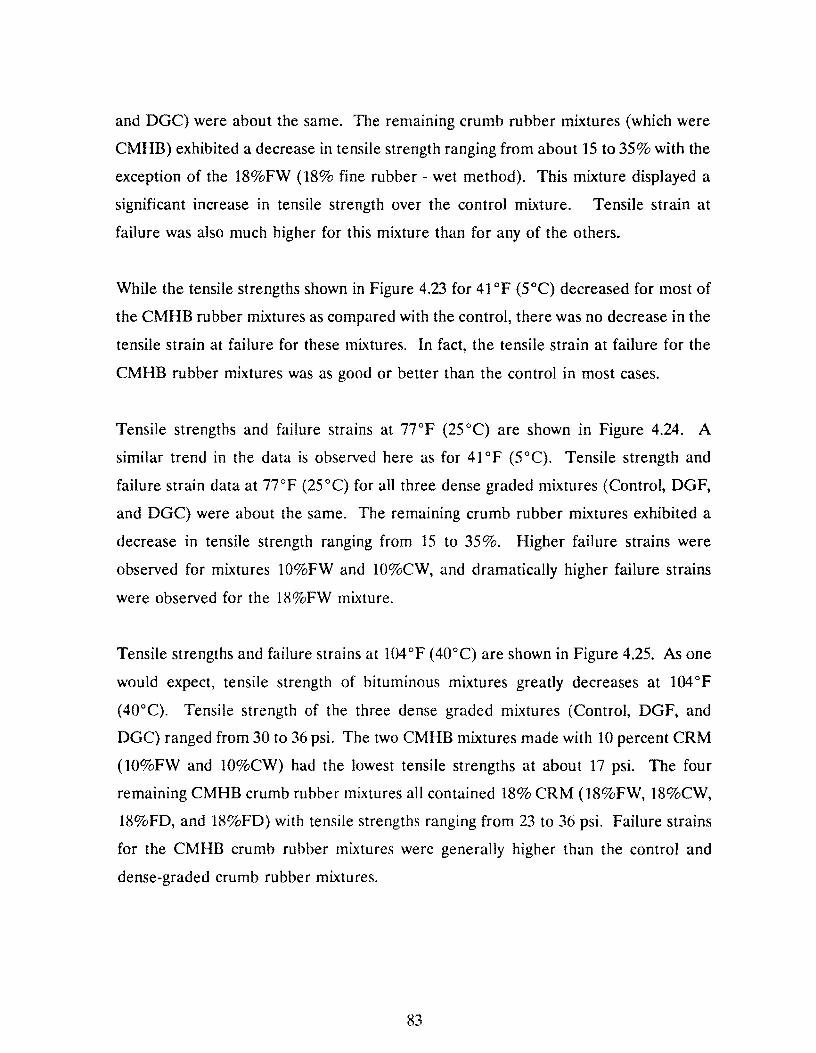
and DGC) were about the same. The remaining crumb rubber mixtures (which were
CMHB) exhibited a decrease in tensile strength ranging from about 15 to 35% with the
exception of the 18%FW (18% fine rubber - wet method). This mixture displayed a
significant increase in tensile strength over the control mixture. Tensile strain at
failure was also much higher for this mixture than for any of the others.
While the tensile strengths shown in Figure 4.23 for 41°F (S°C) decreased for most of
the CMHB rubber mixtures as compared with the control, there was no decrease in the
tensile strain at failure for these mixtures. In fact, the tensile strain at failure for the
CMHB rubber mixtures was as good or better than the control in most cases.
Tensile strengths and failure strains at 77°F (25 °C) are shown in Figure 4.24. A
similar trend in the data is observed here as for 41 °F (5°C). Tensile strength and
failure strain data at 77°F (25°C) for all three dense graded mixtures (Control, DGF,
and DGC) were about the same. The remaining crumb rubber mixtures exhibited a
decrease in tensile strength ranging from 15 to 35%. Higher failure strains were
observed for mixtures 10%FW and 10%CW, and dramatically higher failure strains
were observed for the 18%FW mixture.
Tensile strengths and failure strains at 104 °F ( 40°C) are shown in Figure 4.25. As one
would expect, tensile strength of bituminous mixtures greatly decreases at 104 °F
(40°C). Tensile strength of the three dense graded mixtures (Control, DGF, and
DGC) ranged from 30 to 36 psi. The two CMHB mixtures made with 10 percent CRM
(10%FW and 10%CW) had the lowest tensile strengths at about 17 psi. The four
remaining CMHB crumb rubber mixtures all contained 18% CRM (18%FW, 18%CW,
18%FD, and 18%FD) with tensile strengths ranging from 23 to 36 psi. Failure strains
for the CMHB crumb rubber mixtures were generally higher than the control and
dense-graded crumb rubber mixtures.
83
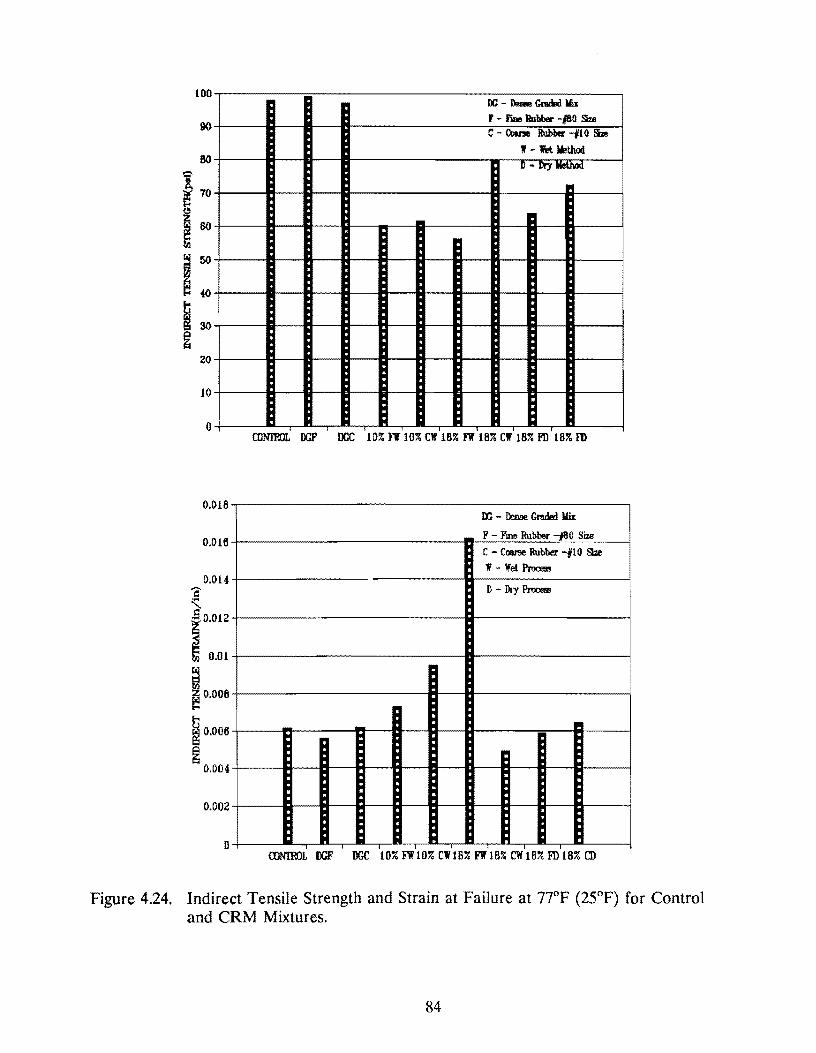
100
90
20
10
0
0.018
0.016
0.014 c
' i0.012
~ 0.01
i•.ooe i 0.006
~ 0.004
0.002
D
00 Dai. Gnml Mix
r - Fine Rubber -IBO Sim c - Come l!ubbeii' -#l 0 ~
1 - 1'et Method D - Dry Mel.hod
' ' CONTROL llGF DCC 10% J"f 10% CW 18% Fl 183 CJ 18% FU 183 rn
00 - lmie Gl'll.de:l Mix
F Fine Rubb« -#60 Size
C - C081'9e Rubber -f 10 !he
'f-Wet ~
D Dry P.rooEe!
I I I ' I I
illN'IROL llGF DGC 1D%FWl0%C'f18%FllB%CW183FD183CD
Figure 4.24. Indirect Tensile Strength and Strain at Failure at 77°F (25°F) for Control and CRM Mixtures.
84
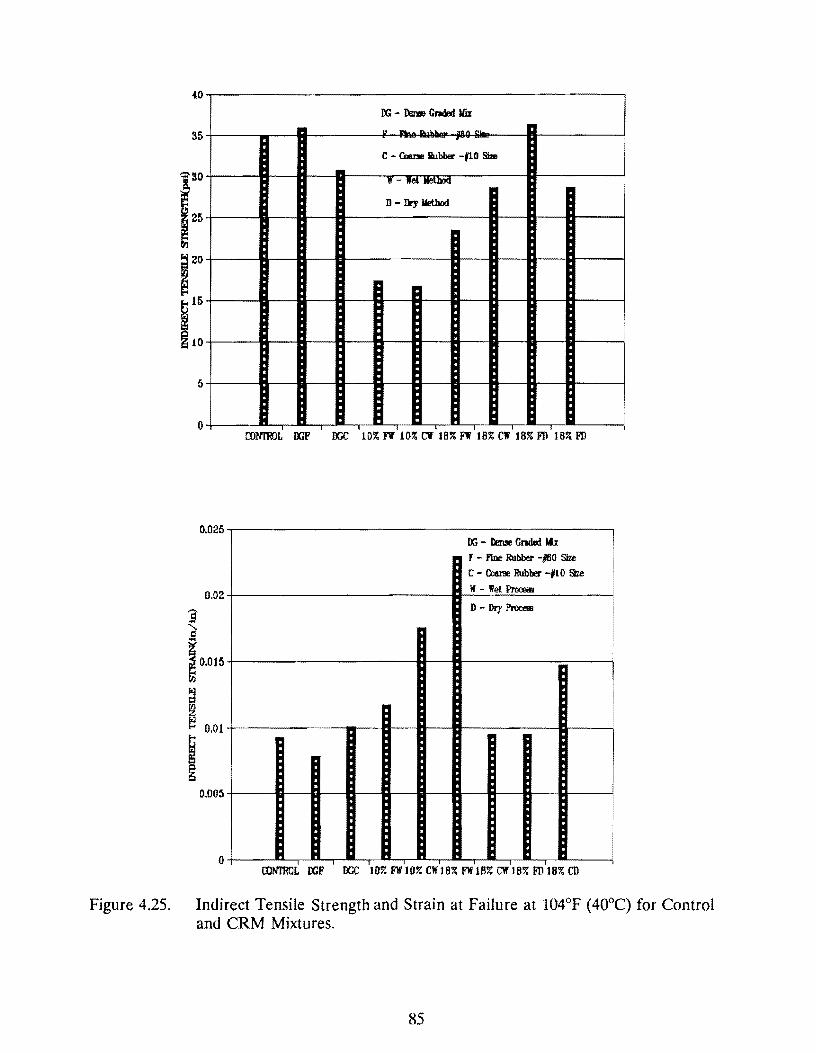
35
1
'
5
0
0.025
0.02
I 0.015
i 0.01
i 0.005
0 I
ix; - DBr. Cnded Mix
"' - ~ ·-A~'-
c - Came RuhhEr -110 Si2e
tr - ""' lle\WQ
D - Iry Method
r:DNl'OOL DGF JX;C 10% flf 103 c.Y 18% Flf 18% CW 18% l'lJ 183 l'lJ
Ix; - Dense Cndai th I r - fine Rubber -1110 size
C - Coarse Rubber -#L 0 Size
lf - ll'el Proceee I D - Dry Pnlcsi i
' IDNTROL OOF JX;C 107. FW 10% CW l 83 FW 18% C1f I 87. l'lJ l 8% CD
Figure 4.25. Indirect Tensile Strength and Strain at Failure at 104°F ( 40°C) for Control and CRM Mixtures.
85
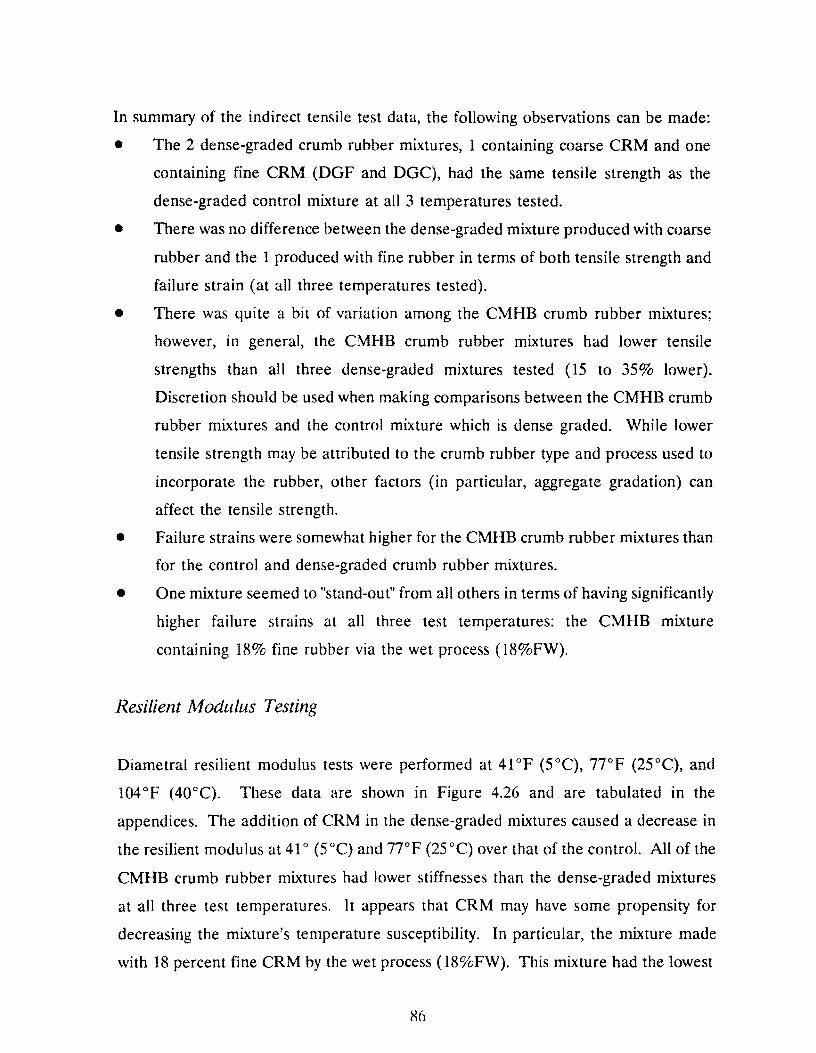
In summary of the indirect tensile test data, the following observations can be made:
• The 2 dense-graded crumb rubber mixtures, I containing coarse CRM and one
containing fine CRM (DGF and DGC), had the same tensile strength as the
dense-graded control mixture at all 3 temperatures tested.
• There was no difference between the dense-graded mixture produced with coarse
rubber and the 1 produced with fine rubber in terms of both tensile strength and
failure strain (at all three temperatures tested).
• There was quite a bit of variation among the CMHB crumb rubber mixtures;
however, in general, the CMHB crumb rubber mixtures had lower tensile
strengths than all three dense-graded mixtures tested (15 to 35% lower).
Discretion should be used when making comparisons between the CMHB crumb
rubber mixtures and the control mixture which is dense graded. While lower
tensile strength may be attributed to the crumb rubber type and process used to
incorporate the rubber, other factors (in particular, aggregate gradation) can
affect the tensile strength.
• Failure strains were somewhat higher for the CMHB crumb rubber mixtures than
for the control and dense-graded crumb rubber mixtures.
• One mixture seemed to "stand-out" from all others in terms of having significantly
higher failure strains at all three test temperatures: the CMHB mixture
containing 18% fine rubber via the wet process ( 18%FW).
Resilient Modulus Testing
Diametral resilient modulus tests were performed at 41°F (5°C), 77°F (25°C), and
104 °F (40°C). These data are shown in Figure 4.26 and are tabulated in the
appendices. The addition of CRM in the dense-graded mixtures caused a decrease in
the resilient modulus at 41 ° (5 °C) and 77°F (25 °C) over that of the control. All of the
CMHB crumb rubber mixtures had lower stiffnesses than the dense-graded mixtures
at all three test temperatures. l t appears that CRM may have some propensity for
decreasing the mixture's temperature susceptibility. In particular, the mixture made
with 18 percent fine CRM by the wet process ( 18%FW). This mixture had the lowest
86
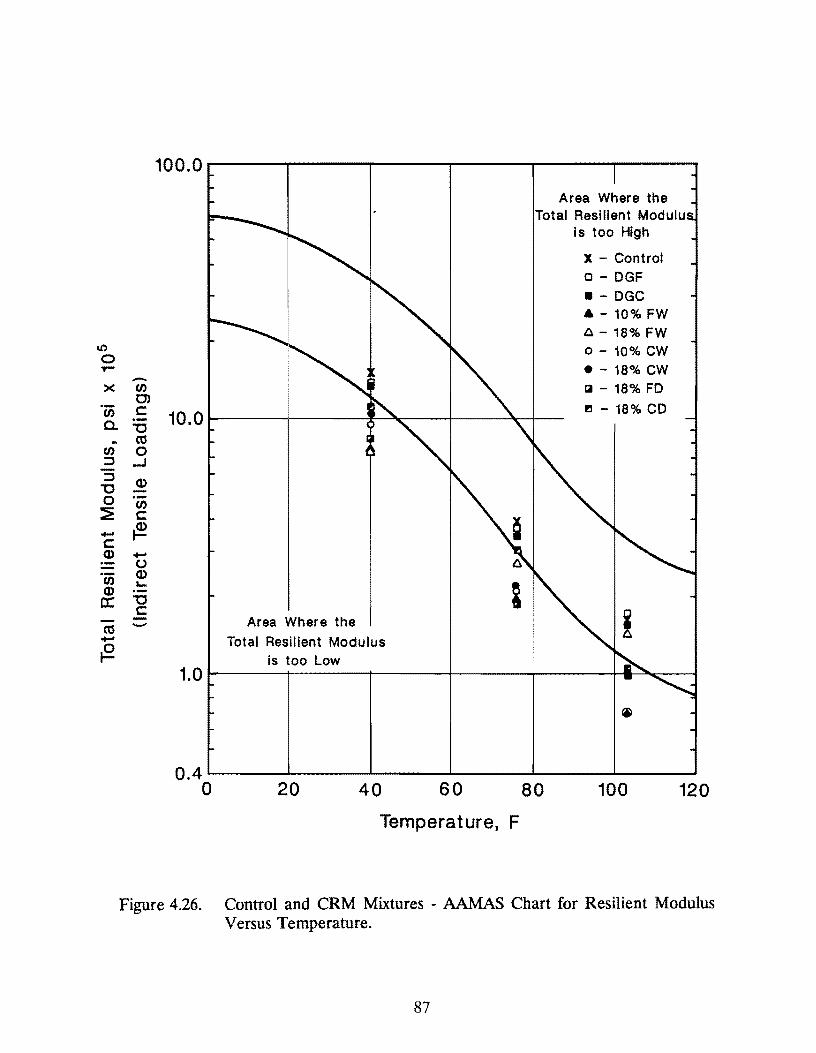
I()
0 ,... ><
'Ci) a. -Cf)
:::::s :::::s
"'C 0 ~ -c: Q)
'Ci) Q) 0:
co -{!.
100.0
Area Where the Total Resilient Modulu
is too High
X - Control o - DGF
• - DGC a - 10% FW ~ - 18% FW 0 - 10% cw • - 18% CW -Cf) i:a - 18% FD
O'> c: 10.0 ri - 18% CD ·-"'C co 0
...J
Q)
Cf)
c: ~ -0 Q) ....
"'C c: - Area Where the
Total Resilient Modulus is too Low
1.0
0.4'--~~-'-~~~-'-~~~~~~---L...~~~...1.-~~--i
0 20 40 60 80 100 120
Temperature, F
Figure 4.26. Control and CRM Mixtures - AAMAS Chart for Resilient Modulus Versus Temperature.
87
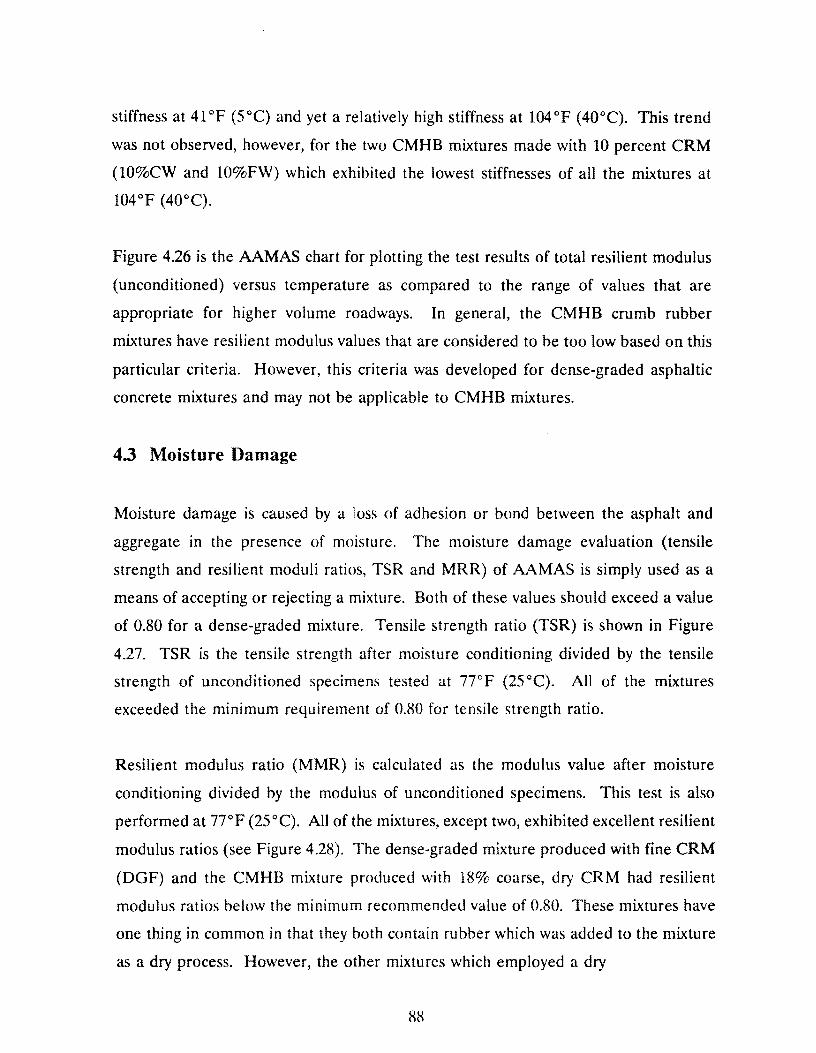
stiffness at 41 °F (5 °C) and yet a relatively high stiffness at 104 °F ( 40°C). This trend
was not observed, however, for the two CMHB mixtures made with 10 percent CRM
(10%CW and 10%FW) which exhibited the lowest stiffnesses of all the mixtures at
104 °F (40°C).
Figure 4.26 is the AAMAS chart for plotting the test results of total resilient modulus
(unconditioned) versus temperature as compared to the range of values that are
appropriate for higher volume roadways. In general, the CMHB crumb rubber
mixtures have resilient modulus values that are considered to be too low based on this
particular criteria. However, this criteria was developed for dense-graded asphaltic
concrete mixtures and may not be applicable to CMHB mixtures.
4.3 Moisture Damage
Moisture damage is caused by a loss of adhesion or bond between the asphalt and
aggregate in the presence of moisture. The moisture damage evaluation (tensile
strength and resilient moduli ratios, TSR and MRR) of AAMAS is simply used as a
means of accepting or rejecting a mixture. Both of these values should exceed a value
of 0.80 for a dense-graded mixture. Tensile strength ratio (TSR) is shown in Figure
4.27. TSR is the tensile strength after moisture conditioning divided by the tensile
strength of unconditioned specimens tested at 77°F (25°C). All of the mixtures
exceeded the minimum requirement of 0.80 for tensile strength ratio.
Resilient modulus ratio (MMR) is calculated as the modulus value after moisture
conditioning divided by the modulus of unconditioned specimens. This test is also
performed at 77°F (25°C). All of the mixtures, except two, exhibited excellent resilient
modulus ratios (see Figure 4.28). The dense-graded mixture produced with fine CRM
(DGF) and the CMHB mixture produced with 18% coarse, dry CRM had resilient
modulus ratios below the minimum recommended value of 0.80. These mixtures have
one thing in common in that they both contain rubber which was added to the mixture
as a dry process. However, the other mixtures which employed a dry
88
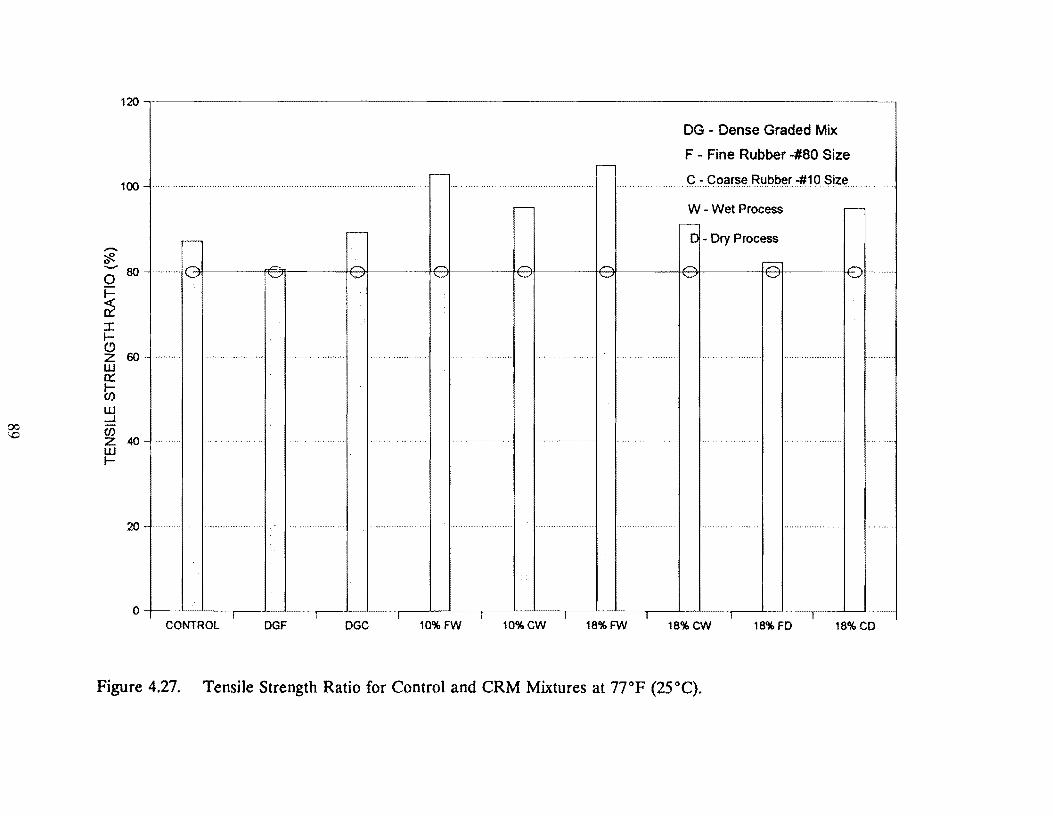
120 --------------------------------------------,
DG - Dense Graded Mix
F - Fine Rubber -#80 Size
100 - ......................... C.:: Goa.r.s~.Rl1.t>~~r.::~19 $i;z~
W - Wet Process
C - Dry Process --;;§?. 0 .._,
0 r-~ I r-(!'.) z 60 - ......... . w 0::: r-(/)
w _. 00 (/) \C z 40 -'··· .....
w r-
20 - .. .. .............. .
I CONTROL DGF OGC 10%FW 10%CW 18%FW 18%CW 18%FD 18%CD
Figure 4.27. Tensile Strength Ratio for Control and CRM Mixtures at 77°F (25°C).
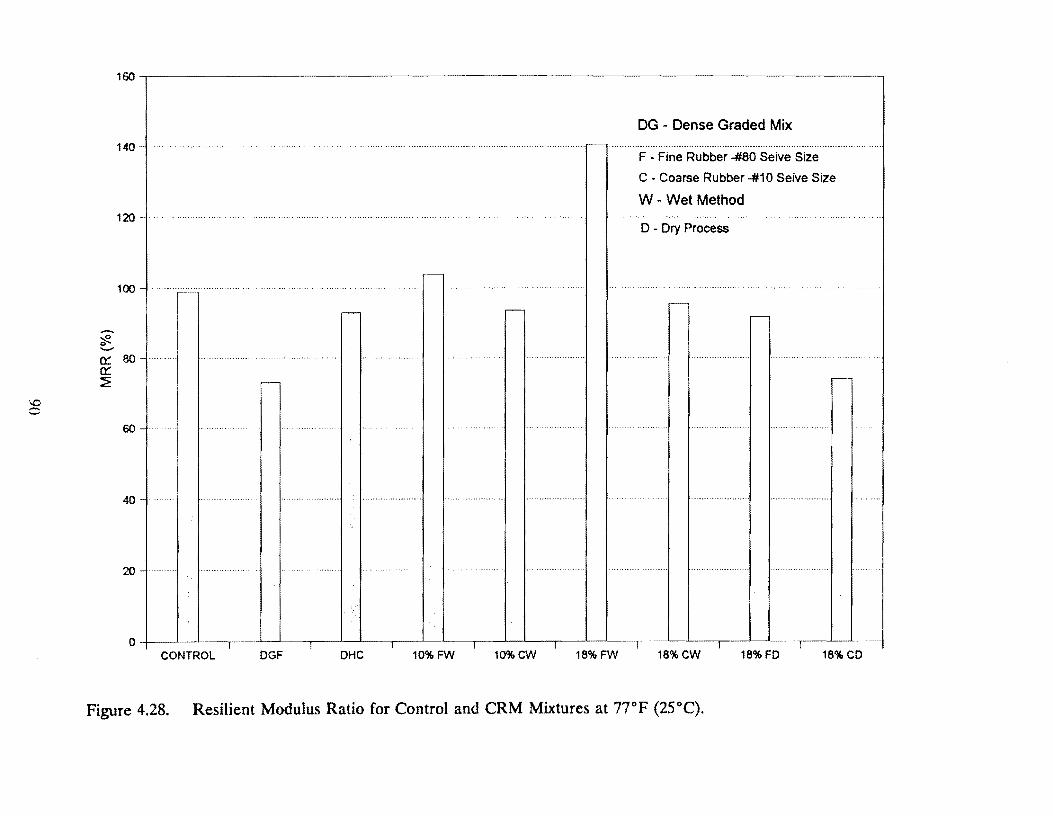
\0 0
140 ...................... .
120
100
,,-..
~ 0 -a::: 80 a::: ~
60
40
20
0 -+---'--..__~_
CONTROL DGF DHC 10%FW 10%CW 18%FW
DG - Dense Graded Mix ···- ...... .
F - Fine Rubber -#80 Seive Size
C - Coarse Rubber-#10 Seive Size
W - Wet Method
D - Dry Process
18%CW 18%FD 18%CD
Figure 4.28. Resilient Modulus Ratio for Control and CRM Mixtures at 77°F (25°C).
process (18%FD and DGC) had very good resilient modulus ratios. The mixture
produced with 18 percent fine CRM via the wet process (18%FW) had resilient
modulus values significantly larger after moisture conditioning. This may be attributed
to this particular mixture having a high degree of saturation (70 percent) and the
development of pore water pressures during the testing procedure.
4.4 Thermal Cracking
Thermal cracking is considered a nontraffic-associated fracture distress that is common,
but not confined, to the northern United States (Von Quintus et al 1991). Low
temperature cracking results when the tensile stresses, caused by temperature drops,
exceed the mixture's fracture strength. The rate at which thermal cracks occur is
dependent on the asphalt rheology properties, mixture properties, and environmental
factors.
The mixture properties which are used to evaluate thermal cracking include indirect
tensile strength, low-temperature creep modulus, and failure strains. These mixture
properties are measured on aged/hardened specimens (environmental aging
simulation). The thermal cracking analysis of the laboratory mixtures is not complete
at the time of this report but some of the material properties resulting from the
laboratory tests are discussed below.
One method of evaluating the potential of a mixture to develop thermal cracking is to
calculate the tensile stress induced in the pavement at a specific temperature, a(T;),
caused by a drop in temperature, .:l T. Asphalt concrete has a thermal coefficient of
contraction, a:A, of between about 1.0 x 10·5 and L8 x 10·5 in/inj°F. This relationship
is expressed as:
91
In this relationship, the creep modulus used in low temperature cracking evaluations
is estimated by regression relationships from a creep modulus determined at 3,600
seconds.
The strength of the mixture at low temperatures can be approximated by IDT strength
measurements. The AAMAS procedure recommends loading at a rate of 0.05 to 0.065
in/min (0.13 to 0.17 cm/min) when performing tests at low temperatures (41°F (5°C)
and below).
Assuming that the thermal coefficient of asphalt concrete and crumb-rubber mixtures
are approximately the same, the only material property affecting the thermal stress
induced within the pavement is the tensile creep stiffness, Eci·
Table 4.4. summarizes the creep stiffness at 3,600 seconds and the indirect tensile
strength data at 41 °F ( 5 °C). To provide resistance to thermal cracking, a mixture
should have a low tensile creep modulus, but a relatively high tensile strength. The
creep modulus of the control mix is significantly higher than all of the crumb rubber
modified mixtures (2 to 5 times higher).
The indirect tensile strengths at 41°F {5°C) and at a loading rate of 0.05 in/min (0.13
cm/min) for some of the crumb rubber mixtures were about the same as (in one case
higher than) the control mixture. Thus, some of the crumb rubber mixtures (18%FW,
DGC, and DGF) appear to offer greater resistance to thermal cracking than the
control mixture.
92
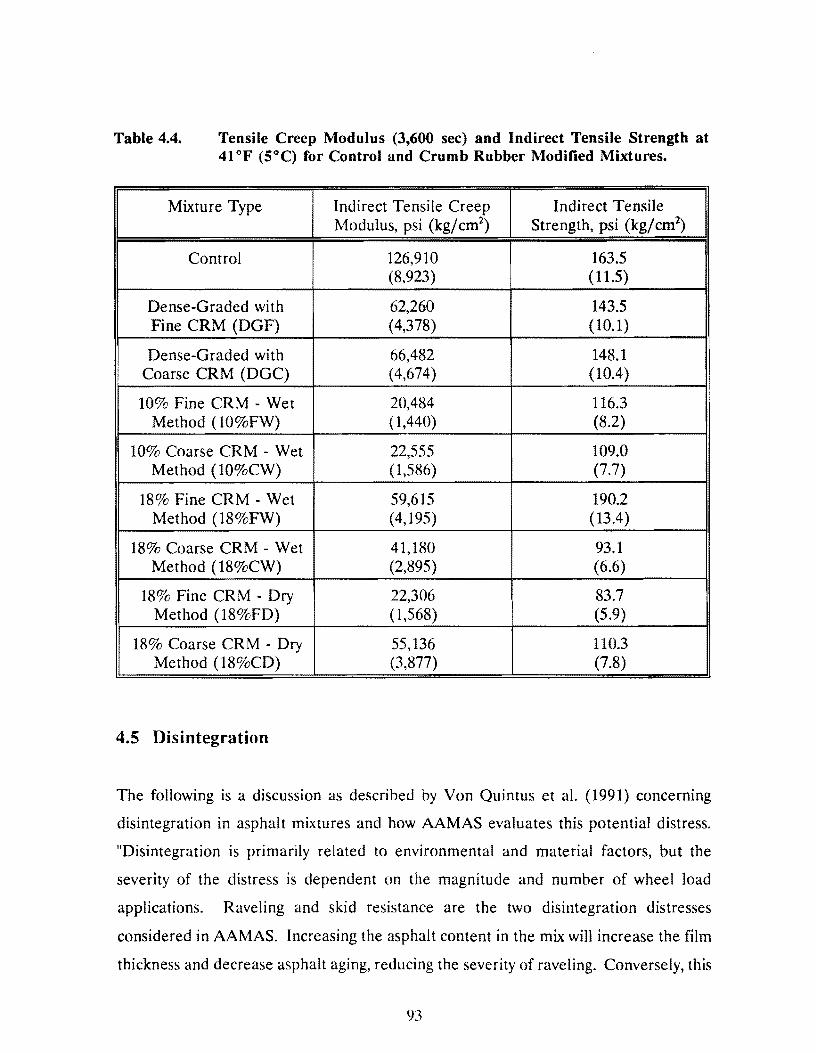
Table 4.4. Tensile Creep Modulus (3,600 sec) and Indirect Tensile Strength at 41°F (5°C) for Control and Crumb Rubber Modified Mixtures.
Mixture Type Indirect Tensile Creep Indirect Tensile Modulus, psi (kg/cm2
) Strength, psi (kg/ cm2)
Control 126,910 163.5 (8,923) (11.5)
Dense-Graded with 62,260 143.5 Fine CRM (DGF) (4,378) (10.1)
Dense-Graded with 66,482 148.1 Coarse CRM (DGC) (4,674) (10.4)
10% Fine CRM - Wet 20,484 116.3 Method ( 10%FW) (1,440) (8.2)
10% Coarse CRM - Wet 22,555 109.0 Method ( 10%CW) (1,586) (7.7)
18% Fine CRM - Wet 59,615 190.2 Method (18%FW) (4, 195) ( 13.4)
18% Coarse CRM - Wet 41,180 93.1 Method ( 18%CW) (2,895) (6.6)
18% Fine CRM - Dry 22,306 83.7 Method (18%FD) ( 1,568) (5.9)
18% Coarse CRM - Dry 55,136 110.3 Method (18%CD) (3,877) (7.8)
4.5 Disintegration
i
The following is a discussion as described by Von Quintus et al. (1991) concerning
disintegration in asphalt mixtures and how AAMAS evaluates this potential distress.
"Disintegration is primarily related to environmental and material factors, but the
severity of the distress is dependent on the magnitude and number of wheel load
applications. Raveling and skid resistance are the two disintegration distresses
considered in AAMAS. Increasing the asphalt content in the mix will increase the film
thickness and decrease asphalt aging, reducing the severity of raveling. Conversely, this
93
increase in asphalt content will also reduce air voids, which can increase the possibility
of flushing (or bleeding) and reduce skid resistance. Thus, both upper and lower
bounds on asphalt content exist and must be considered in mixture design to reduce
disintegration distresses."
"Raveling is directly related to the adhesion between the asphalt and aggregate. The
factors that have an effect on the adhesion property include a combination of asphalt
consistency and film thickness, aggregate cleanliness, shape and texture, air void
content of the mix, and absorption. Reduced skid resistance in the form of flushing is
also related to a combination of these same factors (asphalt consistency and amount,
air voids, and aggregate shape and texture)." (Von Quintus et al. 1991)
"Tensile strain at failure is a measure of the bond or adhesion between the aggregate
and asphalt. Obviously the greater the bond, the less probability for raveling. A low
tensile strength ratio is a measure of moisture damage or loss of bond between the
asphalt and aggregate caused by water. Thus, if a surface mixture is susceptible to
moisture damage, it is similarly susceptible to raveling. Reducing the air voids will
generally reduce moisture damage and asphalt aging. Conversely, for asphaltic
concrete mixes to be resistant to reduced skid resistance and flushing at the surface,
the mix must contain adequate air voids after traffic densification." (Von Quintus et al.
1991)
"The following summarizes the criteria that can be used as guidelines to evaluate the
acceptability of surface mixtures as related to disintegration: (1) air voids at refusal >
3%; (2) indirect tensile strength ratio, TSR > 0.80; (3) bonding loss < 50; and ( 4)
tensile strain at failure > 10 mils/in at 77°F (25°C) and greater than 2.0 mils/in at
41°F (5°C) after accelerated aging.
where thi is the indirect tensile strain at failure measured on specimens that have been
94
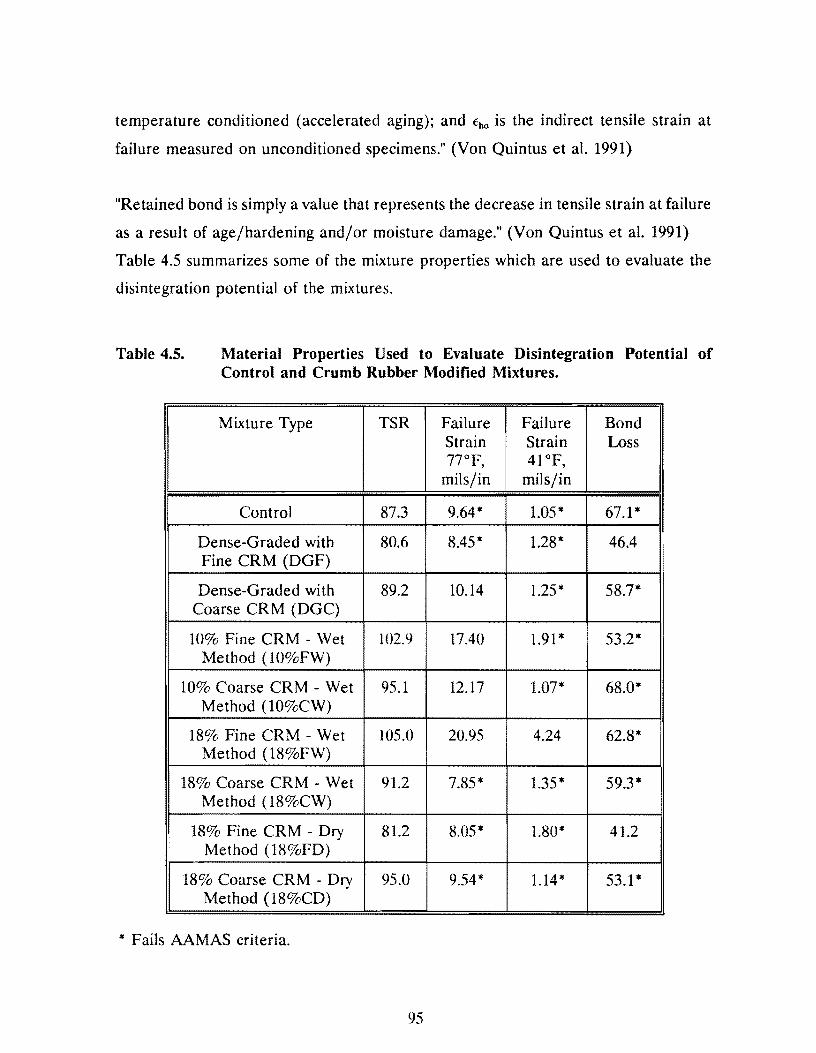
temperature conditioned (accelerated aging); and Eho is the indirect tensile strain at
failure measured on unconditioned specimens." (Von Quintus et al. 1991)
"Retained bond is simply a value that represents the decrease in tensile strain at failure
as a result of age/hardening and/or moisture damage." (Von Quintus et al. 1991)
Table 4.5 summarizes some of the mixture properties which are used to evaluate the
disintegration potential of the mixtures.
Table 4.5. Material Properties Used to Evaluate Disintegration Potential of Control and Crumb Rubber Modified Mixtures.
Mixture Type TSR Failure Failure Bond Strain Strain Loss 77°F, 41°F,
mils/in mils/in
Control 87.3 9.64* 1.05* 67.1 *
Dense-Graded with 80.6 8.45* 1.28* 46.4 Fine CRM (DGF)
Dense-Graded with 89.2 10.14 1.25* 58.7* Coarse CRM (DGC)
10% Fine CRM - Wet 102.9 17.40 1.91 * 53.2* Method ( 10%FW)
10% Coarse CRM - Wet 95.1 12.17 1.07* 68.0* Method ( 10%CW)
18% Fine CRM - Wet 105.0 20.95 4.24 62.8* Method (18%FW)
18% Coarse CRM - Wet 91.2 7.85* 1.35* 59.3* Method (18%CW)
18% Fine CRM - Dry 81.2 8.05* 1.80* 41.2 Method (18%FD)
18% Coarse CRM - Dry 95.0 9.54* 1.14* 53.1 * Method (18%CD)
* Fails AAMAS criteria.
95
All of the mixtures have a high tensile strength ratio indicating these mixtures would
not be susceptible to moisture damage. After accelerated aging, the failure strains at
77°F (25°C) are acceptable for four mixtures: DGC, 10%FW, 10%CW, 18%FW. All
of the mixtures except one (18%FW) fail the tensile strain criteria at 41°F (5°C). The
bonding loss represents the loss in tensile strain as a result of accelerated aging. All
of the mixtures failed the bonding loss criteria except two: DGF and 18%FD. These
two mixtures both contain fine rubber via the dry process.
4.6 Summary of Mixture Evaluation
Nine mixtures were evaluated in the laboratory. Three of these mixtures were designed
according to the standard TxDOT (C-14 Bulletin) design procedure. A control (Type
D) mixture was designed according to this method and two mixtures incorporating
crumb rubber (added dry as part of the aggregate): dense-graded with fine CRM
(DGF) and dense graded with coarse CRM (DGC). These two mixtures contain the
maximum amount of crumb rubber that could be added while still conforming to
standard mixture design criteria. The optimum amount of rubber which could be
incorporated in these dense-graded mixtures was about 0.5% by weight of the
aggregate. This would be equivalent to about 10% rubber by weight of the asphalt.
Six of the mne mixtures evaluated in the laboratory were designed according to
TxDOTs recently developed mixture design procedure for asphalt-rubber mixtures.
These mixtures are CMHB and similar in gradation to a stone mastic-type mixture.
These six different mixtures include both wet and dry processes for adding the crumb
rubber to the mix. Rubber concentration was varied and for comparison purposes all
rubber concentrations are expressed as a percent by weight of the asphalt whether a
dry or wet process was used. Another variable included here is the size of the rubber:
fine (-80 mesh) or coarse ( -10 mesh). These six mixtures are designated as follows:
96
10%FW (JO percent fine rubber, by weight of asphalt, via wet process);
10%CW (JO percent coarse rubber, by weight of asphalt, via wet process);
18%FW (18 percent fine rubber, by weight of asphalt, via wet process);
18%CW (18 percent coarse rubber, by weight of asphalt, via wet process);
18%FD (18 percent fine rubber, by weight of asphalt, via dry process); and
18%CD (18 percent coarse rubber, by weight of asphalt, via dry process).
Rutting Potential
Two test procedures were used to evaluate the rutting potential of the laboratory
mixtures: static and repeated load creep tests. Data from the static load creep test
were compared to AAMAS criteria which was developed to predict rutting potential.
Based on AAMAS criteria all of the mixtures except 2 are considered to have low
rutting potential (modulus at one hour). The mixtures designated as 10%CW and
18%CW are judged to have a moderate rutting potential. These 2 mixtures are the
only 2 containing coarse CRM via the wet process. When asphalt cement and CRM
are blended together at elevated temperatures for 1 hour or more (wet process), the
rubber particles tend to swell. Therefore, the coarse CRM rubber particles which were
incorporated through the wet process may be significantly larger than the coarse rubber
particles which were added via the dry process. It is likely that a different aggregate
gradation for these two mixtures (such as a larger top-size aggregate) might produce
acceptable, rut-resistant mixtures.
The repeated load creep test was performed to more closely simulate wheel loading
than the static creep test. Plastic deformation or relative movement among aggregate
particles is most effectively produced under dynamic loading conditions as the dynamic
effect of each repetition produces some level of relative movement. Based on the total
strain at the end of 10,000 cycles the mixtures were categorized as follows (Category
1 mixtures being the best):
97
Category 1: DGF, Control;
Category 2: 18%FD, DGC, 18%FW; and
Category 3: 18%CD, 10%FW, 10%CW, and 18%CW.
All of the creep tests performed thus far in this study (both repeated and static load
creep), were performed without confining pressure. The CMHB rubber mixtures
analyzed in this study are very similar in gradation to a stone mastic-type mixture.
When performing creep tests on these mixtures without confining pressure, these type
of mixtures may lack the lateral support that is present during the field. It is believed
that because of the aggregate interlock that exists in a dense-graded mixture,
unconfined uniaxial creep properties may be better for dense-graded mixtures than for
stone mastic-type mixtures. However, field performance may be better for a stone
mastic-type mixture. This important factor must be kept in mind when reviewing
unconfined uniaxial creep properties for both dense and CMHB mixtures. It is
appropriate to compare or rank CMHB mixtures against each other but it may not be
appropriate to compare CMHB mixtures to dense-graded mixtures.
Fatigue Cracking Potential
Using the AAMAS criteria for fatigue cracking (which was developed for dense-graded
mixtures), most of the crumb rubber modified mixtures (and the control mix) tested in
this study are more fatigue susceptible than the AAMAS standard mixture but may not
be any more susceptible than conventional dense-graded Type D mixtures currently
used in Texas. The mixture designated as 18%FW had a significantly better fatigue
resistance than the other mixtures. This mixture was also better than the AAMAS
standard mixture.
98
Based on indirect tensile test data, one mixture seemed to "stand-out" from all others
in terms of having significantly higher failure strains at all three test temperatures:
again, 18%FW.
Resilient modulus testing revealed that the addition of CRM in the dense-graded
mixtures caused a decrease in the resilient modulus. All of the CMHB crumb rubber
mixtures had lower stiffnesses than the dense-graded mixtures at all three temperatures.
It appears that CRM may have some propensity for decreasing the mixture's
temperature susceptibility. The 18%FW mixture had a markedly improved
temperature susceptibility.
Thennal Cracking
Tensile creep and tensile strength properties were used to evaluate thermal cracking
potential. To provide resistance to thermal cracking, a mixture should have a low
tensile creep modulus, but a relatively high tensile strength. The creep modulus of the
control mix is significantly higher than all of the crumb rubber modified mixtures (2 to
5 times higher). The indirect tensile strengths at 41°F (5 °C) and at a loading rate of
0.05 in/min (0.13 cm/min) for some of the crumb rubber mixtures were about the same
as (in one case higher than) the control mixture. Thus, some of the crumb rubber
mixtures (18%FW, DGC, and DGF) appear to offer greater resistance to thermal
cracking than the control mixture. A more thorough analysis of thermal cracking
potential was not complete at the time of this report.
Moisture Damage
Moisture damage was evaluated usmg tensile strength ratio (TSR) and resilient
modulus ratio (MMR). AAMAS criteria requires that these ratios should exceed a
value of 0.80 (for dense-graded mixtures). TSR for all nine mixtures exceeded the
minimum requirement of 0.80.
99

All of the mixtures, except two, exhibited excellent MMRs: DGF and 18%CD. These
mixtures have one thing in common in that they both contain rubber which was added
to the mixture as a dry process. However, the other mixtures which employed a dry
process had very good MMRs.
100
References
Anderson, D.A. and T.W. Kennedy, 1993. "Development of SHRP Binder Specification." Paper presented at the 1993 Annual Meeting of the Association of Asphalt Paving Technologists, Austin, Texas.
The Asphalt Handbook. 1989. Asphalt Institute, Lexington, Kentucky.
Austin Research Engineers, Inc., 1975, Asphalt Concrete Overlays of Flexible PavementsVolume 1, Development of New Design Criteria. Report No. FHWA-RD-75-75. Federal Highway Administration, U.S. Department of Transportation, Washington, D.C.
Bolk, H.J.N.A., 1981. The Creep Test, SCW Record 5, Study Centre for Road Construction, The Netherlands.
Button, J.W. and D.N. Little, 1986. Asphalt Additives for Increased Pavement Flexibility. Report 471-ZF, Texas Transportation Institute, Texas A&M University, College Station.
Collins, J.H. and W.J. Mikols, 1985. "Block Copolymer Modification of Asphalt Intended for Surface Dressing Applications." Proceedings of the Association of Asphalt Paving Technologists, Vol. 54, pp. 1-17.
Finn, F.N., C. Saraf, R. Kulkarni, K. Nair, W. Smith and A. Abdullah, 1977. Development of Pavement Structural Subsystems. Final Report NCHRP Project 1-lOB, Transportation Research Board, National Research Council, Washington, D.C.
Huber, G.A., 1993. "SUPERPAVE™ Software: A Tool for Mixture Design." Paper presented at the 1993 Annual Meeting of the Association of Asphalt Paving Technologists, Austin, Texas.
International Surfacing, Inc. Guide Specification for Open, Dense, and Gap-Graded Asphalt Concrete Pavements with Asphalt-Rubber Binder. No date. International Surfacing, Inc., Chandler, Arizona.
King, G, 1993. "Dynamic Oscillatory Shear Rheometer." Koch Materials Company Newsletter, Spring, 1993, Terre Haute, Indiana.
101
Kennedy, T.W. and J.S. Moulthrop, 1993. "Understanding the SUPERPAVE™ System." Paper presented at the 1993 Pacific Rim Conference, Seattle, Washington.
Little, D.N. and Youssef, H., 1992. Improved ACP Mixture Design: Development and Verification. Report 1170-lF, Texas Transportation Institute, Texas A&M University, College Station.
Mahboub K. and D.N. Little, 1988. Improved Asphalt Concrete Mixture Design Procedure. Report 474-lF, Texas Transportation Institute, Texas A&M University, College Station.
Pavlovich, R.D., T.S. Shuler, and J.C. Rosner, 1979. Chemical and Physical Properties of Asphalt-Rubber. Report ADOT-RS-15(133), Arizona DOT.
Rauhut, J.B., R.L. Lytton and M.I. Darter, 1984. Pavement Damage Functions for Cost Allocation Volume 1, Damage Functions and Load Equivalence Factors. Report FHWA/RD-84/018, Federal Highway Administration, U.S. Department of Transportation, Washington, D.C.
Shuler, T.S., C.K. Adams, and M. Lamborn, 1985. Asphalt Rubber Binder Laboratory Peiformance. Report 347-lF, Texas Transportation Institute, Texas A&M University, College Station.
Standard Specifications for Constrnction of Highways, Streets and Bridges. 1993. The Texas Department of Transportation, Austin.
Von Quintus, H.L., J.A. Scherocman, C.S. Hughes and T.W. Kennedy, 1991. AsphaltAggregate Mixture Analysis System (AAMAS). NCHRP Report 338, Transportation Research Board, National Research Council, Washington, D.C.
102
Appendix A
Laboratory Data for Control Mix
(Conventional Type D Mix, No Rubber)
103

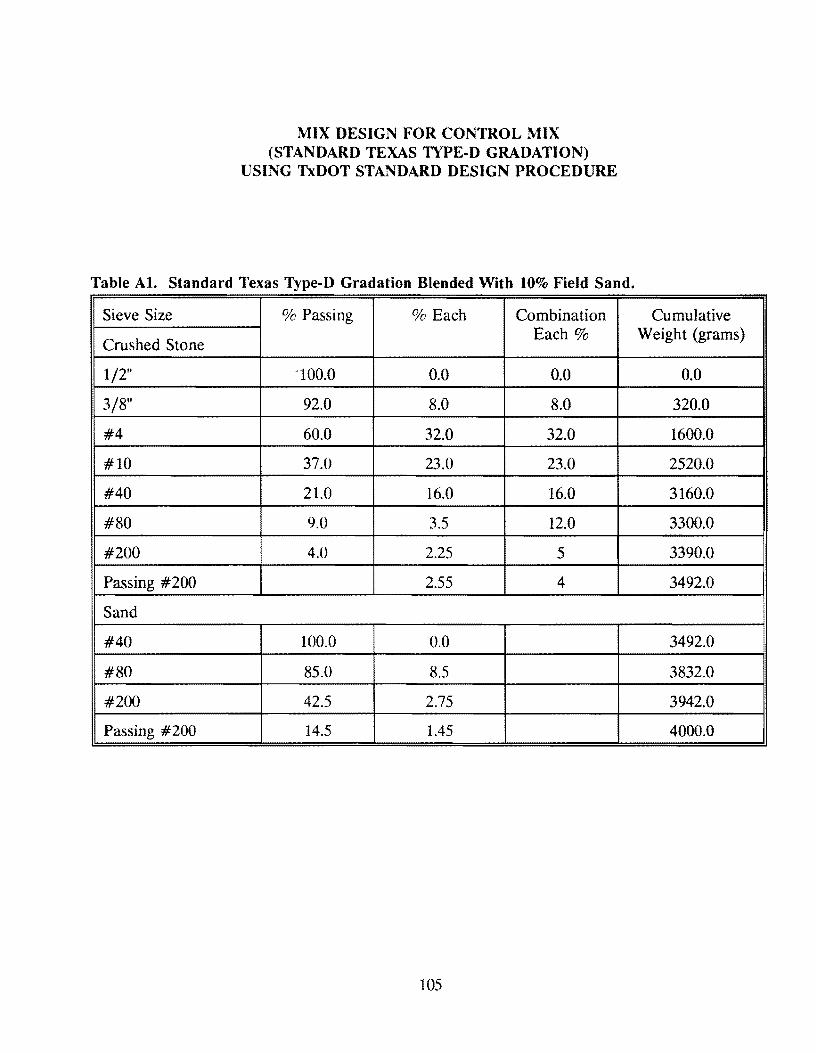
MIX DESIGN FOR CONTROL MIX (STANDARD TEXAS TYPE-D GRADATION)
USING TxDOT STANDARD DESIGN PROCEDURE
Table Al. Standard Texas Type-D Gradation Blended With 10% Field Sand.
I Sieve Size % Passing % Each Combination
Crushed Stone Each%
1/2" -100.0 0.0 0.0
3/8" 92.0 8.0 8.0
#4 60.0 32.0 32.0
#10 37.0 23.0 23.0
#40 21.0 16.0 16.0
#80 9.0 3.5 12.0
#200 4.0 2.25 5
Passing #200 2.55 4
Sand
#40 100.0 0.0
#80 85.0 8.5
#200 42.5 2.75
Passing #200 14.5 1.45
105
Cumulative Weight (grams)
0.0
320.0
1600.0
2520.0
3160.0
3300.0
3390.0
3492.0
3492.0
3832.0
3942.0
4000.0
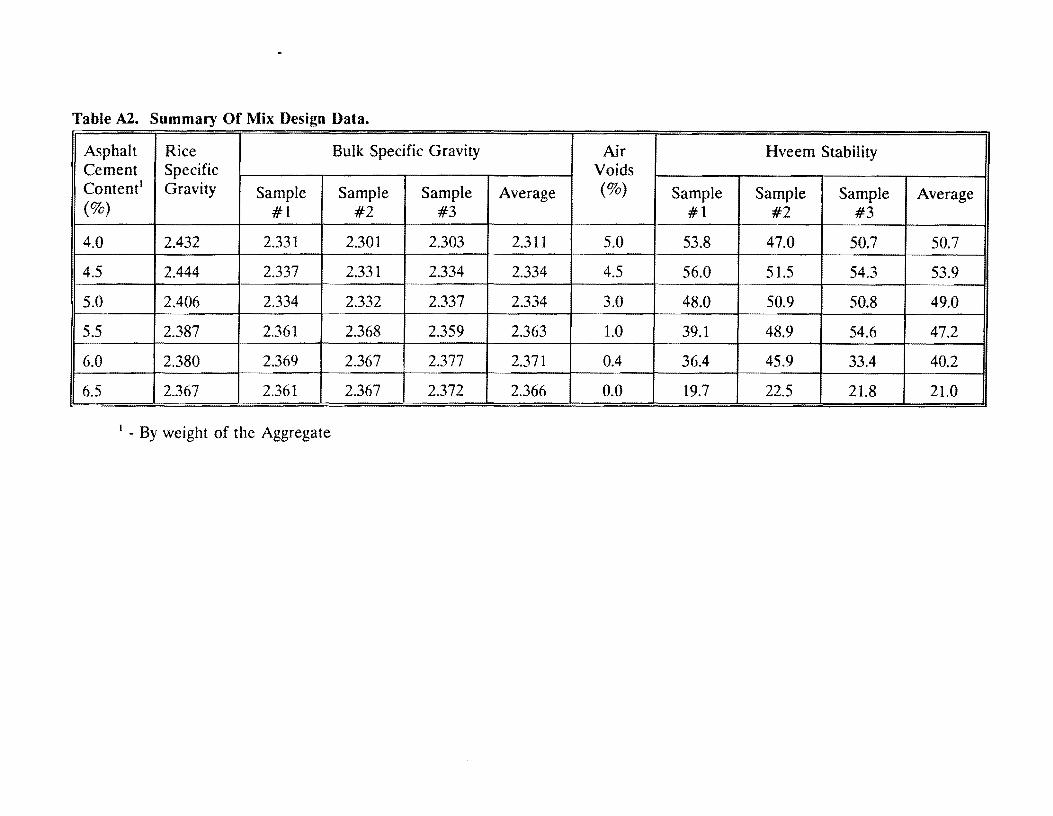
Table A2. Summary Of Mix Design Data . .
Asphalt Rice Bulk Specific Gravity Air Hveem Stability Cement Specific Voids Content' Gravity Sample Sample Sample Average (%) Sample Sample Sample Average (%) #1 #2 #3 #1 #2 #3
4.0 2.432 2.331 2.301 2.303 2.311 5.0 53.8 47.0 50.7 50.7
4.5 2.444 2.337 2.331 2.334 2.334 4.5 56.0 51.5 54.3 53.9
5.0 2.406 2.334 2.332 2.337 2.334 3.0 48.0 50.9 50.8 49.0
5.5 2.387 2.361 2.368 2.359 2.363 1.0 39.1 48.9 54.6 47.2
6.0 2.380 2.369 2.367 2.377 2.371 0.4 36.4 45.9 33.4 40.2
6.5 2.367 2.361 2.367 2.372 2.366 0.0 19.7 22.5 21.8 21.0
1 - By weight of the Aggregate
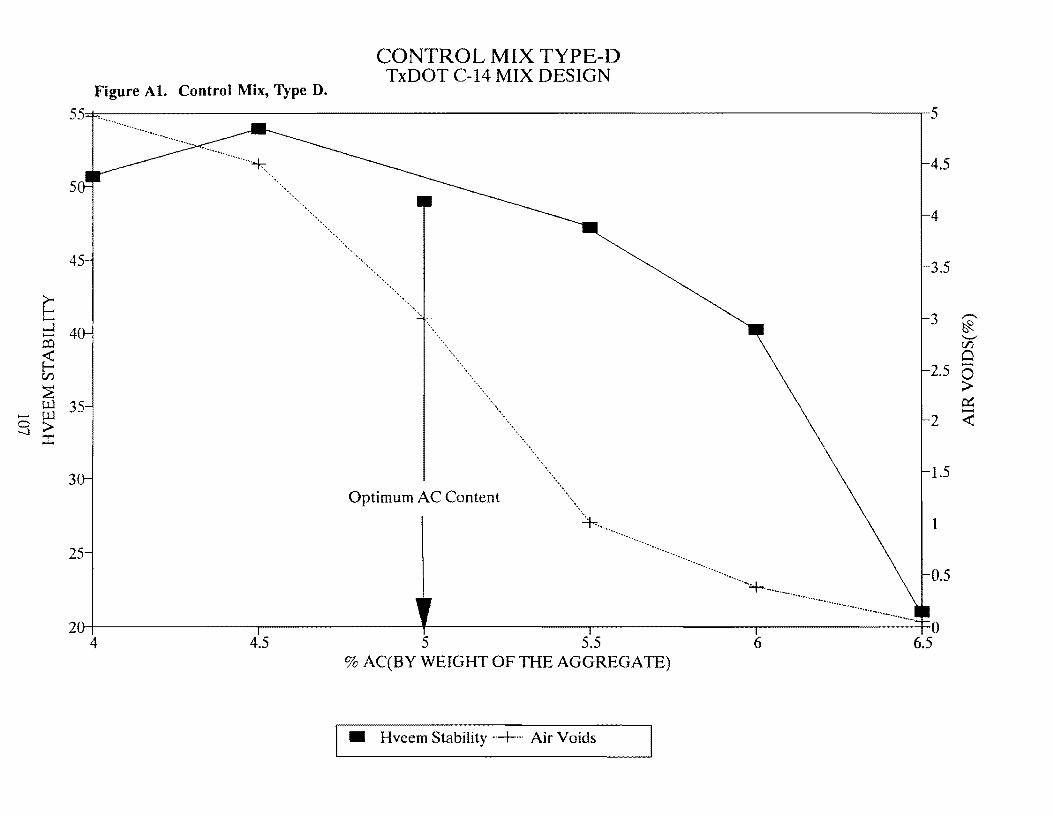
45
~ -d 4 co ~ r:r;
~ u.l 35
- u.l 0 > -..-J ::r::
3
25
Figure Al. Control Mix, Type D.
CONTROL MIX TYPE-D TxDOT C-14 MIX DESIGN
Optimum AC Content
+.. .........•
............................ _____________________________________ __
5
4.5
4
3.5
3
2.5
2
1.5
1
0.5
21-+-~~~~~~--,.~~~~~~~-t-~~~~-----,...----~--~~~-.----------~~-1--0
4 4.5 5 5.5 6 6.5 % AC(BY WEIGHT OF THE AGGREGATE)
• Hveem Stability··+·· Air Voids
,-...,
~ "'-" r:r; Cl -0 > ~ -<!'.'.
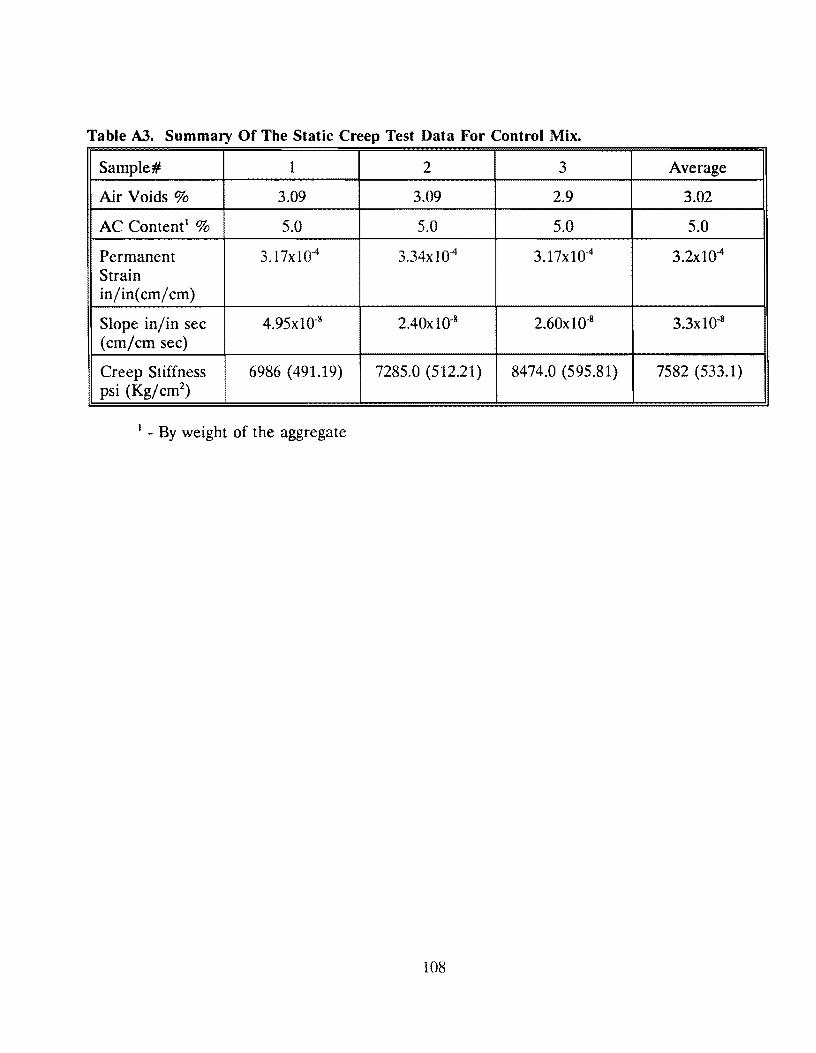
Table A3. Summary Of The Static Creep Test Data For Control Mix.
Sample# 1 2 3 Average
Air Voids% 3.09 3.09 2.9 3.02
AC Content1 % 5.0 5.0 5.0 5.0
Permanent 3.17x10⁴ 3.34x10⁴ 3.17xl04 3.2x10⁴
Strain in/in( cm/cm)
Slope in/in sec 4.95xl0·8 2.40xl0·8 2.6ox10-s 3.3xt0·8
(cm/cm sec)
Creep Stiffness 6986 (491.19) 7285.0 (512.21) 8474.0 (595.81) 7582 (533.1) psi (Kg/ cm2
)
1 - By weight of the aggregate
108
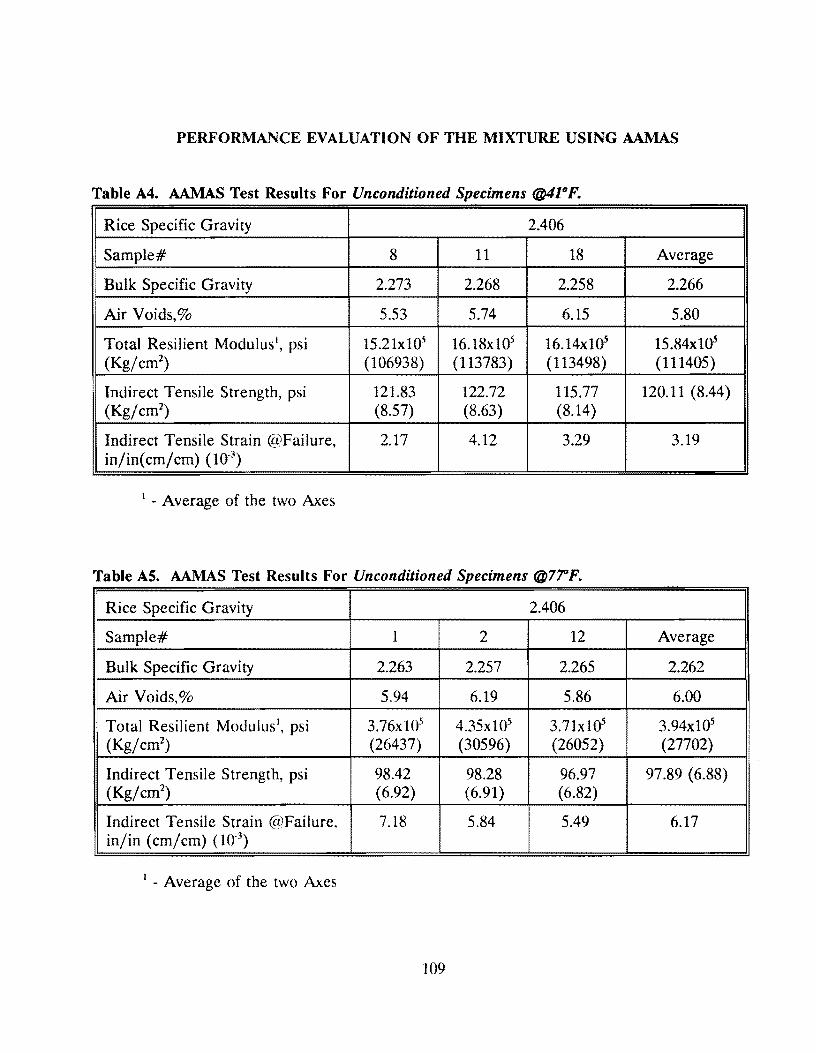
PERFORMANCE EVALUATION OF THE MIXTURE USING AAMAS
Table A4. AAMAS Test Results For Unconditioned Specimens @41°F.
Rice Specific Gravity 2.406
Sample# 8 11 18 Average
Bulk Specific Gravity 2.273 2.268 2.258 2.266
Air Voids,% 5.53 5.74 6.15 5.80
Total Resilient Modulus 1, psi 15.21xl05 16.18x10⁵ 16.14x10⁵ 15.84x10⁵
(Kg/cm2) (106938) (113783) (113498) (111405)
Indirect Tensile Strength, psi 121.83 122.72 115.77 120.11 (8.44) (Kg/cm2
) (8.57) (8.63) (8.14)
Indirect Tensile Strain @Failure, 2.17 4.12 3.29 3.19 in/in(cm/cm) (10-3
)
1 - Average of the two Axes
Table AS. AAMAS Test Results For Unconditioned Specimens @77°F.
Rice Specific Gravity 2.406
Sample# 1 2 12 Average
Bulk Specific Gravity 2.261 2.257 2.265 2.262
Air Voids,% 5.94 6.19 5.86 6.00
Total Resilient Modulus1, psi 3.76xl05 4.35xl05 3.7lxl05 3.94xl05
(Kg/cm2) (26437) (30596) (26052) (27702)
Indirect Tensile Strength, psi 98.42 98.28 96.97 97.89 (6.88) (Kg/cm2
) (6.92) (6.91) (6.82)
Indirect Tensile Strain @Failure, 7.18 5.84 5.49 6.17 in/in (cm/cm) (10-3
)
1 - Average of the two Axes
109
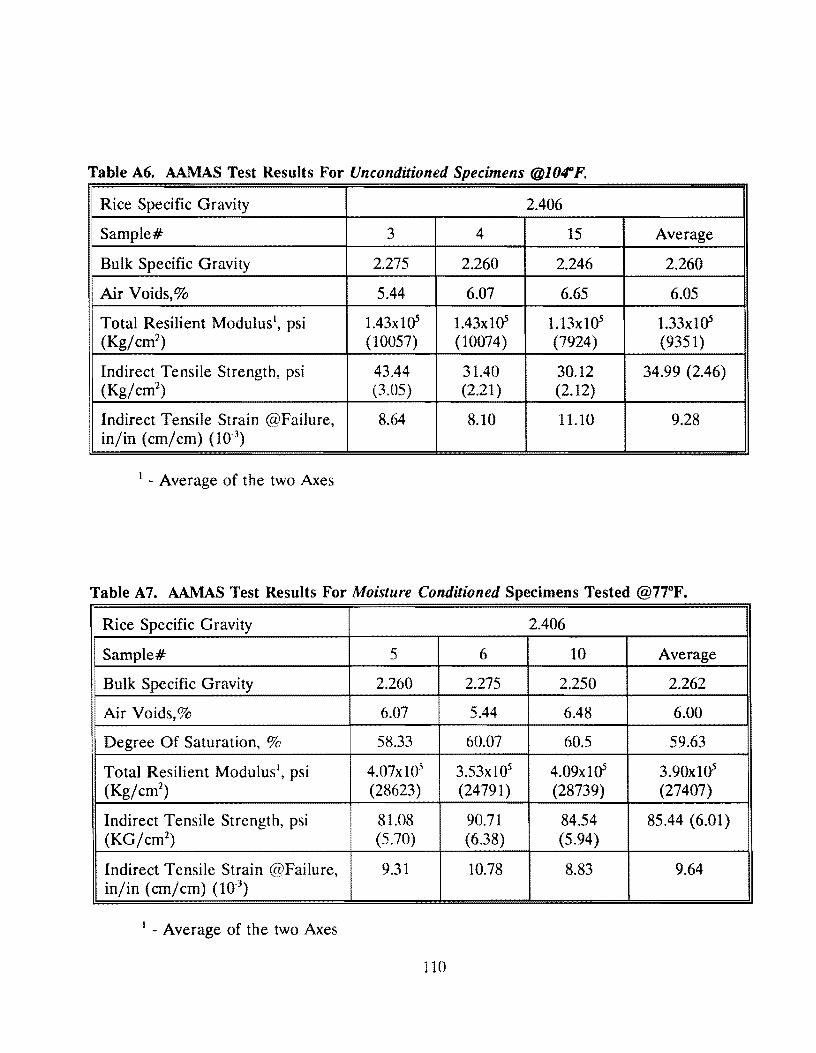
Table A6. AAMAS Test Results For Unconditioned Specimens @l04°F.
Rice Specific Gravity 2.406
Sample# 3 4 15 Average
1 Bulk Specific Gravity 2.275 2.260 2.246 2.260
Air Voids,% 5.44 6.07 6.65 6.05
Total Resilient Modulus1, psi 1.43x10⁵ 1.43xln5 l.13x105 1.33x1D5
(Kg/cm2) (10057) (10074) (7924) (9351)
Indirect Tensile Strength, psi 43.44 31.40 30.12 34.99 (2.46) (Kg/cm2
) (3.05) (2.21) (2.12)
Indirect Tensile Strain @Failure, 8.64 8.10 11.10 9.28 in/in (cm/cm) (10-3
)
1 - Average of the two Axes
Table A7. AAMAS Test Results For Moisture Conditioned Specimens Tested @77°F.
Rice Specific Gravity 2.406
Sample# 5 6 10 Average
Bulk Specific Gravity 2.260 'J ~ .L50 2.262
Air Voids,% 6.07 5.44 6.48 6.00
Degree Of Saturation, % 58.33 60.07 60.5 59.63
Total Resilient Modulus1, psi 4.07xl05 3.53xl05 4.09x10⁵ 3.90xl05
(Kg/cm2) (28623) (24791) (28739) (27407)
Indirect Tensile Strength, psi 81.08 90.71 84.54 85.44 (6.01) (KG/cm2
) (5.70) (6.38) (5.94)
Indirect Tensile Strain @Failure, 9.31 10.78 8.83 9.64 in/in (cm/cm) (10-3
)
1 - Average of the two Axes
110
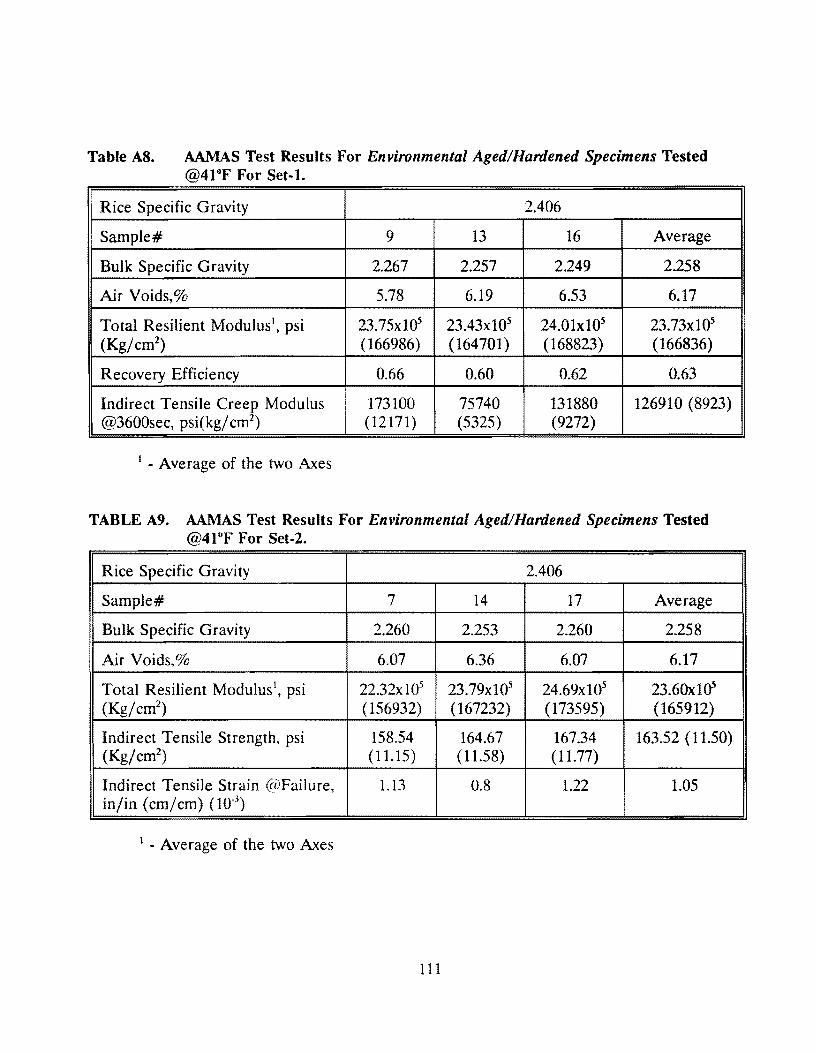
Table AS. AAMAS Test Results For Environmental Aged/Hardened Specimens Tested @4l°F For Set-1.
Rice Specific Gravity 2.406
Sample# 9 13 16 Average
Bulk Specific Gravity 2.267 2.257 2.249 2.258
Air Voids,% 5.78 6.19 6.53 6.17
Total Resilient Modulus1, psi 23.75xl05 23.43xl05 24.QlxlQ5 23.73xla5 (Kg/cm2
) (166986) (164701) (168823) (166836)
Recovery Efficiency 0.66 0.60 0.62 0.63
Indirect Tensile Creep Modulus 173100 75740 131880 126910 (8923) @3600sec, psi(kg/ cm2
) (12171) (5325) (9272)
1 - Average of the two Axes
TABLE A9. AAMAS Test Results For Environmental Aged/Hardened Specimens Tested @41°F For Set-2.
Rice Specific Gravity 2.406
Sample# 7 14 17 Average
Bulk Specific Gravity 2.260 2.253 2.260 2.258
Air Voids,% 6.07 6.36 6.07 6.17
Total Resilient Modulus\ psi 22.32x10⁵ 23.79xl05 24.69xl05 23.60xla5 (Kg/cm2
) (156932) (167232) (173595) (165912)
Indirect Tensile Strength, psi 158.54 164.67 167.34 163.52 (11.50) (Kg/cm2
) (11.15) (11.58) (11.77)
Indirect Tensile Strain @Failure, 1.13 0.8 1.22 1.05 in/in (cm/cm) (10"3
)
1 - Average of the two Axes
111
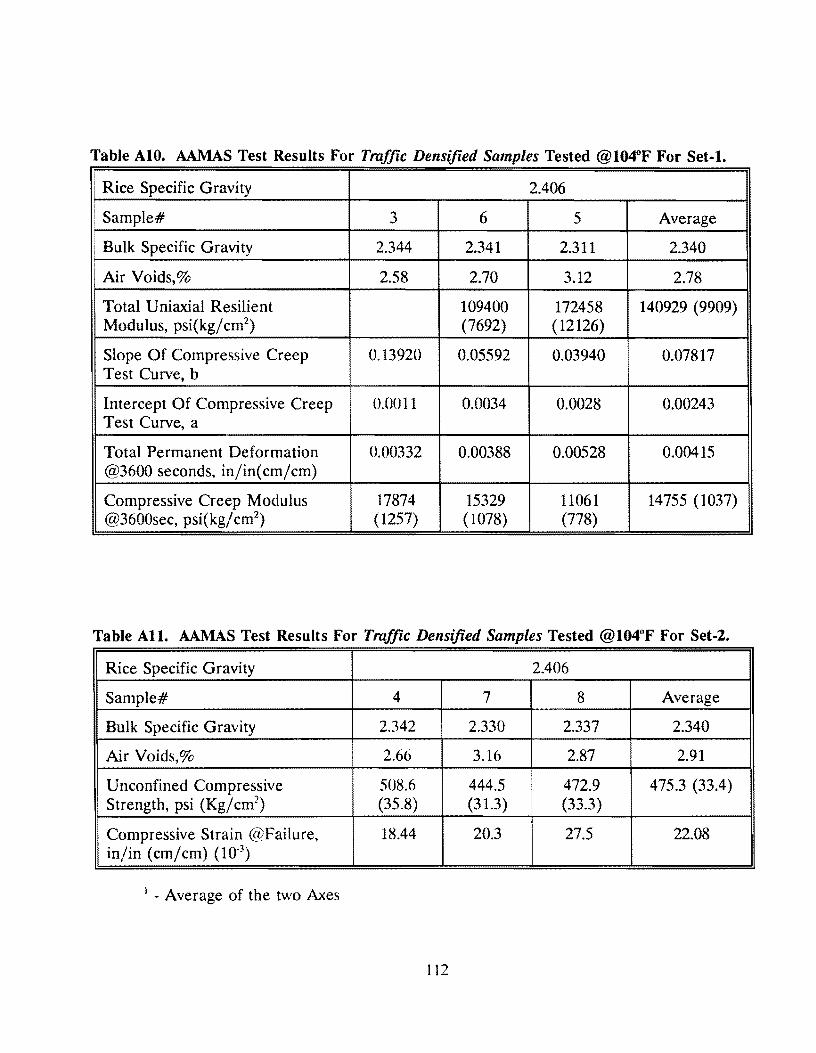
Table AlO. AAMAS Test Results For Traffic Densified Samples Tested @104°F For Set-1.
Rice Specific Gravity 2.406
Sample# 3 6 5 Average
• Bulk Specific Gravity 2.344 2.341 2.311 2.340
Air Voids,% 2.58 2.70 3.12 2.78
Total Uniaxial Resilient 109400 172458 140929 (9909) Modulus, psi(kg/cm2
) (7692) (12126)
Slope Of Compressive Creep 0.13920 0.05592 0.03940 0.07817 Test Curve, b
Intercept Of Compressive Creep 0.0011 0.0034 0.0028 0.00243 Test Curve, a
Total Permanent Deformation 0.00332 0.00388 0.00528 0.00415 @3600 seconds, in/in( cm/ cm)
Compressive Creep Modulus 17874 15329 11061 14755 (1037) @3600sec, psi(kg/ cm2
) (1257) (1078) (778)
Table All. AAMAS Test Results For Traffic Densified Samples Tested @104°F For Set-2.
Rice Specific Gravity 2.406
Sample# 4 7 8 Average
Bulk Specific Gravity 2.342 2.330 2.337 2.340
Air Voids,% 2.66 3.16 2.87 2.91
Unconfined Compressive 508.6 444.5 472.9 475.3 (33.4) Strength, psi (Kg/ cm2
) (35.8) (31.3) (33.3)
Compressive Strain @Failure, 18.44 20.3 27.5 22.08 in/in (cm/cm) (10"3
)
1 - Average of the two Axes
112
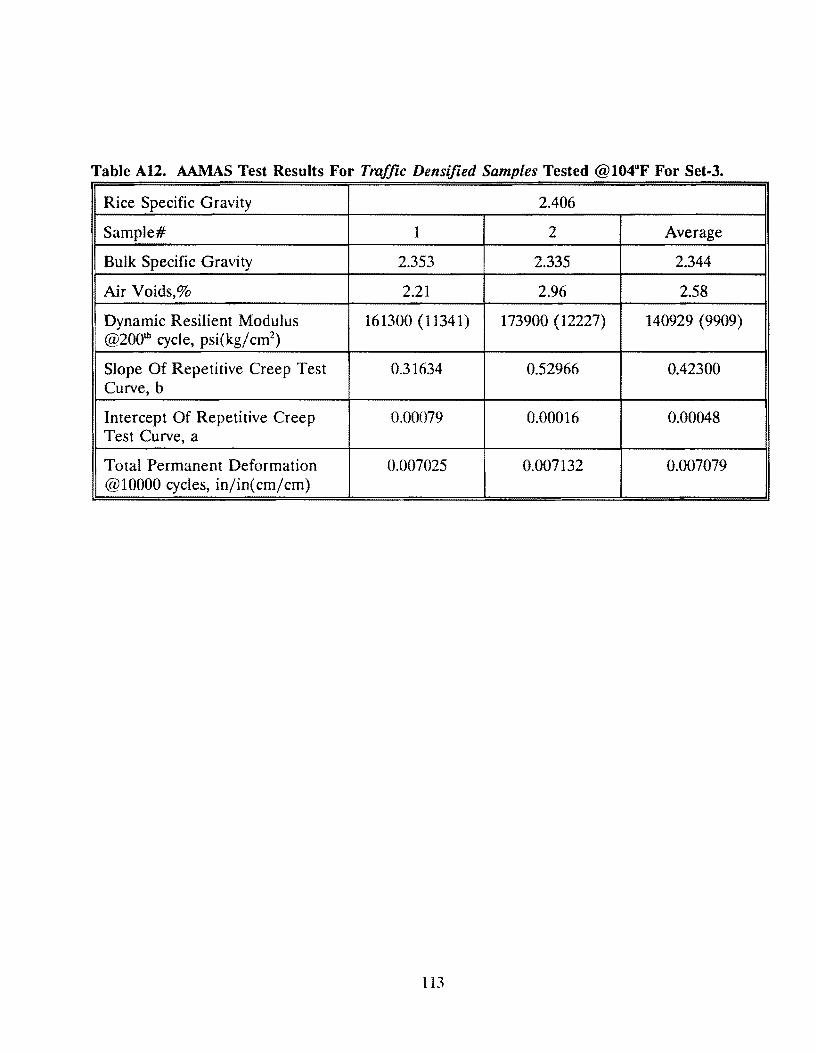
Table Al2. AAMAS Test Results For Traffic Densified Samples Tested @104°F For Set-3.
Rice Specific Gravity 2.406
Sample# 1 2 Average
Bulk Specific Gravity 2.353 2.335 2.344
Air Voids,% 2.21 2.96 2.58
1 Dynamic Resilient Modulus
· @2001h cycle, psi(kg/cm2)
161300 (11341) 173900 (12227) 140929 (9909)
Slope Of Repetitive Creep Test 0.31634 0.52966 0.42300 Curve, b
Intercept Of Repetitive Creep 0.00079 0.00016 0.00048 Test Curve, a
Total Permanent Deformation 0.007025 0.007132 0.007079 @10000 cycles, in/in( cm/cm)
113

Appendix B
Laboratory Data for DGF Mixture
(Dense-Graded, Type D Mixture with Fine Rubber)
115


MIX DESIGN FOR OPTIMUM FINE CRM (-#80 SIEVE SIZE) IN CONTROL MIX (STANDARD TEXAS TYPE-D GRADATION)
USING STANDARD TxDOT DESIGN PROCEDURE
STEP 1: The objective in this section is to determine the optimum rubber content with minimum changes in aggregate gradation according to TxDOTs standard design procedure.
Table Bl.
Sieve Size
Standard Texas Type-D Gradation Blended With 10% Field Sand and 0.2%1
Fine (-80) CRM.
% Passing % Each Combination Cumulative
Crushed Stone Each% Weight (grams)
1/2" 100.0 0.0 0.0 0.0
3/8" 92.0 8.0 8.0 320.0
#4 60.0 32.0 32.0 1600.0
#10 37.0 23.0 23.0 2520.0
#40 21.0 16.0 16.0 3160.0
• #80 9.0 3.5 12.0 3300.0
#200 4.0 2.25 5 3390.0
Passing #200 2.55 4 3492.0
Sand
#40 100.0 0.0 3492.0
#80 85.0 8.5 3832.0
#200 42.5 2.75 3921.02
Passing #200 14.5 1.45 3979.0
By weight of the aggregate. 2 Since the maximum nominal size of the rubber is #80 size equivalent volume of
the sand is replaced on #200 sieve size.
117
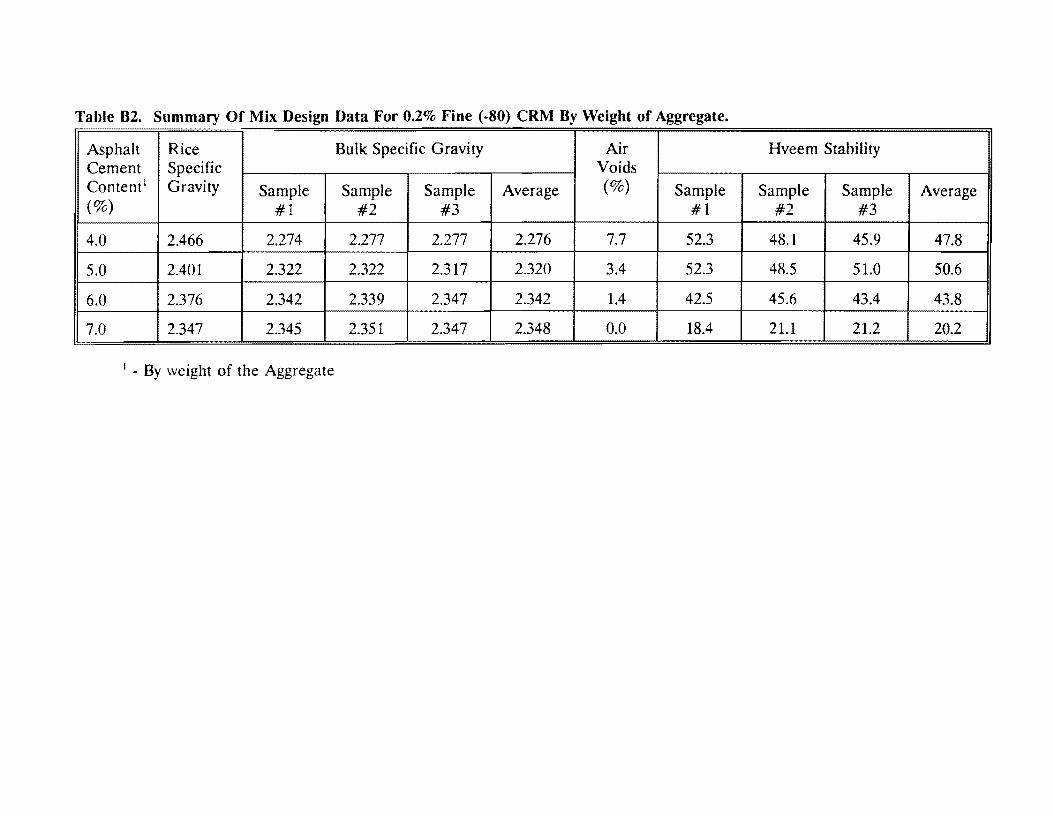
Table 82. Summary Of Mix Design Data For 0.2% Fine (-80) CRM By Weight of Aggregate.
Asphalt Rice Bulk Specific Gravity Air Hveem Stability Cement Specific Voids Content 1 Gravity Sample Sample Sample Average (%) Sample Sample Sample Average (%) #1 #2 #3 #1 #2 #3
4.0 2.466 2.274 2.277 2.277 2.276 7.7 52.3 48.1 45.9 47.8
5.0 2.401 2.322 2.322 2.317 2.320 3.4 52.3 48.5 51.0 50.6
6.0 2.376 2.342 2.339 2.347 2.342 1.4 42.5 45.6 43.4 43.8
7.0 2.347 2.345 2.351 2.347 2.348 0.0 18.4 21.1 21.2 20.2
1 - By weight of the Aggregate
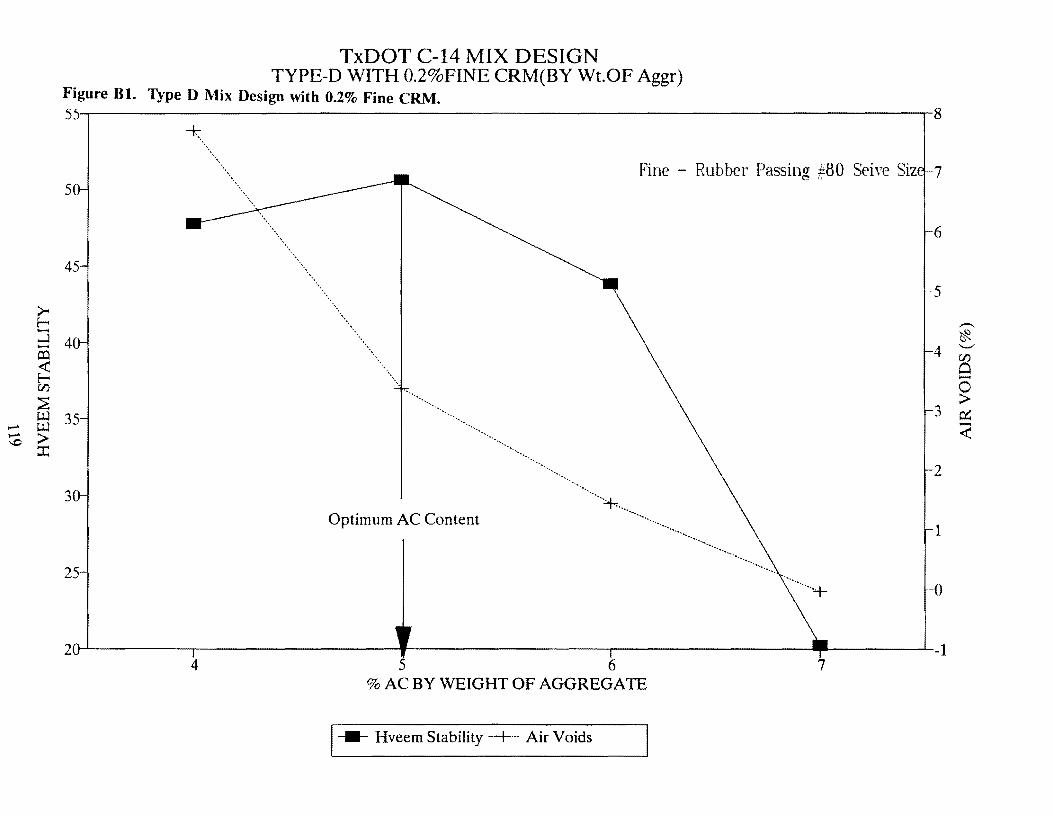
TxDOT C-14 MIX DESIGN TYPE-D WITH 0.2%FINE CRM(BY Wt.OF Aggr)
Figure Bl. Type D Mix Design with 0.2% Fine CRM. 55....,.----------------------------------------------------------------------------r-8
-+: ...... '·· ... . 5
45
3
25
4
·, ·, "._
·•.
Fine - Rubber Passing #80 SeiYe Siz 7
6
... 2
Optimum AC Content 1
5 6 7 % AC BY WEIGHT OF AGGREGATE
1--- Hveem Stability .. +··· Air Voids
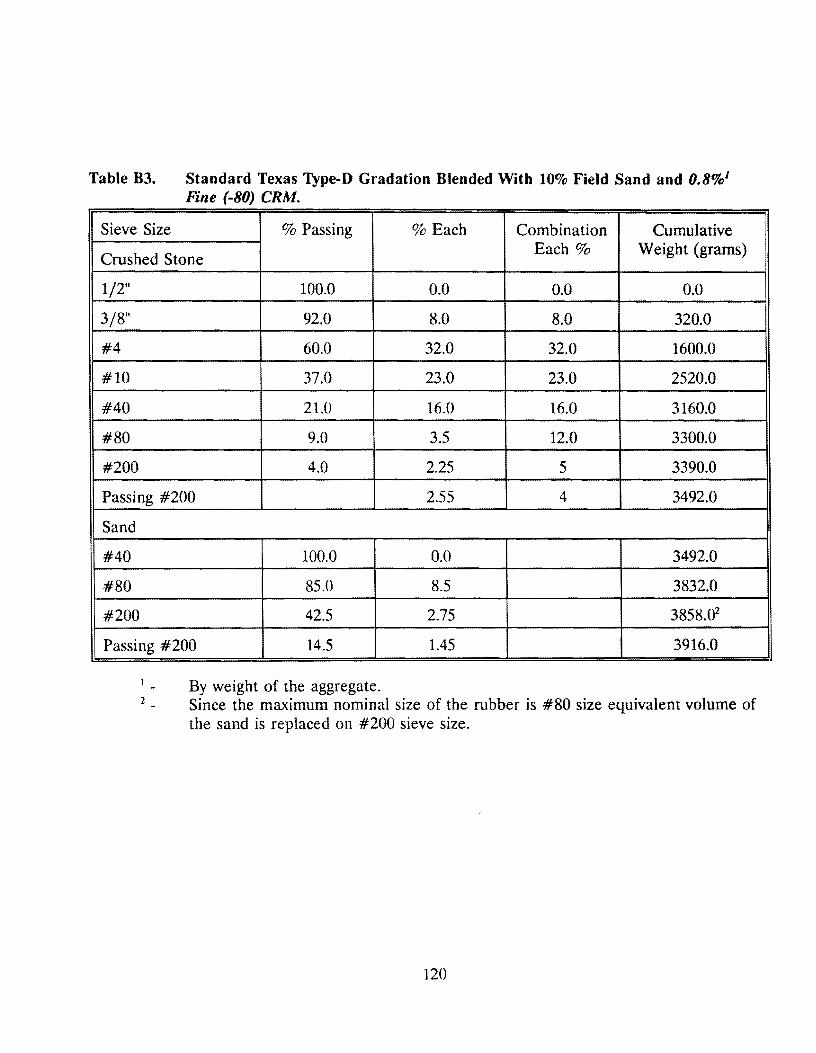
Table B3.
Sieve Size
Standard Texas Type-D Gradation Blended With 10% Field Sand and 0.8%1
Fine (-80) CRM.
% Passing % Each Combination Cumulative
Crushed Stone Each% Weight (grams)
1/211 100.0 0.0 0.0 0.0
3/8" 92.0 8.0 8.0 320.0
#4 60.0 32.0 32.0 1600.0
#10 37.0 23.0 23.0 2520.0
#40 21.0 16.0 16.0 3160.0
#80 9.0 3.5 12.0 3300.0
#200 4.0 2.25 5 3390.0
Passing #200 2.55 4 3492.0
Sand
#40 100.0 0.0 3492.0
#80 85.0 8.5 3832.0
#200 42.5 2.75 3858.02
Passing #200 14.5 1.45 3916.0
By weight of the aggregate. 2 Since the maximum nominal size of the rubber is #80 size equivalent volume of
the sand is replaced on #200 sieve size.
120
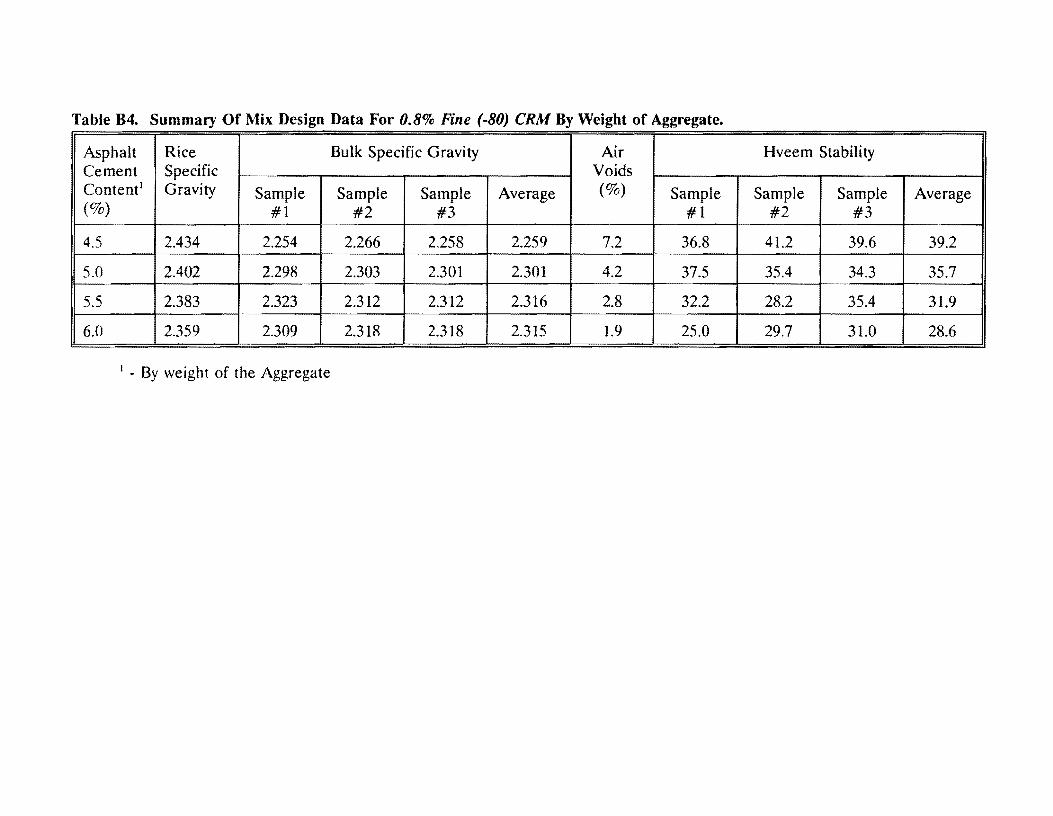
Table 84. Summary Of Mix Design Data For 0.8% Fine (-80) CRM By Weight of Aggregate.
Asphalt Rice Bulk Specific Gravity Air Hveem Stability Cement Specific Voids Content1 Gravity Sample Sample Sample Average (%) Sample Sample Sample Average (%) #1 #2 #3 #1 #2 #3
4.5 2.434 2.254 2.266 2.258 2.259 7.2 36.8 41.2 39.6 39.2
5.0 2.402 2.298 2.303 2.301 2.301 4.2 37.5 35.4 34.3 35.7
5.5 2.383 2.323 2.312 2.312 2.316 2.8 32.2 28.2 35.4 31.9
6.0 2.359 2.309 2.318 2.318 2.315 1.9 25.0 29.7 31.0 28.6
1 - By weight of the Aggregate
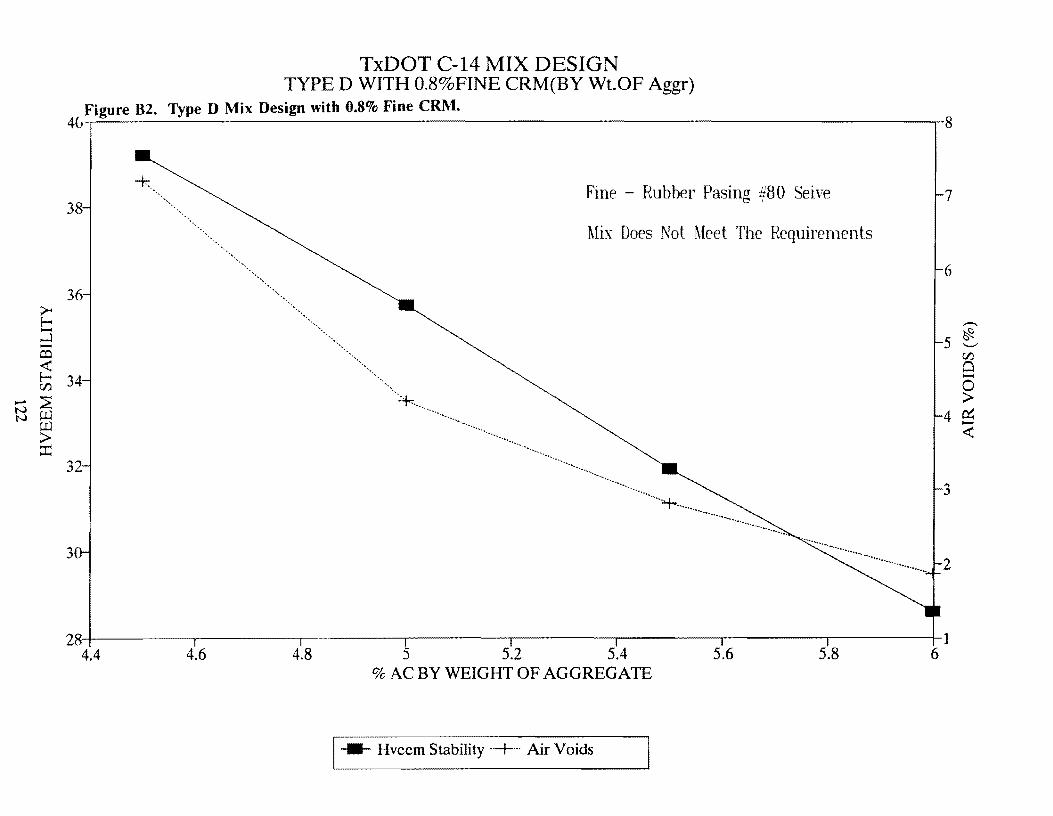
>-r--....l -co <( r-{/j
....... ~ ~ u..l
u..l > ::r:
TxDOT C-14 MIX DESIGN TYPED WITH 0.8%FINE CRM(BY Wt.OF Aggr)
Figure 82. Type D Mix Design with 0.8% Fine CRM. 4&-,--'-~~~~~~~~~~~~~~~~~~~~~~~~~~~~~~~~~~~~---.-s
-+. 38
36
34
32
3
.. · .. · ..
'· .... ·.
Fine - Rubber Pasing #80 Seive 7
Mix Does Not Meet The Requirements
6
······+ .. ·········~~~ ......
···--············· .............. _
3
····--··-············--......................... 2
28'-l-~~~~~~~~-.~~~~--,-~~~~...-~~~--.~~~~-r-~~~~-.--~~~--+-1
4.4 4.6 4.8 5 5.2 5.4 5.6 5.8 6 % AC BY WEIGHT OF AGGREGATE
1-11- Hveem Stability··+·-· Air Voids
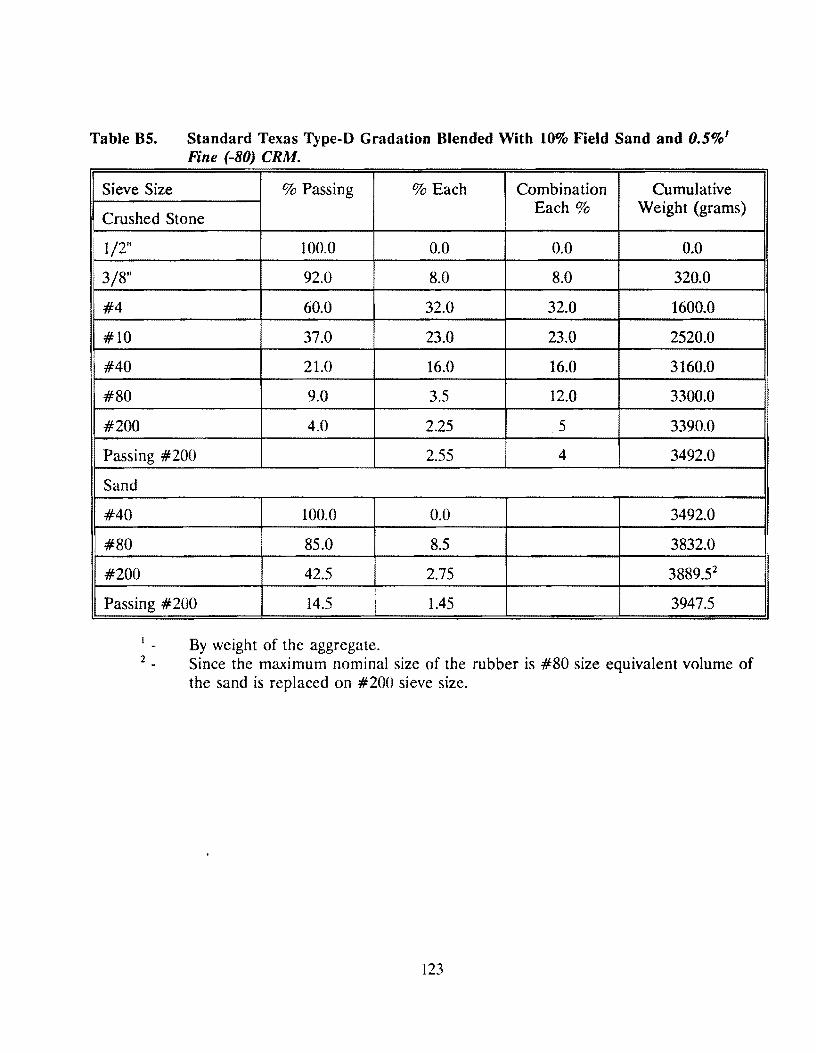
Table 85.
Sieve Size
Standard Texas Type-D Gradation Blended With 10% Field Sand and 0.5%1
Fine (-80) CRM.
% Passing % Each Combination Cumulative
. Crushed Stone Each% Weight (grams)
1/2" 100.0 0.0 0.0 0.0
3/8" 92.0 8.0 8.0 320.0
#4 60.0 32.0 32.0 1600.0
#10 37.0 23.0 23.0 2520.0
#40 21.0 16.0 16.0 3160.0
#80 9.0 3.5 12.0 3300.0
#200 4.0 2.25 5 3390.0
Passing #200 2.55 4 3492.0
Sand
#40 100.0 0.0 3492.0
#80 85.0 8.5 3832.0
#200 42.5 2.75 3889.52
Passing #200 14.5 1.45 3947.5
By weight of the aggregate. 2 Since the maximum nominal size of the rubber is #80 size equivalent volume of
the sand is replaced on #200 sieve size.
123
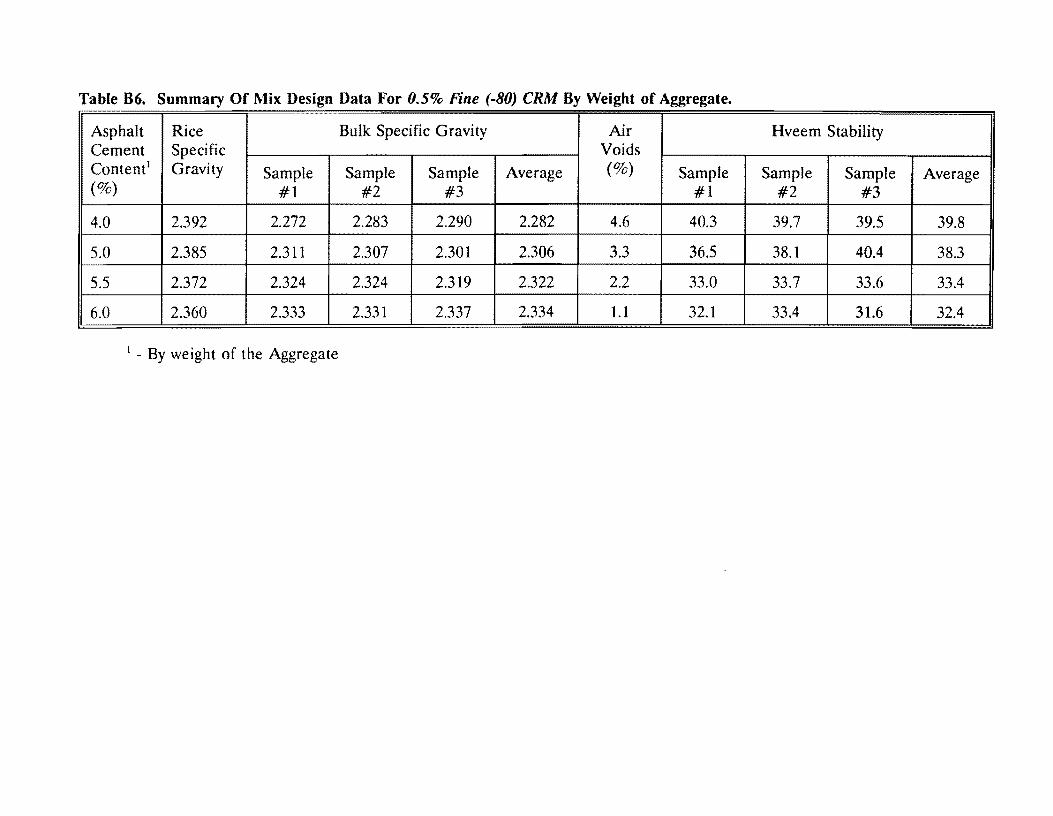
Table 86. Summary Of Mix Design Data For 0.5% Fine (-80) CRM By Weight of Aggregate.
Asphalt Rice Bulk Specific Gravity Air Hveem Stability Cement Specific Voids Content1 Gravity Sample Sample Sample Average (%) Sample Sample Sample Average (%) #1 #2 #3 #1 #2 #3
4.0 2.392 2.272 2.283 2.290 2.282 4.6 40.3 39.7 39.5 39.8
5.0 2.385 2.311 2.307 2.301 2.306 3.3 36.5 38.1 40.4 38.3
5.5 2.372 2.324 2.324 2.319 2.322 2.2 33.0 33.7 33.6 33.4
6.0 2.360 2.333 2.331 2.337 2.334 1.1 32.1 33.4 31.6 32.4
1 - By weight of the Aggregate
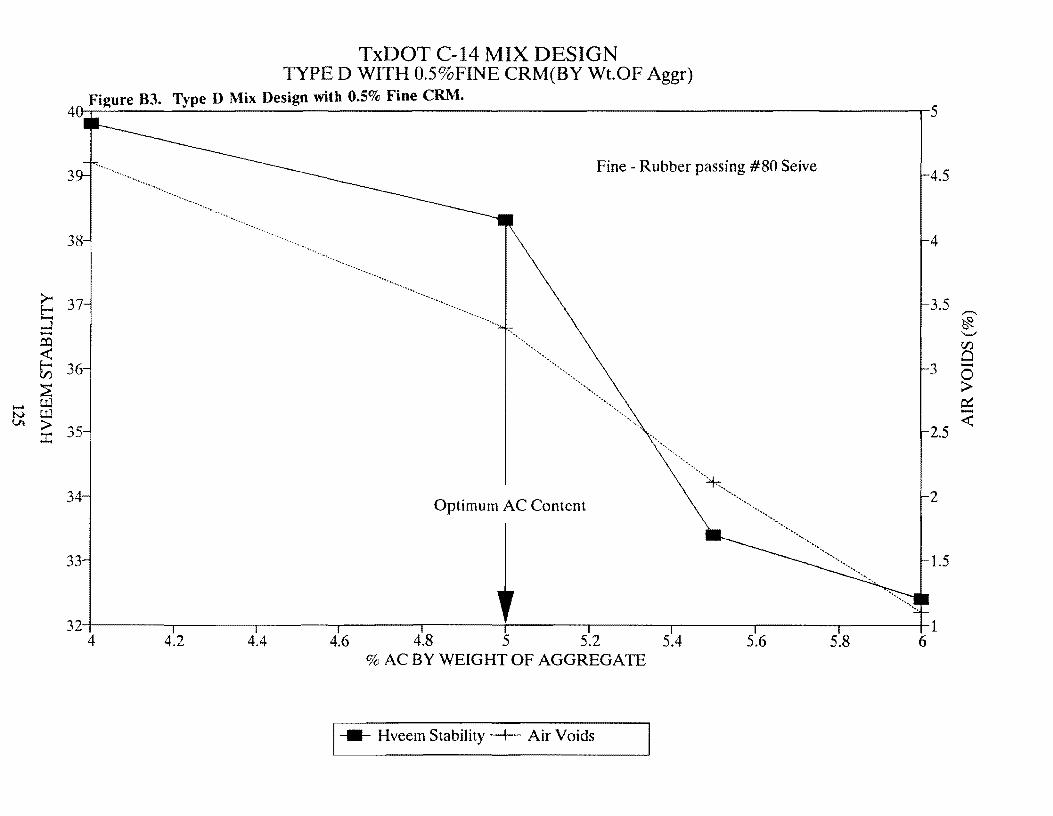
TxDOT C-14 MIX DESIGN TYPED WITH 0.5%FINE CRM(BY Wt.OF Aggr)
Type D Mix Design with 0.5% Fine CRM. h--'--~~~~~~~~~~~~~~~~~~~~~~~~~~~~~~~~~~~~-.-5
3
38
~ 37 ::5 -co
~ 36 ~
- UJ N UJ ti\ >
::r: 35
34
33
Fine - Rubber passing #80 Seive 4.5
4
Optimum AC Content 2
1.5
32-1-~~~~~~~~~~-.-~~~---.-~~~-.-~~~-.--~~~.--~~---~~~~~~~-+-1
4 4.2 4.4 4.6 4.8 5 5.2 5.4 5.6 5.8 6 % AC BY WEIGHT OF AGGREGATE
1--- Hveem Stability··+·-- Air Voids
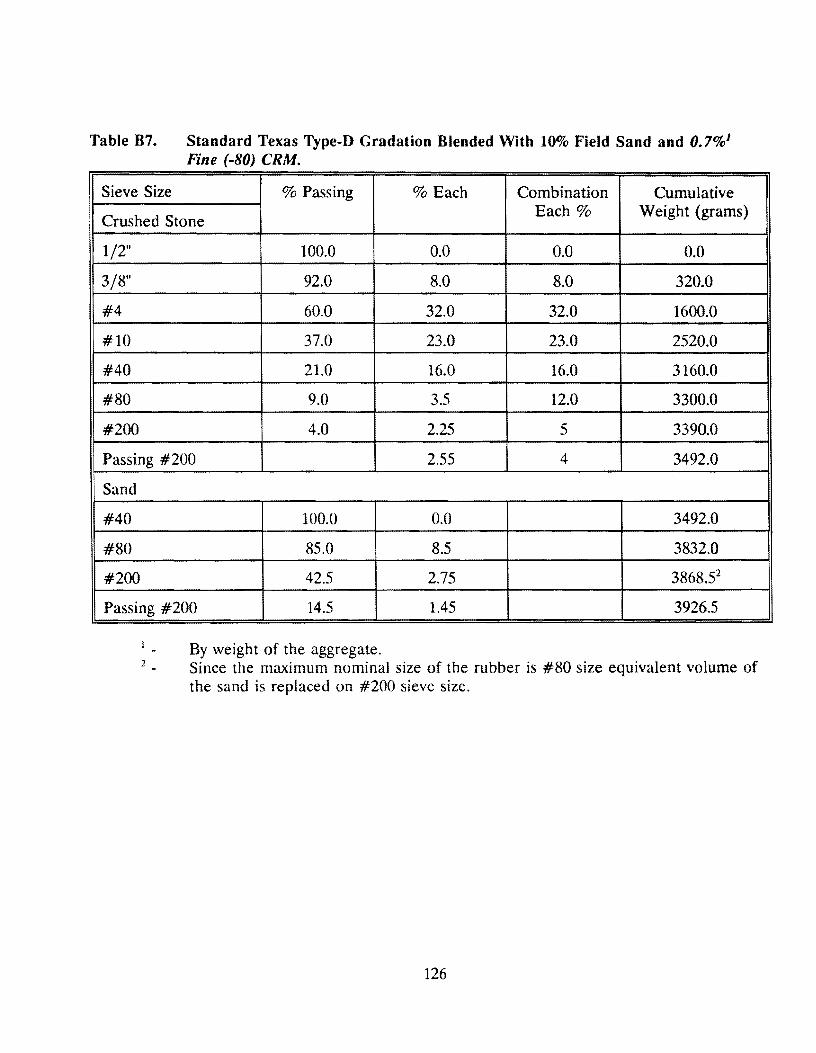
Table 87.
Sieve Size
Standard Texas Type-D Gradation Blended With 10% Field Sand and 0. 7%1
Fine (-80) CRM.
% Passing % Each Combination Cumulative
Crushed Stone Each% Weight (grams)
1/2" 100.0 0.0 0.0 0.0
3/8" 92.0 8.0 8.0 320.0
#4 60.0 32.0 32.0 1600.0
#10 37.0 23.0 23.0 2520.0
#40 21.0 16.0 16.0 3160.0
#80 9.0 3.5 12.0 3300.0
#200 4.0 2.25 5 3390.0
Passing #200 2.55 4 3492.0
Sand
#40 100.0 0.0 3492.0
#80 85.0 8.5 3832.0
#200 42.5 2.75 3868.52
Passing #200 14.5 1.45 3926.5
By weight of the aggregate. 2 Since the maximum nominal size of the rubber is #80 size equivalent volume of
the sand is replaced on #200 sieve size.
126
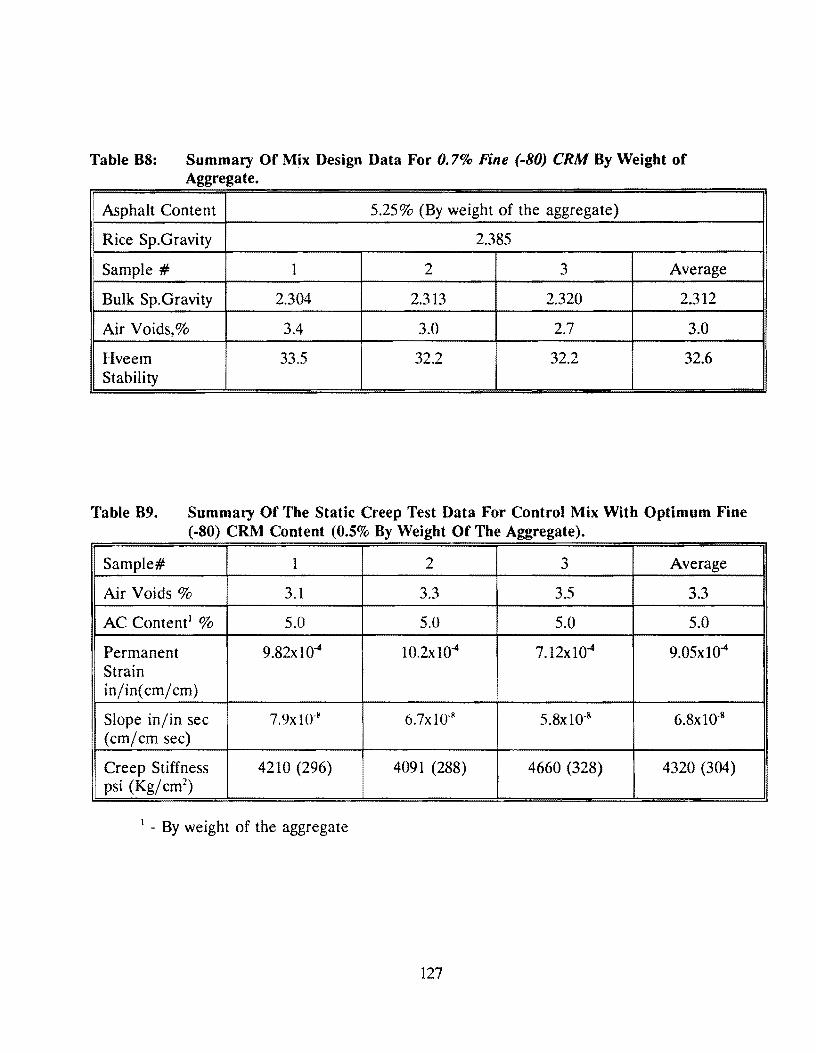
Table B8: Summary Of Mix Design Data For 0. 7% Fine (-80) CRM By Weight of Aggregate.
i Asphalt Content 5.25% (By weight of the aggregate)
' Rice Sp.Gravity 2.385
I Sample# 1 2 3 Average
Bulk Sp.Gravity 2.304 2.313 2.320 2.312
Air Voids,% 3.4 3.0 2.7 3.0
Hveem 33.5 32.2 32.2 32.6 Stability
Table B9. Summary Of The Static Creep Test Data For Control Mix With Optimum Fine (-80) CRM Content (0.5% By Weight Of The Aggregate).
Sample# 1 2 3 Average
Air Voids% 3.1 3.3 3.5 3.3
AC Content1 % 5.0 5.0 5.0 5.0
Permanent 9.82xl04 10.2xl04 7.12xl04 9.05x10⁴
Strain in/in( cm/ cm)
Slope in/in sec 7.9xHY~ 6.7xl0·8 5.8xl0·8 6.8x10-s (cm/cm sec)
Creep Stiffness 4210 (296) 4091 (288) 4660 (328) 4320 (304) psi (Kg/ cm2
)
1 - By weight of the aggregate
127
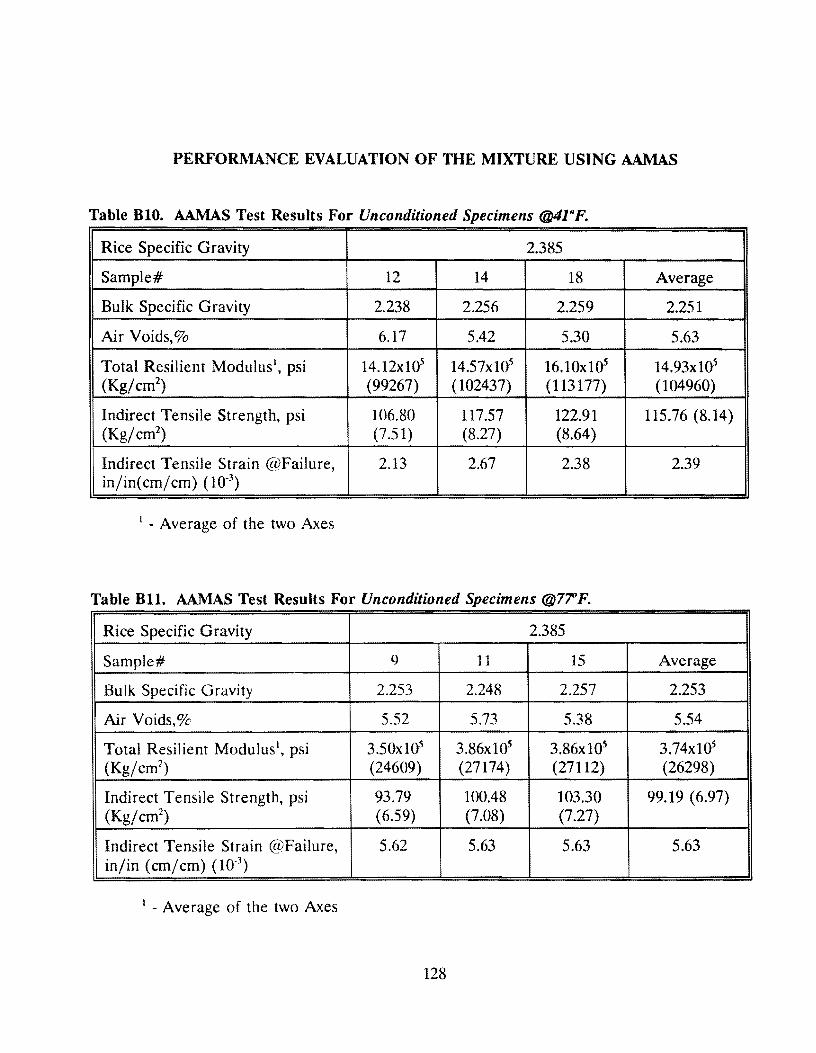
PERFORMANCE EVALUATION OF THE MIXTURE USING AAMAS
Table BIO. AAMAS Test Results For Unconditioned Specimens @41°F.
Rice Specific Gravity 2.385
Sample# 12 14 18 Average
Bulk Specific Gravity 2.238 2.256 2.259 2.251
Air Voids,% 6.17 5.42 5.30 5.63
Total Resilient Modulus\ psi 14.12x10-~ 14.57xl05 16.10xl05 14.93xl05
(Kg/cm2) (99267) (102437) (113177) (104960)
Indirect Tensile Strength, psi 106.80 117.57 122.91 115.76 (8.14) (Kg/cm2
) (7.51) (8.27) (8.64)
Indirect Tensile Strain @Failure, 2.13 2.67 2.38 2.39 in/in(cm/cm) (10-3
)
1 - Average of the two Axes
Table Bll. AAMAS Test Results For Unconditioned Specimens @77°F.
Rice Specific Gravity 2.385
Sample# 9 11 15 Average
Bulk Specific Gravity 2.253 2.248 2.257 2.253
Air Voids,% 5.52 5.73 5.38 5.54
Total Resilient Modulus1, psi 3.50xl05 3.86xlo' 3.86xl05 3.74xlo'
(Kg/cm2) (24609) (27174) (27112) (26298)
Indirect Tensile Strength, psi 93.79 100.48 103.30 99.19 (6.97) (Kg/cm2
) ( 6.59) (7.08) (7.27)
Indirect Tensile Strain @Failure, 5.62 5.63 5.63 5.63 in/in (cm/cm) (10-3
)
1 - Average of the two Axes
128
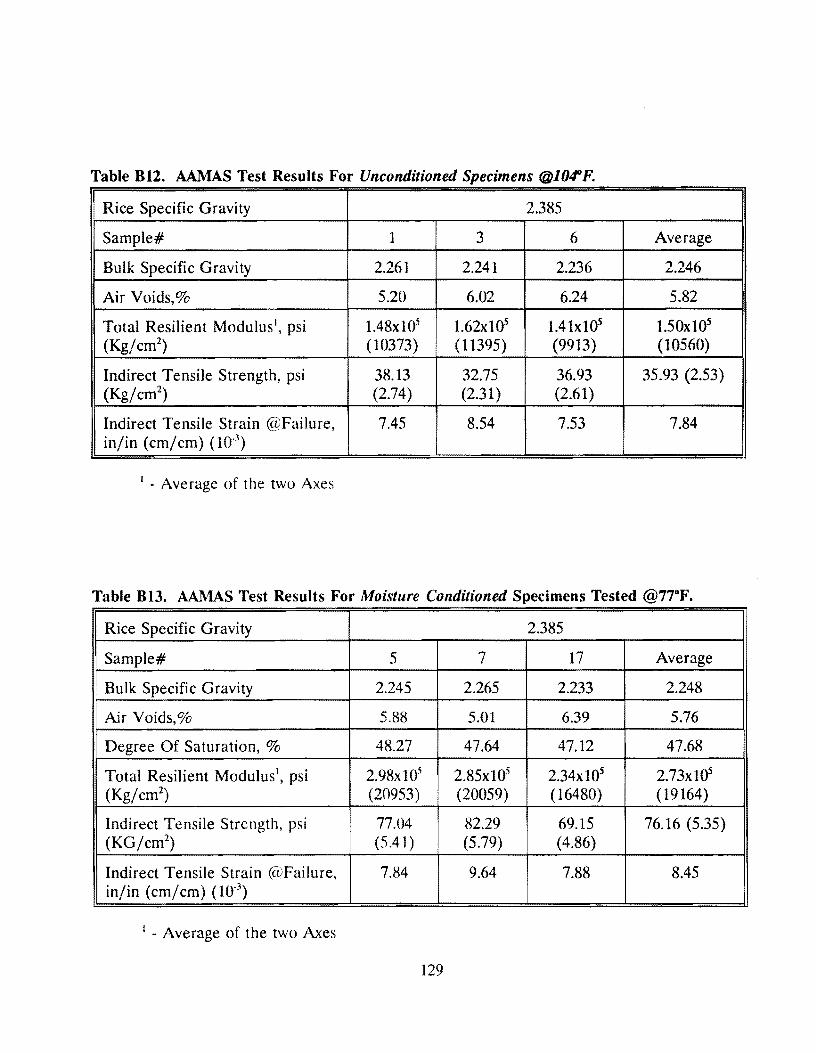
Table 812. AAMAS Test Results For Unconditioned Specimens @104°F.
Rice Specific Gravity 2.385
Sample# 1 3 6 Average
Bulk Specific Gravity 2.261 2.241 2.236 2.246
Air Voids,% 5.20 6.02 6.24 5.82
Total Resilient Modulus 1, psi l.48xl05 1.62xlf>5 1.4 lxlOS 1.50x10⁵
(Kg/cm2) (10373) (11395) (9913) (10560)
Indirect Tensile Strength, psi 38.13 32.75 36.93 35.93 (2.53) (Kg/cm2
) (2.74) (2.31) (2.61)
Indirect Tensile Strain @Failure, 7.45 8.54 7.53 7.84 in/in (cm/cm) (10.3
)
1 - Average of the two Axes
Table 813. AAMAS Test Results For Moisture Conditioned Specimens Tested @77°F.
Rice Specific Gravity 2.385
i Sample# 5 7 17 Average
Bulk Specific Gravity 2.245 2.265 2.233 2.248
i Air Voids,% 5.88 5.01 6.39 5.76
Degree Of Saturation, % 48.27 47.64 47.12 47.68
Total Resilient Modulus1, psi 2.98x10⁵ 2.85xl05 2.34xl05 2.73x10S
(Kg/cm2) (20953) (20059) (16480) (19164)
Indirect Tensile Strength, psi 77.04 82.29 69.15 76.16 (5.35) (KG/cm2
) (5.41) (5.79) (4.86)
Indirect Tensile Strain @Failure, 7.84 9.64 7.88 8.45 in/in (cm/cm) (Hf3
)
1 - Average of the two Axes
129
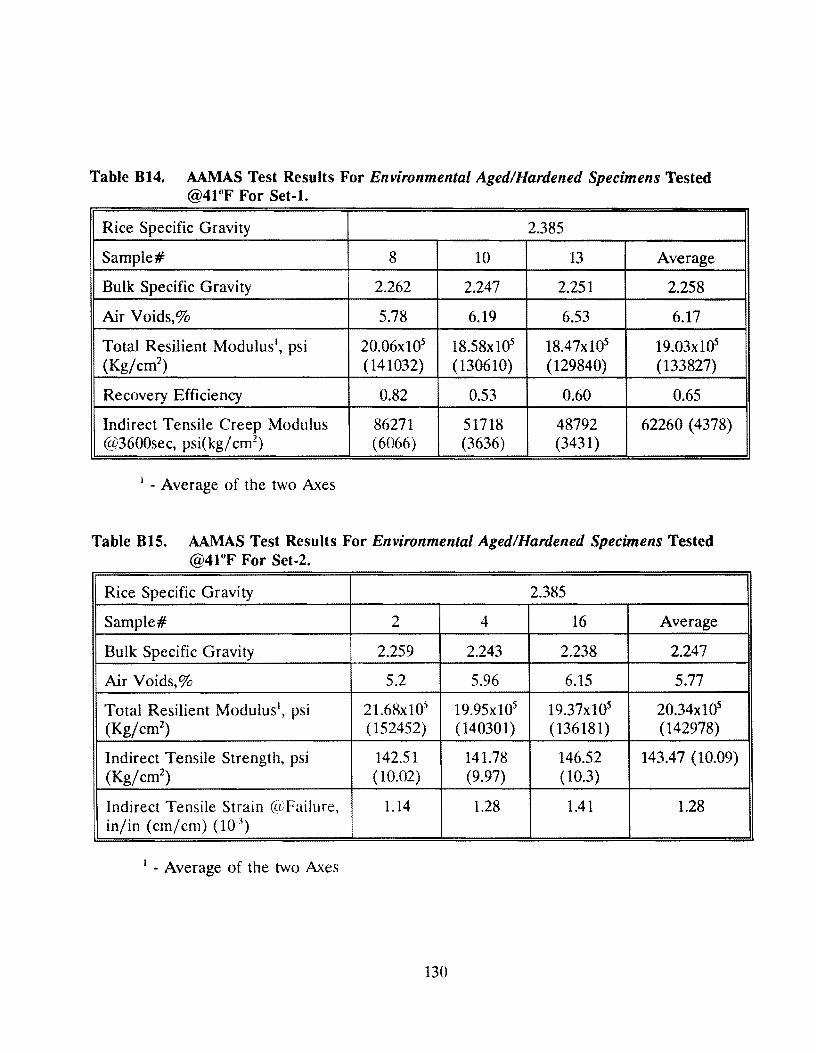
Table 814. AAMAS Test Results For Environmental Aged/Hardened Specimens Tested @41°F For Set-1.
Rice Specific Gravity 2.385
Sample# 8 10 13 Average
Bulk Specific Gravity 2.262 2.247 2.251 2.258
Air Voids,% 5.78 6.19 6.53 6.17
Total Resilient Modulus', psi 20.06xl05 18.58x10⁵ 18.47x10⁵ 19.03xl05
(Kg/cm2) (141032) (130610) (129840) (133827)
Recovery Efficiency 0.82 0.53 0.60 0.65
Indirect Tensile Creep Modulus 86271 51718 48792 62260 ( 4378) @3600sec, psi( kg/ cm2
) (6066) (3636) (3431)
1 - Average of the two Axes
Table 815. AAMAS Test Results For Environmental Aged/Hardened Specimens Tested @41°F For Set-2.
Rice Specific Gravity 2.385
Sample# 2 4 16 Average
Bulk Specific Gravity 2.259 2.243 2.238 2.247
Air Voids,% 5.2 5.96 6.15 5.77
Total Resilient Modulus', psi 21.68x10⁵ 19.95x10⁵ 19.37xla5 20.34xla5 (Kg/cm2
) (152452) (140301) (136181) (142978)
Indirect Tensile Strength, psi 142.51 141.78 146.52 143.47 (10.09) (Kg/cm2
) (10.02) (9.97) (10.3)
Indirect Tensile Strain (lvFailure, 1.14 1.28 1.41 1.28 in/in (cm/cm) 00-3
)
1 - Average of the two Axes
130
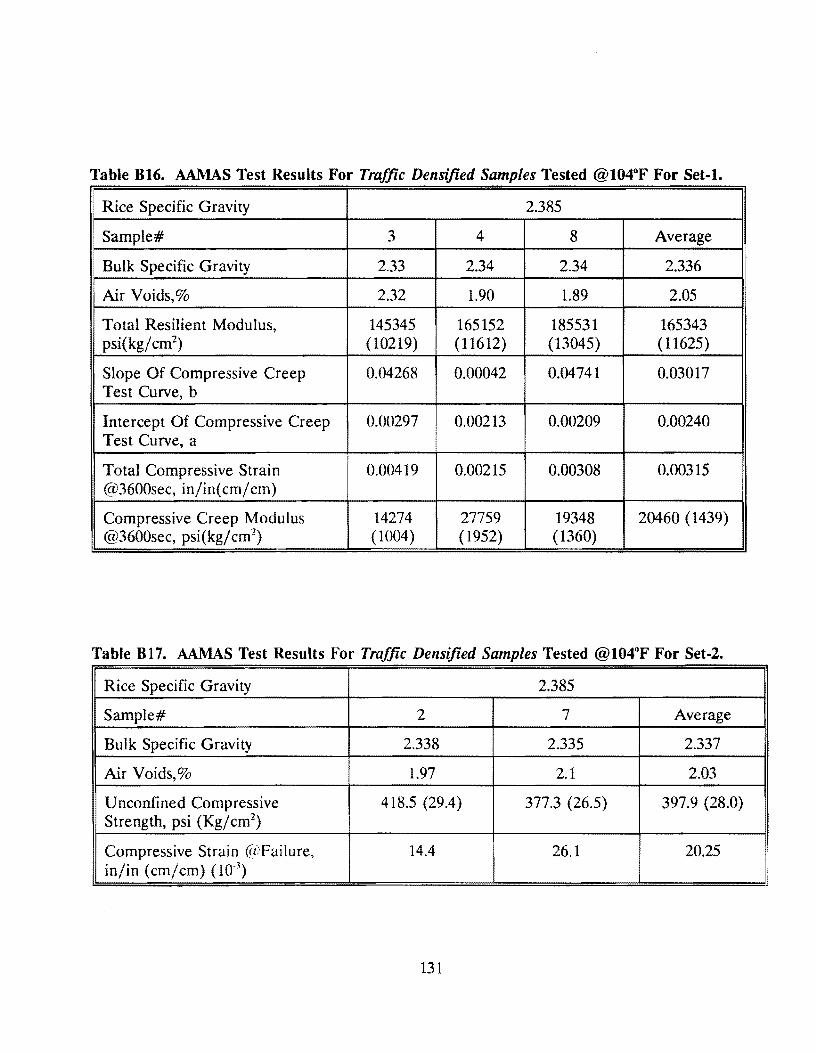
Table B16. AAMAS Test Results For Traffic Densified Samples Tested @104°F For Set-1 •
. Rice Specific Gravity 2.385 !
•Sample# 3 4 8 Average
• Bulk Specific Gravity 2.33 2.34 2.34 2.336
Air Voids,% I
2.32 1.90 1.89 2.05
Total Resilient Modulus, 145345 165152 185531 165343 psi(kg/ cm2
) (10219) (11612) (13045) (11625)
Slope Of Compressive Creep 0.04268 0.00042 0.04741 0.03017 Test Curve, b
Intercept Of Compressive Creep 0.00297 0.00213 0.00209 0.00240 Test Curve, a
Total Compressive Strain 0.00419 0.00215 0.00308 0.00315 @3600sec, in/in( cm/ cm)
Compressive Creep Modulus 14274 27759 19348 20460 (1439) @3600sec, psi(kg/ cm2
) (1004) (1952) (1360)
Table B 17. AAMAS Test Results For Traffic Densified Samples Tested @l04°F For Set-2.
Rice Specific Gravity 2.385
Sample# 2 7 Average
Bulk Specific Gravity 2.338 2.335 2.337
Air Voids,% 1.97 2.1 2.03
Unconfined Compressive 418.5 (29.4) 377.3 (26.5) 397.9 (28.0) Strength, psi (Kg/ cm2
)
Compressive Strain (j'l!failure, 14.4 26.1 20.25 in/in (cm/cm) (10-3
)
131
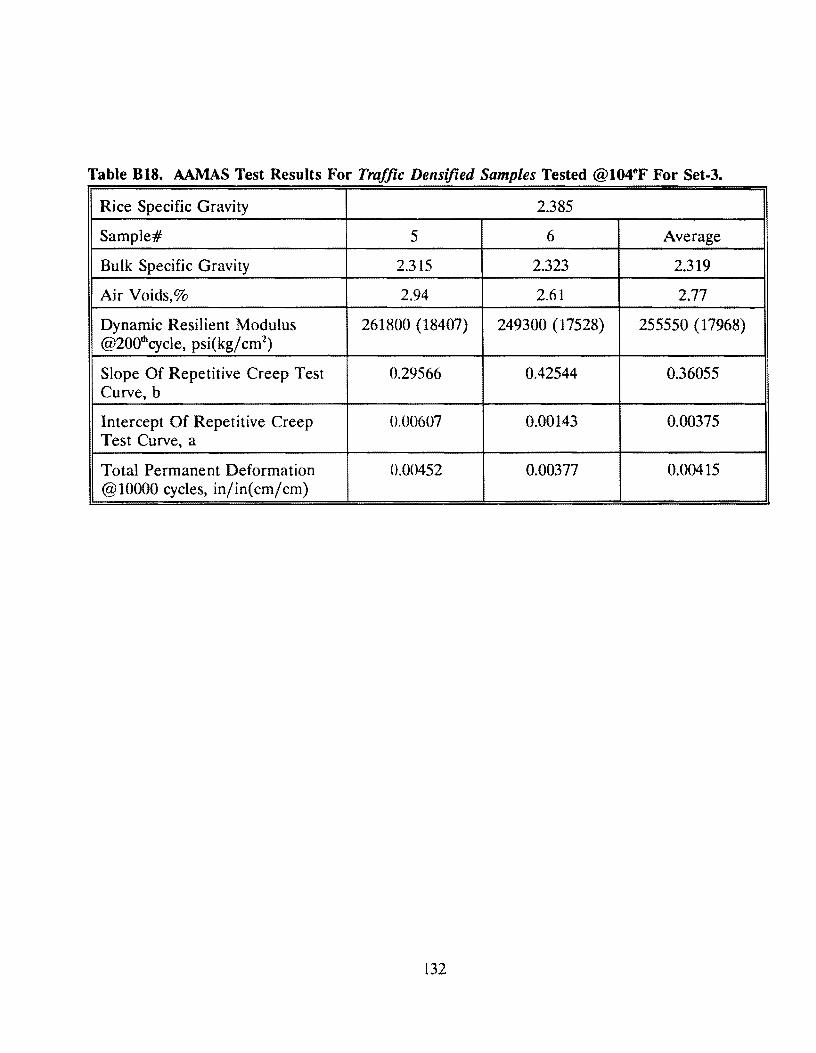
Table 818. AAMAS Test Results For Traffic Densijied Samples Tested @104°F For Set-3.
Rice Specific Gravity 2.385
Sample# 5 6 Average
Bulk Specific Gravity 2.315 2.323 2.319
Air Voids,% 2.94 2.61 2.77
Dynamic Resilient Modulus 261800 (18407) 249300 ( 17528) 255550 (17968) @2001hcycle, psi(kg/ cm2
)
Slope Of Repetitive Creep Test 0.29566 0.42544 0.36055 Curve, b
Intercept Of Repetitive Creep 0.00607 0.00143 0.00375 Test Curve, a
Total Permanent Deformation 0.00452 0.00377 0.00415 @10000 cycles, in/in(cm/cm)
132
Appendix C
Laboratory Data for DGC Mixture
(Type D, Dense Grade Mixture with Coarse Rubber)
133

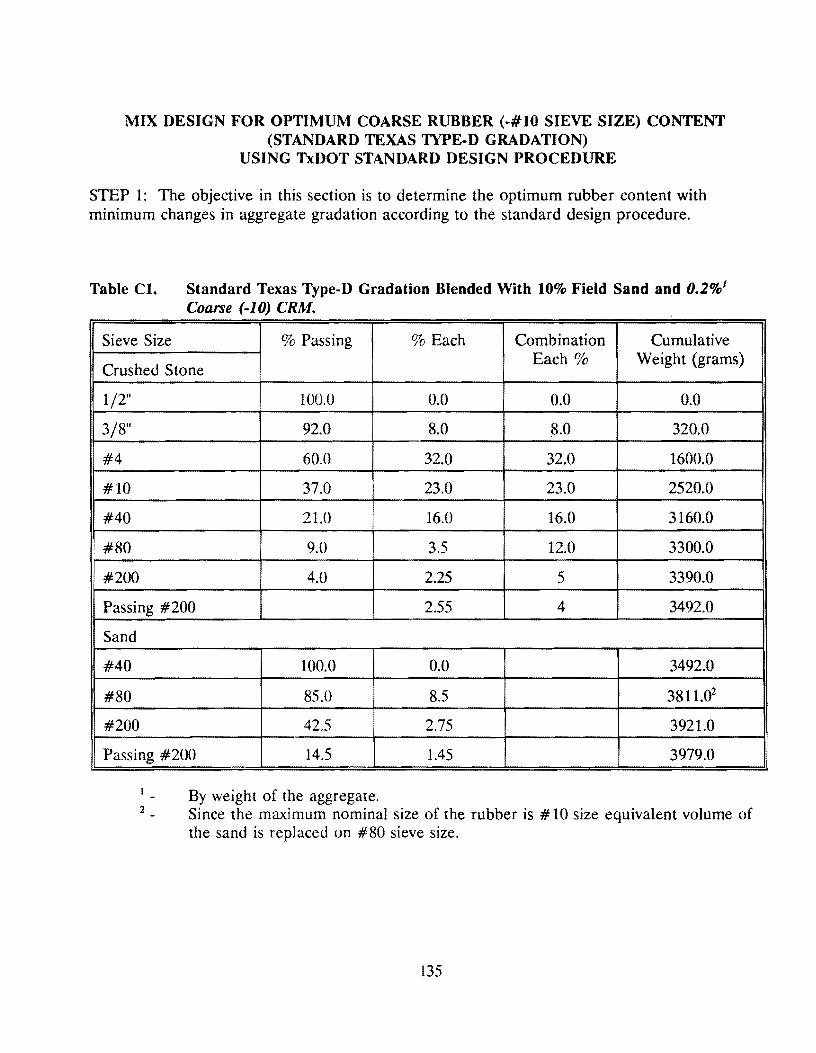
MIX DESIGN FOR OPTIMUM COARSE RUBBER (-#10 SIEVE SIZE) CONTENT (STANDARD TEXAS TYPE-D GRADATION)
USING TxDOT STANDARD DESIGN PROCEDURE
STEP 1: The objective in this section is to determine the optimum rubber content with minimum changes in aggregate gradation according to the standard design procedure.
Table Cl.
Sieve Size
Standard Texas Type-D Gradation Blended With 10% Field Sand and 0.2%1
Coarse (-10) CRM.
% Passing % Each Combination Cumulative
Crushed Stone Each% Weight (grams)
1/2" 100.0 0.0 0.0 0.0
3/8" 92.0 8.0 8.0 320.0
#4 60.0 32.0 32.0 1600.0
#10 37.0 23.0 23.0 2520.0
#40 21.0 16.0 16.0 3160.0
#80 9.0 3.5 12.0 3300.0
#200 4.0 2.25 5 3390.0
Passing #200 2.55 4 3492.0
Sand
#40 100.0 0.0 3492.0
#80 85.0 8.5 3811.02
#200 42.5 2.75 3921.0
Passing #200 14.5 1.45 3979.0
By weight of the aggregate. 2 Since the maximum nominal size of the rubber is # 10 size equivalent volume of
the sand is replaced on #80 sieve size.
135
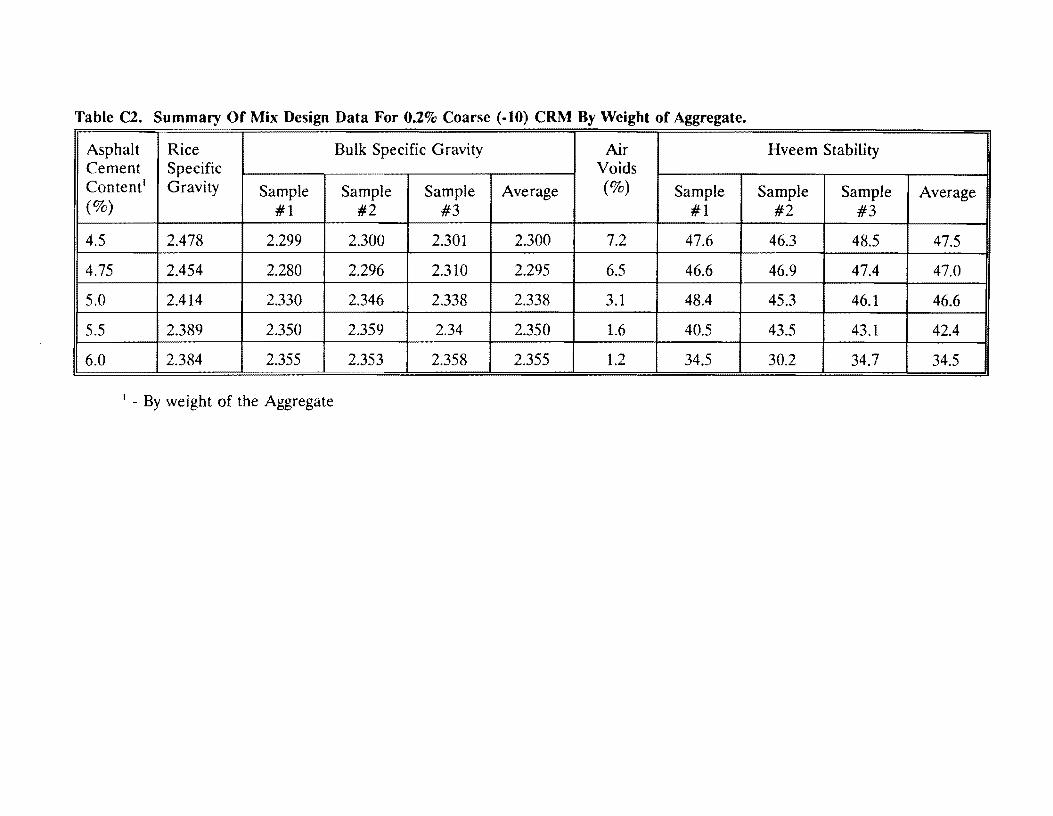
Table C2. Summary Of Mix Design Data For 0.2% Coarse (-10) CRM By Weight of Aggregate.
Asphalt Rice Bulk Specific Gravity Air Hveem Stability Cement Specific Voids Contene Gravity Sample Sample Sample Average (%) Sample Sample Sample Average (%) #1 #2 #3 #1 #2 #3
4.5 2.478 2.299 2.300 2.301 2.300 7.2 47.6 46.3 48.5 47.5
4.75 2.454 2.280 2.296 2.310 2.295 6.5 46.6 46.9 47.4 47.0
5.0 2.414 2.330 2.346 2.338 2.338 3.1 48.4 45.3 46.1 46.6
5.5 2.389 2.350 2.359 2.34 2.350 1.6 40.5 43.5 43.1 42.4
6.0 2.384 2.355 2.353 2.358 2.355 1.2 34.5 30.2 34.7 34.5
1 - By weight of the Aggregate
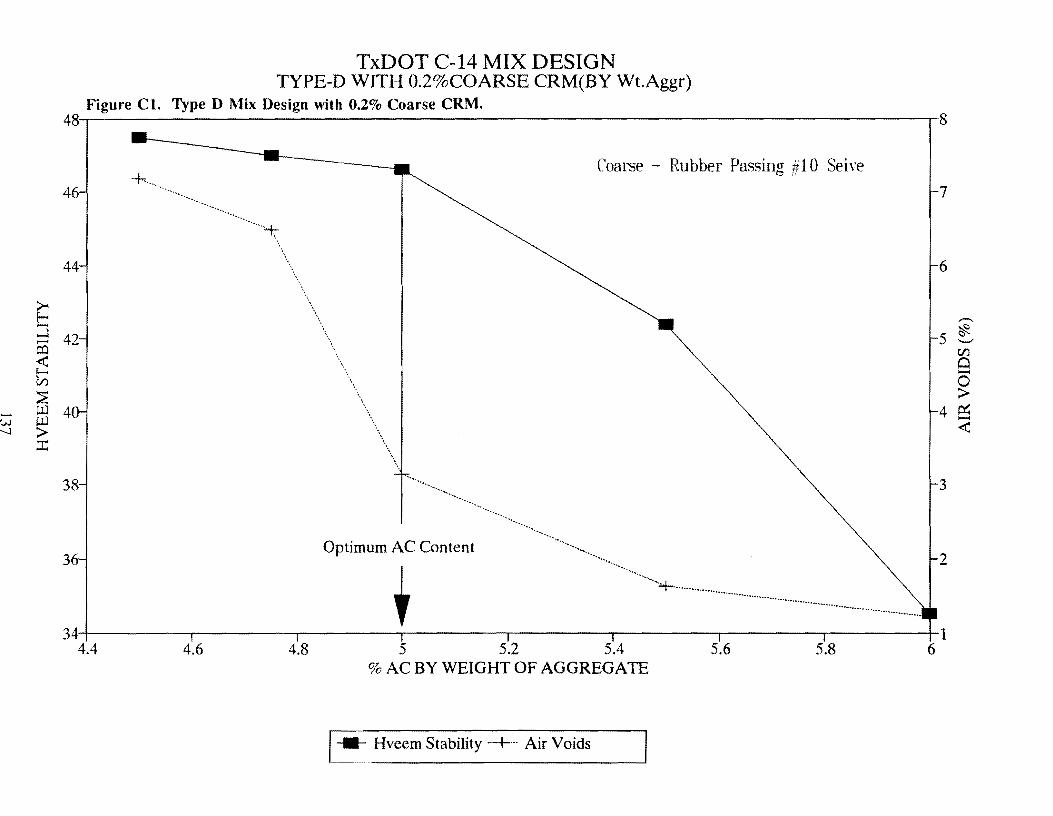
TxDOT C-14 MIX DESIGN TYPE-D WITH 0.2%COARSE CRM(BY Wt.Aggr)
Figure Cl. Type D Mix Design with 0.2% Coarse CRM. 48~~~~~~~~~~~~~~~~~~~~~~~~~~~~~~~~~~~~~~~8
Coarse - Rubber Passing #10 Seive
46 7
44 6
38 ··················-. ........ . 3
3 Optimum AC Content
34-+-~~~~,.-~~~~.--~~~---.-~~~~-r-~~~~-.-~~~~-r-~~~~..-~~~--+-1
4.4 4.6 4.8 5 5.2 5.4 5.6 5.8 6 % AC BY WEIGHT OF AGGREGATE
[ ~ Hveem Stability ··+ ... Air Voids
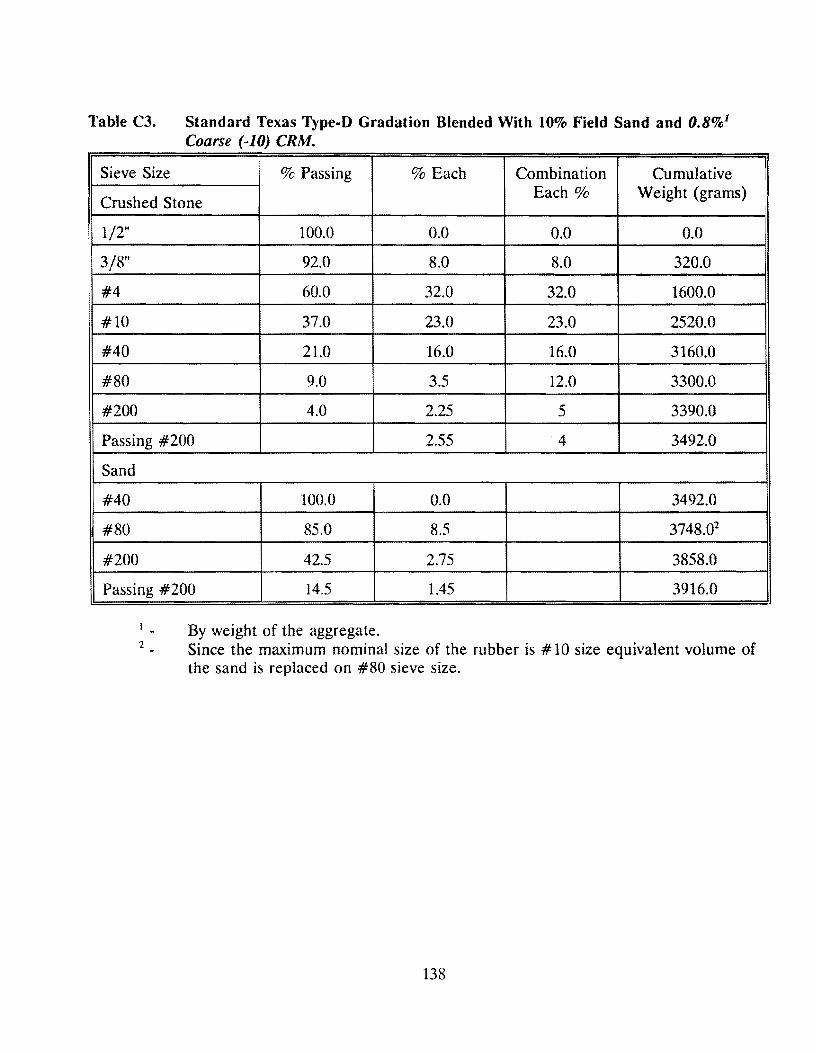
Table CJ.
Sieve Size
Standard Texas Type-D Gradation Blended With 10% Field Sand and 0.8%1
Coarse (~10) CRM.
% Passing % Each Combination Cumulative
Crushed Stone Each% Weight (grams)
1/2" 100.0 0.0 0.0 0.0
3/8" 92.0 8.0 8.0 320.0
#4 60.0 32.0 32.0 1600.0
#10 37.0 23.0 23.0 2520.0
#40 21.0 16.0 16.0 3160.0
#80 9.0 3.5 12.0 3300.0
#200 4.0 2.25 5 3390.0
Passing #200 2.55 4 3492.0
Sand
#40 100.0 0.0 3492.0
#80 85.0 8.5 3748.02
#200 42.5 2.75 3858.0
Passing #200 14.5 1.45 3916.0
By weight of the aggregate. 2 Since the maximum nominal size of the rubber is # 10 size equivalent volume of
the sand is replaced on #80 sieve size.
138
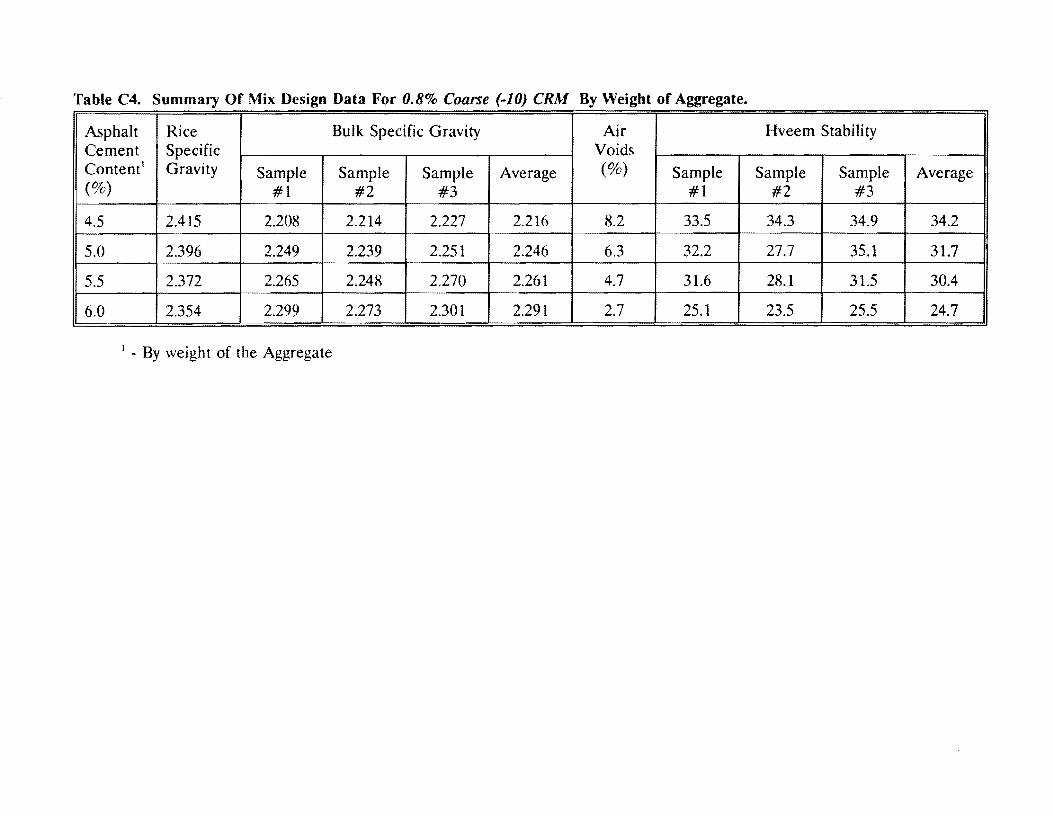
Table C4. Summary Of Mix Design Data For 0.8% Coarse (-10) CRM By Weight of Aggregate.
Asphalt Rice Bulk Specific Gravity Air Hveem Stability Cement Specific Voids Content' Gravity Sample Sample Sample Average (%) Sample Sample Sample Average (%) #1 #2 #3 #1 #2 #3
4.5 2.415 2.208 2.214 2.227 2.216 8.2 33.5 34.3 34.9 34.2
5.0 2.396 2.249 2.239 2.251 2.246 6.3 32.2 27.7 35.l 31.7
5.5 2.372 2.265 2.248 2.270 2.261 4.7 31.6 28.1 31.5 30.4
6.0 2.354 2.299 2.273 2.301 2.291 2.7 25.1 23.5 25.5 24.7
1 - By weight of the Aggregate
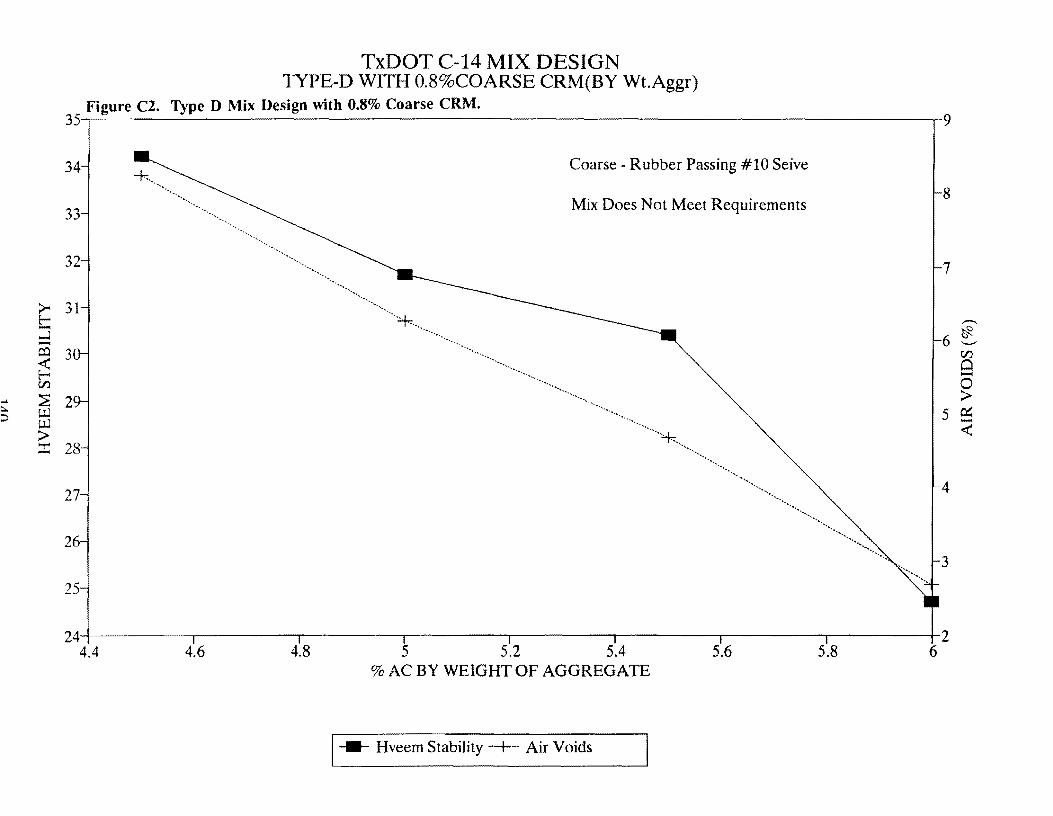
;:;.... E--....l -co ~ Cl)
.... ~ i::.. u.l :::> u.l
> ::r::
TxDOT C-14 MIX DESIGN TYPE-D WITH 0.8%COARSE CRM(BY Wt.Aggr)
Figure C2. Type D Mix Design with 0.8% Coarse CRM. 35-.--~~~~~~~~~~~~~~~~~~~~~~~~~~~~~~~~~~~~~---,-9
34 Coarse - Rubber Passing #10 Seive
33 Mix Does Not Meet Requirements
...
32
31
········ .............. .
·· .................... +..
.... ~
3
2
28
27
26
25 ..................
8
7
--~ 6 '--" Cl)
Cl -0 >
5 er:: -<
4
3
-4-~~~~--.--~~~~..--~~~-.~~~~-.-~~~~-..-~~~~-,--~~~~.,--~~~--+-2 24 4.4 4.6 4.8 5 5.2 5.4 5.6 5.8 6
% AC BY WEIGHT OF AGGREGATE
1--- Hveem Stability··+··· Air Voids
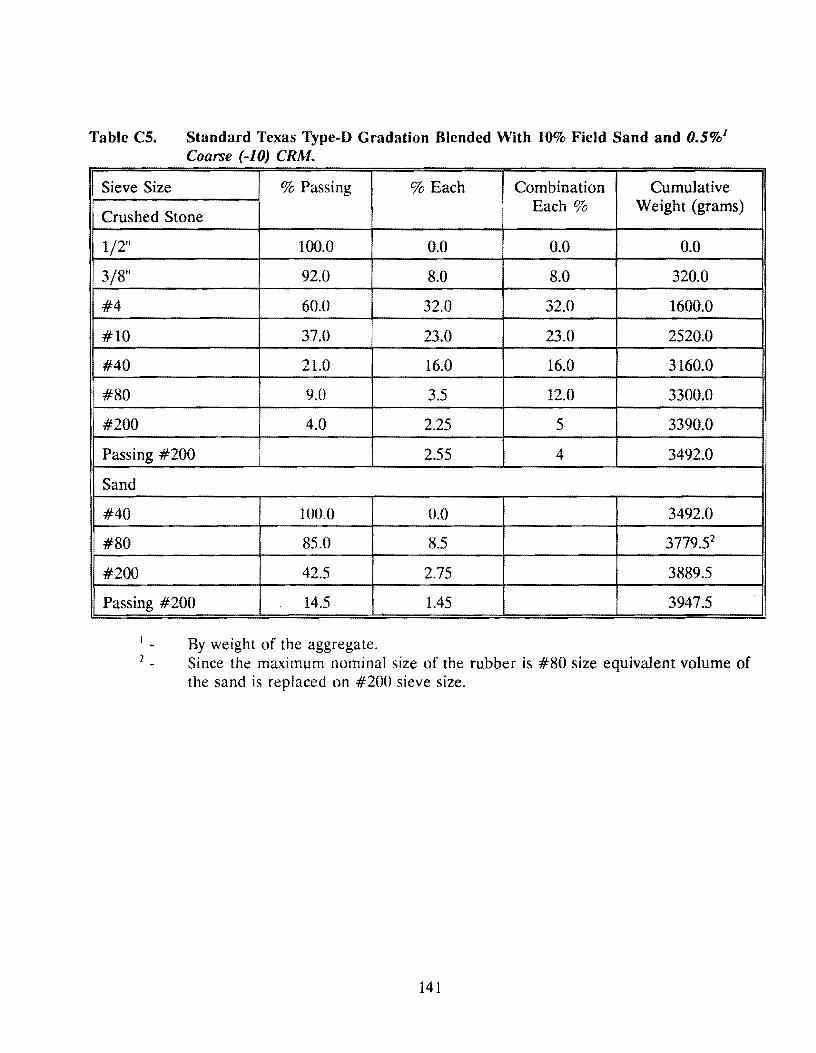
Table CS. Standard Texas Type-D Gradation Blended With 10% Field Sand and 0.5%1
Coarse (-10) CRM.
Sieve Size % Passing % Each Combination Cumulative
Crushed Stone Each% Weight (grams)
1/2" 100.0 0.0 0.0 0.0
3/8" 92.0 8.0 8.0 320.0
#4 60.0 32.0 32.0 1600.0
#10 37.0 23.0 23.0 2520.0
#40 21.0 16.0 16.0 3160.0
#80 9.0 3.5 12.0 3300.0
#200 4.0 2.25 5 3390.0
Passing #200 2.55 4 3492.0
Sand
#40 100.0 0.0 3492.0
#80 85.0 8.5 3779.52
#200 42.5 2.75 3889.5
Passing #200 14.5 1.45 3947.5
By weight of the aggregate. Since the maximum nominal size of the rubber is #80 size equivalent volume of the sand is replaced on #200 sieve size.
141
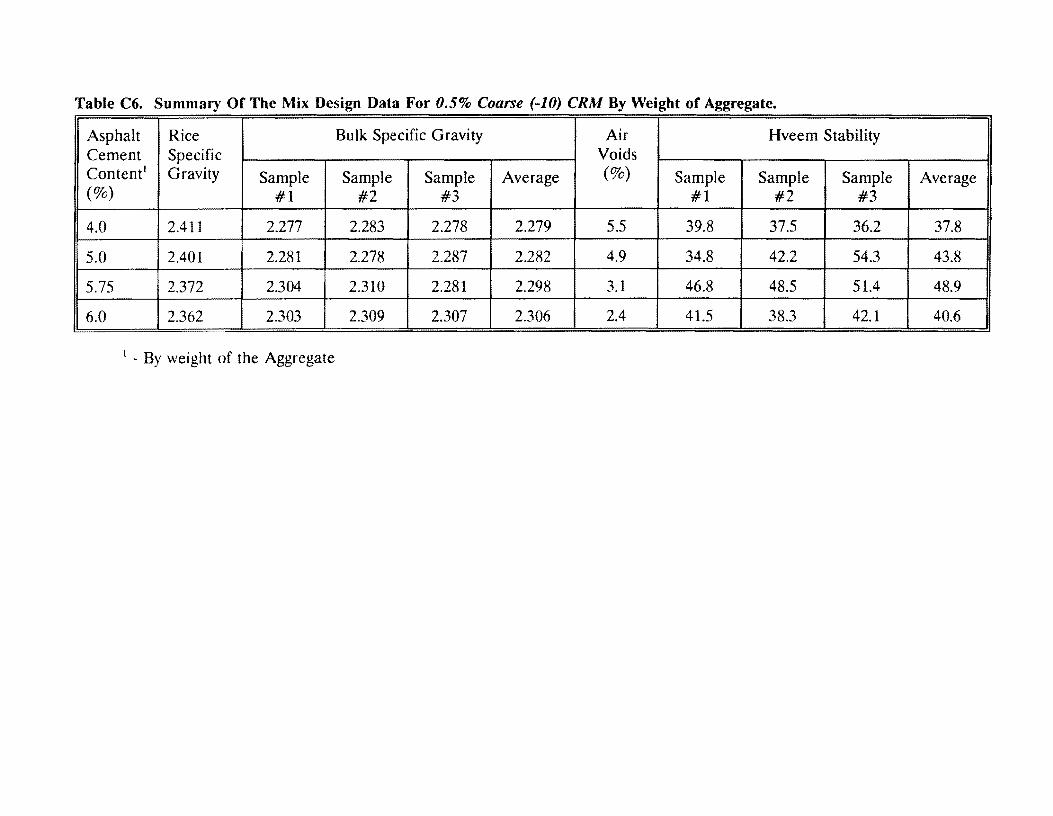
Table C6. Summary Of The Mix Design Data For 0.5% Coarse (-10) CRM By Weight of Aggregate.
Asphalt Rice Bulk Specific Gravity Air Hveem Stability Cement Specific Voids Content1 Gravity Sample Sample Sample Average (%) Sample Sample Sample Average (%) #1 #2 #3 #1 #2 #3
4.0 2.411 2.277 2.283 2.278 2.279 5.5 39.8 37.5 36.2 37.8
5.0 2.401 2.281 2.278 2.287 2.282 4.9 34.8 42.2 54.3 43.8
5.75 2.372 2.304 2.310 2.281 2.298 3.1 46.8 48.5 51.4 48.9
6.0 2.362 2.303 2.309 2.307 2.306 2.4 41.5 38.3 42.1 40.6
1 - By weight of the Aggregate
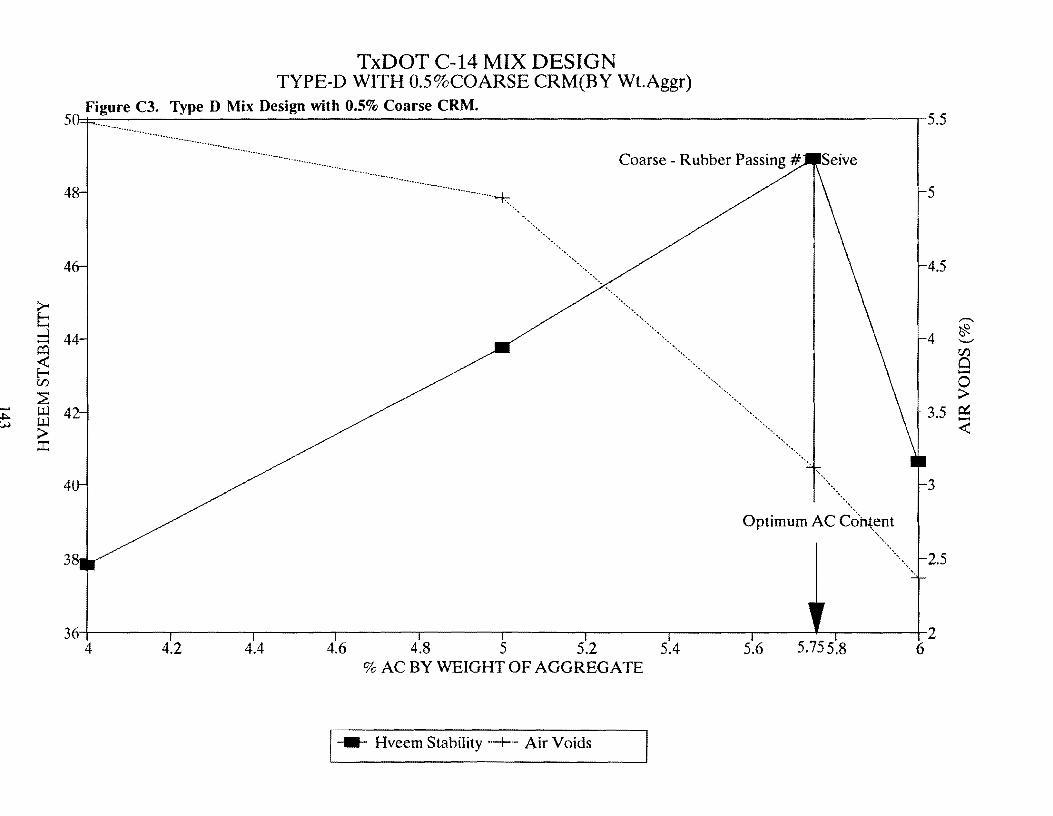
TxDOT C-14 MIX DESIGN TYPE-D WITH 0.5%COARSE CRM(BY Wt.Aggr)
Figure C3. Type D Mix Design with 0.5% Coarse CRM. 5 J::t:::---------------------------------------.-5.5
48
4
4
·~ ~-~·- -·-· ··································--······+
..
Optimum ~~~~ht_ent 3
·. ··........... 2.5
'•
36-----...-----,-----.-----,------,-----..----~------.--------.------+-2
4 4.2 4.4 4.6 4.8 5 5.2 5.4 5.6 5.75 5.8 6 % AC BY WEIGHT OF AGGREGATE
1--- Hveem Stability ··+··· Air Voids
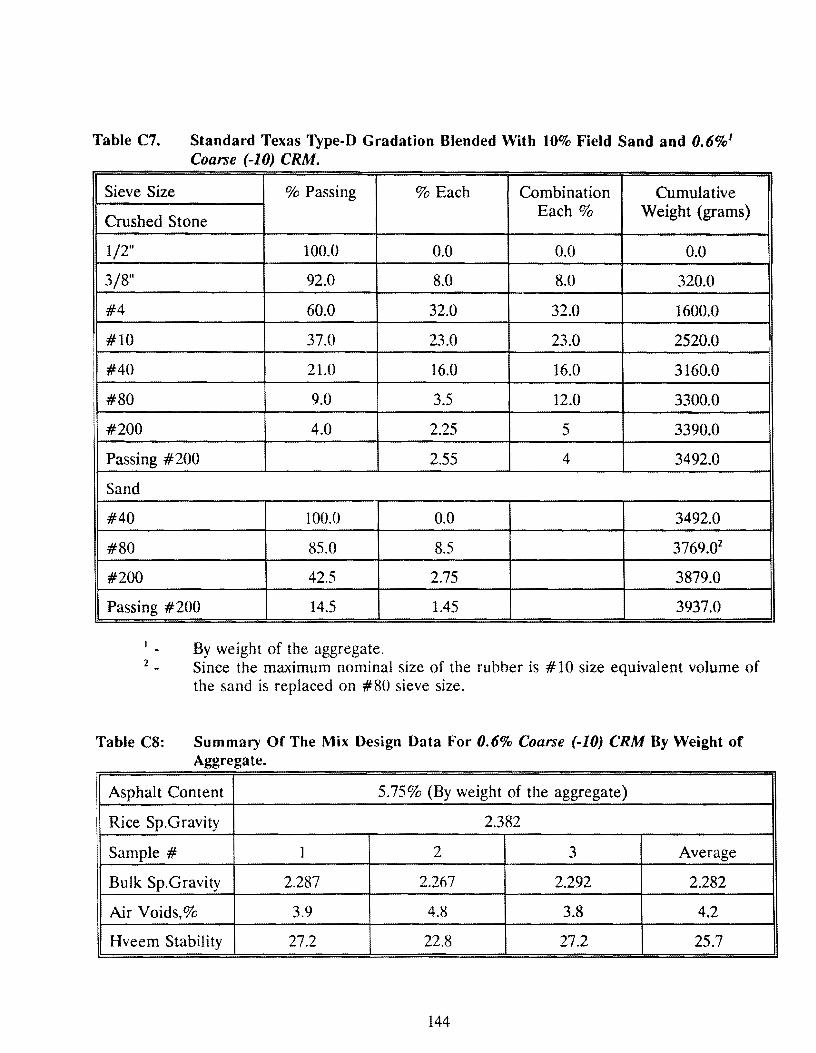
Table C7. Standard Texas Type-D Gradation Blended With 10% Field Sand and 0.6%1
Coarse (-10) CRM.
Sieve Size % Passing % Each Combination Cumulative
Crushed Stone Each% Weight (grams)
1/2" 100.0 0.0 0.0 0.0
3/8" 92.0 8.0 8.0 320.0
#4 60.0 32.0 32.0 1600.0
i #10 37.0 23.0 23.0 2520.0
: #40 21.0 16.0 16.0 3160.0
#80 9.0 3.5 12.0 3300.0
#200 4.0 2.25 5 3390.0
Passing #200 2.55 4 3492.0
Sand
#40 100.0 0.0 3492.0
#80 85.0 8.5 3769.02
#200 42.5 2.75 3879.0
Passing #200 14.5 1.45 3937.0
By weight of the aggregate. 2 Since the maximum nominal size of the rubber is # 10 size equivalent volume of
the sand is replaced on #80 sieve size.
Table CS: Summary Of The Mix Design Data For 0.6% Coarse (-10) CRM By Weight of Aggregate.
I Asphalt Content 5.75% (By weight of the aggregate)
Rice Sp.Gravity 2.382
Sample# 1 2 3 Average
Bulk Sp.Gravity 2.287 2.267 2.292 2.282
Air Voids,% 3.9 4.8 3.8 4.2
Hveem Stability 27.2 22.8 27.2 25.7
144
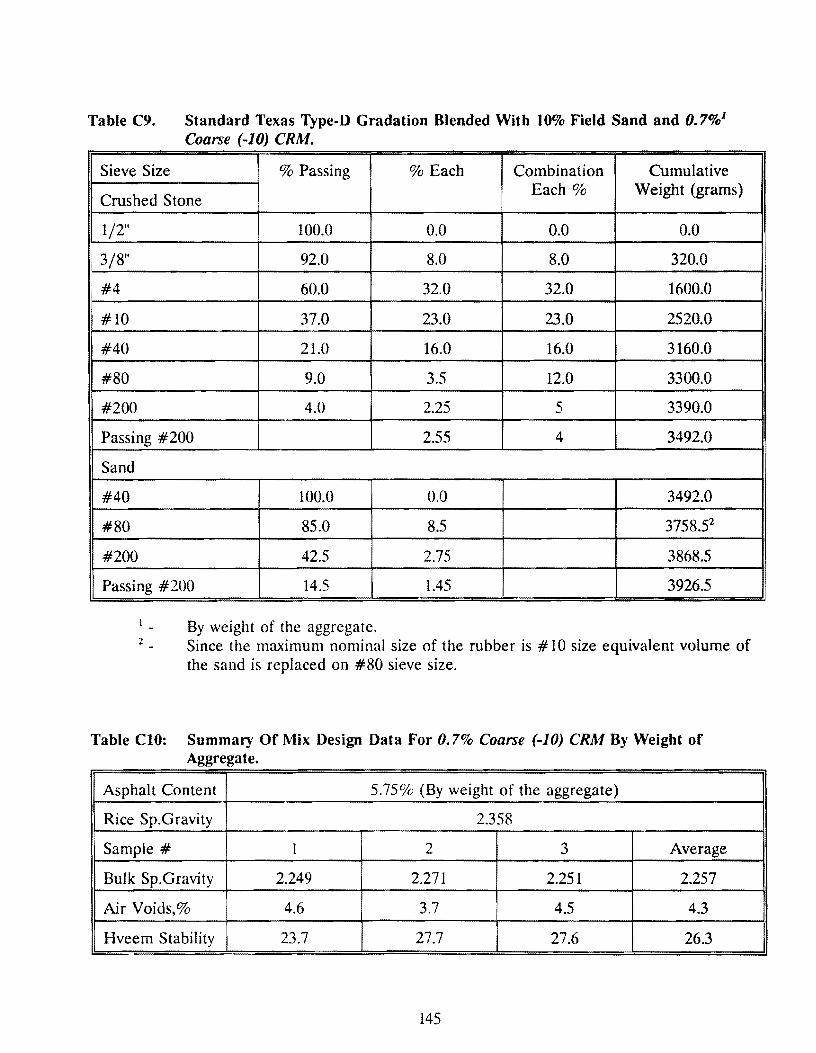
Table C9. Standard Texas Type-D Gradation Blended With 10% Field Sand and 0.7%1
Coarse (-10) CRM.
Sieve Size % Passing % Each Combination Cumulative
Crushed Stone Each% Weight (grams)
1/2" 100.0 0.0 0.0 0.0
. 3/8" 92.0 8.0 8.0 320.0
. #4 60.0 32.0 32.0 1600.0
#10 37.0 23.0 23.0 2520.0
#40 21.0 16.0 16.0 3160.0
#80 9.0 3.5 12.0 3300.0
#200 4.0 2.25 5 3390.0
Passing #200 2.55 4 3492.0
Sand
#40 100.0 0.0 3492.0
#80 85.0 8.5 3758.52
#200 42.5 2.75 3868.5
Passing #200 14.5 1.45 3926.5
By weight of the aggregate. 2 Since the maximum nominal size of the rubber is # 10 size equivalent volume of
the sand is replaced on #80 sieve size.
Table ClO: Summary Of Mix Design Data For 0. 7% Coarse (-10) CRM By Weight of Aggregate.
Asphalt Content 5.75% (By weight of the aggregate)
Rice Sp.Gravity 2.358
Sample# 1 2 3 Average
Bulk Sp.Gravity 2.249 2.271 2.251 2.257
Air Voids,% 4.6 3.7 4.5 4.3
Hveem Stability 23.7 27.7 27.6 26.3
145
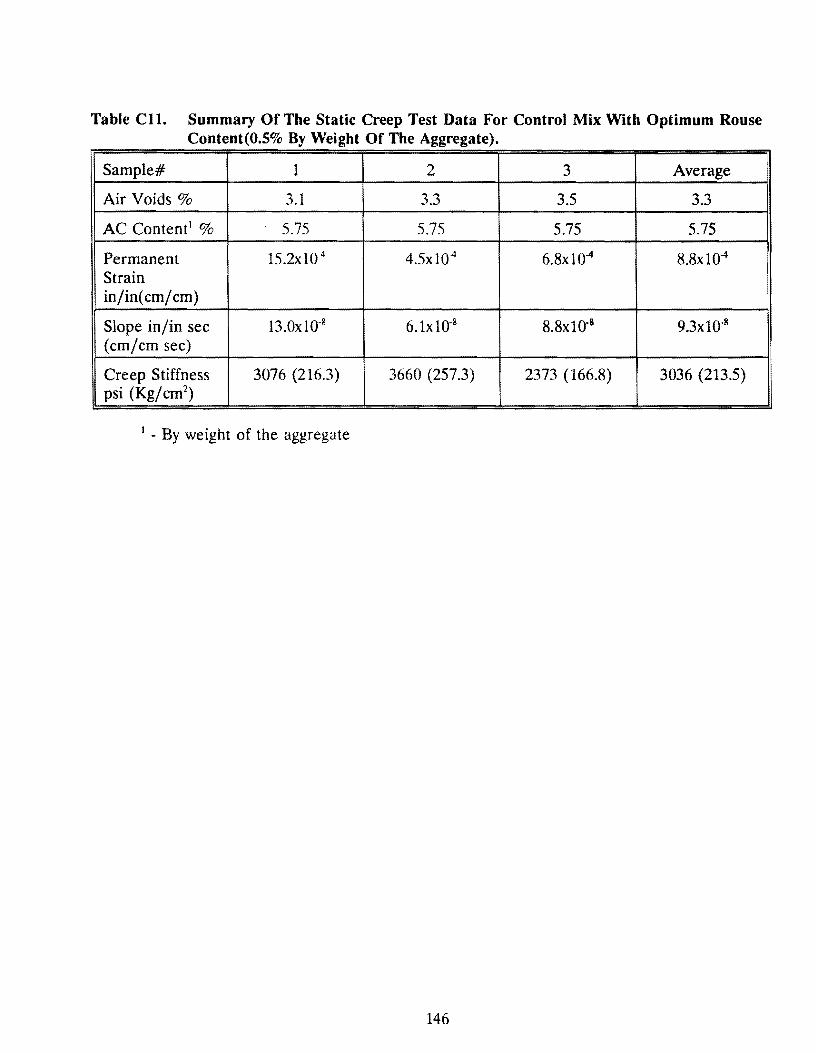
Table Cl 1. Summary Of The Static Creep Test Data For Control Mix With Optimum Rouse Content(0.5% By Weight Of The Aggregate).
Sample# 1 2 3 Average
Air Voids% 3.1 3.3 3.5 3.3
AC Content1 % 5.75 5.75 5.75 5.75
Permanent 15.2xl04 4.5xl04 6.8xl04 8.8xl04
Strain in/in( cm/cm)
Slope in/in sec 13.0xl0-8 6. lxl0-8 8.8xl0-8 9.3xl0·8
(cm/cm sec)
Creep Stiffness 3076 (216.3) 3660 (257.3) 2373 (166.8) 3036 (213.S) psi (Kg/cm2
)
1 - By weight of the aggregate
146
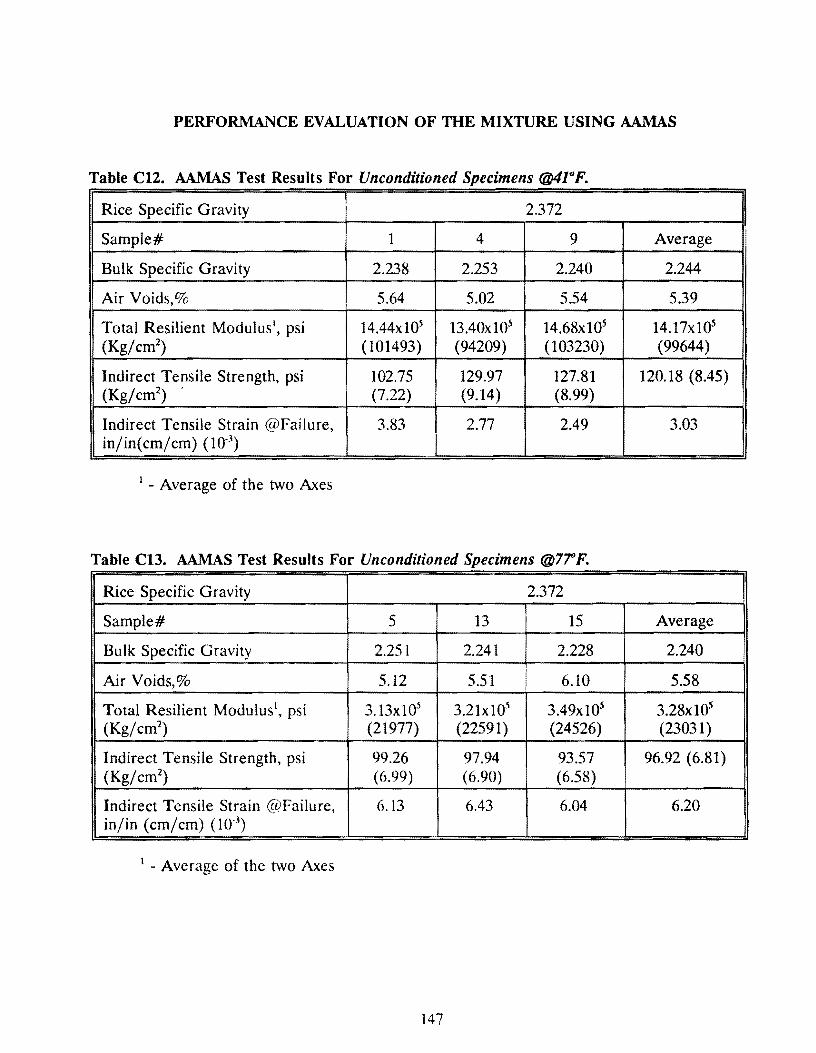
PERFORMANCE EVALUATION OF THE MIXTURE USING AAMAS
Table C12. AAMAS Test Results For Unconditioned Specimens @41"F.
Rice Specific Gravity 2.372
Sample# 1 4 9 Average
Bulk Specific Gravity 2.238 2.253 2.240 2.244
Air Voids,% 5.64 5.02 5.54 5.39
Total Resilient Modulus', psi 14.44x10⁵ 13.40x10⁵ 14.68x10⁵ 14.17x10S (Kg/cm2
) (101493) (94209) (103230) (99644)
Indirect Te!lsile Strength, psi 102.75 129.97 127.81 120.18 (8.45) (Kg/cm2
) (7.22) (9.14) (8.99)
Indirect Tensile Strain ~vFailure, 3.83 2.77 2.49 3.03 in/in(cm/cm) (10.3
)
1 - Average of the two Axes
Table C13. AAMAS Test Results For Unconditioned Specimens @7'71 F.
Rice Specific Gravity 2.372
Sample# 5 13 15 Average
Bulk Specific Gravity 2.251 2.241 2.228 2.240
Air Voids,% 5.12 5.51 6.10 5.58
Total Resilient Modulus1, psi 3.13x10⁵ 3.21x10⁵ 3.49x10⁵ 3.28x10⁵
(Kg/cm2) (21977) (22591) (24526) (23031)
Indirect Tensile Strength, psi 99.26 97.94 93.57 96.92 (6.81) (Kg/cm2
) (6.99) (6.90) (6.58)
Indirect Tensile Strain @Failure, 6.13 6.43 6.04 6.20 in/in (cm/cm) (10-3
)
1 - Average of the two Axes
147

Table Cl4. AAMAS Test Results For Unconditioned Specimens @104°F.
Rice Specific Gravity 2.372
Sample# 7 17 18 Average
Bulk Specific Gravity 2.236 2.240 2.246 2.240
Air Voids,% 5.72 5.55 5.32 5.58
Total Resilient Modulus\ psi 1.20x10⁵ 1.37x10⁵ 1.55xl05 1.37xlo' (Kg/cm2
) (8429) (9622) (10871) (9641)
Indirect Tensile Strength, psi 27.92 31.63 32.54 30.70 (2.16) (Kg/cm2
) ( 1.97) (2.23) (2.29)
Indirect Tensile Strain @Failure, 10.38 8.71 11.16 10.08 in/in (cm/cm) (10"3
)
1 - Average of the two Axes
Table Cl5. AAMAS Test Results For Moisture Conditioned Specimens Tested @77°F.
Rice Specific Gravity 2.372
Sample# 3 11 12 Average
1 Bulk Specific Gravity 2.229 2.242 2.251 2.241
Air Voids,% 6.02 5.46 5.10 5.52
Degree Of Saturation, % 46.62 45.83 45.32 45.92
Total Resilient Modulus1, psi 3.01x10⁵ 2.80x10⁵ 3.34xl05 3.05x10⁵
(Kg/cm2) (21165) ( 19721) (23495) (21460)
Indirect Tensile Strength, psi 83.46 83.10 93.02 86.53 (6.08) (KG/cm2
) (5.89) (5.84) (6.55)
Indirect Tensile Strain @Failure, 10.85 9.67 9.90 10.14 in/in (cm/cm) (10"3
)
1 - Average of the two Axes
148
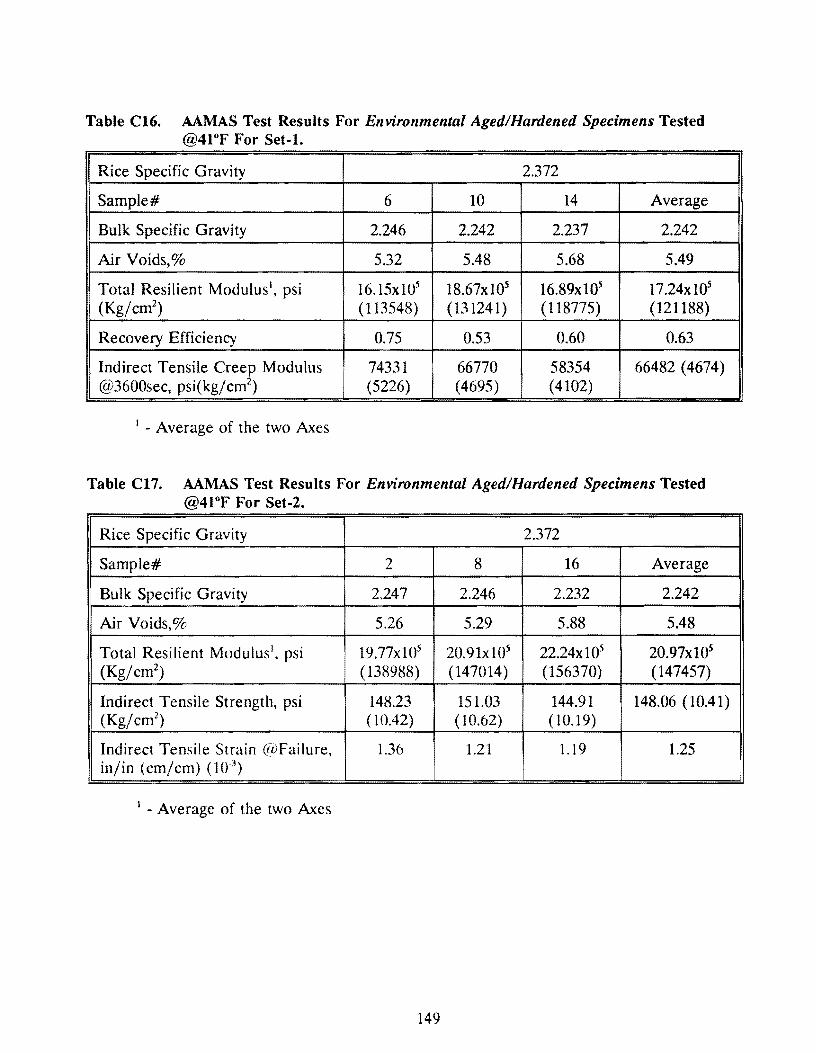
Table C16. AAMAS Test Results For Environmental Aged/Hardened Specimens Tested @4l°F For Set-I.
Rice Specific Gravity 2.372 1
Sample# 6 10 14 Average
Bulk Specific Gravity 2.246 2.242 2.237 2.242
Air Voids,% 5.32 5.48 5.68 5.49
. Total Resilient Modulus 1, psi 16.15xl05 18.67xl05 16.89xl05 17.24xl05
i (Kg/cm2) (113548) (131241) (118775) (121188)
Recovery Efficiency 0.75 0.53 0.60 0.63
Indirect Tensile Creep Modulus 74331 66770 58354 66482 (4674) @3600sec, psi(kg/cm2
) (5226) (4695) (4102)
1 - Average of the two Axes
Table C17. AAMAS Test Results For Environmental Aged/Hardened Specimens Tested @41°F For Set-2.
Rice Specific Gravity 2.372
Sample# 2 8 16 Average
• Bulk Specific Gravity 2.247 2.246 2.232 2.242
Air Voids,% 5.26 5.29 5.88 5.48
Total Resilient Modulus1, psi 19.77x10⁵ 20.91xl05 22.24xl05 20.97xl05
(Kg/cm2) ( 138988) (147014) (156370) (147457)
Indirect Tensile Strength, psi 148.23 151.03 144.91 148.06 ( 10.41) (Kg/cm2
) ( 10.42) (10.62) (10.19)
Indirect Tensile Strain @Failure, 1.36 1.21 1.19 1.25 in/in (cm/cm) (10-3
)
1 - Average of the two Axes
149
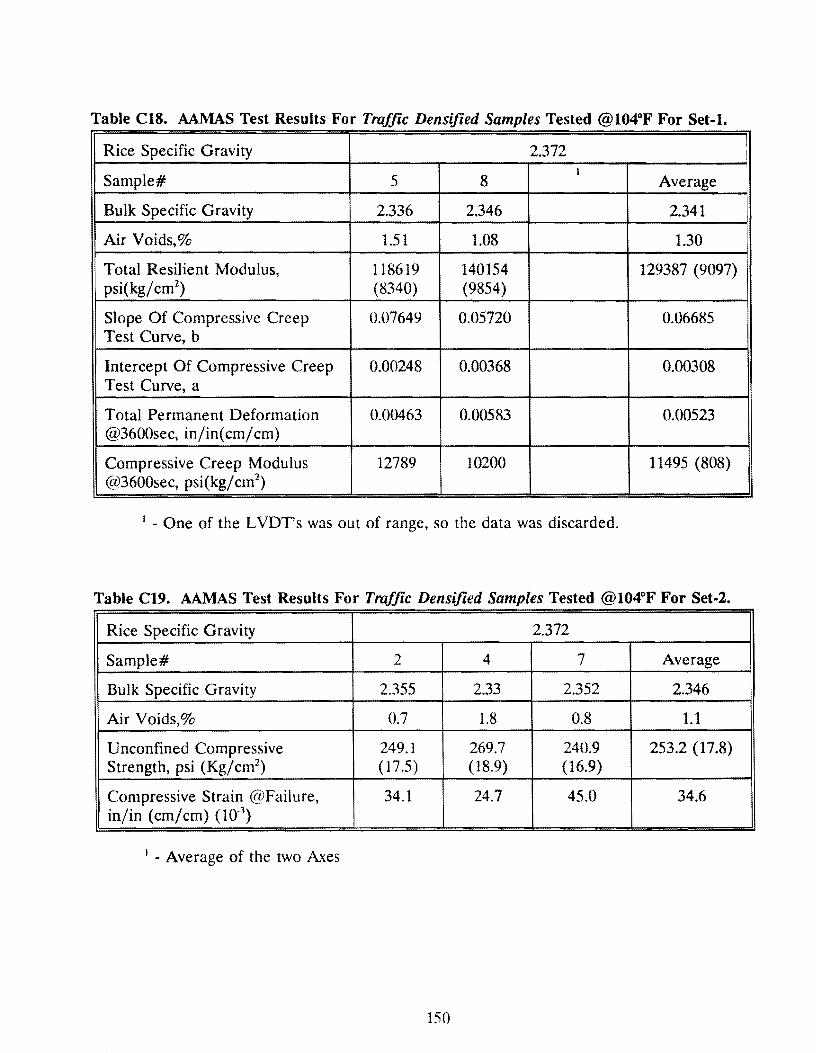
Table Cl8. AAMAS Test Results For Traffic Densified Samples Tested @l04°F For Set-1.
Rice Specific Gravity 2.372 I I
Sample# 5 8 I
! Average
Bulk Specific Gravity 2.336 2.346 2.341
Air Voids,% 1.51 1.08 1.30
Total Resilient Modulus, 118619 140154 129387 (9097) psi(kg/ cm2
) (8340) (9854)
Slope Of Compressive Creep 0.07649 0.05720 0.06685 Test Curve, b
Intercept Of Compressive Creep 0.00248 0.00368 0.00308 Test Curve, a
Total Permanent Deformation 0.00463 0.00583 0.00523 @3600sec, in/in(cm/cm)
Compressive Creep Modulus 12789 10200 11495 (808) @3600sec, psi(kg/ cm2
)
1 - One of the L VDT's was out of range, so the data was discarded.
Table C19. AAMAS Test Results For Traffic Densified Samples Tested @104°F For Set-2.
Rice Specific Gravity 2.372
Sample# 2 4 7 Average
Bulk Specific Gravity 2.355 2.33 2.352 2.346
Air Voids,% 0.7 1.8 0.8 1.1
Unconfined Compressive 249.1 269.7 240.9 253.2 (17.8) Strength, psi (Kg/ cm2
) (17.5) (18.9) (16.9)
Compressive Strain @Failure, 34.1 24.7 45.0 34.6 in/in (cm/cm) (10-3
)
1 - Average of the two Axes
150
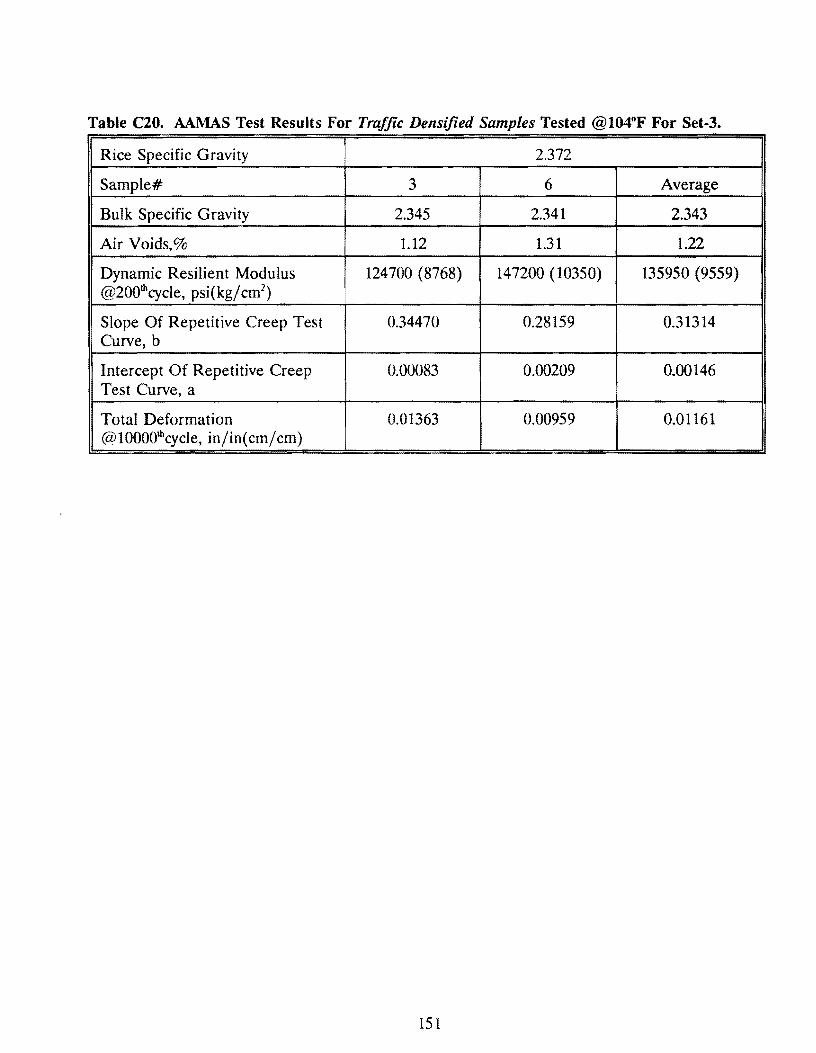
Table C20. AAMAS Test Results For Traffic Densified Samples Tested @l04°F For Set-3.
Rice Specific Gravity 2.372
Sample# 3 6 Average
Bulk Specific Gravity 2.345 2.341 2.343
Air Voids,% 1.12 1.31 1.22
Dynamic Resilient Modulus 124700 (8768) 147200 (10350) 135950 (9559) @2001.hcycle, psi(kg/ cm2
)
Slope Of Repetitive Creep Test 0.34470 0.28159 0.31314 Curve, b
Intercept Of Repetitive Creep 0.00083 0.00209 0.00146 Test Curve, a
Total Deformation 0.01363 0.00959 0.01161 @lOOOOlhcycle, in/in(cm/cm)
151


Appendix D
Laboratory Data for 10%FW Mixture
(10% Fine Rubber, by Weight of Asphalt, via Wet Method)
153

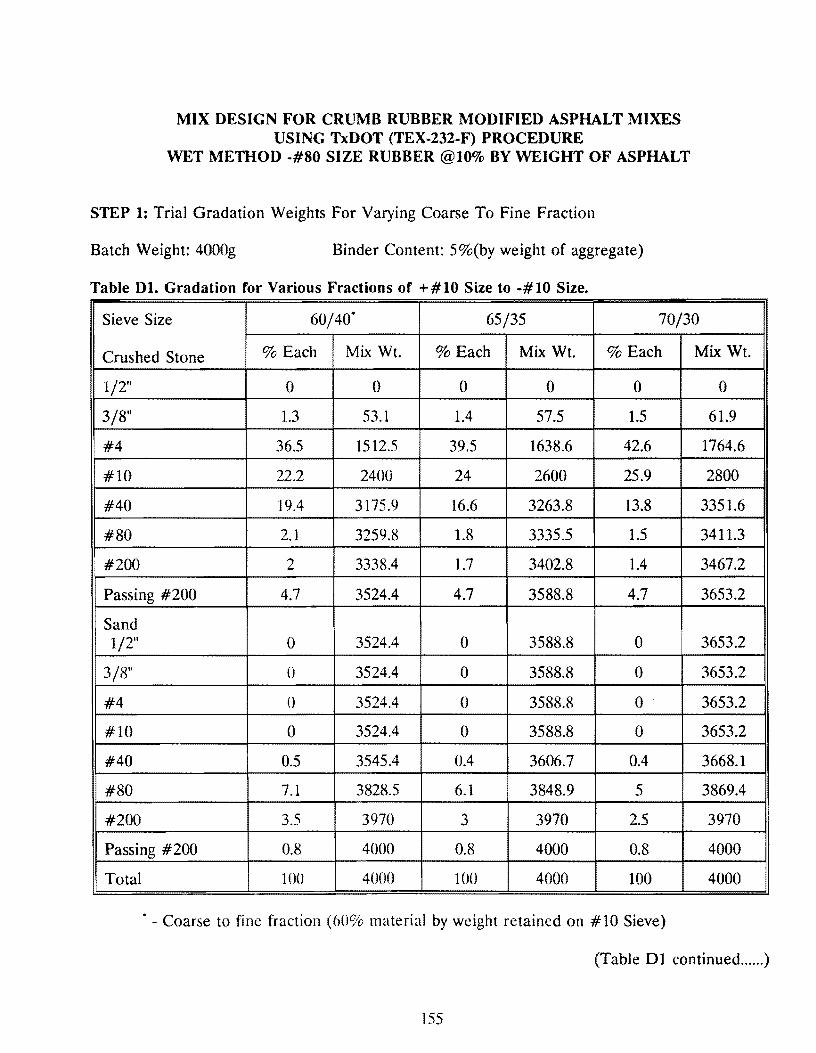
MIX DESIGN FOR CRUMB RUBBER MODIFIED ASPHALT MIXES USING TxDOT (TEX-232-F) PROCEDURE
WET METHOD -#80 SIZE RUBBER @10% BY WEIGHT OF ASPHALT
STEP 1: Trial Gradation Weights For Varying Coarse To Fine Fraction
Batch Weight: 4000g Binder Content: 5%(by weight of aggregate)
Table DI. Gradation for Various Fractions of +#10 Size to -#10 Size.
Sieve Size 60/40. 65/35 70/30
Crushed Stone % Each Mix Wt. %Each Mix Wt. %Each Mix Wt.
1/2" 0 0 0 0 0 0
3/8" 1.3 53.1 1.4 57.5 1.5 61.9
• #4 36.5 1512.5 39.5 1638.6 42.6 1764.6
#10 22.2 2400 24 2600 25.9 2800
#40 19.4 3175.9 16.6 3263.8 13.8 3351.6
#80 2.1 3259.8 1.8 3335.5 1.5 3411.3
i #200 2 3338.4 ' 1.7 3402.8 1.4 3467.2
Passing #200 4.7 3524.4 4.7 3588.8 4.7 3653.2
Sand 1/2" 0 3524.4 0 3588.8 0 3653.2
3/8" 0 3524.4 0 3588.8 0 3653.2
#4 0 3524.4 0 3588.8 0 3653.2
#10 0 3524.4 0 3588.8 0 3653.2
#40 0.5 3545.4 0.4 3606.7 0.4 3668. l
#80 7.1 3828.5 6.1 3848.9 5 3869.4
#200 3.5 3970 3 3970 2.5 3970
Passing #200 0.8 4000 0.8 4000 0.8 4000
Total 100 4000 100 4000 100 4000
• - Coarse to fine fraction (60% material by weight retained on #10 Sieve)
(Table Dl continued ...... )
155
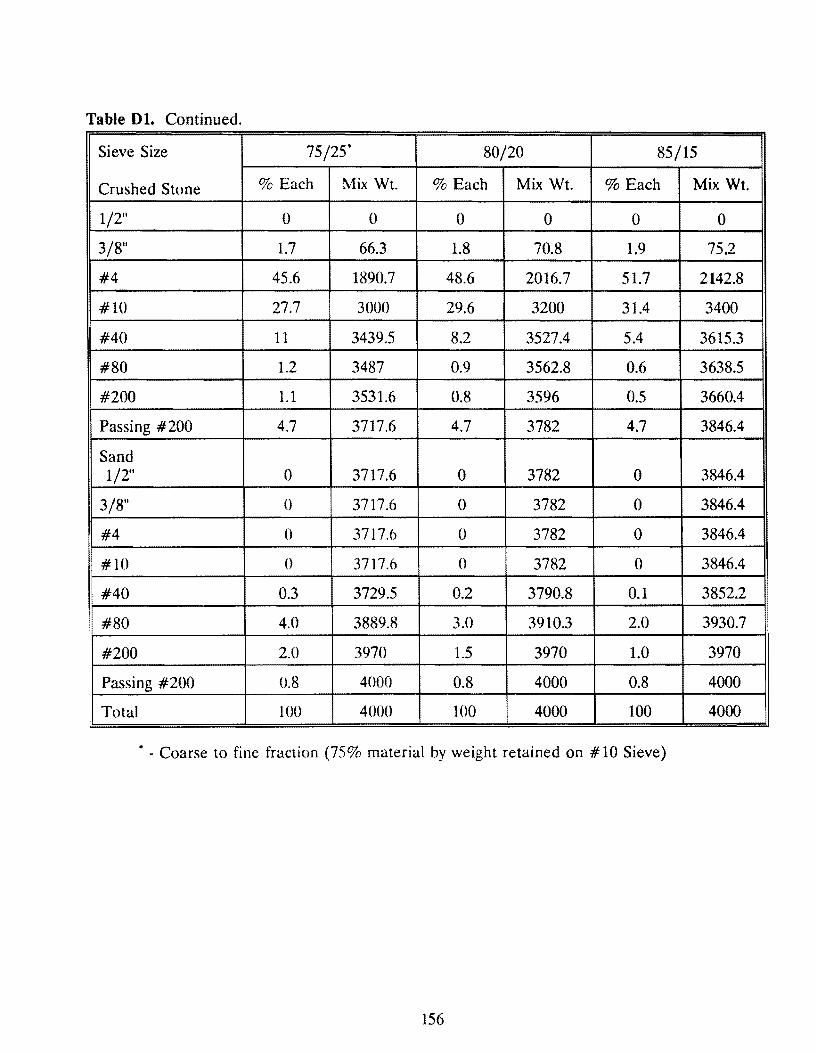
Table Dl. Continued.
Sieve Size 75/25. 80/20 85/15
Crushed Stone % Each Mix Wt. % Each Mix Wt. % Each Mix Wt.
1/2" 0 0 0 0 0 0
3/8" 1.7 66.3 1.8 70.8 1.9 75.2
#4 45.6 1890.7 48.6 2016.7 51.7 2142.8
#10 27.7 3000 29.6 3200 31.4 3400
#40 11 3439.5 8.2 3527.4 5.4 3615.3
#80 1.2 3487 0.9 3562.8 0.6 3638.5
#200 1.1 3531.6 0.8 3596 0.5 3660.4
Passing #200 4.7 3717.6 4.7 3782 4.7 3846.4
Sand 1/2" 0 3717.6 0 3782 0 3846.4
3/8" 0 3717.6 0 3782 0 3846.4
#4 0 3717.6 0 3782 0 3846.4
#10 0 3717.6 0 3782 0 3846.4
#40 0.3 3729.5 0.2 3790.8 0.1 3852.2
#80 4.0 3889.8 3.0 3910.3 2.0 3930.7
#200 2.0 3970 1.5 3970 1.0 3970
Passing #200 0.8 4000 0.8 4000 0.8 4000
Total 100 4000 100 4000 100 4000
• - Coarse to fine fraction (75% material by weight retained on # 10 Sieve)
156
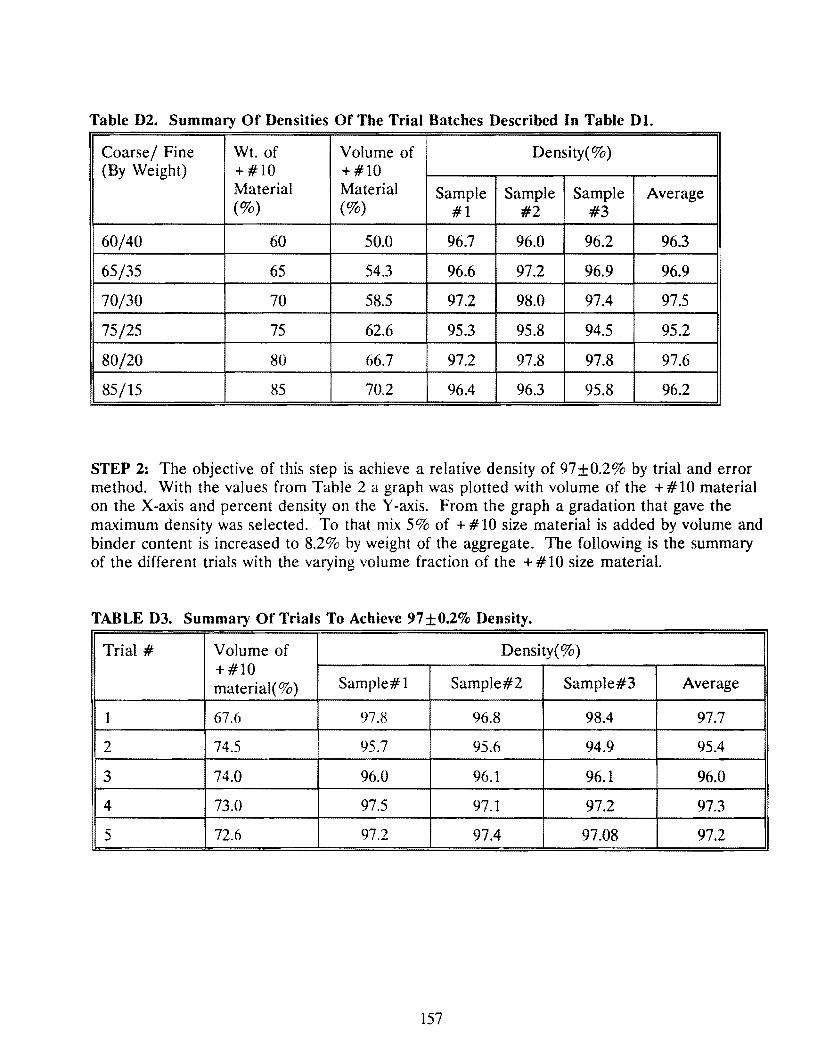
Table D2. Summary Of Densities Of The Trial Batches Described In Table DI.
Coarse/ Fine Wt. of Volume of Density(%) (By Weight) +#10 +#10
Material Material Sample Sample Sample Average (%) (%) #1 #2 #3
60/40 60 50.0 96.7 96.0 96.2 96.3
65/35 65 54.3 96.6 97.2 96.9 96.9
70/30 70 58.5 97.2 98.0 97.4 97.5
75/25 75 62.6 95.3 95.8 94.5 95.2
80/20 80 66.7 97.2 97.8 97.8 97.6
85/15 85 70.2 96.4 96.3 95.8 96.2
STEP 2: The objective of this step is achieve a relative density of 97 ±0.2% by trial and error method. With the values from Table 2 a graph was plotted with volume of the + #10 material on the X-axis and percent density on the Y-axis. From the graph a gradation that gave the maximum density was selected. To that mix 5% of + #10 size material is added by volume and binder content is increased to 8.2% by weight of the aggregate. The following is the summary of the different trials with the varying volume fraction of the + #10 size material.
TABLE D3. Summary Of Trials To Achieve 97 ±0.2% Density.
Trial# Volume of Density(%) +#10 material(%) Sample#l Sample#2 Sample#3 Average
1 67.6 97.8 96.8 98.4 97.7
2 74.5 95.7 95.6 94.9 95.4
3 74.0 96.0 96.1 96.1 96.0
4 73.0 97.5 97.1 97.2 97.3
5 72.6 97.2 97.4 97.08 97.2
157
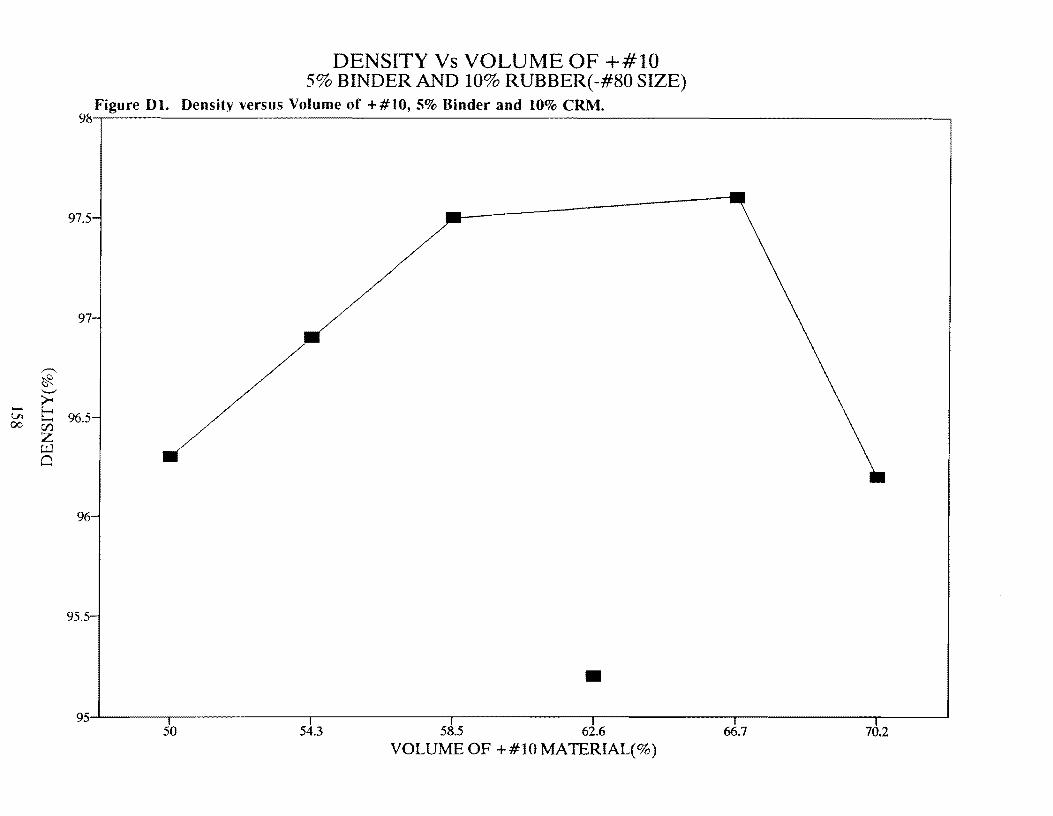
DENSITY Vs VOLUME OF +#10 5% BINDER AND 10% RUBBER(-#80 SIZE)
Figure DI. Density versus Volume of +#IO, 5% Binder and 10% CRM. 9~.-,-~~~~~~~~~~~~~~~~~~~~~~~~~~~~~~~~~~~~~~-,
97.5
97
,......__
~ '-'
- ~ Vl ......... 96.5 00 Vl
z UJ Cl
96
95.5
• 50 54.3 58.5 62.6 66.7 70.2
VOLUME OF +#10 MATERIAL(%)
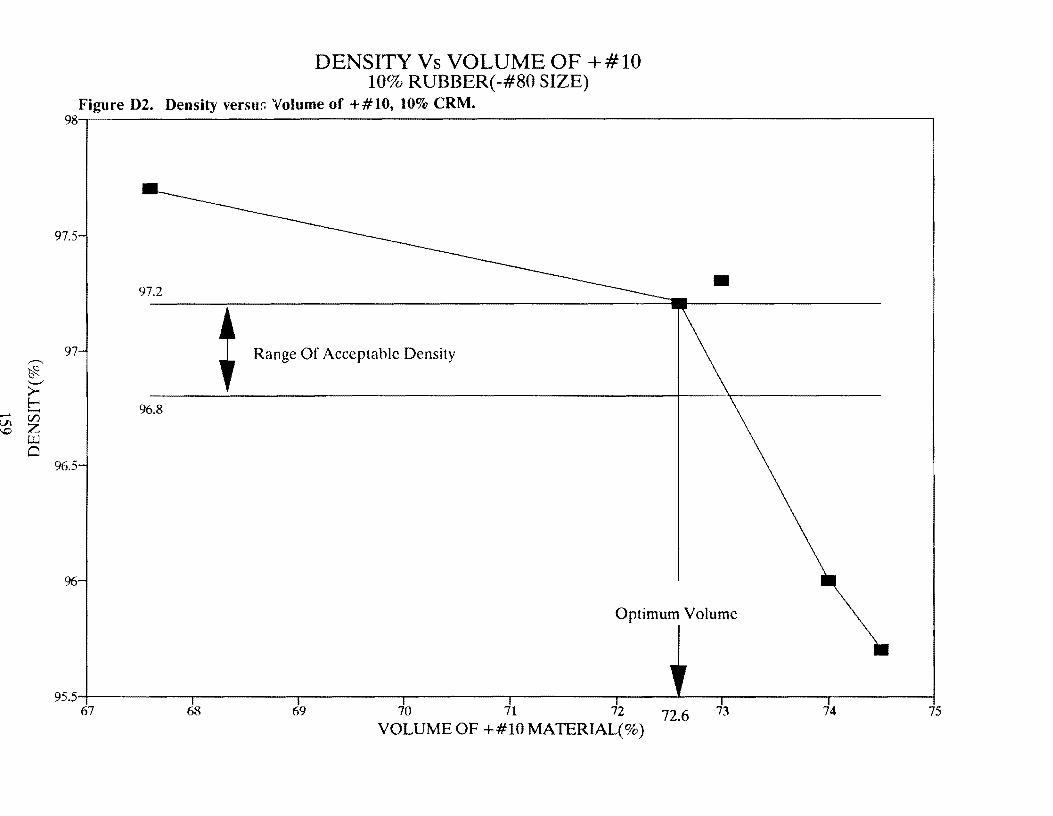
DENSITY Vs VOLUME OF +#10 10% RUBBER(-#80 SIZE)
Figure 02. Density versu;. Volume of +#10, 10% CRM. 98-.--------------------------------------~
97.5
• 97 Range Of Acceptable Density
96.8
96.5
96
Optimum Volume
95.5-;-----.------r--------,....----------.-------,----..l...--..,.-------.------1 67 68 69 70 71 72 72.6 73 74 75
VOLUME OF +#10 MATERIAL(%)
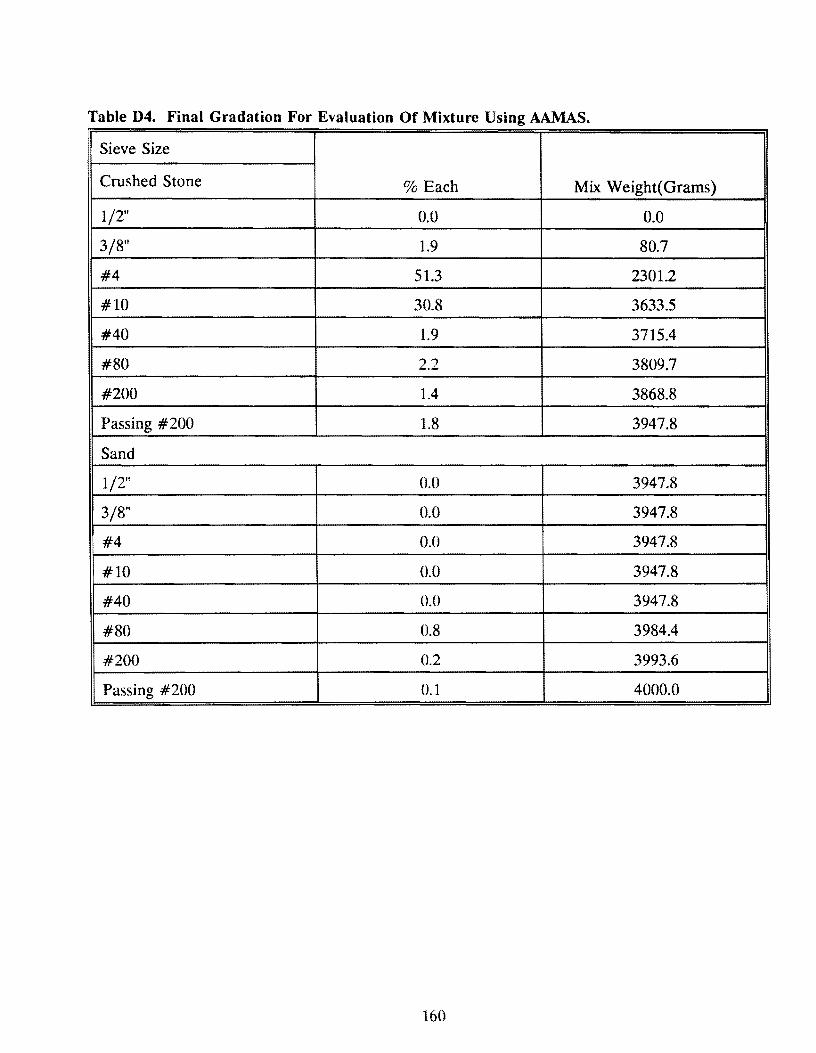
Table 04. Final Gradation For Evaluation Of Mixture Using AAMAS.
Sieve Size
Crushed Stone % Each Mix Weight( Grams)
1/2" 0.0 0.0
3/8" 1.9 80.7
#4 51.3 2301.2
#10 30.8 3633.5
#40 1.9 3715.4
#80 2.2 3809.7
#200 1.4 3868.8
Passing #200 1.8 3947.8
Sand
1/2" 0.0 3947.8
3/8" 0.0 3947.8
#4 0.0 3947.8
#10 0.0 3947.8
#40 0.0 3947.8
#80 0.8 3984.4
#200 0.2 3993.6
Passing #200 0.1 4000.0
160
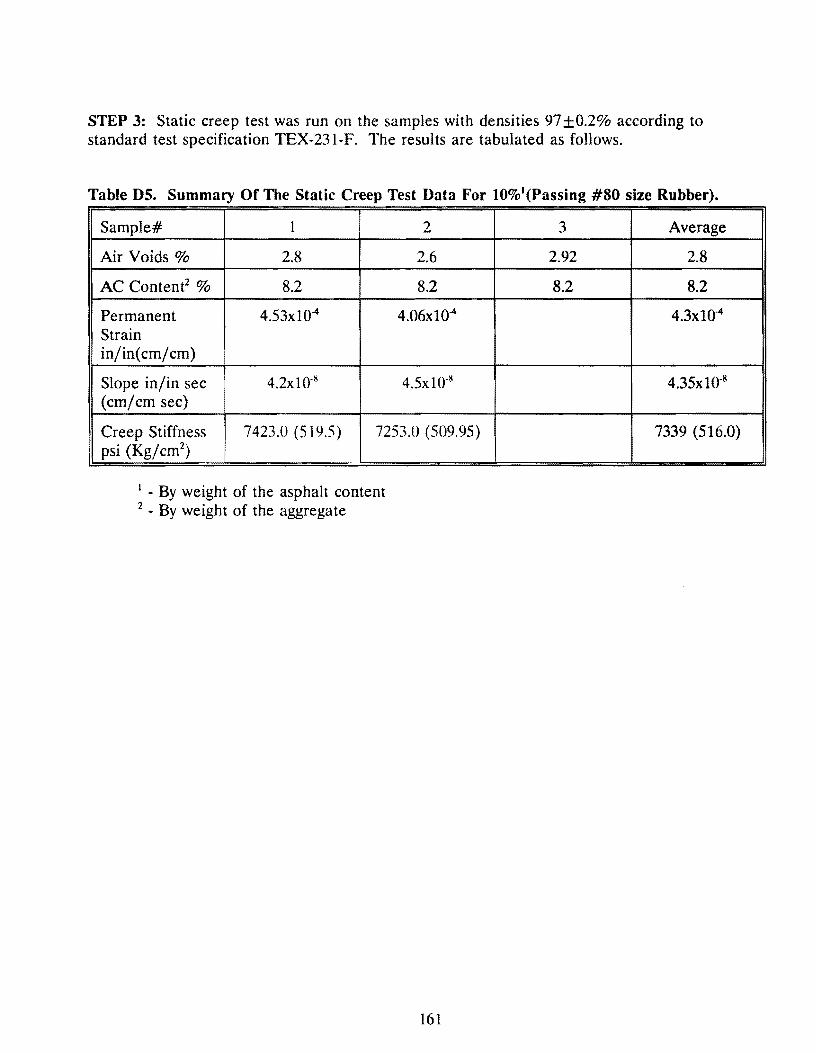
STEP 3: Static creep test was run on the samples with densities 97 +0.2% according to standard test specification TEX-231-F. The results are tabulated as follows.
Table DS. Summary Of The Static Creep Test Data For 10%1(Passing #80 size Rubber).
Sample# 1 2
Air Voids% 2.8 2.6
AC Content2 % 8.2 8.2
Permanent 4.53xl04 4.06x10⁴
Strain in/in( cm/cm)
Slope in/in sec 4.2xl0·8 4.5x10·~
(cm/cm sec)
Creep Stiffness 7423.0 (519.5) 7253.0 (509.95) psi (Kg/cm2
)
1 • By weight of the asphalt content
2 • By weight of the aggregate
161
3 Average
2.92 2.8
8.2 8.2
4.3x10⁴
4.35x10-s
7339 (516.0)
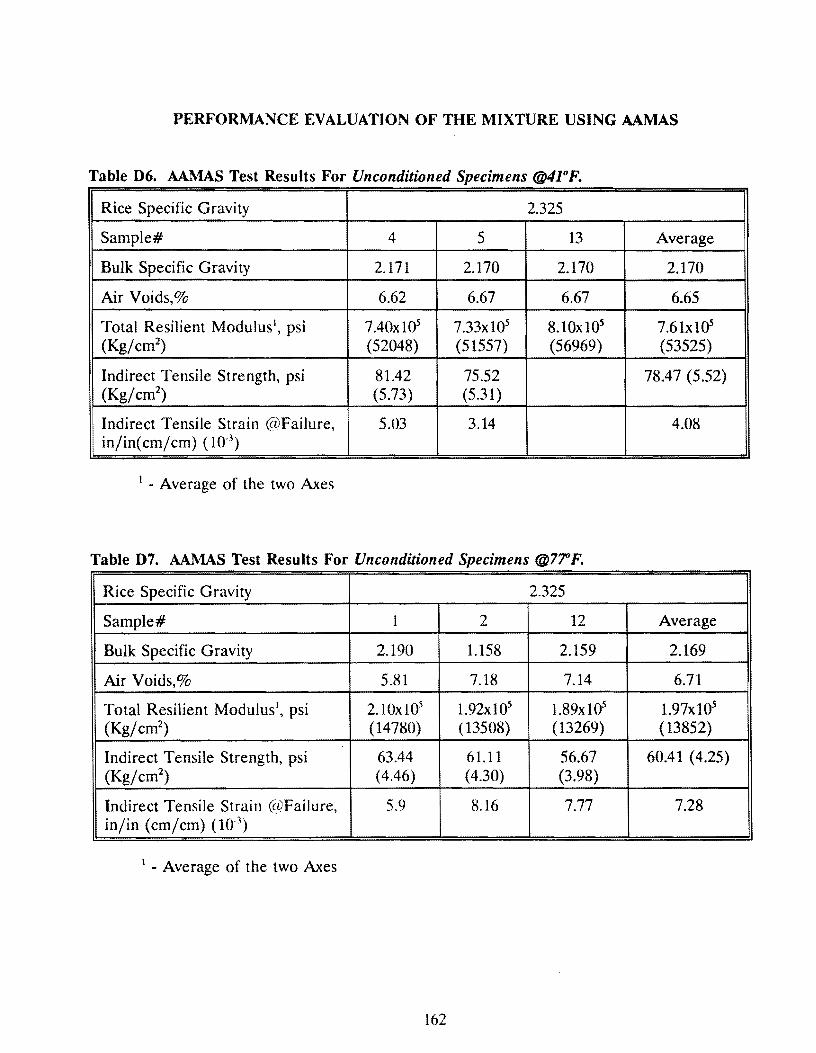
PERFORMANCE EVALUATION OF THE MIXTURE USING AAMAS
Table 06. AAMAS Test Results For Unconditioned Specimens @41°F.
Rice Specific Gravity 2.325
Sample# 4 5 13 Average
Bulk Specific Gravity 2.171 2.170 2.170 2.170
Air Voids,% 6.62 6.67 6.67 6.65
Total Resilient Modulus', psi 7.40x10⁵ 7.33x10⁵ 8.10x10⁵ 7.6lxl05
(Kg/cm2) (52048) (51557) (56969) (53525)
Indirect Tensile Strength, psi 81.42 75.52 78.47 (5.52) (Kg/cm2
) (5.73) (5.31)
Indirect Tensile Strain @Failure, 5.03 3.14 4.08 in/in(cm/cm) (10.3
)
1 - Average of the two Axes
Table 07. AAMAS Test Results For Unconditioned Specimens @7'rF.
Rice Specific Gravity 2.325
Sample# 1 2 12 Average
Bulk Specific Gravity 2.190 1.158 2.159 2.169
Air Voids,% 5.81 7.18 7.14 6.71
Total Resilient Modulus', psi 2.10xl05 l.92x105 1.89x10⁵ l.97xlQ5
(Kg/cm2) (14780) (13508) (13269) (13852)
Indirect Tensile Strength, psi 63.44 61.11 56.67 60.41 ( 4.25) (Kg/cm2
) (4.46) (4.30) (3.98)
Indirect Tensile Strain @Failure, 5.9 8.16 7.77 7.28 in/in (cm/cm) (10.3
)
1 - Average of the two Axes
162
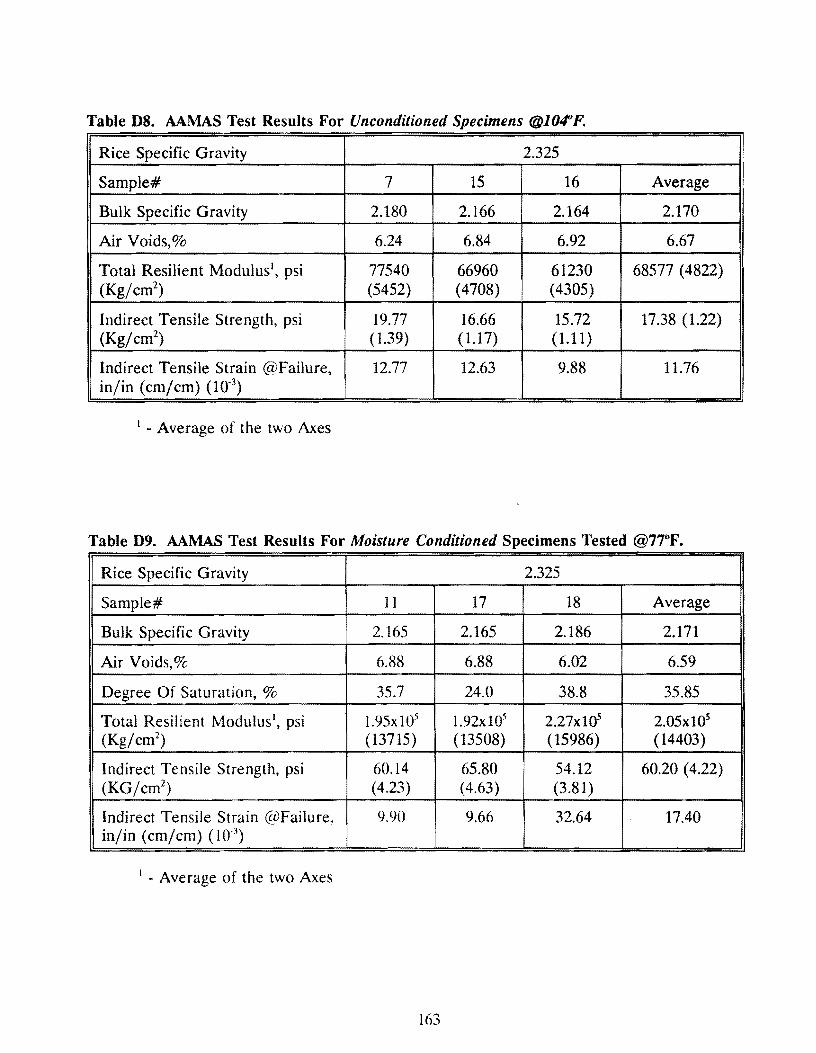
Table DS. AAMAS Test Results For Unconditioned Specimens @104°F.
Rice Specific Gravity 2.325 1
Sample# 7 15 16 Average
Bulk Specific Gravity 2.180 2.166 2.164 2.170
Air Voids,% 6.24 6.84 6.92 6.67
Total Resilient Modulus', psi 77540 66960 61230 68577 ( 4822) (Kg/cm2
) (5452) (4708) (4305)
Indirect Tensile Strength, psi 19.77 16.66 15.72 17.38 (1.22) (Kg/cm2
) ( 1.39) ( 1.17) (1.11)
Indirect Tensile Strain @Failure, 12.77 12.63 9.88 11.76 in/in (cm/cm) (10-3
)
1 - Average of the two Axes
Table D9. AAI\1AS Test Results For Moisture Conditioned Specimens Tested @77°F.
Rice Specific Gravity 2.325
Sample# 11 17 18 Average
Bulk Specific Gravity 2.165 2.165 2.186 2.171
Air Voids,% 6.88 6.88 6.02 6.59
Degree Of Saturation, % 35.7 24.0 38.8 35.85
Total Resilient Modulus\ psi l.95xl05 1.92xl05 2.27xl05 2.05x10⁵
(Kg/cm2) (13715) (13508) (15986) (14403)
Indirect Tensile Strength, psi 60.14 65.80 54.12 60.20 (4.22) (KG/crn2
) (4.23) (4.63) (3.81)
Indirect Tensile Strain @Failure, 9.90 9.66 32.64 17.40 in/in (cm/cm) (10.3
)
1 - Average of the two Axes
163
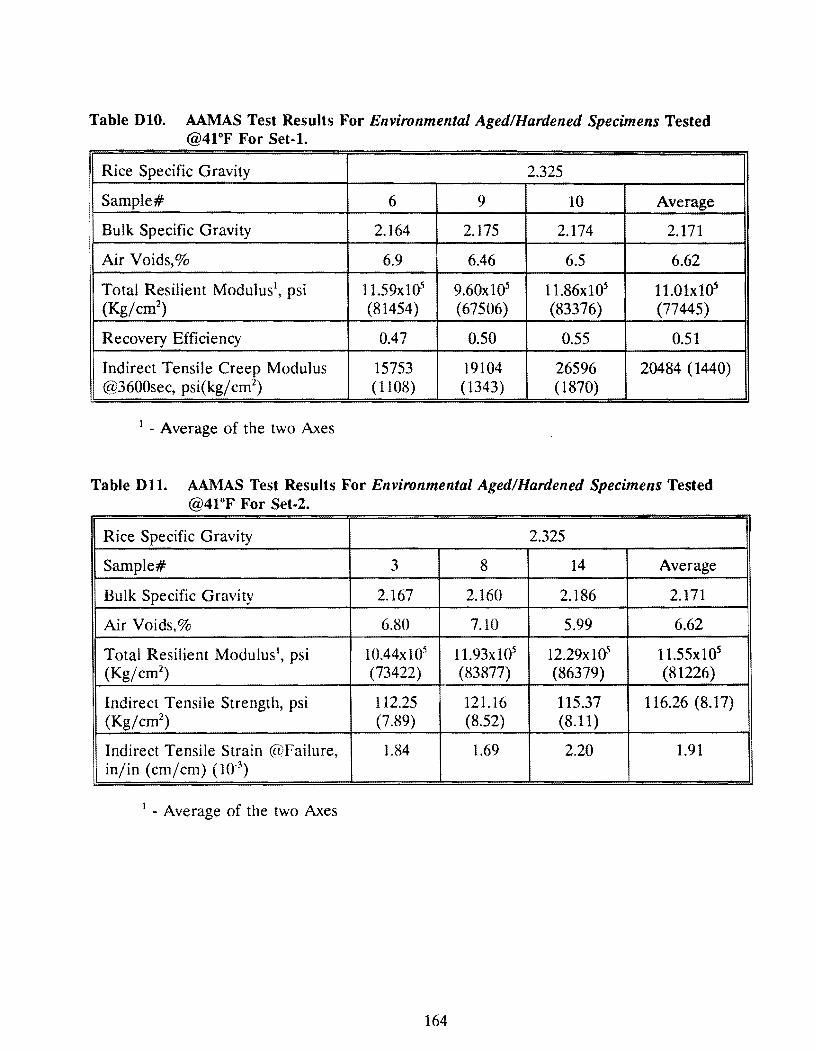
Table DlO. AAMAS Test Results For Environmental Aged/Hardened Specimens Tested @4l°F For Set-1.
I Rice Specific Gravity 2.325
Sample# 6 9 10 Average
Bulk Specific Gravity 2.164 2.175 2.174 2.171
Air Voids,% 6.9 6.46 6.5 6.62
Total Resilient Modulus1, psi l 1.59xl05 9.60x10⁵ 11.86xl05 11.0lxlo'
(Kg/cm2) (81454) (67506) (83376) (77445)
Recovery Efficiency 0.47 0.50 0.55 0.51
Indirect Tensile Creep Modulus 15753 19104 26596 20484 (1440) @3600sec, psi(kg/ cm2
) (1108) ( 1343) (1870)
1 - Average of the two Axes
Table Dl 1. AAMAS Test Results For Environmental Aged/Hardened Specimens Tested @41°F For Set-2.
Rice Specific Gravity 2.325
Sample# 3 8 14 Average
Bulk Specific Gravity 2.167 2.160 2.186 2.171
Air Voids,% 6.80 7.10 5.99 6.62
Total Resilient Modulus 1, psi 10.44xl05 11.93x10⁵ 12.29xl05 11.55x10⁵
(Kg/cm2) (73422) (83877) (86379) (81226)
Indirect Tensile Strength, psi 112.25 121.16 115.37 116.26 (8.17) (Kg/cm2
) (7.89) (8.52) (8.11)
Indirect Tensile Strain @Failure, 1.84 1.69 2.20 1.91 in/in (cm/cm) (10-3
)
1 - Average of the two Axes
164
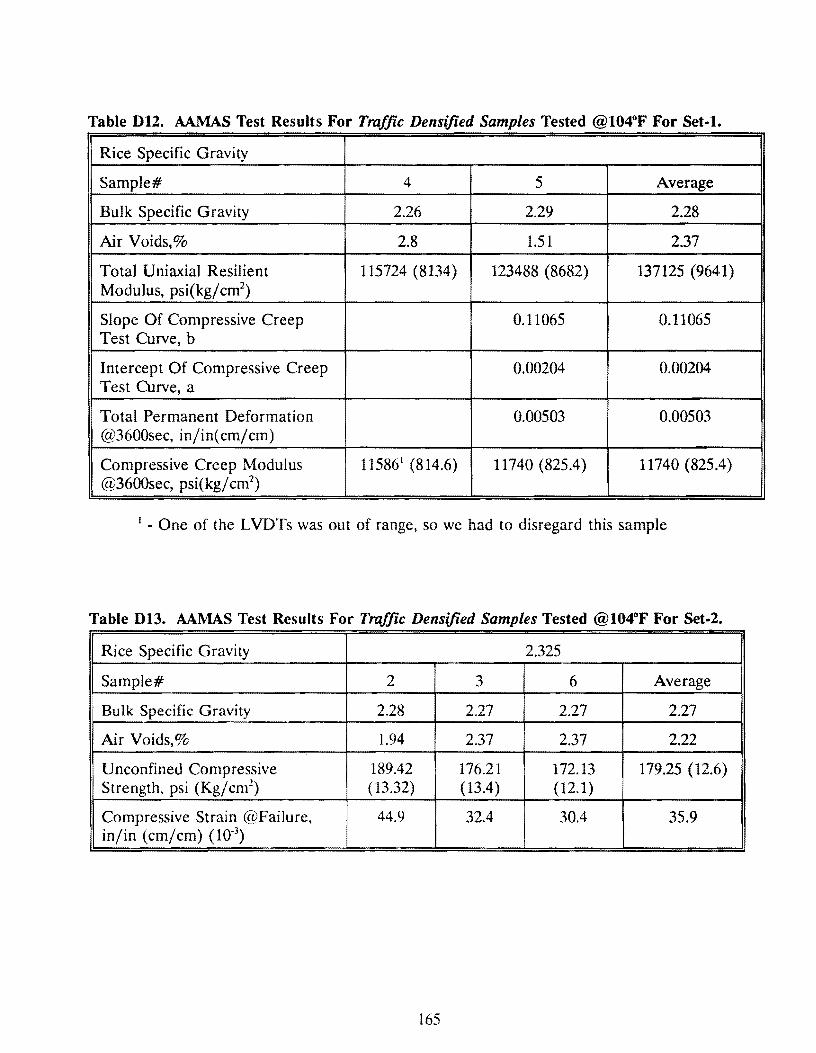
Table D12. AAMAS Test Results For Traffic Densified Samples Tested @104°F For Set-1.
Rice Specific Gravity
Sample# 4 5 Average
Bulk Specific Gravity 2.26 2.29 2.28
Air Voids,% 2.8 1.51 2.37
Total Uniaxial Resilient 115724 (8134) 123488 (8682) 137125 (9641) Modulus, psi(kg/ cm2
)
Slope Of Compressive Creep 0.11065 0.11065 Test Curve, b
Intercept Of Compressive Creep 0.00204 0.00204 Test Curve, a
Total Permanent Deformation 0.00503 0.00503 @3600sec, in/in(cm/cm)
Compressive Creep Modulus 115861 (814.6) 11740 (825.4) 11740 (825.4) @3600sec, psi(kg/ cm2
)
1 - One of the L VDTs was out of range, so we had to disregard this sample
Table D13. AAMAS Test Results For Traffic Densified Samples Tested @104°F For Set-2.
Rice Specific Gravity 2.325
Sample# 2 3 6 Average
Bulk Specific Gravity 2.28 2.27 2.27 2.27
Air Voids,% 1.94 2.37 2.37 2.22
Unconfined Compressive 189.42 176.21 172.13 179.25 (12.6) Strength, psi (Kg/cm2
) (13.32) ( 13.4) (12.l)
Compressive Strain @Failure, 44.9 32.4 30.4 35.9 in/in (cm/cm) (10-3
)
165

Table D14. AAMAS Test Results For Traffic Densified Samples Tested @104°F For Set-3.
Rice Specific Gravity 2.325
Sample# 1 2 Average
Bulk Specific Gravity 2.254 2.259 2.257
Air Voids,% 3.10 2.80 2.95
Dynamic Resilient Modulus 141100 (9921) 144700 (10174) 142900 (10047) @200th cycle, psi(kg/ cm2
)
Slope Of Repetitive Creep Test 0.51111 0.41650 0.46380 Curve, b
Intercept Of Repetitive Creep 0.00022 0.00062 0.00042 Test Curve, a
Total Permanent Deformation 0.01523 0.01809 0.01666 @lOOOOcycles, in/in(cm/cm)
166
Appendix E
Laboratory Data for 18%FW Mixture
(18% Fine Rubber, by Weight of Asphalt, via Wet Method)
167

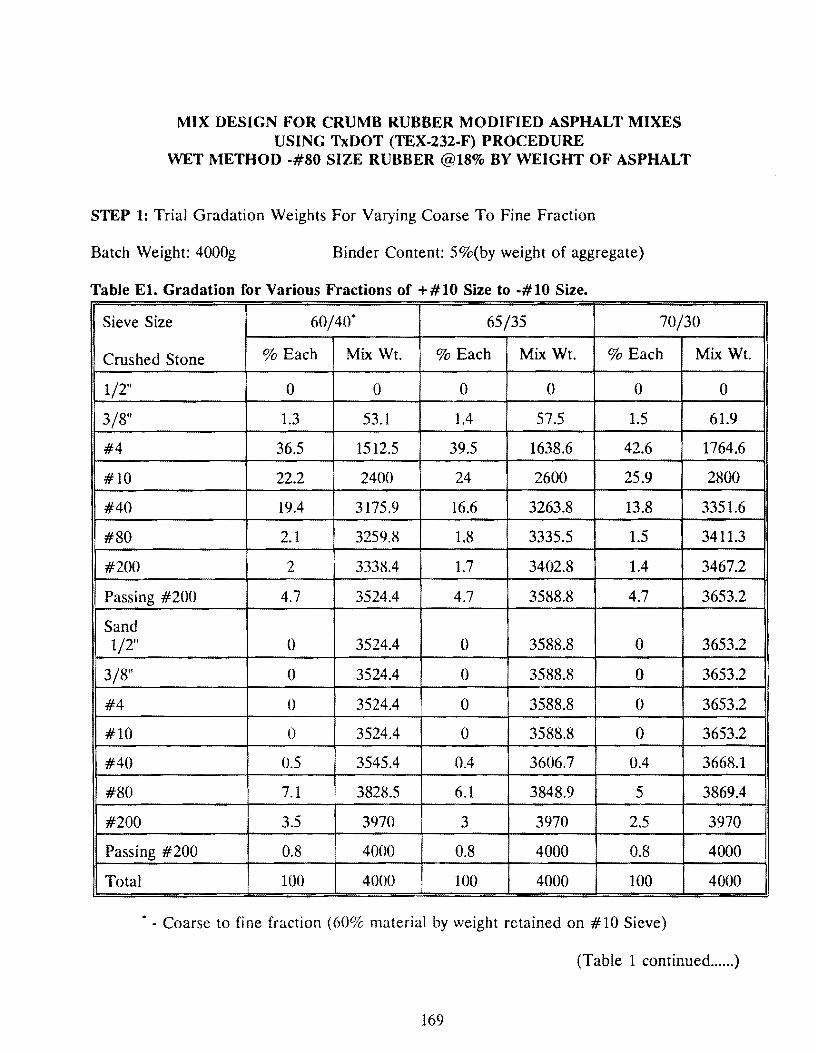
MIX DESIGN FOR CRUMB RUBBER MODIFIED ASPHALT MIXES USING TxDOT (TEX-232-F) PROCEDURE
WET METHOD -#80 SIZE RUBBER @18% BY WEIGHT OF ASPHALT
STEP 1: Trial Gradation Weights For Varying Coarse To Fine Fraction
Batch Weight: 4000g Binder Content: 5%(by weight of aggregate)
Table El. Gradation for Various Fractions of +#10 Size to -#10 Size.
Sieve Size 60/40" 65/35 70/30
Crushed Stone % Each Mix Wt. % Each Mix Wt. % Each Mix Wt.
1/2" 0 0 0 0 0 0
3/8" 1.3 53.l 1.4 57.5 1.5 61.9
#4 36.5 1512.5 39.5 1638.6 42.6 1764.6
#10 22.2 2400 24 2600 25.9 2800
#40 19.4 3175.9 16.6 3263.8 13.8 3351.6
#80 2.1 3259.8 1.8 3335.5 1.5 3411.3
#200 2 3338.4 1.7 3402.8 1.4 3467.2
Passing #200 4.7 3524.4 4.7 3588.8 4.7 3653.2
Sand 1/2" 0 3524.4 0 3588.8 0 3653.2
3/8" 0 3524.4 0 3588.8 0 3653.2
#4 () 3524.4 0 3588.8 0 3653.2
#10 0 3524.4 0 3588.8 0 3653.2
#40 0.5 3545.4 0.4 3606.7 0.4 3668.1
#80 7.1 3828.5 6.1 3848.9 5 3869.4
#200 3.5 3970 3 3970 2.5 3970
Passing #200 0.8 4000 0.8 4000 0.8 4000
Tota] 100 4000 100 4000 100 4000
• - Coarse to fine fraction (60% material by weight retained on #10 Sieve)
(Table 1 continued ...... )
169
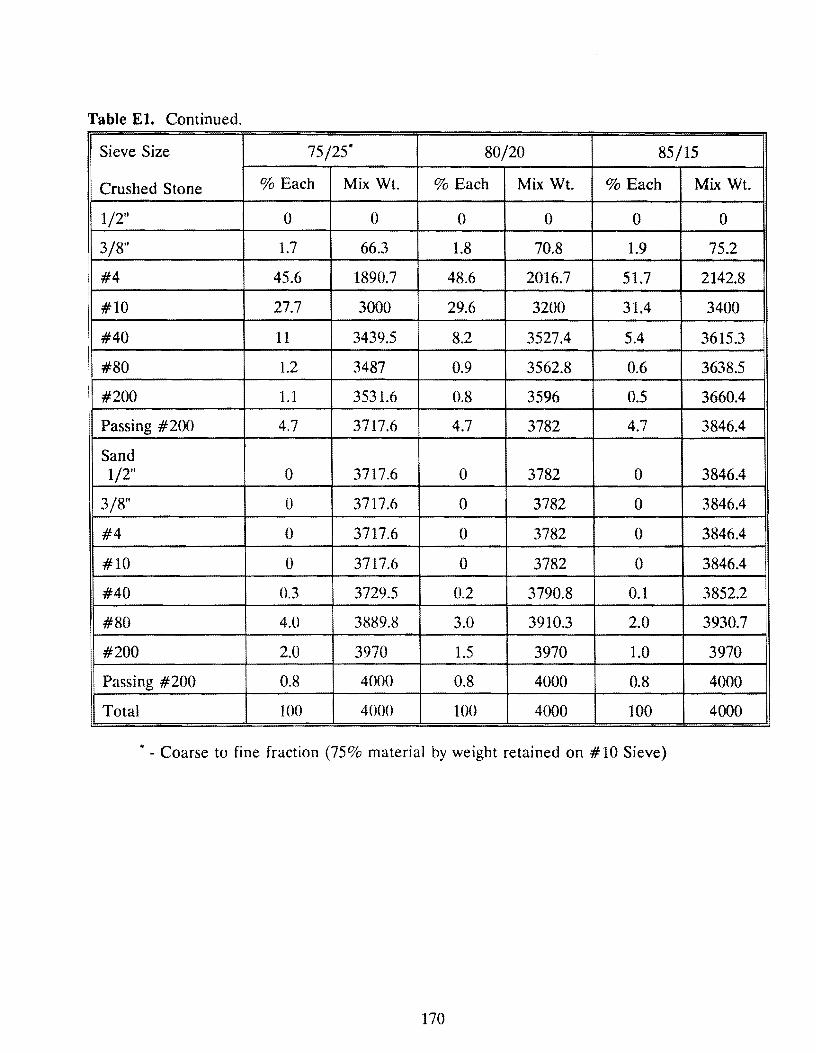
Table El. Continued.
Sieve Size 75/25· 80/20 85/15
Crushed Stone % Each Mix Wt. % Each Mix Wt. % Each Mix Wt.
1/2" 0 0 0 0 0 0
3/8" 1.7 66.3 1.8 70.8 1.9 75.2 i
I #4 45.6 1890.7 48.6 2016.7 51.7 2142.8
I #10 27.7 3000 29.6 3200 31.4 3400
#40 11 3439.5 8.2 3527.4 5.4 3615.3
I #80 1.2 3487 0.9 3562.8 0.6 3638.5 i
#200 1.1 3531.6 0.8 3596 0.5 3660.4
Passing #200 4.7 3717.6 4.7 3782 4.7 3846.4
Sand 1/2" 0 3717.6 0 3782 0 3846.4
3/8" 0 3717.6 0 3782 0 3846.4
#4 0 3717.6 0 3782 0 3846.4
#10 0 3717.6 0 3782 0 3846.4
#40 0.3 3729.5 0.2 3790.8 0.1 3852.2
#80 4.0 3889.8 3.0 3910.3 2.0 3930.7 I
#200 2.0 3970 1.5 3970 1.0 3970
Passing #200 0.8 4000 0.8 4000 0.8 4000
Total 100 4000 100 4000 100 4000
• - Coarse to fine fraction (75% material by weight retained on # 10 Sieve)
170
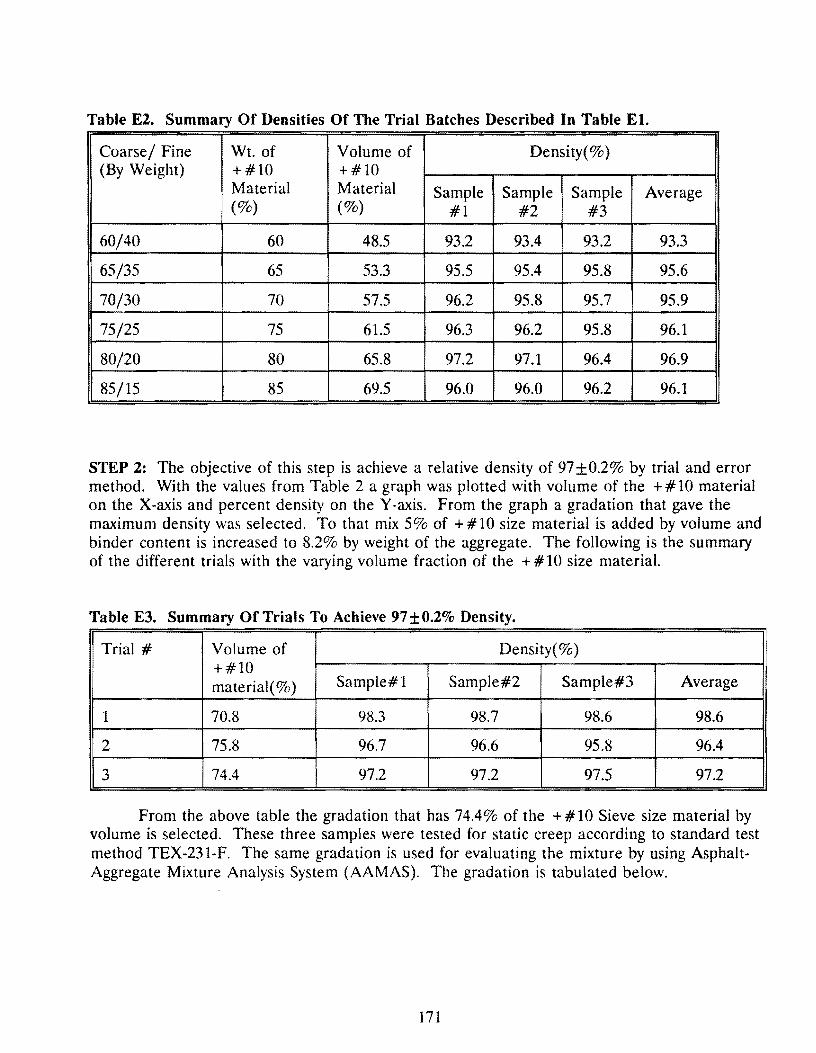
Table E2. Summary Of Densities Of The Trial Batches Described In Table El.
Coarse/ Fine Wt. of Volume of Density(%) (By Weight) +#10 +#10
Material Material Sample Sample Sample Average (%) (%) #1 #2 #3
60/40 60 48.5 93.2 93.4 93.2 93.3
65/35 65 53.3 95.5 95.4 95.8 95.6
70/30 70 57.5 96.2 95.8 95.7 95.9
75/25 75 61.5 96.3 96.2 95.8 96.1
80/20 80 65.8 97.2 97.1 96.4 96.9
85/15 85 69.5 96.0 96.0 96.2 96.1
STEP 2: The objective of this step is achieve a relative density of 97±0.2% by trial and error method. With the values from Table 2 a graph was plotted with volume of the + # 10 material on the X~axis and percent density on the Y-axis. From the graph a gradation that gave the maximum density was selected. To that mix 5 % of + # 10 size material is added by volume and binder content is increased to 8.2% by weight of the aggregate. The following is the summary of the different trials with the varying volume fraction of the + # 10 size material.
Table E3. Summary Of Trials To Achieve 97 ±0.2% Density.
Trial # Volume of Density(%) +#10 material(%) Sample#l Sample#2 Sample#3 Average
1 70.8 98.3 98.7 98.6 98.6
2 75.8 96.7 96.6 95.8 96.4
3 74.4 97.2 97.2 97.5 97.2
From the above table the gradation that has 74.4% of the + #10 Sieve size material by volume is selected. These three samples were tested for static creep according to standard test method TEX-231-F. The same gradation is used for evaluating the mixture by using Asphalt· Aggregate Mixture Analysis System (AAMAS). The gradation is tabulated below.
171
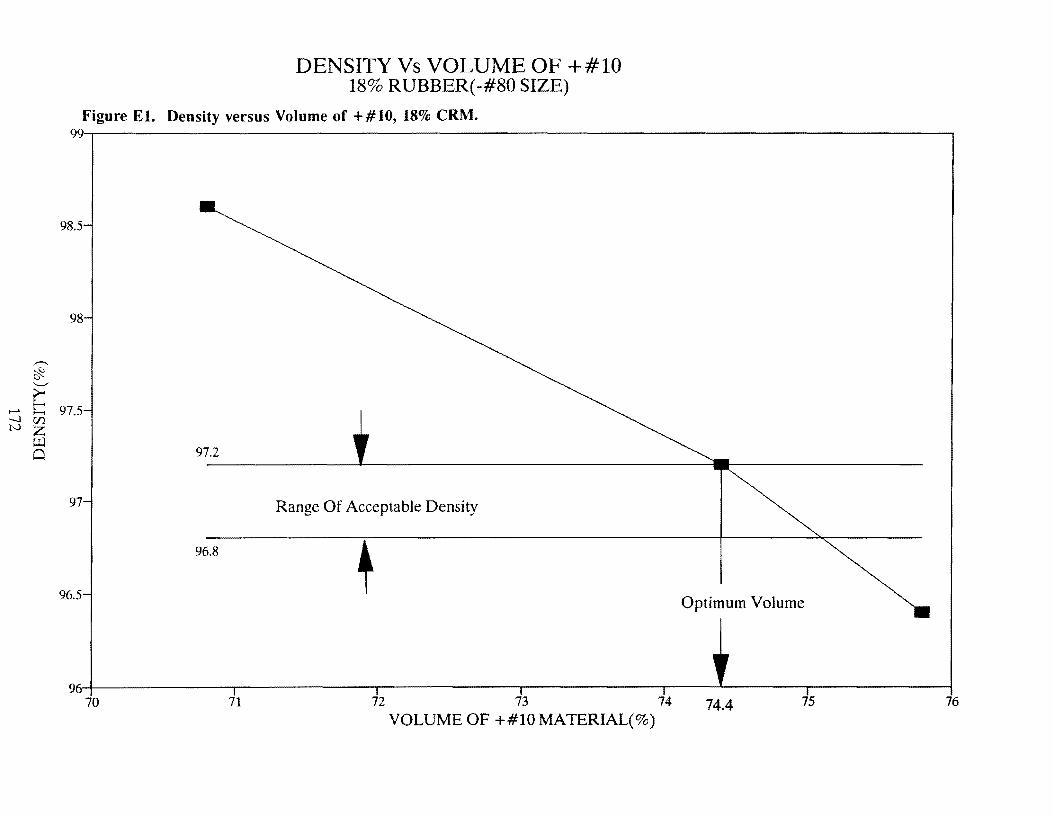
,,..-..
~ .._.., ;::...
...... E-.........
-.l Cl) N z w
a
DENSITY Vs VOLUME OF +#10 18% RUBBER(-#80 SIZE)
Figure El. Density versus Volume of +#10, 18% CRM. 99-,---------------------------------------------------~-----------------------------,
98.5
98
97.5
97.2
97 Range Of Acceptable Density
96.8
96.5 Optimum Volume
96-+-------------.,--------~----.-------------.--------------,-----"'--------.,-------------;
70 71 72 73 74 74.4 75 76
VOLUME OF +#10 MATERIAL(%)
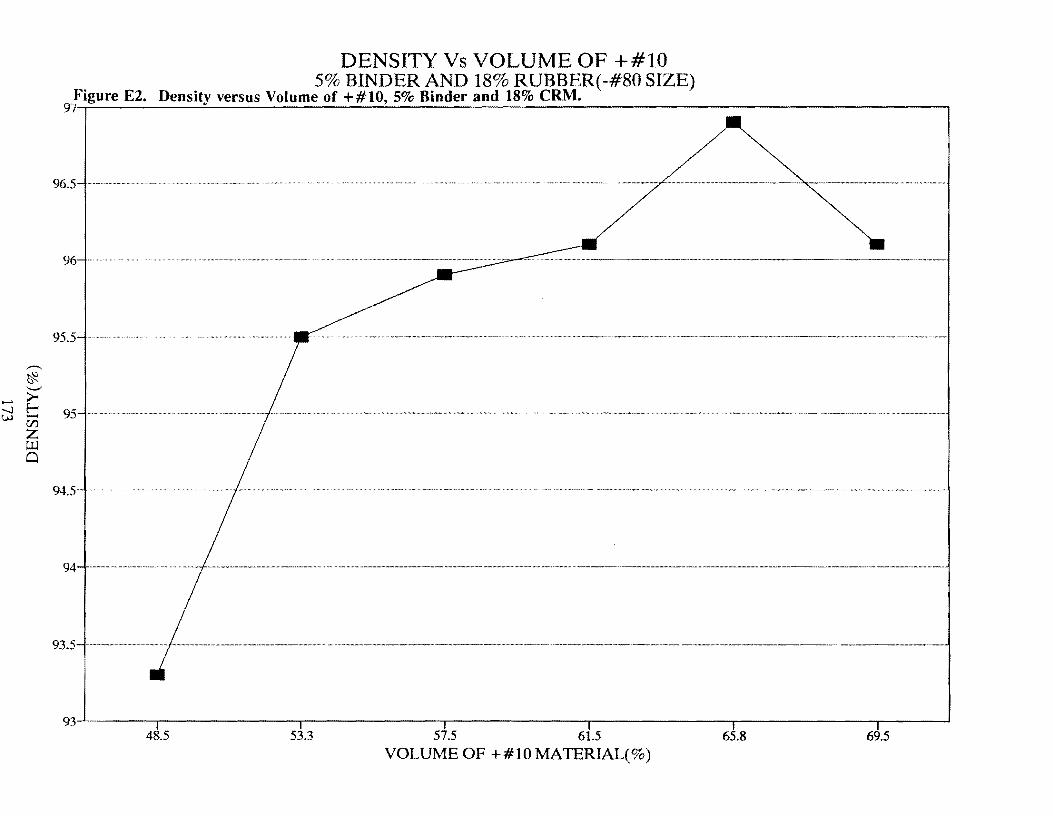
,....__ ~ ....._,
....... >---...) f-; VJ -lfJ z
u.l Cl
DENSITY Vs VOLUME OF +#10 5% BINDER AND 18% RUBBER(-#80 SIZE)
Figure E2. Density versus Volume of +#10, 5% Binder and 18% CRM. 9·1·-r---------"--------"'-----------------------------.
95.5
95
94.5
94 .................................................................................................. ,_ .. _ ........................ -............................................................ - .................... - ........... - ................................................................................................................. --.~--............ --.................................... - ....... . ________ .......... ,_ .............. .
93.5 .................................................................................................... _,_,,, ............... --.......................................... _ ............ _ ......... ---·-·-"---·-·--"-·-·-.................... - ....................... _ ........... - .. _~ ..................... - ............ _ ......... __ , ----
48.5 53.3 57.5 61.5 65.8 69.5 VOLUME OF +#10 MATERIAL(%)
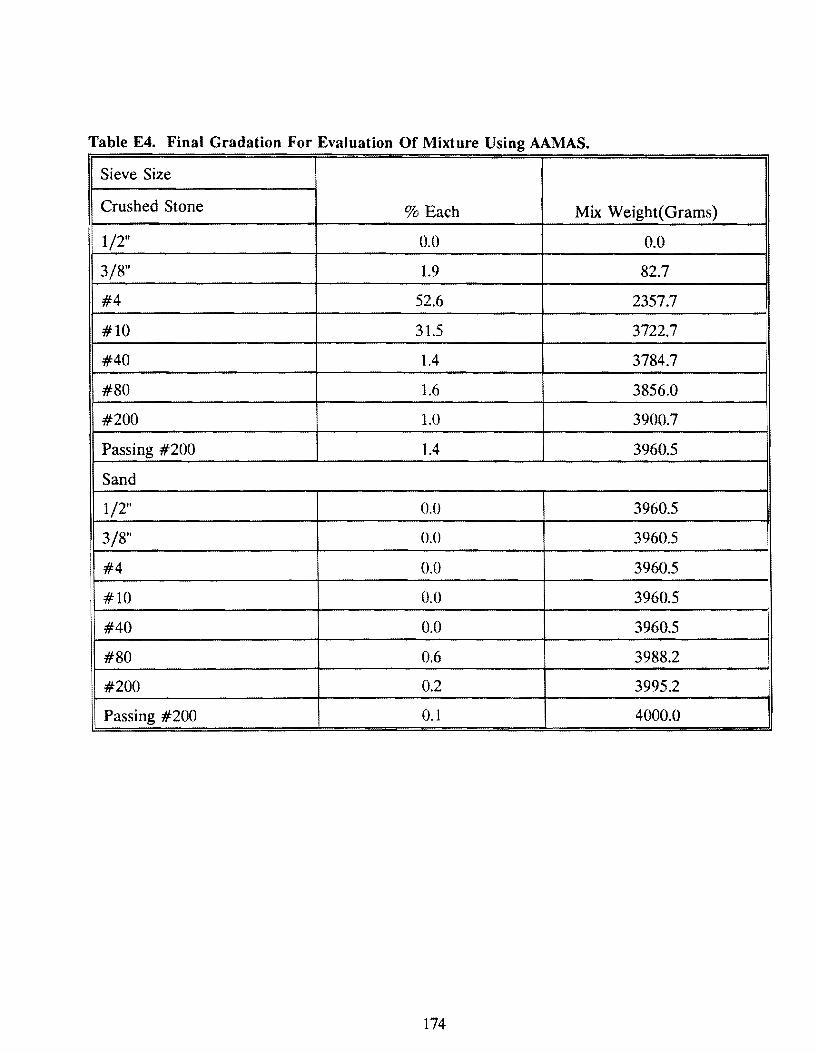
Table E4. Final Gradation For Evaluation Of Mixture Using AAMAS.
Sieve Size
Crushed Stone % Each Mix Weight(Grams)
1/2" 0.0 0.0
3/8" 1.9 82.7
#4 52.6 2357.7
#10 31.5 3722.7
#40 1.4 3784.7
#80 1.6 3856.0
#200 1.0 3900.7
Passing #200 1.4 3960.5
Sand
1/2" 0.0 3960.5
3/8" 0.0 3960.5
#4 0.0 3960.5
#10 0.0 3960.5
#40 0.0 3960.5
#80 0.6 3988.2
#200 0.2 3995.2
Passing #200 0.1 4000.0
174
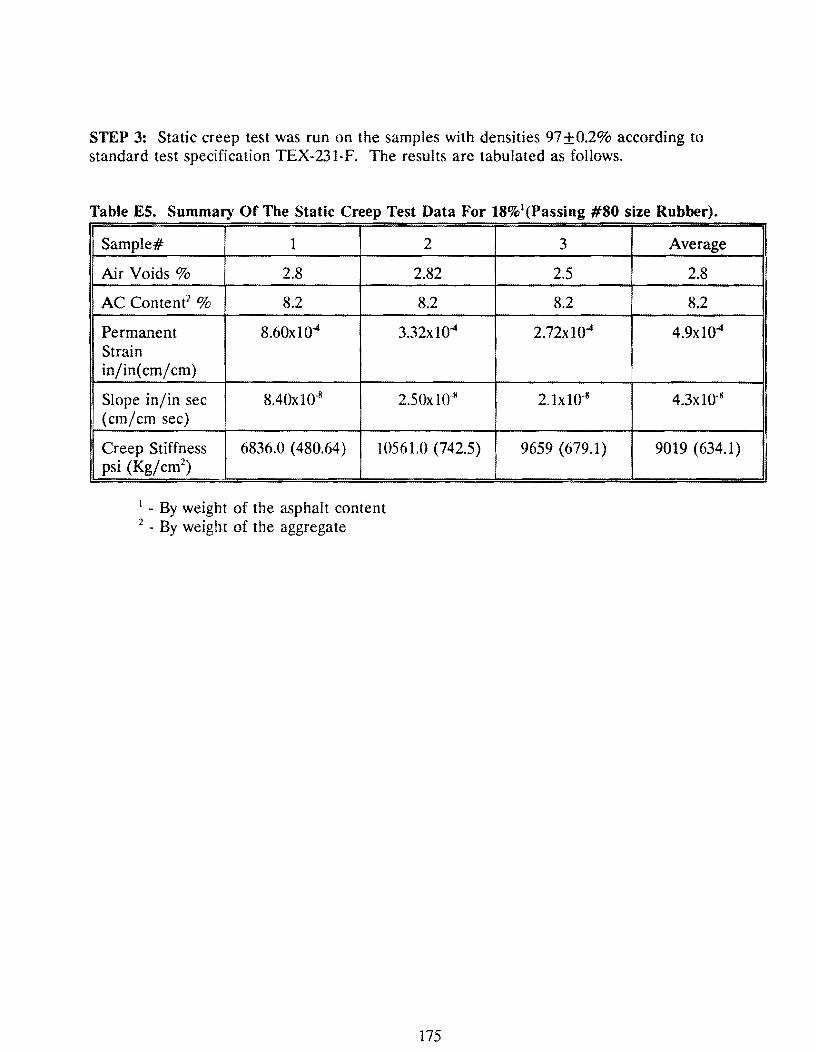
STEP 3: Static creep test was run on the samples with densities 97±0.2% according to standard test specification TEX-231-F. The results are tabulated as follows.
Table ES. Summary Of The Static Creep Test Data For 18%1(Passing #80 size Rubber).
Sample# 1 2
Air Voids% 2.8 2.82
AC Content2 % 8.2 8.2
Permanent 8.60xl04 3.32xl04
Strain in/ in( cm/ cm)
Slope in/in sec 8.40xt0·8 2.50x10⁻³
(cm/cm sec)
Creep Stiffness 6836.0 ( 480.64) 10561.0 (742.5) psi (Kg/ cm2
)
1 - By weight of the asphalt content
2 - By weight of the aggregate
175
3 Average
2.5 2.8
8.2 8.2
2.72xl04 4.9xl04
2.lxt0·8 4.3xt0·8
9659 (679.1) 9019 (634.1)
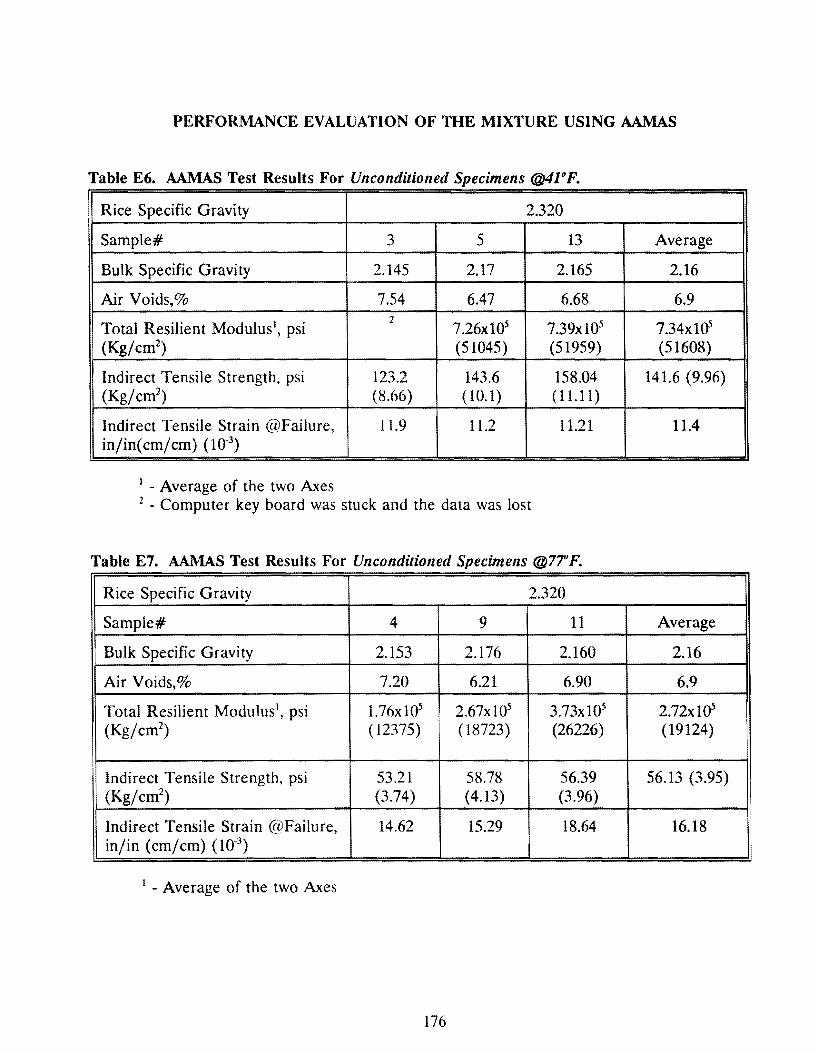
PERFORMANCE EVALUATION OF THE MIXTURE USING AAMAS
Table E6. AAMAS Test Results For Unconditioned Specimens @41° F.
Rice Specific Gravity 2.320
Sample# 3 5 13 Average
Bulk Specific Gravity 2.145 2.17 2.165 2.16
Air Voids,% 7.54 6.47 6.68 6.9
Total Resilient Modulus1, psi
2 7.26xl05 7.39xl05 7.34x1D5
(Kg/cm2) (51045) (51959) (51608)
Indirect Tensile Strength, psi 123.2 143.6 158.04 141.6 (9.96) (Kg/cm2
) (8.66) ( 10.1) (11.11)
Indirect Tensile Strain @Failure, 11.9 11.2 11.21 11.4 in/in(cm/cm) (10-3
)
1 - Average of the two Axes
2 - Computer key board was stuck and the data was lost
Table E7. AAMAS Test Results For Unconditioned Specimens @77' F.
Rice Specific Gravity 2.320
Sample# 4 9 11 Average
Bulk Specific Gravity 2.153 2.176 2.160 2.16
Air Voids,% 7.20 6.21 6.90 6.9
Total Resilient Modulus', psi 1.76x10⁵ 2.67x10⁵ 3.73xl05 2.72x10⁵
(Kg/cm2) ( 12375) ( 18723) (26226) (19124)
Indirect Tensile Strength, psi 53.21 58.78 56.39 56.13 (3.95) (Kg/cm2
) (3.74) (4.13) (3.96) !
Indirect Tensile Strain @Failure, 14.62 15.29 18.64 16.18 I in/in (cm/cm) (10-3
)
1 - Average of the two Axes
176
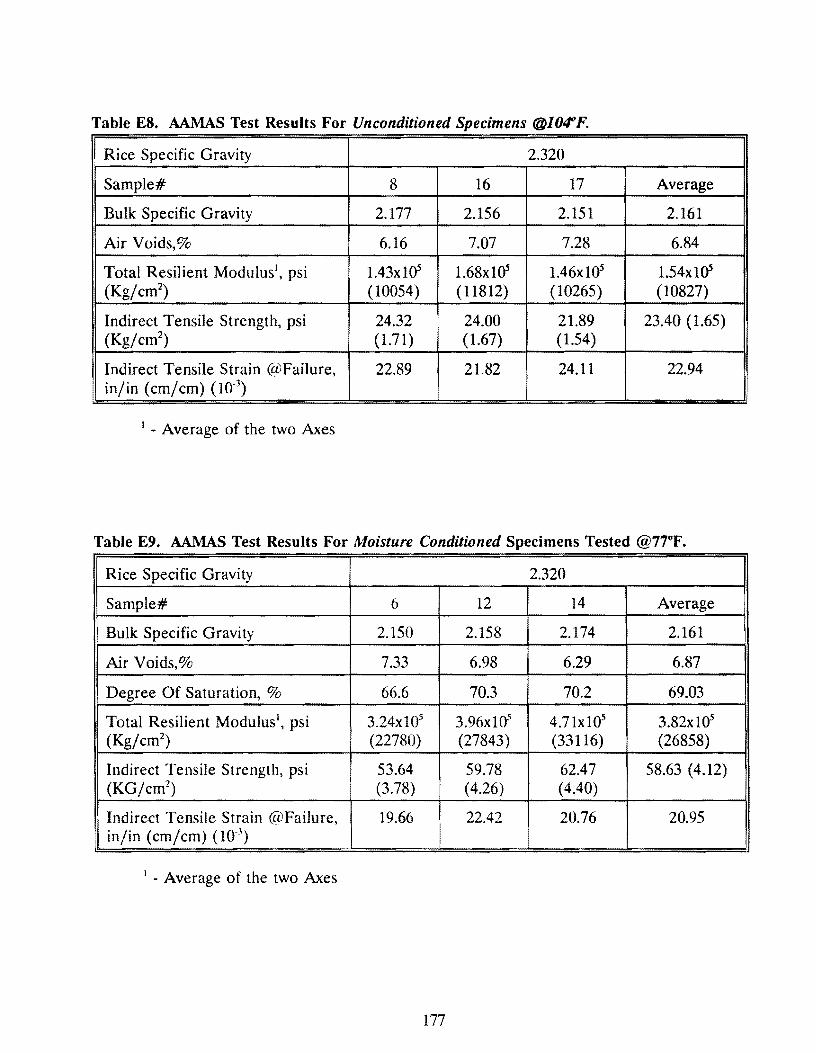
Table ES. AAMAS Test Results For Unconditioned Specimens @l04"F.
Rice Specific Gravity 2.320
Sample# 8 16 17 Average
Bulk Specific Gravity 2.177 2.156 2.151 2.161
Air Voids,% 6.16 7.07 7.28 6.84
Total Resilient Modulus1, psi 1.43xl05 1.68xla5 1.46xla5 1.54xla5
(Kg/cm2) (10054) (11812) (10265) (10827)
Indirect Tensile Strength, psi 24.32 24.00 21.89 23.40 ( 1.65) (Kg/cm2
) (1.71) (1.67) (1.54)
Indirect Tensile Strain @Failure, 22.89 21.82 24.11 22.94 in/in (cm/cm) (10.3
)
1 - Average of the two Axes
Table E9. AAMAS Test Results For Moisture Conditioned Specimens Tested @77°F.
Rice Specific Gravity 2.320
Sample# 6 12 14 Average ' Bulk Specific Gravity 2.150 2.158 2.174 2.161
Air Voids,% 7.33 6.98 6.29 6.87
Degree Of Saturation, % 66.6 70.3 70.2 69.03
Total Resilient Modulus', psi 3.24xl05 3.96xl05 4.71xl05 3.82xl05
(Kg/cm2) (22780) (27843) (33116) (26858)
Indirect Tensile Strength, psi 53.64 59.78 62.47 58.63 (4.12) (KG/cm2
) (3.78) (4.26) (4.40)
Indirect Tensile Strain @Failure, 19.66 22.42 20.76 20.95 1 in/in (cm/cm) (10.3
)
1 - Average of the two Axes
177
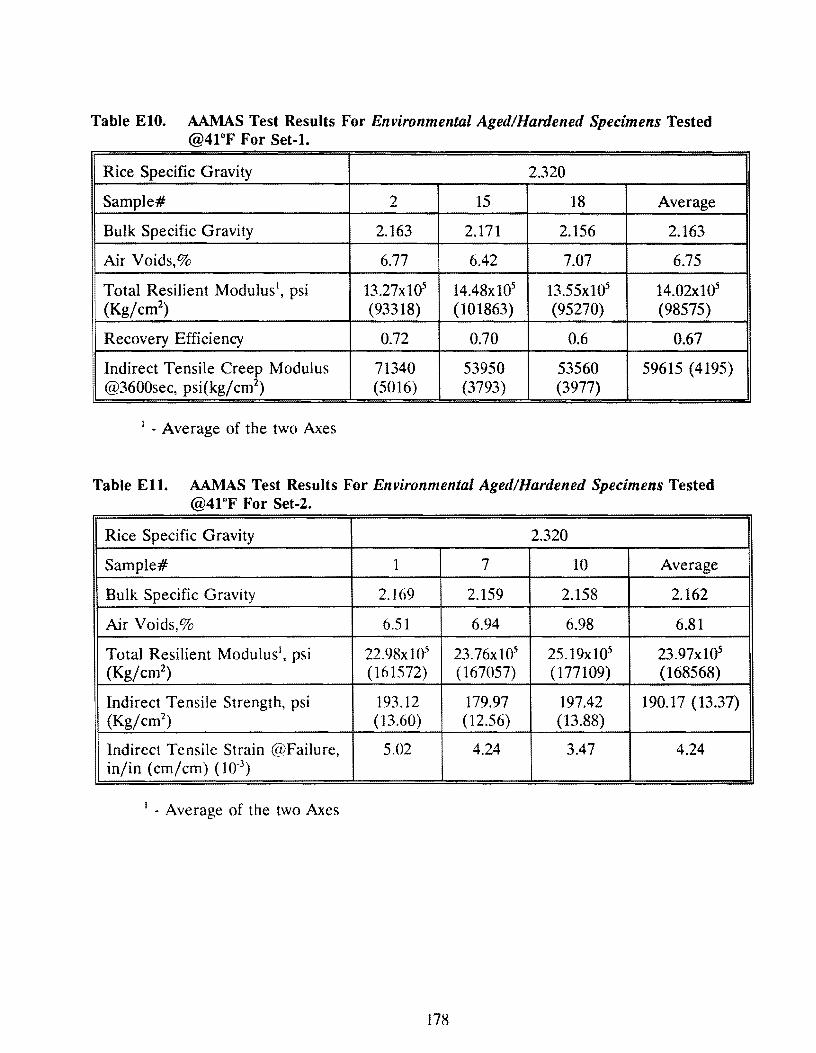
Table ElO. AA.MAS Test Results For Environmental Aged/Hardened Specimens Tested @41°F For Set-1.
Rice Specific Gravity 2.320
Sample# 2 15 18 Average
Bulk Specific Gravity 2.163 2.171 2.156 2.163
Air Voids,% 6.77 6.42 7.07 6.75
Total Resilient Modulus1, psi 13.27xl05 14.48xl05 13.55xl05 14.02xl05
(Kg/cm2) (93318) (101863) (95270) (98575)
Recovery Efficiency 0.72 0.70 0.6 0.67
Indirect Tensile Creep Modulus 71340 53950 53560 59615 (4195) @3600sec, psi(kg/ cm2
) (5016) (3793) (3977)
1 - Average of the two Axes
Table Ell. AAMAS Test Results For Environmental Aged/Hardened Specimens Tested @41°F For Set-2.
Rice Specific Gravity 2.320
Sample# 1 7 10 Average
Bulk Specific Gravity 2.169 2.159 2.158 2.162
Air Voids,% 6.51 6.94 6.98 6.81
Total Resilient Modulus1, psi 22.98x10⁵ 23.76x10⁵ 25.19xl05 23.97xl05
(Kg/cm2) (161572) (167057) (177109) (168568)
Indirect Tensile Strength, psi 193.12 179.97 197.42 190.17 (13.37) (Kg/cm2
) (13.60) (12.56) (13.88)
Indirect Tensile Strain @Failure, 5.02 4.24 3.47 4.24 in/in (cm/cm) (10-3
)
1 - Average of the two Axes
178
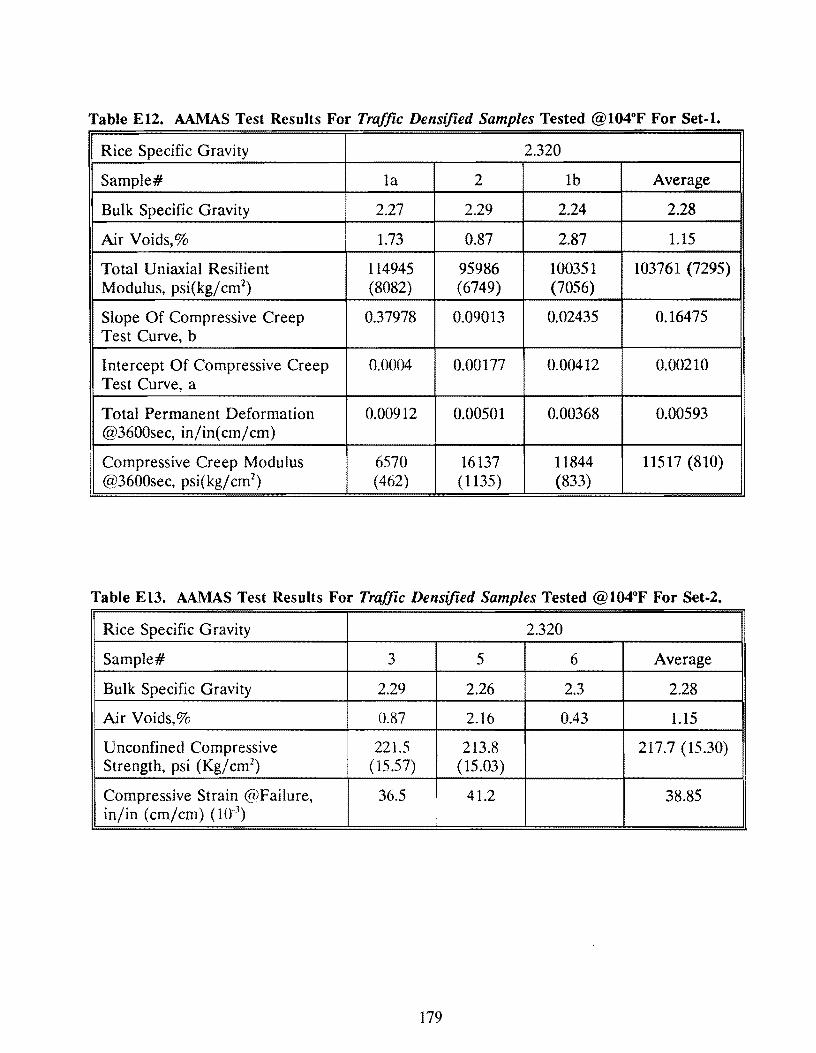
Table E12. AAMAS Test Results For Traffic Densified Samples Tested @l04°F For Set·l.
Rice Specific Gravity 2.320
Sample# la 2 lb Average
Bulk Specific Gravity 2.27 2.29 2.24 2.28
Air Voids,% 1.73 0.87 2.87 1.15
Total U niaxial Resilient 114945 95986 100351 103761 (7295) Modulus, psi(kg/ cm2
) (8082) (6749) (7056)
Slope Of Compressive Creep 0.37978 0.09013 0.02435 0.16475 Test Curve, b
Intercept Of Compressive Creep 0.0004 0.00177 0.00412 0.00210 Test Curve, a
Total Permanent Deformation 0.00912 0.00501 0.00368 0.00593 @3600sec, in/in(cm/cm)
Compressive Creep Modulus 6570 16137 11844 11517 (810) @3600sec, psi(kg/cm2
) (462) (1135) (833)
Table E13. AAMAS Test Results For Traffic Densified Samples Tested @l04°F For Set·2.
Rice Specific Gravity 2.320
Sample# 3 5 6 Average
Bulk Specific Gravity 2.29 2.26 2.3 2.28
! Air Voids,% 0.87 2.16 0.43 1.15
Unconfined Compressive 221.5 213.8 217.7 (15.30) Strength, psi (Kg/ cm2
) (15.57) (15.03)
Compressive Strain @Failure, 36.5 41.2 38.85 in/in (cm/cm) 00-3
)
179
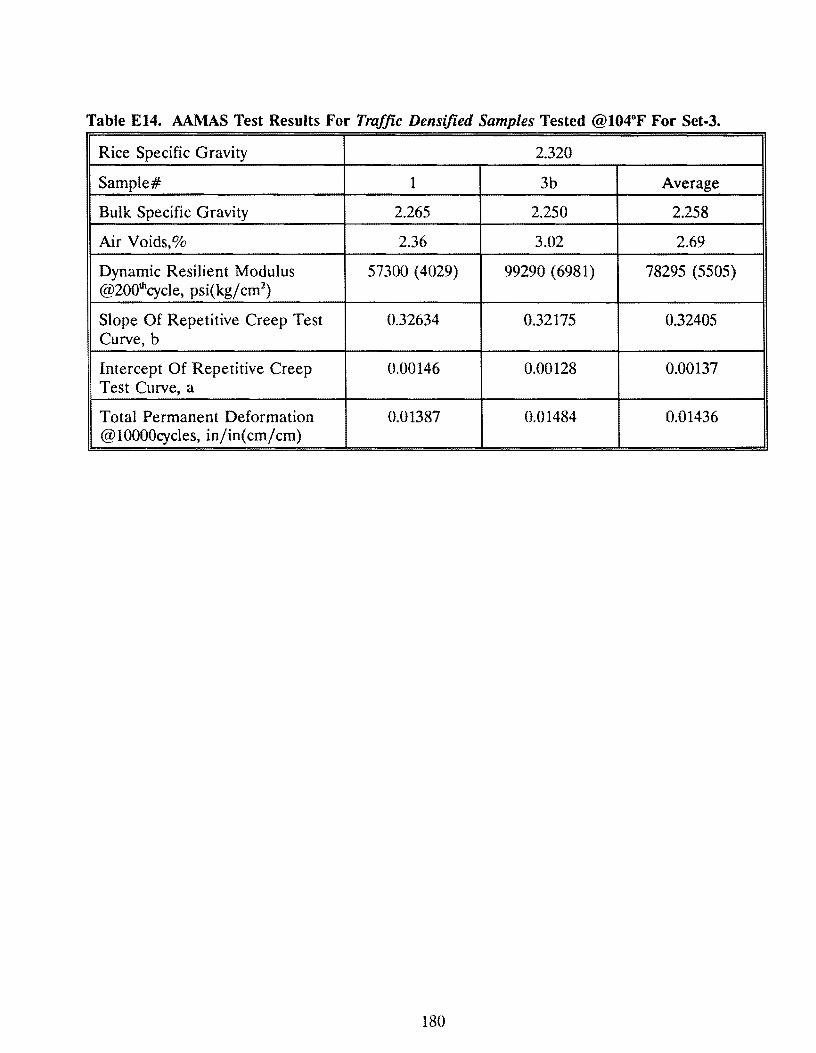
Table E14. AAMAS Test Results For Traffic Densified Samples Tested @104°F For Set-3.
Rice Specific Gravity 2.320
Sample# 1 3b Average
Bulk Specific Gravity 2.265 2.250 2.258
Air Voids,% 2.36 3.02 2.69
Dynamic Resilient Modulus 57300 ( 4029) 99290 ( 6981) 78295 (5505) @2001hcycle, psi(kg/cm2
)
Slope Of Repetitive Creep Test 0.32634 0.32175 0.32405 Curve, b
Intercept Of Repetitive Creep 0.00146 0.00128 0.00137 Test Curve, a
Total Permanent Deformation 0.01387 0.01484 0.01436 @lOOOOcycles, in/in(cm/cm)
180
Appendix F
Laboratory Data for 10%CW Mixture
(lOo/o Coarse Rubber, by Weight of Asphalt, via Wet Method)
181

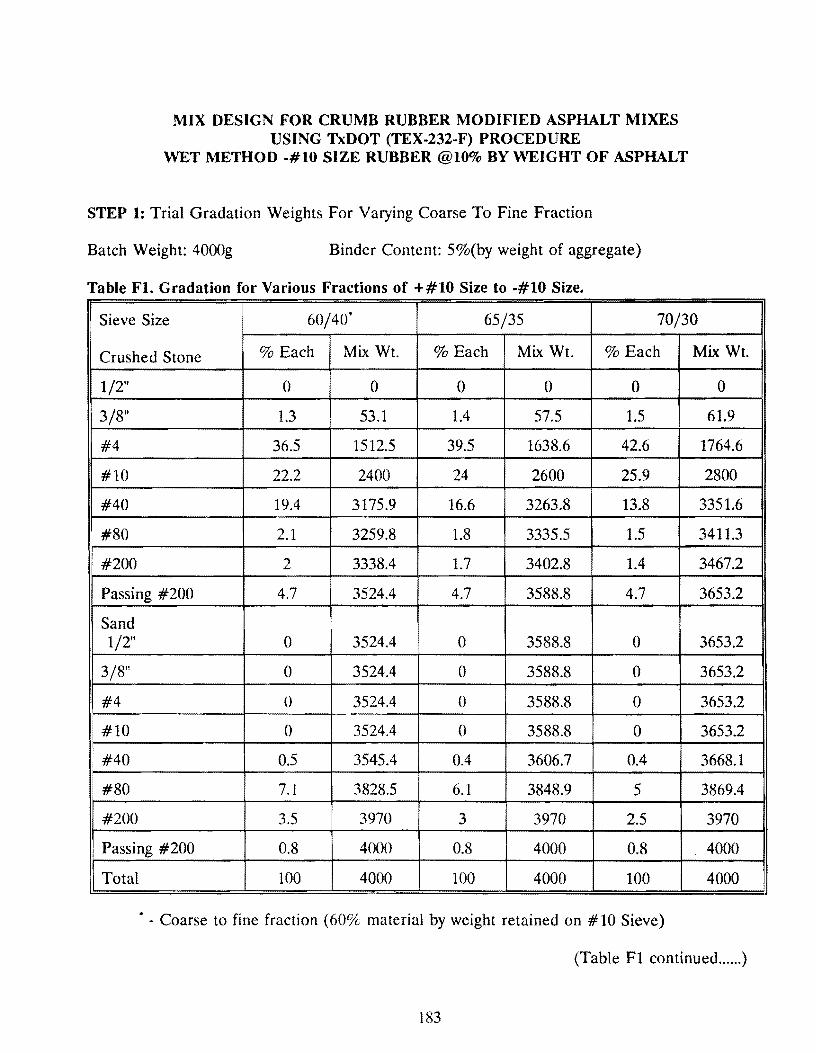
MIX DESIGN FOR CRUMB RUBBER MODIFIED ASPHALT MIXES USING TxDOT (TEX-232-F) PROCEDURE
WET METHOD -#10 SIZE RUBBER @10% BY WEIGHT OF ASPHALT
STEP 1: Trial Gradation Weights For Varying Coarse To Fine Fraction
Batch Weight: 4000g Binder Content: 5%(by weight of aggregate)
Table Fl. Gradation for Various Fractions of +#10 Size to -#10 Size.
Sieve Size 60/40. 65/35 70/30
Crushed Stone % Each Mix Wt. % Each Mix Wt. % Each Mix Wt.
1/2" 0 0 0 0 0 0
3/8" 1.3 53.1 1.4 57.5 1.5 61.9
#4 36.5 1512.5 39.5 1638.6 42.6 1764.6
#10 22.2 2400 24 2600 25.9 2800
#40 19.4 3175.9 16.6 3263.8 13.8 3351.6
! #80 2.1 3259.8 1.8 3335.5 1.5 3411.3
#200 2 3338.4 1.7 3402.8 1.4 3467.2
Passing #200 4.7 3524.4 4.7 3588.8 4.7 3653.2
Sand 1/2" 0 3524.4 0 3588.8 0 3653.2
3/8" 0 3524.4 () 3588.8 0 3653.2
#4 () 3524.4 0 3588.8 0 3653.2
#10 0 3524.4 0 3588.8 0 3653.2
#40 0.5 3545.4 0.4 3606.7 0.4 3668.1
. #80 7.1 3828.5 6.1 3848.9 5 3869.4
#200 3.5 3970 3 3970 2.5 3970
Passing #200 0.8 4000 0.8 4000 0.8 4000
Total 100 4000 100 4000 100 4000
• - Coarse to fine fraction (60% material by weight retained on #10 Sieve)
(Table Fl continued ...... )
183
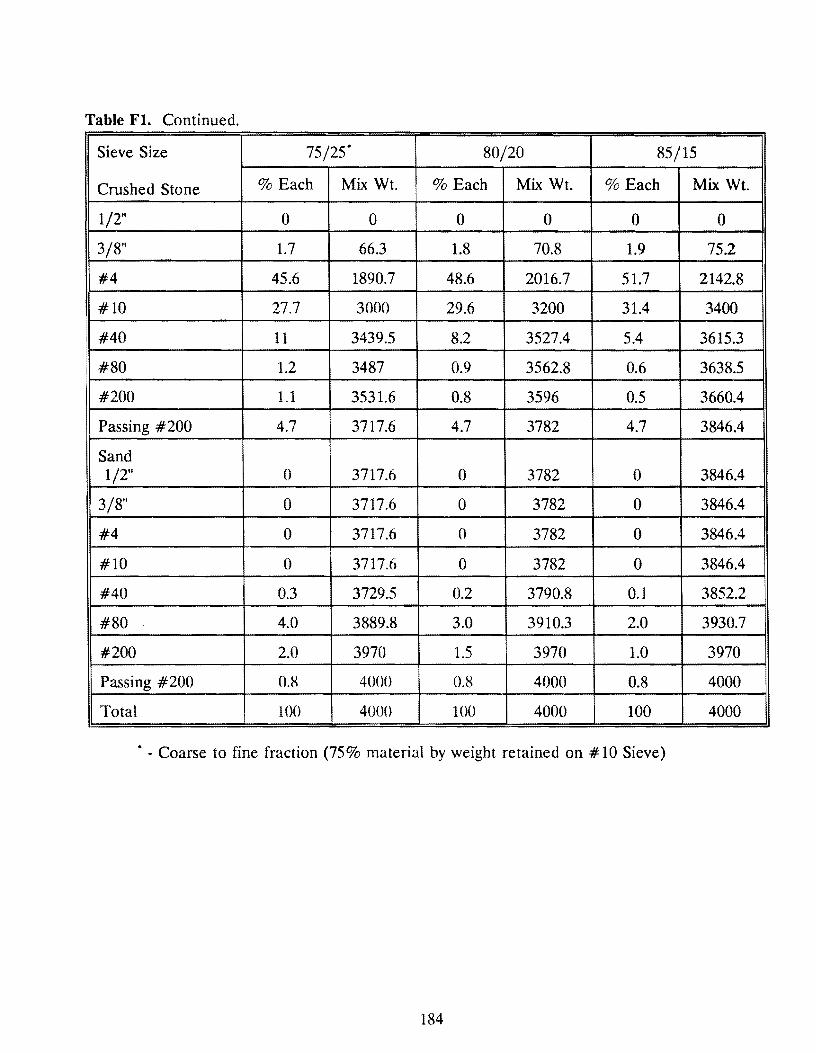
Table Fl. Continued.
Sieve Size 75/25* 80/20 85/15
Crushed Stone % Each Mix Wt. % Each Mix Wt. % Each Mix Wt.
1/2" 0 0 0 0 0 0
3/8" 1.7 66.3 1.8 70.8 1.9 75.2
#4 45.6 1890.7 48.6 2016.7 51.7 2142.8
#10 27.7 3000 29.6 3200 31.4 3400
i #40 11 3439.5 8.2 3527.4 5.4 3615.3 I I #80 1.2 3487 0.9 3562.8 0.6 3638.5
#200 1.1 3531.6 0.8 3596 0.5 3660.4
Passing #200 4.7 3717.6 4.7 3782 4.7 3846.4
Sand 1/2" 0 3717.6 0 3782 0 3846.4
3/8" 0 3717.6 0 3782 0 3846.4
#4 0 3717.6 0 3782 0 3846.4
#10 0 3717.6 0 3782 0 3846.4
#40 0.3 3729.5 0.2 3790.8 0.1 3852.2
#80 4.0 3889.8 3.0 3910.3 2.0 3930.7
#200 2.0 3970 1.5 3970 1.0 3970
Passing #200 0.8 4000 0.8 4000 0.8 4000
Total 100 4000 100 4000 100 4000
• · Coarse to fine fraction (75% material by weight retained on # 10 Sieve)
184
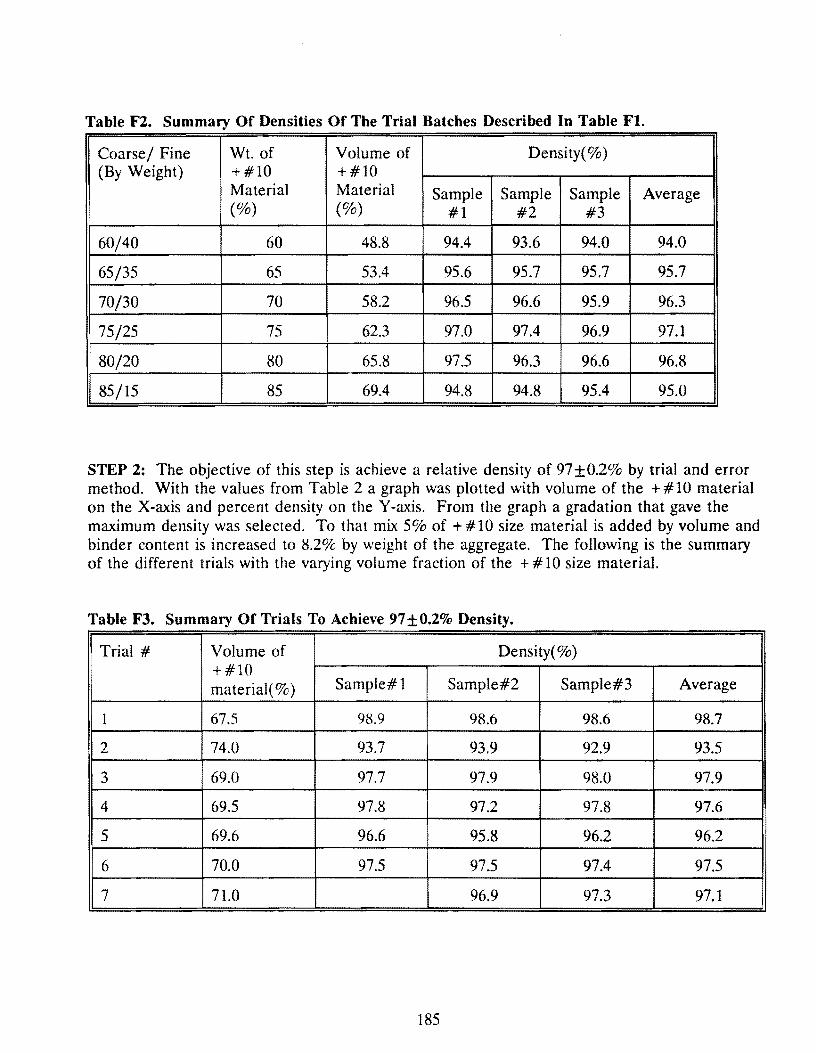
Table F2. Summary Of Densities Of The Trial Batches Described In Table Fl.
Coarse/ Fine Wt. of Volume of Density(%) (By Weight) +#10 +#10
Material Material Sample Sample Sample Average (%) (%) #1 #2 #3
60/40 60 48.8 94.4 93.6 94.0 94.0
65/35 65 53.4 95.6 95.7 95.7 95.7
70/30 70 58.2 96.5 96.6 95.9 96.3
75/25 75 62.3 97.0 97.4 96.9 97.1
80/20 80 65.8 97.5 96.3 96.6 96.8
85/15 85 69.4 94.8 94.8 95.4 95.0
STEP 2: The objective of this step is achieve a relative density of 97 ±0.2% by trial and error method. With the values from Table 2 a graph was plotted with volume of the + # 10 material on the X-axis and percent density on the Y-axis. From the graph a gradation that gave the maximum density was selected. To that mix 5% of + #10 size material is added by volume and binder content is increased to 8.2% by weight of the aggregate. The following is the summary of the different trials with the varying volume fraction of the + # 10 size material.
Table F3. Summary Of Trials To Achieve 97±0.2% Density.
• Trial # Volume of Density(%) +#10 material(%) Sample#l Sample#2 Sample#3 Average
1 67.5 98.9 98.6 98.6 98.7
2 74.0 93.7 93.9 92.9 93.5
3 69.0 97.7 97.9 98.0 97.9
4 69.5 97.8 97.2 97.8 97.6
5 69.6 96.6 95.8 96.2 96.2
6 70.0 97.5 97.5 97.4 97.5
7 71.0 96.9 97.3 97.1
185
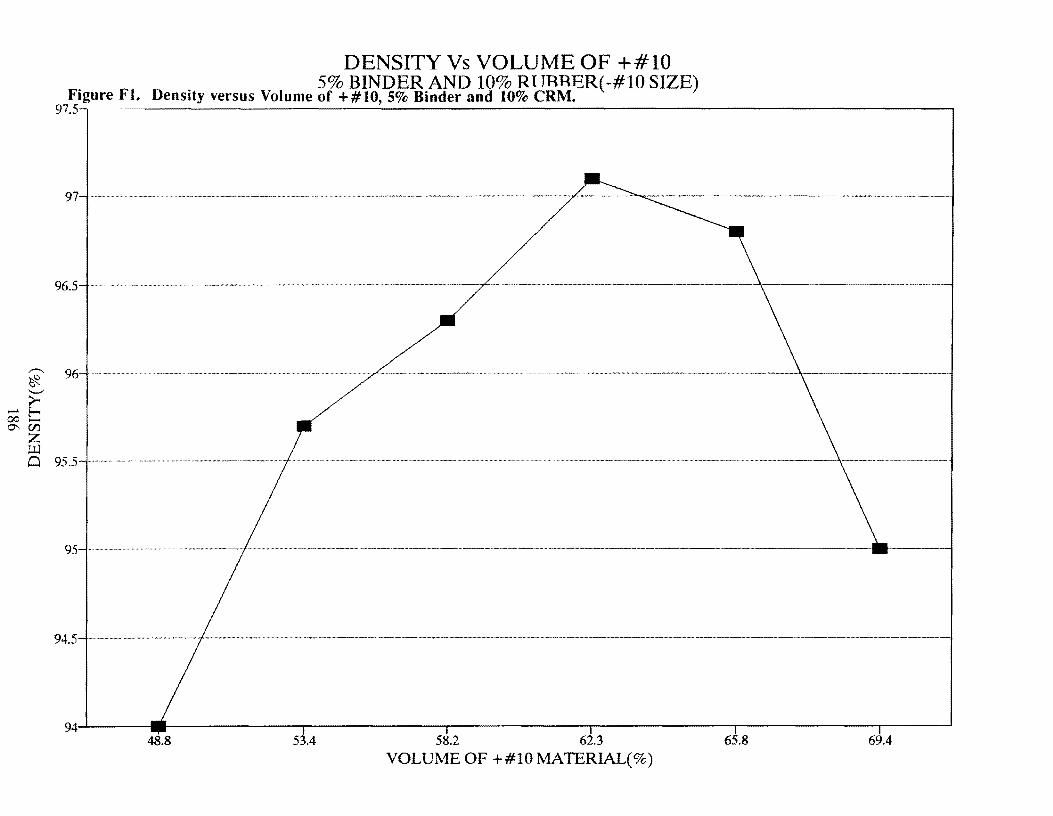
DENSITY Vs VOLUME OF +#10 5% BINDER AND 10% R l TRRBR(-#10 SIZE)
Figure Fl. Density versus Volume of +#10, 5% Binder and 10% CRM. 97.5~- ----------------------------------------.
96.5
~ 96 '--' ;>-<
...... E-< 00 ........ °' (/) z
Ul Cl 95.5
48.8 53.4 58.2 62.3 65.8 69.4
VOLUME OF +#10 MATERIAL(%)
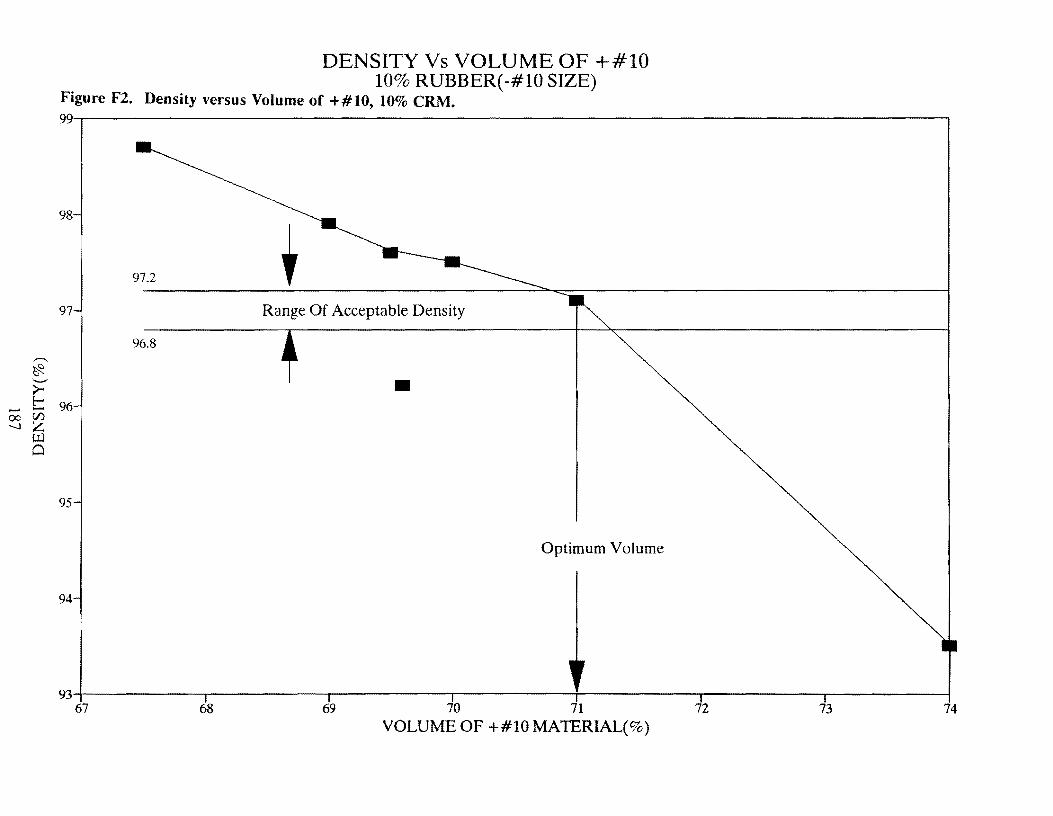
,,...., ~ '-"
>-E-....... ......
00 (/} -...) z
U.l Cl
DENSITY Vs VOLUME OF +#10 10% RUBBER(-#10 SIZE)
Figure F2. Density versus Volume of +#10, 10% CRM. 99~~~~~~~~~~~~~~~~~~~~~~~~~~~~~~~~~~~~~~~~--,
98
97.2
97 Range Of Acceptable Density
96.8
• 96
95
Optimum Volume
94
93-4-~~~~~-.-~~~~~.--~~~~--.~~~~~-;-~~~~~-r-~~~~~-.-~~~~--1
67 68 69 70 71 72 73 74 VOLUME OF +#10 MATERIAL(%)
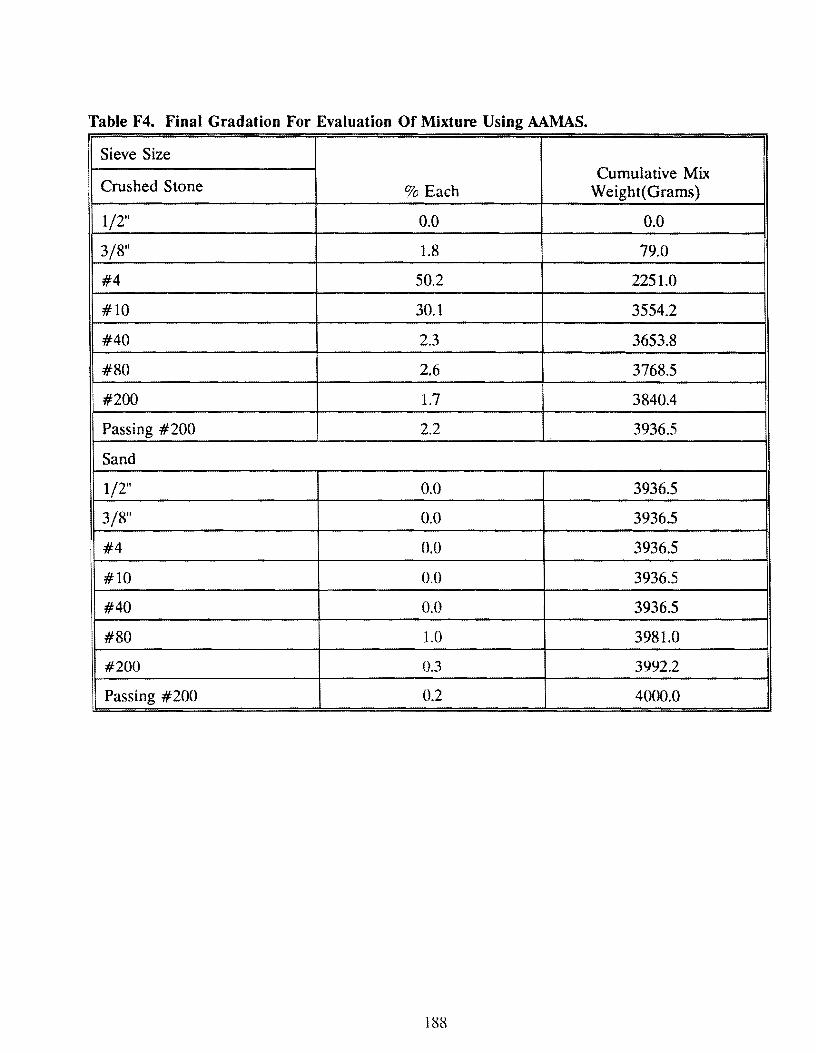
Table F4. Final Gradation For Evaluation Of Mixture Using AAMAS.
Sieve Size Cumulative Mix
Crushed Stone % Each Weight( Grams)
1/2" 0.0 0.0
3/8" 1.8 79.0
#4 50.2 2251.0
#10 30.1 3554.2
#40 2.3 3653.8
#80 2.6 3768.5
#200 1.7 3840.4
Passing #200 2.2 3936.5
Sand
1/2" 0.0 3936.5
3/8" 0.0 3936.5
#4 0.0 3936.5
#10 0.0 3936.5
#40 0.0 3936.5
#80 1.0 3981.0
#200 0.3 3992.2
Passing #200 0.2 4000.0
188

STEP 3: Static creep test was run on the samples with densities 97 +0.2% according to standard test specification TEX-231-F. The results are tabulated as follows.
Table F5. Summary Of The Static Creep Test Data For 10%1(Passing #80 size Rubber).
Sample# 1
Air Voids% 2.1
Binder Content2 8.2%
Permanent 5.3xl04
Strain in/in( cm/cm)
Slope in/in sec 4.5xl0-8
(cm/ cm sec)
Creep Stiffness 7996 (562.2) psi (Kg/ cm2
)
1 - By weight of the asphalt content
2 - By weight of the aggregate
2 3 Average
3.1 2.7 2.9
8.2% 8.2% 8.2%
l.95xl04 4.lxl04 3.78xl04
2.5x10⁻⁸ 2.4x10⁻⁸ 3. lxl0·8
7856 (552.4) 8054 (566.3) 7969 (560.3)
189
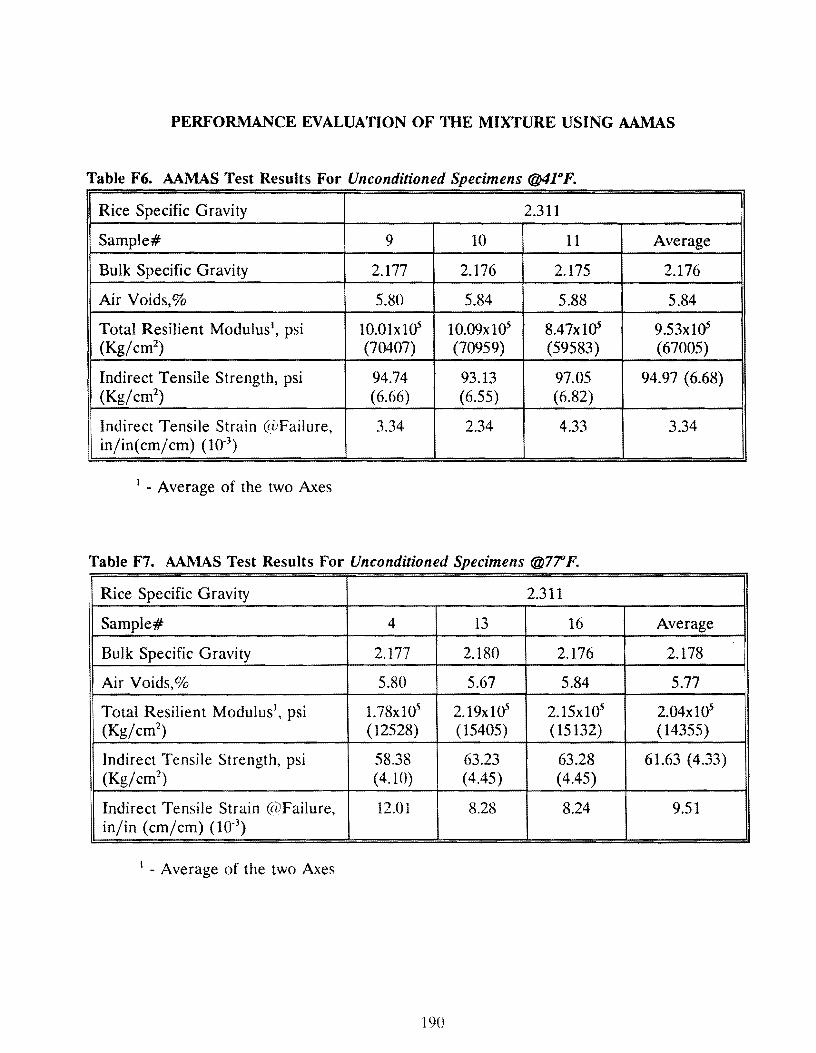
PERFORMANCE EVALUATION OF THE MIXTURE USING AAMAS
Table F6. AAMAS Test Results For Unconditioned Specimens @41° F.
Rice Specific Gravity 2.311
Sample# 9 10 11 Average
Bulk Specific Gravity 2.177 2.176 2.175 2.176
Air Voids,% 5.80 5.84 5.88 5.84
Total Resilient Modulus', psi 10.0lxHY 10.09x10⁵ 8.47xla5 9.53xla5 (Kg/cm2
) (70407) (70959) (59583) (67005)
Indirect Tensile Strength, psi 94.74 93.13 97.05 94.97 ( 6.68) (Kg/cm2
) (6.66) (6.55) (6.82)
Indirect Tensile Strain @Failure, 3.34 2.34 4.33 3.34 in/in( cm/ cm) (1 o-3
)
1 - Average of the two Axes
Table F7. AAMAS Test Results For Unconditioned Specimens @77'1 F. I 1 Rice Specific Gravity 2.311
Sample# 4 13 16 Average
Bulk Specific Gravity 2.177 2.180 2.176 2.178
Air Voids,% 5.80 5.67 5.84 5.77 !
Total Resilient Modulus1, psi 1.78xl05 2.19xl05 2.15x10⁵ 2.04xl05
(Kg/cm2) (12528) (15405) (15132) (14355)
Indirect Tensile Strength, psi 58.38 63.23 63.28 61.63 ( 4.33) (Kg/cm2
) (4.10) (4.45) ( 4.45)
Indirect Tensile Strain @Failure, 12.01 8.28 8.24 9.51 in/in (cm/cm) (10-3
)
1 - Average of the two Axes
190
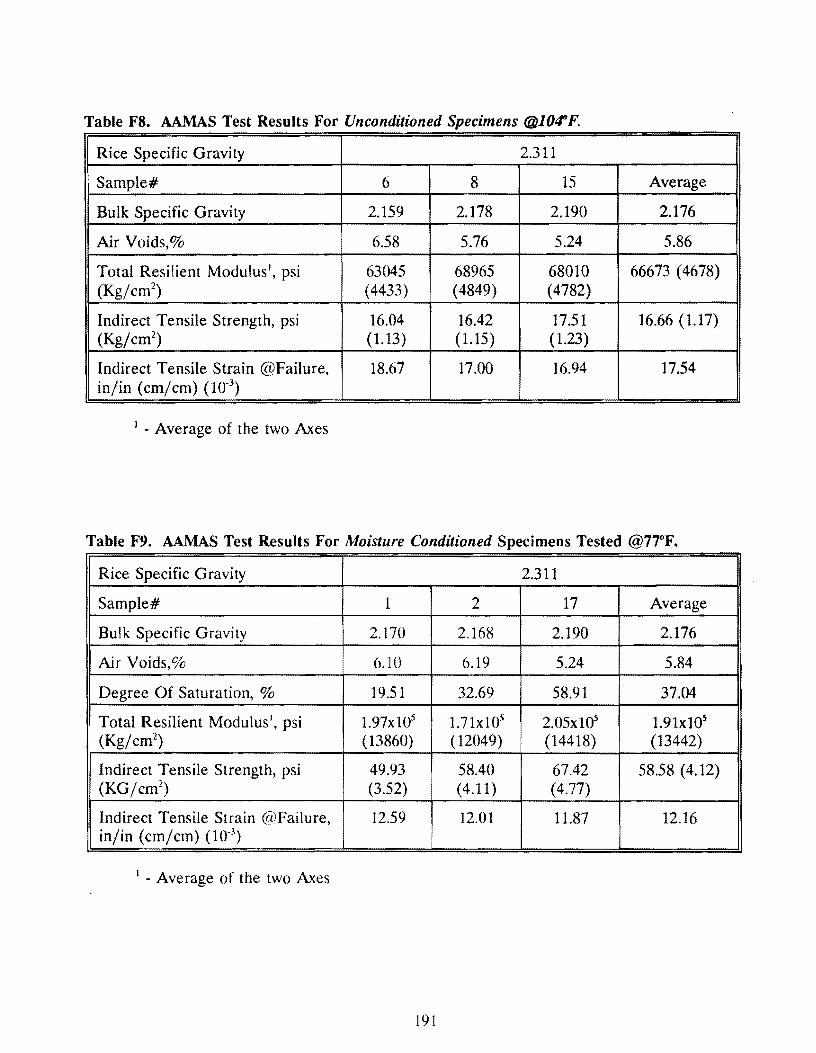
Table F8. AAMAS Test Results For Unconditioned Specimens @104"F.
Rice Specific Gravity 2.311
Sample# 6 8 15 Average
Bulk Specific Gravity 2.159 2.178 2.190 2.176
Air Voids,% 6.58 5.76 5.24 5.86
Total Resilient Modulus 1, psi 63045 68965 68010 66673 ( 4678) (Kg/cm2
) (4433) (4849) (4782)
Indirect Tensile Strength, psi 16.04 16.42 17.51 16.66 {l.17) (Kg/cm2
) (1.13) (1.15) (1.23)
Indirect Tensile Strain @Failure, 18.67 17.00 16.94 17.54 in/in (cm/cm) (10-3
)
1 - Average of the two Axes
Table F9. AAMAS Test Results For Moisture Conditioned Specimens Tested @7T'F.
Rice Specific Gravity 2.311
Sample# 1 2 17 Average
Bulk Specific Gravity 2.170 2.168 2.190 2.176
Air Voids,% 6.10 6.19 5.24 5.84
Degree Of Saturation, % 19.51 32.69 58.91 37.04
Total Resilient Modulus1, psi 1.97xl05 1.7lxl05 2.05xl05 J.9lxlQ5
i (Kg/cm2) (13860) ( 12049) (14418) (13442)
Indirect Tensile Strength, psi 49_93 58.40 67.42 58.58 ( 4.12) (KG/cm2
) (3.52) (4.11) (4.77)
Indirect Tensile Strain @Failure, 12.59 12.01 11.87 12.16 in/in (cm/cm) 00-3
)
1 - Average of the two Axes
191
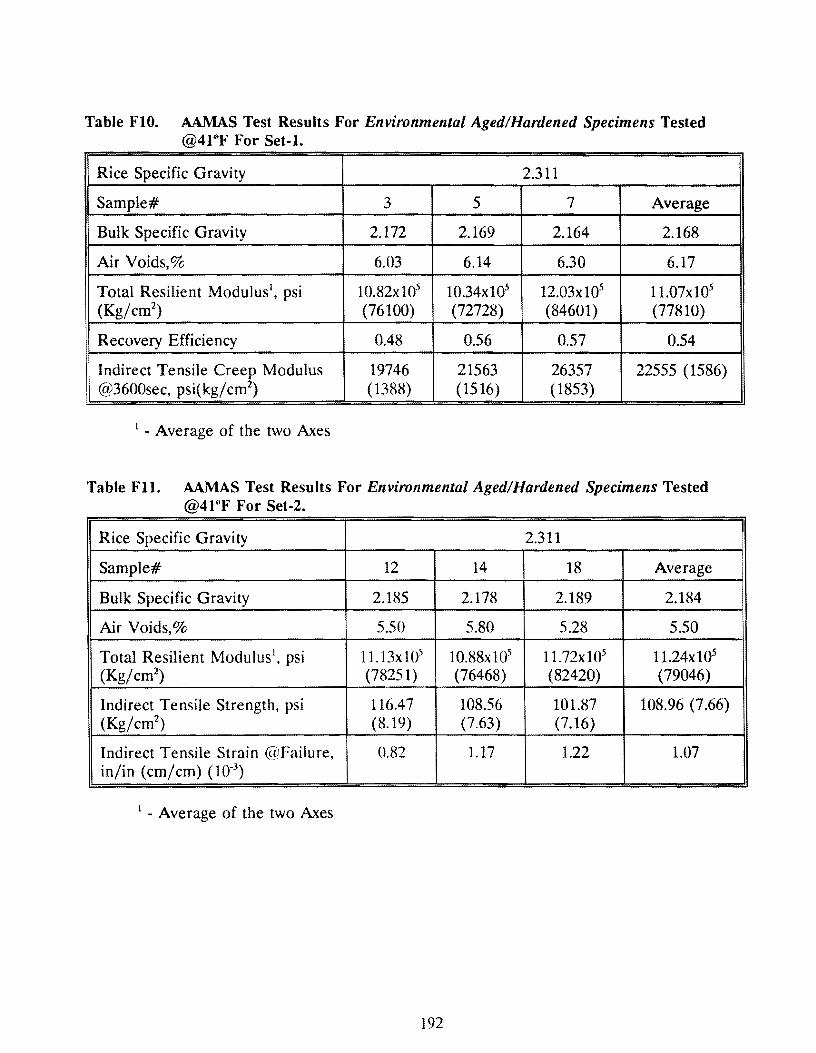
Table FlO. AAMAS Test Results For Environmental Aged/Hardened Specimens Tested @41°F For Set-1.
Rice Specific Gravity 2.311
Sample# 3 5 7 Average
Bulk Specific Gravity 2.172 2.169 2.164 2.168
Air Voids,% 6.03 6.14 6.30 6.17
Total Resilient Modulus 1, psi 10.82xl05 10.34xl05 12.03xl05 1 l.07x105
(Kg/cm2) (76100) (72728) (84601) (77810)
Recovery Efficiency 0.48 0.56 0.57 0.54
Indirect Tensile Creep Modulus 19746 21563 26357 22555 (1586) @3600sec, psi( kg/ cm2
) (1388) (1516) (1853)
1 - Average of the two Axes
Table Fll. AAMAS Test Results For Environmental Aged/Hardened Specimens Tested @41°F For Set-2.
Rice Specific Gravity 2.311
Sample# 12 14 18 Average
Bulk Specific Gravity 2.185 2.178 2.189 2.184
Air Voids,% 5.50 5.80 5.28 5.50
Total Resilient Modulus1, psi 11.13x10⁵ 10.88xl05 11.72xl05 1 l.24x105
(Kg/cm2) (78251) (76468) (82420) (79046)
Indirect Tensile Strength, psi 116.47 108.56 101.87 108.96 (7.66) (Kg/cm2
) (8.19) (7.63) (7.16)
Indirect Tensile Strain @Failure, 0.82 1.17 1.22 1.07 in/in (cm/cm) (10-3
)
1 - Average of the two Axes
192
!
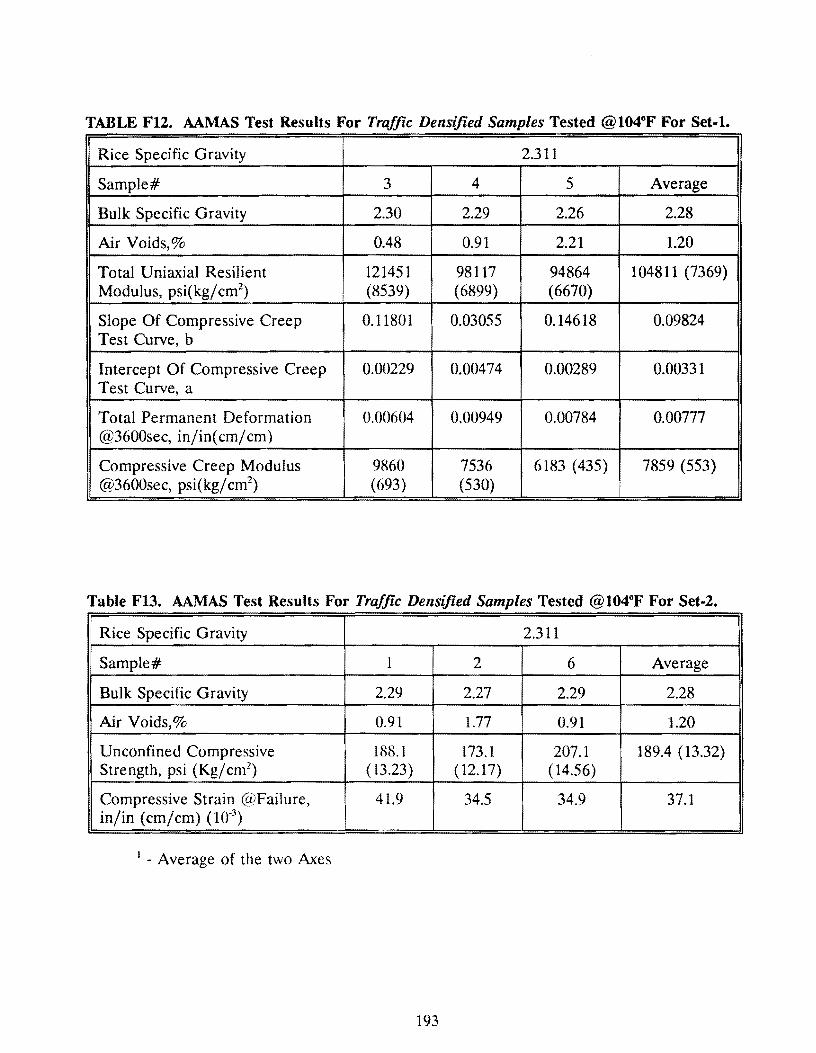
TABLE F12. AAMAS Test Results For Traffic Densified Samples Tested @104°F For Set-1.
Rice Specific Gravity 2.311
Sample# 3 4 5 Average
Bulk Specific Gravity 2.30 2.29 2.26 2.28
Air Voids,% 0.48 0.91 2.21 1.20
Total Uniaxial Resilient 121451 98117 94864 104811 (7369) Modulus, psi( kg/ cm2
) (8539) (6899) (6670)
Slope Of Compressive Creep 0.11801 0.03055 0.14618 0.09824 Test Curve, b
Intercept Of Compressive Creep 0.00229 0.00474 0.00289 0.00331 Test Curve, a
Total Permanent Deformation 0.00604 0.00949 0.00784 0.00777 @3600sec, in/in(cm/cm)
Compressive Creep Modulus 9860 7536 6183 (435) 7859 (553) @3600sec, psi(kg/ cm2
) (693) (530)
Table F13. AAMAS Test Results For Troffic Densijied Samples Tested @104°F For Set-2.
Rice Specific Gravity 2.311
Sample# 1 2 6 Average
Bulk Specific Gravity 2.29 2.27 2.29 2.28
Air Voids,% 0.91 1.77 0.91 1.20
Unconfined Compressive 188.1 173.1 207.1 189.4 (13.32) Strength, psi (Kg/cm2
) ( 13.23) (12.17) (14.56)
Compressive Strain @Failure, 41.9 34.5 34.9 37.1 in/in (cm/cm) (10-3
)
1 - Average of the two Axes
193
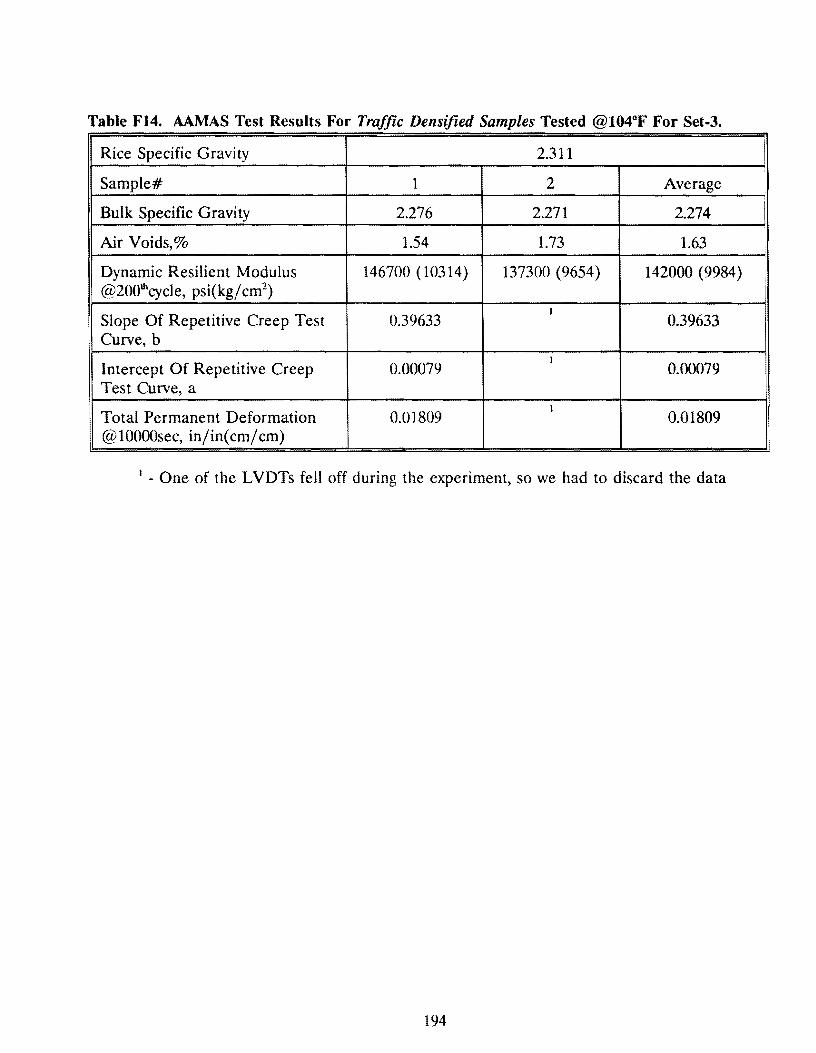
Table F14. AAMAS Test Results For Traffic Densified Samples Tested @104°F For Set-3.
Rice Specific Gravity 2.311
Sample# 1 2 Average
Bulk Specific Gravity 2.276 2.271 2.274
Air Voids,% 1.54 1.73 1.63 i
Dynamic Resilient Modulus 146700 ( 10314) 137300 (9654) 142000 (9984) i
@2001hcycle, psi(kg/ cm2)
Slope Of Repetitive Creep Test 0.39633 I
0.39633 Curve, b
Intercept Of Repetitive Creep 0.00079 I
0.00079 Test Curve, a
Total Permanent Deformation 0.01809 I
0.01809 @lOOOOsec, in/in(cm/cm)
1 - One of the LVDTs fell off during the experiment, so we had to discard the data
194
Appendix G
Laboratory Data for 18o/cCW Mixture
(18% Coarse Rubber, by Weight of Asphalt, via Wet Method)
195

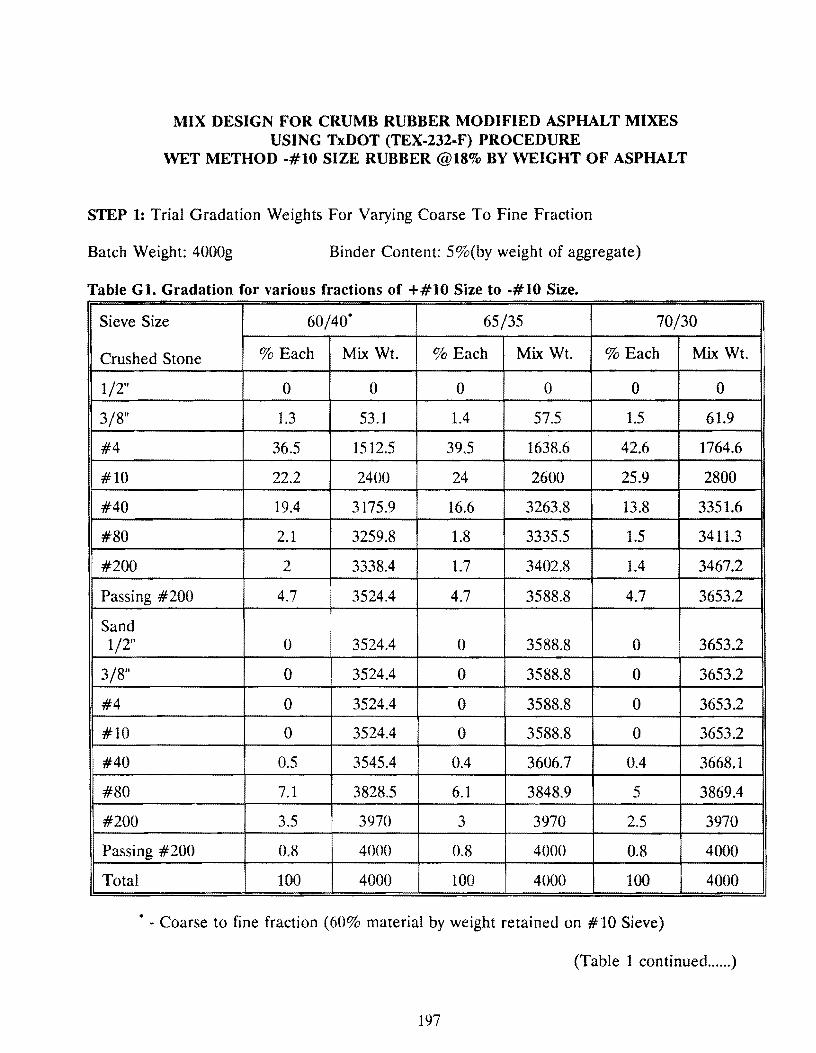
MIX DESIGN FOR CRUMB RUBBER MODIFIED ASPHALT MIXES USING TxDOT (TEX-232-F) PROCEDURE
WET METHOD -#10 SIZE RUBBER @18% BY WEIGHT OF ASPHALT
STEP 1: Trial Gradation Weights For Varying Coarse To Fine Fraction
Batch Weight: 4000g Binder Content: 5%(by weight of aggregate)
Table Gl. Gradation for various fractions of +#10 Size to -#10 Size.
Sieve Size 60/40* 65/35 70/30
Crushed Stone % Each Mix Wt. % Each Mix Wt. % Each Mix Wt.
1/2" 0 0 0 0 0 0
3/8" 1.3 53.1 1.4 57.5 1.5 61.9
#4 36.5 1512.5 39.5 1638.6 42.6 1764.6
#10 22.2 2400 24 2600 25.9 2800
#40 19.4 3175.9 16.6 3263.8 13.8 3351.6
#80 2.1 3259.8 1.8 3335.5 1.5 3411.3
#200 2 3338.4 1.7 3402.8 1.4 3467.2
Passing #200 4.7 3524.4 4.7 3588.8 4.7 3653.2
Sand 1/2" 0 3524.4 0 3588.8 0 3653.2
3/8" 0 3524.4 0 3588.8 0 3653.2
#4 0 3524.4 0 3588.8 0 3653.2
#10 0 3524.4 0 3588.8 0 3653.2
#40 0.5 3545.4 0.4 3606.7 0.4 3668.1
#80 7.1 3828.5 6.1 3848.9 5 3869.4
#200 3.5 3970 3 3970 2.5 3970
Passing #200 0.8 4000 0.8 4000 0.8 4000
Total 100 4000 100 4000 100 4000
• - Coarse to fine fraction ( 60% material by weight retained on # 10 Sieve)
(Table 1 continued ...... )
197
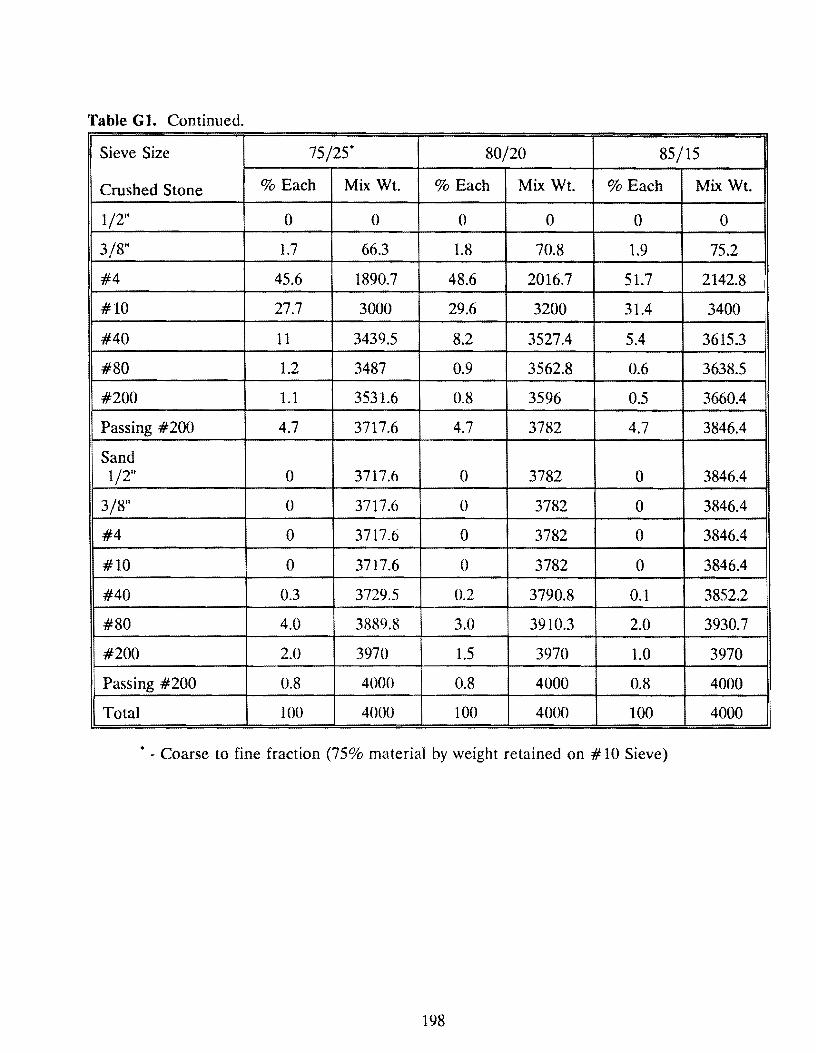
Table G 1. Continued.
Sieve Size 75/25· 80/20 85/15
Crushed Stone % Each Mix Wt. % Each Mix Wt. %Each Mix Wt.
1/2" 0 0 0 0 0 0
3/8" 1.7 66.3 1.8 70.8 1.9 75.2
#4 45.6 1890.7 48.6 2016.7 51.7 2142.8
#10 27.7 3000 29.6 3200 31.4 3400
#40 11 3439.5 8.2 3527.4 5.4 3615.3
#80 1.2 3487 0.9 3562.8 0.6 3638.5
#200 1.1 3531.6 0.8 3596 0.5 3660.4
Passing #200 4.7 3717.6 4.7 3782 4.7 3846.4
Sand 1/2" 0 3717.6 0 3782 0 3846.4
3/8" 0 3717.6 0 3782 0 3846.4
#4 0 3717.6 0 3782 0 3846.4
#10 0 3717.6 0 3782 0 3846.4
#40 0.3 3729.5 0.2 3790.8 0.1 3852.2
#80 4.0 3889.8 3.0 3910.3 2.0 3930.7
#200 2.0 3970 1.5 3970 1.0 3970
Passing #200 0.8 4000 0.8 4000 0.8 4000
Total 100 4000 100 4000 100 4000
• - Coarse to fine fraction (75% material by weight retained on #10 Sieve)
198
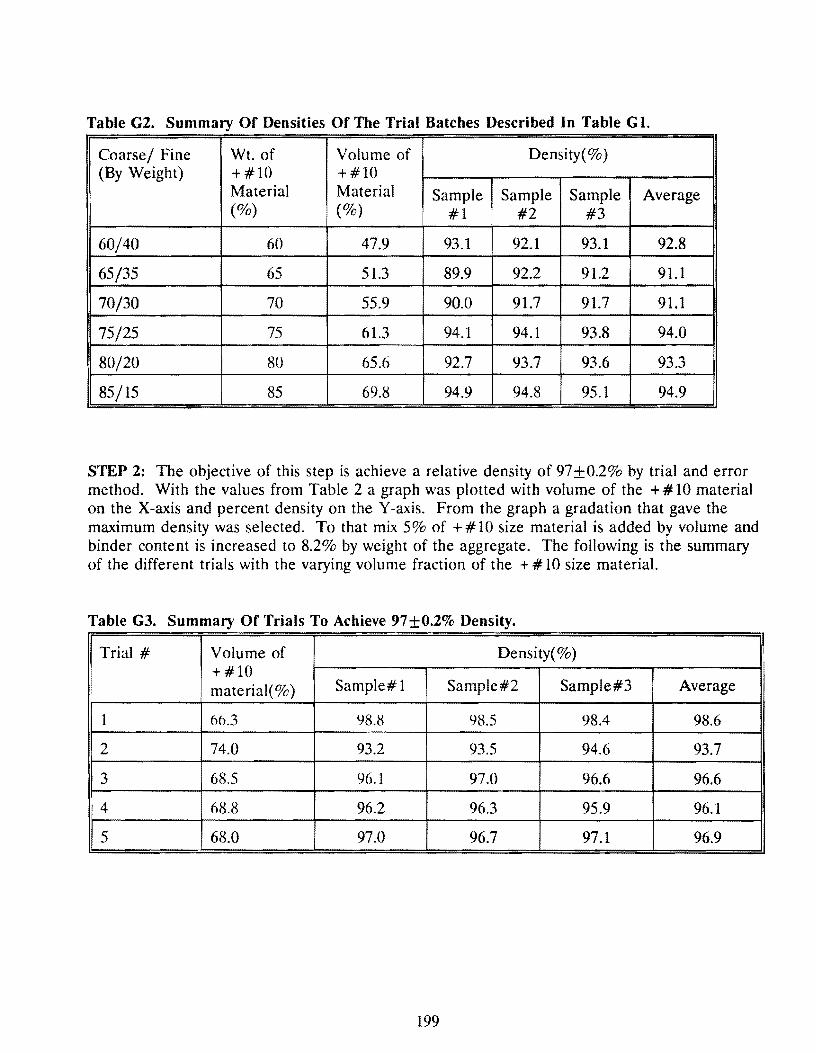
Table G2. Summary Of Densities Of The Trial Batches Described In Table G 1.
Coarse/ Fine Wt. of Volume of Density(%) (By Weight) +#10 +#10
Material Material Sample Sample Sample Average (%) (%) #1 #2 #3
60/40 60 47.9 93.1 92.1 93.1 92.8
65/35 65 51.3 89.9 92.2 91.2 91.1
70/30 70 55.9 90.0 91.7 91.7 91.1
75/25 75 61.3 94.l 94.1 93.8 94.0
80/20 80 65.6 92.7 93.7 93.6 93.3
85/15 85 69.8 94.9 94.8 95. l 94.9
STEP 2: The objective of this step is achieve a relative density of 97 ±0.2% by trial and error method. With the values from Table 2 a graph was plotted with volume of the +#10 material on the X-axis and percent density on the Y-axis. From the graph a gradation that gave the maximum density was selected. To that mix 5 % of + # 10 size material is added by volume and binder content is increased to 8.2% by weight of the aggregate. The following is the summary of the different trials with the varying volume fraction of the + # 10 size material.
Table G3. Summary Of Trials To Achieve 97 ±0.2% Density.
Trial# Volume of Density(%) +#10 material(%) Sample#l Sample#2 Sample#3 Average
1 66.3 98.8 98.5 98.4 98.6
2 74.0 93.2 93.5 94.6 93.7
3 68.5 96.1 97.0 96.6 96.6
4 68.8 96.2 96.3 95.9 96.1
5 68.0 97.0 96.7 97.l 96.9
199
I
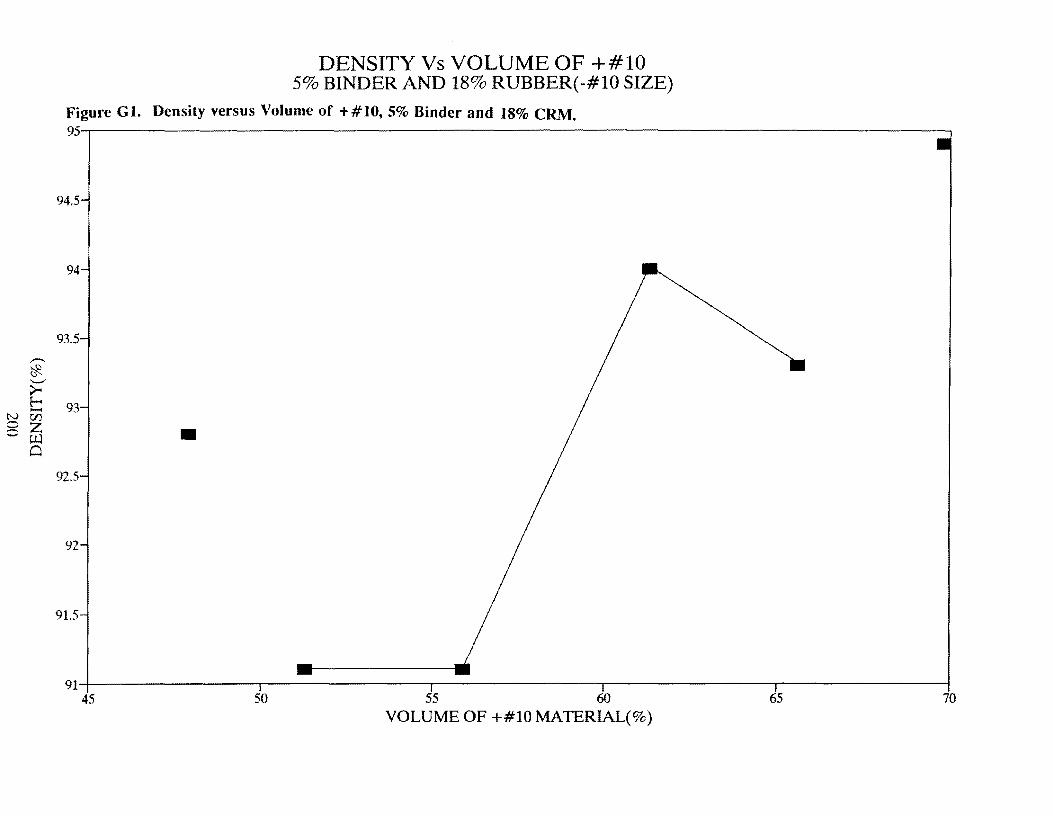
,........,
~ "--"'
>-E-.......
N Cl) ,...._ z ::=::: '-' u.:i
0
DENSITY Vs VOLUME OF +#10 5% BINDER AND 18% RUBBER(-#10 SIZE)
Figure GI. Density versus Volume of +#10, 5% Binder and 18% CRM. 95--.--~~~~~~~~~~~~~~~~~~~~~~~~~~~~~~~~~~~~~~-,
94.5
94
93.5
93
• 92.5
92
91.5
91-+-~~~~~~~..,--~~~~~~~-r--~~~~~~---.--~~~~~~--,~~~~~~~-1
45 50 55 60 65 70
VOLUME OF +#10 MATERIAL(%)
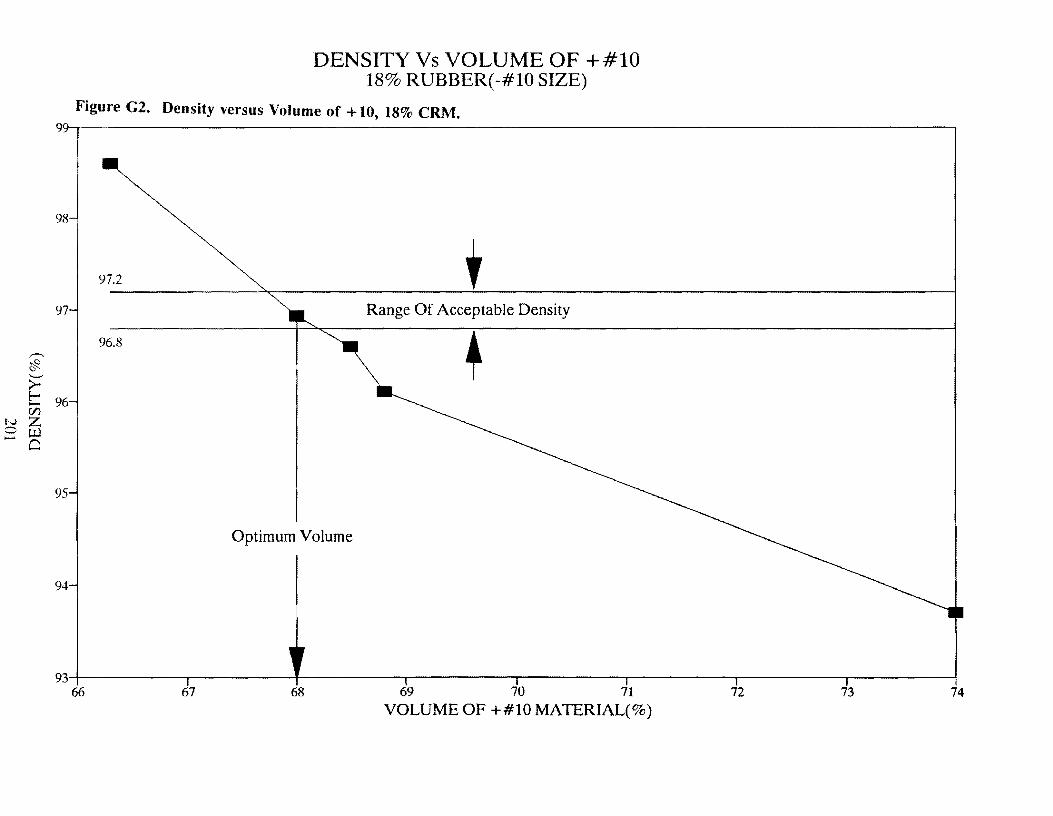
~
~
DENSITY Vs VOLUME OF +#10 18% RUBBER(-#10 SIZE)
Figure G2. Density versus Volume of + 10, 18% CRM. 99 ··-··
98
97.2
97 Range Of Acceptable Density
96.8
f 96 [/)
!'-.) z 0 [..l.]
a
95
Optimum Volume
94
93~~~~~~~~~~-t-~~~~--.-~~~~~.--~~~~-r--~~~~-.-~~~~--.-~~~~-i
66 67 68 69 70 71 72 73 74 VOLUME OF +#10 MATERIAL(%)
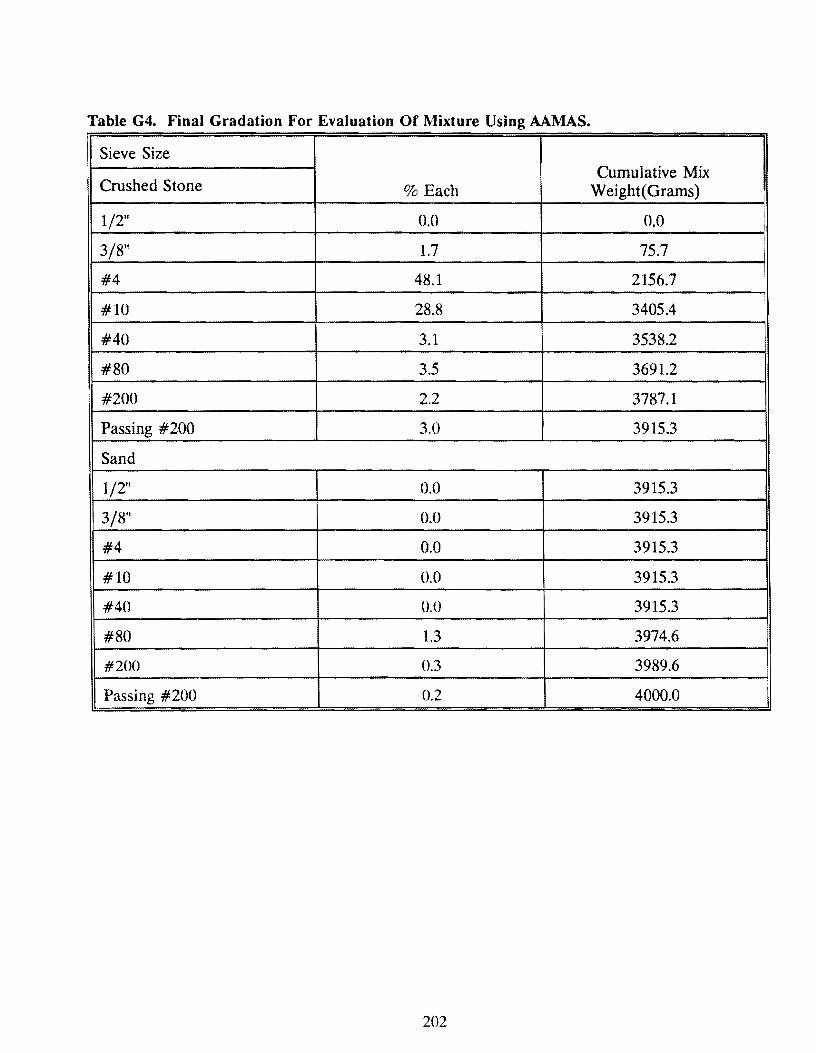
Table G4. Final Gradation For Evaluation Of Mixture Using AAMAS.
Sieve Size Cumulative Mix
Crushed Stone % Each Weight( Grams)
1/2" 0.0 0.0
3/8" 1.7 75.7
#4 48.1 2156.7
#10 28.8 3405.4
#40 3.1 3538.2
#80 3.5 3691.2
#200 2.2 3787.1
Passing #200 3.0 3915.3
Sand
1/2" 0.0 3915.3
3/8" 0.0 3915.3
#4 0.0 3915.3
#10 0.0 3915.3
#40 0.0 3915.3
#80 1.3 3974.6 I
#200 0.3 3989.6
Passing #200 0.2 4000.0
202
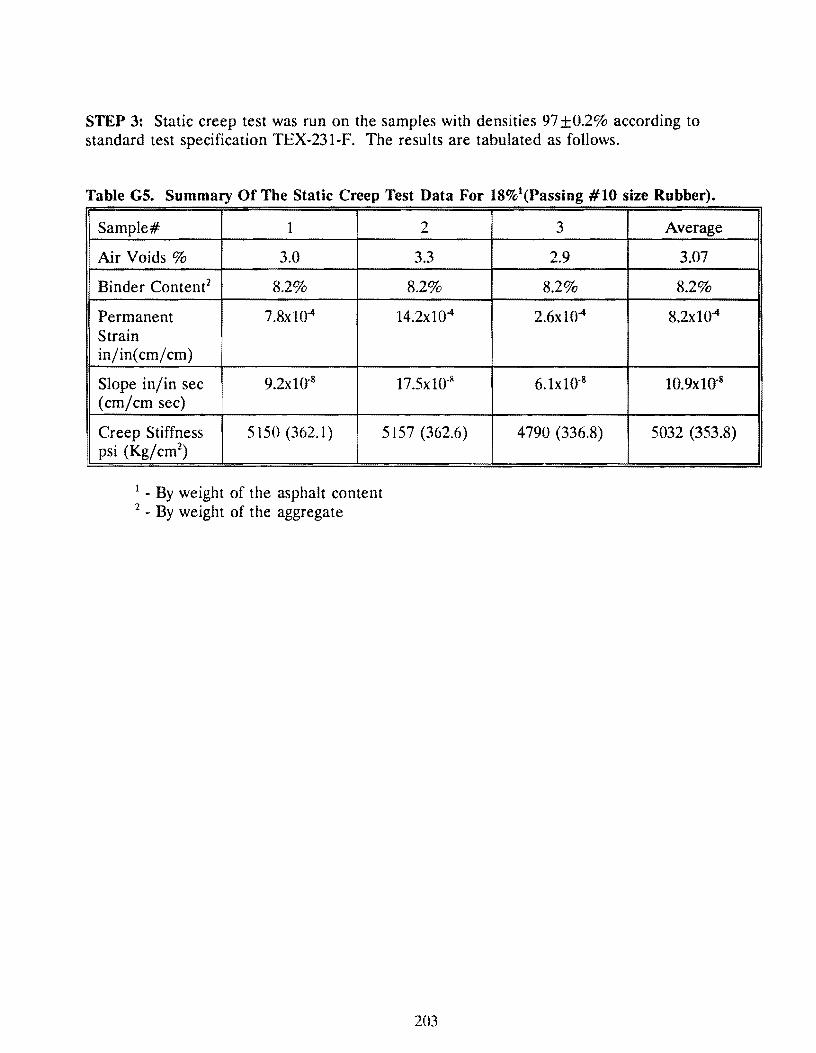
STEP 3: Static creep test was run on the samples with densities 97 +0.2% according to standard test specification TEX-231-F. The results are tabulated as follows.
Table GS. Summary Of The Static Creep Test Data For 18%1(Passing #10 size Rubber). '~
Sample# 1 2
Air Voids% 3.0 3.3
Binder Content2 8.2% 8.2%
Permanent 7.8xl04 14.2xl04
Strain in/in( cm/cm)
Slope in/in sec 9.2xl0·8 17.5xl0·8
(cm/cm sec)
Creep Stiffness 5150 (362.1) 5157 (362.6) psi (Kg/ cm2
)
1 - By weight of the asphalt content
2 - By weight of the aggregate
203
3 Average
2.9 3.07
8.2% 8.2%
2.6xl04 8.2xl04
6.1x10-s 10.9xI0·8
4790 (336.8) 5032 (353.8)
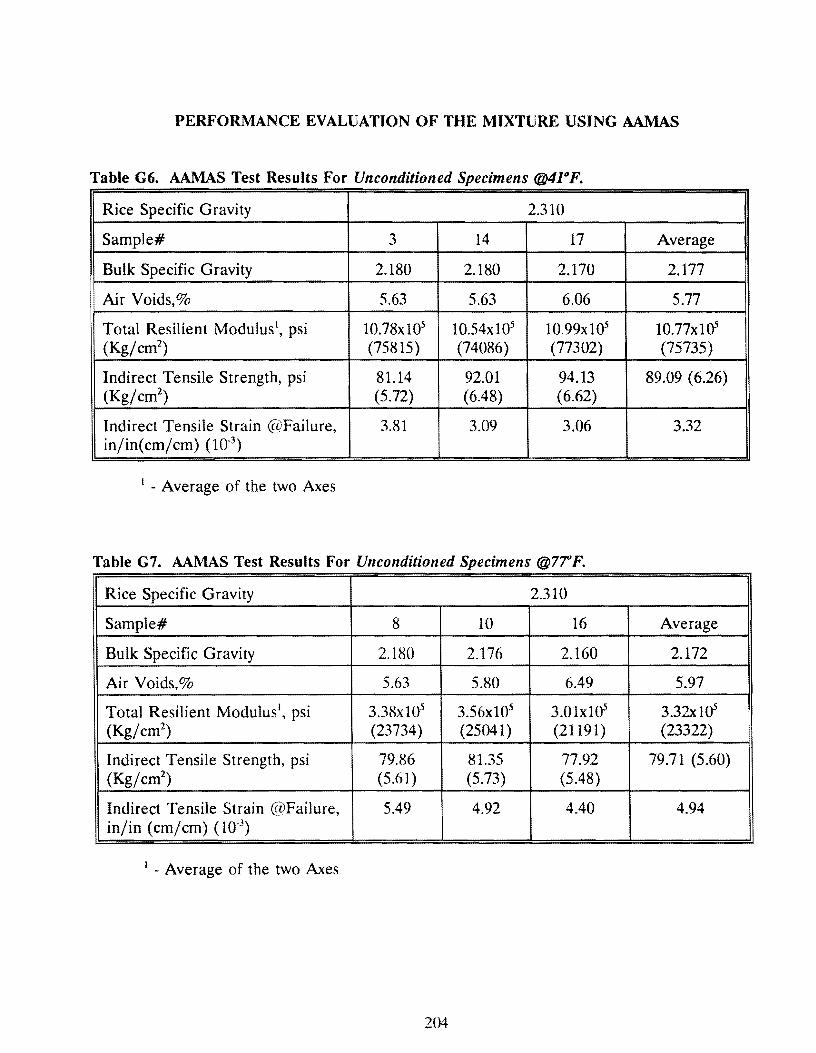
PERFORMANCE EVALUATION OF THE MIXTURE USING AAMAS
Table G6. AAMAS Test Results For Unconditioned Specimens @4l°F.
Rice Specific Gravity 2.310
Sample# 3 14 17 Average
Bulk Specific Gravity 2.180 2.180 2.170 2.177
Air Voids,% 5.63 5.63 6.06 5.77
Total Resilient Modulus1, psi 10.78xl05 10.54xl05 10.99x10⁵ 10.77xla5
(Kg/cm2) (75815) (74086) (77302) (75735)
Indirect Tensile Strength, psi 81.14 92.01 94.13 89.09 (6.26) (Kg/cm2
) (5.72) (6.48) (6.62)
Indirect Tensile Strain @Failure, 3.81 3.09 3.06 3.32 in/in(cm/cm) (10.3
)
1 - Average of the two Axes
Table G7. AAMAS Test Results For Unconditioned Specimens @77°F.
Rice Specific Gravity 2.310
Sample# 8 10 16 Average
Bulk Specific Gravity 2.180 2.176 2.160 2.172
Air Voids,% 5.63 5.80 6.49 5.97
Total Resilient Modulus 1, psi 3.38x10⁵ 3.56xl05 3.01xl05 3.32xl05
(Kg/cm2) (23734) (25041) (21191) (23322)
Indirect Tensile Strength, psi 79.86 81.35 77.92 79.71 (5.60) (Kg/cm2
) (5.61) (5.73) (5.48)
Indirect Tensile Strain @Failure, 5.49 4.92 4.40 4.94 in/in (cm/cm) (10.3
)
1 - Average of the two Axes
204
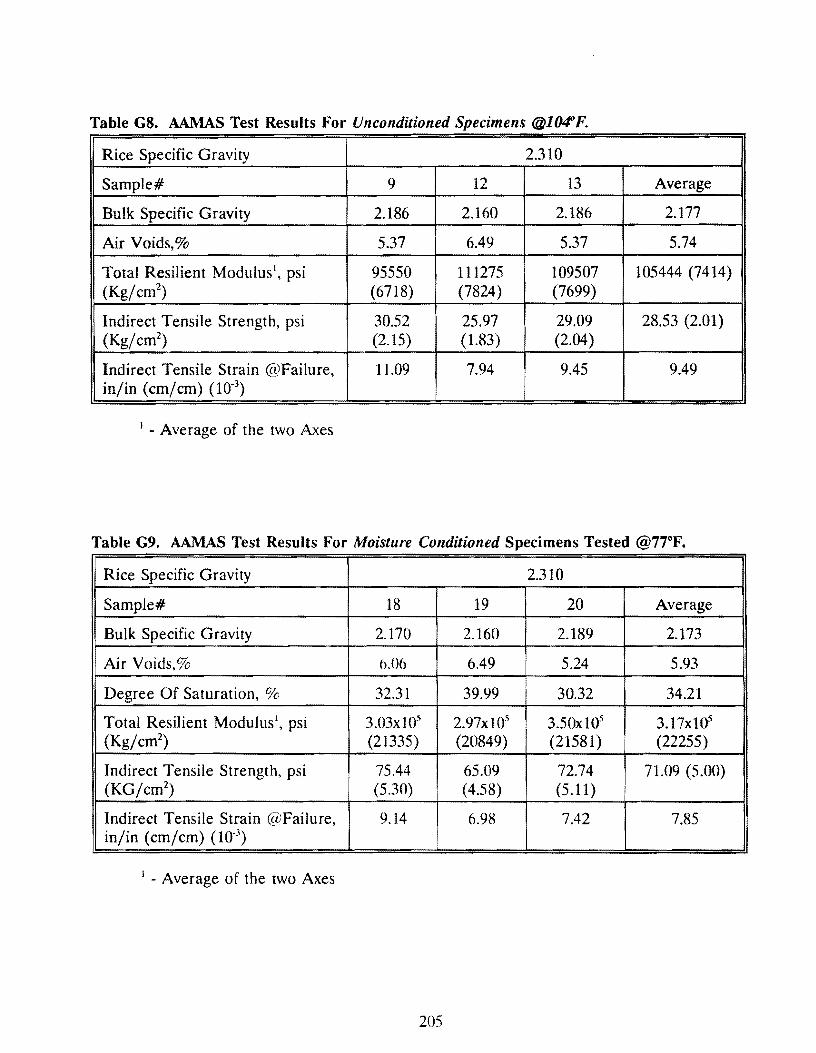
Table GS. AAMAS Test Results For Unconditioned Specimens @104°F.
Rice Specific Gravity 2.310
Sample# 9 12 13 Average
Bulk Specific Gravity 2.186 2.160 2.186 2.177
Air Voids,% 5.37 6.49 5.37 5.74
Total Resilient Modulus 1, psi 95550 111275 109507 105444 (7414) (Kg/cm2
) (6718) (7824) (7699)
Indirect Tensile Strength, psi 30.52 25.97 29.09 28.53 (2.01) (Kg/cm2
) (2.15) (1.83) (2.04)
Indirect Tensile Strain @Failure, 11.09 7.94 9.45 9.49 in/in (cm/cm) (10-3
)
1 - Average of the two Axes
Table G9. AAMAS Test Results For Moisture Conditioned Specimens Tested @77°F.
Rice Specific Gravity 2.310
Sample# 18 19 20 Average
Bulk Specific Gravity 2.170 2.160 2.189 2.173
Air Voids,% 6.06 6.49 5.24 5.93
Degree Of Saturation, % 32.31 39.99 30.32 34.21
Total Resilient Modulus\ psi 3.03xl05 2.97xl05 3.50x10⁵ 3.17xl05
(Kg/cm2) (21335) (20849) (21581) (22255)
Indirect Tensile Strength, psi 75.44 65.09 72.74 71.09 (5.00) (KG/cm2
) (5.30) i
( 4.58) (5.11)
Indirect Tensile Strain @Failure, 9.14 6.98 7.42 7.85 in/in (cm/cm) (10.3
)
1 - Average of the two Axes
205
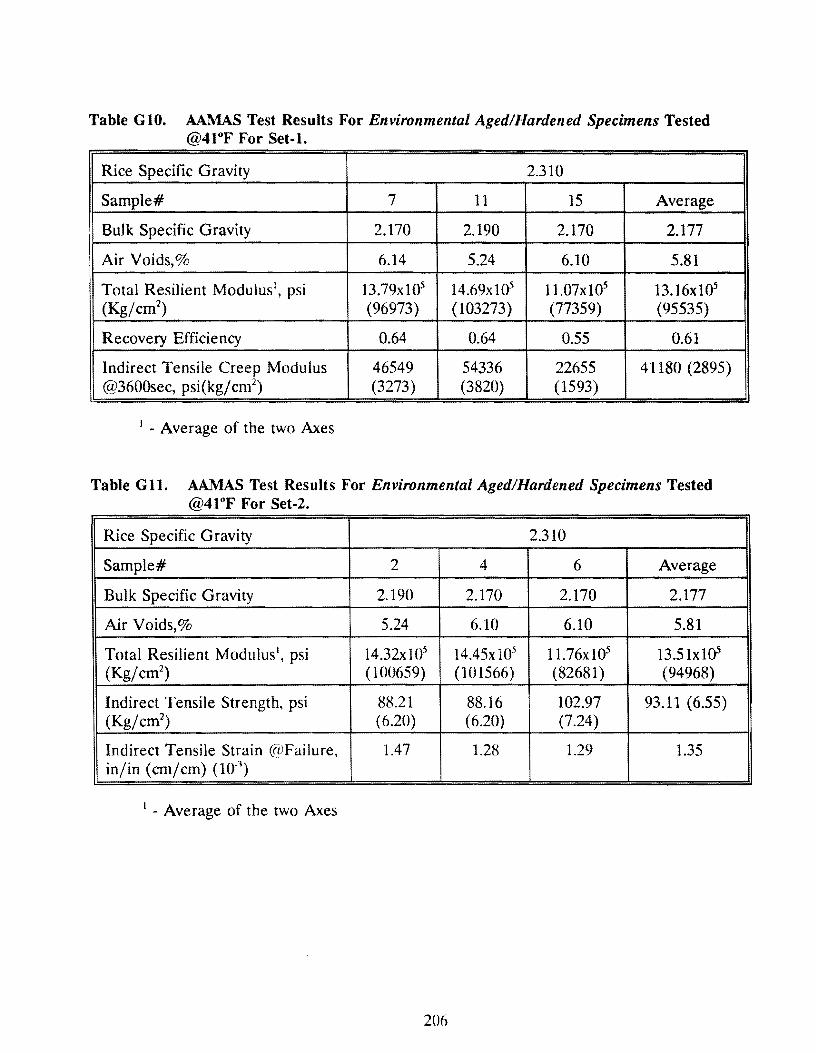
Table G 10. AAMAS Test Results For Environmental Aged/Hardened Specimens Tested @41°F For Set-1.
l~ice Specific Gravity 2.310
Sample# 7 11 15 Average
Bulk Specific Gravity 2.170 2.190 2.170 2.177
Air Voids,% 6.14 5.24 6.10 5.81
Total Resilient Modulus1, psi 13.79xl05 14.69xl05 11.07x10⁵ 13.16xl05
(Kg/cm2) (96973) (103273) (77359) (95535)
Recovery Efficiency 0.64 0.64 0.55 0.61
Indirect Tensile Creep Modulus 46549 54336 22655 41180 (2895) @3600sec, psi(kg/cm2
) (3273) (3820) (1593)
1 - Average of the two Axes
Table G 11. AAMAS Test Results For Environmental Aged/Hardened Specimens Tested @41°F For Set-2.
Rice Specific Gravity 2.310
Sample# 2 4 6 Average
Bulk Specific Gravity 2.190 2.170 2.170 2.177
Air Voids,% 5.24 6.10 6.10 5.81
Total Resilient Modulus1, psi 14.32x 10⁵ 14.45x10⁵ 11.76xl05 13.51xla5
(Kg/cm2) (100659) (101566) (82681) (94968)
Indirect Tensile Strength, psi 88.21 88.16 102.97 93.11 (6.55) (Kg/cm2
) (6.20) (6.20) (7.24)
Indirect Tensile Strain @Failure, 1.47 1.28 1.29 1.35 in/in (cm/cm) (10-3
)
1 - Average of the two Axes
206
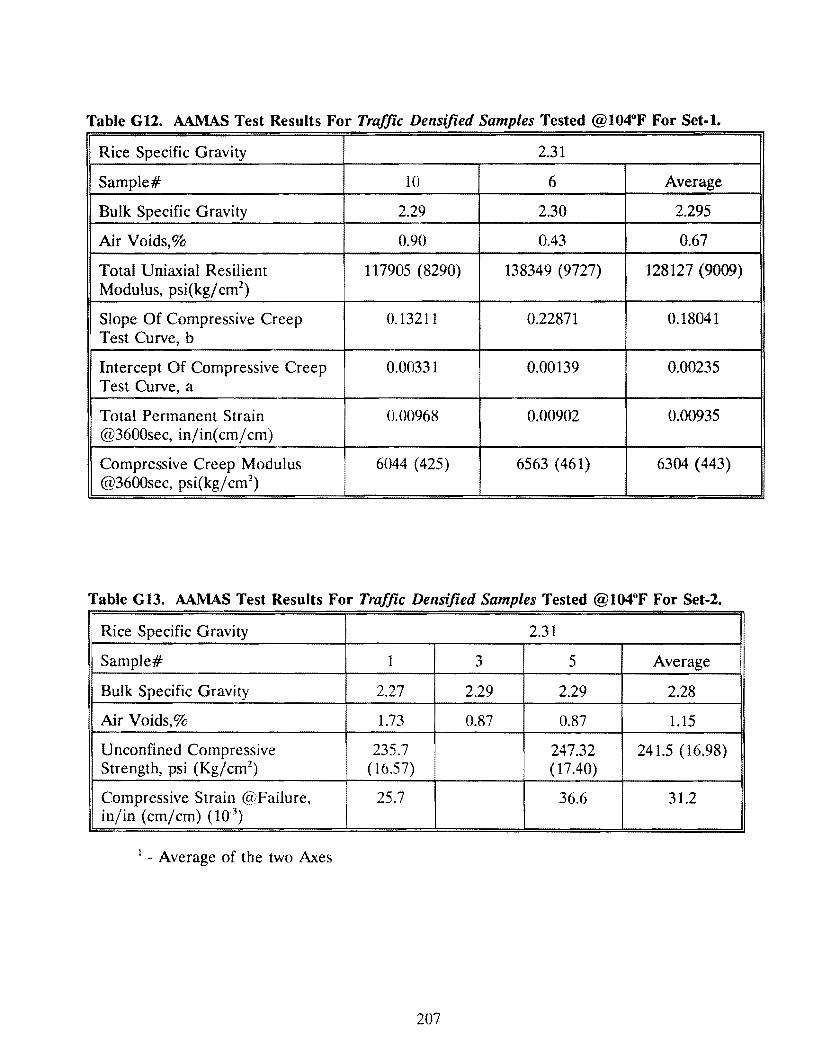
Table G12. AAMAS Test Results For Traffic Densified Samples Tested @104°F For Set-1.
Rice Specific Gravity 2.31
Sample# 10 6 Average
Bulk Specific Gravity 2.29 2.30 2.295
Air Voids,% 0.90 0.43 0.67
Total Uniax.ial Resilient 117905 (8290) 138349 (9727) 128127 (9009) Modulus, psi(kg/cm2
)
Slope Of Compressive Creep 0.13211 0.22871 0.18041 · Test Curve, b
Intercept Of Compressive Creep 0.00331 0.00139 0.00235 Test Curve, a
Total Permanent Strain 0.00968 0.00902 0.00935 @3600sec, in/in(cm/cm)
Compressive Creep Modulus 6044 (425) 6563 (461) 6304 (443) @3600sec, psi(kg/cm2
)
Table G 13. AAMAS Test Results For Traffic Densified Samples Tested @104°F For Set-2. !
· Rice Specific Gravity 2.31
Sample# 1 3 5 Average
Bulk Specific Gravity 2.27 2.29 2.29 2.28
Air Voids,% 1.73 0.87 0.87 1.15
Unconfined Compressive 235.7 247.32 241.5 (16.98) Strength, psi (Kg/ cm2
) (16.57) (17.40)
Compressive Strain @Failure, 25.7 36.6 31.2 in/in (cm/cm) (10-3
)
1 - Average of the two Axes
207
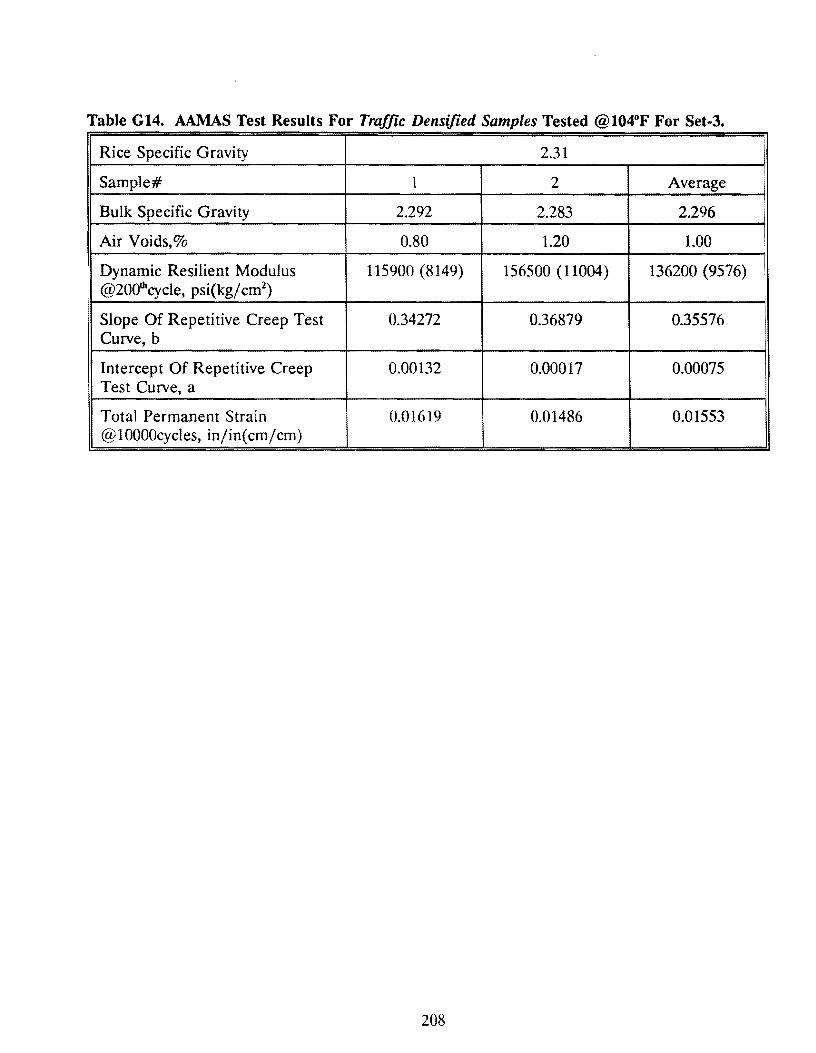
Table G14. AAMAS Test Results For Traffic Densified Samples Tested @104°F For Set-3.
. Rice Specific Gravity !
2.31
Sample# 1 2 Average
Bulk Specific Gravity 2.292 2.283 2.296
Air Voids,% 0.80 1.20 1.00
Dynamic Resilient Modulus 115900 (8149) 156500 (11004) 136200 (9576) @2001hcycle, psi(kg/ cm2
) i
Slope Of Repetitive Creep Test 0.34272 0.36879 0.35576 Curve, b
Intercept Of Repetitive Creep 0.00132 0.00017 0.00075 Test Curve, a
Total Permanent Strain 0.01619 0.01486 0.01553 @lOOOOcycles, in/in(cm/cm)
208
Appendix H
Laboratory Data for 18%CD Mixture
(18% Coarse Rubber, by Weight of Asphalt, via Dry Process)
209

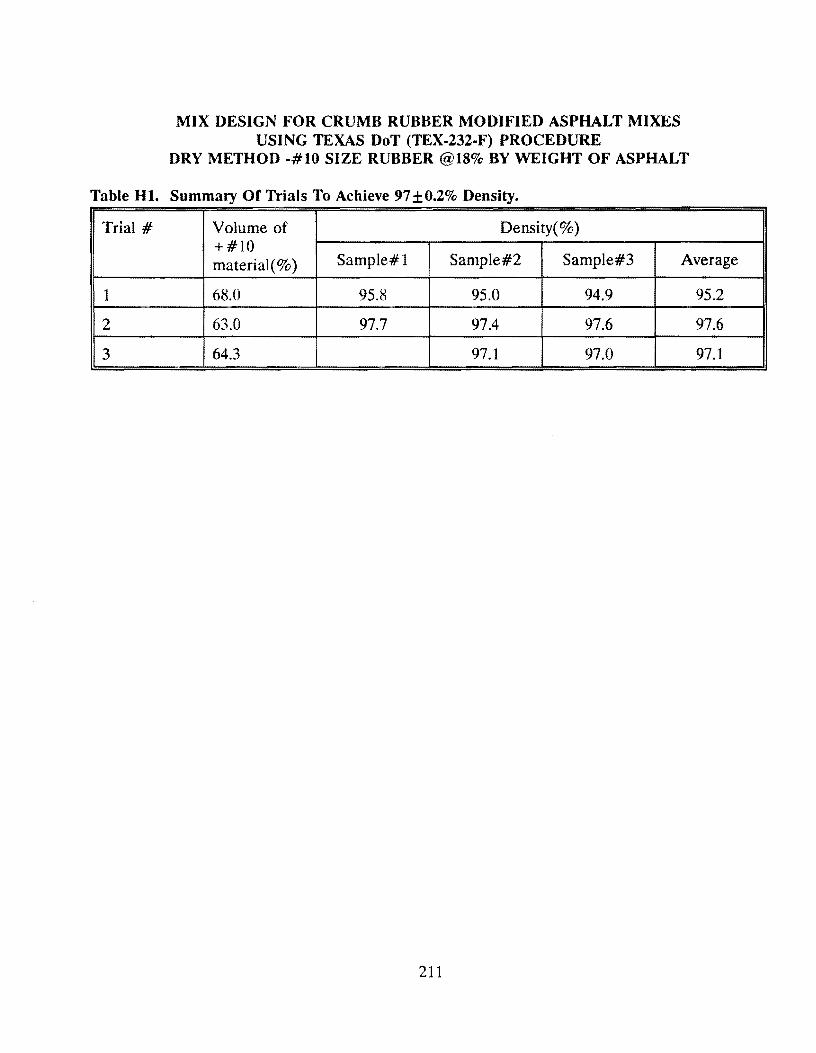
MIX DESIGN FOR CRUMB RUBBER MODIFIED ASPHALT MIXES USING TEXAS DoT (TEX-232-F) PROCEDURE
DRY METHOD -#10 SIZE RUBBER @18% BY WEIGHT OF ASPHALT
Table Hl. Summary Of Trials To Achieve 97±0.2% Density.
Trial# Volume of Density(%) +#10 material ( % ) Sample#! Sample#2 Sample#3 Average
I 68.0 95.8 95.0 94.9 95.2
2 63.0 97.7 97.4 97.6 97.6
3 64.3 97.1 97.0 97.1
211
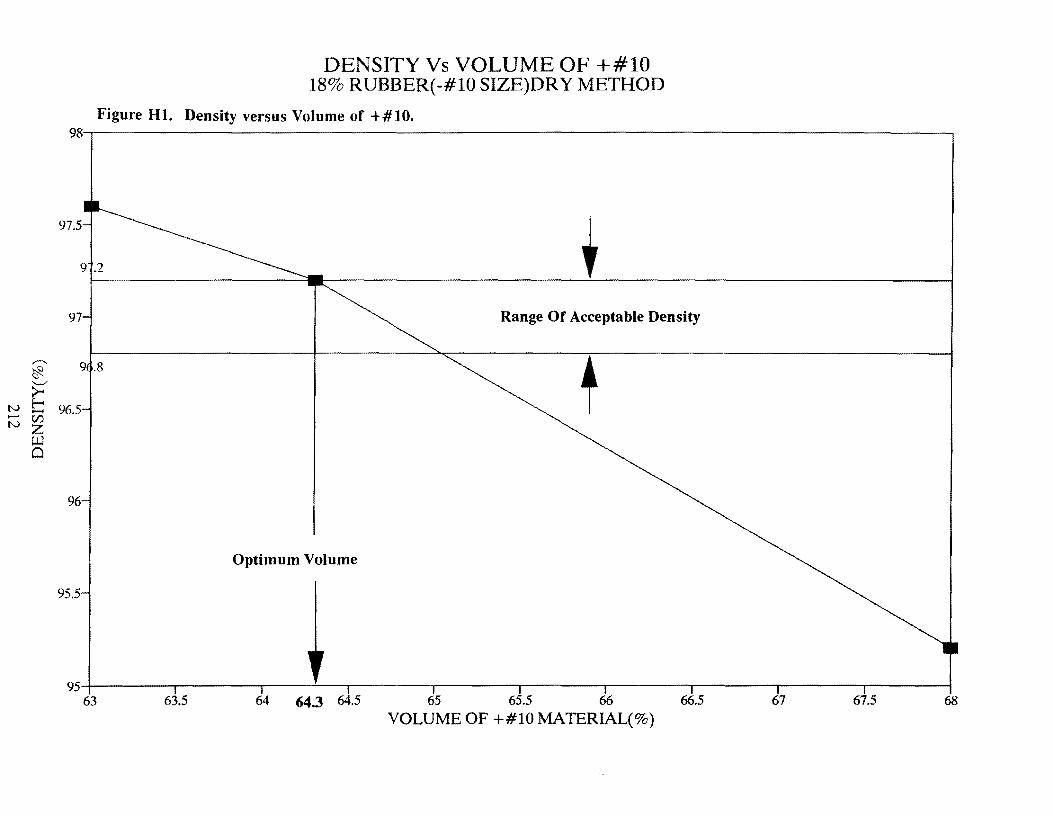
DENSITY Vs VOLUME OF +#10 18% RUBBER(-#10 SIZE)DRY METHOD
Figure Hl. Density versus Volume of +#10. 98.-,-~~~~~~~~~~~~~~~~~~~~~~~~~~~~~~~~~~~~~~~~~~~~~-.
97.5-l .....___
• 91.2 .....___
97-l I ~ Range Of Acceptable Density
~ r ~ t N t: 96.5 _. r:J')
NZ UJ 0
96
Optimum Volume
95.5
95f-r~~~--r~~~-,~~-!-~r-~~~.-~~~-.~~~-.~~~-.~~~--,..--~~~-.--~~---l
63 63.5 64 64.3 64.5 65 65.5 66 66.5 67 67.5 68
VOLUME OF +#10 MATERIAL(%)
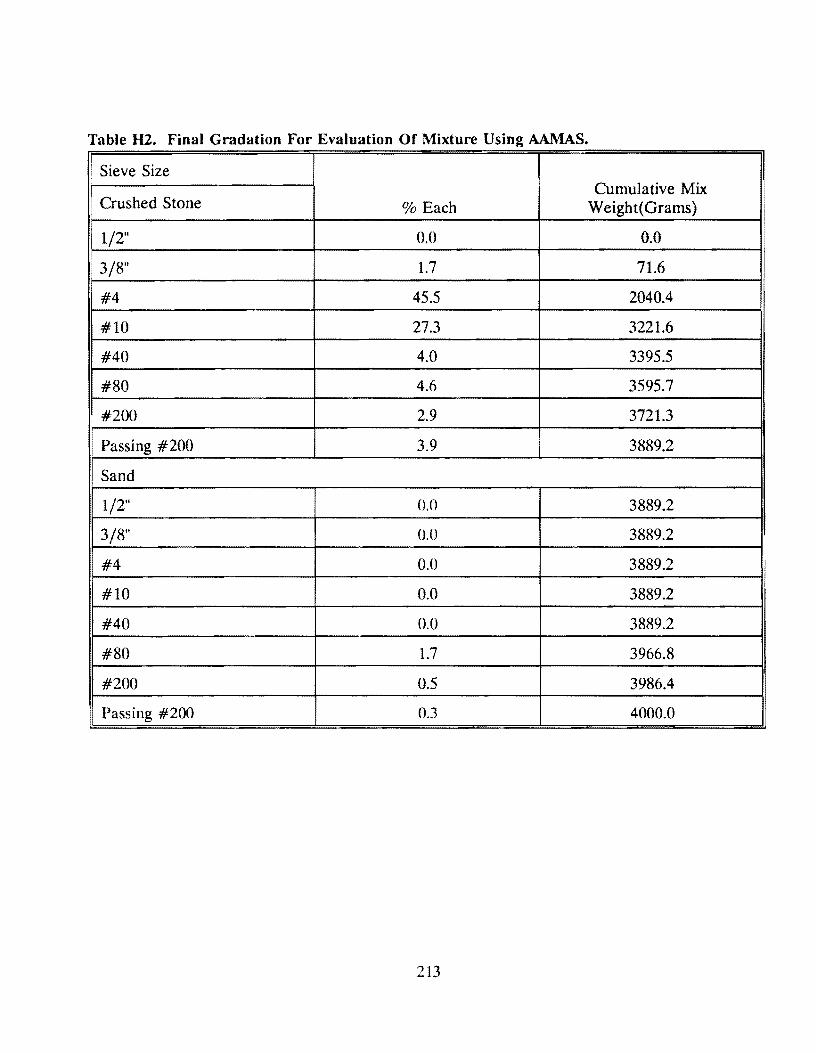
Table H2. Final Gradation For Evaluation Of Mixture Using AAMAS .
• Sieve Size Cumulative Mix l
: Crushed Stone % Each Weight( Grams)
I t/2" 0.0 0.0 !
• 3/8" 1.7 71.6
#4 45.5 2040.4
#10 27.3 3221.6
#40 4.0 3395.5
#80 4.6 3595.7
#200 2.9 3721.3
1 Passing # 200 3.9 3889.2
Sand
1/2" 0.0 3889.2
3/8" 0.0 3889.2
#4 0.0 3889.2
#10 0.0 3889.2
#40 0.0 3889.2
#80 1.7 3966.8
#200 0.5 3986.4
Passing #200 0.3 4000.0
213

STEP 3: Static creep test was run on the samples with densities 97+0.2% according to standard test specification TEX-231-F. The results are tabulated as follows.
Table H3. Summary Of The Static Creep Test Data For 18%1(Passing #10 size Rubber).
Sample# 1 2
Air Voids% 3.0 3.3
AC Content2 6.8% 6.8%
Permanent 12.9xl04 7.51xl04
Strain in/in( cm/cm)
Slope in/in sec 19. lxl0'8 10.?xIO·li (cm/cm sec)
Creep Stiffness 3659 (257.3) 4584 (322.3) psi (Kg/cm2
)
1 - By weight of the asphalt content
2 - By weight of the aggregate
214
3 Average
2.9 3.07
6.8% 6.8%
12.5xl04 10.9xl04
12.8x10-s 14.2xt0·8
3633 (255.4) 3959 (278.3)
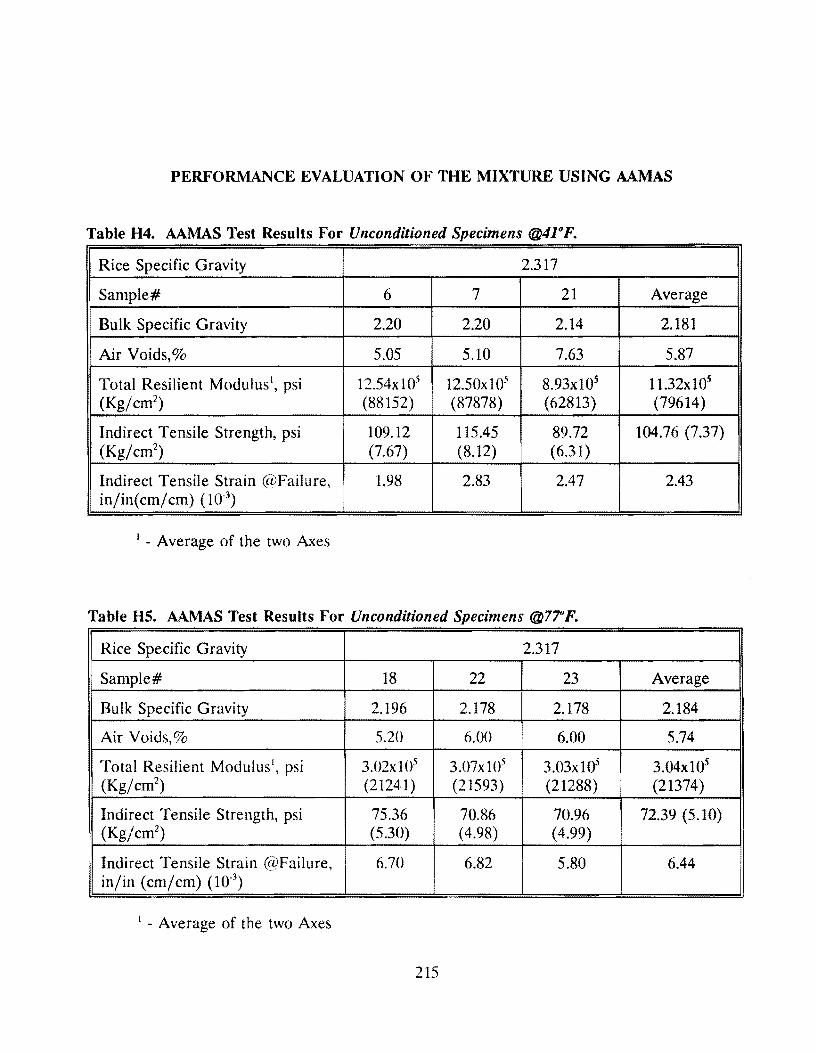
PERFORMANCE EVALUATION OF THE MIXTURE USING AAMAS
Table H4. AAMAS Test Results For Unconditioned Specimens @41° F.
Rice Specific Gravity 2.317
Sample# 6 7 21 Average
Bulk Specific Gravity 2.20 2.20 2.14 2.181
Air Voids,% 5.05 5.10 7.63 5.87
Total Resilient Modulus', psi 12.54xl05 12.50xl05 8.93x10⁵ 1 l.32x105
(Kg/cm2) (88152) (87878) (62813) (79614)
Indirect Tensile Strength, psi 109.12 115.45 89.72 104.76 (7.37) (Kg/cm2
) (7.67) (8.12) (6.31)
Indirect Tensile Strain @Failure, 1.98 2.83 2.47 2.43 in/in(cm/cm) (10-3
)
1 - Average of the two Axes
Table HS. AAMAS Test Results For Unconditioned Specimens @77°F.
Rice Specific Gravity 2.317
Sample# 18 22 23 Average
Bulk Specific Gravity 2.196 2.178 2.178 2.184
Air Voids,% 5.20 6.00 6.00 5.74
Total Resilient Modulus1, psi 3.02xl05 3.07x10⁵ 3.03xln5 3.04xl05
(Kg/cm2) (21241) (21593) (21288) (21374)
Indirect Tensile Strength, psi 75.36 70.86 70.96 72.39 (5.10) (Kg/cm2
) (5.30) (4.98) ( 4.99)
Indirect Tensile Strain @Failure, 6.70 6.82 5.80 6.44 in/in (cm/cm) (10-3
)
1 - Average of the two Axes
215
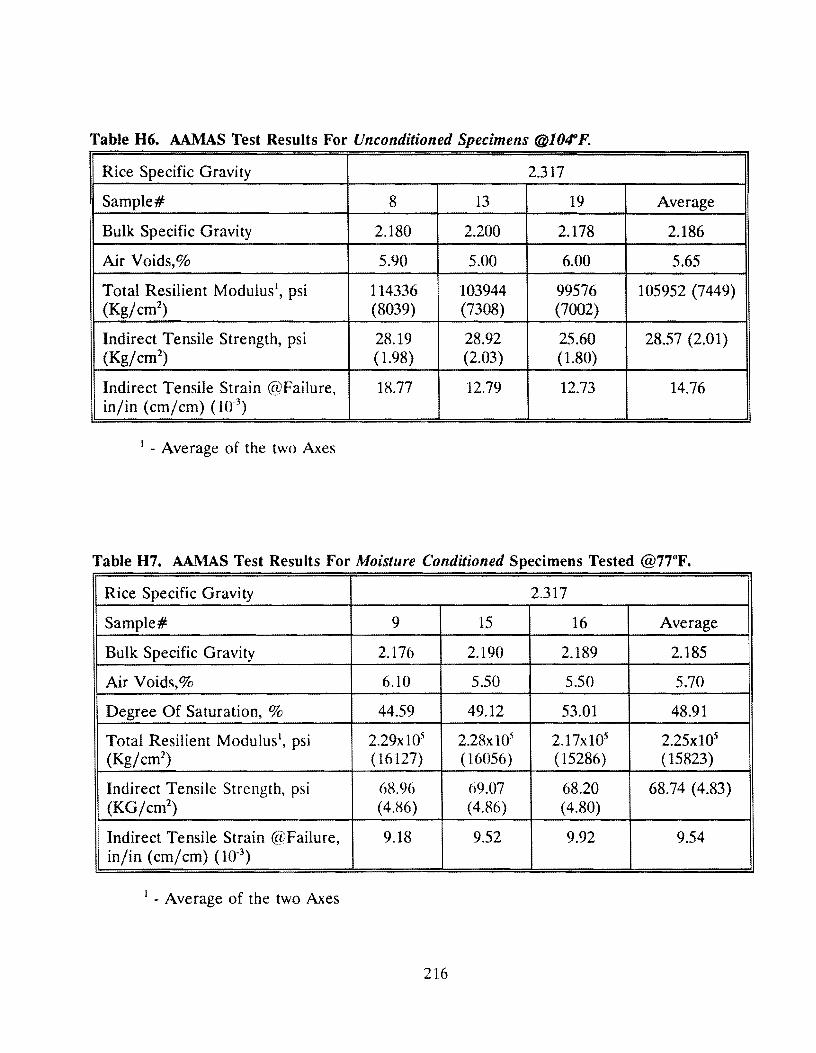
Table H6. AAMAS Test Results For Unconditioned Specimens @104°F.
Rice Specific Gravity 2.317
Sample# 8 13 19 Average
Bulk Specific Gravity 2.180 2.200 2.178 2.186
Air Voids,% 5.90 5.00 6.00 5.65
Total Resilient Modulus1, psi 114336 103944 99576 105952 (7449) (Kg/cm2
) (8039) (7308) (7002)
Indirect Tensile Strength, psi 28.19 28.92 25.60 28.57 (2.01) (Kg/cm2
) (1.98) (2.03) (1.80)
Indirect Tensile Strain @Failure, 18.77 12.79 12.73 14.76 in/in (cm/cm) (lff3
)
1 - Average of the two Axes
Table H7. AAMAS Test Results For Moisture Conditioned Specimens Tested @77°F.
Rice Specific Gravity 2.317
Sample# 9 15 16 Average
Bulk Specific Gravity 2.176 2.190 2.189 2.185
Air Voids,% 6.10 5.50 5.50 5.70
Degree Of Saturation, % 44.59 ' 49.12 53.01 48.91
Total Resilient Modulus 1, psi 2.29xl05 2.28xl05 2.17x10⁵ 2.25xl05
(Kg/cm2) ( 16127) ( 16056) (15286) (15823)
Indirect Tensile Strength, psi 68.96 69.07 68.20 68.74 (4.83) (KG/cm2
) (4.86) (4.86) (4.80)
Indirect Tensile Strain @Failure, 9.18 9.52 9.92 9.54 in/in (cm/cm) (10"3
)
1 • Average of the two Axes
216
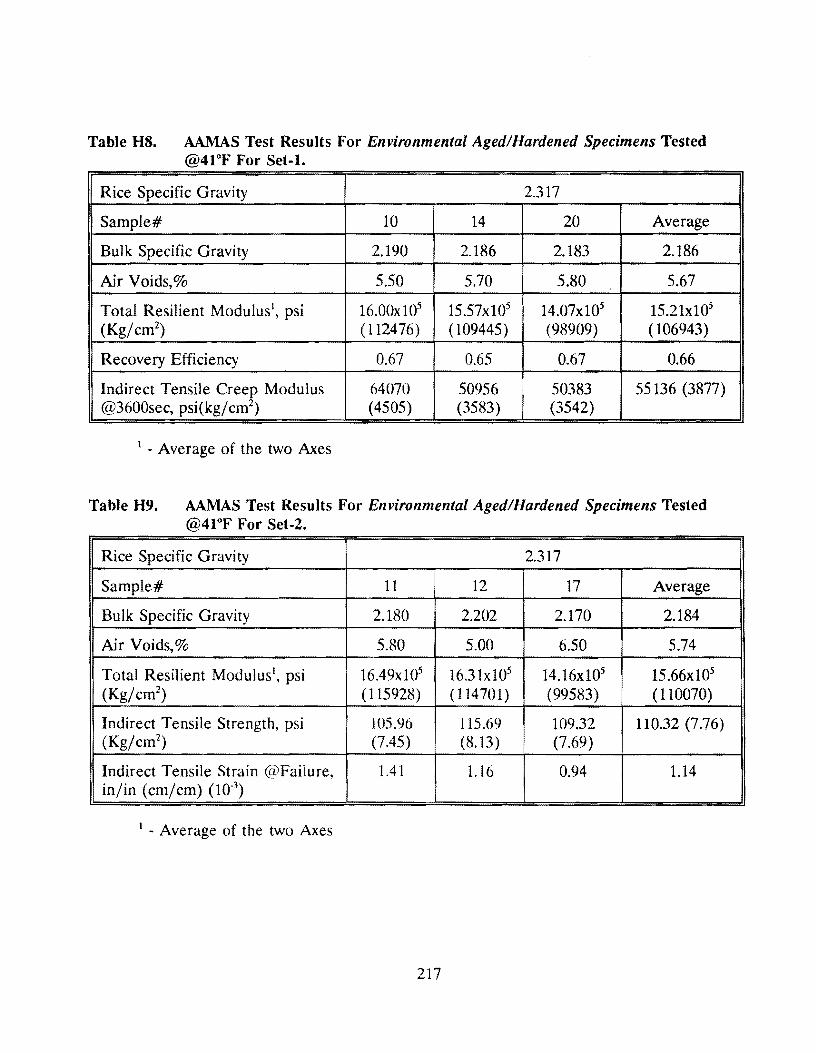
Table HS. AAMAS Test Results For Environmental Aged/Hardened Specimens Tested @41°F For Set-1.
Rice Specific Gravity 2.317
Sample# 10 14 20 Average
Bulk Specific Gravity 2.190 2.186 2.183 2.186
Air Voids,% 5.50 5.70 5.80 5.67
Total Resilient Modulus1, psi 16.00xl05 15.57x10⁵ 14.07x10⁵ 15.21xl05
(Kg/cm2} (112476) (109445) (98909) (106943)
Recovery Efficiency 0.67 0.65 0.67 0.66
Indirect Tensile Creep Modulus 64070 50956 50383 55136 (3877) @3600sec, psi(kg/ cm2
) (4505) (3583) (3542)
1 - Average of the two Axes
Table H9. AAMAS Test Results For Environmental Aged/Hardened Specimens Tested @41°F For Set-2.
Rice Specific Gravity 2.317
Sample# 11 12 17 Average
Bulk Specific Gravity 2.180 2.202 2.170 2.184
Air Voids,% 5.80 5.00 6.50 5.74
Total Resilient Modulus1, psi 16.49x10⁵ 16.3 lx105 14.16xl05 15.66xl05
(Kg/cm2} ( 115928) ( 114701) (99583) (110070)
Indirect Tensile Strength, psi 105.96 115.69 109.32 110.32 (7.76) (Kg/cm2
) (7.45) (8.13) (7.69)
Indirect Tensile Strain @Failure, 1.41 1.16 0.94 1.14 in/in (cm/cm) (10-3
)
1 - Average of the two Axes
217
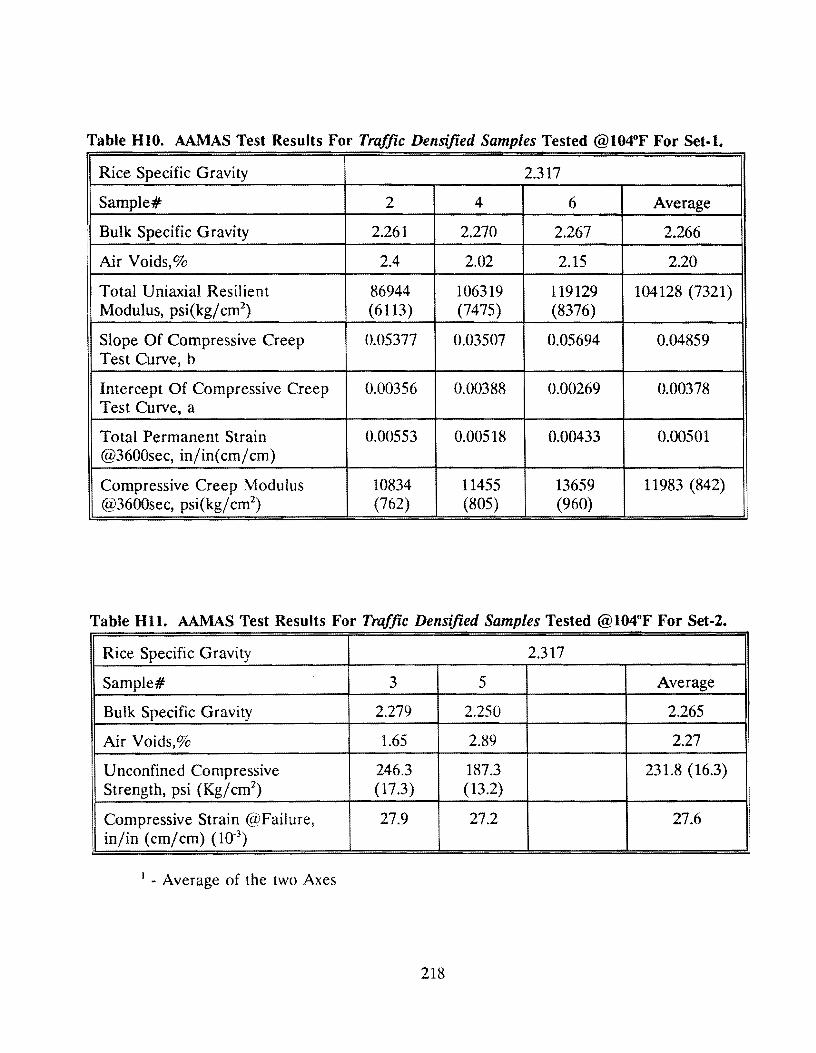
Table HlO. AAMAS Test Results For Traffic Densified Samples Tested @104°F For Set-1.
Rice Specific Gravity 2.317
Sample# 2 4 6 Average
Bulk Specific Gravity 2.261 2.270 2.267 2.266
Air Voids,% 2.4 2.02 2.15 2.20
Total Uniaxial Resilient 86944 106319 119129 104128 (7321) Modulus, psi(kg/ cm2
) (6113) (7475) (8376)
Slope Of Compressive Creep 0.05377 0.03507 0.05694 0.04859 Test Curve, b
Intercept Of Compressive Creep 0.00356 0.00388 0.00269 0.00378 Test Curve, a
Total Permanent Strain 0.00553 0.00518 0.00433 0.00501 @3600sec, in/in(cm/cm)
Compressive Creep Modulus 10834 11455 13659 11983 (842) @3600sec, psi(kg/ cm2
) (762) (805) (960)
Table Hll. AAMAS Test Results For Traffic Densified Samples Tested @104°F For Set-2.
Rice Specific Gravity 2.317
Sample# 3 5 Average
Bulk Specific Gravity 2.279 2.250 2.265
Air Voids,% 1.65 2.89 2.27 i
Unconfined Compressive 246.3 187.3 231.8 (16.3)
I Strength, psi (Kg/ cm2) (17.3) (13.2)
Compressive Strain @Failure, 27.9 27.2 27.6 !
in/in (cm/cm) (10'3)
1 - Average of the two Axes
218
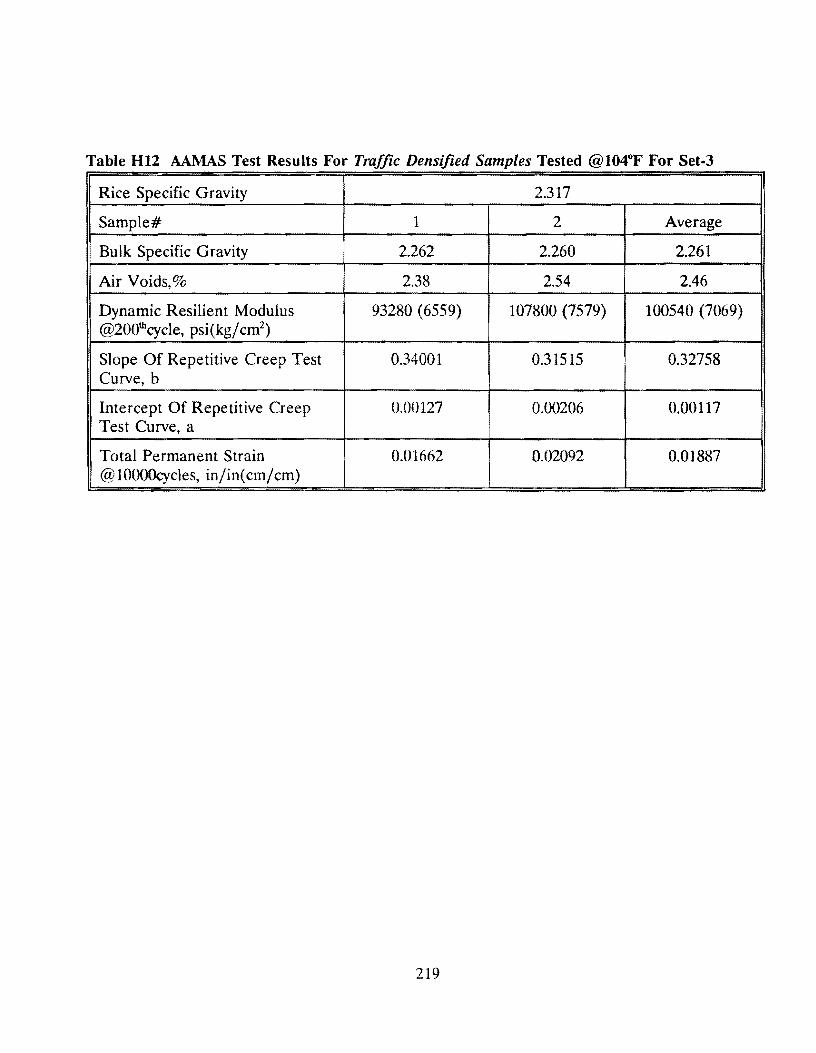
Table H12 AAMAS Test Results For Traffic Densified Samples Tested @104°F For Set-3
Rice Specific Gravity 2.317
Sample# 1 2 Average
Bulk Specific Gravity 2.262 2.260 2.261
Air Voids,% 2.38 2.54 2.46
Dynamic Resilient Modulus 93280 ( 6559) 107800 (7579) 100540 (7069) @2001hcycle, psi(kg/cm2
)
Slope Of Repetitive Creep Test 0.34001 0.31515 0.32758 Curve, b
Intercept Of Repetitive Creep 0.00127 0.00206 0.00117 Test Curve, a
Total Permanent Strain 0.01662 0.02092 0.01887 @lOOOOcycles, in/in(cm/cm)
219

Appendix I
Laboratory Data for 18o/oFD Mixture
(18% Fine Rubber, by Weight of Asphalt, via Dry Process)
221

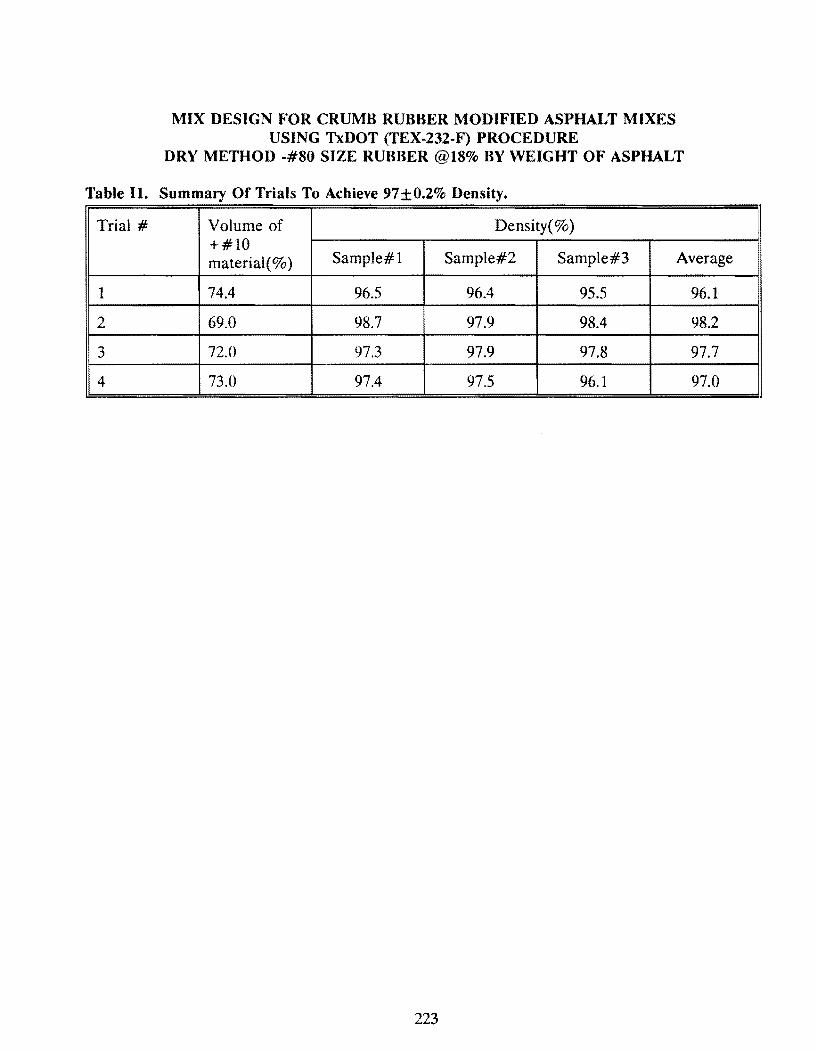
MIX DESIGN FOR CRUMB RUBBER MODIFIED ASPHALT MIXES USING TxDOT (TEX-232-F) PROCEDURE
DRY METHOD -#80 SIZE RUBBER @18% BY WEIGHT OF ASPHALT
Table 11. Summary Of Trials To Achieve 97±0.2% Density.
Trial# Volume of Density(%) +#10 material(%) Sample#l Sample#2 Sample#3 Average
1 74.4 96.5 96.4 95.5 96.1
2 69.0 98.7 97.9 98.4 98.2
3 72.0 97.3 97.9 97.8 97.7
4 73.0 97.4 97.5 96.1 97.0
223
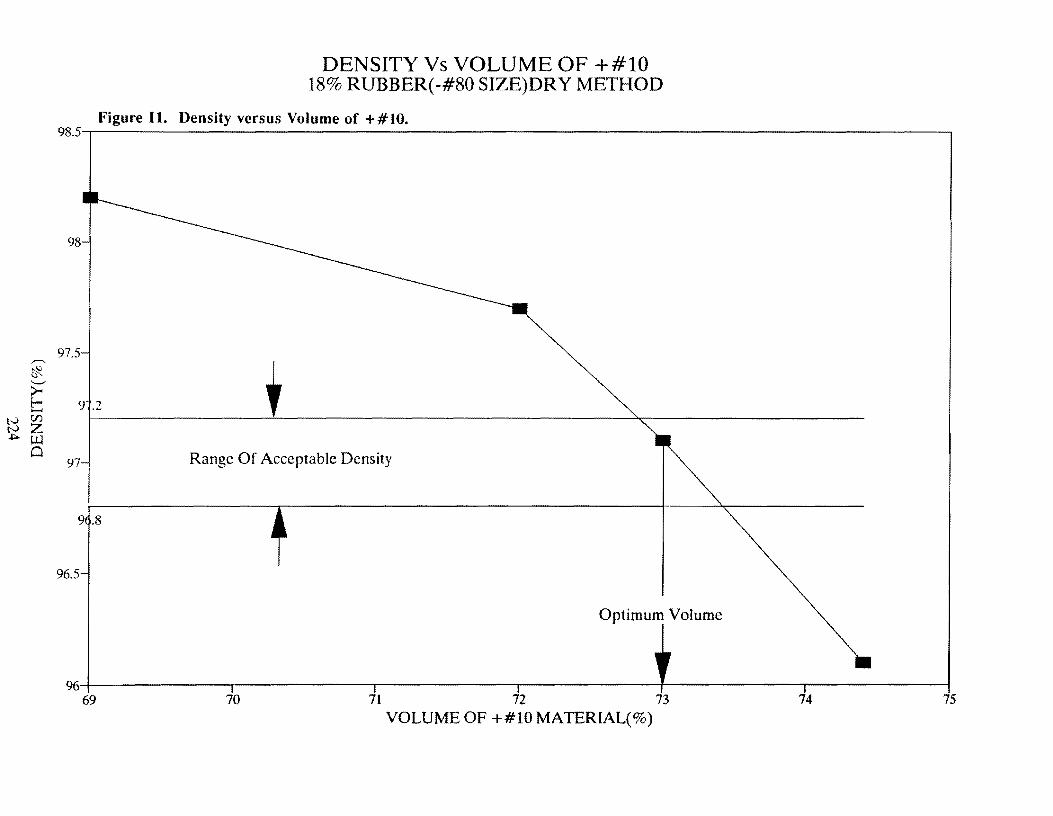
~
~ '--"
>-
DENSITY Vs VOLUME OF +#10 18% RUBBER(-#80 SIZE)DRY METHOD
Figure 11. Density versus Volume of +#10. 98.5---.-----------------------------------------~
98
97.5
t: 9 .2 ~ ~ f----------'-----------------------------~ Ul
Cl 97 Range Of Acceptable Density
9 .8
96.5
Optimum Volume
%-l--------,,--------,.-------..--------1-------..--------1 69 70 71 72 73 74 75
VOLUME OF +#10 MATERIAL(%)
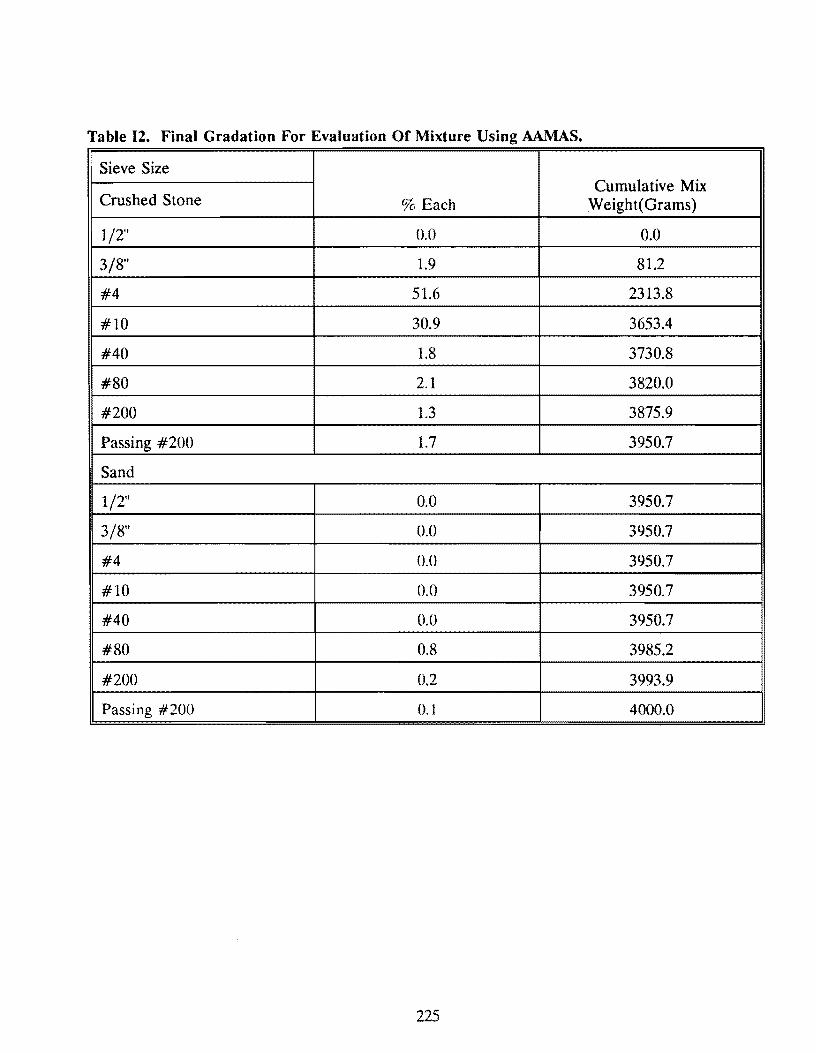
Table 12. Final Gradation For Evaluation Of Mixture Using AAMAS.
Sieve Size Cumulative Mix
Crushed Stone % Each Weight( Grams)
1/2" 0.0 0.0
3/8" 1.9 81.2
#4 51.6 2313.8
#10 30.9 3653.4
#40 1.8 3730.8
#80 2.1 3820.0
#200 1.3 3875.9
Passing #200 1.7 3950.7
Sand
1/2" 0.0 3950.7
3/8" 0.0 3950.7
#4 0.0 3950.7
#10 0.0 3950.7
#40 0.0 3950.7
#80 0.8 3985.2
#200 0.2 3993.9
Passing #200 0.1 4000.0
225

STEP 3: Static creep test was run on the samples with densities 97 ±0.2% according to standard test specification TEX-231-F. The results are tabulated as follows.
Table 13. Summary Of The Static Creep Test Data For 18%1(Passing #80 size Rubber) .
. Sample# 1 1
Air Voids% 2.6
AC Content2 6.8%
Permanent 5. lxl04
Strain in/in( cm/cm)
Slope in/in sec 7.7xl0·8
(cm/cm sec)
Creep Stiffness 6093 ( 428.4) psi (Kg/ cm2
)
1 - By weight of the asphalt content
2 - By weight of the aggregate
2 3 Average
2.5 3.9 3.00
6.8% 6.8% 6.8%
7.0xl04 6.8xl04 6.3x10⁴
4.6x 10-~ 3.3xl0·8 5.2x10"8
6472 (455.0) 6222 (437.5) 6262 (440.3)
226
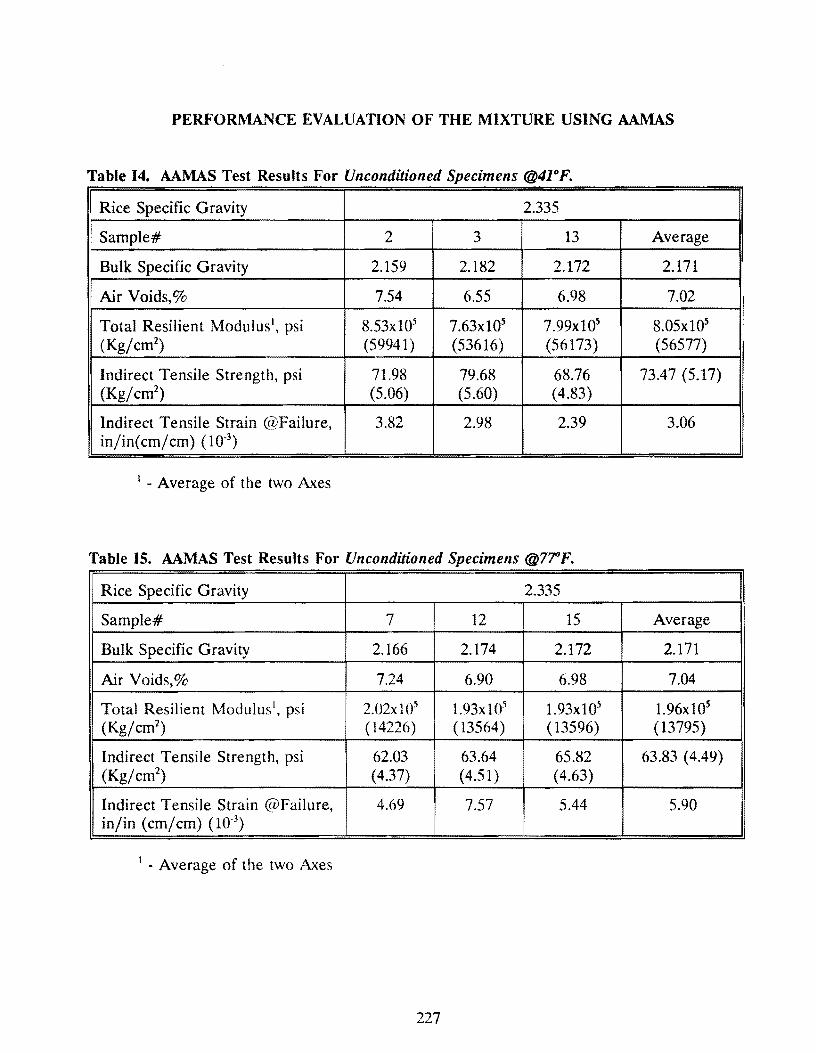
PERFORMANCE EVALUATION OF THE MIXTURE USING AAMAS
Table I4. AAMAS Test Results For Unconditioned Specimens @41° F.
Rice Specific Gravity 2.335
I Sample# 2 3 13 Average
. Bulk Specific Gravity 2.159 2.182 2.172 2.171
Air Voids,% 7.54 6.55 6.98 7.02
Total Resilient Modulus•, psi 8.53x10⁵ 7.63xl05 7.99x10⁵ 8.05x10S (Kg/cm2
) (59941) (53616) (56173) (56577)
Indirect Tensile Strength, psi 71.98 79.68 68.76 73.47 (5.17) (Kg/cm2
) (5.06) (5.60) (4.83)
Indirect Tensile Strain @Failure, 3.82 2.98 2.39 3.06 in/in( cm/ cm) (1 o-3
)
1 - Average of the two Axes
Table IS. AAMAS Test Results For Unconditioned Specimens @TrF.
Rice Specific Gravity 2.335
Sample# 7 12 15 Average
Bulk Specific Gravity 2.166 2.174 2.172 2.171
Air Voids,% 7.24 6.90 6.98 7.04
Total Resilient Modulus1, psi 2.02x10⁵ 1.93x10⁵ l.93x105 1.96xl05
(Kg/cm2) (14226) ( 13564) (13596) (13795)
Indirect Tensile Strength, psi 62.03 63.64 65.82 63.83 ( 4.49) (Kg/cm2
) (4.37) (4.51) (4.63)
Indirect Tensile Strain @Failure, 4.69 7.57 5.44 5.90 in/in (cm/cm) (10"3
)
1 - Average of the two Axes
227
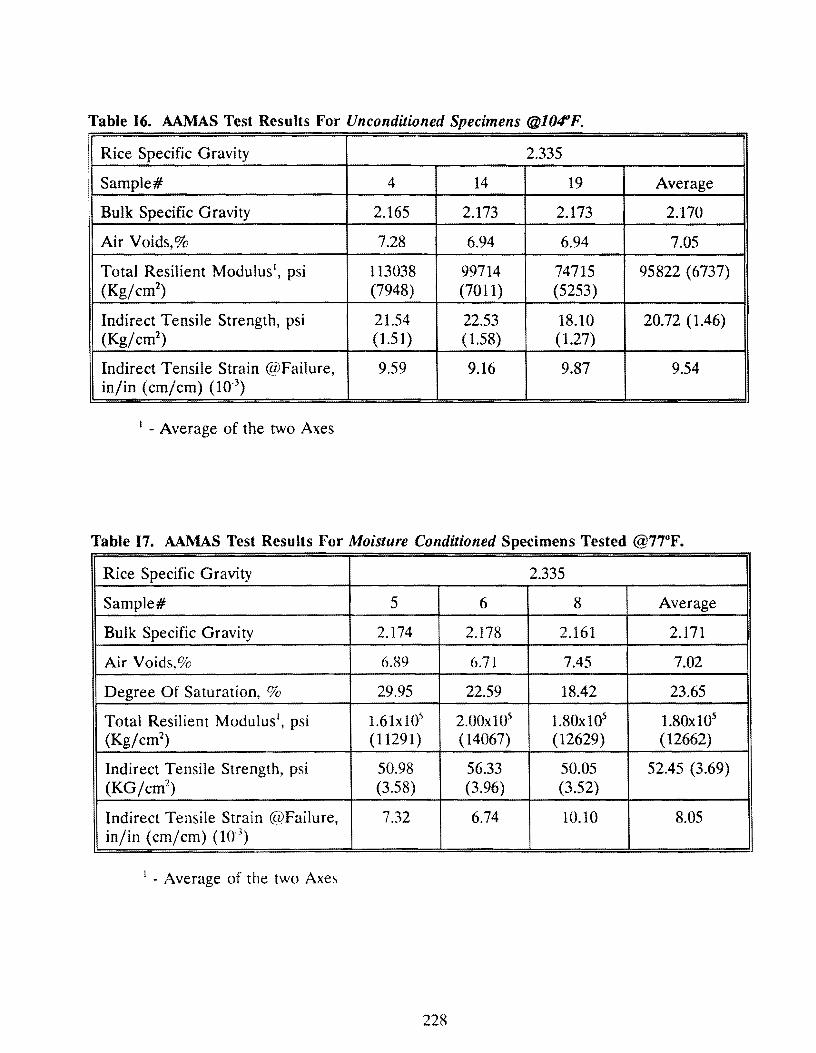
Table 16. AAMAS Test Results For Unconditioned Specimens @l04"F. !
Rice Specific Gravity 2.335
Sample# 4 14 19 Average
Bulk Specific Gravity 2.165 2.173 2.173 2.170
Air Voids,% 7.28 6.94 6.94 7.05
Total Resilient Modulus 1, psi 113038 99714 74715 95822 (6737)
(Kg/cm2) (7948) (7011) (5253)
Indirect Tensile Strength, psi 21.54 22.53 18.10 20.72 (1.46) (Kg/cm2
) (1.51) ( 1.58) (1.27)
Indirect Tensile Strain @Failure, 9.59 9.16 9.87 9.54 in/in (cm/cm) (10.3
)
1 - Average of the two Axes
Table 17. AAMAS Test Results For Moisture Conditioned Specimens Tested @77°F.
Rice Specific Gravity 2.335
Sample# 5 6 8 Average
Bulk Specific Gravity 2.174 2.178 2.161 2.171
Air Voids,% 6.89 6.71 7.45 7.02
Degree Of Saturation, % 29.95 22.59 18.42 23.65
Total Resilient Modulus 1, psi 1.6lxl05 2.00xl05 1.80x10⁵ 1.80x10⁵
(Kg/cm2) (11291) (14067) (12629) (12662)
Indirect Tensile Strength, psi 50.98 56.33 50.05 52.45 (3.69) (KG/cm2
) (3.58) (3.96) (3.52)
Indirect Tensile Strain @Failure, 7.32 6.74 10.10 8.05 in/in (cm/cm) (10.3
)
1 - Average of the two Axes
228
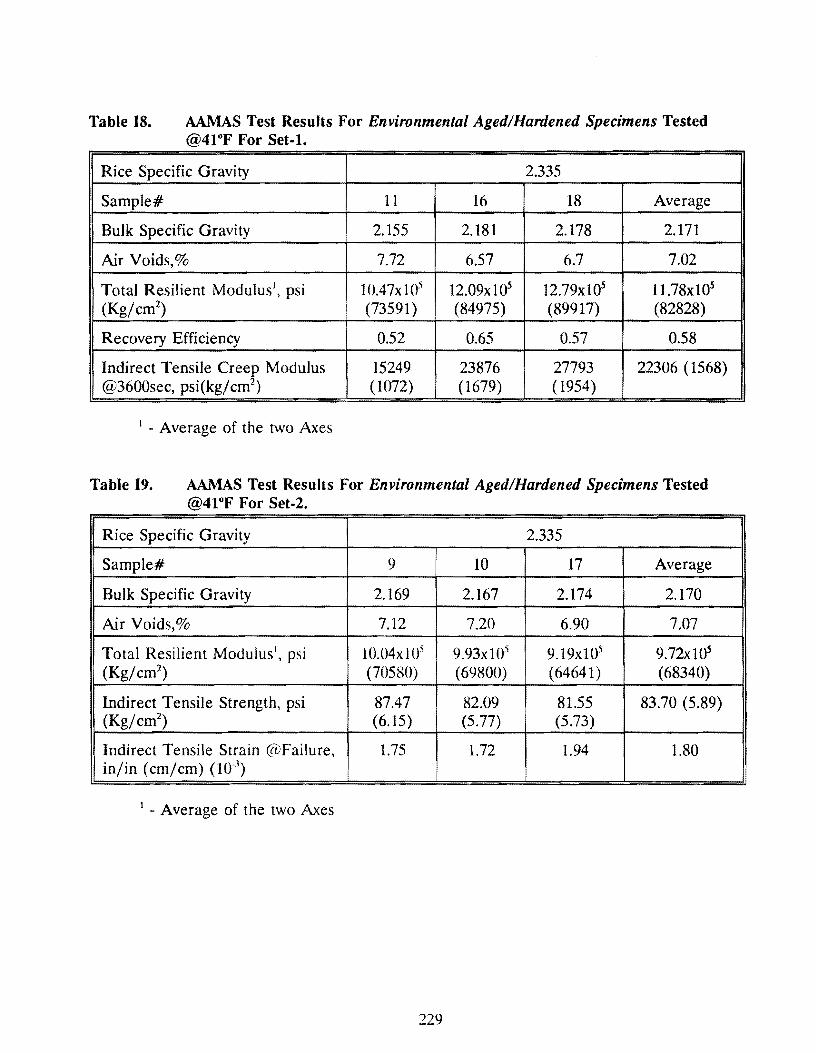
Table 18. AAMAS Test Results For Environmental Aged/Hardened Specimens Tested @41°F For Set-1.
Rice Specific Gravity 2.335
Sample# 11 16 18 Average
Bulk Specific Gravity 2.155 2.181 2.178 2.171
Air Voids,% 7.72 6.57 6.7 7.02
Total Resilient Modulus1, psi 10.47x10⁵ 12.09x10⁵ 12.79x10⁵ 11.78x10⁵
(Kg/cm2) (73591) (84975) (89917) (82828)
Recovery Efficiency 0.52 0.65 0.57 0.58
Indirect Tensile Creep Modulus 15249 23876 27793 22306 (1568) @3600sec, psi(kg/cm2
) (1072) (1679) (1954)
1 - Average of the two Axes
Table 19. AAMAS Test Results For Environmental Aged/Hardened Specimens Tested @4l°F For Set-2.
Rice Specific Gravity 2.335
Sample# 9 10 17 Average
Bulk Specific Gravity 2.169 2.167 2.174 2.170
Air Voids,% 7.12 7.20 6.90 7.07
Total Resilient Modulus', psi 10.04xl05 9.93x10⁵ 9. l 9x10⁵ 9.72xla5 (Kg/cm2
) (70580) (69800) (64641) (68340)
Indirect Tensile Strength, psi 87.47 82.09 81.55 83.70 (5.89) (Kg/cm2
) (6.15) (5.77) (5.73)
Indirect Tensile Strain @Failure, 1.75 1.72 1.94 1.80 in/in (cm/cm) (10'3)
1 - Average of the two Axes
229
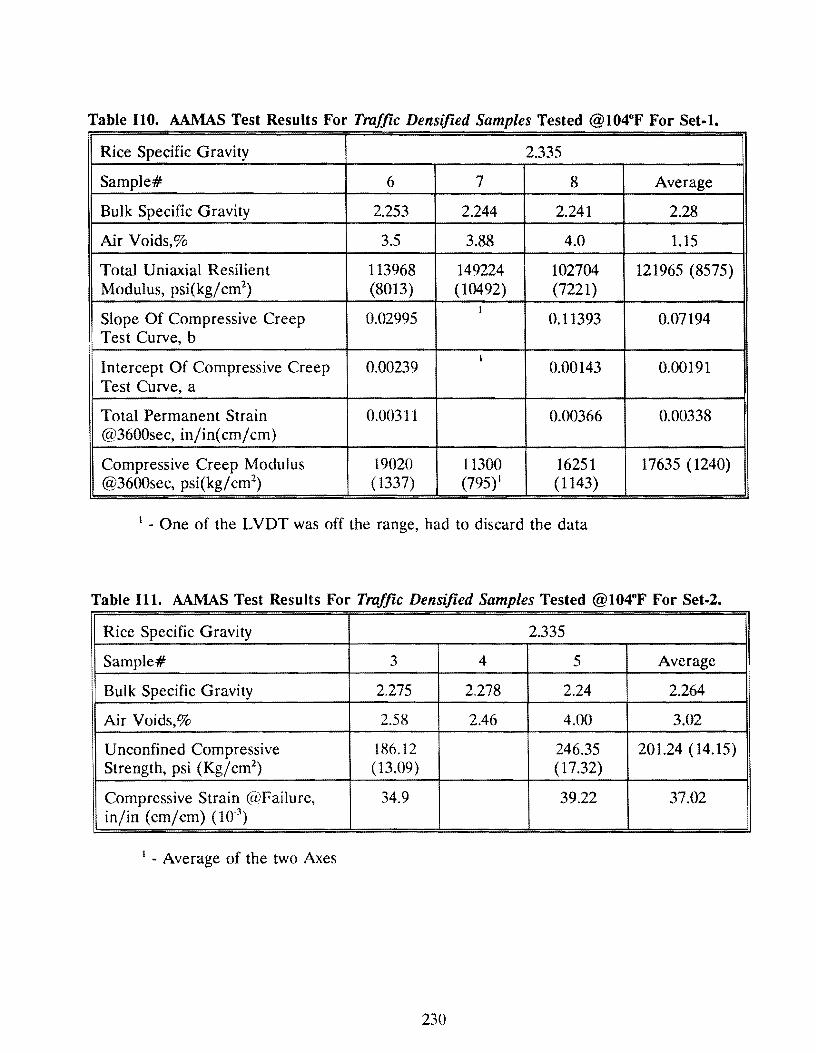
Table 110. AAMAS Test Results For Traffic Densified Samples Tested @104°F For Set-1.
Rice Specific Gravity 2.335
Sample# 6 7 8 Average
Bulk Specific Gravity 2.253 2.244 2.241 2.28
Air Voids,% 3.5 3.88 4.0 1.15
Total Uniaxial Resilient 113968 149224 102704 121965 (8575) Modulus, psi(kg/ cm2
) (8013) (10492) (7221)
Slope Of Compressive Creep 0.02995 I
0.11393 0.07194 Test Curve, b
Intercept Of Compressive Creep 0.00239 I
0.00143 0.00191 Test Curve, a
Total Permanent Strain 0.00311 0.00366 0.00338 @3600sec, in/in(cm/cm)
Compressive Creep Modulus 19020 11300 16251 17635 (1240) @3600sec, psi(kg/ cm2
) ( 1337) (795) 1 (1143)
1 - One of the LVDT was off the range, had to discard the data
Table Ill. AA.MAS Test Results For Traffic Densified Samples Tested @104°F For Set-2.
Rice Specific Gravity 2.335
Sample# 3 4 5 Average
Bulk Specific Gravity 2.275 2.278 2.24 2.264
Air Voids,% 2.58 2.46 4.00 3.02
Unconfined Compressive 186.12 246.35 201.24 (14.15) Strength, psi (Kg/cm2
) (13.09) (17.32)
Compressive Strain @Failure, 34.9 39.22 37.02 in/in (cm/cm) 00-1
)
1 - Average of the two Axes
230
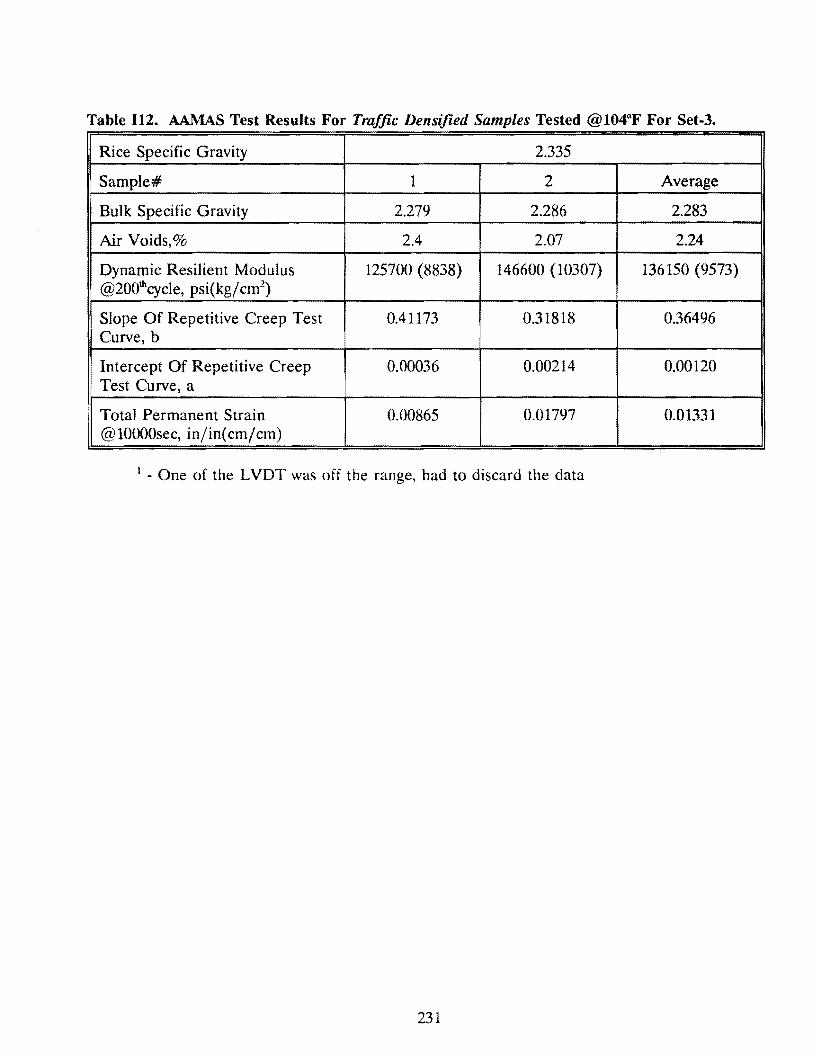
Table 112. AAMAS Test Results For Traffic Densified Samples Tested @104°F For Set-3.
Rice Specific Gravity 2.335
1 Sample# 1 2 Average
Bulk Specific Gravity 2.279 2.286 2.283
Air Voids,% 2.4 2.07 2.24
Dynamic Resilient Modulus 125700 (8838) 146600 (10307) 136150 (9573) @200thcycle, psi(kg/ cm2
)
Slope Of Repetitive Creep Test 0.41173 0.31818 0.36496 Curve, b
Intercept Of Repetitive Creep 0.00036 0.00214 0.00120 Test Curve, a
Total Permanent Strain 0.00865 0.01797 0.01331 @lOOOOsec, in/in(cm/cm)
1 - One of the L VDT was off the range, had to discard the data
231

Appendix J
Description of AAMAS and
Preparation of Samples for Testing
233

Performance Evaluation
The performance of the mixes that were designed in chapter 3 are evaluated by using
Asphalt-Aggregate Mixture Analysis System (AAMAS). AAMAS was developed for
designing and evaluating the performance of the asphalt concrete mixes in the laboratory.
Two mix design methods namely Hveem and Marshall, with some modifications are
commonly used throughout the United States. The design philosophies behind these
methodologies are reasonable and served well over the past few decades. These mix design
methods were developed several years ago for the traffic volumes and tire pressures
representing that period. High traffic volumes and tire pressures increased the need for a
system that can not only provide mix design but also evaluate the performance of the
mixtures that are designed. AAMAS was developed based on the engineering properties
of the mixtures that relate to the performance of the mixes simulating the field conditions.
AAMAS can be broadly divided into two parts. First is the mixture design and the second
is the analysis of the mix with the test procedures and evaluating the mix using distress
mechanisms. One of the advantages of the AAMAS is that it provides the flexibility of
designing the mix using the mix design prescribed in AAMAS or mix design adopted by the
agency or the department. The performance evaluation of the mixtures is briefly explained
in the following lines.
The evaluation is done by considering performance or the resistance for various forms of
distresses the mix encounters in the pavement structure over the design period. There are
several analytical models and procedures for designing or evaluating flexible pavements.
Most of the models use elastic layer theory or finite element analysis for calculating stresses,
strains and deflections etc., for estimating the life of the pavement. After careful evaluation
of all these analytical models four forms of distresses were considered for the evaluation of
the mixes in conjunction with the pavement structure as a whole. They are fatigue cracking,
rutting or permanent deformation, thermal cracking or low temperature cracking and
moisture damage. Secondary consideration is given to disintegration, such as ravelling and
skid resistance.
235
The input parameters or properties of the mixes that are considered for evaluation using
analytical models are measured by laboratory testing. Five tests were selected for measuring
these engineering properties. They are diametral resilient modulus, indirect tensile strength
test, gyratory shear strength test and the indirect tensile and uniaxial unconfined
compression test. Besides these tests repetitive creep test is added at the request of FHWA
officials.
Testing Program
AAMAS testing program can be divided into three distinctive steps.
• Preparation of the samples
• Preconditioning of the samples
• Testing of the samples
Each of these steps are explained in the following pages. Nine different mixes were
considered for this testing program and are listed below. Of these three are dense graded
mixes and six are crumb rubber modified mixes designed using Tex-232-F.
(1) Type-D control mix (control)
(2) 0.5% Fine rubber by weight of aggregate in control mix (DGF)
(3) 0.5% Coarse rubber by weight of aggregate in control mix (DGC)
(4) 10% Fine rubber by weight of asphalt content - Wet Method (10%FW)
(5) 18% Fine rubber by weight of asphalt content - Wet Method (18%FW)
(6) 10% Coarse rubber by weight of asphalt content - Wet Method (10%CW)
(7) 18% Coarse rubber by weight of asphalt content - Wet Method (18%CW)
(8) 18% Fine rubber by weight of asphalt content - Dry Method (18%FD)
(9) 18% Coarse rubber by weight of asphalt content - Dry Method (18%CW)
Preparation Of The Samples
For the mixes described above, final gradations and optimum asphalt contents were
determined in chapter 3 and are used for the preparation of the samples. For each of the
236
mixes described above, twenty seven samples were fabricated for testing. Eighteen of these
samples are 4" in diameter and 2" in height. Nine samples are 4" in diameter and 4" in
height. The step by step procedures for fabrication of these samples are described below.
(1). Blending of these of these mixes was done in accordance with Test method Tex-205-F
for dense graded mixes and necessary modifications for mixing were done for CRM mixes
in accordance with Tex-232-F.
(2). After mixing, these mixes were kept in a forced draft oven at approximately 275°F
for three hours before molding. This is done to simulate the plant hardening of asphalt and
absorption of the asphalt by the aggregates.
(3). Fabrication of the samples was done using a California Kneading compactor. This is
because 4 inch samples cannot be molded using Texas gyratory compactor and also because
of the nature of the mixes that were considered. It is believed that for open graded mixes,
compacting using kneading compactor would simulate the field conditions better than Texas
gyratory compactor and Marshall hammer.
(4) All the 2" samples were molded for an air void content of 5 to 8% to simulate the initial
condition of the mix immediately after placing in the field. All 2" samples are compacted
in a single lift. After compacting the samples are left in the mold for two hours to avoid
any rebound of the rubber particles. The target air void content was achieved by trial and
error method. For all the mixes 20 tamps @250 psi were applied to accomplish a semi
compacted condition so that mix will not be unduly disturbed when the full load is applied.
The compaction effort required to achieve 5 to 8% air voids are given in table J.1.
(5). All 4 inch are molded for air voids at refusal. Due to the unavailability of the
equipment prescribed in the AAMAS for molding refusal samples in AAMAS was not
followed. Due to this it was decided to use the California kneading compactor to mold the
refusal samples. A mix which has air voids between 5 to 8% immediately after placing and
compacting the mix, due to the wheel loads the mix densifies and reaches air voids of
approximately 3%. This reduction in air voids is called as rutting. A mix reaches air voids
less than or equal to 3% then the said to be at the refusal. So it was decided to mold all
the refusal to less than or equal to 3% air voids. Compaction energies required to achieve
the refusal state are approximately same for control, DGF and 18% FD. Compaction
energy @refusal is the same for all the wet mixes. Coarse rubber when added dry, required
237
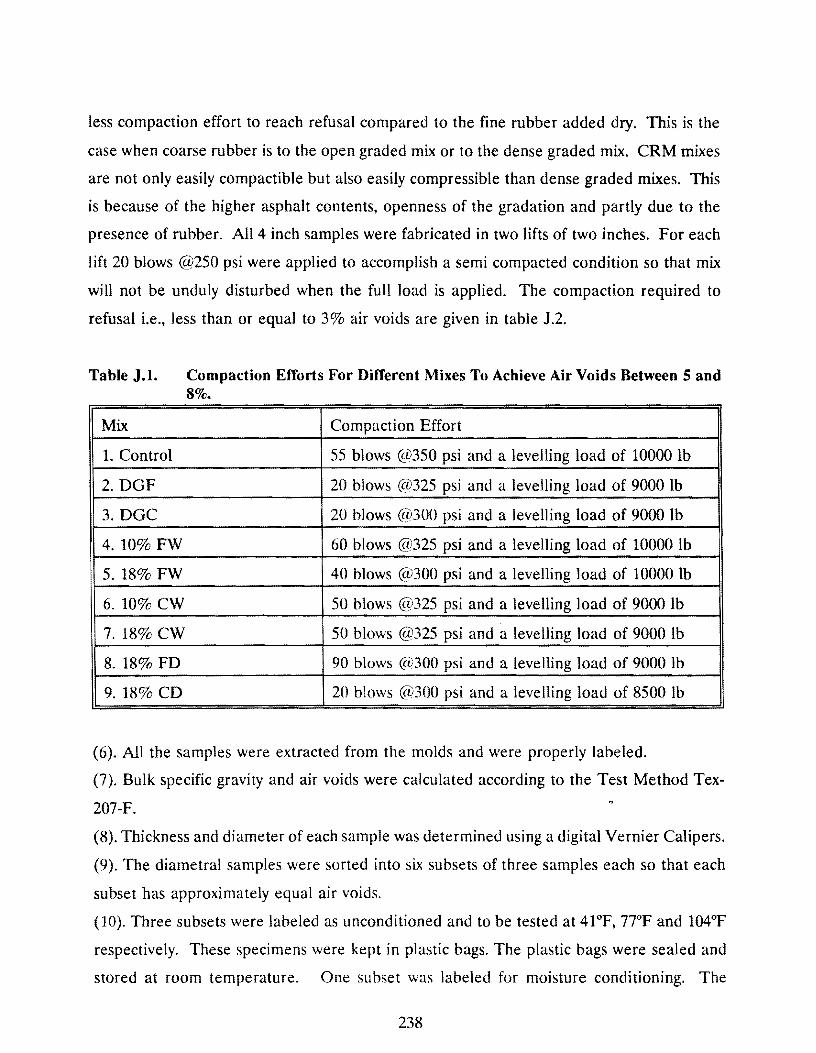
less compaction effort to reach refusal compared to the fine rubber added dry. This is the
case when coarse rubber is to the open graded mix or to the dense graded mix. CRM mixes
are not only easily compactible but also easily compressible than dense graded mixes. This
is because of the higher asphalt contents, openness of the gradation and partly due to the
presence of rubber. All 4 inch samples were fabricated in two lifts of two inches. For each
lift 20 blows @250 psi were applied to accomplish a semi compacted condition so that mix
will not be unduly disturbed when the full load is applied. The compaction required to
refusal i.e., less than or equal to 3% air voids are given in table J.2.
Table J.1.
Mix
1. Control
2. DGF
3. DGC
4. 10% FW
5. 18% FW
6. 10% cw 7. 18% cw 8. 18% FD
9. 18% CD
Compaction Efforts For Different Mixes To Achieve Air Voids Between 5 and 8%.
Compaction Effort
55 blows @350 psi and a levelling load of 10000 lb
20 blows @325 psi and a levelling load of 9000 lb
20 blows @300 psi and a levelling load of 9000 lb
60 blows @325 psi and a levelling load of 10000 lb
40 blows @300 psi and a levelling load of 10000 lb
50 blows @325 psi and a levelling load of 9000 lb
50 blows @325 psi and a levelling load of 9000 lb
90 blows @300 psi and a levelling load of 9000 lb
20 blows @300 psi and a levelling load of 8500 lb
(6). All the samples were extracted from the molds and were properly labeled.
(7). Bulk specific gravity and air voids were calculated according to the Test Method Tex-
207-F.
(8). Thickness and diameter of each sample was determined using a digital Vernier Calipers.
(9). The diametral samples were sorted into six subsets of three samples each so that each
subset has approximately equal air voids.
(10). Three subsets were labeled as unconditioned and to be tested at 41°F, 77°F and 104°F
respectively. These specimens were kept in plastic bags. The plastic bags were sealed and
stored at room temperature. One subset was labeled for moisture conditioning. The
238
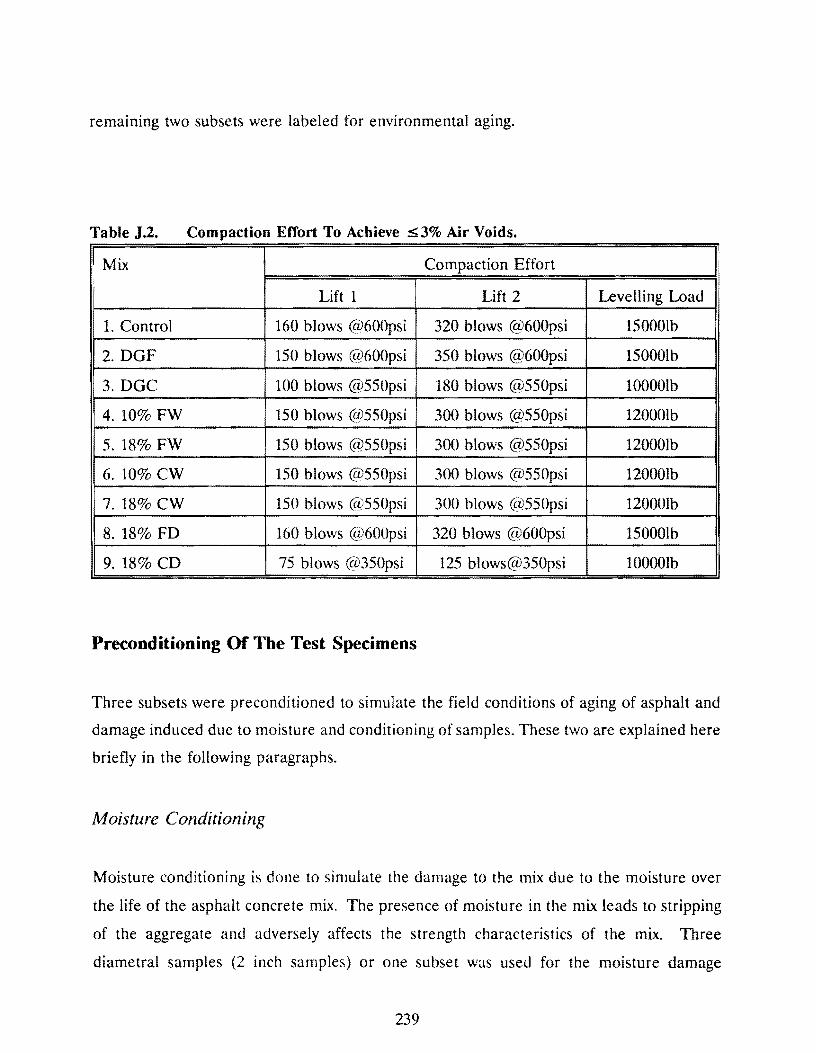
remaining two subsets were labeled for environmental aging.
Table J.2. Compaction Effort To Achieve ~3% Air Voids.
Mix Compaction Effort
Lift 1 Lift 2 Levelling Load
1. Control 160 blows @600psi 320 blows @600psi 15000lb
2. DGF 150 blows @600psi 350 blows @600psi 15000lb
3. DGC 100 blows @550psi 180 blows @550psi lOOOOlb
4. 10% FW 150 blows @550psi 300 blows @550psi 12000lb
5. 18% FW 150 blows @550psi 300 blows @550psi 12000lb
6. 10% cw 150 blows @550psi 300 blows @550psi 12000lb
7. 18% cw 150 blows @550psi 300 blows @550psi 12000lb
8. 18% FD 160 blows @600psi 320 blows @600psi 15000lb
9. 18% CD 75 blows @350psi 125 blows@350psi 10000lb
Preconditioning Of The Test Specimens
Three subsets were preconditioned to simulate the field conditions of aging of asphalt and
damage induced due to moisture and conditioning of samples. These two are explained here
briefly in the following paragraphs.
Moisture Conditioning
Moisture conditioning is done to simulate the damage to the mix due to the moisture over
the life of the asphalt concrete mix. The presence of moisture in the mix leads to stripping
of the aggregate and adversely affects the strength characteristics of the mix. Three
diametral samples (2 inch samples) or one subset was used for the moisture damage
239
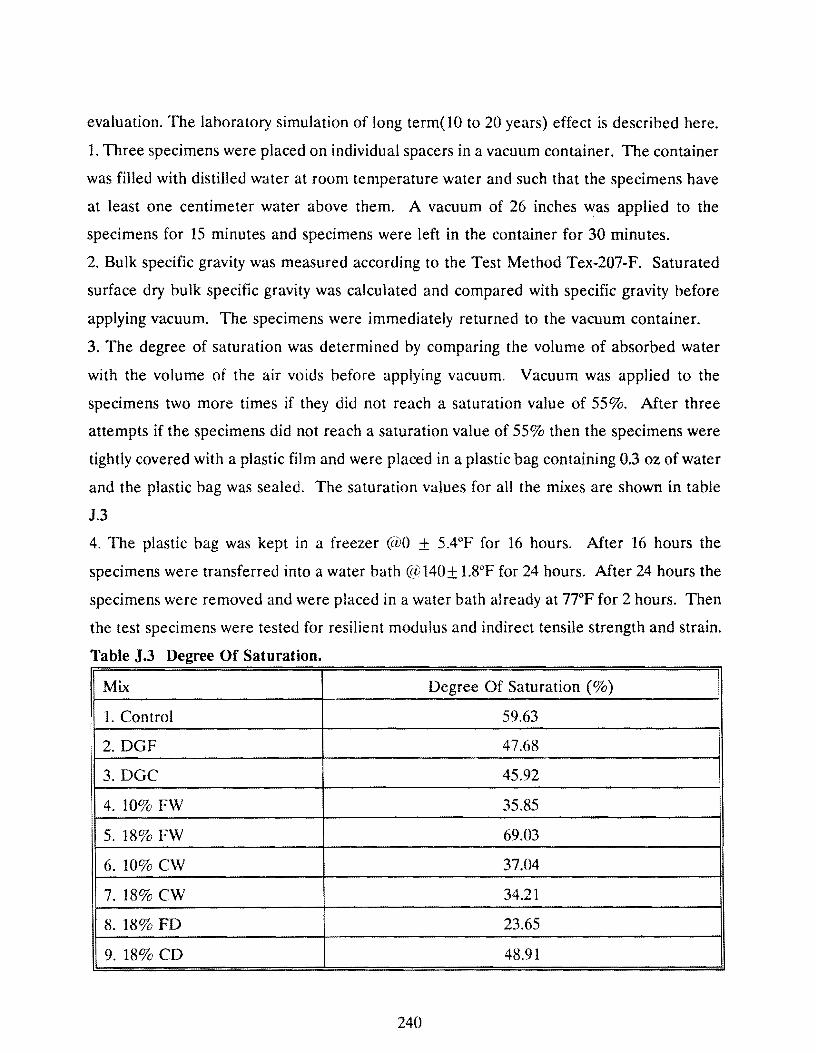
evaluation. The laboratory simulation of long term(lO to 20 years) effect is described here.
1. Three specimens were placed on individual spacers in a vacuum container. The container
was filled with distilled water at room temperature water and such that the specimens have
at least one centimeter water above them. A vacuum of 26 inches was applied to the
specimens for 15 minutes and specimens were left in the container for 30 minutes.
2. Bulk specific gravity was measured according to the Test Method Tex-207-F. Saturated
surface dry bulk specific gravity was calculated and compared with specific gravity before
applying vacuum. The specimens were immediately returned to the vacuum container.
3. The degree of saturation was determined by comparing the volume of absorbed water
with the volume of the air voids before applying vacuum. Vacuum was applied to the
specimens two more times if they did not reach a saturation value of 55%. After three
attempts if the specimens did not reach a saturation value of 55% then the specimens were
tightly covered with a plastic film and were placed in a plastic bag containing 0.3 oz of water
and the plastic bag was sealed. The saturation values for all the mixes are shown in table
J.3
4. The plastic bag was kept in a freezer @O ± 5.4°F for 16 hours. After 16 hours the
specimens were transferred into a water bath @140± l.8°F for 24 hours. After 24 hours the
specimens were removed and were placed in a water bath already at 77°F for 2 hours. Then
the test specimens were tested for resilient modulus and indirect tensile strength and strain.
Table J.3 Degree Of Saturation. !
Mix Degree Of Saturation (%)
: 1. Control 59.63 i
2. DGF 47.68
3. DGC 45.92
4. 10% FW 35.85
5. 18% FW 69.03
6. 10% cw 37.04
7. 18% cw 34.21
8. 18% FD 23.65
9. 18% CD 48.91
240
Temperature Conditioning (Accelerated Aging)
Asphaltic concrete mixture properties are time temperature dependent. Asphalt reacts with
atmospheric oxygen which stiffens or hardens the asphalt. This is a very slow process, but
as temperature increases the reaction rate increases exponentially. Aging of the asphalt
alters the physical properties of the mix considerably. However at lower temperatures if the
mix is too stiff the stresses induced due to temperature differential will be released through
the development of the crack. This condition is undesirable. Two subsets were temperature
conditioned. The laboratory method for simulating long term environmental and
temperature loading is described below.
Two subsets of three diametral specimens were placed in the forced draft oven set at
temperature of 140°F. These specimens were heated for approximately 48 hours. After
initial aging, the temperature of the forced draft oven was elevated to 225°F. These
specimens were aged for 5 more days. After 5 days six specimens were placed in
temperature cabinet set at temperature 41°F and were stored for 12 hours prior to testing.
Testing of the Samples
Five tests were selected as tools for measuring the properties of the mix. The conditioned
and unconditioned samples were tested as follows
Unconditioned Diametral Specimens
Three sets of three specimens each were tested at three different temperatures. They
are 41°F, 77°F, and 104°F. These specimens were kept at their respective test temperatures
12 hours prior to the testing. Resilient modulus test (a nondestructive test) was performed
on these specimens. Resilient Modulus test was conducted according to the Standard Test
Method ASTM 04123. Total resilient modulus is the average of the two axes perpendicular
to each other of the same sample. Indirect tensile test was conducted on the axis which was
found to have higher resilient deformation. Indirect tensile test was conducted on the same
241
specimens at their respective temperatures at a loading rate of 2 in/min. All the values of
these two tests were tabulated in Appendixes A through I and results were discussed in
Chapter 4.
Moisture Conditioned Specimens
Resilient modulus was performed on the samples that were moisture conditioned as
described previously. This test was performed according to standard test method ASTM
04123 at test temperature 77°F. Total resilient modulus and total and instantaneous
resilient deformations were recorded. The indirect tensile test was conducted as described
previously. All the results were tabulated in Appendix A through I and the results were
discussed in chapter 4. Moisture damage evaluation was done by comparing indirect tensile
strains before and after moisture conditioning.
Temperature Conditioned Samples
Resilient modulus and Indirect tension were conducted according to the standard procedures
described previously for the first subset of temperature conditioned samples. These tests
were performed at 41°F. The results were tabulated in appendix and are discussed in
chapter 4. For the second subset, a indirect tensile creep was conducted at 41°F. The scope
of this test is to find the creep recovery efficiency of the specimens after a fixed duration
after applying the static load. The creep recovery efficiency values were tabulated and
discussed in chapter 4.
Traffic Densified Specimens
Three subsets of traffic densified samples were tested. Unconfined compression test was
performed on subset one at test temperature 104°F. The unconfined compressive strength
and compressive strain at failure were recorded and tabulated. These results are discussed
in chapter 4. A uniaxial resilient modulus test was performed on the specimens in subset
two at 104°F. After determining the resilient modulus, a uniaxial unconfined compressive
242
static creep test was performed at 104°F. A stress level of 60 psi was used for all the mixes.
Creep stiffness and creep strain were calculated at various time intervals during the test.
This test is valuable tool for evaluating the rutting or permanent deformation characteristics
of the mix. The results are tabulated and discussed in detail in chapter 4. A dynamic
loading creep test was conducted on the third subset. This test was also performed at 104°F.
In order to compare the results dynamic creep test was also performed at stress level of 60
psi. All the results are tabulated in Appendix A through I. A detailed discussion and
analysis is done in chapter 4.
243