Embed Size (px)
Citation preview

OAK RIDGE NATIONAL LABORATORY , ,-- - < , - ' a 7. *: POST OFFICE BOX 2038 1; : . - - , .
MANAGED BY M h M l N MARIElTA E N E l G Y S I S l E H S . INC. - .-- OAK RIDGE. TENNESSEE 37831
FOR THE U.S. DEPARTMEIIT OF EWEROI
April 22, 1994
Dr. W. k Williams EM-421 Trwion n: Building Department of Energy Washington, D. C 20585-0002
Dear Dr. Williams:
In a letter to you dated August 18, 1993, a summary of the initial radiological survey was provided with only limited inionnation regarding mncentratiom in soil samples and radiation measurements inside the house. Since then, all of the samples from the initial survey have been analyzed and additional samples have been collected and anal- The reauits have been provided lo y o u ' d D. G. Adler informally as they became available 'Ihir letter contains all the 'as-found" survey results produced by Oak Ridge National Laboratory. lXs letter does not contain survey results venfylng post-remedial action surveys. Independent verifkation sutvey results will be provided under a separate cover.
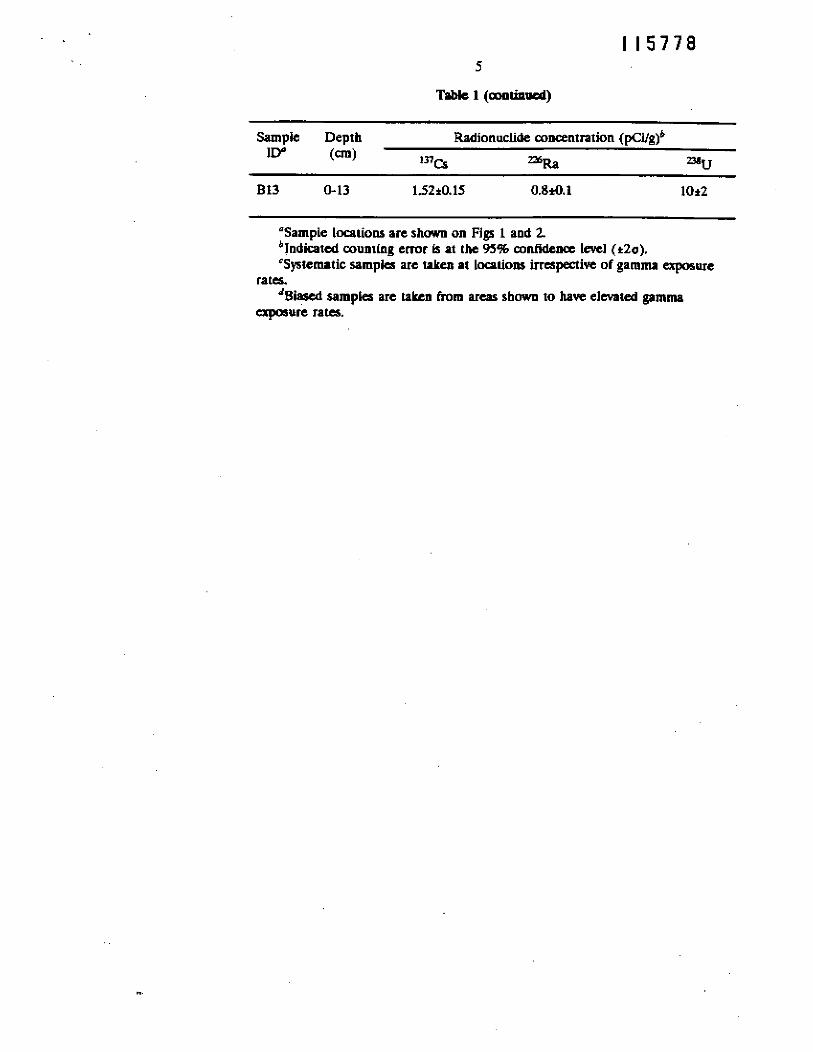
Table 1 gives the aoalytiical results of all soil samples (bded and systematic). Biased samples were either oollected because elevated radiation above backgmund was detected, or taken in areas suspected of contamination based on experience at similar sites. Systematic samples were mllected to provide data on the overall radiological condition of the property in areas where only background radiation was detected. The systematic data is useful in bounding areas of horm contamination and providing a bask to collect additional samples if needed. The corresponding sample Iocatiohg are shown on Fig. 1 for the outside portion of the p r o w , and Fig. 2 for the crawl space oE the house. A total of 62 soil samples representing 45 different locations was collected . The most significant activity was found at B004, with the highest activity of 14,000 pCig p8U. The vast majority oE the
at that location was removed by sampling, and since then many samplei have been collected near BOO4 to ensure the extent of the cantamination is known.
Other results from Table 1 require further explanation. Location 8006 contained an electrical switch with a radium bead for illumination. Apparently some of the radium had leaked from the radium bead into the soil. The switch was removed Eor disposal at Oak Ridge National Laboratory. Location BOO5 sbowed a 13'G concentration of approximately 6 pCi/g, which k probably attributabk to atmospheric fallout from nuclear wea ns testing. BOO5 is located near a roof downspout where K" rainwater may have concentrated the ' Cs from the roof into a small area where the cesium adhered to soil partick The '"Cs values in all the other samples are more representative of general fallout Neither the radioactivity at B005 or B006 can be attributed to operations at the Eomer Alba CraEt EaciliQ. Slightly elevated concentrations of can also be found along the driveway (BOO3 and SO1 1~ through S015), while =U under the driveway is detectable but quite low. Samples at locations B001,

Dr. W. k Williams Page 2 April 22, 1994
BOM and SO18 show elevated "U near the porch. Figure 2 sborvr numemu smal l isolated spots of % in the crawl space of the house, mostly removed by sampling (Boll through B013 and spots near the fireplace foundation).
Wide the h m e the contamhation w a restricted to the part of the h o w tbat appearad to b e the original s tw tu rc Figure 3 s k the arca~ wbut was b u d in the den, den, Figure 4 detaib the bedroom above the garage The floors in botb thae srur wue tongue and groove blrdwood, with the majority of the % found in the pink. The ladom on tb t figures idwtifiai with T numben were c h a m m i d for alpha ond beta r d i a h n using direct reading irwrunnmtl and were smeared to tat for trpmferable mataminntion. Ibt d t r are given in Tabk 2 The direct measurtmentr are givtn in dpmfl00 cm2, c o r r d for beck@ radiation. Ibe valuer are w ~ y t r v a t k , io that a mmmsioo factor of30 was u s 4 which muma the coat.minstion is uniform wtr a 100 c d are+ although in molt - it was not uniform. -use the contamination war in the flwr cracka in small spots, the muversion factor s W act+ range h 5 to 30, but to be c o ~ ~ k t e n t (and mnrewative), M wsr d The s m t a r smpk mults (all l a than the minimum detectable activity) iadi tad the was indeed faed contaminatioa
The remaining hairk locations where con tamination a found were the restroom awciated with the garage, and tht area uadtr the stairway kading from the garage to the uptaka bkmu The aren &r the stainray was -led ofl by a partition wall in the rrrtmom In both areas there were numerous small s p o ~ only a few =re above Department of Eatrgy guidelines. The m h u m activity f o u d inom s p t (hated on a shell under the. stairway) was approximately 25,000 dWlOO c d . The shownr drain in the restroam a h contained mntamination up to 280 pCdg (sample BOOB). Gamma exporurc rates on the property aa measured witb a pressurid ionization chamber are Listad in Tabk 4.
Again, this data represenis the condition "as found" at the time by Oak Ridge National Laboratory staff. Bechtel National, Inc. has conducted additiond. radiological surveys and initiated remedial actions; thefore, complete information is not provided in tbi letter. Please contact me if you have any comments or questions
Sincerely,
Michael E Murray Measurement Applications
' f l and Development Group
c: D. G. Adler. WE-OR (2) R D. F o b W. D. Cottrell File-Rc

SIA 0-15 0.40&11 1.3tO.l SIB 15-30 0.23t0.07 l.2tO.l
S8
59
S10
Sll
S1Z
S13A S13B
1.6 tas 10 12
3.8 tl.0

1 1 5 7 7 8 4
T W I ( - 1)
Sample Depth Radionuclide mnoentration (pZi/& M (cm)
"Q % =u S22 0-15 0.69 t0.09 1.4tQ1 21 20.5
S23 &I5 034 a.09 0.9 30.1 1.6 30.5
S24 0-15 0.43 a.08 1.24.1 184 .6
SZ5 0-15 0.55 t a l l 1.410.1 1JM.6
S26 0-15 <0.m 1.4t0.1 1.2 45
S27 6 1 5 4 9 0 1.3t0.1 1.3 a.6
S28 0-15 a41 d.07 1.2 i0.1 2 7 tO3
529 &I5 <am 0.8t0.1 0.8 KJJ
S% 0-15 < 0.05 1.1 20.1 1.4 20.6
S31 0-15 <O.W l.0t0.l 2.0 20.5
s32 0-3 <o.m 0.9io.1 1.1 to.6
W b r c d ~ 4
BIA 0-15 a97i0.2 1.44.2 450 ~ I O O BIB 15-30 0.29iO.081 1.2t0.2 223 440
B2A 0-15 0.53iO.08 1.310.1 140t40 B2B 15-30 0.21tO.M 1SAl 66i20
B3A 0-15 1.8510.17 13t0.1 27 i 5 B ~ B IS -30 a43 t0.m IJ t0.1 21 is B4A 0- 15 <27 c4.8 1 4 0 0 0 ~ B4B 15-30 < 1.3 4 . 6 3700t300
B5A 0- 15 5.97M.22 15t0.1 4.7 20.5 B5B 15-2s I57tO. 13 0.9t0.1 22 t0.6
B6A 0-15 0.46 t0.09 24 t2 ZZtl.0 B6B 15-JO 0.20 t0.07 3.9 tQ2 23t1.0
B7A 0-15 0.41 20.08 1.1 t a l 3.4i1.0 B7B 15-30 <O.u) 1.3 t0.1 22t0.6
88 4 . 7 280i30
B9 2541 <O.a 1.1 ial 59tIO
BlOA 20.36 4 1 3 1.44.1 60i5 BlOB 35-51 4.13 1.3*0.1 32 t5
B11 0-3 <a14 25 iO.5 31t3
Sampk Depth Radionudide concentration (pCi/glb ID IW
1% =%a 2%
B13 0-13 152t0.15 0.84.1 lot2
"Sample locations arc shown on Fig 1 and Z blndicated counting ermr K at the 95% mnfidclla W (t20). 'Sysrermtic samples are taken at localions imtpective of gamma arpoanre
rates. d W i sampkr arc taken from areas s b m to have elevated gamma
exposurk rates.

...... -- . . .......
Fig. 1. Sampling locations outside the house at 525 South Main Street, Oxford, Ohio.

L _ _ _ _ _ _ . . _ . _ _ - _ _ _ _ 7 m I L? U
I o CXCAVCTCD,,,-_- I
AREAS O I URAINYIV< I
I
0 I 0 0 1 l I I I I I I
(SMAI.1 ARCA 1 I'X, J.) 2.500-6.000 BCOINS r I INSIDE CllCbVbTCD ARCA
OH LCDGC UNDCR JOIST . 2.500 -._
> 1..
A
B i Ti7'
OQ# BlASLD SAYPLC LOCATION .5#. S.rSfCYAfIC SAYPLC LOCATION
YI
S-y VALULS AUL a p m / l u U ~ r n '
YI b 6 2 5 S. UAIH ST.
I OXTORO, on 0 * 0 0 9 2
Fig. 2. Sampling locations in the crawl spce of the house under the original den.

( IFNEHAIIY CON1'AMINATEI)IN FI.OOH CKAOKS - -
Fig. 3. Radiation/contamination levels in the original den of ihe house.

ORNL-OWG 94-5908
T GENERAL B -? BACKGROUND RANzGE UP TO
3.000 d p m / I O O c m
Fig. 4. Radiatiodwntamination levels in the area a h the garage.
C w W Tr C Ln
z < I
5 3 O *
I '8 T 6 SMEAR LOCATION 'I
4 LOCATIONS MEASURED / 3 . 0 0 0 - t 6 . 5 W d p r n / l 0 0 c r n ' ~ - 1
j Td SMCAR NUMeER
CONlAMINAllON VERY SPOTTY AND SPARSE ON THIS END OF ROOM
! 0 i 5700 d p m / l O O c m ' 8 - 7 1 i
(BEDROOM OVER GARAGE)
!
,
1 I - .B PIC #2
! CLOSET - ! /HALLWAY TO WEST BEDROOM I PIC MEASUREMENT
[' , 1 c CONTAMINATION AREA
1 1 7 LOCAlIOHS MEASURED I 3.000-35.000 dpm/lOOcm:f?-T
CONTAMINATION I N CRACKS (sponu)
EXIT TO GARAGE 525 5. MAIN ST. .
I I OXFORD. OH ! 0 % 0 0 0 2
1 T5
C 6 - 9 1

TAr Beta-gamma Mb Alpha levelc (dpd100 cm2) (dpd100 cm')
Direct Transferable Diract Transferable
1 16500 sMDA 21 sMDA
'Locations are shown on Figs. 3 and 4. 'Beta-gamma MDA = 100 dpmlfOO cm'. 'Alpha MDA = 10 dpd100 c d .

Tabk 3. Appliablt gmidtlina for protcnion against radialion (Limits for unmnrroUcd areas)
Mode a1 arpwure Exposure conditions Guideline value
Gamma radiation Indoor gamma radiation level 20 pRhV' ( a m background)
Total residual surface =u, ='U, U-natural (alpha wntaminatiod emitten)
or Beta-gamma ernitten'
Mndmum 15,000 dpWlOO cm' 5,000 dpm/lM) cm'
Rcmovrble 1,000 dp#iOO cm2
Beta-%amma dc6e Surface dose rate averaged 0.2D mradih razes over nor more than 1 m2
Maximum doat rate in any 1.0 rnradh area
Radionuclide mn- centrations in soil (generic)
Deriwd concentrations
Maximum permissible mn- 5 pCUg avenged over the centration of the iollowing fiat 15 cm of soil below radionudida in soil above the surfacc; IS F i g backgmund &Is, averaged when averaged over over a 100-m' area 15-cmlhick soil layen
%a more than i5 cm below % the surface =Ill
Site s p e d i &
"The 20 rrWh shall m m p i y w ~ h the barr dose hi^ (100 mrcmyear) whm an appqmze-usc -ria is considc~.
bDOE lurfarr cnntaminatk guidciinn arc mmatent antb lYRC GuideIincJ [a DccaUmnhlim a? Fucilidu a d Equipvnr Aior ro & I r a fm Llnmukd Usc w Tmninrrrion 4 Licrmc~ la &-Pmduc: S m e . w S p r i d NwIrm Mama!. May 1987.
~ ~ c t a - ~ a k emitten ( ra t i iuc l ih mth decay moder 0 t h than alpha emissic4 or spIranmllr m) m c n l %r. = ~ a . %. =Ac IUI. I?. '%I. Iz1. ~ - - . - ~ ~ . - - . ~~ . .
d 6 ~ ~ g u i d c l i r r s far uranium arc dcmdd k a sircapeflfic barir Guideliag of M pCUg h m been a m at other NSRAP atca Swm.- R. E Rodn'gucr cr al.. Redu offhe Rodidqicd S w q or ihc T F I I of T o d ImndflL Tommu& Nru Yor* (TNYOOI), ORNIJUASA-WIZ Manin Ma&m Energy System 11% Oak Ridge NaU Lab., Oaobtr 1992
SOUWLI: Adapted from US. Depanmcnt d Emrgg, DOE Order SJOOJ. Aprd 1990, and US. Depan. mcnr at Energy. Guidclinwfw R L S ~ R a a b ~ % ~ M d af F e Udkd Sues R e d i d Acrion Prqnvn d Remac S u p b FacWes M ~ 1 1 p m u Ifogmm Sirrr. Rev. 2. March 1987.

Location' PIC (CJUh) at 1 meter
P1 9
P2 8
P3 7
P4 10
PS 10
P6 10
'Locations are shown on Figs. 1, 3 and 4.

Table5. Background radiation and ranges of radionuclide mncentrationa for Ohio
Type of radiation measurement or sample
Radiation level or radionudidc concenuation
Ave* extend gamma exposun rate at 1 m above the gmund surf= ( W P
Range of e x ~ m a l gamma expolure ntcs at 1 rn above the ground surflce O&hP
C o x a n m h ~ l g ~ for r a d i a in surfre &I (pCVgP
-a . 2327% =mu
aRuuttadWmaswmuu Y*ud counting om! is at the 95% m f i bvel I* M.
Source: T. E. Myrick. B. A. Buwh and F. F. Fhywcod, 3fme B~~roundROm.011~onLmLc Rc$vlu ofM-emu T&n During 1975-19D. ORNtlTM-7343, hlmin Marieua Emgy ~ ~ n u n r . ' Inc, Cak Rage NPrl. Lab.. Novtmba 1981.

OAK RIDGE NATIONAL LABORATORY m n OFFICE BOX 2m3 OAK RIDGE. TENNESSEE 37831
April 22, 1994
Dr. W. A. William EM-421 Trevion II Building Department of Energy Washington, D. C. #)585M)[12
Dear Dr. Williams:
In a letter to you dated August 18, 1993, a summary o i the initial radiological sulvey was prwided with only limited information regarding =U concentrations in soil samples and radiation measurements inside the house. S i then, all of the samples from tbe initial survqr have been a n a w and additional samples have been c o k k d and a d p s i . The results have bew provided to you a d D. G. Adkr informally as they btcame available. This letter antaim all the "as-foundn survey results produced by Oak Ridge National Laboratory. Tbir letter does not contain survey results venfylng post-remedial action surveys. Independent verificaticm survey results will be provided under a separate cover.
Table 1 gives the analytii results of aU soil sampler (biased and gygtematic). B W samples were either collected because elevated radiation above bafkground was detected, or taken in areas suspected of contamination based on experience at similar'sitea Systematic samples were wllected to provide data on the overall radiorogical wnditioo of the property in areas where only background radiation was detected. The systematic data is usehl in bounding area of known contamination and providing a basii to coUect additional samples if needed. The corresponding sample locations are shown on Fig. 1 for the outside portion of the property, and Fi. 2 for the crawl space or the house. A total of 62 soil samples representing 45 different locatiom was wllected . The mart signfiant activity was found at B004, with the highest activity of 14,000 pCi/g The vast majority of the 238U at that location was removed by sampling, and since then many samples havebeen collected near BOO4 to ensure the extent of the contamination is known.
Other results hmTable 1 require further explanation. Location B006motakd an electrical switch with a radium bead for illumination. Apparently some of the radium had leaked from the radium bead into the soiL The switch was removed for disposal at Oak Rage National Laboratory. Location BOO5 showed a '% concentration of approximately 6 Vg, which is probably attributable to atmtgpheric fallout from nuciear wea ns testing. B005 is located near a roof downspout where P" rainwater may have concentrated the ' 'Cs h m the roof into a small area where the cesium adhered to soil particles. The values in all the other samples are more representative of general fallout. Neither the radioactivity at B005 or HME can be attributed to operations at the former Alba Craft facility. Slightly elwated concentrations of *U can also be found along the driveway (B003 and SO11 through SOIS), while =U under the driveway is detectable but quite low. Samples at locations B001.

Dr. W. k Williams Page 2 April 22, 1994
B002, and SO18 show elevated MU near the porch. Figure 2 show numerous small isolated s p t s of in the crawl space of the house, mostly removtd by sampling (Boll through 3013 and spots near the tireplaw foundation).
Inside the how the mntnminatian w restrided to the part of the b o w that appeared to be tbe original stru4ure. Figure 3 slmw the a m whcn w found in the &a, d Figure 4 detaih the badroom above the garage. The tbm in both these arear wm toague and groove hardrvood, witb the majority d the -U E d in the jointr. The on the 6- identified with T numbers were cboracterizd for alpba and beta rdbtioo llling dircEt read in^ htrumentr and were smursd to test for tmmfcrabk m n ~ t i w . Ibe multr are g h in T a b k 2 ?he dkx4 mesrurements are given in dpmllOO an2, d for background radiation The valuer are mnrervatiw, in that a mmcnion factor of 30 was urcd, which asWnes the antamination is uniform over a 100 an2 ares, although in mnst cases it wm aot d o r m . Because the umtamination was in the le m k s in amall spts, the cowemion factor h d d actually mge from 5 to 30, but to be cornistent ( a d comemathe), 30 was ud. 'Zbe smear sample results (all lear than the minimum detectable activity) iodicatd the WBI indeed &xed motamination.
'Zbe reniaining i m i locations where contprmnatlon . . war Sound were the restroom asmiatad witb
the garage, and the ara under the stairway Leading born the garage to tk uptairs bedroom. The a m under the rtaimay wsl sealed off by a @tion wall in tbe restroom In both areas there were numerous smaU spots; only a few wcrc above Department of Eatrgy p i d e l i The h u m &ty bund in one spot (located on a shelf under the s t a m ) war appmhately 25,000 dpmnOO cm2. Tbe shower drain in the -room a h contained mntaminatian up to 280 pCdg (ample BOOB). Gamma aparure rates m the property as measured with a p r r s r d ionization chamber are listed in Table 4.
Again, this data represents the condition 'as foundm at the time by Oak Ridge National Laboratory st& Bechtel National, Ioc. has wducted addi t id radiological s q and initiated remedial actions; therefore, mmplete information is not provided in this letter. Please amtact me if you have any comments or quatiom
Sincerely,
Michael E Murray Measurement Applications
. +H' and Developm&it Group
c: D. G. Adler, DOE-OR (2) W. D. CottreU
R D. Foley File-Rc

Sampk Depth Radionuclide concentration (pcilgy ID" ('=w '"a =%a ZYv
azo 4.06
c1.1
0.51 All

Sample Depth Radionuclide wnmmtion (pCi/gp M Icm) ' 3 b
P6Rp =u
BSA BSB
BlOA BlOB
B l l

Sample Depth Radionnclide mncentration ( p ~ i g y M (m)
i 3 7 ~ % =u B13 &13 152i0.15 0.8t0.1 lot2
'Sample locations are s b m MI Figs 1 and Z ' ~ t d counting e m is at tbe 95% a~nfidcact h t (320). 'Syrlemslic samples are ufca m locstionr imrpeUive of gamma exposure
ram. 'BW samples are uktn imm a m shown to have elevated gamma
nparure ram.

...... - . -- ........ GRASSYAYPA I GUAWYAUkA - -- - .-
... 1 .-
I . 7 W A ~ ~ W & V 1.51111 WALKWAY 5-8~1011
... .......... LLI .... J <-l>.BJ
Fig. 1. Sampling locations outside the house at 525 South Main Street, Oxford, Ohio.

(UAS 05 DUf TO NCTURbL IN DISCARDID BRICU5)
1
Fig. 2. Sampling locations in the crawl space oE the house under the original den.

pl VALUES ARC rlyrb'll~klll'
525 S. MAIN sr OXI'ORD. OH
o x m 2
Fig. 3. Radiation/contamination levels in the original den of the house.

ORNL-DWG 9 4 - 5 9 0 8
GENERAL 8-7 BPICKGROUND RAN2E UP TO 3.000 d p m / 1 0 0 c m
CONTAMINATION VERY s p o m AND SPARSE ON THIS END O F ROOM
i
'I 4 HALLWAY TO WEST BEDROOM
4 LOCATIONS MEASURED / 3.000-16 .500 dpm/lOOcm'@-7
1 7 LOCATIONS MEASURED 3.000-35.000 dpm/lOOcm'@-7
CONTAMINAllON IN CRACKS ( s p o r r r )
' EXIT TO ' GARAGE
! I
B PIC MEASUREMENT SMEAR LOCATION
1% SMEAR NUMBER J CONTAMINATION AREA
I 525 5. LixlN ST. OXFORD. OH
0X0002
Fig. 4. Radiation/mntamination levels in the area above the garage.

Alpha leveic (dpm/lOa cm2)
Direct Tramferable Direct Transferable
1 16500 sMDA 21 rMDA
'btions are shown on Figs. 3 and 4. %eta-gamma MDA = 100 dpd100 cm2. 'Alpha MDA = 10 dpd100 cm2.

Table 3. Applicable guidelines for protcctioa ayiert radiation (Limits for uncontmllcd areas)
Mode of expure Expmure mndjtions Guideline value
Gamma radiation Indoor gamma radiation level 20 &'@' (above background)
Total residual surfia =U, w. U-natural (alpha contaminationb emitters)
or Beta-gamma emiltersc
Maximum Avenge Removable
Radionuclidc con- centrations in soil (generic)
Surface dose rate amagar! over not more than I m-
Maximum dcse rate in any 100-cm' area
Madmum penniujbk mn- 5 pCig averaged over the oenrration of the following first 15 on of soil below radionuclides in soil above the surface: 15 pCilg backgrouad lmk, avnaged when a ~ r a g d over over a 1mm2 a m 15sm-thick soil layers
=%a more than IS cm below 9 3 tbe surface =='!TI
Deriwd concenrrations =U Site
*The 20 shall m p l y aith the barR dosc h t (100 m m r ) when an appropriatevsc socnario is mmlatrtd
b D ~ E wrfaa comamination gudcliacs are mMiUcnt Mh NRC W t l k for DrcMmmvrmwr . . a.
f m d h d Rim ur Reteme .hn UnnmicKd Use a Tmninolion 0 J L i C ~ fa &Adyet,
S ~ L ar S d ~ l r m M d . Mw 1937. &k-ga&m c m i t ~ ~ r s (radmnudidtsnlh other than alpha cmWm or spt.4- W)
,pt " ~ r , %a, %, ll~f, IU1, '3 tmI, ' I. d ~ E guide- for uranium arc derkd on a H i t = - s p a k baric GuideliDa 0130 wig have been
amlied at Mhcr FUSRAP silts. S-C: R E. Rodrirma et al, Rendis of L!te Radbkgkd Swvry at rhr i c k of T d a Mpl, TbnowMdq New Y& (TNYIX)]), O R N ~ . W I ~ Manin Marietta Eacrgy S p e w Ior. Oak Ridge NatL Lab., Cuobcr 1992
kumu: Adapted imm U.S. Depanmcnt of Emerw, DOE Order 5400.5, April 1990, ami U.S. Depn- ment of Emrgy, Guidrlinu fa M u a d Radiwcriw Mat& nr F@ Ulilkrd Sim Rmvdinl Anion pmsmm a d RLmOf+ S+ FffdLia Manag%ww RO@WII Siarr, RN. L March 1987.

Location' PIC {CJUh) at 1 meter
P1 9
P2 8
P3 7
P4 10
P5 10
P6 10
'Locatiom are shown on Figs. 1,3 and 4.

Table 5. Background radiation and ranges of radionuclide concentrations for Ohio
Type of radiation mcasurcmcnt Radiation level or or sample radionuclide conccnuation
Average exwnul gamma exposun ntc
at 1 rn above lfie g~wnd surface ( M P
Range of external gamma expDwle at 1 m above che ground surface I W P
Conccnmtlon ~ l g e for radianucliks in surface sail (pCilgF
m R a 232Th =au
Source: T. E. Myrick, 8. A. Bavtn, and F. F. Haywood. Srm Back8round R d k a r i o n M ~ : Resvlu ofMemwemc~~rs T&n D W ~ J 1975-3979,ORNLIIM.7)43. Martin Marietta Energy Sysrtms. Inc.. Oak Ridge Nd. M.. Nowmbu 1981.