Embed Size (px)
Citation preview
Labor productivity, trade and R&D in the Electronics industry Madhuri Saripalle*
(DRAFT VERSION, NOT TO BE QUOTED)
There is a rising concern in the recent times regarding the growth of Indian manufacturing sector
and the sources of productivity growth. Recent trends indicate that growth is highly import
intensive while both total and partial factor productivity growth is concentrated only in few
subsectors. Using the prowess database from 2002-2012, the paper analyses the impact of trade
and research and development on labor productivity in the Indian electronics industry. The paper
finds that trade and R&D per se do not contribute to labor productivity, however, the joint impact
of both these variables is positive and significant, suggesting strong complementarities between
internal R&D and technology transfer in the Indian electronics industry.
*Author can be contacted at [email protected]

Labor productivity, trade and R&D in the Electronics industry
I. Introduction There is a rising concern in the recent times regarding the growth of Indian manufacturing sector
and the sources of productivity growth. Recent trends indicate that growth is highly import
intensive while both total and partial factor productivity growth is concentrated only in few
subsectors. This paper tries to understand the linkages between labor productivity, trade and
research and development in a technology intensive industry, namely the electronics industry in
India.
While total factor productivity has improved overall post 2000, in certain subsectors of
manufacturing both total and partial factors of productivity, namely labor productivity, have
declined. This is especially true for hi-technology sectors like Television, Radio and
communication; accounting, office equipment and computing machinery1. There are also causes
for concern that this sector has become highly import dependent2. These trends motivate one to
explore the causes of declining labor productivity and the impact of increased import
dependence. What is the role of research and development in improving labor productivity?
The objectives of this paper are two-fold. One, it seeks to measure the impact of trade on labor
productivity of the electronics industry in India. Second, the paper analyzes the impact of
research and development on labor productivity. Being knowledge based, electronics industry
requires frequent innovations and in-house research to be globally competitive. There is also an
increasing trend of outsourcing R&D to emerging economies, with the output of research aimed
1 Post 2000, much of the output growth has come from capital (82%) followed by labor (12%) and productivity
(6%). Virmani and Hashim (2011, 2009) 2 The materials import intensity of Indian manufacturing almost doubled between 1998 and 2007 (Goldar, 2013).

at developed country markets. The role of technology transfer becomes very important because
of research collaboration between foreign and domestic firms. Hence, the joint impact of
research and development and imported inputs also becomes important. That is, in-house R&D
may not directly enhance labor productivity but only when combined with imported inputs and
equipment suppliers.
The paper uses the standard production function approach in the growth form to analyse the
impact of labor, capital and knowledge inputs on the growth of firm productivity. Firm level
data for the electronics industry is obtained for a period of 2002-2013 from PROWESS database.
The paper is organized as follows. Section II presents literature review and broad trends,
followed by methodology and data sources in section III. Section IV presents the results of
empirical estimation and section V presents conclusions.
II. Literature review Economic theory argues that there are two channels through which trade influences productivity
growth: exports and imports. Although the causality can be two way, trade theory argues that
firms learn about advanced technologies through exports and adopt them by learning by doing
through imports, technology transfer agreements and licenses. Thus, trade is an important
channel through which technological capabilities of the country can be enhanced. At the same
time it can stunt the growth of domestic industries by making them import-dependent if there is
no conscious effort or policies that support the growth of domestic technology capability
building through entry barriers for selective components and categories. The example of Korean
and Indian electronics industry provides a study in contrast.

Productivity is synonymous with growth in Total Factor productivity (TFP), as it measures the
overall technical efficiency or the way a set of factors is combined to yield the best possible
output. Labor productivity is a partial measure and captures only the contribution of labor,
ignoring the changes in factor intensities and efficiency of capital. Increase in TFP need not
imply an increase in labor productivity as well. For example, a substitution of capital for labor
may increase labor productivity, but without any increase in productivity of capital or the overall
TFP. On the other hand, productivity of capital may increase, without a concomitant increase in
labor productivity if the absorptive capacity of labor is not sufficient. This is true in a developing
country context, where unorganized sector comprises a large share in manufacturing. In this
context, where, production processes are heterogeneous and highly labor intensive with
small/medium firms facing shortages in the supply of skilled labor technology imports may not
translate to very large increases in overall productivity because of decrease in labor productivity.
Hence, an overall improvement in TFP may not suffice to capture the economic constraints faced
by firms to improve labor productivity.
The importance of trade as well as research and development on improving total as well as
partial factor productivity has been well documented. Empirical evidence on causality between
exports, imports and productivity has been mixed (Hadad et al 1996, Pavcnik 2000). A recent
study in the Indian context does not find support for the learning by exporting hypothesis for the
manufacturing sector (Haider 2012). That is, while more productive firms enter the export
market, reverse is not true. Moreover high export intensities in hi-tech industries need not be a
consequence of their technological capability, but rather an international fragmentation of
production, as reflected by rising import intensities as well (Shrolec, 2007). With respect to

imports, while some studies have supported a positive impact of imports on TFP, others have
shown contrary (Tybout 2000, Muendler 2004).
In-house Research and Development has been found to positively influence labor productivity,
though with a higher impact in high-tech industries (Grilliches 1986, Mairesse, J. and M.
Sassenou 1991, Tsai and Wang, 2004). More recent studies have found complementarity
between in house and external (contracted) R&D; and a higher impact of R&D on productivity
on industries engaged in product vis-à-vis process innovation (Lokshin, Rene Belderbos and
Martin Carree 2008, Francesco Bogliacino and Mario Pianta 2009). In the Indian context,
imports and R&D have been found to have a positive and significant impact on the total factor
productivity of high tech industry as well as the output of overall manufacturing sector (Sharma
2010, Saxena 2011). Siddharthan (1992) analyzed the impact of technology transfer
expenditures on R&D expenditures for a sample of private sector firms and found
complementarities between R&D and technology transfer expenditures.
Few studies have however, analysed the joint impact of trade and R&D on labor productivity.
For instance, Acharya and Keller (2009) argue, in the context of industrialized nations, that while
R&D has a positive and significant impact on productivity, the contribution of international
technology transfer often exceeds the effect of domestic R&D on productivity. They analyse the
joint impact of R&D and trade by interacting the share of country’s share in G6 imports with its
domestic R&D and find that imports are crucial for technology transfer from Germany, France,
and the United Kingdom. Industries where foreign technology has a strong impact on domestic
productivity are radio, T.V, communication equipment, office, accounting, and computing
machinery (72%) chemicals (39%), aircraft (26%), and drugs (15%).

In the context of the above findings, it would be interesting to analyse the impact of trade-
related technology expenditures on the productivity of the electronics industry in India, which
has witnessed a fall in productivity levels in the recent times.
II.1 Recent trends in imports and exports and labor productivity The two major items that account for one-third of manufactured exports from India are Mineral
oil and Pearls & Precious stones. This is in contrast with China, where, electrical & electronics
and machinery products constituted more than two-fifth of Chinese export in 2012. While the
share of automobiles in Indian exports doubled from 2 to 4% during 2001-2012, electrical and
electronics equipments marginally increased their export share.
Import of electronic items present a different picture. In general, the share of imports in Indian
manufacturing has been rising rapidly since liberalization policies were introduced in 1991. In
the electronics industry, there has been a rapid growth in imports since India became a member
of the Information technology agreement (ITA) where in the participating countries agreed to
bind and eliminate all customs and other duties and charges on information technology products
by the year 2000. India eliminated tariffs on 38 per cent of the ITA products by 2000 and the rest
by 2005. So the actual impact of the agreement on India was felt only by 2005 when the tariffs
on 62 % of the total products were reduced to zero. Subsequently, there was a surge in import of
electronics imports which grew at the rate of 18% during 1997-2000 and 38% from 2001-2005.
The share of raw material imports in total sales increased from 5% in 1997 to 20% in 2004
(Kallumal and Francis, 2014). During 2001-2012, India’s import of electrical & electronic items
rose from 0.2 billion dollar to almost 30 billion dollars, out of which, the import of mobile phone
& parts was almost 10 billion in 2012.

The incidence of high imports could have a negative impact on manufacturing. Further, because
of quality standards and market access issues, the existing domestic producers may become
domestic assemblers/traders in the IT products, rather than competitors in global value chain of
electronics. This trend is supported by the results of the field survey interviews of small and
medium firm belonging to the electronics industry in the city of Chennai, India.
Figure 1 shows the trend in export and import intensities (value of imports/value of sales) for the
electronics industry during 2002-2012. The import intensity is higher than export intensity, both
of which are increasing at a decreasing rate. Figure 2 shows the labor productivity and
employment trends in the electronics industry. Labor productivity is continuously falling till
2005 and exhibits volatility over 2005-12, while employment steadily rose upto 2008 and
exhibits volatility afterwards.
Figure 1: Export and Import intensities in Electronics sector (2002-12)
Source: Prowess database, CMIE
0
0.05
0.1
0.15
0.2
0.25
0.3
0.35
0.4
0.45
0.5
20
02
20
03
20
04
20
05
20
06
20
07
20
08
20
09
20
10
20
11
20
12
Expore_int_E Import_int_E

Figure 2: Labor productivity in electronics sector
Source: Prowess database, CMIE
II.2 Impact of imports on growth of electronics industry: primary data
analysis
The electronics industry consists of three segments as per the NIC classification: electronics
components, communication equipment and computer peripherals. An analysis of the
employment and output characteristics reveals that the electronics components segment is
dominated by the formal sector (covered by ASI) whereas the informal segment dominates the
other two segments (Institute for Human development studies, 2014). A comparison of the
output and employment growth in the two sectors shows that the informal sector performed
better than the formal sector in terms of employment and growth in units. During 2005-06 to
2011-12, while the formal sector output grew by 4 percent, informal sector output grew by 3 per
cent. The growth in number of units and employment in the informal sector was 17 per cent and
11 percent as opposed to 8 per cent and 6 per cent in the formal sector. The relatively poor
0
20000
40000
60000
80000
100000
120000
0
0.1
0.2
0.3
0.4
0.5
0.6
0.7
0.8 2
00
2
20
03
20
04
20
05
20
06
20
07
20
08
20
09
20
10
20
11
20
12
Emp
loye
es (
no
.)
Lab
or
pro
du
ctiv
ity
labor productivity_electronics employees_electronics

growth of formal sector is also evident from the increasing import competition that the formal
sector is facing in the recent times.
Table 1: Growth in units, employment and output in the electronics sector: 2005-06 to 2011-12
NIC
DME Factories Total 2008
Code Units
Output Employ
Units
Output Employ
Units
Output Employ
(crore) ment (crore) ment (crore) ment
Electronics
261 22.7 10.9 35.1 13.7 5.4 9.5 18.9 5.5 12.4
262 26.1 -2.6 -8.6 -3.1 2 -2.3 15.9 1.9 -3.9
263 -21.8 -9.8 -20 0 3.4 3 -9.5 3.4 1.5
Total 17.3 3 11.4 8.3 3.9 5.9 13.5 3.9 6.7 Source: Different Rounds of Annual Survey of Industries and Unorganised Manufacturing Survey, NSS 62nd
Round: July 2005 - June 2006, from IHDS report (2014)
A survey of 35 electronic units (out of 300 units) in Chennai in 2014 showed that majority of
units in Chennai manufacture or trade in electronic components (261 NIC code) and very few are
engaged in communications equipments. Hardly any manufacturer of computer and peripherals
was located in Chennai. Only one third were registered and covered by ASI, while rest come
under the informal sector. These units were at the low end of the supply chain and involved
mostly in design and assembly of printed circuit boards for automobile electronic components,
medical equipment, display boards and vending machines, assembly of electronic testing
equipment and manufacturers of transformers. The import intensity (import of raw materials as
% of sales) was 21 percent and export intensity was 17 per cent. Only 43 percent of firms were
exporting outside India whereas 80 percent of firms were importing raw material. The average
share of raw material imports in total imports was 36 percent with one-third firms importing 80-
90 percent of raw materials from abroad.

A preliminary analysis of the primary data reveals the following facts: one is the declining
growth in output and employment in formal vis-a-vis informal sector, indicating a rise in
subcontracting in the electronics industry. A second fact is the rising import intensity of exports.
II.3 Complementarities between technology transfer and nature of R&D
The supply chain of electronics sector in India is dualistic in nature. The capabilities in the
electronics supply chain consist of assembly at the low end to designing and research and
development at the high end, without any manufacturing capability. Both these segments are
highly import dependent with important implications for labor productivity.
A preliminary analysis of the firm –level data from Prowess database shows 126 categories of
product classification in the electronics industry. It ranges from small parts and components like
printed circuit boards, switches and connectors to more high value products like solar
photovoltaic cells, integrated circuits and computer terminals. There are also end-end (from
designing to development and installation) solution providers for industrial process automation
and defence industries, who need not manufacture any specific product. For example, firms
engaged in industrial process automation design the factory automation process, buy the
imported hardware components from companies like Siemens or ABB; and assemble and install
the machinery at the industrial premises of the client. The R&D carried out by these firms is
relatively low but import of raw material and capital goods is very high. Table A.1 shows the
average import intensity of firms by different product categories and finds that import intensity is
highest in case of control instrumentation and industrial electronics, suppliers to defence
industry, solar appliances, and components for telecom industry, integrated circuits and computer
terminals.

For these firms, the direct impact of R&D on labor productivity is low because of its low
magnitude. However, the import of technology complements the R&D and may generate a
positive impact on labor productivity.
At the other end, there are firms with high R&D capabilities. Post 2000, India has emerged as the
global R&D outsourcing hub for IT solutions in all hi-tech industries ranging from telecom,
automobiles to aerospace. MNCs like Motorola and QuEST global have set up R&D hubs in
India for new product development in various areas. A survey of conventional and new
technology industries3 (Reddy 2010) was carried out to find the motive behind R&D in these
industries. Availability of personnel and low cost of R&D were the main reasons for setting up
such R&D hubs in emerging economies. Two important conclusions emerged from the survey:
(a) there is less need for product or process adaptation to the local market; (b) proximity to
manufacturing facilities and the Indian market were not considered as important suggesting that
R&D could be geographically delinked from manufacturing facilities.
The research and development undertaken by the firms in global value chain has weak linkages
with the domestic manufacturing capability and is highly dependent on disembodied technology
transfer through import of raw materials and capital goods. Hence, there are strong
complementarities between R&D and technology imports. What does this imply for labor
productivity? In essence, we can expect that compared to standalone imports or R&D, the
interaction between the two would have a higher impact on labor productivity.
3 The new technology industries included electronics, bio technology and solar energy companies. Firms engaged in
R&D were classified into four categories: technology transfer unit, Indigenous technology unit, global technology
unit and corporate technology unit. Results of the survey showed that all the global technology unit (GTU) and
corporate technology unit (CTU) types of R&D units belonged to new technologies firms, with 50 percent of new
technologies firms carrying out GTU and 12.5 percent performing CTU types of R&D.

III. Data Methodology The following section analyzes the impact of trade and R&D on labor productivity. The study
utilizes a sample of 266 electronics over the time period of 2002-2012 from the Prowess
database. The study uses the standard production function approach whereby ouput is expressed
as a function of inputs in an augmented Cobb-Dougals production function4 for firm i at time t:
Yit = αitLitβKit
δRit
γeit
σit………………………………………………………(1)
Where Y is the output, L is labor, K is physical capital stock value and R is knowledge stock.
The parameter σ is firm specific efficiency parameter. The knowledge stock is captured by in-
house research and development and import of technological know-how through royalty
payments and import of raw materials/capital goods.
Dividing by labor on both sides and taking logs, value added is expressed as a function of labor,
capital and other variables affecting firm output:
yit = , …………………………………………..(2)
where, letters in small case denote logs of the variables. Taking first difference, we arrive at the
growth equation
Δyit-1 = ………………………………………….(3)
Change in firm-specific efficiency levels is assumed as a function of past productivity, in order
to allow for a gradual convergence in efficiency levels between firms, where, is the
convergence parameter that lies between -1 and 0:
Δ ....................................................................................................(4)
4 Lokshin et al (2008)

To allow unobserved firm-level heterogeneity in efficiency growth and an impact of common
macroeconomic efficiency shocks, the error term in equation above includes firm-specific fixed
effects μi and year-specific intercepts λt in addition to serially uncorrelated measurement errors
vit.
III.1 Expressing change in knowledge stock as a function of technology
expenditures
The study assumes that change in knowledge stock is a function of past research and
development5, disembodied technology transfer in the form of import of technical know-how,
raw material and capital goods imports and learning from exports of goods and services. Import
of technical know-how is captured through royalty expenditures and technical licensing fees. It is
also captured through import of raw materials and capital goods, where a lot of know-how is
transferred through specialized equipment suppliers.
In addition to the R&D and technology transfer variables, the study also introduces an interaction
term between the two to analyze complementarities between the two variables. This is especially
important in the context of emerging economies which are witnessing an increasing trend in
outsourcing of R&D along with transfer of technology, where such R&D needs to be applied.
Taking the lagged output on the right hand side of the equation and substituting (4) into (3) the
dynamic panel equation is:
yit = (1+θ) yit-1 + (1-β0)Δl + δΔk + + μi + λt + vit…………………………………..(5)
5 The knowledge stock can be transformed as follows: = Δ
Δ
which gives change in knowledge stock as a function of past investments in research and development (Lokshin et al
2008).
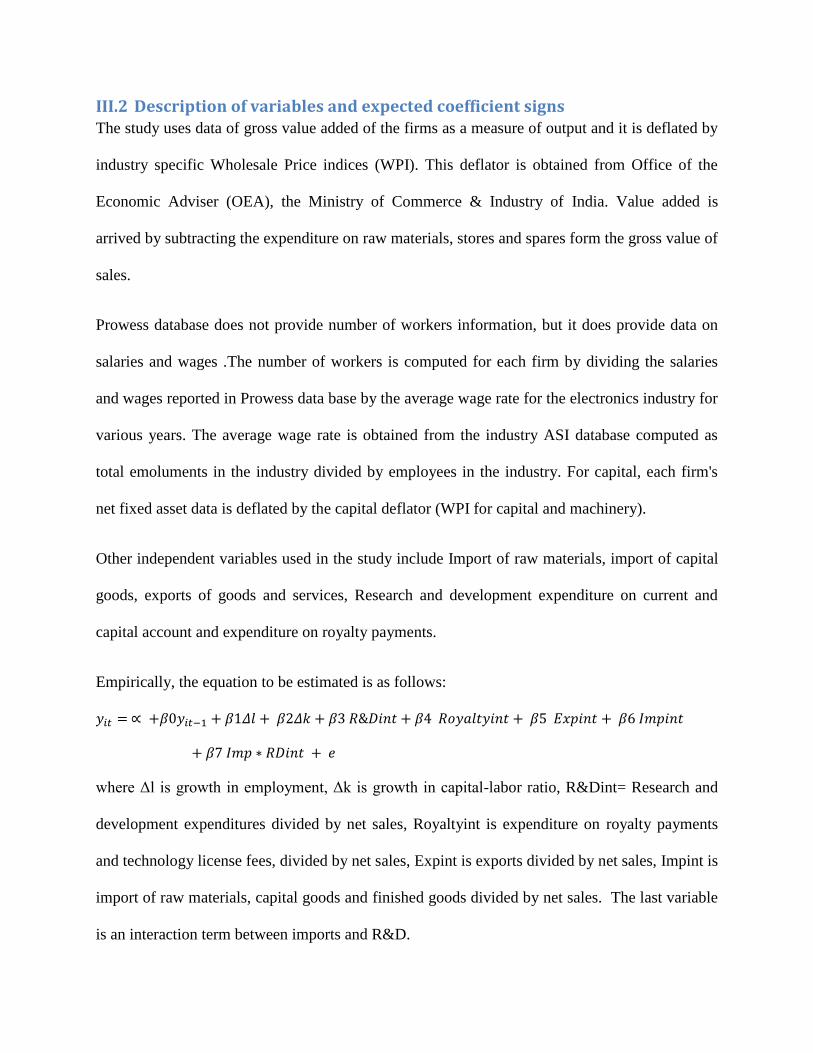
III.2 Description of variables and expected coefficient signs The study uses data of gross value added of the firms as a measure of output and it is deflated by
industry specific Wholesale Price indices (WPI). This deflator is obtained from Office of the
Economic Adviser (OEA), the Ministry of Commerce & Industry of India. Value added is
arrived by subtracting the expenditure on raw materials, stores and spares form the gross value of
sales.
Prowess database does not provide number of workers information, but it does provide data on
salaries and wages .The number of workers is computed for each firm by dividing the salaries
and wages reported in Prowess data base by the average wage rate for the electronics industry for
various years. The average wage rate is obtained from the industry ASI database computed as
total emoluments in the industry divided by employees in the industry. For capital, each firm's
net fixed asset data is deflated by the capital deflator (WPI for capital and machinery).
Other independent variables used in the study include Import of raw materials, import of capital
goods, exports of goods and services, Research and development expenditure on current and
capital account and expenditure on royalty payments.
Empirically, the equation to be estimated is as follows:
where Δl is growth in employment, Δk is growth in capital-labor ratio, R&Dint= Research and
development expenditures divided by net sales, Royaltyint is expenditure on royalty payments
and technology license fees, divided by net sales, Expint is exports divided by net sales, Impint is
import of raw materials, capital goods and finished goods divided by net sales. The last variable
is an interaction term between imports and R&D.

The coefficient for lagged productivity β0 = 1+ θ, as per the model specification. If θ is zero,
then change in firm specific efficiencies are not dependent on past productivities and there is no
convergence in efficiency levels between firms with high and low productivity. The opposite
would hold true if θ = -1. The coefficient on lagged labor productivity is expected to lie between
0 and 1. Growth of employment is expected to have a positive impact on productivity. The
coefficient of labor growth is β-1, implying that β>0.
As per economic theory, R&D intensity is expected to influence labor productivity positively.
However, in the context of the current sample of electronics industry, R&D intensity is very low
and hence it is not expected to be significant in the study. Also, a threshold R&D intensity may
be necessary before firms can benefit from it through improvements in productivity. A negative
coefficient sign would mean that the returns to R&D are diminishing for the industry.
Imports and exports are assumed to have a positive impact if the firms have the sufficient
absorptive capacity in terms of higher R&D and skilled labor. In the absence of both, it may be
insignificant or even negative. The coefficient for technology expenditures or royalty
expenditures is assumed to follow a similar argument. In the study, R&D expenditures are
combined with royalty expenditures together as technology expenditures. This also solved the
problem of too few observations related to royalty payments.
The interaction term between technology expenditures and imports is expected to be positive
because of the earlier arguments related to complementarities between the two variables. This is
one of the crucial arguments proposed by the study in the context of an emerging economy
where firms are increasingly becoming a part of the global value chain for hi-tech industries
resulting in technical collaborations and technology transfers through different channels.

However, this will have a positive impact on labor productivity only if the firms have sufficient
absorptive capacity and relevant R&D capabilities in the sense that firms with higher R&D also
benefit more from technology transfer. In the current context, in-house R&D can be too low to
have positive impact on labor productivity. Technology transfers may enable firms to benefit
from such R&D. On the flip side, even when firms are undertaking high R&D, it may not be
directed towards domestic market demand, thus not having a significant impact on productivity,
unless they also undertake technology transfers for applying the R&D.
Table 2 shows the descriptive statistics for the period under study for all the variables used.
Table 2 Descriptive statistics
Electronics Industry
Mean Standard Deviation
Labor Productivity 0.70 0.72
R&D intensity 0.01 0.05
Royalty intensity 0.01 0.02
Export intensity 0.27 0.33
Import intensity K goods 0.32 0.29
Import intensity Raw material 0.07 0.30
K-labor ratio 8.34 17.85
Source: Prowess database
The average export intensity for the period under study is 0.27, whereas, import intensity of
capital goods is 0.32 and that of raw materials is 0.07. Capital labor ratio is 8.34, with a high
standard deviation, suggesting varying levels of labor intensity in the electronics industry. R&D
intensity is very low in the sample under study. Out of 266 firms 19 are private foreign firms,
160 are private Indian firms and rest are owned by individual business groups. There might be
underreporting of R&D by privately owned foreign firms, resulting in the low R&D figure (table

2A) whereas it is mandatory to report R&D expenditure by central government enterprises like
BEL Optronic devices, Bharat dynamics and Bharat electronics.
Table 2A: Average R&D expenditure during 2002-2012
Ownership type Average R&D intensity
Business group 1%
Private Foreign 0%
Private Indian 1%
State/Central 4%
Source: Prowess database
IV. Results
Three specifications are estimated: specification one estimates the equation in levels and without
royalty (technology transfer) expenditures. Specification two estimates the difference equation,
again without the technology transfer expenditures. Specification three combines R&D
expenditures along with technology transfer expenditures and estimates complementarities
between the overall technology expenditures and imports. Lagged variables are used as
instruments in the dynamic panel data model.
Table 3 reports the results from panel data estimation for variables in levels and without royalty
expenditures. Tests for serial correlation and heteroskedasticity in panels show to be significant
and hence a generalized least square model was estimated that uses panel corrected standard
errors and AR(1) process. However, as Hausman test shows that fixed-effects is the appropriate
model, using a GLS corrected for heteroskedasticity and autocorrelation does not solve the
problem. For the dynamic panel data, the OLS-fixed effect estimator is not designed to correct
the problem of simultaneity between inputs and the persistent shock that varies within firm over

time. To effectively account for the simultaneity and endogeniety problem in panel data, the
paper uses the GMM technique, following Arellano and Bover (1995) and Blundell and Bond
(1998). The Blundell and Bond estimator, also called system GMM estimator, uses moment
conditions in which lagged differences are used as instruments for the level equation in addition
to the moment conditions of lagged levels as instruments for the differenced equation.
Instruments in the difference GMM model are twice-lagged values of the level of the dependent
variable and the lagged-level values of the labour, capital-labor ratio and R&D variables. The
extra lag reduces the number of observations considerably. Instruments in system GMM
estimation for equations in levels are differenced values of the other right-handside variables, i.e.
twice-lagged change in productivity and lagged changes in employment and capital-labor ratio,
and R&D.
Table 3: Fixed and random effects model for electronics panel data (variables in logs)
FE RE GLS (corrected for heteroskedasticity and AR1)
Dependent variable= log productivity Coeff Coeff Coeff
Employment `-1.005***
(0.04) `-0.98***
(0.04) `-0.91***
(0.016)
K-L ratio 0.04
(0.03) 0.018
(0.025) 0.017
(0.010)
R&D current exp `-1.001***
(0.035) `-0.96***
(0.031) `-0.90*** (0.0154)
Imports `-1.092***
(0.045) `-1.05***
(0.042) `-0.94***
(0.02)
Exports `-0.028 (0.011)
`-0.03 (0.010)
`-0.024** (0.006)
R&D *Imports 1.005*** (0.037)
0.97*** (0.033)
0.90*** (0.016)
_cons `-0.84***
(0.22) `-0.77***
(0.18) `-0.68***
(0.04)
N 353 353 345
Groups 64 64 56
R Sq (overall) 0.78 0.78

Tables 4 and 5 report the results from dynamic panel data estimation, with and without royalty
payments. Lagged value added is positive and significant. The convergence factor θ ranges from
-0.64 to -0.75. Growth in employment is also positive and significant as expected ranging from
0.25 to 0.5. A one percent increase in labor increases labor productivity by 0.25 to 0.5 per cent.
Capital-labor ratio is not significant and does not have any influence on labor productivity.
Exports also do not turn out to be significant. Imports and R&D are negative and significant at
1% level of significance, implying that in-house R&D does not improve labor productivity.
However, the interaction term between R&D and imports is positive and highly significant. A 1
per cent joint increase in R&D and imports results in a gain of 0.5 per cent in labor productivity.
What this means is that firms engaged in R&D per se do not find any improvement in labor
productivity. However, R&D along with technology transfers through imports increases labor
productivity significantly. The coefficient magnitude increases when research and development
expenditures are combined with technology transfer (royalty) expenditures.
Table 4: Dynamic panel data estimation (Only R&D current expenditures)
Difference GMM estimator System estimator
Coeff Coeff
Value added (lag1) 0.29** (0.12)
0.46* (0.11)
Employment (growth)
`-0.61*** (0.16)
`-0.75* (0.14)
Capital-labor (growth)
`-0.092 (0.088)
`-0.018 (0.86)
R&D current expenses
`-0.56*** (0.18)
`-0.63*** (0.12)
prob >chi2 0 0 0
Hausman Prob>chi2 = 0.053
Figures in parentheses are standard errors. ***, **, * denote significance at 1%, 5% and 10% levels.

Imports `-0.66***
(0.19) `-0.61***
(0.18)
Exports `-0.058 (0.046)
0.001 (0.03)
R&D current*Imports
0.56*** (0.19)
0.59*** (0.11)
time `-0.03 (0.04)
`-0.03* (0.015)
constant `-4.3***
(0.76)
No. of obs 203 311
No. of groups 45 60
No. of instruments 47 52
Prob > F /chi2 0 0
Figures in parentheses are standard errors. ***, **, * denote significance at 1%, 5% and 10% levels.
Table 5: Dynamic panel data estimation (combining R&D and royalty expenditures)
Difference GMM estimator System estimator
Value added Coeff Coeff
Value added (lag1) 0.25**
(0.12)
0.41***
(0.12)
Employment (growth) `-0.49***
(0.18)
`-0.54***
(0.16)
Capital-labor (growth) `-0.04
(0.098)
0.012
(0.11)
R&D current & royallty expenses `-0.59***
(0.14)
`-0.65***
(0.10)
Imports
`-0.71***
(0.14)
`-0.72***
(0.11)
Exports
`-0.036
(0.053)
0.02
(0.03)
Tecnology expenditures*Imports
0.61***
(0.15)
0.66***
(0.09)
time
0.02
(0.05)
`-0.04***
(0.016)
constant
`-4.5***
(0.68)
No. of obs 272 422
No. of groups 59 82
No. of instruments 47 52
Prob > F /chi2 0 0
Figures in parentheses are standard errors. ***, **, * denote significance at 1%, 5% and 10% levels.

V. Conclusions The study analyses the impact of trade on labor productivity and finds that while imports and
R&D both have a negative impact on labor productivity, the interaction of R&D and imports has
a positive impact on labor productivity. The negative coefficient on R&D and imports suggests
the lack of a domestic manufacturing capability of electronic components and absence of
linkages between R&D and domestic market demand. On the positive side, a positive coefficient
of the interaction terms suggests the contractual nature of R&D and role of technology transfer in
the global value chain of electronics industry.
The results point towards the lop-sided development of Indian manufacturing, whereby,
domestic manufacturing capability has not developed alongside research and development
capabilities in the electronics sector. Further, the free trade regime in electronics components has
discouraged manufacturing and led to import intensive manufacturing and prevalence of trading
opportunities. Policy steps need to be taken to encourage indigenous manufacturing capability
and provide incentives for research and development that directly contributes to product
development in domestic markets.

Table A.1 Firms classified by type of electronic products
industry total_imports (millions Rs)
Sales_def (millions Rs)
Average Import intensity (2002-
12) Import
intensity_2012
No. of firms in
2012
Analytical instruments 92 453 20% 0% 1
Antennae for TVs 0 0 0
Antennae for radios & TVs 125 514 24% 4% 1
Batteries incl. Ni-Cd batteries 33 212 15% 0
Blowers, portable 3 158 2% 0
CR tubes 41 146 28% 0
Capacitors 107 248 43% 0
Ceramic capacitors 21 65 32% 43% 1
Coils 2 50 3% 0
Communication & broadcasting equipment 30 251 12% 55% 1
Compact Discs 19 83 23% 0
Computer peripherals 237 619 38% 53% 2
Computer systems 258 1153 22% 8% 3
Computer terminals (VXL instruments, thin client computing technology) 458 577 79% 98% 1
Connectors 331 636 52% 61% 2
Control instrumentation & industrial electronics (print solutions, real time
dashboards, motion control, industrial electronics) 205 609 34% 180% 2
Control panels 124 552 23% 39% 2
Control valve actuators 21 732 3% 0
Control valves 15 255 6% 8% 1
Crystals 1 26 4% 4% 1
Data storage, memory systems (real time tech solutions, defence) 328 361 91% 56% 1
Defence communication equipment 201 1980 10% 4% 2
Diagnostic equipment 1157 4003 29% 0
Diodes 17 40 41% 0
Electro cardio graphics 565 2997 19% 60% 1
Electrolytic capacitors 40 63 64% 94% 1
Electronic balances 0 18 3% 1% 1
Electronic components 35 325 11% 3% 5
Electronic relays 106 397 27% 0
Electronic test & measuring instruments 50 422 12% 6% 1
Electronic transformers 0 14 0% 0
Electronics 491 1793 27% 54% 5

Filters 17 89 19% 14% 2
Floppy disks 9006 15133 60% 33% 2
Fuses & fuse holders 12 35 33% 0
Industrial electronics & automation equipment 6 46 12% 0
Industrial fans, blowers, etc. 5 58 9% 31% 1
Industrial fans, etc. 23 354 7% 0
Industrial power supplies 16 379 4% 0% 1
Industrial ultrasonic equipment 31 158 20% 16% 1
Instrument cooling fans 34 137 25% 37% 1
Integrated circuits 120 182 66% 82% 1
Integrated circuits, nec 39 80 49% 44% 0
Inverters 5 116 4% 0
LED displays 164 1225 13% 7% 1
LED lamps 6 19 31% 10% 1
Laminates 12 35 34% 0
Level controllers 8 19 41% 40% 1
Line printers 511 1181 43% 41% 1
Medical electronic equipment, nec 9 112 8% 3% 1
Medical equipment 78 144 54% 19% 3
Microwave passive components 149 446 33% 37% 2
Miscellaneous components, nec 19 232 8% 9% 1
Miscellaneous electronic equipment 1234 3989 31% 55% 1
Mosquito repellers, insect killers 16 216 7% 0
Moulding compounds in electronics 1 32 3% 3% 1
Other automation electronics equipment 152 1087 14% 0% 1
Other communication equipment, nec 217 862 25% 0% 1
Other diodes & transitors 1761 2276 77% 67% 1
Other electronic components 150 220 68% 0
Other electronic equipment 21 188 11% 28% 1
Other electronic equipment, nec 46 124 37% 0
Other parts of lamps, nec 82 115 72% 96% 1
Other testing & measuring instruments 404 1125 36% 54% 1
Other transmission equipment 73 368 20% 0
Pacemakers 14 44 33% 29% 1
Photovoltaic power modules 1916 2126 90% 69% 3
Piezo electric elements (centum rakon, defence) 223 177 126% 79% 1
Power line carrier communication equip. 103 636 16% 0
Printed circuit boards 81 152 53% 72% 8
Process control equipment 447 1375 33% 37% 2
Process controllers 0 1 20% 0% 1

Rack & panel connectors 91 842 11% 11% 1
Reed switches 25 49 51% 70% 2
Resistors 2 8 27% 0
Rotary switches 6 169 4% 4% 1
Satellite communication equipment 0 4 3% 0
Security electronics equipment 2 6 36% 0
Semiconductor devices 174 437 40% 32% 1
Servo components 6 4 139% 0
Soft ferrites 17 111 15% 27% 2
Solar appliances 218 228 96% 103% 5
Solar modules 532 900 59% 57% 5
Stepper motors 319 592 54% 0
Surgical equipment 39 116 33% 15% 2
Switch mode power supply systems 42 434 10% 0% 3
Switching systems 335 619 54% 0
TV picture tubes colour 877 3516 25% 23% 2
Telephone components 2777 3115 89% 90% 1
Temperature controllers 7 193 3% 10% 1
Therapy equipment 4 453 1% 1% 1
Thermal analysis equipment 6 33 18% 26% 1
Thyristor power convertors 53 90 58% 0
Transmission equipment 323 1171 28% 48% 0
Uninterrupted power supplies 267 710 38% 79% 2
Voltage stabilisers / regulators 10 77 12% 0

References
Acharya Ram C and Wolfgang Keller (2009), “Technology transfer through imports”, Canadian
Journal of Economics, Vol. 42, No. 4, pp 1411-1448.
Clerides, S.K, Lach, S. and Tybout, J. (1998), Is Learning-by-Exporting Important? Micro-
Dynamic Evidence from Colombia, Morocco, and Mexico, Quarterly Journal of Economics,
113(3), 903-947.
Francesco Bogliacino and Mario Pianta (2009), “The impact of innovation on labour
productivity growth in European industries: Does it depend on firms' competitiveness
strategies?”, Institute for Proespective Technology Studies (IPTS) working paper on corporate
R&D and Innovation No. 13/2009, No. 13/2009, European Commision.
Goldar, Biswanth (2013), “Determinants of Import Intensity of India’s Manufactured Exports
Under the New Policy Regime”, Indian Economic Review, 2013, vol. 48, issue 1, pages 221-
237.
Grilches, Z., (1986), "Productivity, R&D and Basic Research at the Firm Level in the 1970s”,
American Economic Review, 76, pp: 141-154.
Haddad, M., Harrision, A. (1993), Are there Positive Spillovers from Direct Foreign Investment?
Evidence from Panel Data for Morocco, Journal of Development Economics, 42(1), 51-74.
Haidar,Jamal Ibrahim (2012), “Trade and productivity: Self-selection or learning-by-exporting in
India”, Economic Modelling 29 (2012) 1766–1773.

Nathan Dev, Sandip Sarkar and Balwant Singh Mehta (2014), Promoting employment and skill
development in manufacturing sector in India, Study conducted by Institute for Human
development and sponsored by International Labor Organization, August 2014.
Kokko, A., Tansini, R. and M.C. Zejan (1996), “Local Technological Capability and
Productivity Spillovers from FDI in the Uruguayan Manufacturing Sector”, The Journal of
Development Studies, 32(4), pp. 602-611.
Lokshin Boris, Rene Belderbos and Martin Carree (2008), “The Productivity Effects of Internal
and External R&D: Evidence from a Dynamic Panel Data Model”, Oxford Bulletin of
Economics and Statistics, 70, 3, pp:399-413.
Luis Suarez-Villa and Pyo-Hwan HanSource (1990), “The Rise of Korea's Electronics Industry:
Technological Change, Growth, and Territorial Distribution”, Economic Geography, Vol. 66,
No. 3 (Jul., 1990), pp. 273-292.
Mairesse, Jacques and Mohamed Sassenou (1991), “R&D AND PRODUCTIVITY: A SURVEY
OF ECONOMETRIC STUDIES AT THE FIRM LEVEL”, Working Paper No. 3666,
NATIONAL BUREAU OF ECONOMIC RESEARCH (NBER), Cambridge MA.
Mukherjee S, and S.Mukherjee (2012), “Overview of India’s export performance: trends and
drivers”, working paper number 363, IIM Bangalore.
Muendler, M., 2004. Trade, Technology, and Productivity: A Study of Brazilian Manufacturers,
1986-1998. Department of Economics, UC SanDiego, University of California At San Diego,
Economics Working Paper.
Patricia Augier, Olivier Cadot, Marion Dovis (2013), Imports and TFP at the firm level: the role
of absorptive capacity, Canadian Journal of Economics , 46(3), pp956-981.

Pavcnik, N., 2002, “Trade Liberalisation, Exit, and Productivity Improvements: Evidence From
Chilean Plants”, Review of Economic Studies 69, 245-276.
Reddy Prasada (2010), Global innovation in emerging economies, Routledge studies in
Innovation, Organization and Technology, Taylor and Francis, London.
Sharma Chandan (2010),” Does Productivity Differ in Domestic and Foreign Firms? Evidence
from the Indian Machinery Industry”, Indian Economic Review, New Series, Vol. 45, No. 1
(January-June 2010), pp. 87-110.
Shrolec mArtin (2007), “High-Tech Exports from Developing Countries: A Symptom of
Technology Spurts or Statistical Illusion?” Review of World Economics / Weltwirtschaftliches
Archiv, Vol. 143, No. 2, pp. 227-255.
Siddharthan, N. S. (1992). “Transaction Costs, Technology Transfer, and In-House R&D. A
Study of the Indian Private Corporate Sector”, Journal of Economic Behavior and Organization,
18, pp. 265-271.
Siddharthan N.S. and Savita Bhatt (2009), “Human capital, labor productivity and employment”,
in Human Capital and Development: The Indian Experience, by Natteri Siddharthan, Krishnan
Narayanan.
Tsai, K.H. and J.C. Wang (2004), “R&D productivity and the spillover effects of Hightech
industry on the traditional manufacturing sector: The case of Taiwan”, World Economy, 27,
15551570.
Tybout, James R, “ Manufacturing Firms in Developing Countries: How Well Do They Do, and
Why?”, Journal of Economic Literature, Vol. 38, No. 1 (Mar., 2000), pp. 11-44.
Verspagen, B. (1995), “R&D and productivity: A broad cross- section cross-country look”,
Journal of Productivity Analysis, 6, 117135.

Virmani Arvind and Danish A. Hashim (2009), “ Factor Employment, Sources and Sustainability
of Output Growth: Analysis of Indian Manufacturing, Working Paper No.3 /2009-DEA,
Ministry of finance, Government of India, April 2009.
________________(2011), “J-Curve of Productivity and Growth: Indian Manufacturing Post-
Liberalization”, IMF working paper, WP/11/163.
Zaleha Mohd Noor, Noraini Isa, Rusmawati Said and Suhaila Abd Jalil (2011), “The Impact of
Foreign Workers on Labour Productivity in Malaysian Manufacturing Sector”, Int. Journal of
Economics and Management 5(1): 169 – 178 (2011).