Embed Size (px)
Citation preview
Labor Policies and Philippine Companies: Analysis of Survey Opinions
Gerardo P. Sicat1
AbStrACtThis paper analyzes the responses from a survey of Philippine companies concerning labor market policies, such as minimum wage-setting process, hiring and firing practices, training, and holidays. These policies have gained wide acceptance as a means of protecting the welfare of workers. But one of the features of the Philippine economy is the massive unemployment that has persisted for a long time.
Specific characteristics associated with the respondent firms help to isolate important findings in their opinions about the country’s labor policies. Responses to each policy issue vis-à-vis certain criteria around which operating enterprises were grouped yielded some important conclusions. The firms were either recipient or nonrecipient of investment incentives; export- or domestic market-oriented; owned by nationals or by foreigners; young or old; and small or large based on size of labor employment.
Although the policy implications of the findings are not discussed in this paper, some conclusions appear evident. Among others, companies are adversely affected by certain policies that they complain about.
1 The author is Professor Emeritus, University of the Philippines School of Economics (UPSE). This side research arose from topics stimulated by participation in a project under the Asian Development Bank which covered labor market issues. The author is thankful to Rose Edillon and Sharon Faye Piza of the Asia Pacific Policy Center for reigniting his interest in labor market issues, as well as to Kelly Bird of the ADB and Clarence Pascual of UP. He is likewise grateful to his colleague, Emmanuel Esguerra of the UPSE, with whom he has had discussions on labor issues in the Philippines. He is especially thankful to Lora Liza S. Dioquino, a human relations manager in the private sector, who enlightened him on many practical labor policy issues in the workplace. E-mail for correspondence: [email protected]
Philippine Journal of DevelopmentNumber 67, Second Semester 2009
Volume XXXVI, No. 2
2 PhiliPPine Journal of DeveloPment 2009
INtrODUCtIONThis paper analyzes the results of an opinion survey of Philippine enterprises on labor market issues. In early 2009, a survey of Philippine companies was launched as part of a project study financed by the Asian Development Bank. The firms consisted of a limited sample of operating enterprises located in two major industrial and commercial regions of the country: Metro Manila and Metro Cebu. Despite this limited sample, which was not intended to be representative of the Philippine economy, the surveyed firms comprised 157 major operating enterprises from which important findings could be drawn. The survey focused on enterprises that provide a wide range of employment in the country.
As part of this survey, a number of labor market policy questions were posed to the company respondent firms.2 In general, these questions revolved around policy issues, specifically those involving the minimum wage, the regulation of labor contracts, the hiring and firing of workers, manpower training, and the number of holidays. Some of the issues covered were often publicly discussed.
The respondents were asked to rate specific labor policies based on a scale of approval ranging from 1 (“very poor”) to 5 (“excellent”), with 3 indicating “average” or “fair.” Each labor policy issue was assigned a corresponding frequency distribution of responses along the five-point scale, yielding the corresponding average scores and measures of variability from the resulting average.
This paper presents the survey results on labor market policies mainly in two parts. The first part reviews the overall findings, summarizing the frequency distribution of the various opinions expressed by the respondent companies. Comparisons of average responses per policy show the degree of their variations and the extent to which answers to the questionnaires correlate with one another.
The second part presents a full discussion of the various influences arising from firm characteristics. The wide-ranging responses are analyzed to determine their frequency distribution.
This paper was prompted by the need to probe the attitudes of operating firms toward specific labor policies in a manner that yields statistical proof. If surveys of opinions elicit their responses to specific labor policies, then it is useful to find out what groups of firms consistently give tractable responses to specific policies that may need the attention of policy makers. As a result, this study focuses on the frequency of responses that are critical of the policies. This means zeroing in on the responses of operating enterprises that are critical of those policies.
2 The labor policy questions are only a part of a larger statistical survey of operating enterprises dealing with other employment issues and company characteristics. The labor policy issues were only one aspect of this larger labor market survey.
3Sicat
Such responses yielded scores of “very poor” and “poor” on specific labor market issues. Collectively they indicated a strong level of disagreement with the existing labor policies and hinted at the types of companies that were hurt or adversely affected by such policies. That could mean certain policies were hampering their operations, possibly hindering their flexibility and therefore adding to their costs. It could also mean being left with inferior options on the hiring of labor that could not be properly exercised. In a globalizing world this could eventually mean becoming less competitive compared to other enterprises, either domestic or foreign.
This paper hopes to reach a wide segment of the general public that is interested in labor policy issues in the Philippine context. Sicat (2010 ) uses the same data reported here to determine the influences of various characteristics associated with respondent companies on the probability that they would voice a specific opinion about the minimum wage policy. The approaches of the two papers are different but they feed into each other’s major conclusions.
COMPANY VIEWS ON LAbOr ISSUES IN PErSPECtIVECompany respondents were asked 14 specific questions covering a host of labor market issues. The questions were designed to elicit responses on how respondent companies viewed the policies meant to promote a good investment environment. These specifically focused on the following:
The minimum wage setting as a consultative process The cost of severance pay regulation Freedom to employ workers on fixed-term contracts Ease of dismissing regular workers Mandatory on work hours per week Overtime pay rates Industrial relations and harmony Mode of settling labor disputes Inspections by officials of the Department of Labor and Employment
(DOLE) Performance of the Public Employment Service Office Government incentives for training workers The quality of vocational schools in the respondent’s sector Number of mandatory national holidays Number of discretionary national and local holidays
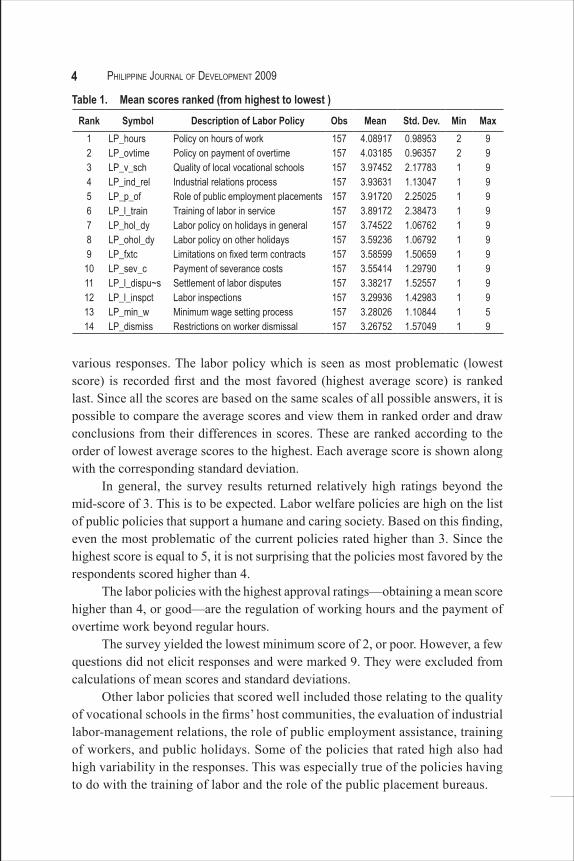
Average scores of policiesTable 1 presents the summary of the responses of the surveyed enterprises to the 14 labor policy issues covered. It shows the average ratings derived from the
4 PhiliPPine Journal of DeveloPment 2009
various responses. The labor policy which is seen as most problematic (lowest score) is recorded first and the most favored (highest average score) is ranked last. Since all the scores are based on the same scales of all possible answers, it is possible to compare the average scores and view them in ranked order and draw conclusions from their differences in scores. These are ranked according to the order of lowest average scores to the highest. Each average score is shown along with the corresponding standard deviation.
In general, the survey results returned relatively high ratings beyond the mid-score of 3. This is to be expected. Labor welfare policies are high on the list of public policies that support a humane and caring society. Based on this finding, even the most problematic of the current policies rated higher than 3. Since the highest score is equal to 5, it is not surprising that the policies most favored by the respondents scored higher than 4.
The labor policies with the highest approval ratings—obtaining a mean score higher than 4, or good—are the regulation of working hours and the payment of overtime work beyond regular hours.
The survey yielded the lowest minimum score of 2, or poor. However, a few questions did not elicit responses and were marked 9. They were excluded from calculations of mean scores and standard deviations.
Other labor policies that scored well included those relating to the quality of vocational schools in the firms’ host communities, the evaluation of industrial labor-management relations, the role of public employment assistance, training of workers, and public holidays. Some of the policies that rated high also had high variability in the responses. This was especially true of the policies having to do with the training of labor and the role of the public placement bureaus.
Rank Symbol Description of Labor Policy Obs Mean Std. Dev. Min Max1 LP_hours Policy on hours of work 157 4.08917 0.98953 2 92 LP_ovtime Policy on payment of overtime 157 4.03185 0.96357 2 93 LP_v_sch Quality of local vocational schools 157 3.97452 2.17783 1 94 LP_ind_rel Industrial relations process 157 3.93631 1.13047 1 95 LP_p_of Role of public employment placements 157 3.91720 2.25025 1 96 LP_l_train Training of labor in service 157 3.89172 2.38473 1 97 LP_hol_dy Labor policy on holidays in general 157 3.74522 1.06762 1 98 LP_ohol_dy Labor policy on other holidays 157 3.59236 1.06792 1 99 LP_fxtc Limitations on fixed term contracts 157 3.58599 1.50659 1 9
10 LP_sev_c Payment of severance costs 157 3.55414 1.29790 1 911 LP_l_dispu~s Settlement of labor disputes 157 3.38217 1.52557 1 912 LP_l_inspct Labor inspections 157 3.29936 1.42983 1 913 LP_min_w Minimum wage setting process 157 3.28026 1.10844 1 514 LP_dismiss Restrictions on worker dismissal 157 3.26752 1.57049 1 9
Table 1. Mean scores ranked (from highest to lowest )
5Sicat
The policies that received the lowest scores revolved around the restrictions on the dismissal of workers, the minimum wage setting process, labor inspections by the government, the settlement of labor disputes, the payment of workers’ severance pays, and the restrictions on the use of fixed-term contracts. These are cause for grievance among respondent companies regarding labor policies. The average scores are relatively close to one another although their measures of variability differ.
Mean scores help to gauge which policies receive relatively greater or less approval from the respondent firms. But variability measures the “noise” that could be read from these responses. Variability in effect describes the spread of the responses relative to the average. The wider the spread, the higher is the disagreement of some respondents with the policy judgment of many firms.
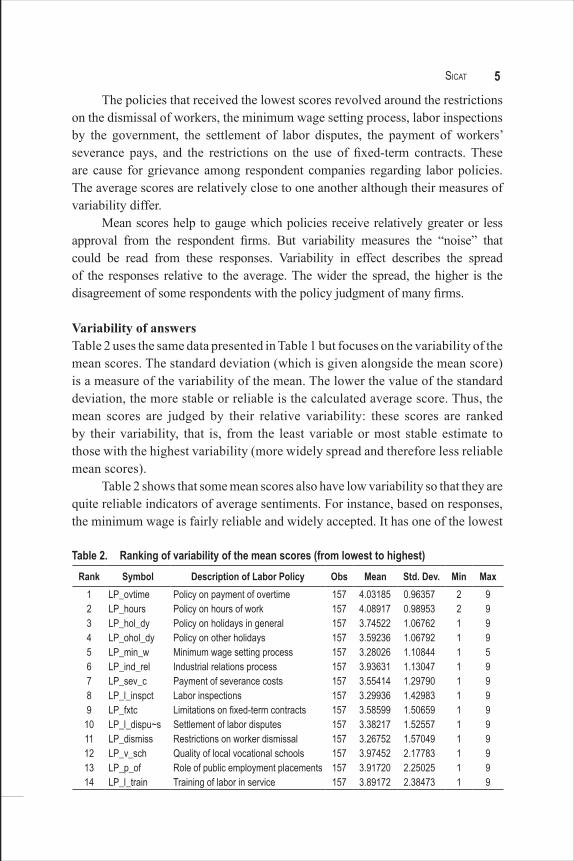
Variability of answersTable 2 uses the same data presented in Table 1 but focuses on the variability of the mean scores. The standard deviation (which is given alongside the mean score) is a measure of the variability of the mean. The lower the value of the standard deviation, the more stable or reliable is the calculated average score. Thus, the mean scores are judged by their relative variability: these scores are ranked by their variability, that is, from the least variable or most stable estimate to those with the highest variability (more widely spread and therefore less reliable mean scores).
Table 2 shows that some mean scores also have low variability so that they are quite reliable indicators of average sentiments. For instance, based on responses, the minimum wage is fairly reliable and widely accepted. It has one of the lowest
Rank Symbol Description of Labor Policy Obs Mean Std. Dev. Min Max1 LP_ovtime Policy on payment of overtime 157 4.03185 0.96357 2 92 LP_hours Policy on hours of work 157 4.08917 0.98953 2 93 LP_hol_dy Policy on holidays in general 157 3.74522 1.06762 1 94 LP_ohol_dy Policy on other holidays 157 3.59236 1.06792 1 95 LP_min_w Minimum wage setting process 157 3.28026 1.10844 1 56 LP_ind_rel Industrial relations process 157 3.93631 1.13047 1 97 LP_sev_c Payment of severance costs 157 3.55414 1.29790 1 98 LP_l_inspct Labor inspections 157 3.29936 1.42983 1 99 LP_fxtc Limitations on fixed-term contracts 157 3.58599 1.50659 1 9
10 LP_l_dispu~s Settlement of labor disputes 157 3.38217 1.52557 1 911 LP_dismiss Restrictions on worker dismissal 157 3.26752 1.57049 1 912 LP_v_sch Quality of local vocational schools 157 3.97452 2.17783 1 913 LP_p_of Role of public employment placements 157 3.91720 2.25025 1 914 LP_l_train Training of labor in service 157 3.89172 2.38473 1 9
Table 2. Ranking of variability of the mean scores (from lowest to highest)
6 PhiliPPine Journal of DeveloPment 2009
measures of variability (rank number 5). Payment of overtime enjoys the second highest mean score from the respondents but it has the lowest variability. In general, however, all the average judgments arising from the respondent returns indicate mean values that are above the measure of variability, the standard deviation. When this fact is translated into statistical terms, the computed means are statistically significant, which are at least at the 5 percent level. As will be seen below, the responses to the policies on severance costs, fixed-term contracts, and worker dismissal indicate that these are the most challenging labor policies to a number of firms. Still, they have wide acceptability based on the magnitude of favorable responses.
The policies related to labor training (on the quality of vocational schools and on incentives for training) have the highest level of volatility of the mean scores. But they still represent a situation in which the calculated variability is lower than the mean score.
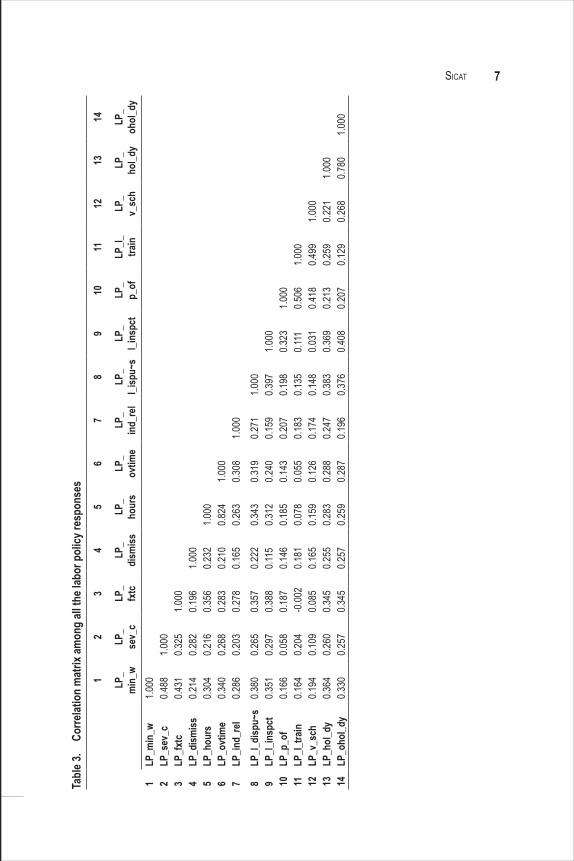
CorrelationsTable 3 shows the simple correlation matrix of the responses with each other. Correlations have values ranging from +1.0 to –1.0. Given the design of the questions, most of the answers are expected to be positive correlations, with none having negative correlations. The obvious correlation of a given policy with itself is 1.0. The matrix reads best row-wise against the column entry, or alternatively, column-wise against the row entry. It is essentially a two-by-two matrix: a particular policy read on the row correlated against the entry that is given on the answers to the policy listed in the column.
For instance, the policy on the payment of severance costs (LP_sev_c) in the second row is correlated 0.48 with the minimum wage (column 1). This high level of correlation shows that most answers relating to the minimum wage issue have close to 50 percent chance of viewing the policy on severance costs in the same way.
Highly related policy issues tend to have high correlations. Correlation implies that responses tend to complement each other. For instance, respondents that tend to approve a given policy would approve another closely related labor policy. If the response is one of disapproval, then the same opinion is accorded to a similar policy. For instance, those who responded favorably to the general policy on holidays tend to favor the discretionary nature of additional local holidays and nonworking holidays (close to 0.80). The same is true of responses on hours of work in relation to the overtime payment (correlation is 0.82).
The correlation of the responses varies according to the specific labor policy under consideration. Take the case, again, of the responses on severance payment for affected workers. As could be gleaned from column 2 and the
7SicatTa
ble 3
. Co
rrelat
ion
mat
rix am
ong
all th
e lab
or p
olicy
resp
onse
s1
23
45
67
89
1011
1213
14
LP_
min
_w
LP_
sev_
c
LP_
fxtc
LP
_di
smiss
LP
_ho
urs
LP
_ov
time
LP
_in
d_re
l LP
_l_i
spu~
s LP
_l_i
nspc
t LP
_p_
of
LP_l_
train
LP
_v_
sch
LP
_ho
l_dy
LP
_oh
ol_d
y 1
LP_m
in_w
1.0
002
LP_s
ev_c
0.4
881.0
003
LP_f
xtc
0.4
310.3
251.0
004
LP_d
ismiss
0.2
140.2
820.1
961.0
005
LP_h
ours
0.3
040.2
160.3
560.2
321.0
006
LP_o
vtim
e
0.340
0.268
0.283
0.210
0.824
1.000
7LP
_ind_
rel
0.2
860.2
030.2
780.1
650.2
630.3
081.0
008
LP_l_
disp
u~s
0.3
800.2
650.3
570.2
220.3
430.3
190.2
711.0
009
LP_l_
insp
ct
0.351
0.297
0.388
0.115
0.312
0.240
0.159
0.397
1.000
10LP
_p_o
f
0.166
0.058
0.187
0.146
0.185
0.143
0.207
0.198
0.323
1.000
11LP
_l_tra
in
0.164
0.204
-0.00
20.1
810.0
780.0
550.1
830.1
350.1
110.5
061.0
0012
LP_v
_sch
0.1
940.1
090.0
850.1
650.1
590.1
260.1
740.1
480.0
310.4
180.4
991.0
0013
LP_h
ol_d
y
0.364
0.260
0.345
0.255
0.283
0.288
0.247
0.383
0.369
0.213
0.259
0.221
1.000
14LP
_oho
l_dy
0.3
300.2
570.3
450.2
570.2
590.2
870.1
960.3
760.4
080.2
070.1
290.2
680.7
801.0
00
8 PhiliPPine Journal of DeveloPment 2009
corresponding correlations across the rows, in general a lot of responses to policies are substantially positively correlated if the correlations are low. But 10 of the responses to labor policies of different types are correlated with the policy of severance pay by at least 25 percent of the time. The highest correlation lies in responses on the minimum wage.
Some of the labor policies elicit responses that are closely linked with one another. Approval ratings for the minimum wage, severance costs, restrictions on fixed-term contracts, the policy on settling industrial disputes, and holidays tend to go together. But responses to policies with respect to training, restrictions on dismissal, and vocational schools tend to have less in common with the responses to other policies.
All this discussion of correlation coefficients indicates a high degree of variations among the responses to specific policies.
Correlations of the responses to various policies are just a peep through the window. It is still important to understand the nature of the respondent firms and how they respond to specific policies. Thus, it is also vital to delve into firm characteristics and understand how these shape company opinions of specific policies. A firm’s group background may embody important behavioral characteristics that may be associated with its outlook, objectives, or special interests.
For instance, a company that has been around for long may display a degree of complacency about certain policy issues that are otherwise cause for concern for a younger company. An enterprise mainly engaged in domestic business may behave differently from one that caters to foreign markets. A firm owned by local citizens could respond differently from a foreign-owned firm. A company with a very large employment size may have different assessments of the same policy compared to one with a very small manpower complement.
It is therefore desirable to find new information about respondent firms that differentiate them from one another. In this way, it is possible to analyze any degree of “noise” that might separate them in their judgments about particular labor market policies. This could lead to critical information that could be missed by focusing on average responses. Key to an effective policy analysis is understanding the subtleties underlying complex issues and using them effectively.
Specifically, the survey design allowed the regrouping of various respondents by specific characteristics, which are outlined below.
By the response of the firms to government investment incentives (recipients or nonrecipients; the survey asked if the firm is or had been a Board of Investments-or Philippine Economic Zone Authority-registered enterprise).
9Sicat
By the main sector of activity of the firm (manufacturing or services, which were the only ones comprehensively surveyed in the study).
By type of market served by the firm (the survey asked companies to indicate the extent of their sales to market destination, domestic or foreign. For purposes of the study, only those catering to the domestic market were compared with those catering solely to the foreign markets. A few respondents have mixed markets.)
By the nature of the enterprise ownership of the companies (respondent firms were either 100% Filipino enterprises, joint ventures with at least 60% Filipino ownership, joint ventures with at least 60% foreign direct investment [FDI] ownership, or 100% FDI).
By age of the enterprise (based on the year of their corporate registration in the Philippines, firms were classified as new [one to five years old], more than five to 10 years old, more than 10 years old to 20 years old, and more than 20 years old).
By size of employment (based on standards set by the Philippine statistical authorities, the firms were reclassified as micro [with up to 9 workers], small [with 10–99 workers], medium [with 100–199 workers], and large [with more than 200 workers]).
COMPANY CHArACtErIStICS AND tHEIr rESPONSESSurvey responses that yielded poor ratings for certain labor market policies were analyzed to determine the nature of firms that gave such responses. Such enterprises are likely to have been adversely affected by these policies.
One major concern in the realm of economic policy is the inability of the country to generate massive employment despite legal moves to raise labor standards. This concern may not be readily blamed on specific labor policies, since there are other factors that affect overall economic growth and employment.
For decades, these policies have been widely accepted by the public, thus creating a feeling of comfort about them. In fact, relying mainly on the average scores or the frequency of responses could lead to a mistaken notion that all is well with respect to these policies and therefore dispel the need to change them.
A different outcome could arise from some analysis of critical information about the policies. The purpose of sound policymaking is to understand how criticisms of existing policies could help improve them such that they can boost economic and social development.3 An understanding of the views of specific firms
3 In the discussion below, the statement that a group of firms receives a poor rating might refer to the sum of very poor and poor together. It is therefore useful to refer to the table whenever examining the full meaning of the statement.
10 PhiliPPine Journal of DeveloPment 2009
toward some policies could provide a hint about where desirable improvements are possible and how they can boost economic growth.
Understanding the types of firms that are critical of certain policies also facilitates understanding of those enterprises that favor such policies.
The discussion below focuses on the critical answers to each of the 14 labor policy issues posed in the survey. For ease of reference, 14 frequency tables contain the responses “very poor” and “poor,” summing up the two sets of responses and then showing these as a percent of the total responses to the survey. The final column indicates the percent of respondents to a specific labor policy issue.
Responses critical of specific labor policies yielded ratings of 1 and 2. Each of these tables is a set of two-by-two tables: the frequencies of company responses of “very poor” and “poor” are matched against the specific grouping (that is defined by a specific characteristic classification) to which the respondent firm belongs.
Labor policy 1: Minimum wage Responses to the issue of minimum wage revolved around the level at which it is set and how it is done. Under the law, a regional wage-setting process is mandatory even as the national wage level is often influenced by that of the Metro Manila region. All regional wages fall below that of Metro Manila while the regional wage boards oftentimes act only after the Metro Manila level has been set.
The sample of respondents was mainly drawn from two major areas of the country: Cebu and Metro Manila. But because of the presence of numerous firms in the CALABARZON (located in Southern Luzon and comprising Cavite, Laguna, Batangas, Rizal, and Quezon) region, some of them were included as respondents. Care, however, was taken to ensure that the respondent firms were evenly spread out by municipality. The choice of the samples was confined to Metro Manila and Cebu—two regions with different minimum wage-setting schemes. The Metro Manila rates are slightly higher than those of Cebu.
CALABARZON is almost an extension of the Metro Manila region. Firms in the region are geographically close to Metro Manila. Their economic and locational conditions appear to be similar to those of the latter. And there are only a few of them.
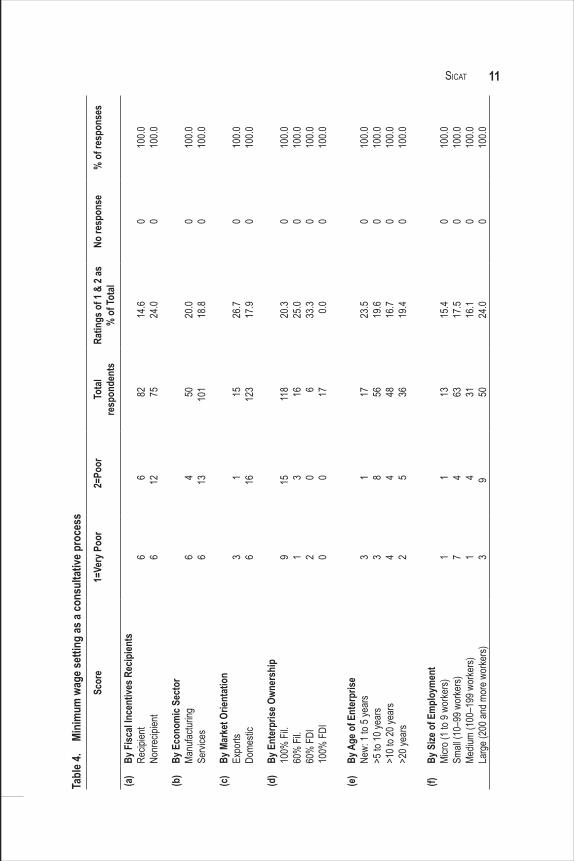
Table 4 presents the results of the survey indicating outlier responses. The mean score of the respondents is 3.28 (Table 1). With the exception of the labor policy on the issue of dismissal of workers, this is the lowest rating received from 157 respondents. That all of the firms responded to the question suggests that none
11SicatTa
ble 4
. Mi
nim
um w
age s
ettin
g as
a co
nsul
tativ
e pro
cess
Scor
e1=
Very
Poo
r2=
Poor
Tota
lre
spon
dent
sRa
tings
of 1
& 2
as
% o
f Tot
alNo
resp
onse
%
of r
espo
nses
(a)
By F
iscal
Ince
ntive
s Rec
ipien
tsRe
cipien
tNo
nrec
ipien
t6 6
6 1282 75
14.6
24.0
0 010
0.010
0.0
(b)
By E
cono
mic
Sect
orMa
nufac
turing
Servi
ces
6 64 13
50 101
20.0
18.8
0 010
0.010
0.0
(c)
By M
arke
t Orie
ntat
ion
Expo
rtsDo
mesti
c3 6
1 1615 12
326
.717
.90 0
100.0
100.0
(d)
By E
nter
prise
Own
ersh
ip10
0% F
il.60
% F
il.60
% F
DI10
0% F
DI
9 1 2 0
15 3 0 0
118 16 6 17
20.3
25.0
33.3 0.0
0 0 0 0
100.0
100.0
100.0
100.0
(e)
By A
ge o
f Ent
erpr
iseNe
w: 1
to 5 y
ears
>5 to
10 ye
ars
>10 t
o 20 y
ears
>20 y
ears
3 3 4 2
1 8 4 5
17 56 48 36
23.5
19.6
16.7
19.4
0 0 0 0
100.0
100.0
100.0
100.0
(f)By
Size
of E
mpl
oym
ent
Micro
(1 to
9 wo
rkers)
Sm
all (1
0–99
wor
kers)
Mediu
m (1
00–1
99 w
orke
rs)La
rge (
200 a
nd m
ore w
orke
rs)
1 7 1 3
1 4 4 9
13 63 31 50
15.4
17.5
16.1
24.0
0 0 0 0
100.0
100.0
100.0
100.0
12 PhiliPPine Journal of DeveloPment 2009
of them was indifferent to the issue or was unaware of its implications on their operations. All these show that there is a wide range of respondents who favor this relatively low rating.
By recipient or nonrecipient of fiscal incentives. Twelve respondents, or 14.6 percent of a total of 82 recipients of fiscal incentives gave a very poor or poor rating. A larger proportion, or 24 percent of 75 nonrecipient firms gave similar ratings. Nonrecipient companies of investment incentives expressed greater resentment toward the policy governing the minimum-wage setting process. Local firms thriving under a uniform business environment appear to be more hurt by mandated minimum wages than those who have been granted additional investment incentives.
By economic sector. There is no significant difference in the attitude of respondents within the manufacturing and services sectors toward the minimum wage. Around one-fifth of the firms in both sectors rated the minimum wage issue as either poor or very poor.
By market orientation: domestic or export. A higher proportion of export firms have a poor opinion of the minimum wage policy compared to those serving only the domestic market. Four (26.7%) of 15 export firms rated it as poor compared to only 17.9 percent of the 123 domestic market-oriented respondent firms.
By ownership of enterprises. The critical view of minimum wage legislation came mainly from firms owned by Filipino nationals, whether 100 percent-owned or 60 percent controlled joint-venture investments. Foreign enterprises, especially 100 percent-owned companies, expressed little dissatisfaction with the policy. Therefore, in general, the respondents found the minimum wage rate low. Since foreign companies tend to pay their workers higher than the government-mandated minimum wage, it can be concluded that the minimum wage policy hurts Filipino-owned domestic firms more compared to those owned by foreigners.
By age of the enterprise. Younger firms tended to be more vocal in their views of the policy than older ones. Still the latter made up a sizeable size of firms—close to 20 percent among firm respondents that were more than 20 years old.
By employment size of the firm. The larger a firm is by employment size, the more critical it is of the minimum wage policy. Among micro, small- and medium-sized firms by employment size (with less than 9 to 199 workers), the proportion of those respondent firms rated the minimum wage policy as poor ranged from 15.4 percent to
13Sicat
17.5 percent. But of the 50 large respondent firms, 12 gave the policy a poor rating.
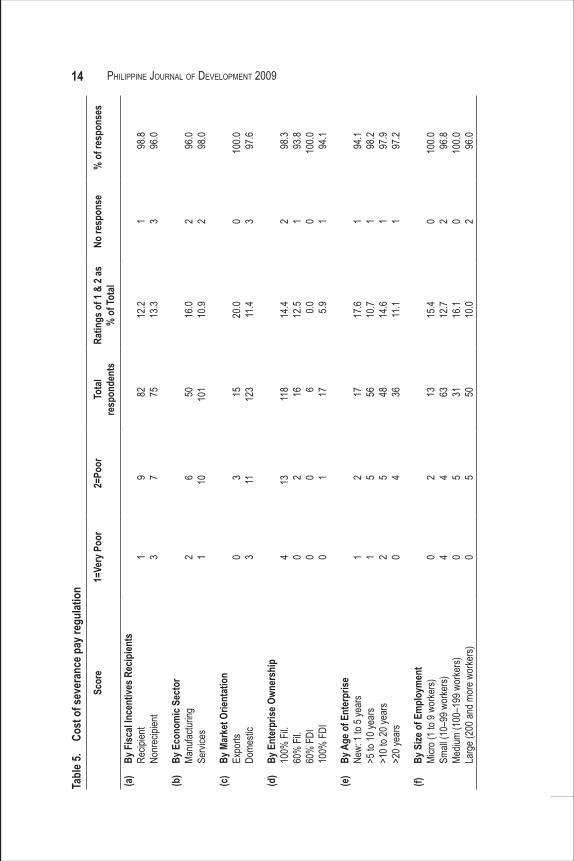
Labor policy 2: Cost-of-severance pay regulationThe survey also sought to determine respondent views on the policy on employee severance pay. Severance payment is money paid to employees on top of their wages when they leave the firm. It is a labor welfare standard mandated by law and which is accorded to regular employees. Temporary workers or casual workers are not entitled to this benefit.
Respondents who rated the policy as either poor or very poor indicated that they found it too costly. Still, it was the issue of minimum wage that generated stronger reactions from the respondents, at least 10 percent of whom gave it a rating of poor or very poor.
Recipients of fiscal incentives as well as local companies tended to be less vocal in their objections to the policy on severance pay. This is also true of respondent firms in the manufacturing sector whose responses contrasted with those in the services. Export-oriented enterprises, on the other hand, seemed more critical of the policy than those selling mainly to the domestic market. Younger firms (aged up to 5 years old) tended to be more sensitive to this issue compared to older firms, who appeared resigned to it and who comprised a smaller proportion of respondents who did not favor the policy. Enterprises with huge manpower pools were less critical of the policy than smaller firms.
Table 5 shows the various responses to the labor policy on severance pay. By recipient or nonrecipient of fiscal incentives. There was little
difference in the reaction of firms to the policy on severance pay. By economic sector. Respondent firms in the manufacturing
industry were proportionately more sensitive to the policy on severance pay than those in the services sector. Eight, or 16 percent of the 50 manufacturing respondents rated the policy as poor. Of 101 respondents in the services sector, 11, or 11 percent of them, gave it a poor rating. Poor ratings exceeded very poor ratings in both sectors.
By market orientation: domestic or export. Proportionately, more export firms rated the policy as poor compared to those catering to the domestic market. Of the 15 fully export firms, three, or 20 percent of the respondents gave the policy a poor rating. Domestic–oriented firms that rated this policy made up 11.4 percent of 123 respondents.
By ownership of enterprises. Dissatisfaction with the policy was most pronounced among 100 percent Filipino-owned enterprises.
14 PhiliPPine Journal of DeveloPment 2009Ta
ble 5
. Co
st o
f sev
eran
ce p
ay re
gulat
ion
Scor
e1=
Very
Poo
r2=
Poor
Tota
lre
spon
dent
sRa
tings
of 1
& 2
as
% o
f Tot
alNo
resp
onse
%
of r
espo
nses
(a)
By F
iscal
Ince
ntive
s Rec
ipien
tsRe
cipien
tNo
nrec
ipien
t1 3
9 782 75
12.2
13.3
1 398
.896
.0
(b)
By E
cono
mic
Sect
orMa
nufac
turing
Servi
ces
2 16 10
50 101
16.0
10.9
2 296
.098
.0
(c)
By M
arke
t Orie
ntat
ion
Expo
rtsDo
mesti
c0 3
3 1115 12
320
.011
.40 3
100.0 97
.6
(d)
By E
nter
prise
Own
ersh
ip10
0% F
il.60
% F
il.60
% F
DI10
0% F
DI
4 0 0 0
13 2 0 1
118 16 6 17
14.4
12.5 0.0 5.9
2 1 0 1
98.3
93.8
100.0 94
.1
(e)
By A
ge o
f Ent
erpr
iseNe
w: 1
to 5 y
ears
>5 to
10 ye
ars
>10 t
o 20 y
ears
>20 y
ears
1 1 2 0
2 5 5 4
17 56 48 36
17.6
10.7
14.6
11.1
1 1 1 1
94.1
98.2
97.9
97.2
(f)By
Size
of E
mpl
oym
ent
Micro
(1 to
9 wo
rkers)
Sm
all (1
0–99
wor
kers)
Mediu
m (1
00–1
99 w
orke
rs)La
rge (
200 a
nd m
ore w
orke
rs)
0 4 0 0
2 4 5 5
13 63 31 50
15.4
12.7
16.1
10.0
0 2 0 2
100.0 96
.810
0.0 96.0
15Sicat
More Filipino-controlled joint ventures, albeit marginally, seemed to favor this policy compared to fully Filipino-owned enterprises. Firms that are owned by foreigners—whether fully owned or joint ventures—generally accepted severance cost as part of the employment contracts.
By age of the enterprise. Newer firms tended to be more critical of severance costs compared to older firms. Of 17 new firms (1 to 5 years old), five, or 17 percent of them rated the policy on severance costs as poor. Firms aged 6 to 10 years old expressed greater tolerance toward the policy, with only 10.7 percent of them rating the policy as poor. Among much older firms (above 20 years), 11 percent, or four of the 36 firms, gave this policy issue a poor rating. A slight spike in dissatisfaction was observed among firms that are more than 10 to 20 years old. Among these, 14.6 percent, or 7 of 48 respondent firms, rated the policy as either poor or very poor.
By employment size of the firm. The responses of firms by employment size approximated those of firms classified by age. Small firms (with 10 to 99 workers) that rated the severance pay policy negatively comprised 12.7 percent of the respondents; micro enterprises, 15.4 percent. More medium-sized firms (with 100 to 199 workers) gave the policy negative ratings. Among large firms (with more than 200 workers), only 5, or 10 percent of the 50 respondents, rated this policy as poor.
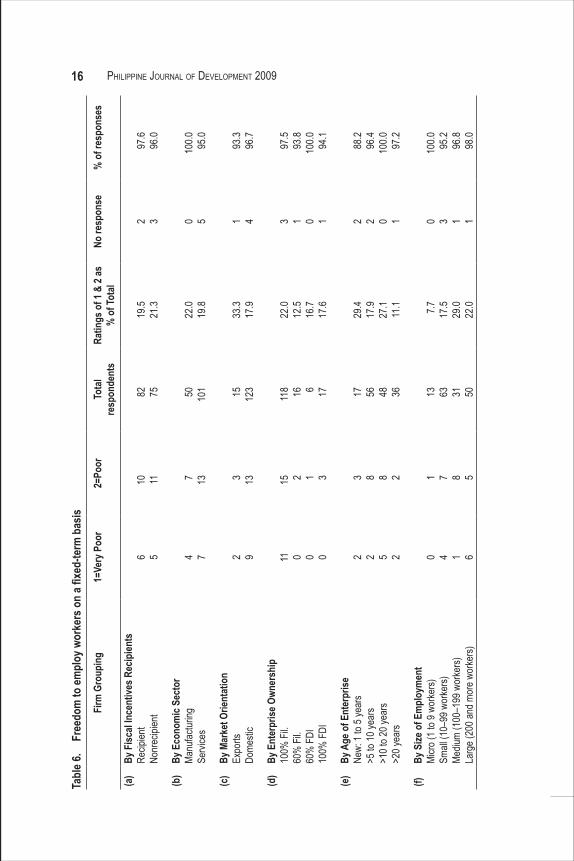
Labor policy 3: Freedom to employ on a fixed-term basisTo protect employees from being employed on a temporary basis for long periods, labor policy has required that temporary workers be elevated to full-time status after six months of their employment. However, some enterprises want more leeway in dealing with workers on temporary contracts so they can control costs and citing specific and nonrecurrent projects that do not require fixed-term contracts. But those who favor this policy say it helps ensure employment stability for temporary workers.
The proportion of responses indicating very poor and poor ratings on the policy varied based on certain firm characteristics. At least 20 percent of respondents across most classifications of firms rated the policy either as poor or very poor.
Table 6 shows the survey responses to the policy on restrictions to fixed-term labor contracts.
By recipient or nonrecipient of fiscal incentives. Among firms that received or did not receive fiscal incentives, there was no marked difference in their view of this policy. Among respondents, 20 percent
16 PhiliPPine Journal of DeveloPment 2009Ta
ble 6
. Fr
eedo
m to
empl
oy w
orke
rs o
n a fi
xed-
term
bas
isFi
rm G
roup
ing
1=
Very
Poo
r2=
Poor
Tota
lre
spon
dent
sRa
tings
of 1
& 2
as
% o
f Tot
alNo
resp
onse
%
of r
espo
nses
(a)
By F
iscal
Ince
ntive
s Rec
ipien
tsRe
cipien
tNo
nrec
ipien
t6 5
10 1182 75
19.5
21.3
2 397
.696
.0
(b)
By E
cono
mic
Sect
orMa
nufac
turing
Servi
ces
4 77 13
50 101
22.0
19.8
0 510
0.0 95.0
(c)
By M
arke
t Orie
ntat
ion
Expo
rtsDo
mesti
c2 9
3 1315 12
333
.317
.91 4
93.3
96.7
(d)
By E
nter
prise
Own
ersh
ip10
0% F
il.60
% F
il.60
% F
DI10
0% F
DI
11 0 0 0
15 2 1 3
118 16 6 17
22.0
12.5
16.7
17.6
3 1 0 1
97.5
93.8
100.0 94
.1
(e)
By A
ge o
f Ent
erpr
iseNe
w: 1
to 5 y
ears
>5 to
10 ye
ars
>10 t
o 20 y
ears
>20 y
ears
2 2 5 2
3 8 8 2
17 56 48 36
29.4
17.9
27.1
11.1
2 2 0 1
88.2
96.4
100.0 97
.2
(f)By
Size
of E
mpl
oym
ent
Micro
(1 to
9 wo
rkers)
Sm
all (1
0–99
wor
kers)
Mediu
m (1
00–1
99 w
orke
rs)La
rge (
200 a
nd m
ore w
orke
rs)
0 4 1 6
1 7 8 5
13 63 31 50
7.7 17.5
29.0
22.0
0 3 1 1
100.0 95
.296
.898
.0
17Sicat
in either class of firms rated this policy either as very poor or poor. This is a fairly high level of disapproval of the policy under consideration.
By economic sector. Slightly more respondent firms in manufacturing rated the policy as either very poor or poor compared to those in the services sector. The level of dissatisfaction was noted among a sizeable 20 percent of the respondents.
By market: domestic or export orientation. More firms engaged in exports expressed disapproval of this policy compared to those serving the domestic market, with five (33%) of 15 respondent firms and 22 (16.7%) of 123 respondent firms, respectively. Thus the export sector appeared more hurt by this policy.
By ownership of enterprises. Filipino-owned enterprises appear more critical of this labor policy, with 26 or 29.4 percent of 118 respondents rating it as poor or very poor. Among respondents comprising foreign-owned enterprises (fully or 60% controlled), 17 percent gave the policy similar ratings, indicating less intense sentiments toward the policy compared to the former. By all accounts, however, this policy is more discomfiting to foreign-owned enterprises than those on severance pay and minimum wage, which they consider socially useful.
By age of the enterprise. This labor policy restricting fixed-term contracts for workers was viewed most critically by new respondent firms and by companies that aged more than 10 years to 20 years old. Of the 17 respondent firms in this age group, five of them (29%) rated the policy as poor. Such rating persisted also among firms that have been around for 20 years, and even more so among firms that have been in operation for more than 20 years.
By employment size of the firm. The smaller a firm is, the less important is the restriction against fixed-term contracts. More respondent firms with bigger manpower complement rated this policy as poor. Among medium-sized enterprises (with 100 to 199 workers), 9 out of 31 firms, or 29.0 percent, the policy also rated poorly. Among large firms with more than 200 workers, 11 of 50 respondent firms, or 22.0 percent, rated the policy as poor. This shows that the impact of such a policy is greater on large companies.
Labor policy 4: regulations against worker dismissal The policy relating to worker dismissal is designed to protect workers from arbitrary dismissal. Companies are legally bound to observe due process before terminating a worker with cause. Among others, this requires written justification, which some firms may find difficult to comply with owing to the complexity
18 PhiliPPine Journal of DeveloPment 2009
of certain situations underlying such a decision. The company also risks lawsuit from the affected workers, who by law are entitled to their day in court.
On the other hand, employers have the right to remove workers with cause. The stringent restrictions are considered an infringement on the firm’s need for speedy action and flexibility, especially if the case at hand affects worker morale and company productivity. If firms find it difficult to dismiss erring workers, so the argument goes, then it would be hampered in its market performance.
The law requires just cause for firing an employee. While the law also recognizes a company’s right to dismiss workers with cause, the corresponding legal conditions it imposes could exact a high cost on the employer. Based on the survey, this specific component of employment protection generated the strongest negative reaction among the respondents.
Among the labor market policies covered in this study, the policy surrounding the dismissal of a worker received the lowest average score from respondents (Table 1). This is due to the high degree of “very poor” and “poor” ratings that respondent firms gave to this labor policy.
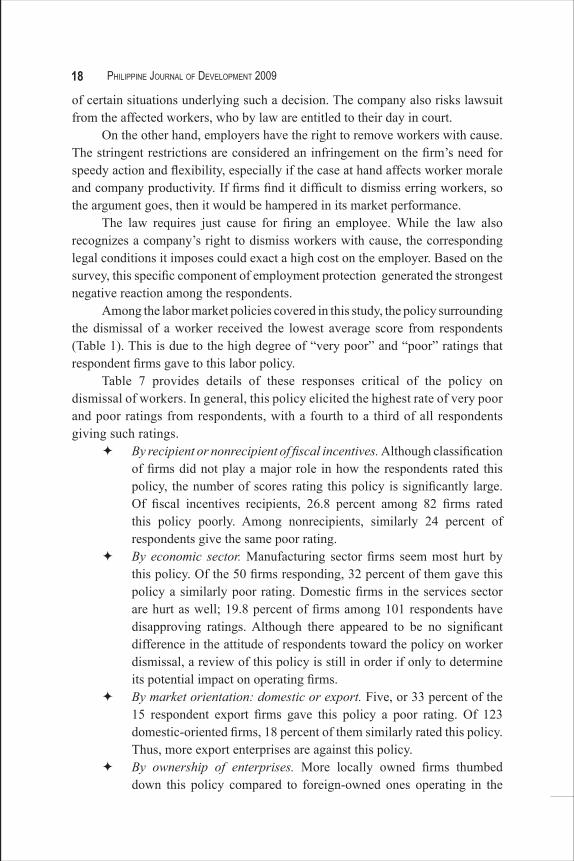
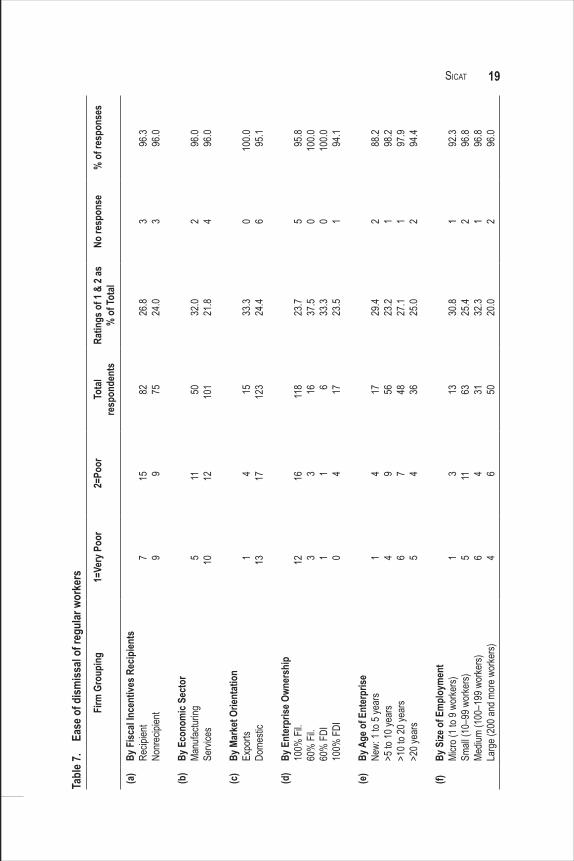
Table 7 provides details of these responses critical of the policy on dismissal of workers. In general, this policy elicited the highest rate of very poor and poor ratings from respondents, with a fourth to a third of all respondents giving such ratings.
By recipient or nonrecipient of fiscal incentives. Although classification of firms did not play a major role in how the respondents rated this policy, the number of scores rating this policy is significantly large. Of fiscal incentives recipients, 26.8 percent among 82 firms rated this policy poorly. Among nonrecipients, similarly 24 percent of respondents give the same poor rating.
By economic sector. Manufacturing sector firms seem most hurt by this policy. Of the 50 firms responding, 32 percent of them gave this policy a similarly poor rating. Domestic firms in the services sector are hurt as well; 19.8 percent of firms among 101 respondents have disapproving ratings. Although there appeared to be no significant difference in the attitude of respondents toward the policy on worker dismissal, a review of this policy is still in order if only to determine its potential impact on operating firms.
By market orientation: domestic or export. Five, or 33 percent of the 15 respondent export firms gave this policy a poor rating. Of 123 domestic-oriented firms, 18 percent of them similarly rated this policy. Thus, more export enterprises are against this policy.
By ownership of enterprises. More locally owned firms thumbed down this policy compared to foreign-owned ones operating in the
19SicatTa
ble 7
. Ea
se o
f dism
issal
of re
gular
wor
kers
Firm
Gro
upin
g
1=Ve
ry P
oor
2=Po
orTo
tal
resp
onde
nts
Ratin
gs o
f 1 &
2 as
%
of T
otal
No re
spon
se
% o
f res
pons
es
(a)
By F
iscal
Ince
ntive
s Rec
ipien
tsRe
cipien
tNo
nrec
ipien
t7 9
15 982 75
26.8
24.0
3 396
.396
.0
(b)
By E
cono
mic
Sect
orMa
nufac
turing
Servi
ces
5 1011 12
50 101
32.0
21.8
2 496
.096
.0
(c)
By M
arke
t Orie
ntat
ion
Expo
rtsDo
mesti
c1 13
4 1715 12
333
.324
.40 6
100.0 95
.1
(d)
By E
nter
prise
Own
ersh
ip10
0% F
il.60
% F
il.60
% F
DI10
0% F
DI
12 3 1 0
16 3 1 4
118 16 6 17
23.7
37.5
33.3
23.5
5 0 0 1
95.8
100.0
100.0 94
.1
(e)
By A
ge o
f Ent
erpr
iseNe
w: 1
to 5 y
ears
>5 to
10 ye
ars
>10 t
o 20 y
ears
>20 y
ears
1 4 6 5
4 9 7 4
17 56 48 36
29.4
23.2
27.1
25.0
2 1 1 2
88.2
98.2
97.9
94.4
(f)By
Size
of E
mpl
oym
ent
Micro
(1 to
9 wo
rkers)
Sm
all (1
0–99
wor
kers)
Mediu
m (1
00–1
99 w
orke
rs)La
rge (
200 a
nd m
ore w
orke
rs)
1 5 6 4
3 11 4 6
13 63 31 50
30.8
25.4
32.3
20.0
1 2 1 2
92.3
96.8
96.8
96.0
20 PhiliPPine Journal of DeveloPment 2009
country, with 22 percent and 17.6, respectively. This shows that the policy hurts the former more than the latter. The policy on dismissal of labor requires further study in light of liberalization if the country is to attract more foreign-owned companies.
By age of the enterprise. Younger firms tended to give this policy a poor rating compared to the oldest of the respondent firms. Disapproval of the policy was strongest among firms that have been in operation for five years. Older companies, like those in the more than 10 years up to 20 years of operational existence, rated this policy as poor. Within this group, 13 of 48 respondent firms, or 27 percent of them, rated this policy as either poor or very poor. Firms that have existed for much longer than 20 years were not as critical of the policy, though, with only a little over tenth (11%) of the 36 respondents giving it a negative rating.
By employment size of the firm. A universal margin of small to large enterprises (with more than 10 and up to more than 200 workers) rated the policy as poor or very poor. Among the 31 medium-sized respondent enterprises, 29 percent thought poorly of the policy. Findings showed restrictions to worker dismissal needed the most attention for reform among the policies covered.
Labor policy 5: regulation on work hours per weekIntroduced in the early 1960s, the 40-hour workweek is one of the earliest labor market regulations to be enforced in the Philippines. It is the legally mandated maximum workweek length in industrialized countries. Minimum wages are based on eight hourly cycles, and salaries in general are based on this labor standard. Another measure of standard work hours refers to the work of women. Based on the traditional view of work hours, women are allowed to work only during specific hours of the day. The night work prohibition for women is one of the requirements of law protecting women employed in industry and commerce. Hence the limited supply of labor for the night shift in factories.
The imposition of regulated working hours is considered a humane workplace practice, because it protects workers against exploitation. Industrial enterprises in general appear to have adopted it without complaint. Mandating standard work hours sets the stage for the imposition of additional pay for extended work hours.
This regulation is also intended to discourage the occurrence of sweatshops, places of work known for their excessive work hours for very little pay. Yet, workers in these places are forced to endure their conditions if only to make a living. Cognizant of this problem, the government encourages the establishment of cottage industries that operate outside the restrictions of many, if not all, of the labor standards that are part of the formal labor policies of the country.
21Sicat
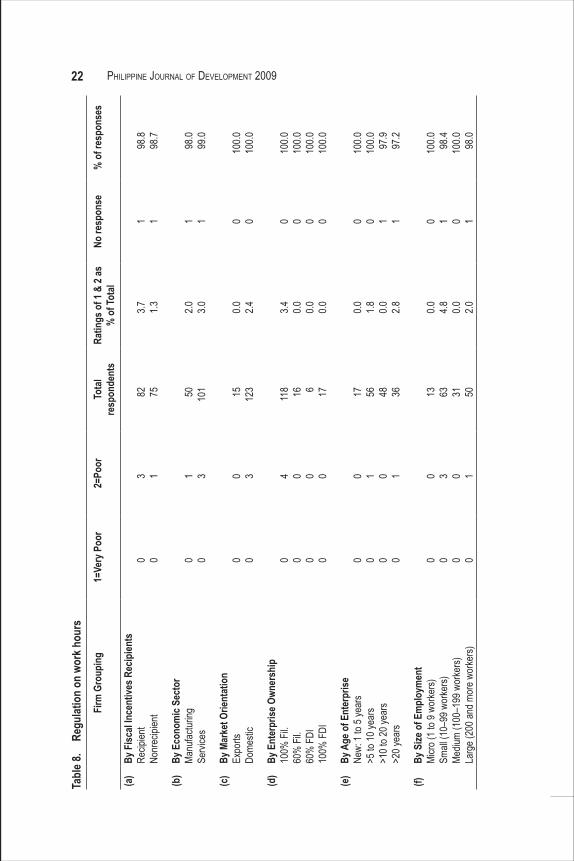
In general, there is wide acceptance of the regulation of hours of work as a labor policy. Responses yielded no very poor ratings while very few enterprises rated the policy as poor. This policy obtained the highest mean rating among all policies with the lowest variability.
Table 8 contains breakdowns of the responses by respondent characteristics. In general, this policy on regulated work hours seemed generally accepted. There were no “very poor” ratings and only two instances of poor ratings.
By recipient or nonrecipient of fiscal incentives. Only two respondent firms among nonrecipients gave the policy a score of poor.
By economic sector. The nature of the economic sector has no distinguishing role in the emerging responses.
By market orientation: domestic or export. The only respondents that gave the policy a poor rating belong to domestic-oriented firms. However, one respondent, or 6.7 percent among 15 exporters gave a similarly poor rating.
By ownership of enterprises. Only four, or 3.4 percent of 118 respondents among 100 percent Filipino-owned enterprises rated this policy as poor. No respondents among foreign-owned firms gave this policy a poor rating.
By age of the enterprise. This policy did not receive markedly significant poor ratings from the respondents.
By employment size of the firm. Only three (4.8%) of 63 respondent firms accorded the policy a poor rating.
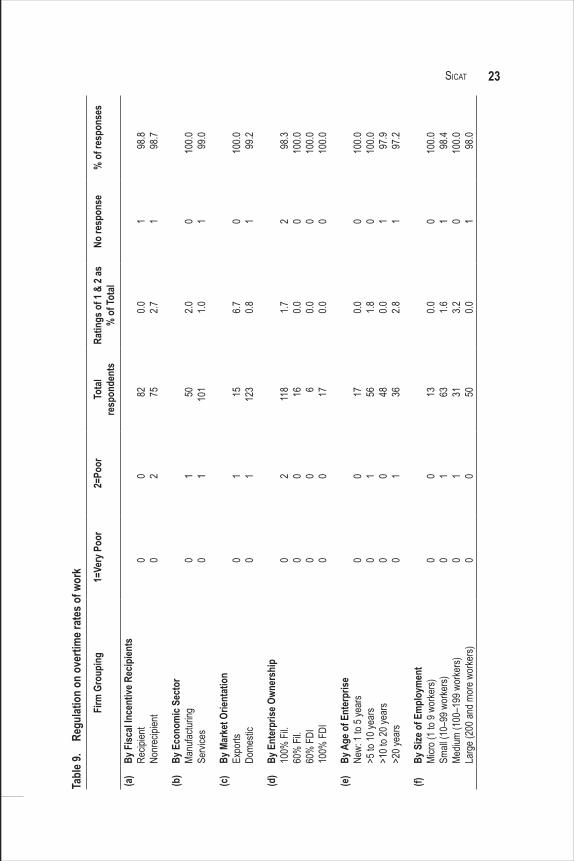
Labor policy 6: regulation on overtime rates of workThe labor policy on overtime is almost an extension of the regulation on work hours. Under such a policy, workers who render overtime work are allowed a higher pay over base pay. Overtime pay rate is 25 percent of the base pay and is different during holidays (see discussion under the labor laws on holidays). It becomes applicable after the full eight-hour work has been rendered. Overtime pay rates raise the hourly cost of labor but it may also be one way of compensating highly productive employees for work done beyond the standard work hours. Responses to this policy were similar to those involving working hours. Hence, this labor policy scored well in the comparison of average scores.
Table 9 indicates an insignificant number of firms that rated labor policy on overtime as poor. Such ratings were similar to those given to the regulation of work hours.
(a) By recipient or nonrecipient of fiscal incentives. Of the 82 recipients of fiscal incentives, not one gave the policy a poor rating while
22 PhiliPPine Journal of DeveloPment 2009Ta
ble 8
. Re
gulat
ion
on w
ork h
ours
Fi
rm G
roup
ing
1=
Very
Poo
r2=
Poor
Tota
lre
spon
dent
sRa
tings
of 1
& 2
as
% o
f Tot
alNo
resp
onse
%
of r
espo
nses
(a)
By F
iscal
Ince
ntive
s Rec
ipien
tsRe
cipien
tNo
nrec
ipien
t0 0
3 182 75
3.7 1.31 1
98.8
98.7
(b)
By E
cono
mic
Sect
orMa
nufac
turing
Servi
ces
0 01 3
50 101
2.0 3.01 1
98.0
99.0
(c)
By M
arke
t Orie
ntat
ion
Expo
rtsDo
mesti
c0 0
0 315 12
30.0 2.4
0 010
0.010
0.0
(d)
By E
nter
prise
Own
ersh
ip10
0% F
il.60
% F
il.60
% F
DI10
0% F
DI
0 0 0 0
4 0 0 0
118 16 6 17
3.4 0.0 0.0 0.0
0 0 0 0
100.0
100.0
100.0
100.0
(e)
By A
ge o
f Ent
erpr
iseNe
w: 1
to 5 y
ears
>5 to
10 ye
ars
>10 t
o 20 y
ears
>20 y
ears
0 0 0 0
0 1 0 1
17 56 48 36
0.0 1.8 0.0 2.8
0 0 1 1
100.0
100.0 97
.997
.2
(f)By
Size
of E
mpl
oym
ent
Micro
(1 to
9 wo
rkers)
Sm
all (1
0–99
wor
kers)
Mediu
m (1
00–1
99 w
orke
rs)La
rge (
200 a
nd m
ore w
orke
rs)
0 0 0 0
0 3 0 1
13 63 31 50
0.0 4.8 0.0 2.0
0 1 0 1
100.0 98
.410
0.0 98.0
23SicatTa
ble 9
. Re
gulat
ion
on o
verti
me r
ates
of w
ork
Firm
Gro
upin
g
1=Ve
ry P
oor
2=Po
orTo
tal
resp
onde
nts
Ratin
gs o
f 1 &
2 as
%
of T
otal
No re
spon
se
% o
f res
pons
es
(a)
By F
iscal
Ince
ntive
Rec
ipien
tsRe
cipien
tNo
nrec
ipien
t0 0
0 282 75
0.0 2.71 1
98.8
98.7
(b)
By E
cono
mic
Sect
orMa
nufac
turing
Servi
ces
0 01 1
50 101
2.0 1.00 1
100.0 99
.0
(c)
By M
arke
t Orie
ntat
ion
Expo
rtsDo
mesti
c0 0
1 115 12
36.7 0.8
0 110
0.0 99.2
(d)
By E
nter
prise
Own
ersh
ip10
0% F
il.60
% F
il.60
% F
DI10
0% F
DI
0 0 0 0
2 0 0 0
118 16 6 17
1.7 0.0 0.0 0.0
2 0 0 0
98.3
100.0
100.0
100.0
(e)
By A
ge o
f Ent
erpr
iseNe
w: 1
to 5 y
ears
>5 to
10 ye
ars
>10 t
o 20 y
ears
>20 y
ears
0 0 0 0
0 1 0 1
17 56 48 36
0.0 1.8 0.0 2.8
0 0 1 1
100.0
100.0 97
.997
.2
(f)By
Size
of E
mpl
oym
ent
Micro
(1 to
9 wo
rkers)
Sm
all (1
0–99
wor
kers)
Mediu
m (1
00–1
99 w
orke
rs)La
rge (
200 a
nd m
ore w
orke
rs)
0 0 0 0
0 1 1 0
13 63 31 50
0.0 1.6 3.2 0.0
0 1 0 1
100.0 98
.410
0.0 98.0
24 PhiliPPine Journal of DeveloPment 2009
among the 75 nonrecipient respondents, two firms rated this policy as poor.
(b) By economic sector. The two firms that registered a poor rating were split between manufacturing enterprises and the services sector. There were 50 manufacturing and 101 services firms among the respondents.
(c) By market orientation: domestic or export. Of the 15 export-oriented respondents, one respondent—a Filipino-owned enterprise—rated this policy as poor. This lone respondent represents 6.7 percent of the total firms in the sample. Only one of 123 domestic-oriented firms rated this policy as poor.
(d) By ownership of enterprises. Two Filipino-owned enterprises (out of 118 respondents) rated this policy as poor. Not one of the foreign-owned firm gave the policy a similar rating.
(e) By age of the enterprise. Of the two firms that gave this policy a poor rating, one was in the age group of 5 to 10 years and the other in than more than 20 years age bracket. Both were Filipino-owned enterprises.
(f) By employment size of the firm. One of two respondent firms belonged to small-scale companies by employment size, of which there were 63 firms in the sample. The other is a medium-scale company, of which there were 31 firms in the sample.
Labor policy 7: Industrial relations (labor-management relations)Industrial relations have become more peaceful in recent years. Major external trade adjustments marked by the country’s entry into the World Trade Organization (WTO), the moves of the Association of Southeast Asian Nations (ASEAN) toward a free-trade area, as well as adjustments triggered by the financial crisis of 1997 in East Asia, among others, changed the industrial climate and removed many protectionist barriers. These led to a decline of highly protected domestic industries. As a number of well-known companies began closing down their operations and restructuring their production locations within Southeast Asia, sometimes leaving and at other times repositioning their strengths within the Philippines, extreme labor activism was weakened at its core. That this was an international trend only made the process take its course naturally.
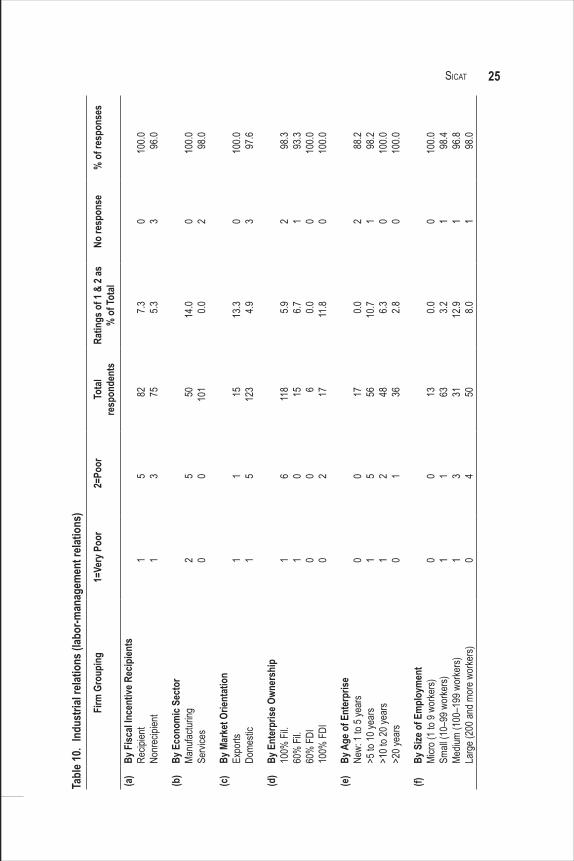
Table 10 shows only a few respondent firms were critical of the climate of industrial relations in the country. In general, the proportion of such respondents was smaller than those of other controversial policies such as those governing minimum wages, fixed-term contracts, and worker dismissal. Less than 10 percent of respondents in each class of firms had a critical view of the state of industrial relations in the country. This shows little dissatisfaction among respondents about the state of industrial relations in the Philippines.
25SicatTa
ble 1
0. In
dust
rial r
elatio
ns (l
abor
-man
agem
ent r
elatio
ns)
Firm
Gro
upin
g
1=Ve
ry P
oor
2=Po
orTo
tal
resp
onde
nts
Ratin
gs o
f 1 &
2 as
%
of T
otal
No re
spon
se
% o
f res
pons
es
(a)
By F
iscal
Ince
ntive
Rec
ipien
tsRe
cipien
tNo
nrec
ipien
t1 1
5 382 75
7.3 5.30 3
100.0 96
.0
(b)
By E
cono
mic
Sect
orMa
nufac
turing
Servi
ces
2 05 0
50 101
14.0 0.0
0 210
0.0 98.0
(c)
By M
arke
t Orie
ntat
ion
Expo
rtsDo
mesti
c1 1
1 515 12
313
.3 4.90 3
100.0 97
.6
(d)
By E
nter
prise
Own
ersh
ip10
0% F
il.60
% F
il.60
% F
DI10
0% F
DI
1 1 0 0
6 0 0 2
118 15 6 17
5.9 6.7 0.0 11.8
2 1 0 0
98.3
93.3
100.0
100.0
(e)
By A
ge o
f Ent
erpr
iseNe
w: 1
to 5 y
ears
>5 to
10 ye
ars
>10 t
o 20 y
ears
>20 y
ears
0 1 1 0
0 5 2 1
17 56 48 36
0.0 10.7 6.3 2.8
2 1 0 0
88.2
98.2
100.0
100.0
(f)By
Size
of E
mpl
oym
ent
Micro
(1 to
9 wo
rkers)
Sm
all (1
0–99
wor
kers)
Mediu
m (1
00–1
99 w
orke
rs)La
rge (
200 a
nd m
ore w
orke
rs)
0 1 1 0
0 1 3 4
13 63 31 50
0.0 3.2 12.9 8.0
0 1 1 1
100.0 98
.496
.898
.0
26 PhiliPPine Journal of DeveloPment 2009
By recipient or nonrecipient of fiscal incentives. There was no difference in the nature of responses between recipients and nonrecipients of fiscal incentives where their responses concerning industrial relations were concerned.
By economic sector. Of the 50 respondent firms within the manufacturing sector, seven firms gave a poor rating to the state of industrial relations policy. Although these represent around 14 percent of the respondents, such a proportion was significantly different from that in the services sector, where not one firm among the 101 respondents rated this policy as poor.
By market orientation: domestic or export. Among the 15 companies that are engaged in export sales, only two, or 13 percent, rated the policy as poor. In the case of 123 domestic market respondent companies, only 5 percent expressed a negative view of the state of industrial relations in the Philippines. In general, therefore, export-oriented companies tend to be more critical of this policy.
By ownership of enterprise. Despite general acknowledgement of industrial peace among companies by ownership, the 100 percent foreign direct investors, or 2 of 17 foreign-owned firms, which translates to 11.8 percent, assign the policy a rating of poor. Of the 100 percent and 60 percent Filipino-owned companies, only 6 percent gave the policy a similar rating. This shows that foreign companies were less inclined to be less satisfied with this labor policy on labor relations. There was little evidence, however, of direct complaint among these firms about the policy.
By age of enterprise. New enterprises hardly indicated poor ratings for the state of industrial relations. Some of the older firms were dissatisfied with the policy, yet their poor ratings were negligible.
By employment size of the firm. The labor policy on industrial relations does not seem to be a concern among very small firms. In general, it only rated poorly among a small percentage of larger firms. The few medium-sized firms and very large companies who gave it poor ratings represent no more than 13 percent of the respondent class, and even fewer among very large companies.
Labor policy 8: regulatory mechanisms for settling labor disputesAll enterprises encounter worker grievances in varying degrees as well as their own share of complaints against specific members of their workforce. At times, such a situation requires government intervention.
27Sicat
When grievance cases cannot be settled easily—or the mechanisms encourage a prolonged settlement—then the country’s court system becomes the venue for their settlement. Litigation is a costly process for all the parties involved, especially for the company concerned. How the latter responds to this labor policy issue essentially sets the course for the labor-management relations within the enterprise.
The issue of dispute resolution has one of the lowest ratings given by the respondents. The mean score ranks 11th (Table 1) and the variability of this mean score ranked 10th (Table 2). All this means that it is among the most controversial of the labor policies.
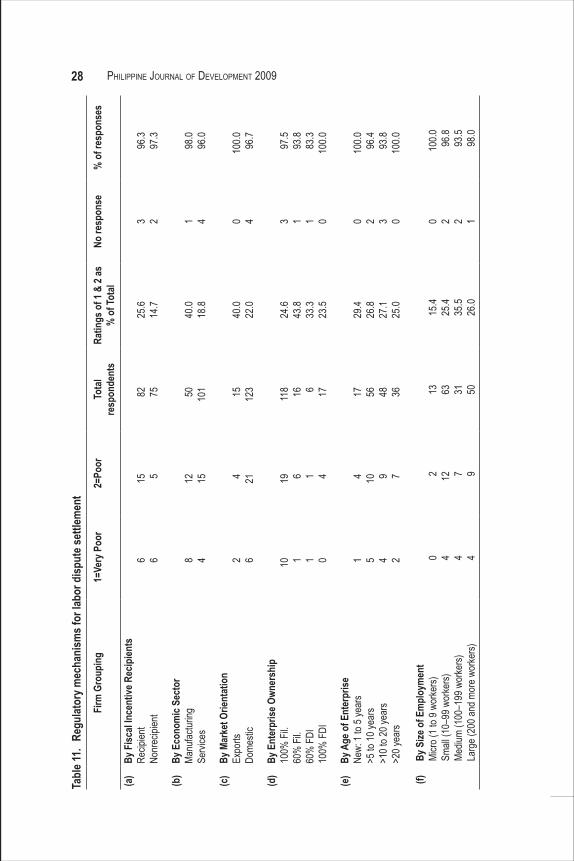
Table 11 indicates the various outlier responses for the labor policy on the mechanisms for settling labor disputes.
By recipient or nonrecipient of fiscal incentives. Recipients of fiscal incentives appeared less inclined to favor the existing labor dispute settlement mechanism in the country compared to nonrecipients of those incentives. Of the recipient firms, 24 percent of them gave the policy a poor rating. This perhaps approximates the number of instances of dispute affecting the respondents concerned, but this is at best a mere conjecture. The proportion of respondents among nonrecipient firms giving a similar rating stood at only 15 percent.
By economic sector. The policy was rated as poor by 20 of 50 respondents, which translated to 40 percent. Among respondents in the services sector, 18.8 percent or 19 of the 101 respondent companies, gave similar ratings. This shows that far more respondents in manufacturing frowned on the policy compared to those in the services industry.
By market orientation: domestic or export. Export companies also had a high proportion of respondents giving the policy a poor rating—40 percent of the 15 respondent companies. Among domestic-oriented companies, 22 percent or 27 of the 123 respondent companies, similarly rated the policy as poor.
By ownership of enterprises. In general, there is no marked difference between the ratings accorded by Filipino-owned and foreign owned companies for the policy, which obtained the same proportion of poor ratings as the mechanism for labor disputes. But despite the limited sample of respondent firms, less joint ventures—whether dominated
by nationals or by foreigners—gave the policy lower ratings compared to fully owned enterprises.
By age of the enterprise. A firm’s age made no difference in the respondents’ responses on the policy. Outlier responses—which
28 PhiliPPine Journal of DeveloPment 2009Ta
ble 1
1. Re
gulat
ory m
echa
nism
s for
labo
r disp
ute s
ettle
men
tFi
rm G
roup
ing
1=
Very
Poo
r2=
Poor
Tota
lre
spon
dent
sRa
tings
of 1
& 2
as
% o
f Tot
alNo
resp
onse
%
of r
espo
nses
(a)
By F
iscal
Ince
ntive
Rec
ipien
tsRe
cipien
tNo
nrec
ipien
t6 6
15 582 75
25.6
14.7
3 296
.397
.3
(b)
By E
cono
mic
Sect
orMa
nufac
turing
Servi
ces
8 412 15
50 101
40.0
18.8
1 498
.096
.0
(c)
By M
arke
t Orie
ntat
ion
Expo
rtsDo
mesti
c2 6
4 2115 12
340
.022
.00 4
100.0 96
.7
(d)
By E
nter
prise
Own
ersh
ip10
0% F
il.60
% F
il.60
% F
DI10
0% F
DI
10 1 1 0
19 6 1 4
118 16 6 17
24.6
43.8
33.3
23.5
3 1 1 0
97.5
93.8
83.3
100.0
(e)
By A
ge o
f Ent
erpr
iseNe
w: 1
to 5 y
ears
>5 to
10 ye
ars
>10 t
o 20 y
ears
>20 y
ears
1 5 4 2
4 10 9 7
17 56 48 36
29.4
26.8
27.1
25.0
0 2 3 0
100.0 96
.493
.810
0.0
(f)By
Size
of E
mpl
oym
ent
Micro
(1 to
9 wo
rkers)
Sm
all (1
0–99
wor
kers)
Mediu
m (1
00–1
99 w
orke
rs)La
rge (
200 a
nd m
ore w
orke
rs)
0 4 4 4
2 12 7 9
13 63 31 50
15.4
25.4
35.5
26.0
0 2 2 1
100.0 96
.893
.598
.0
29Sicat
indicated poor ratings for the policy—comprised about one-fourth of the total.
By employment size of the firm. With the exception of the smallest firms, the general responses of firms of whatever size of employment were also relatively high and similar in extent to the enterprises classified by their length of existence as companies.
Labor policy 9: Government monitoring of enterprisesThe labor inspection system involves judgment about the government implementation of labor laws and regulations. This consists of direct interaction between firms and agents of the law. Such contacts could be driven by the need for regular inspections and specific workplace issues that require government intervention or reporting.
To some extent, responses to the survey question on this issue reflected the companies’ perception of their interactions with government authorities. The nature of regulation of enterprise operation presupposes some degree of antagonism between the regulator, who implements government policy, and the company, which is the subject of the mandatory regulation. In this context, the interaction produces some friction. A high degree of negative response from respondent firms implies a need for improvement of the policy regime in question.
Interactions with the government could further involve issues beyond those affecting labor and employment. These include compliance with tax laws or laws involving the grant of fiscal support. While the survey question was mainly focused on labor issues, some of the emerging responses may be indicative of the respondents’ sentiments toward other regulatory issues involving the government.
Thus, while this question on government’s monitoring of companies’ compliance with labor laws was expected to yield responses that reflected the performance of the DOLE and its attached agencies, it was not limited to it. It could also cover the finance department and its tax-collecting units, namely, the internal revenue and customs bureau, and all other regulatory agencies with which firms interact in the course of their operations.
Based on the emerging responses from the survey, government inspection systems rated lower than the labor policy on dispute settlement. The former also elicited the same average rating as that of minimum wage legislation. This means that it is one of the biggest issues confronting companies.
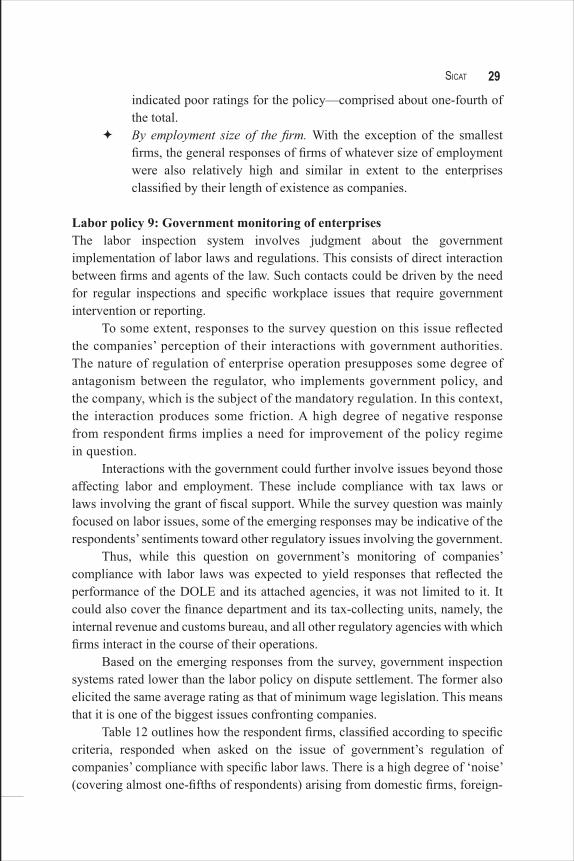
Table 12 outlines how the respondent firms, classified according to specific criteria, responded when asked on the issue of government’s regulation of companies’ compliance with specific labor laws. There is a high degree of ‘noise’ (covering almost one-fifths of respondents) arising from domestic firms, foreign-

30 PhiliPPine Journal of DeveloPment 2009Ta
ble 1
2. In
spec
tions
by D
OLE
offic
ials
Firm
Gro
upin
g
1=Ve
ry P
oor
2=Po
orTo
tal
resp
onde
nts
Ratin
gs o
f 1 &
2 as
%
of T
otal
No re
spon
se
% o
f res
pons
es
(a)
By F
iscal
Ince
ntive
Rec
ipien
tsRe
cipien
tNo
nrec
ipien
t10 6
10 1082 75
24.4
21.3
1 398
.896
.0
(b)
By E
cono
mic
Sect
orMa
nufac
turing
Servi
ces
5 1110 10
50 101
30.0
20.8
0 410
0.0 96.0
(c)
By M
arke
t Orie
ntat
ion
Expo
rtsDo
mesti
c3 10
5 1115 12
353
.317
.10 4
100.0 96
.7
(d)
By E
nter
prise
Own
ersh
ip10
0% F
il.60
% F
il.60
% F
DI10
0% F
DI
10 3 1 2
17 0 1 2
118 16 6 17
22.9
18.8
33.3
23.5
3 1 0 0
97.5
93.8
100.0
100.0
(e)
By A
ge o
f Ent
erpr
iseNe
w: 1
to 5 y
ears
>5 to
10 ye
ars
>10 t
o 20 y
ears
>20 y
ears
1 9 3 3
3 7 6 4
17 56 48 36
23.5
28.6
18.8
19.4
1 1 1 1
94.1
98.2
97.9
97.2
(f)By
Size
of E
mpl
oym
ent
Micro
(1 to
9 wo
rkers)
Sm
all (1
0–99
wor
kers)
Mediu
m (1
00–1
99 w
orke
rs)La
rge (
200 a
nd m
ore w
orke
rs)
0 4 4 8
2 10 4 4
13 63 31 50
15.4
22.2
25.8
24.0
1 1 1 1
92.3
98.4
96.8
98.0
31Sicat
owned firms, large companies, export-oriented enterprises, the manufacturing sector, and all other classifications of firms, whether they are qualified as fiscal incentive recipients or not.
By recipient or nonrecipient of fiscal incentives. Of the 80 recipients of fiscal incentives, 20 respondents, or 24.4 percent, rated the policy as poor. Among nonrecipients of fiscal incentives, or ordinary firms, of the 75 respondents, 18 (21.3%) of the respondents graded the policy as poor.
By economic sector. Poor ratings for the policy were prevalent in the manufacturing sector, where 15 of 50 respondents or 30 percent, gave such responses. Within the services sector, 21.3 percent of 101 respondents rated this policy as either poor or very poor.
By market orientation: domestic or export. Far more firms with export businesses expressed dissatisfaction with this policy compared to domestic enterprises. Among the 15 respondent companies, eight of them gave a rating of poor or very poor. Of the 123 firms serving the domestic market, only 21 respondents, representing 17 percent of the sector, gave this labor policy a poor rating.
By ownership of enterprises. In general, firms, whether 100 percent Filipino-owned or 100 percent foreign-owned, registered the same level of dissatisfaction with the policy, with almost 20 percent of their respective respondents giving similar responses.
By age of the enterprise. A slightly greater number of younger firms (9 years and below) were dissatisfied with this labor policy compared to older firms (10 years and above), 19 percent of whom rated the policy as poor.
By employment size of the firm. Only very small or micro enterprises yielded responses that were critical of the policy. Firms employing more than 10 workers (whether small, medium, or large) tended to view the policy similarly, with 22 to 24 percent of respondents in each class of firms by size rating it as either poor or very poor.
The foregoing responses show that government regulatory agencies must do better in their interactions with all types of firms while ensuring labor policies are consistently enforced by companies.
Labor policy 10: Performance of the public employment service officerThis labor policy refers mainly to the performance of public employment services by the government. This concerns mainly the DOLE, which is tasked, among others, to provide labor-related assistance to enterprises operating in the country.
32 PhiliPPine Journal of DeveloPment 2009
To some extent, the responses to the survey question reflect on the effectiveness of DOLE in its role of supporting employment generation. They also reflect the respondents’ sentiments on the government policy on labor inspections.
This labor policy obtained a much higher average score compared to the policy on labor inspection, that is, by more than half a percentage point score. Yet the variability of the answers relating to the former is much wider. A number of respondents did not answer the question on this policy on the provision of labor assistance, as indicated by the last column in Table 13, which shows the percentage of responses to the issue. Abstention from answering the question was more frequent among companies operating in the domestic market, which are mainly owned by Filipinos and which are predominantly in the services sector. They are also mainly medium-scale enterprises employing 100 to 199 workers.4
Table 13 sums up the respondent classifications. Following is a brief description of the responses.
By recipient or nonrecipient of fiscal incentives. The policy got a poor rating from 20.7 percent of the 82 respondent firms among fiscal incentive recipients and 24 percent of 75 respondents among nonrecipients.
By economic sector. Of the 50 manufacturing firms, six or 30 percent of them rated this policy as poor or very poor. This contrasted with only 17.8 percent of the 101 respondents firms in the services sector who gave the policy similar ratings.
By market orientation: domestic or export. Among 15 respondent export firms, almost 30 percent gave the policy a poor rating. Domestic-oriented firms were less critical of the policy, with 18.7 of 123 respondent firms rating it as poor. Some respondents, however, comprising 13.8 percent of the total firms in this group, declined to answer the question on this policy. These are all Filipino-owned enterprises.
By ownership of enterprises. Among 118 firms that are 100 percent Filipino-owned, 22 percent gave the policy a poor rating, with 17 of them declining to respond to the question. Among 100 percent foreign-owned firms totaling 17 in the sample, 29.4 percent gave the policy a similar rating. This shows a substantial difference between these two groups of respondents.
By age of the enterprise. Younger firms tended to be more critical of this labor policy than much older firms. Among the youngest firms, 29 percent rated the policy as poor. This percentage drops to 20 percent
4 There must be some reason for this: the respondent has no opinion on the matter, the matter is too sensitive to discuss, or they have no experience and knowledge about it. Some of these reasons are mutually exclusive.
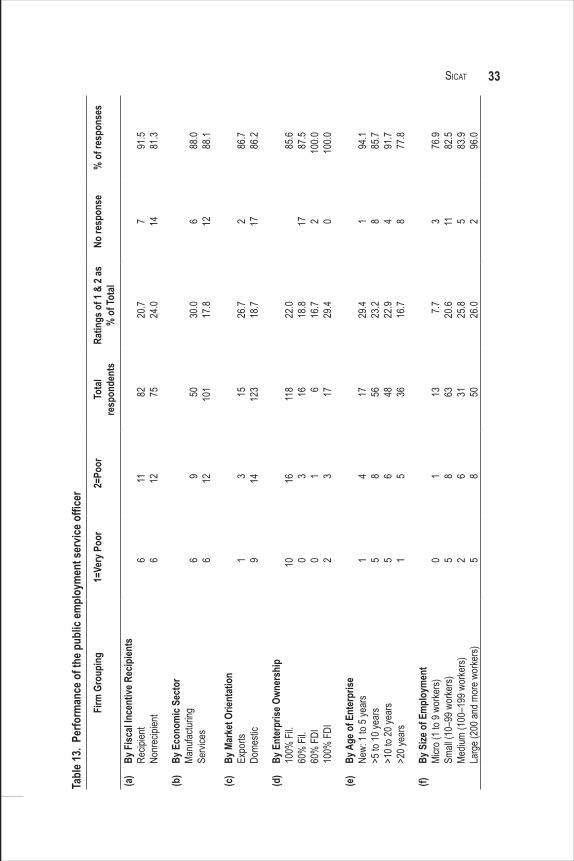
33SicatTa
ble 1
3. P
erfo
rman
ce o
f the
pub
lic em
ploy
men
t ser
vice o
ffice
rFi
rm G
roup
ing
1=
Very
Poo
r2=
Poor
Tota
lre
spon
dent
sRa
tings
of 1
& 2
as
% o
f Tot
alNo
resp
onse
%
of r
espo
nses
(a)
By F
iscal
Ince
ntive
Rec
ipien
tsRe
cipien
tNo
nrec
ipien
t6 6
11 1282 75
20.7
24.0
7 1491
.581
.3
(b)
By E
cono
mic
Sect
orMa
nufac
turing
Servi
ces
6 69 12
50 101
30.0
17.8
6 1288
.088
.1
(c)
By M
arke
t Orie
ntat
ion
Expo
rtsDo
mesti
c1 9
3 1415 12
326
.718
.72 17
86.7
86.2
(d)
By E
nter
prise
Own
ersh
ip10
0% F
il.60
% F
il.60
% F
DI10
0% F
DI
10 0 0 2
16 3 1 3
118 16 6 17
22.0
18.8
16.7
29.4
17 2 0
85.6
87.5
100.0
100.0
(e)
By A
ge o
f Ent
erpr
iseNe
w: 1
to 5 y
ears
>5 to
10 ye
ars
>10 t
o 20 y
ears
>20 y
ears
1 5 5 1
4 8 6 5
17 56 48 36
29.4
23.2
22.9
16.7
1 8 4 8
94.1
85.7
91.7
77.8
(f)By
Size
of E
mpl
oym
ent
Micro
(1 to
9 wo
rkers)
Sm
all (1
0–99
wor
kers)
Mediu
m (1
00–1
99 w
orke
rs)La
rge (
200 a
nd m
ore w
orke
rs)
0 5 2 5
1 8 6 8
13 63 31 50
7.7 20.6
25.8
26.0
3 11 5 2
76.9
82.5
83.9
96.0
34 PhiliPPine Journal of DeveloPment 2009
among respondents that are five years old up to 20 years old. Among firms 20 years and older, the proportion of respondents who gave poor ratings comprised 16.7 percent.
By employment size of the firm. Firms with the smallest employment size were the least critical of this policy. Among the rest of the larger firms, at least a fifth of the respondents gave the policy a poor score.
Labor policy 11: Government incentives for workers’ trainingContinuous manpower development and investment in new equipment or technology are a definite boost to company productivity. Government’s role in this regard is vital as well.
Two related policy questions in this survey relate to labor training. The first concerned respondents’ views on government incentives for companies providing manpower training. The other asked the respondent to rate the quality of vocational schools catering to their sector and in their host communities. It is possible that the answers of the respondent companies would factor in the quality of the educational system that produces the manpower they employ.
In general, the responses indicated strong support for training incentives while showing a high degree of variability. As the summary of mean scores shows, this labor policy has one of the highest scores among the policies covered by the survey although their variance was wide. There was also a high rate of no response among the respondents, which implies that some firms did not consider training as a priority. This could further indicate that the concerned respondent firms had a significant supply of trained workforce.
The labor market is marked by a large supply of unemployed labor, a significant number of whom are educated and therefore can be easily trained for employment. This probably explains one aspect of the training issue. There is no significant need for workers’ training except during their employment.
Table 14 shows the responses on the policy concerning government incentives for labor training. In general, there is a high degree of dissatisfaction among the respondents, comprising a fifth to a fourth of the respondents.
By recipient or nonrecipient of fiscal incentives. There was no marked difference in the responses of the recipients and nonrecipients of fiscal incentives. However, 17 of 75 respondents refrained from answering the question on the policy at hand.
By economic sector. Responses in the manufacturing and services sectors showed no significant disparity but a high degree of nonresponse.
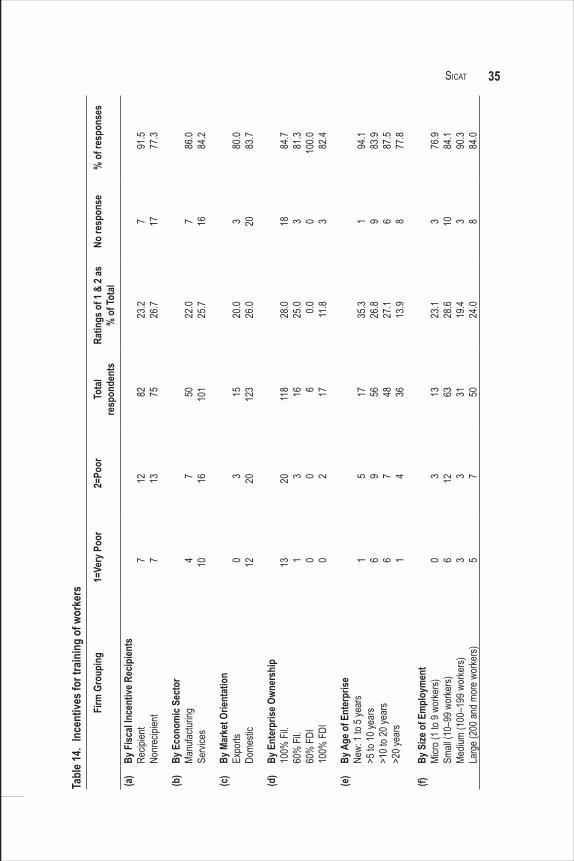
35SicatTa
ble 1
4. In
cent
ives f
or tr
ainin
g of
wor
kers
Firm
Gro
upin
g
1=Ve
ry P
oor
2=Po
orTo
tal
resp
onde
nts
Ratin
gs o
f 1 &
2 as
%
of T
otal
No re
spon
se
% o
f res
pons
es
(a)
By F
iscal
Ince
ntive
Rec
ipien
tsRe
cipien
tNo
nrec
ipien
t7 7
12 1382 75
23.2
26.7
7 1791
.577
.3
(b)
By E
cono
mic
Sect
orMa
nufac
turing
Servi
ces
4 107 16
50 101
22.0
25.7
7 1686
.084
.2
(c)
By M
arke
t Orie
ntat
ion
Expo
rtsDo
mesti
c0 12
3 2015 12
320
.026
.03 20
80.0
83.7
(d)
By E
nter
prise
Own
ersh
ip10
0% F
il.60
% F
il.60
% F
DI10
0% F
DI
13 1 0 0
20 3 0 2
118 16 6 17
28.0
25.0 0.0 11.8
18 3 0 3
84.7
81.3
100.0 82
.4
(e)
By A
ge o
f Ent
erpr
iseNe
w: 1
to 5 y
ears
>5 to
10 ye
ars
>10 t
o 20 y
ears
>20 y
ears
1 6 6 1
5 9 7 4
17 56 48 36
35.3
26.8
27.1
13.9
1 9 6 8
94.1
83.9
87.5
77.8
(f)By
Size
of E
mpl
oym
ent
Micro
(1 to
9 wo
rkers)
Sm
all (1
0–99
wor
kers)
Mediu
m (1
00–1
99 w
orke
rs)La
rge (
200 a
nd m
ore w
orke
rs)
0 6 3 5
3 12 3 7
13 63 31 50
23.1
28.6
19.4
24.0
3 10 3 8
76.9
84.1
90.3
84.0
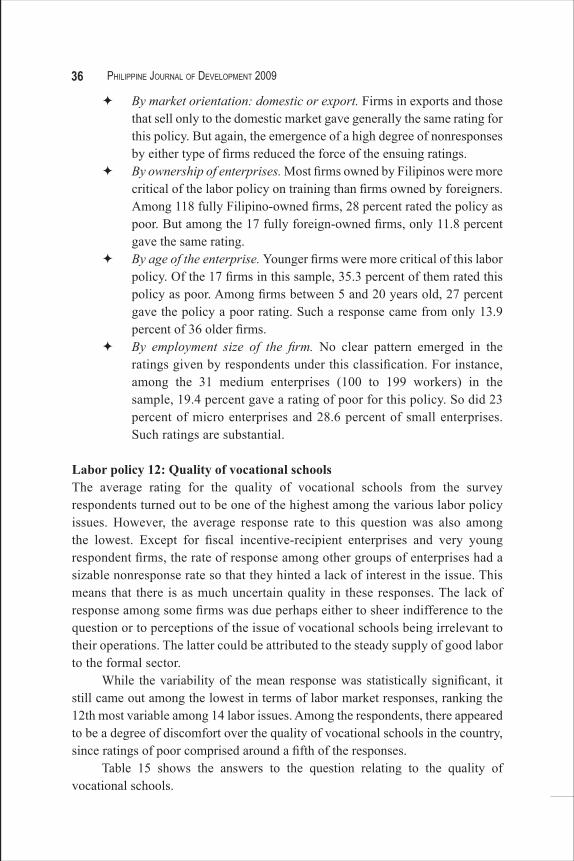
36 PhiliPPine Journal of DeveloPment 2009
By market orientation: domestic or export. Firms in exports and those that sell only to the domestic market gave generally the same rating for this policy. But again, the emergence of a high degree of nonresponses by either type of firms reduced the force of the ensuing ratings.
By ownership of enterprises. Most firms owned by Filipinos were more critical of the labor policy on training than firms owned by foreigners. Among 118 fully Filipino-owned firms, 28 percent rated the policy as poor. But among the 17 fully foreign-owned firms, only 11.8 percent gave the same rating.
By age of the enterprise. Younger firms were more critical of this labor policy. Of the 17 firms in this sample, 35.3 percent of them rated this policy as poor. Among firms between 5 and 20 years old, 27 percent gave the policy a poor rating. Such a response came from only 13.9 percent of 36 older firms.
By employment size of the firm. No clear pattern emerged in the ratings given by respondents under this classification. For instance, among the 31 medium enterprises (100 to 199 workers) in the sample, 19.4 percent gave a rating of poor for this policy. So did 23 percent of micro enterprises and 28.6 percent of small enterprises. Such ratings are substantial.
Labor policy 12: Quality of vocational schoolsThe average rating for the quality of vocational schools from the survey respondents turned out to be one of the highest among the various labor policy issues. However, the average response rate to this question was also among the lowest. Except for fiscal incentive-recipient enterprises and very young respondent firms, the rate of response among other groups of enterprises had a sizable nonresponse rate so that they hinted a lack of interest in the issue. This means that there is as much uncertain quality in these responses. The lack of response among some firms was due perhaps either to sheer indifference to the question or to perceptions of the issue of vocational schools being irrelevant to their operations. The latter could be attributed to the steady supply of good labor to the formal sector.
While the variability of the mean response was statistically significant, it still came out among the lowest in terms of labor market responses, ranking the 12th most variable among 14 labor issues. Among the respondents, there appeared to be a degree of discomfort over the quality of vocational schools in the country, since ratings of poor comprised around a fifth of the responses.
Table 15 shows the answers to the question relating to the quality of vocational schools.
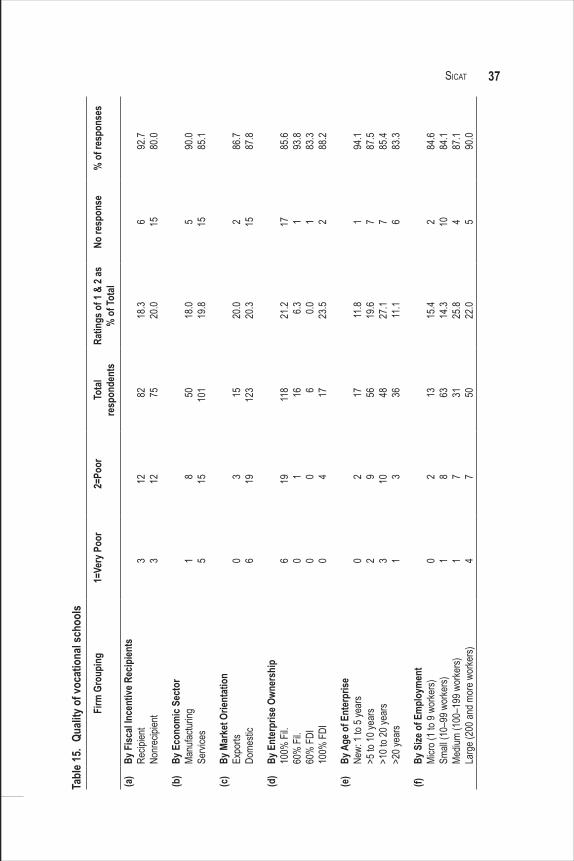
37SicatTa
ble 1
5. Qu
ality
of v
ocat
iona
l sch
ools
Firm
Gro
upin
g
1=Ve
ry P
oor
2=Po
orTo
tal
resp
onde
nts
Ratin
gs o
f 1 &
2 as
%
of T
otal
No re
spon
se
% o
f res
pons
es
(a)
By F
iscal
Ince
ntive
Rec
ipien
tsRe
cipien
tNo
nrec
ipien
t3 3
12 1282 75
18.3
20.0
6 1592
.780
.0
(b)
By E
cono
mic
Sect
orMa
nufac
turing
Servi
ces
1 58 15
50 101
18.0
19.8
5 1590
.085
.1
(c)
By M
arke
t Orie
ntat
ion
Expo
rtsDo
mesti
c0 6
3 1915 12
320
.020
.32 15
86.7
87.8
(d)
By E
nter
prise
Own
ersh
ip10
0% F
il.60
% F
il.60
% F
DI10
0% F
DI
6 0 0 0
19 1 0 4
118 16 6 17
21.2 6.3 0.0 23.5
17 1 1 2
85.6
93.8
83.3
88.2
(e)
By A
ge o
f Ent
erpr
iseNe
w: 1
to 5 y
ears
>5 to
10 ye
ars
>10 t
o 20 y
ears
>20 y
ears
0 2 3 1
2 9 10 3
17 56 48 36
11.8
19.6
27.1
11.1
1 7 7 6
94.1
87.5
85.4
83.3
(f)By
Size
of E
mpl
oym
ent
Micro
(1 to
9 wo
rkers)
Sm
all (1
0–99
wor
kers)
Mediu
m (1
00–1
99 w
orke
rs)La
rge (
200 a
nd m
ore w
orke
rs)
0 1 1 4
2 8 7 7
13 63 31 50
15.4
14.3
25.8
22.0
2 10 4 5
84.6
84.1
87.1
90.0
38 PhiliPPine Journal of DeveloPment 2009
By recipient or nonrecipient of fiscal incentives. There was no significant difference in the ratings that recipients and nonrecipients of fiscal incentives gave to the question on vocational schools’ quality of education. About one-fifth of the respondents rated the issue either as poor or very poor. Presumably the comments refer to schools in the community where the firms are located.
By economic sector. This classification made no difference in the respondents’ judgment of the issue. If the enterprises concerned relied on the supply of labor from vocational schools, the issue of quality of vocational schools would appear to be more important for manufacturing. But this was not the case with the current sample of respondents.
By market orientation: domestic or export. This sample of the respondents yielded exactly the same proportional distribution of poor ratings, with no distinct difference across the firms in each group.
By ownership of enterprises. The quality of vocational schools in the Philippines was generally adjudged poor by respondents among fully Filipino- and foreign-owned firms, which constitute the bulk of the respondents. Among joint ventures involving Filipinos and foreigners, respondents gave a less critical assessment of vocational schools. The rate of response to the labor issue is evenly distributed among these types of enterprises.
By age of the enterprise. In general, most of the firms that rated the quality of vocational schools as poor, began operations between the 1980s and 1990s. The proportion of responses among the very young and very old of the respondent firms was not as high as the other firms. The underlying reason for this was not readily evident compared to those who did not offer any opinion or opted not to give any response and who comprised a significant number of the respondents, indicating a lack of interest in the issue.
By employment size of the firm. The bigger the firm is in terms of employment size, the more negative responses there are on the quality of the vocational schools. However, there was only a slightly higher degree of responses among the larger firms compared to the smaller ones.
Labor policy 13: Number of mandatory national holidaysNational holidays are designed as days of rest for the labor sector. They are also important elements of nation building, national development, and other significant national undertakings with religious and cultural underpinnings.
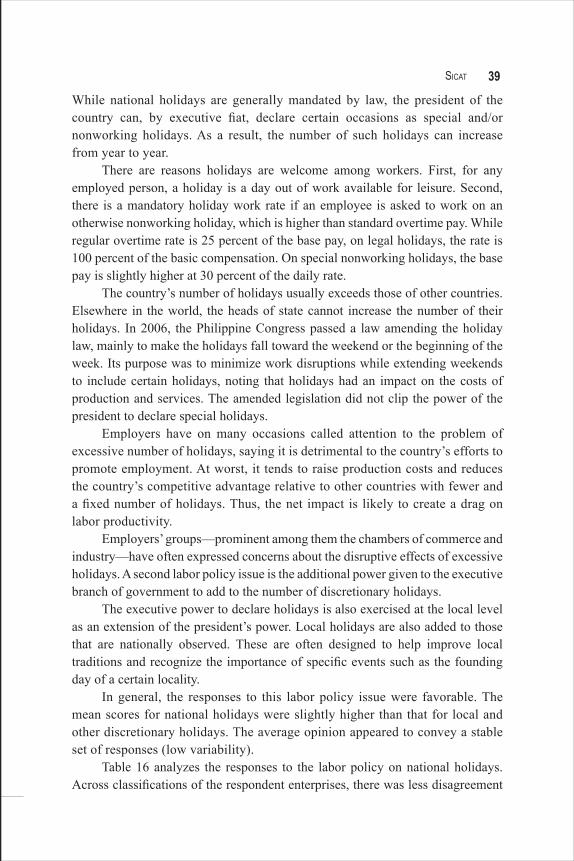
39Sicat
While national holidays are generally mandated by law, the president of the country can, by executive fiat, declare certain occasions as special and/or nonworking holidays. As a result, the number of such holidays can increase from year to year.
There are reasons holidays are welcome among workers. First, for any employed person, a holiday is a day out of work available for leisure. Second, there is a mandatory holiday work rate if an employee is asked to work on an otherwise nonworking holiday, which is higher than standard overtime pay. While regular overtime rate is 25 percent of the base pay, on legal holidays, the rate is 100 percent of the basic compensation. On special nonworking holidays, the base pay is slightly higher at 30 percent of the daily rate.
The country’s number of holidays usually exceeds those of other countries. Elsewhere in the world, the heads of state cannot increase the number of their holidays. In 2006, the Philippine Congress passed a law amending the holiday law, mainly to make the holidays fall toward the weekend or the beginning of the week. Its purpose was to minimize work disruptions while extending weekends to include certain holidays, noting that holidays had an impact on the costs of production and services. The amended legislation did not clip the power of the president to declare special holidays.
Employers have on many occasions called attention to the problem of excessive number of holidays, saying it is detrimental to the country’s efforts to promote employment. At worst, it tends to raise production costs and reduces the country’s competitive advantage relative to other countries with fewer and a fixed number of holidays. Thus, the net impact is likely to create a drag on labor productivity.
Employers’ groups—prominent among them the chambers of commerce and industry—have often expressed concerns about the disruptive effects of excessive holidays. A second labor policy issue is the additional power given to the executive branch of government to add to the number of discretionary holidays.
The executive power to declare holidays is also exercised at the local level as an extension of the president’s power. Local holidays are also added to those that are nationally observed. These are often designed to help improve local traditions and recognize the importance of specific events such as the founding day of a certain locality.
In general, the responses to this labor policy issue were favorable. The mean scores for national holidays were slightly higher than that for local and other discretionary holidays. The average opinion appeared to convey a stable set of responses (low variability).
Table 16 analyzes the responses to the labor policy on national holidays. Across classifications of the respondent enterprises, there was less disagreement
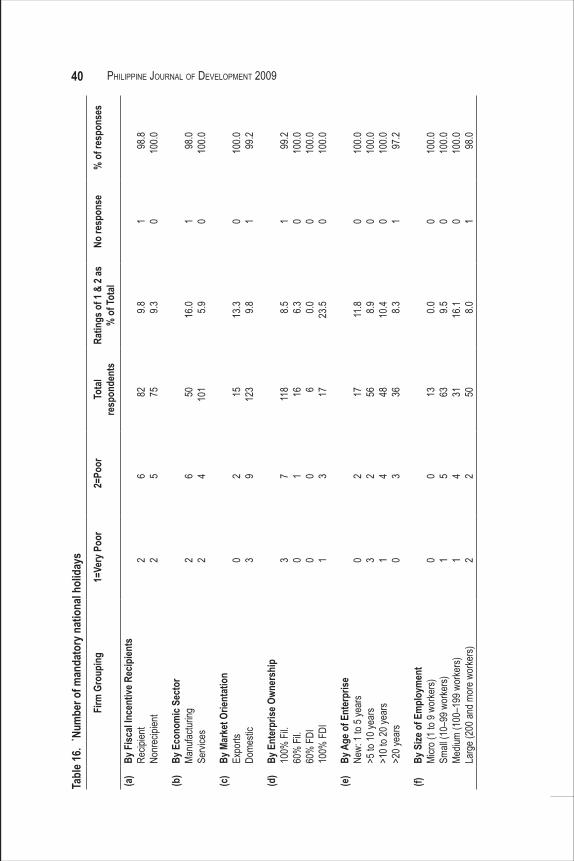
40 PhiliPPine Journal of DeveloPment 2009Ta
ble 1
6. `N
umbe
r of m
anda
tory
nat
iona
l hol
iday
sFi
rm G
roup
ing
1=
Very
Poo
r2=
Poor
Tota
lre
spon
dent
sRa
tings
of 1
& 2
as
% o
f Tot
alNo
resp
onse
%
of r
espo
nses
(a)
By F
iscal
Ince
ntive
Rec
ipien
tsRe
cipien
tNo
nrec
ipien
t2 2
6 582 75
9.8 9.31 0
98.8
100.0
(b)
By E
cono
mic
Sect
orMa
nufac
turing
Servi
ces
2 26 4
50 101
16.0 5.9
1 098
.010
0.0
(c)
By M
arke
t Orie
ntat
ion
Expo
rtsDo
mesti
c0 3
2 915 12
313
.3 9.80 1
100.0 99
.2
(d)
By E
nter
prise
Own
ersh
ip10
0% F
il.60
% F
il.60
% F
DI10
0% F
DI
3 0 0 1
7 1 0 3
118 16 6 17
8.5 6.3 0.0 23.5
1 0 0 0
99.2
100.0
100.0
100.0
(e)
By A
ge o
f Ent
erpr
iseNe
w: 1
to 5 y
ears
>5 to
10 ye
ars
>10 t
o 20 y
ears
>20 y
ears
0 3 1 0
2 2 4 3
17 56 48 36
11.8 8.9 10.4 8.3
0 0 0 1
100.0
100.0
100.0 97
.2
(f)By
Size
of E
mpl
oym
ent
Micro
(1 to
9 wo
rkers)
Sm
all (1
0–99
wor
kers)
Mediu
m (1
00–1
99 w
orke
rs)La
rge (
200 a
nd m
ore w
orke
rs)
0 1 1 2
0 5 4 2
13 63 31 50
0.0 9.5 16.1 8.0
0 0 0 1
100.0
100.0
100.0 98
.0
41Sicat
with the policies. But it is possible to get a hint of dissent in the answers in some classifications of the respondent firms.
By recipient or nonrecipient of fiscal incentives. There was no distinction in response among recipients and nonrecipients of fiscal incentives. In general, there are some firms that gave holidays very poor and poor ratings. Negative views about the policy comprised only about 10 percent or even less of the responses.
By economic sector. Among manufacturing establishments, 8 out of 50 respondents, or 16 percent, gave the policy a poor rating compared to 6 percent of respondents among 101 establishments in the services sector. Thus, manufacturing firms tended to be hit harder by this policy compared to those in the services.
By market orientation: domestic or export. Two of 15 export establishments, or 13.3 percent, rated this as poor compared to 10 percent of 123 domestic-oriented respondents. Export producers tended to disagree with the policy compared to domestic-oriented companies.
By ownership of enterprises. Foreign-owned establishments rated this policy more critically than Filipino-owned companies. Of the 17 foreign-owned companies in this class of enterprises, four, or 23.5 percent of them, rated this policy as poor. On the other hand, of the 118 fully Filipino-owned firms, 8.3 percent of them rated this policy as poor. It is clear from these responses that foreign investors were more critical of the policy on public holidays than domestic firms.
By age of the enterprise. In general, there is little distinction in the responses of these enterprises when classified by age. Only around 10 percent of them rated the policy as poor.
By employment size of the firm. Among the micro enterprises, the policy merited no poor ratings. About 16 percent of the respondents among medium-scale enterprises rated this policy as poor while only less than 10 percent of the respondents among small and large firms similarly rated the holiday policy. In general, employment size did not have much influence on the firms’ responses.
Labor policy 14: Number of other discretionary national and local holidaysThe number of discretionary national and local holidays is a critical component of the holiday law provisions, since it raises the total number of public holidays in the country. The law on holidays was designed to correct the adjustment of working days when the normal holidays fall on a Sunday, a practice that tended to create longer holidays. Religious and other holidays, as well as important events like elections, often create a long list of unintended holidays.
42 PhiliPPine Journal of DeveloPment 2009
Then, too, there was the government’s “holiday economics” policy, which was intended to promote longer weekend holidays, thus boosting the local tourism industry, when normal holidays veered toward the weekend. The issue of long holidays takes on greater significance when one considers, for instance, that the last week of the year has become essentially a nonworking week because it covers Christmas Day (December 25) and Rizal Day (December 30) and due to its close proximity to New Year’s Day. This is also the time of year when companies must close their books of accounts. This period corresponds to some countries’ practice of observing workers’ long holidays as a national tradition. This is specifically true of Japan, which is known for its weeklong spring holiday. Work stops at all levels except in the utilities sector and the holiday (local tourism) industry.
In the Philippines there is also the Holy Week, during which Thursdays and Fridays are public national holidays. Wednesdays are practically extensions of these official holidays since many workers go home to their provinces as early as then. Elsewhere in the world, such as in the United States, these days are normal working days.
National elections also provide another distortion of the holiday practice. These are declared nonworking holidays. Again, in the United States, elections are considered normal working days, although work hours are flexible to allow workers to do their civic duty, albeit for a limited period of time. In the Philippines, the President is allowed to declare the day before as a nonworking day to allow workers to go home to their provinces so they can vote. A sensible residential requirement for voting should take care of this issue so that voters, most of whom comprise the labor force, need not travel back their places of origin just to cast their votes. This is not the case, however, for many of the electorates.
All these instances of local and special holidays have created a bias for vacations. It is as if the country’s working policy is designed to create slack in the work place. This has also raised labor costs and reduced the opportunities for poor people to earn more income during normal working days within the organized sector of the economy.
Despite the high satisfactory rating the policy has generated among the respondents, the responses across the different classifications of the respondents are similar to those on national holidays.
As expected, the responses to this question mirrored those revolving around the issue of mandatory holidays. Table 17 provides a picture of the answers to the issue. Even without detailing the answers of various respondents by different classifications, it may be useful to comment on the respondents of the questionnaire.
An analysis of Tables 16 and 17 indicates that they are complementary. The detailed descriptions of the influences of specific firm characteristics indicate that
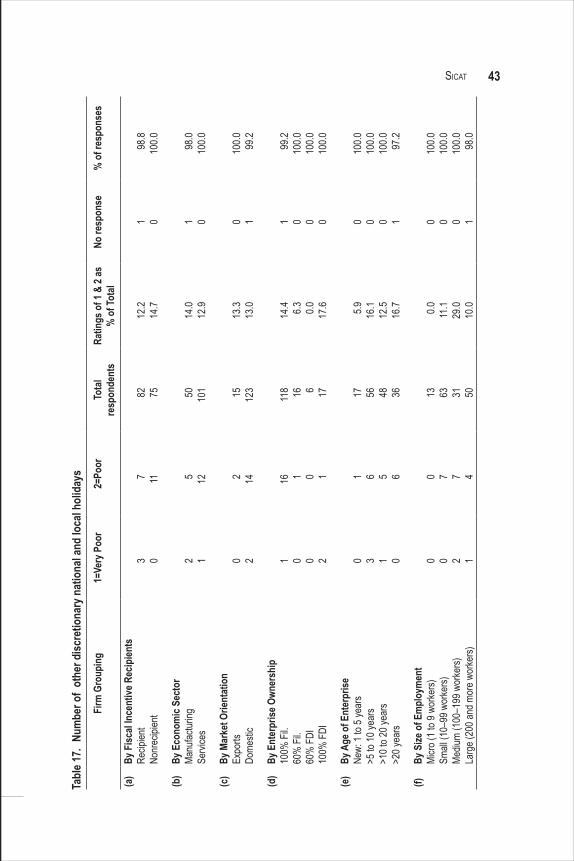
43SicatTa
ble 1
7. Nu
mbe
r of
othe
r disc
retio
nary
nat
iona
l and
loca
l hol
iday
sFi
rm G
roup
ing
1=
Very
Poo
r2=
Poor
Tota
lre
spon
dent
sRa
tings
of 1
& 2
as
% o
f Tot
alNo
resp
onse
%
of r
espo
nses
(a)
By F
iscal
Ince
ntive
Rec
ipien
tsRe
cipien
tNo
nrec
ipien
t3 0
7 1182 75
12.2
14.7
1 098
.810
0.0
(b)
By E
cono
mic
Sect
orMa
nufac
turing
Servi
ces
2 15 12
50 101
14.0
12.9
1 098
.010
0.0
(c)
By M
arke
t Orie
ntat
ion
Expo
rtsDo
mesti
c0 2
2 1415 12
313
.313
.00 1
100.0 99
.2
(d)
By E
nter
prise
Own
ersh
ip10
0% F
il.60
% F
il.60
% F
DI10
0% F
DI
1 0 0 2
16 1 0 1
118 16 6 17
14.4 6.3 0.0 17.6
1 0 0 0
99.2
100.0
100.0
100.0
(e)
By A
ge o
f Ent
erpr
iseNe
w: 1
to 5 y
ears
>5 to
10 ye
ars
>10 t
o 20 y
ears
>20 y
ears
0 3 1 0
1 6 5 6
17 56 48 36
5.9 16.1
12.5
16.7
0 0 0 1
100.0
100.0
100.0 97
.2
(f)By
Size
of E
mpl
oym
ent
Micro
(1 to
9 wo
rkers)
Sm
all (1
0–99
wor
kers)
Mediu
m (1
00–1
99 w
orke
rs)La
rge (
200 a
nd m
ore w
orke
rs)
0 0 2 1
0 7 7 4
13 63 31 50
0.0 11.1
29.0
10.0
0 0 0 1
100.0
100.0
100.0 98
.0
44 PhiliPPine Journal of DeveloPment 2009
the responses to the question under consideration were generally independent of the specific classification of the respondent firms. But this was not the case with the classification of respondents by ownership. Foreign-owned companies regarded this policy on holidays critically. Perhaps, given their awareness of holidays in other countries, they thought the Philippines simply had too many of them or that some of the holidays were too unpredictable in occurrence.
It must also be pointed out how the questionnaires in the survey were answered. Officials in the human resource (HR) departments of the respondent companies mainly filled up the survey questionnaires. A few of the respondents were operating managers whose posts fall below those of the president or chief executive officers of the respondent companies. The possibility of upward bias in the nature of the replies is examined elsewhere.
Indeed, there appears to be some bias for long and intermittent holidays. This is due in part to the mandate of the HR personnel to oversee the implementation of laws and regulations pertaining to worker welfare. Company presidents, owners, or general managers who responded to the survey tended to be more critical of the policy compared to those in HR (Sicat 2010).
CONCLUSIONThis paper analyzed the survey responses of enterprises operating in the Philippines concerning various labor policies in the country. In general, such policies have come from an extensive list of welfare legislation comprising the legal framework that is intended to protect labor’s welfare, improve their incomes and job security, as well as to help develop a caring and prosperous society. The findings of the paper should help inform the policy debate on labor market issues (Congress of the Philippines [2002], Sicat [2004], and Imperial [2004]).
The inadequacy of the country’s employment creation suggests current labor policies need reevaluation. Admittedly, however, the populist character of these social policies makes them difficult to reform. Understanding the opinions of operating enterprises is a big step toward understanding the impact of these policies on labor costs and, in the long term, on the country’s global competitiveness. The future ASEAN Free Trade Agreement and the application of rules of the WTO on trade and industrial issues make these reforms most urgent. As the national economics become more homogenous as a result of this trade and industrial system, competition becomes important.
The approval rates for these policies were high, and this was reflected in the mean scores for the opinions that the respondent firms expressed with respect to various labor policies. Many respondent firms favored these labor market policies.
45Sicat
But the variability of these average scores indicates a pattern. Some policies that continue to be discussed publicly have far wider variability in opinions expressed than other policies. These policies include the following: severance costs for workers leaving the service, restrictions on fixed-term contracts, regulations dealing with worker dismissals, settling of labor disputes, government labor inspections, and public holidays. The minimum wage issue is generally widely accepted in principle. But various answers pertaining to this policy also reveal interesting details about the firms that have a critical view of the policy.
The views of particular types of enterprises send important signals for policy reforms, which the government needs to consider. For instance, the fact that FDIs are in favor of the minimum wage process while complaining about specific labor issues conveys many important messages about the direction of labor market reforms.
It is therefore important to recognize the nature of criticisms about the labor policies and the types of firms making them. Focusing on the favorable opinions on these policies will prevent the government from undertaking the needed reforms to address the issues confronting the different enterprises operating in the country. Government would do well to understand how firms classified by specific criteria responded to the questions on these policies. This paper has brought to the fore differences in views among firms according to the sector of the economy in which they operate; whether or not they receive fiscal incentives; who owns them—nationals or foreigners; the nature of their markets—domestic or export; the length of time they have been in operation; and their employment sizes.
One major point that merits mention in this conclusion is that the existing labor laws tend to harm Filipino-owned domestic enterprises most heavily compared to foreign investors in the country. Yet it is also true that the government’s efforts to attract FDIs into the country have not yielded as much fruit as other countries in the regions that have continuously raised the inflows of desirable FDIs. These twin facts seem to emphasize a failure of economic policy to address two major needs—to make domestic enterprises competitive and to attract foreign capital—to enable the country to raise growth, generate employment, and sustain development.
In fact, many foreign direct investors—those that were once in the country and those prospectively reviewing their investment plans in favor of lower-cost sites—put a premium on the stability of labor policies alongside other factors. Some have had to move to other countries. This has led the labor sector to be more moderate in its demands and perhaps take a more realistic assessment of their attitudes. Yet, there are radical remnants on the labor front, and some in the government front who are insensitive to development objectives, who continue to remain intransigent on these issues.
46 PhiliPPine Journal of DeveloPment 2009
Domestic policies on the economic environment have discordant effects on local and foreign investors. Foreign companies that do not agree with these policies have an escape route: exit or reduce their presence. But domestic enterprises have basically little choice unless they migrate to other countries—a move that entails costs many of them can ill afford. Hence the penalty is larger on domestic firms than on foreign firms.
rEFErENCES Asian Development Bank (ADB). 2009. Project on the employment of the youth.
Pasig City: ADB.Imperial, G.S. 2004. Understanding Philippine labor policies. Philippine Review
of Economics 41(2).Presidential Decree No. 442. (The Labor Code of the Philippines).Republic of the Philippines, Congress of the Philippines. (2001). Report and
recommendations of the congressional committee on labor: human capital in an emerging economy.
Sicat, G.P. 2010. Firm characteristics as determinants of views on the minimum wage policy. Discussion Paper. Unpublished manuscript. Quezon City: University of the Philippines School of Economics.
_______. 2004. Reforming the Philippine labor market. Philippine Review of Economics 41(2).