Embed Size (px)
Citation preview

This PDF is a selection from an out-of-print volume from the National Bureauof Economic Research
Volume Title: Differences and Changes in Wage Structures
Volume Author/Editor: Richard B. Freeman and Lawrence F. Katz, Editors
Volume Publisher: University of Chicago Press
Volume ISBN: 0-226-26160-3
Volume URL: http://www.nber.org/books/free95-1
Conference Date: July 12-24, 1992
Publication Date: January 1995
Chapter Title: Labor Markets and Economic Growth: Lessons from Korea’sIndustrialization, 1970-1990
Chapter Author: Dae-II Kim, Robert H. Topel
Chapter URL: http://www.nber.org/chapters/c7859
Chapter pages in book: (p. 227 - 264)
7 Labor Markets and Economic Growth: Lessons from Korea’s Industrialization, 1970-1990 Dae-I1 Kim and Robert H. Topel
7.1 Introduction and Summary
This paper studies the evolution of labor markets in the Republic of Korea (henceforth, Korea) during an episode of extraordinary economic growth and structural change. Real per capita income in Korea roughly tripled between 1971 and 1986. This was accompanied by a transformation of the Korean labor market from a largely rural base-agriculture accounted for half of total em- ployment in 1970 but less than 20 percent in 1990-to one in which manufac- turing’s share of total employment (25 percent) is now larger than it is in the United States. This industrialization has been fueled by dramatic productivity growth and by a fourfold increase in exports’ share of national output. By these measures, Korea underwent a greater industrial transformation in the twenty- five years following 1965 than Britain did in the seventy-five years following 1780.
While studying the evolution of the Korean labor market is interesting in its own right, our motives are somewhat broader. First, we think that Korea’s rapid industrialization offers a unique laboratory in which to gauge the way decen- tralized labor markets adjust to structural change. After all, in what other im- portant market did labor productivity triple in only fifteen years, fueling a wholesale shift of the workforce from agriculture to urban manufacturing? What other country has upgraded the skills of its workforce so rapidly that the proportion of high school and college graduates increased by 30 percentage
Dae-I1 Kim is assistant professor of Economics at Rice University. Robert H. Topel is the Isidore Brown and Gladys J. Brown Professor in Urban and Labor Economics at the University of Chicago and a research associate of the National Bureau of Economic Research.
The authors are grateful to the Ford Foundation, the Bradley Foundation, and the National Science Foundation for financial support and to Larry Katz, Richard Freeman, Bill Dickens, Ann Case, and conference participants for valuable comments. Jeff Williamson, the discussant, pro- vided extraordinarily useful written comments.
221

228 Dae-I1 Kim and Robert H. Topel
points since 1972? The changes that we observe in developed economies are glacial, and minor, by comparison.
Our second motive is to provide new evidence relevant to long-standing de- bates in the development literature. How do wage inequality and income in- equality change during economic development? Do rapid changes in educa- tional attainment have important labor market effects? Do manufacturing exports drive wage and income growth? How do government policies, includ- ing so-called industrial policies, affect labor markets? How mobile is labor, and what is the role of urban-rural migration in development?
7.1.1 Main Results
We address these issues by drawing on a number of data sources, including both published series and individual earnings and employment records for large samples of Korean men.’ Our findings can be grouped into five main areas. as follows.
1. Productivity, trade, and employment. Korea’s small share of world markets implies that demands for tradable manufactured goods are highly elastic, so productivity growth increases the demand for labor. Yet productivity growth was unevenly distributed among industries, which means that labor demand growth was too. Looking across industries, we find that both exports and em- ployment expanded in proportion to productivity gains. We take this as evi- dence that advancing productivity drove the transformation of the Korean la- bor market.
2. Sectoral neutrality of aggregate wage growth. While government policies aimed at controlling wage growth appear to have been effective in the early 1970s, wages were determined by market forces during most of the period under study. Aggregate labor demand expanded rapidly, drawing millions of workers from rural to urban labor markets and tripling the aggregate real wage. Yet, in spite of wide differences among sectors in rates of employment growth, we find that sectoral changes in wages and employment are unrelated. In other words, aggregate wage growth was neutral among sectors. This comports with related evidence for the United States (see Murphy and Topel 1987a, 1987b; and Dickens and Katz 1987) and suggests that there is “one labor market” in Korea.
3. Sectoral mobility of workers. The growth of manufacturing and related sec- tors was accompanied by a wholesale shift of employment out of agriculture. Workers of all ages left the farm. Yet we find scant evidence that manufacturing drew on agriculture or any other sector as a source of labor supply. Instead,
1. We plan to analyze women in a paper that compares Taiwan and Korea.
229 Labor Markets and Economic Growth: Korea’s Industrialization
virtually all of manufacturing’s growth was accomplished by hiring ever larger numbers of new entrants to the labor force, who then stay in the sector over their careers. In the manufacturing sector, there was virtually no net hiring of workers older than age twenty-five. In a sort of “musical chairs” process, mi- grants from agriculture entered the nonmanufacturing sector, replacing the young workers who were hired into manufacturing.
4. High labor furnovel: Japan’s model of lifetime jobs does not apply to Korea. While industrial expansion has been accompanied by increased durability in employment relationships, job spells remain very short by the standards of developed countries. Even today, the average job in progress has lasted only about four years, compared to about nine years in the United States. In the growing manufacturing sector, 60 percent of all new jobs end in the first year, and turnover is much higher in manufacturing than in the rest of the economy. To square this finding with the virtual absence of net mobility from manufac- turing as a whole, there must be very high interfirm mobility within that sector.
5. ZnequulizjJ. Simon Kuznets’s 1955 presidential address to the American Eco- nomic Association introduced a now-famous hypothesis about changes in wage inequality during economic development. Kuznets argued that the initial stages of industrialization would cause wage inequality to rise. This relation has been dubbed the Kuznets curve by development economists, yet subse- quent research has shown only weak evidence in its favor.2
Our results for Korea do not support Kuznets’s conjecture. Korea is a promi- nent example of rapid industrialization combined with sharply declining wage inequality. In 1970, wage inequality (as measured by the spread between the ninetieth and the tenth percentiles of the wage distribution) was 40 percent greater in Korea than in the United States. The 90-10 differential fell by 20 percent over the next fifteen years, and by 1986 wages were more equally dis- tributed in Korea than in the United States.
One explanation for declining inequality is the rapid expansion of manufac- turing, perhaps driven by purposeful industrial policies favoring that sector. These policies might have increased the demand for less skilled workers. But we find no evidence of this: sectors that employ relatively unskilled workers did not expand more rapidly than others. Instead, the data point to improve- ments in human capital as the major force that narrowed wage differences. In 1972, over 60 percent of Korean workers had only a grade school education, a figure that fell to 30 percent by 1989. We find important changes in relative wages that were driven by these changes in factor ratios: as high school and college graduates became more plentiful, their relative wages fell by more than half.
2. See the discussion in Little (1982) and the references therein.

230 Dae-I1 Kim and Robert H. Tope1
7.1.2 The Data
We analyze data from a variety of sources. Employment data are drawn from the Annual Reports on the Economically Active Population (EAP), published by the Economic Planning Board, which is a census-style sample of the Korean labor force. The main source for wages, job tenures, and other job-related sta- tistics is the Occupational Wage Survey (OWS), conducted annually by the Korean Ministry of Labor. This survey includes wage, employment, and demo- graphic information for about 5 million workers per year, which makes it much larger than typical sources of micro data in the United States and other coun- tries.3 For the most part, we rely on published cross-tabulations of these data, although we also make use of original files, in tape form, for 1971, 1983, 1986, and 1989.4
The OWS has its drawbacks. The sampling units are firms, not individuals. Firms report wage and demographic data for a random sample of their workers, but only firms with ten or more employees are included in the survey. This omits roughly one-third of the nonagricultural labor force in a typical year. Since manufacturing firms are larger than those in other sectors and they em- ploy younger workers, this has the effect of giving greater weight to young workers who work in manufacturing. At this stage, we have not tried to re- weight the data to reflect these limitations. Readers are advised to keep this in mind.
7.2 The Setting: Growth, Institutions, and Policy in Korea, 1970-90
7.2.1 Trade, Income, and Productivity Growth
Table 7.1 compares per capita income growth in South Korea and other countries since 1970. Over this period, Korea grew more than twice as fast as did Japan and roughly three times faster than the United States and the re- maining OECD countries. By 1990, per capita income in Korea was $5,584, up from $1,023 in 1970. For comparison, this is 30 percent of the U.S. level, which stood at $18,482 in 1990.
The evident sources of Korean growth are rapid advances in labor productiv- ity coupled with open markets for exports of manufactured products. Figure 7.1 shows the evolution of average hourly wages and manufacturing productiv- ity in Korea since 1971.5 There are two noteworthy points about the figure.
3. A similar survey is conducted by the Japanese Ministry of Labor (see, e.g., Hashimoto and Raisian 1985). 4. These data were kindly provided by John Bauer. Each of these tapes has about 600,000
observations that are randomly sampled from the original survey. 5. Alternative measures of labor productivity give substantially different estimates of productiv-
ity growth in Korea. The Korean Productivity Center (KPC) index of output perproducrion worker is based on survey responses of Korean manufacturers. From a base of one hundred in 1975, this index rises to nearly four hundred by 1987! Measured output per hour worked by all employees, calculated by us, shows less dramatic growth. We are suspicious of the survey data and uncomfort- able with the survey’s focus on production workers, so calculated productivity is shown in fig. 7.1.
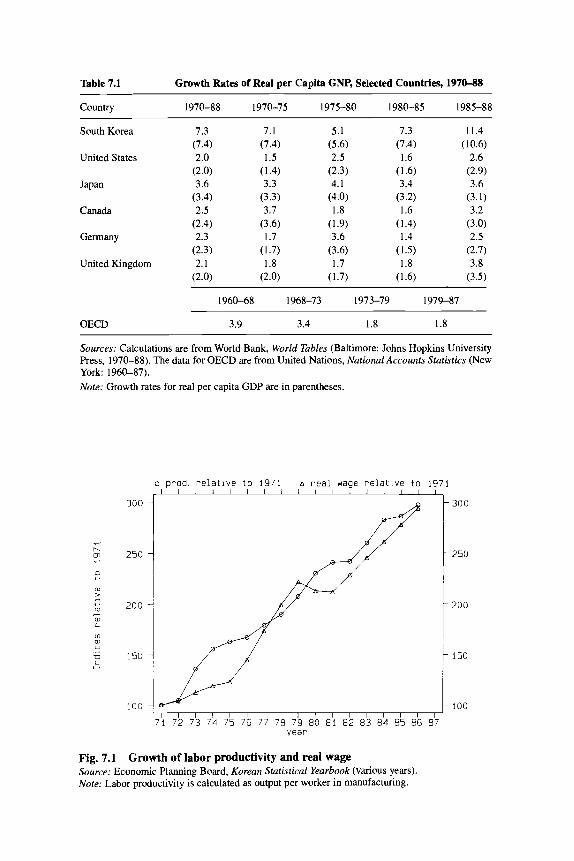
Table 7.1 Growth Rates of Real per Capita GNP, Selected Countries, 1W0-88
Country 1970-88 1970-75 1975-80 1980-85 1985-88
- 250
- 200
- 150
- 100
South Korea 7.3 (7.4)
United States 2.0 (2.0)
Japan 3.6 (3.4)
Canada 2.5
Germany 2.3 (2.4)
(2.3) United Kingdom 2.1
(2.0)
7.1 (7.4) 1.5
3.3 (3.3) 3.7
(3.6) 1.7
1.8 (2.0)
(1.4)
(1.7)
5.1 (5.6) 2.5
(2.3) 4.1
1.8
3.6 (3.6) 1.7
(4.0)
( 1.9)
( 1.7)
11.4 (10.6)
2.6 (2.9) 3.6
(3.1) 3.2
2.5
3.8 (3.5)
(3.0)
(2.7)
1960-68 1968-73 1973-79 1979-87
OECD 3.9 3.4 1.8 1.8
Sources: Calculations are from World Bank, World Tables (Baltimore: Johns Hopkins University Press, 1970-88). The data for OECD are from United Nations, National Accounts Statistics (New York: 1960-87). Note: Growth rates for real per capita GDP are in parentheses.
o prod. r e l a t i v e t o 1971 A r e a l wage r e l a t i v e t o I I I I I I I 1 I l l l I l I 1
e r. m +
0 4.
a, > ?. u
m
a, L
ln W V
u C
- 3
H
300
250
200
150
100 I l I I I / l I I I / l I I / I '
71 72 7 3 74 75 76 77 78 79 80 81 82 8 3 84 85 86 8 7 yea r
Fig. 7.1 Growth of labor productivity and real wage Source: Economic Planning Board, Korean Statistical Yearbook (various years). Note: Labor productivity is calculated as output per worker in manufacturing.

232 Dae-I1 Kim and Robert H. Topel
First, over the long term, wage growth and productivity growth are identical. Both indices tripled in a period of only sixteen years. The obvious message is that advancing labor productivity fueled wage and income growth in Korea. More generally, the close correspondence between productivity and wages points to the widely discussed emergence of manufacturing as the engine of Korean economic development.
The second point is timing. Real-wage growth in the early 1970s lagged behind productivity growth, but the gap closed after 1975. As we will indicate below, government efforts to suppress wage growth-at least for less skilled workers-seem to have been successful in the early 1970s. At least from the middle 1970s on, market forces play a dominant role in wage determination.
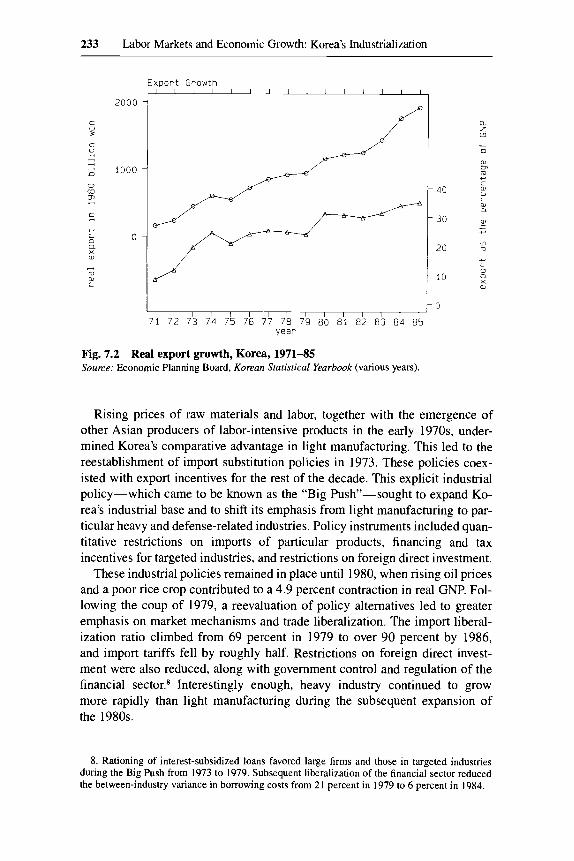
Later we will argue that productivity growth in particular industries fueled a transformation of the Korean labor market, creating export opportunities and huge shifts in the sectoral composition of employment. For now, figure 7.2 shows the growth in aggregate foreign trade since 1970. The real value of man- ufactured exports grew sevenfold in only fifteen years. As a proportion of total output, exports grew from about 10 percent of GNP in 1970 to over one-third of GNP in 1985. For comparison, the corresponding figures for the United States are 7.2 percent and 10 percent, respectively.
7.2.2 Industrial Policies Affecting the Composition of Output6
Like other developing countries in East Asia (except Japan), Korea’s rapid development coincides with a shift in policy from import substitution to active export promotion. As in Taiwan, which began its shift in policy in the early 1950s, export promotion was achieved by dismantling macroeconomic policies that had restricted exports and by instituting policies that actively favored them.
The 1960s were a turning point for Korean economic policy. Until then, the government’s policy of import substitution had controlled all imports. Imports were restricted to those on a “permissible” list that included only 207 commod- ities before 1965. This system was reversed in 1967 so that only specified com- modity imports were prohibited. As a result, the import liberalization ratio (au- tomatically approvedtotal importable) jumped from 12 to 59 percent (Collins and Park 1989).’
Export incentives took various forms, including direct cash subsidies for exported products, preferential tax treatment of income from exports, interest rate subsidies, tax exemptions on intermediate inputs, and tariff exemptions on imported raw materials used for export production. During the 1970s, preferen- tial interest rates and tax and tariff exemptions accounted for more than 90 percent of gross subsidies per dollar of exports. Interest subsidies were abol- ished in 1982.
6. The discussion in this section draws on Collins and Park (1989), Kim (1990), and Song
7. This ratio remained fairly stable until 1978, after which it grew to 88 percent by 1985. (1990b).
233 Labor Markets and Economic Growth: Korea’s Industrialization
C 0
C 0
n - 3 - D
0 m m - c n
w
c 0 a
X W
3
10 aJ
c
2000
1000
0
E x p o r t Growth J I l i l l l l l I l l l I I
I I I I I I I I I I I I I I I /I 72 73 74 75 76 77 78 79 80 81 82 83 84 85
y e a r
Fig. 7.2 Real export growth, Korea, 1971-85 Source: Economic Planning Board, Korean Statistical Yearbook (various years).
a z L!
.t 0
W
m C
U
L aJ a
m
40 a,
Y
30 W c Y
20 m m
i L
o
X W 10 a
0
Rising prices of raw materials and labor, together with the emergence of other Asian producers of labor-intensive products in the early 1970s, under- mined Korea’s comparative advantage in light manufacturing. This led to the reestablishment of import substitution policies in 1973. These policies coex- isted with export incentives for the rest of the decade. This explicit industrial policy-which came to be known as the “Big Push”-sought to expand Ko- rea’s industrial base and to shift its emphasis from light manufacturing to par- ticular heavy and defense-related industries. Policy instruments included quan- titative restrictions on imports of particular products, financing and tax incentives for targeted industries, and restrictions on foreign direct investment.
These industrial policies remained in place until 1980, when rising oil prices and a poor rice crop contributed to a 4.9 percent contraction in real GNP. Fol- lowing the coup of 1979, a reevaluation of policy alternatives led to greater emphasis on market mechanisms and trade liberalization. The import liberal- ization ratio climbed from 69 percent in 1979 to over 90 percent by 1986, and import tariffs fell by roughly half. Restrictions on foreign direct invest- ment were also reduced, along with government control and regulation of the financial sector.8 Interestingly enough, heavy industry continued to grow more rapidly than light manufacturing during the subsequent expansion of the 1980s.
8. Rationing of interest-subsidized loans favored large firms and those in targeted industries during the Big Push from 1973 to 1979. Subsequent liberalization of the financial sector reduced the between-industry variance in borrowing costs from 21 percent in 1979 to 6 percent in 1984.

234 Dae-I1 Kim and Robert H. Topel
7.2.3 Labor Market Policies
Korean governments have intervened in labor markets with varying degrees of success. Our reading of government policy and its effects leads us to believe that wages and employment were mainly determined by market forces during the period under study, although there is some evidence that the government was successful in capping wage growth in the early 1970s.
This is not to say that governments took a hands-off approach to labor mar- kets. Two aspects of these policies are noteworthy. First, as noted by Song (1990a, 1990b), legal restrictions on collective bargaining have been an im- portant component of Korean industrial policies. Perhaps because of this, union members of all kinds have accounted for a very small portion of total employment. Figure 7.3 shows that union membership (including company unions) peaked at about 8 percent of total employment in 1979, which corre- sponds to about 13 percent of nonagricultural employment. At its peak in the late 1970s, union membership may have accounted for 18 percent of total man- ufacturing employment. The post-1986 upturn in union coverage reflects a re- laxation of government restrictions on collective bargaining, as indicated below.
Emergency provisions enacted in 197 1 prohibited collective bargaining by broad labor organizations. This sharply reduced the power of the Korean Head- quarters of Unions (KHU) and industrial unions, which had grown in the 1960s. At least until 1974, these organizations lost effective control over firm- level unions. The result of this policy was to strengthen the role of decentral- ized wage setting, which seems to have been a goal of government policies throughout the period under study. Even when unions were involved in wage setting, it was generally as a party to a bilateral negotiation between an individ- ual company and its union. Strikes and other forms of collective action were also banned at this time.
Korean governments also attempted to limit wage growth in key sectors. Under the threat of withdrawing government subsidies and support, employers were directed to keep nominal wage growth below an upper limit established by the Economic Planning Board (EPB). Roughly speaking, the allowable limit on any firm’s nominal wage growth was 80 percent of the sum of inflation and aggregate productivity growth. While there is little evidence that the limit was enforced, circumstantial evidence suggests that the policies were fairly successful in the early 1970s. Figure 7.1 above showed that aggregate wage growth lagged behind productivity growth at that time. More specifically, fig- ure 7.4 shows the correspondence between actual nominal wage growth and the government targets set by the EPB. Nominal wage growth exceeded gov- ernment targets by huge margins after 1975. This was a period of substantial price inflation and, as figure 7.3 above showed, of some resurgence in union coverage. Indeed, KHU and industrial unions reentered the wage negotiation process in 1975.

15
c 0 n u
m N - c 10 D
c 3
M
6
5
union/total employ o union/industr~al sector 1 1 1 1 1 1 1 1 l I I I I I I I I
7 1 I I I I I I I I I I I - 70 71 72 73 74 75 76 77 78 79 80 81 82 83 84 85 86
year
rig. I .J
employment, Korea, 1970-88 Source: Economic Planning Board, Korean Srarisrical Yearbook (various years).
umvn rnemoersmp as percenrage or tomi ana nonagncuiturai
o actual
1 40 1
A gov ' t guideline
15
10
5
", I I I I I I I I I I I I I 1 71 72 73 74 75 76 77 78 79 80 81 82 83 84 85 86 87
year
Fig. 7.4 Nominal wage growth, actual vs. government guideline Source: Song (1990b).

236 Dae-I1 Kim and Robert H. Tope1
Following the coup of 1979, KHU and industrial unions were again prohib- ited from participating in wage negotiations. Authority for industrial rela- tions-including wage negotiations-was placed in mandated labor- management committees, which further eroded the importance of unions. These policies coincide with the decline of union coverage up through 1986 and-because inflation was brought under control-with nominal wage in- creases that were in line with government targets (fig. 7.4). Actual wage growth kept pace with productivity in this period, however. Restrictions on collective bargaining were relaxed in 1986. This led to another resurgence of union power and a sharp increase in organizing and strike activities.
7.3 Labor Market Performance in Korea
7.3.1 Productivity, Employment, and Exports
We argued above that sustained productivity growth has been the fulcrum of Korea’s economic development. Our interpretation of the labor market ef- fects of rising productivity is straightforward. Coupled with open markets for manufactured exports, increases in total factor productivity raise the demand for labor in the manufacturing sector. With fixed aggregate labor supply, this causes net migration of labor to manufacturing and support industries and ris- ing aggregate wages. Consistent with this, figure 7.5 shows that manufactur- ing’s share of total Korean employment doubled between 1971 and 1986. This relative growth has been fed by a steady decline in agricultural employment.
Large-scale migration from agriculture is certainly consistent with rising relative demand for nonagricultural labor. With a rising supply price of mi- grants, this might widen the rural-urban income gap in the short run. While the unemployment rate of nonfarm households fell steadily over the period, Tcha (1992) shows that rural incomes rose relative to urban ones until 1975 and actually exceeded urban incomes from 1973 to 197K9 There is some evidence in Tcha’s data for declining relative incomes of rural workers after 1975. Over- all, however, his data indicate rough parity between urban and rural incomes during the period of our data.Io This is weak evidence against the relevance of Todaro (1969)-style models of segmented labor markets, where urban wages are held above those in rural areas. Given the magnitude of the migration that took place, these data are superficially consistent with highly elastic labor sup- ply from rural areas.
International trade is a key element of this scenario. With prices of manufac-
9. The data for unemployment rates are from the Economic Planning Board (EPB), Monthly Staristics of Korea, 1988, and Annual Report of the Economically Active Population, various issues.
10. Tcha’s data are fairly tentative. They are adjusted for differences in costs of living between rural and urban areas, which he finds to be quite large. Further, Tcha’s adjustment to income levels is based on government data from 1980 alone, so time-series changes in the cost of living are not captured in his estimates.

237 Labor Markets and Economic Growth: Korea's Industrialization
o agriculture ather industries
A manufactur ing
70 75 80 85 y e a r
Fig. 7.5 Sectoral employment shares Source: Economic Planning Board, Korean Statistical Yearbook (various years).
tured goods fixed on international markets, productivity growth in a small open economy raises the demand for factors because increased output can be sold abroad. This means that exports will account for a rising proportion of total output, which is what happened. At a more disaggregated level, it also means that rapidly growing sectors-in terms of output and employment-should be those with the greatest productivity growth. In turn, these should also be the sectors with the largest increases in exports. Figures 7.6-7.8 below provide direct evidence on these points.
Figure 7.6 shows patterns of export growth among manufacturing industries between 1978 and 1985." Exports grew most rapidly in fabricated metals, where they nearly quadrupled in seven years, while the real value of exports actually declined in wood products. Table 7.2 shows the corresponding values for labor productivity after 1971. While productivity grew dramatically in all industries, the range of growth rates is fairly wide. Output per worker grew by a factor of four in fabricated metals and machinery-an annual rate of nearly 10 percent-but by less than 50 percent in wood products.
The relations among productivity growth, employment growth, and exports are shown in figures 7.7 and 7.8. Figure 7.7 plots rates of employment growth against rates of productivity growth for manufacturing industries between 1978 and 1985.12 The correlation between them is .85. Figure 7.8 is a conform-
11. Data from earlier years were not available. 12. A corresponding figure for growth rates from 1971 to 1985 shows the same relation. We
focus on 1978-85 to be consistent with fig. 7.8. Export data by industry were available to us only for this period.

BOO0 1 1 BOO0
-6000
- 4000
2000
400 -
200 -
0 -
7b 7b eb e i u . m m ~ b BB s i B!
Real Export. f o r S e i e c t e d I n d u s t r i e s , I1 Real Export for Sei i i ted I n d u s t r i e s , I1
Fig. 7.6 Exports of manufacturing industries, 1978-85 Source: Economic Planning Board, Korean Statistical Yearbook (various years).
600
400
200
a

1.4
2 1.2 U c
C W
0
.- c
5
E l - a
.8
machinery
chemical
paper
glass primary metal
wood
textile
1 1 1.2 1.4 1.6 1.8
productivity index
Fig. 7.7 Employment and productivity, 1985 vs, 1978
Indices are 1985 relative to 1978 J I I 1 I L
machinery
primary metal
chemical
textile glass
paper
0 1 2 3 4 5 export index
Fig. 7.8 Employment vs. export for Korean manufacturing

240 Dae-Il Kim and Robert H. Tope1
Table 7.2 Productivity Indices within Manufacturing Measured as Output per Worker, Korea, 1971-86
Sectors within Manufacturing Entire
Year Mfg. (1) (2) (3) (4) (5) (6) (7) (8)
1971 100.0 100.0 100.0 100.0 100.0 100.0 100.0 100.0 100.0 1972 104.7 105.2 113.8 93.2 100.4 101.4 110.8 117.8 108.4 1973 135.8 128.3 149.8 113.6 138.2 116.4 128.9 185.3 148.9 1974 155.6 138.6 151.2 118.2 163.2 156.1 157.1 205.5 179.3 1975 162.6 168.5 165.8 124.1 147.0 176.0 184.7 159.7 171.6 1976 166.8 180.8 174.7 123.3 157.5 164.6 184.5 198.0 189.4 1977 179.1 198.5 178.2 131.5 175.6 172.7 214.1 194.0 218.0 1978 189.7 208.9 187.7 137.3 188.6 181.4 198.0 115.2 223.3 1979 207.4 204.0 202.1 157.9 205.4 207.7 234.7 223.4 248.2 1980 230.1 217.6 216.4 145.6 228.0 261.9 261.2 251.0 237.5 1981 240.7 233.5 216.3 137.8 241.2 274.8 244.9 281.7 271.3 1982 241.7 251.0 204.5 138.5 237.2 260.3 248.3 288.0 289.0 1983 259.7 256.0 213.9 143.6 276.9 276.6 289.1 302.6 324.0 1984 282.5 266.0 243.2 149.8 300.2 294.6 301.9 325.2 362.3 1985 286.3 268.5 252.1 144.4 302.6 283.5 307.3 332.2 370.3 1986 297.6 278.3 282.4 146.4 337.2 241.7 346.8 345.1 409.4
Source: Calculations are from Korean Staristical Yearbook (Seoul: Economic Planning Board, 197 1-86). Note: (1) Food and beverages, (2) textiles, (3) wood products, (4) paper products, (5) chemical product, (6) pottery and glass, (7) primary metals, and (8) fabricated metals and machinery.
able graph of employment growth against export growth for the same period; the correlation between these is .62. The data suggest a strong causal link run- ning from productivity growth to exports and employment.
7.3.2
The preceding data indicate that important changes in relative labor de- mands have caused large shifts in the sectoral composition of employment in Korea. If expanding industries require specific talents subject to rising supply price, then the speed of these shifts should cause conformable changes in rela- tive wages. We find scant evidence of this. Instead, we find that the dramatic real-wage growth documented in figure 7.1 above is mainly neutral across manufacturing industries. To a first approximation, there is one big labor mar- ket in Korea, at least in the nonagricultural sector.
To investigate these issues, we regressed industry values of log wages, pro- ductivity, and employment on fixed industry effects and common year effects, as in
Industry Growth, Productivity, and Wages
Wi, = a, + B, + wl,, where W,, is the log of average hourly earnings for workers in industry i at time t. Call the residuals from these regressions wi,, P , ~ , and e , for wages, productiv- ity, and employment, respectively. To demonstrate the relation between em-

241 Labor Markets and Economic Growth: Korea’s Industrialization
ployment and productivity growth rates, figure 7 . 9 ~ shows results from re- gressing e,, on p, , for the eight manufacturing industries listed in table 7.2 above. As above, the data clearly indicate that greater productivity growth in- creases labor demand; on average, productivity growth that is 10 percent greater than average generates employment growth that is 6 percent greater than average.
There is slight evidence of a positive relation between productivity growth and wages, shown in figure 7.96. A 10 percent increase in relative productivity growth is associated with about a 1 percent increase in relative wages. Our estimates cannot control for changes in the quality of the workforce, but we take this as some evidence that skill upgrading raised measured productivity in some sectors.
Finally, figure 7 . 9 ~ shows the estimated relation between wage growth and employment growth. There isn’t one. These data indicate that differences in relative growth rates have had no measurable effect on relative wages. In other words, while differences in productivity growth strongly influence labor de- mand and output, there is no evidence that growing sectors faced a rising sup- ply price of labor over this period.I3
7.3.3 Sectoral Reallocation of Labor
The neutrality of wage growth in spite of large shifts in relative demands suggests that sectoral wage differentials are arbitraged by labor mobility and the growing supply of skilled workers. While our data do not allow for a de- tailed investigation of mobility among manufacturing industries, we can use the EAP data to investigate patterns of mobility among broader industry aggre- gates. We find that almost all intersectoral mobility occurs among young work- ers and new entrants to the labor force. They account for virtually all the growth in manufacturing employment, and it appears that their numbers are large enough to arbitrage intersectoral wage differences. Later we will show that the wages of young workers have risen through time, but it seems that this can be attributed to a decline in their relative supply (a baby bust) rather than to an increase in demand in any particular sector.
Evidence on sectoral mobility is in table 7.3, which shows how the sectoral composition of employment has changed within labor market cohorts. We know from earlier evidence that employment has shifted from agriculture to manufacturing and trades. The table demonstrates the pace with which this transformation of the labor market has taken place. As late as 1975, the modal job among new entrants (twenty to twenty-five years old) was in agriculture, which accounted for nearly a third of all young workers’ jobs. By 1989, that figure had fallen to 6 percent, while nearly half of all new entrants worked in
13. This does not mean that supplies of different skill groups were perfectly elastic at each point in time. As the education data suggest, supply curves of skill groups were also shifting during this period.

Regression o f employment res idua ls on p r o d u c t i v i t y res idua ls
L c
L
Fig. 7 . 9 ~
Fig. 7.9b
- 5
75
e, = .613 pir (. 134)
I I I I - 3 - 1 1 3
res idua ls from p r o d u c t l v ~ t y regress ion
Employment and productivity within manufacturing
.2
. 1
0
-.l
-.2
Regression of wage residuals on productivity residuals
W, = .123 pi, (. 036)
5
25
0
- 25
- 5
- 7s -r .5
.2
. 1
0
-.l
-.2 I 1 I T I
- 3 -.l 1 .3 .5 residuals from productivity regression
Neutrality in wage growth within manufacturing

243 Labor Markets and Economic Growth: Korea’s Industrialization
R e g r e s s i o n o f wage r e s i d u a l s on employment r e s i d u a l s
2-1
E 0 L
+
in I I .-
t .*
w,, = -.016 e,, - 1 ; (.023,; I 0 o l , [ - I
D
- 2 - 2
r e s i d u a l s f rom employment r e g r e s s i o n - 5 - 3 - 1 1 3
Fig. 7 . 9 ~ Neutrality in wage growth within manufacturing
manufacturing. The corresponding figure in 1970 was only 23.7 percent. For comparison, by 1985 less than one-fifth of labor force entrants in the United States began their careers in manufacturing (Murphy and Tope1 1987a).
Surprisingly, in spite of the rapid growth of manufacturing, there is little evidence of within-cohort migration to that sector. For example, among work- ers who were twenty-five to twenty-nine years old in 1970, the proportion who work in manufacturing remained stable at roughly 17 percent for twenty years.
This pattern occurs in all cohorts, which implies that the growth of manufac- turing employment was accomplished by allocating ever larger proportions of new entrants to that sector. This is illustrated in figure 7.10, which simply plots the shares of successive age cohorts that work in manufacturing. The within- cohort shares are basically flat lines; indeed, there is some evidence of within- cohort outmigrution from manufacturing between 1975 and 1985. The figure shows that all the growth in manufacturing’s average share-shown as the bold line-is due to rapidly increasing shares at the margin, that is, of new entrants. It appears that workers who start in manufacturing stay there, with little net migration in or out at older ages.
While there is no evidence of within-cohort migration to manufacturing, inspection of table 7.3 does show that agricultural workers were leaving the farm, albeit at faster rates among the young. They were absorbed by the non- manufacturing sector, especially by wholesale and retail trade. This pattern suggests a sort of “musical chairs” interpretation of the sectoral reallocation of labor in Korea. During Korea’s industrialization, agriculture declined, and manufacturing grew, but agricultural workers did not migrate to manufactur- ing. Instead, it appears that manufacturing draws on the urban young, who

244 Dae-II Kim and Robert H. Topel
Table 7.3
Age Cohorts 1970 1975 1980 1985 1989 Sectors
Employment by Sector and Cohorts, Korea, 1970-89
20-24 in 1989
20-24 in 1985
20-24 in 1980
20-24 in 1975
20-24 in 1970
25-29 in 1970
30-34 in 1970
35-39 in 1970
13.2 38.8 20.7 27.3
25.6 14.8 36.6 30.7 14.3 22.2 23.5 32.3
31.8 23.6 17.4 22.6 28.1 25.6 9.4 17.9 24.5
36.2 30.4 32.5 40.4 36.7 25.5 20.7 23.7 22.0 23.1 21.4 11.6 14.9 20.5 25.7 24.3 26.4 30.9 32.2 40.7 38.3 32.6 28.0 17.1 17.7 17.7 17.6 13.7 16.9 20.9 25.0 28.5 27.1 28.8 29.4 44.3 45.8 41.8 37.3 13.3 13.0 13.3 13.2 14.1 16.4 18.7 22.2 28.3 24.8 26.2 27.3 48.9 52.1 50.2 44.6 10.5 9.8 10.0 10.1 14.7 15.8 16.4 20.2 25.9 22.3 23.4 25.1
6.0 44.6 20.1 29.3
8.5 38.4 21.1 32.0 11.1 31.8 23.2 33.9 14.9 26.7 25.0 33.4 18.1 23.2 25.5 33.2 26.9 17.8 24.4 30.9 37.1 14.6 18.9 29.4 47.0 11.4 17.3 24.3
Source: Annual Reports on the Economically A c h e Population (Seoul: Economic Planning Board, 1970, 1975, 1980, 1985, 1989). Note: (1) Agriculture, (2) manufacturing, (3) trades, (4) all others.
develop skills that bind them to that sector. Their places in nonmanufacturing industries are taken by agricultural migrants of varying ages.I4
Why this occurs is something of a mystery. One explanation is the nature of secondary school training in Korea, which emphasizes vocational skills for
14. It is possible, although improbable, that substantial intersectoral mobility within a cohort would leave manufacturing’s share constant. This would be more plausible were manufacturing’s overall share of employment stable. It is hard to believe that new cohorts enter manufacturing in ever mounting numbers while offsetting gross flows for older cohorts leave their shares of manu- facturing employment unchanged.

245 Labor Markets and Economic Growth: Korea’s Industrialization
Employment Share o f Mining 6 Manufacturing
c - W
L m L Ln
20 w E ?. 0
Q E
W
4
35-39 in ’70
20-24 in ’89
20-24 in ’85
20-24 in ’80
20-24 in ’75
20-24 in ‘70 25-29 in ’70
30-34 in ’70
o j I I I I 1
70 75 80 85 89 y e i j r
Fig. 7.10 Employment shares in mining and manufacturing, by cohort and year, 1970-89 Source: Economic Planning Board, Annual Reports on the Economically Active Population (1970, 1975, 1980, 1985, 1989).
students who are not college bound. Rural schools emphasize agricultural skills, while urban ones provide mechanical training that is more suited to manufacturing employment. This difference makes the urban young a natural source of manufacturing employment and may account for the mobility pat- terns shown in table 7.3.
7.3.4 Interfirm Mobility
Within-cohort stability of manufacturing’s share, combined with the overall growth of that sector, might suggest that the Korean labor market is moving toward “lifetime” employment relations reminiscent of Japan. In fact, average job durations have risen substantially over time, yet our data suggest that turn- over rates remain remarkably high, especially in manufacturing.
Figure 7.11 shows that the average duration of job spells in progress has risen over time. Since the average age of the labor force has also been rising, the estimates in the figure are regression adjusted to reflect average job tenures for the mean age (thirty-three) during the sample period. In spite of the fact that average job durations have risen by about 1.5 years, job duration in Korea remains much shorter than in other industrialized countries. The average dura- tion of an (incomplete) job in Korea-now slightly more than four years-is less than half as long as the average job in the United States (nine years; Aker-

246 Dae-Ii Kim and Robert H. Tope1
D age-ad lus ted t e n u r e p r e d i c t e d value
4 5 -1 0 0
- 2 5 I I I I I 70 75 80 85 90
year
Fig. 7.11 Age-adjusted job tenures of Korean men, 1971-88 Note: The values shown in the figure are average incomplete job tenures, adjusted for changes in the age composition of the workforce.
lof and Main 1980).15 Job durations in Japan were longer still (Hashimoto and Raisian 1985).
The tenure data indicated that long-term employment relations are less im- portant in Korea than in the United States or Japan. To get closer to this issue, we obtained data on the raw number of separations at various job durations during the 1980s. We then combined these data with OWS estimates of the number of workers at each tenure level, yielding turnover rates by job tenure for manufacturing and nonmanufacturing jobs. These “employment hazards” are shown in table 7.4. They show the usual pattern of declining mobility with job tenure. More important, they also indicate a sharp decline in turnover rates during the 1980s, especially for workers with more than one year of job se- niority.
Interestingly, turnover rates are much highel; and job durations correspond- ingly lower, in manufacturing than in other sectors. This is the opposite of what is found in most other industrialized countries, and it suggests that firm- specific skills are less important in Korea than elsewhere. This surprising result also stands in contrast to our earlier findings on net sectoral mobility, which showed virtually no within-cohort mobility to and from the manufacturing sec-
15. The OWS survey also records “task tenure,’’ which can exceed job tenure if workers move among firms but remain in the same occupation. Task tenures have also risen over time, indicating increased specialization of the workforce. Even so, average task tenures were only 5.5 years for the mean age at the end of the 1980s. Even among workers aged fifty to fifty-four in manufactur- ing, average job durations were only about seven years in the mid-1980s.

247 Labor Markets and Economic Growth: Korea’s Industrialization
Table 7.4 Job Separation Rates, Korea, 1982-88
Year
Years of Job Tenure Expected
<1 1-2 3-4 5-9 10+ Total Tenure
A. Manufacturing sector:
1982 64.1 23.4 11.0 7.0 7.0 25.1 3.77 1983 74.4 21.0 10.5 5.5 4.8 24.4 3.33 1984 84.2 26.9 13.3 7.1 4.3 30.5 2.44 1985 68.0 20.8 9.8 5.8 4.7 23.6 3.70 1986 69.1 17.8 9.7 5.1 4.4 21.0 3.72 1987 55.7 17.3 8.4 4.9 3.7 19.8 4.34 1988 61.0 16.8 8.4 4.9 3.3 20.8 4.15
B. Nonagricultural sector:
1982 1983 1984 1985 1986 1987 1988
26.6 10.1 5.2 3.2 2.8 10.4 5.35 32.4 9.6 5.2 2.8 2.2 10.4 5.26 37.8 8.0 6.4 3.4 2.6 13.0 5.13 30.7 10.1 5.1 2.9 2.1 10.2 5.28 31.2 8.9 5.0 2.7 2.0 9.2 5.30 26.8 8.6 4.6 2.5 1.8 8.7 5.41 27.9 8.1 4.4 2.4 1.7 8.9 5.40
Source: Authors’ calculations from Reports on Occupational Wage Survey (Seoul: Ministry of Labor, 1982-89) and Annual Reports on the Economically Active Population (Seoul: Economic Planning Board, 1982-89). Note: For the group with more than ten years of tenure, the distribution of job tenure is assumed to decline linearly until it reaches zero at thirty years of tenure for the calculation.
tor. This implies that within-sector mobility is very high in manufacturing. Evidently, the human capital that binds workers to the manufacturing sector is industry, rather than firm, specific.I6
7.4 Wage Differentials and Inequality
While wages of workers in different industries have moved together, there is strong evidence of changing relative wages along observable and unobservable dimensions of skill. We analyze the determinants of changing returns to schooling and age and draw implications for the determinants of changing overall wage inequality in Korea.
7.4.1
Overall wage inequality fell dramatically during Korea’s industrialization. On the basis of our micro-data files for 1971, 1983, 1986, and 1989, table
Wage Inequality and Changing Skill Premiums
16. In an economy as dynamic as Korea’s, recorded job separation numbers may be heavily influenced by births and deaths of firms. We have been unable to obtain any evidence on this.

248 Dae-I1 Kim and Robert H. Topel
Table 7.5
Percentile Difference 1971 1983 1986 1989
Wage Inequality among Korean Men, 1971,1983,1986,1989
A. Log wage: 90-10 90-50 50-10 SD
B. Log wage residuals: 90-10 90-50 50-10 SD
1.683 ,800 ,883 ,663
1.066 .511 ,555 .438
1.410 ,700 ,710 .550
,801 .372 ,429 .327
1.289 ,657 ,642 ,517
,762 ,307 ,375 ,300
1.219 ,605 ,614 .484
,739 ,360 .379 ,305
Source: Calculations from OWS microdata files, Ministry of Labor, Korea Note: Wage measure is by log monthly earnings deflated by the consumer price index provided by the Economic Planning Board of Korea. Regressors for panel B estimates are three education dummies, an experience quartic, a quadratic in years with current employer, years at current job (task), dummies for one-digit occupation and one-digit industry.
7.5 summarizes changes in the distribution of wages among Korean men. The difference in log wages between men in the ninetieth and tenth percentiles of the wage distribution fell from 1.68 in 1971 to 1.22 in 1989, a narrowing of forty-six log points. The comparable statistic for the United States increased during this period from 1.16 to 1.46 (Goldin and Margo 1992). Indeed, these data indicate that overall wage inequality is now greater in the United States than in K0rea.I’ The lower panel of the table shows the change in “residual inequality” after controlling for a vector of observed worker characteristics. The 90-10 spread in unobserved determinants of wages fell by thirty-three log points over this period, which is about three-quarters (33/46) of the overall change in wage inequality.
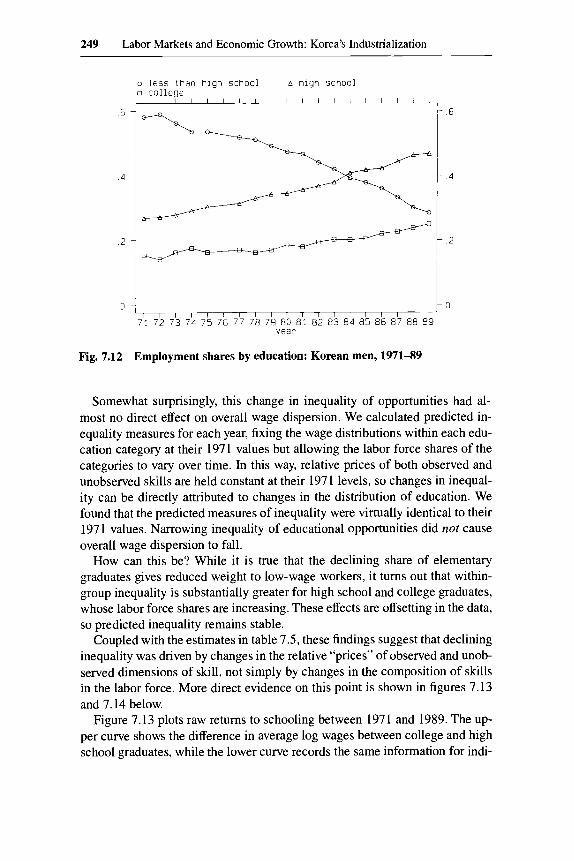
There are several hypotheses about why inequality narrowed. One is that changes in the educational composition of the labor force caused a narrowing of opportunities, which could directly reduce wage dispersion. Figure 7.12 shows the raw labor force shares of schooling groups in the OWS data. The main message of the figure is the large decline in the relative supply of less educated workers, reflecting the extraordinary increase in school enrollments following World War 11. The labor force share of elementary school graduates was halved in only eighteen years, from 60 to 30 percent. Two-thirds of this decline is due to a rising share of high school graduates, indicating that overall inequality of education levels declined.
17. Keep in mind that these statistics are based on the OWS data, which exclude small firms. As in other countries, there is every reason to believe that small firms employ disproportionate numbers of less skilled workers (Brown and Medoff 1989), so overall inequality in Korea is likely to be understated.
249 Labor Markets and Economic Growth: Korea’s Industrialization
o less than h igh school A h igh s c h o o l o co l l ege
1 l I l 1 1 1 1 l I I / I I I I I l l
I I ~ I I ~ I I I ~ I I I I I I I I ~
y e a r 71 72 73 74 75 76 77 7t3 79 80 81 82 83 8 4 85 86 8 7 88 89
Fig. 7.12 Employment shares by education: Korean men, 1971-89
Somewhat surprisingly, this change in inequality of opportunities had al- most no direct effect on overall wage dispersion. We calculated predicted in- equality measures for each year, fixing the wage distributions within each edu- cation category at their 1971 values but allowing the labor force shares of the categories to vary over time. In this way, relative prices of both observed and unobserved skills are held constant at their 1971 levels, so changes in inequal- ity can be directly attributed to changes in the distribution of education. We found that the predicted measures of inequality were virtually identical to their 1971 values. Narrowing inequality of educational opportunities did nor cause overall wage dispersion to fall.
How can this be? While it is true that the declining share of elementary graduates gives reduced weight to low-wage workers, it turns out that within- group inequality is substantially greater for high school and college graduates, whose labor force shares are increasing. These effects are offsetting in the data, so predicted inequality remains stable.
Coupled with the estimates in table 7.5, these findings suggest that declining inequality was driven by changes in the relative “prices” of observed and unob- served dimensions of skill, not simply by changes in the composition of slulls in the labor force. More direct evidence on this point is shown in figures 7.13 and 7.14 below.
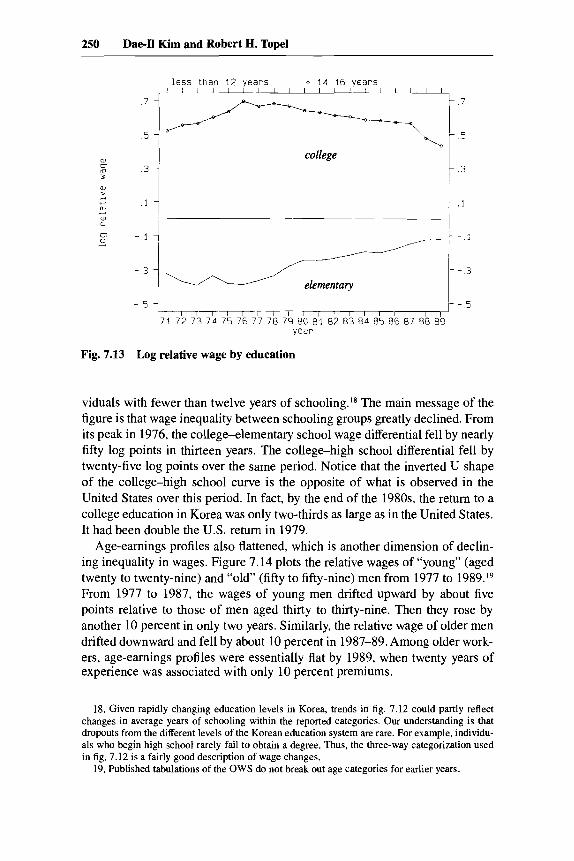
Figure 7.13 plots raw returns to schooling between 1971 and 1989. The up- per curve shows the difference in average log wages between college and high school graduates, while the lower curve records the same information for indi-
250 Dae-I1 Kim and Robert H. Tope1
less t h a n 12 y e a r s o 14-16 y e a r s
7 7
5 5
W cn m 3 3
W > +
(0
UJ c
u 1 1 4
- 1
- 3
g - 1 +
- 3
- 5 , , , 1 - 5 L77-r I I 1 I I I I I 71 72 7 3 7 4 7 5 76 77 70 7 9 80 8 1 8 2 83 8 4 85 86 87 88 89
year
Fig. 7.13 Log relative wage by education
viduals with fewer than twelve years of schooling.18 The main message of the figure is that wage inequality between schooling groups greatly declined. From its peak in 1976, the college-elementary school wage differential fell by nearly fifty log points in thirteen years. The college-high school differential fell by twenty-five log points over the same period. Notice that the inverted U shape of the college-high school curve is the opposite of what is observed in the United States over this period. In fact, by the end of the 1980s, the return to a college education in Korea was only two-thirds as large as in the United States. It had been double the U.S. return in 1979.
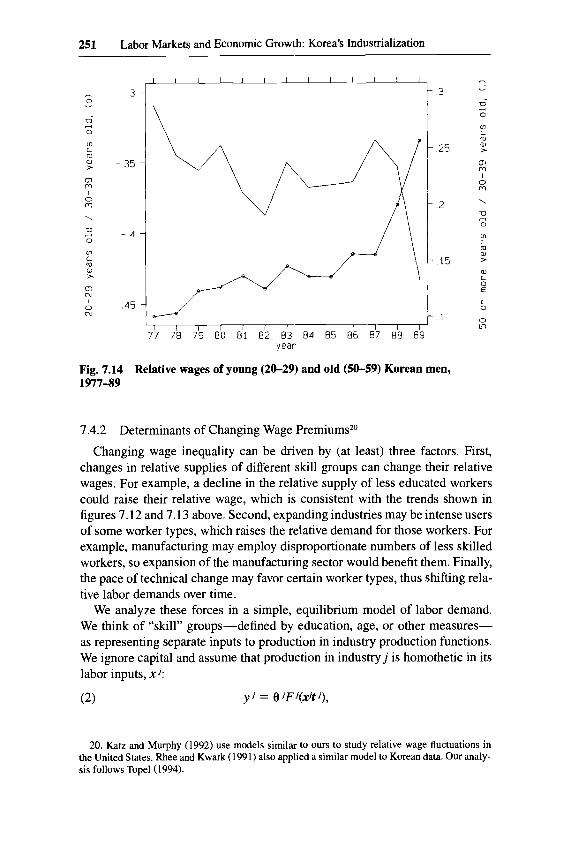
Age-earnings profiles also flattened, which is another dimension of declin- ing inequality in wages. Figure 7.14 plots the relative wages of “young” (aged twenty to twenty-nine) and “old” (fifty to fifty-nine) men from 1977 to 1989.19 From 1977 to 1987, the wages of young men drifted upward by about five points relative to those of men aged thirty to thirty-nine. Then they rose by another 10 percent in only two years. Similarly, the relative wage of older men drifted downward and fell by about 10 percent in 1987-89. Among older work- ers, age-earnings profiles were essentially flat by 1989, when twenty years of experience was associated with only 10 percent premiums.
18. Given rapidly changing education levels in Korea, trends in fig. 7.12 could partly reflect changes in average years of schooling within the reported categories. Our understanding is that dropouts from the different levels of the Korean education system are rare. For example, individu- als who begin high school rarely fail to obtain a degree. Thus, the three-way categorization used in fig. 7.12 is a fairly good description of wage changes.
19. Published tabulations of the OWS do not break out age categories for earlier years.
251 Labor Markets and Economic Growth: Korea’s Industrialization
- - - .3
5:
0 - 0
m L m
-.35
rn m I 0 m \
U
0
m L “3 W >
-.4 4
m N
A -.45 N
- 3 - - D
0
01 L m (u >
0, m I 0
3
m \
U
0
m L m 0 >
W L 0 E
L 0
0 Ln
fi
y e a r
Fig. 7.14 Relative wages of young (20-29) and old (50-59) Korean men, 1977-89
7.4.2 Determinants of Changing Wage PremiumsZo
Changing wage inequality can be driven by (at least) three factors. First, changes in relative supplies of different skill groups can change their relative wages. For example, a decline in the relative supply of less educated workers could raise their relative wage, which is consistent with the trends shown in figures 7.12 and 7.13 above. Second, expanding industries may be intense users of some worker types, which raises the relative demand for those workers. For example, manufacturing may employ disproportionate numbers of less skilled workers, so expansion of the manufacturing sector would benefit them. Finally, the pace of technical change may favor certain worker types, thus shifting rela- tive labor demands over time.
We analyze these forces in a simple, equilibrium model of labor demand. We think of “skill” groups-defined by education, age, or other measures- as representing separate inputs to production in industry production functions. We ignore capital and assume that production in industry j is homothetic in its labor inputs, nJ: (2) y j = 0 JFj(xJtJ),
20. Katz and Murphy (1992) use models similar to ours to study relative wage fluctuations in the United States. Rhee and Kwark (1991) also applied a similar model to Korean data. Our analy- sis follows Tope1 (1994).
252 Dae-I1 Kim and Robert H. Topel
where 6’ represents total factor productivity and the parameters tJ = (tJ,, ti, . . .) represent factor-augmenting technical change for each input in industry j . Given (2 ) and output prices p ~ , the factor demand equations are of the form
(3)
where j’: = d log 4 ld t etc., and w = (w,, w2, . . . , wn) is the vector of market wage rates for inputs i = 1 , 2, . . . , n. In (3), @ is the row vector of compen- sated demand elasticities for input i in industry j , and & indexes biased techni- cal change affecting the demand for input i. Notice that factor-neutral technical change raises the demand for all inputs because price, p , is fixed. The terms fY(p + 6’) are unobserved but common to all inputs in industryj. They can be eliminated by imposing the homogeneity condition that a cost share-weighted sum of demand elasticities is zero, which is equivalent to removing fixed ef- fects within industry j . Letting k; be the cost share of input i, subtract
(4) 21 = z k!x;
from each demand equation (3), yielding the deviations model for factor i in industry j :
x; =qw + (L(p + sl) - #,
I
xi - 2~ = E J ~ - +I ( 5 ) I
In (3, the term i; - represents the rate of change in the factor ratio for input i, which is determined by pure substitution effects of relative wage changes, El, and by factor-biased technical change.
In market equilibrium, the set of factor demand equations (5) must solve
where x, is the market-wide rate of change in supply of input i, and where s; is the share of input i that is employed in industry j . Substitute (5) in the equilib- rium condition (6) , yielding the market demand equation for each input i:
(7) x , - z , = E , w - + , , i = l , 2 , . . . , n,
where E, = z s; E; is a weighted sum of within-industry demand elasticities
for input i. 1;(7), the term i, = S ~ J can be thought of as a relative demand
index for input i; expansion of industries (2) that use input i intensively (s;) raises the relative demand for input i.
Finally, we can invert the demand system (7) to obtain a system of linear equations for the determinants of equilibrium relative wages:
I
w = c [k - Z] + c+. (8) -
According to (8), changes in relative wages are determined by (i) changes in the “relative net supply” of inputs, it - i,, and (ii) biased technical changes that shift the relative demands for inputs. The coefficients in these models,

253 Labor Markets and Economic Growth: Korea’s Industrialization
C = E-I, are output-constant “elasticities of complementarity” that measure the effect of net relative supplies of factors on relative wages. The terms x and z involve only observable quantities (employment and wages), so (8) can be used to study the determinants of wages in Korea.2’
7.4.3 Factors Affecting the Returns to Schooling
We use model (8) to estimate the determinants of the returns to schooling and age, which changed substantially during the period under study. For schooling, we categorize individuals into three groups: college graduates (c), high school graduates (h), and those with only elementary school training ( e ) . We estimate models of the general form
(9) log(wclwe) = c,,(x, - z,) + c12(xH - zH) + &(trend) + cc,
where c , ~ < 0, cZ2 < 0, and the trend terms are meant to control for biased technical change over time.
Before proceeding to the estimates, it is instructive to decompose the rela- tive net supply of type i workers as
(11)
where x is the log of total employment. The first term in (1 1) is simply the log share of type i( = c, h, e ) workers in the labor market. Smaller values of x, - x mean reduced relative supply of type i workers, which should increase their relative wage. This is consistent with the declining share of elementary gradu- ates in figure 7.12 above, whose relative wages were rising. The second term in (1 1) indexes growth in demand for type i workers relative to total employ- ment. For example, the returns to schooling will fall if rapidly growing manu- facturing industries are intense users of less educated workers.
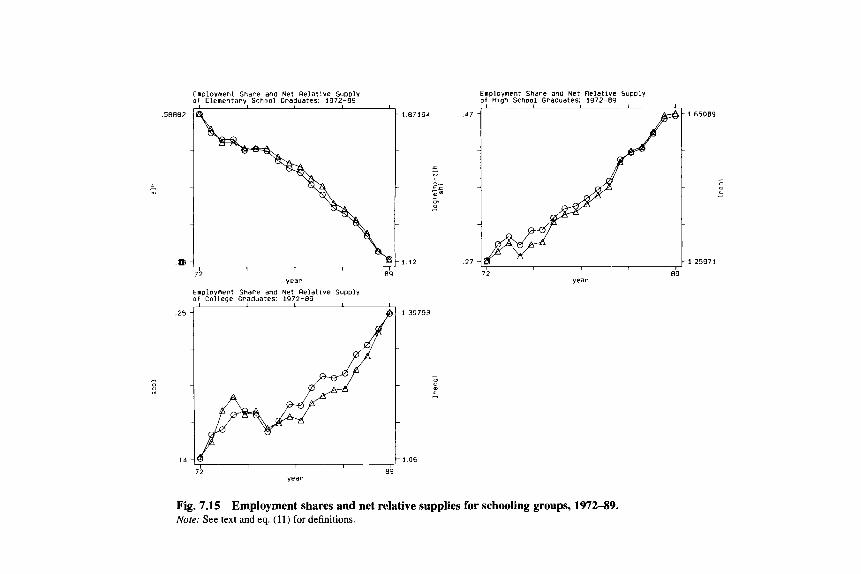
It turns out that almost all the variation in x, - z , is accounted for by chang- ing employment shares, x, - x. This is demonstrated in figure 7.15, which plots calculated values of x, - z , and x, - x for the three schooling groups. For each group, the series are almost indistinguishable.22 This means that differences in industry growth rates had no appreciable eflect on relative demands for skill.23
x, - z, = (x, - x) - (z , - x) ,
21. To calculate the cost shares, k;, we use average values of wages over the full period of our data.
22. The R’ values from regressions of net relative supply on the corresponding employment share for each group are .99, .99, and .93 for elementary, high school, and college graduates, respectively. In fig. 7.14 above, there is minor evidence that industrial shifts reduced the demand for college graduates in the late 1980s.
23. The net supply indexes, x, - z,, are constructed using data on men only, which means that changes in female labor force participation are ignored. Inclusion of women in the analysis is unlikely to change our conclusions since they are typically employed in less skilled jobs. Further, because most agricultural workers are excluded from the OWS. we ignore agriculture in con- structing the demand indexes 2,. Since agriculture is the least education-intensive industry, our
.25
M
0 u
14
oloyment Share and Net Relative supply Elementary Scnool Graduates. 1972-139
1 8 7 1 9 4
5
2; a'" - rn 0 -
1 1 2
72 8 9 Year
, 3 , 1 0 6
Emolovnent Snare and Net Relative S U D P ~ Y o f High School Graduates: 1972-89
.47
.27
72 year
ploynent Share and Net Relative Supply College Graduates 1972-89
1 I I
P I 3 9 7 9 3
- 0 Y u -
Fig. 7.15 Employment shares and net relative supplies for schooling groups, 197289. Note: See text and eq. (11) for definitions.

255 Labor Markets and Economic Growth: Korea’s Industrialization
This finding is important. We had expected that rapid growth of manufactur- ing was the link between industrialization and declining inequality in Korea. Instead, the data indicate that any effects of industry growth rates on the de- mand for skills are swamped by the very rapid upgrading of the educational quality of the Korean workforce. If there is a story to be told, it comes from the supply side-changing the stock of human capital via education-rather than from industry shifts that could change the relative demands for skills.
This brings us to estimates of models (10) and (1 l) , which are reported in table 7.6. For each group, the first reported model includes only the “own ef- fect” of a change in the net relative supply (x, - zi) of the group whose wage is modeled. For both high school and college graduates, the estimates indicate that increasing relative supply reduces relative wages. For these specifications, the elasticities of complementarity are approximately the inverse own-price elasticities of demand. The estimates indicate that the long-run demand for high school graduates is more elastic than the corresponding demand for col- lege graduates. And the implied elasticities of demand do not seem unrea- sonable.
Figures 7.16 and 7.17 plot the predicted and actual values of relative wages for high school and college graduates on the basis of the “own effects” models in column 1 of table 7.6 above. For high school graduates, the overall fit of the model is quite good-virtually all the 30 percent long-run decline in their relative wage is explained by increased relative abundance in the labor force. The model does somewhat less well for college graduates, mainly because of a poor fit in the early 1970s. Then, the rising relative supply of college gradu- ates was accompanied by rising relative wages (see figs. 7.12 and 7.13 above), which is inconsistent with the observable parts of the model. Keep in mind that this was a period in which the government was apparently more successful in controlling wage growth as part of an industrial policy of remaining compet- itive in traded goods. We conjecture that these policies may have had a smaller effect in the market for college graduates, although we can offer no proof at this time.
The remainder of table 7.6 shows variants on the basic model of wage deter- mination. Column 2 adds a linear trend, allowing for slowly moving, biased technical change that affects relative wages. Not surprisingly, this causes a sub- stantial decline in the estimated elasticities of complementarity, especially for college graduates. Column 3 adds cross-effects. The only noteworthy aspect of these estimates is that the relative quantity of high school graduates has more explanatory power for college wages than do college graduates themselves. This is not surprising in light of the perverse movements in college wages and quantities in the early 1970s, mentioned earlier. Finally, column 4 includes both cross-effects and trend.
results may miss a component of declining demand (increasing net supply) for less skilled workers. Since we find that the net supply of less skilled workers actually fell, this omission is unlikely to affect our conclusions.

Table 7.6 Net Relative Supply and Relative Wages for Education Categories, 197249: Elasticities of Complementarity
High School Relative Wage College Relative Wage
(1) (2) (3) (4) (1) (2) (3) (4)
High school relative quantity - ,692 ( .045)
College relative quantity
Trend
Intercept
R2
N
1.250 (.om ,936 18
-.396 (.219)
- ,007 W 5 ) 1.430 (.143) .944 18
1.180 (.087) ,941 18
-4.78 (.227) .I72
(.138) - ,008 (.005) 1.370 (.151) ,949 18
- 1.460 - ,573
-.016 (.239) (.396)
(.006) 2.620 2.860 (.287) (.263) ,701 ,794 18 18
- ,992 - 1.880 (.214) (.498)
p.196 -.213 (.336) (.304)
,024 (.012)
2.420 1.840 (.204) (.33 I ) ,866 ,898 18 18
Source: Authors’ calculations from Reports on Occupational Wage Survey (Seoul: Ministry of Labor, 1972-89). Note: Dependent variable = log monthly earnings relative to workers with fewer than twelve years of schooling. Standard errors are in parentheses.

,109513 - I I I 1 I
7 2 89 y e a r
Fig. 7.16 Predicted and actual high school relative wage model (1): own effects only Nore: The figure shows actual and predicted values of the high schooklementary school wage differential, based on the estimates in table 7.7.
1.08311 4
,554434 -1 I I , I p 7 2 89
y e a r
Fig. 7.17 Predicted and actual college wage model (1): own effects only Nore: See note to fig. 7.16.

258 Dae-I1 Kim and Robert H. Topel
A Caveat
Our estimation strategy has taken changes in the educational composition of the Korean labor force at face value. Specifically, we assumed that the average “qualities” of high school and college graduates did not change when their numbers increased. Given the scale and speed of educational upgrading in Ko- rea, this assumption may not be satisfied. For example, expansion of high schools and colleges may have diluted the quality of education, at least at the margin, and drawn in less able students. This would reduce the relative wage of educated workers and cause us to overstate the substitution effects of changes in labor force shares.
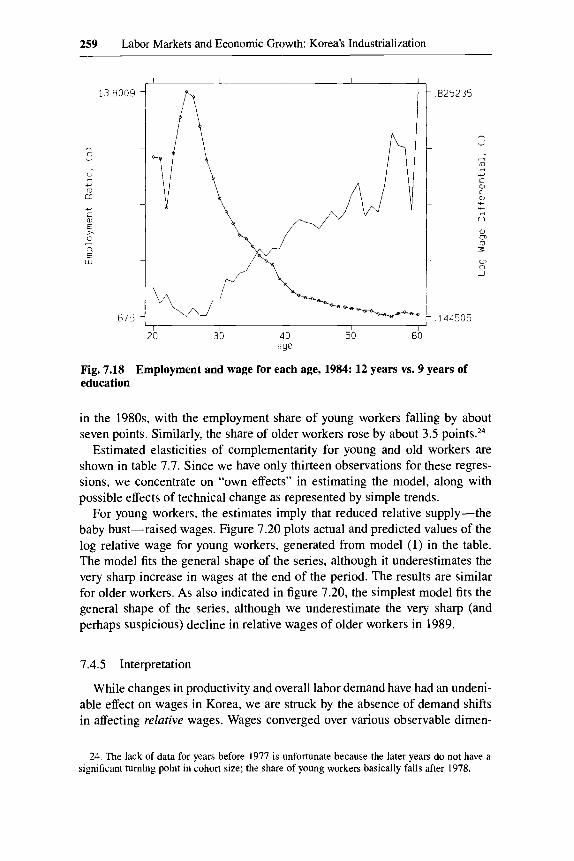
Some suggestive evidence on this point is presented in figure 7.18. Using data from the 1984 OWS, the figure graphs the ratio of high school to elemen- tary school graduates at each age (left scale) and the ratio of their average wages (right scale). For recent (aged twenty-five) entrants to the labor market, high school graduates are fourteen times more plentiful than elementary gradu- ates, and they earn about fourteen percent more. Compare this to the cohort aged twenty-five in 1967 (forty-two in 1984), which entered the labor market just before the education boom. In that cohort, high school graduates are only twice as plentiful as elementary school graduates, but they earn about 40 per- cent more. Of course it is possible that this pattern reflects substitution ef- fects-greater relative quantities reduce relative wages at each age-but the magnitudes shown in the figure make us suspect that the relative quality of high school graduates was diluted. In light of this, extra caution is warranted in interpreting the substitution effects shown in table 7.6. Even so, it is worth emphasizing that changing relative qualities cannot be the whole story. Changes in the return to schooling conform to the reduction in overall wage inequality, which cannot be explained by composition.
7.4.4 Net Supply and Shapes of Age-Earnings Profiles
We next apply the model to changes in relative wages across age groups, which were shown in figure 7.14 above. We choose our aggregates on the basis of observed relative wage changes. Thus, we treat workers aged twenty to twenty-nine as a separate input. Wages rose for this group, which could be generated by a decline in their net relative supply or by technical change that favored young workers. Similarly, relative wages of workers aged fifty and older have fallen, which could be generated by an increase in their net supply.
Figure 7.19 shows time series for aggregate employment shares and esti- mated net relative supply for these two age groups since 1977. We do not have data on wages and employment by age groups before then. As we found for schooling groups, the figures imply that differential rates of employment growth across industries had only minor effects on relative labor demands. Vir- tually all the variation in these series is caused by changes in labor force shares. Indeed, the data indicate that Korea experienced something of a “baby bust”
259 Labor Markets and Economic Growth: Korea’s Industrialization
13.8009
- 0 v
0 n +- ro a I
L a E 1 0
E W
3
a
.675
i I I
825235
- - d
+ u m
C (u L (u + c
n (u O
?z m
m 0 1
144505
2c 30 40 50 60 age
Fig. 7.18 Employment and wage for each age, 1984: 12 years vs. 9 years of education
in the 1980s, with the employment share of young workers falling by about seven points. Similarly, the share of older workers rose by about 3.5
Estimated elasticities of complementarity for young and old workers are shown in table 7.7. Since we have only thirteen observations for these regres- sions, we concentrate on “own effects” in estimating the model, along with possible effects of technical change as represented by simple trends.
For young workers, the estimates imply that reduced relative supply-the baby bust-raised wages. Figure 7.20 plots actual and predicted values of the log relative wage for young workers, generated from model (1) in the table. The model fits the general shape of the series, although it underestimates the very sharp increase in wages at the end of the period. The results are similar for older workers. As also indicated in figure 7.20, the simplest model fits the general shape of the series, although we underestimate the very sharp (and perhaps suspicious) decline in relative wages of older workers in 1989.
7.4.5 Interpretation
While changes in productivity and overall labor demand have had an undeni- able effect on wages in Korea, we are struck by the absence of demand shifts in affecting relative wages. Wages converged over various observable dimen-
24. The lack of data for years before 1977 is unfortunate because the later years do not have a significant turning point in cohort size; the share of young workers basically falls after 1978.

Relatlve Employment Share and Net Relative supply Of Workers AWd 20-29: 1977-88
.404007 1.60063
.. u * ‘0
D 0
0
D 0 d
)I II ZB -
.3 1.35 89
Fig. 7.19 Employment shares and net relative supplies of men aged 2&29 and 50+, 197-89

261 Labor Markets and Economic Growth: Korea's Industrialization
Table 7.7 Net Relative Supply and Relative Wages for Age Groups, 1977-89
Relative Wages
Young," Old? 20-29 Years Old 50+ Years Old
(1) (2) (1 ) (2)
Own relative quantity -.377 -.239 - .225 -.271 (.OW (.148) (.046) (.202)
Trend .033 ,002 (.@33) (.007)
Intercept .I49 - ,307 ,122 ,001 (.101) (.452) (.012) (S23)
R2 ,745 ,770 ,683 .685 w 13 13 13 13
Source; Authors' calculations from Reports on Occupational Wuge Survey (Seoul: Ministry of Labor, 1977-89). Note: Standard errors are in parentheses. "Dependent variable = log monthly earnings relative to thirty to thirty-nine years old. bDependent variable = log monthly earnings relative to forty to forty-nine years old.
sions of skill-schooling and age-but relative demand shifts played a trivial role. Instead, it appears that changes in relative supplies of different skill groups reduced wage inequality in Korea.
This gives an interesting interpretation to the relative roles of industrial pol- icy and education in affecting wages. We have shown that most of the advances in average education were accomplished at lower schooling levels. Successive cohorts contained ever larger proportions of high school graduates, which raised the average level of education in the workforce and reduced educational inequality. This alone might have reduced overall wage inequality because there are more high school graduates and fewer elementary school ones. Yet we found no evidence for this effect. Instead, the data show that substitution effects raised the relative wages of shrinking groups. In true Ricardian fashion, the least skilled benefited from the educational investments of others because their own skills became more scarce. How much of the overall narrowing of the wage distribution is caused by improvements in overall human capital and consequent substitution effects? We are unable to say, but these results suggest that the effects may be quite large.
In contrast, we noted that shifts in the industrial composition of labor de- mand had trivial effects on relative wages. That surprised us. At the outset, we expected that Korea's large and evidently purposeful shift toward manufactur- ing and exports would raise the relative demand for less skilled workers and so help explain the narrowing wage inequality that accompanied development. What we found is that industrial policies, which may have nurtured particular

.334965 -
.458951 -
0 ,117656 -
0 -.025593 - , 0

263 Labor Markets and Economic Growth: Korea’s Industrialization
industries, did not appear to benefit any particular group of workers relative to others.
7.5 Conclusions
We have analyzed labor market performance in Korea during a period of extraordinary growth and structural change. Driven mainly by rapid productiv- ity growth in tradable goods, the demand for industrial labor increased dramat- ically between 1970 and 1990. Real wages tripled, as did productivity and the share of exports in GNP. To supply this expansion, workers left the farm in droves. The share of agriculture in total Korean employment fell by 30 percent- age points in fewer than twenty years. Yet we find no evidence that agricultural workers migrated to manufacturing. Instead, the growth of manufacturing em- ployment was accomplished solely by hiring new entrants to the labor force, who tend to stay in that sector over their careers.
Despite this apparent stability of manufacturing employment, it does not appear that employment relations in Korea are evolving toward the form taken by those in Japan. Turnover is high and job durations short, especially in the manufacturing sector. The implied mobility of the labor force may be a boon to development and structural change, especially on the scale that these have occurred in Korea.
We found no evidence for a “Kuznets curve” in Korea. Wage inequality fell during the period under study. Indeed, our estimates indicate that wages are now more equally distributed in Korea than in the United States. Given the large shifts that occurred in the sectoral composition of employment, it is tempting to conclude that this convergence was related to government policies that fostered the growth of certain industries, perhaps raising the relative de- mand for less skilled workers. But we can find no support for this idea; differ- ences in industrial growth rates had negligible effects on the relative demands for skill groups. Changes in relative supply did matter. The rapid growth of education has caused a convergence of schooling levels, which reduced in- equality. The labor force share of unskilled workers fell, which raised their relative price.
None of this is to say that government policies did not matter to labor market outcomes. At certain times, especially in the early 1970s, it appears that the government successfully capped wage growth as a means of maintaining com- parative advantage in international markets. Union participation in wage deter- mination has been severely limited at various times. And, overall, industrial policies ranging from subsidies to protection seem to have benefited certain industries. But we find that these policies had little effect on relative wages, measured either across industries or across identifiable skdl categories of the workforce. Growth of demand in certain industries raised aggregate wages, while relative wages changed because of shifting relative supplies.

264 Dae-II Kim and Robert H. Topel
References
Akerlof, George A., and Brian G. M. Main. 1980. Unemployment spells and unemploy- ment experience. American Economic Review 70 (December): 885-93.
Brown, Charles, and James Medoff. 1989. The employer size-wage effect. Journal of Political Economy 97 (October): 1027-59.
Collins, S. M., and W. Park. 1989. External debt and macro-economic performance in South Korea. In Developing country debt and economic peformance, vol. 3, ed. Jeffrey D. Sachs and Susan M. Collins. Chicago: University of Chicago Press.
Dickens, William T., and Lawrence F. Katz. 1987. Inter-industry wage differences and industry characteristics. In Unemployment and the structure of labor markets, ed. Kevin Lang and Jonathan S. Leonard. New York: Blackwell.
Economic Planning Board. 1970-89. Annual reports on the economically active popu- lation. Seoul.
. 1971-89. Korean statistical yearbook. Seoul.
. 1980-89. Monthly statistics of Korea. Seoul. Goldin, Claudia, and Robert A. Margo. 1992. The great compression: The wage struc-
ture in the United States at mid-century. Quarterly Journal of Economics 107 (Febru-
Hashimoto, Masanori, and John Raisian. 1985. Employment tenure and earnings pro- files in Japan and the United States. American Economic Review 75 (September):
Katz, Lawrence F., and Kevin M. Murphy. 1992. Changes in relative wages, 1963-87: Supply and demand factors. Quarterly Journal of Economics 107 (February): 3.5. .78.
Kim, K. 1990. Import liberalization and its impact in Korea. In Korean economic devel- opment, ed. Jene K. Kwon. Westport, Conn.: Greenwood.
Kuznets, Simon. 1955. Economic growth and income inequality. American Economic Review 45, no. 1 (March): 1-28.
Little, I. M. D. 1982. Economic development. New York: Basic. Ministry of Labor. 1971-89. Reports on Occupational Wage Survey. Seoul. Murphy, Kevin M., and Robert H. Topel. 1987a. The evolution of unemployment in the
United States: 1968-1985. NBER Macroeconomics Annual, 11-58. . 1987b. Unemployment, risk, and earnings: Testing for equalizing differences
in the labor market. In Unemployment and the structure of labor markets, ed. K. Lang and J. Leonard. London: Blackwell.
Rhee, C., and S. Kwark. 1991. Educational wage differentials in Korea. University of Rochester. Typescript.
Song, H. 1990a. Government and labor policy in authoritarian Korea, 1970-1987. In Labor and inequality (in Korean), ed. Ho-Geun Song. Nanam.
ary): 1-34.
721-35.
. 1990b. Labor policy and market in Korea. Seoul. Nanam. Tcha, M. 1992. Altruism and migration in developing countries. University of Chi-
cago. Typescript. Todaro, M. P. 1969. A model of labor migration and urban unemployment in less-
developed countries. American Economic Review 59, no. 1 (March): 138-48. Topel, Robert H. 1994. Wage inequality and regional labor market performance in the
United States. In Labor market and economic performance: Europe, Japan, and the USA, ed. Toshiaki Tachibanaki. New York: St. Martin’s.
United Nations. 1960-89. Yearbook of national account statistics. New York.
World Bank. 1970-88. World tables. Baltimore: Johns Hopkins University Press. . 1982-89. National account statistics: Analysis of main aggregates. New York.