Embed Size (px)
Citation preview

Labor Market and UnemploymentIng. Mansoor Maitah Ph.D.
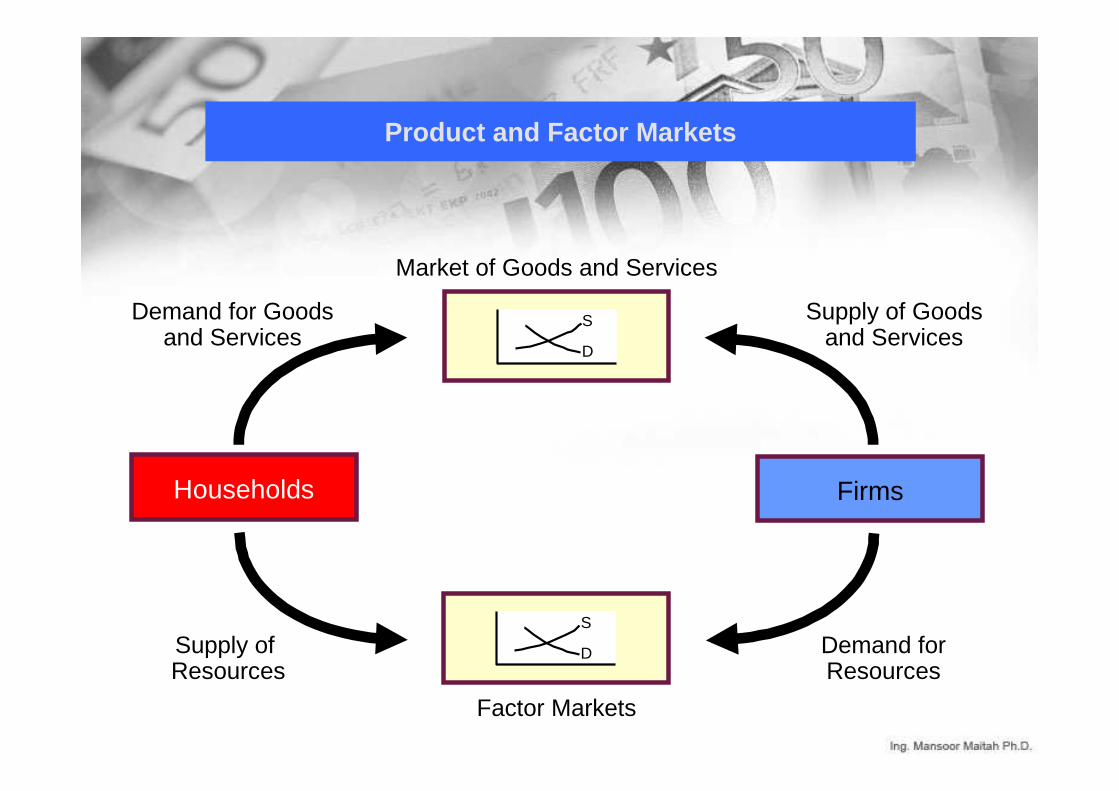
Product and Factor Markets
Households Firms
S
D
Demand for Goodsand Services
Supply of Goodsand Services
Demand forResources
Supply of Resources
Factor Markets
Market of Goods and Services
S
D
Examining Unemployment
• The unemployed are those individuals who do not currently have a job but who are actively looking for work.
•• The The employedemployed are individuals who currently have are individuals who currently have jobs.jobs.
•• The employed plus the unemployed comprise the The employed plus the unemployed comprise the labor forcelabor force ..
The Types of Unemployment
• Cyclical unemployment is the unemployment that accompanies fluctuations in real GDP.- Reflects business cycle conditions- When there is a general downturn in business activity, cyclical
unemployment increases.
• Frictional unemployment is the unemployment that occurs naturally during the normal workings of an economy. It occurs because it simply takes time for people to find the right jobs and for employers to find the right people to hire.
- Caused by imperfect information.- Occurs because:
• employers are not aware of all available workers and their qualifications, and,
• available workers are not fully aware of all the jobs being offered by employers.
The Types of Unemploymen
Seasonal UnemploymentSeasonal Unemployment ::A product of regular, recurring changes in the hiring needs of certain industries on a monthly or seasonal basis.
Structural unemployment:occurs when the economy evolves. It occurs when different sectors give way to other sectors or certain jobs are eliminated while new types of jobs are created.
Alternative Measures of Unemploymentand Why They’re Important
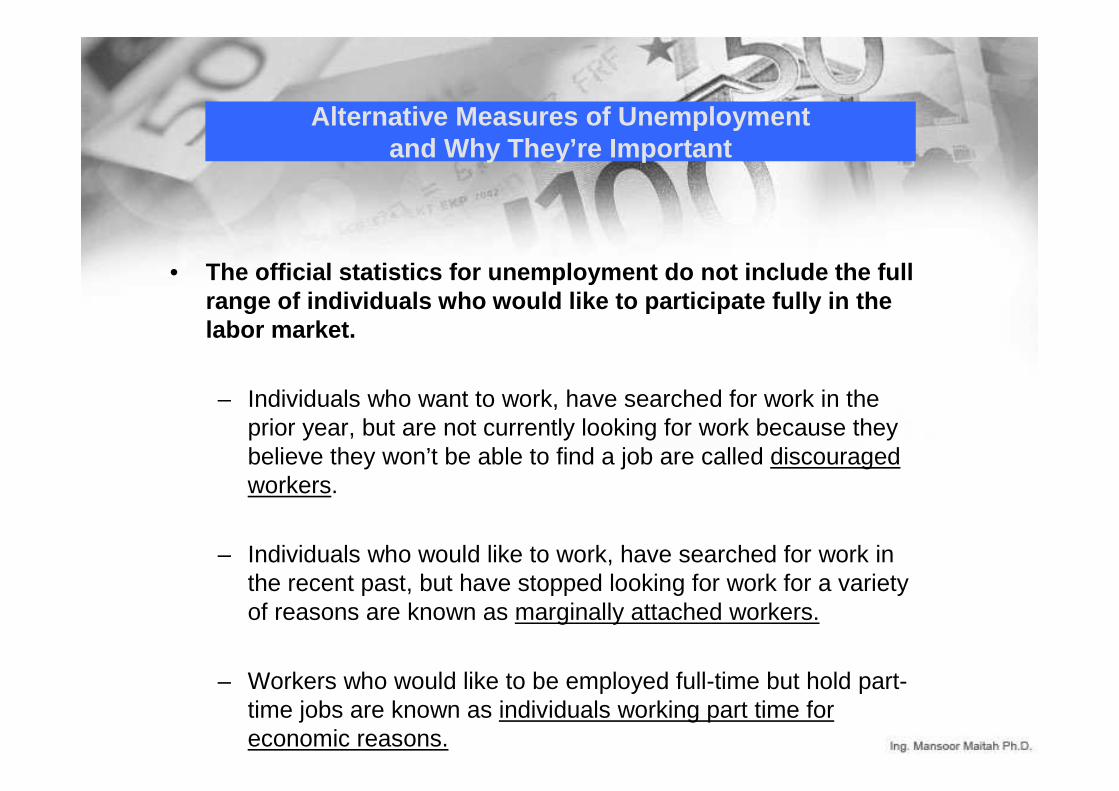
• The official statistics for unemployment do not inc lude the fullrange of individuals who would like to participate fully in the labor market.
– Individuals who want to work, have searched for work in the prior year, but are not currently looking for work because they believe they won’t be able to find a job are called discouraged workers.
– Individuals who would like to work, have searched for work in the recent past, but have stopped looking for work for a varietyof reasons are known as marginally attached workers.
– Workers who would like to be employed full-time but hold part-time jobs are known as individuals working part time for economic reasons.
Alternative Measures of Unemployment
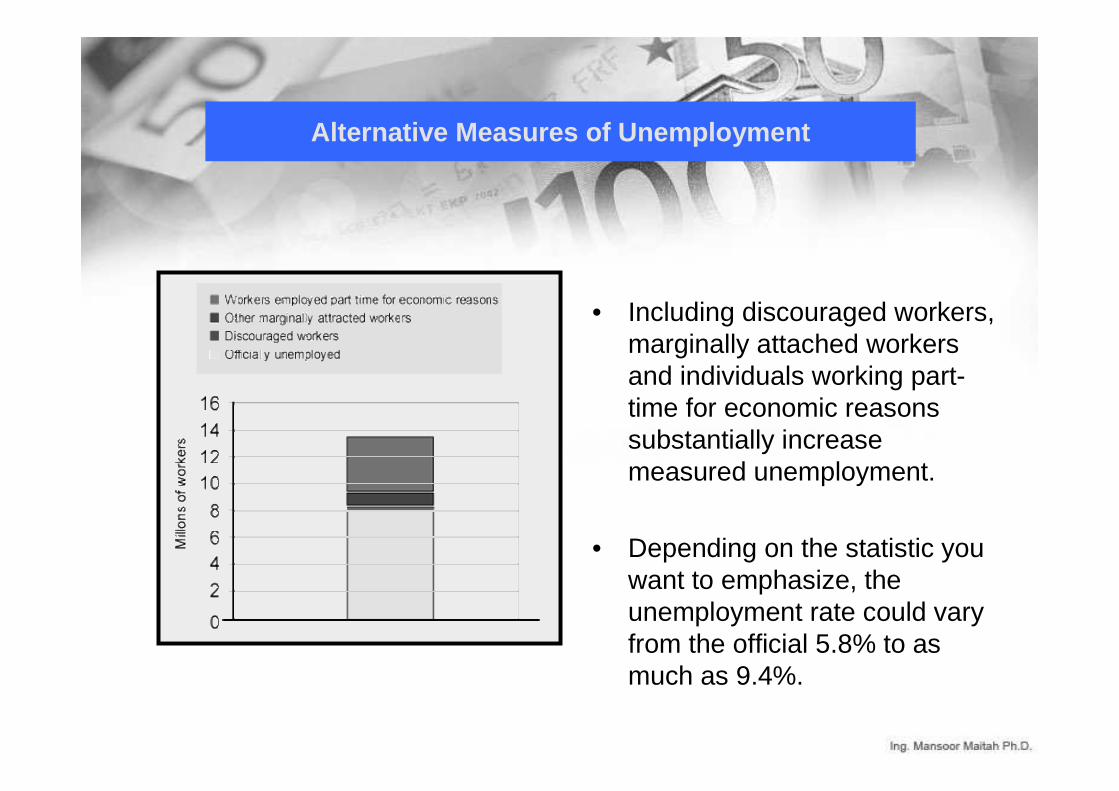
• Including discouraged workers, marginally attached workers and individuals working part-time for economic reasons substantially increase measured unemployment.
• Depending on the statistic you want to emphasize, the unemployment rate could vary from the official 5.8% to as much as 9.4%.
Who Are the Unemployed?
• Different groups of people suffer more unemployment than other groups.
• Unemployment rates vary somewhat as GDP rises and falls.
• Underemployment is the employment of workers in jobs that do not utilize their productive skills.
Czech Population, Employment, and Unemployment
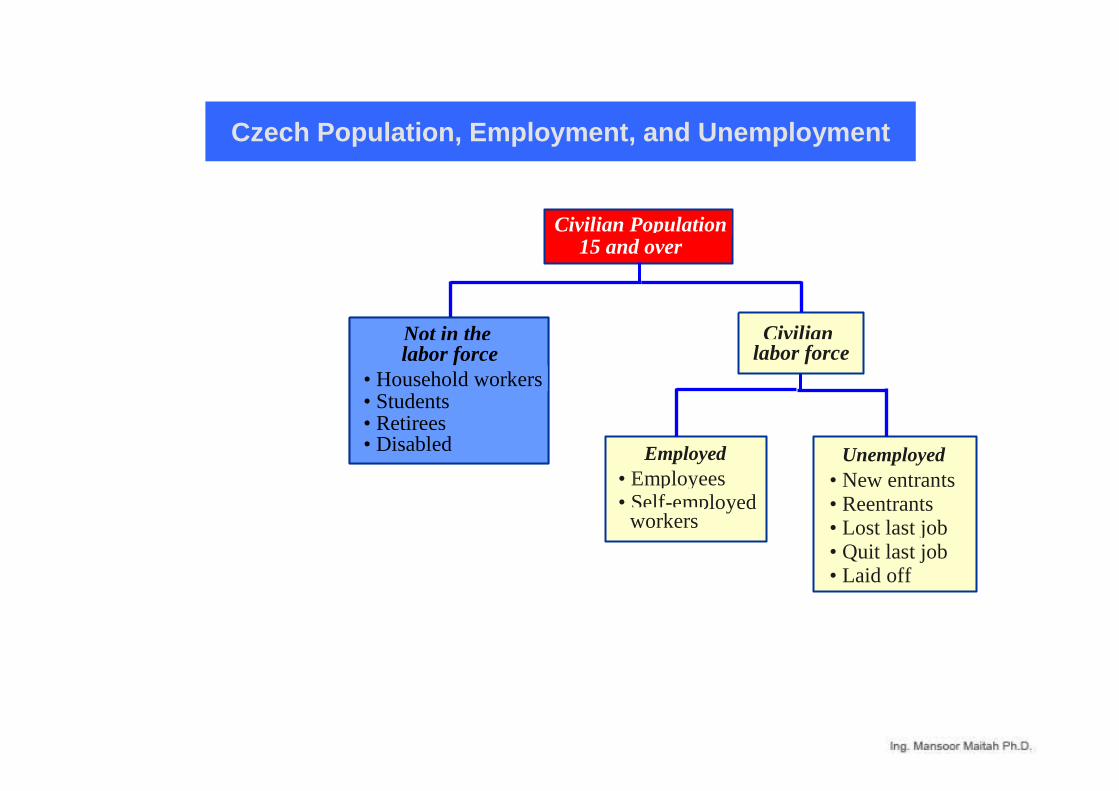
Civilian Population15 and over
Civilianlabor force
Employed• Employees• Self-employed
workers
Unemployed• New entrants • Reentrants • Lost last job • Quit last job • Laid off
Not in the labor force
• Household workers • Students • Retirees • Disabled
Examining Unemployment
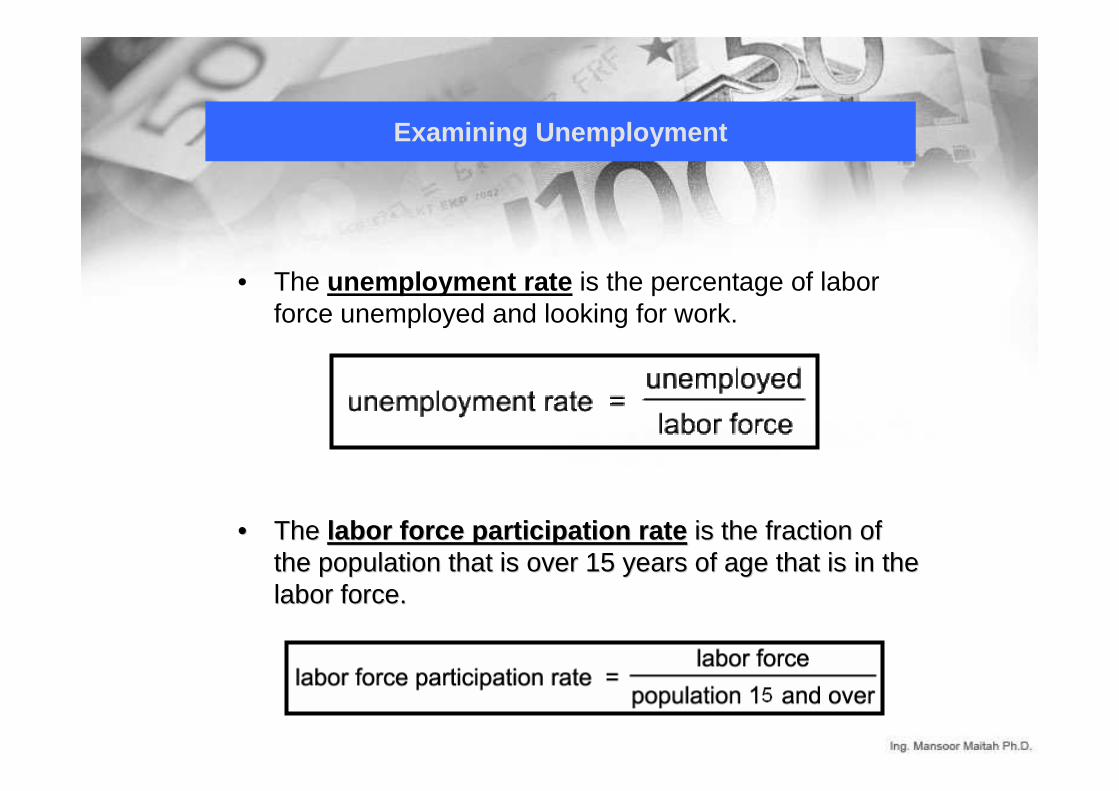
• The unemployment rate is the percentage of labor force unemployed and looking for work.
•• The The labor force participation ratelabor force participation rate is the fraction of is the fraction of the population that is over 1the population that is over 155 years of age that is in the years of age that is in the labor force.labor force.
Natural Rate of Unemployment
• Natural Rate of Unemployment
The level of unemployment that results when the rate of unemployment is normal, considering both frictional and structural factors. Also called the NAIRUNAIRU (Nonaccelerating Inflation Rate of Unemployment)
• Potential Real GDP
The level of output produced when nonlabor resources are fully utilized and unemployment is at its natural rate.
• GDP gap = potential real GDP – actual GDP• In the United States, economists estimate that the natural rate of
unemployment is between 5.0% and 6.5%.
The Labor Market: Basic Concepts
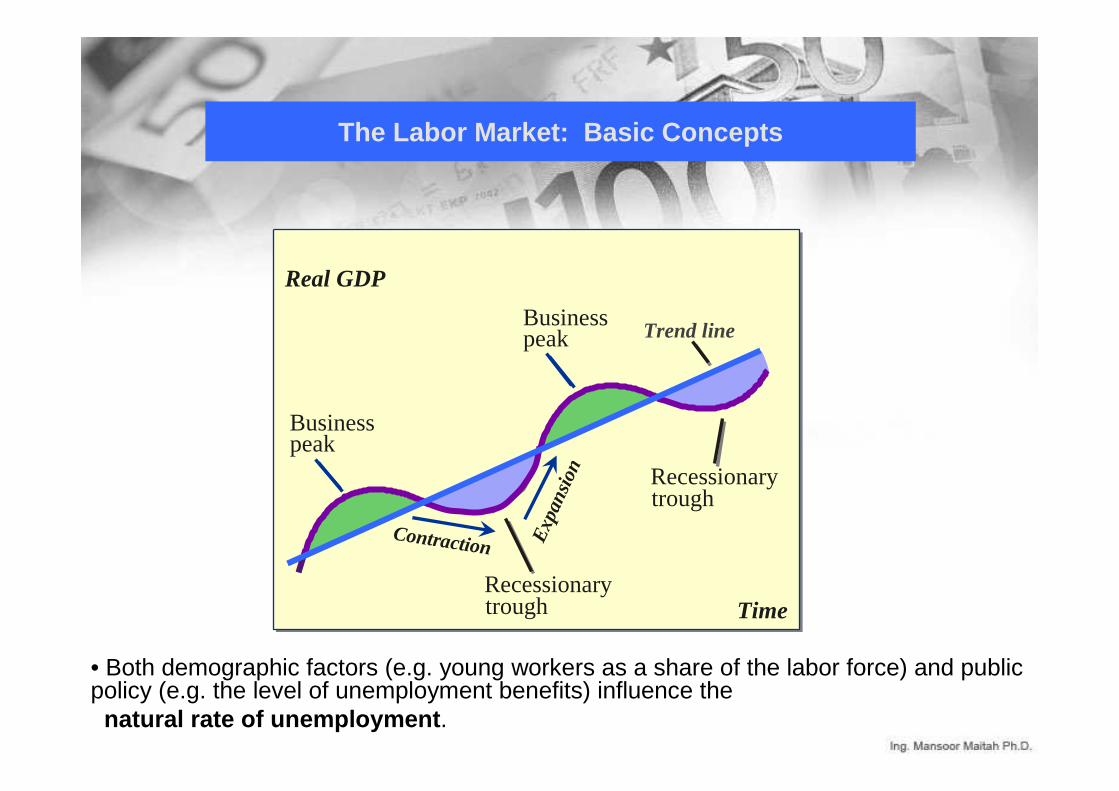
Time
Real GDP
Business peak
Recessionary trough
Contraction Exp
ansi
on
Business peak
Recessionary trough
Trend line
• Both demographic factors (e.g. young workers as a share of the labor force) and public policy (e.g. the level of unemployment benefits) influence the
natural rate of unemployment.
Composition of the Unemployed by Reason
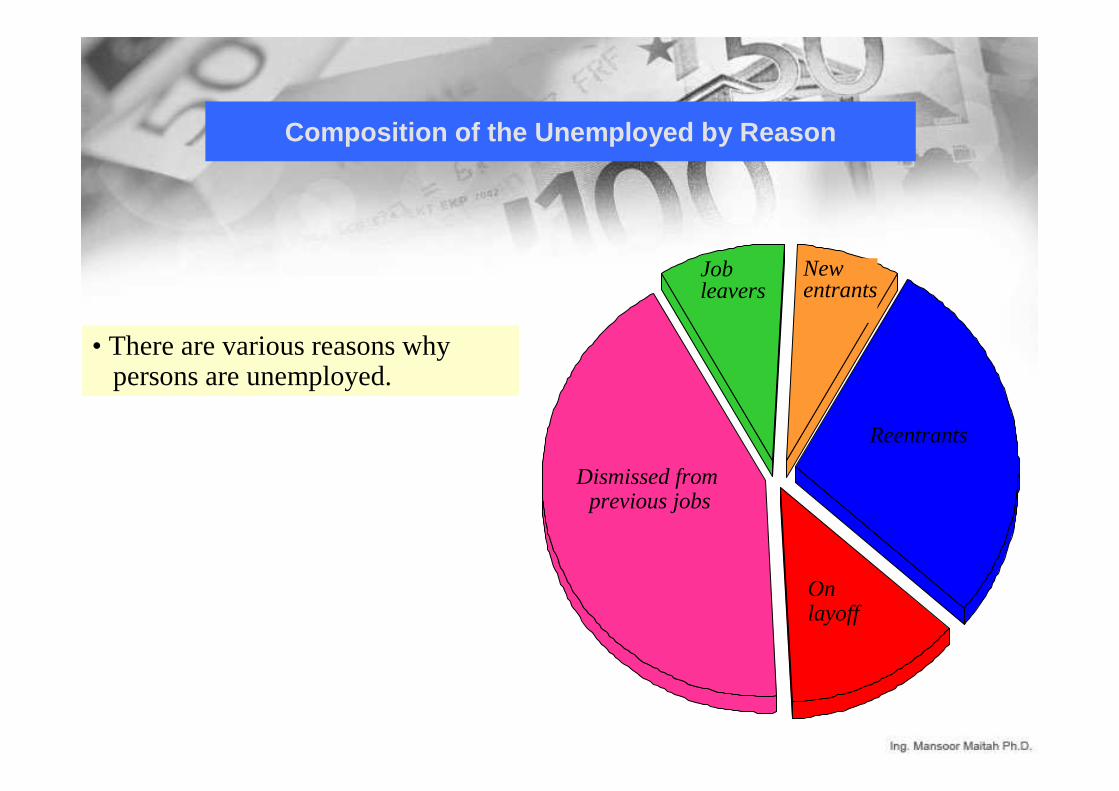
• There are various reasons why persons are unemployed.
Dismissed from previous jobs
Jobleavers
Newentrants
Reentrants
Onlayoff
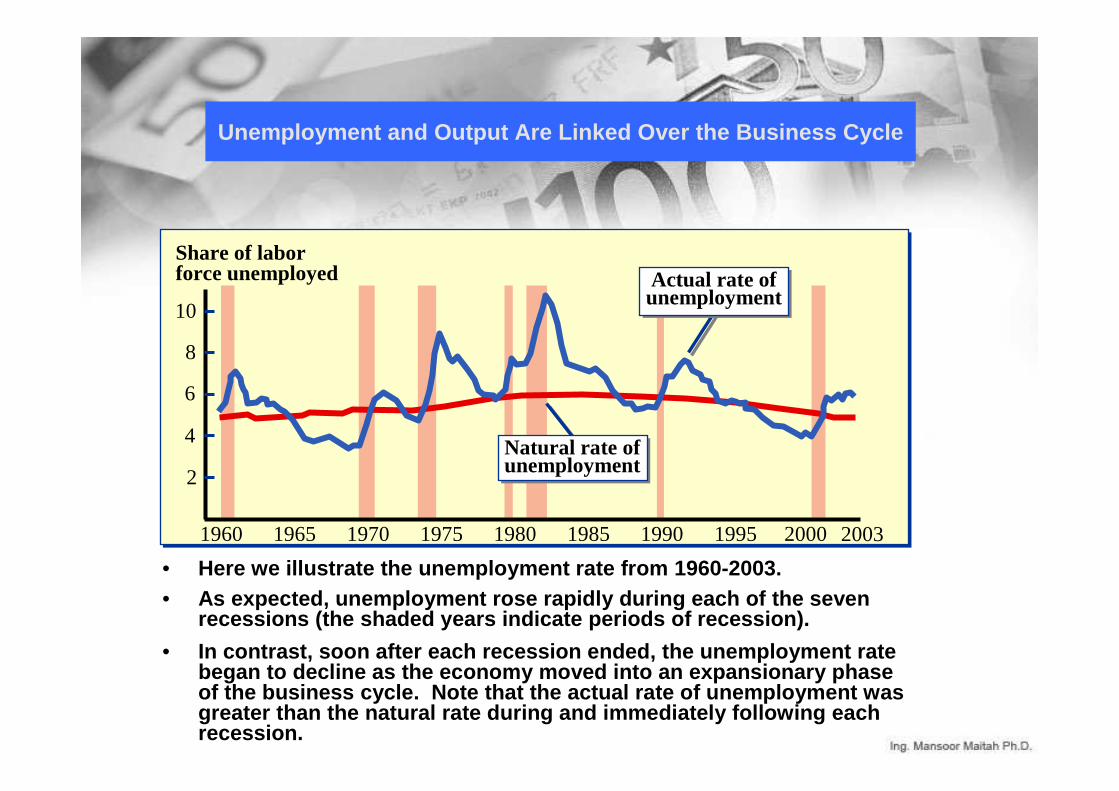
Unemployment and Output Are Linked Over the Business Cycle
Natural rate ofunemployment
Actual rate ofunemployment
Share of labor force unemployed
10
8
6
4
2
1960 1965 1970 1975 1980 1985 1990 1995 20002003
• Here we illustrate the unemployment rate from 1960- 2003.
• In contrast, soon after each recession ended, the u nemployment rate began to decline as the economy moved into an expan sionary phaseof the business cycle. Note that the actual rate o f unemployment was greater than the natural rate during and immediatel y following each recession.
• As expected, unemployment rose rapidly during each of the seven recessions (the shaded years indicate periods of recession).
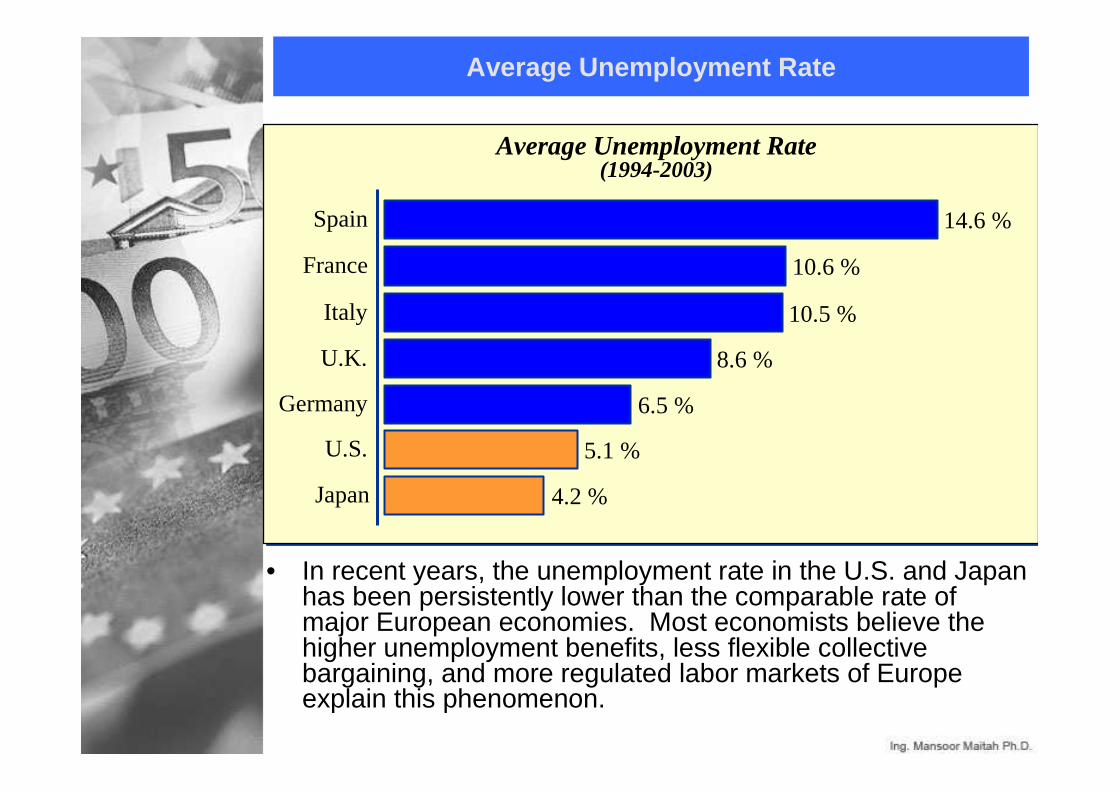
5.1 %
8.6 %
10.6 %
4.2 %
6.5 %
10.5 %
14.6 %Spain
Italy
Germany
Japan
Average Unemployment Rate(1994-2003)
France
U.K.
U.S.
• In recent years, the unemployment rate in the U.S. and Japan has been persistently lower than the comparable rate of major European economies. Most economists believe the higher unemployment benefits, less flexible collective bargaining, and more regulated labor markets of Europe explain this phenomenon.
Average Unemployment Rate
The Labor Market: Basic Concepts
• During periods of poor economic performance, such as economic recessions when real GDP declines, unemployment rises sharply and becomes a cause of public concern.
• During times of good economic performance and rapid economic growth, unemployment is reduced but does not disappear.
The Classical View of the Labor Market
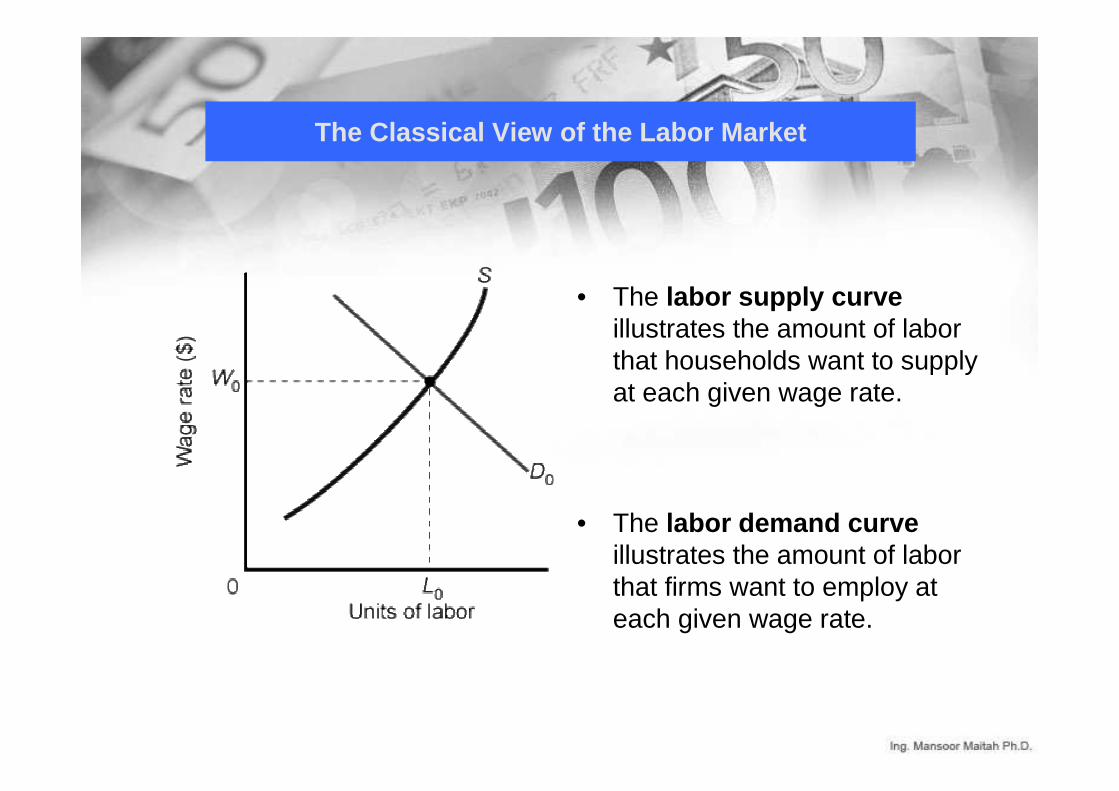
• According to classical economists, the quantity of labor demanded and supplied are brought into equilibrium by rising and falling wage rates. There should be no persistent unemployment above the frictional and structural amount.
The Classical View of the Labor Market
• The labor supply curveillustrates the amount of labor that households want to supply at each given wage rate.
• The labor demand curveillustrates the amount of labor that firms want to employ at each given wage rate.
The Classical View of the Labor Market
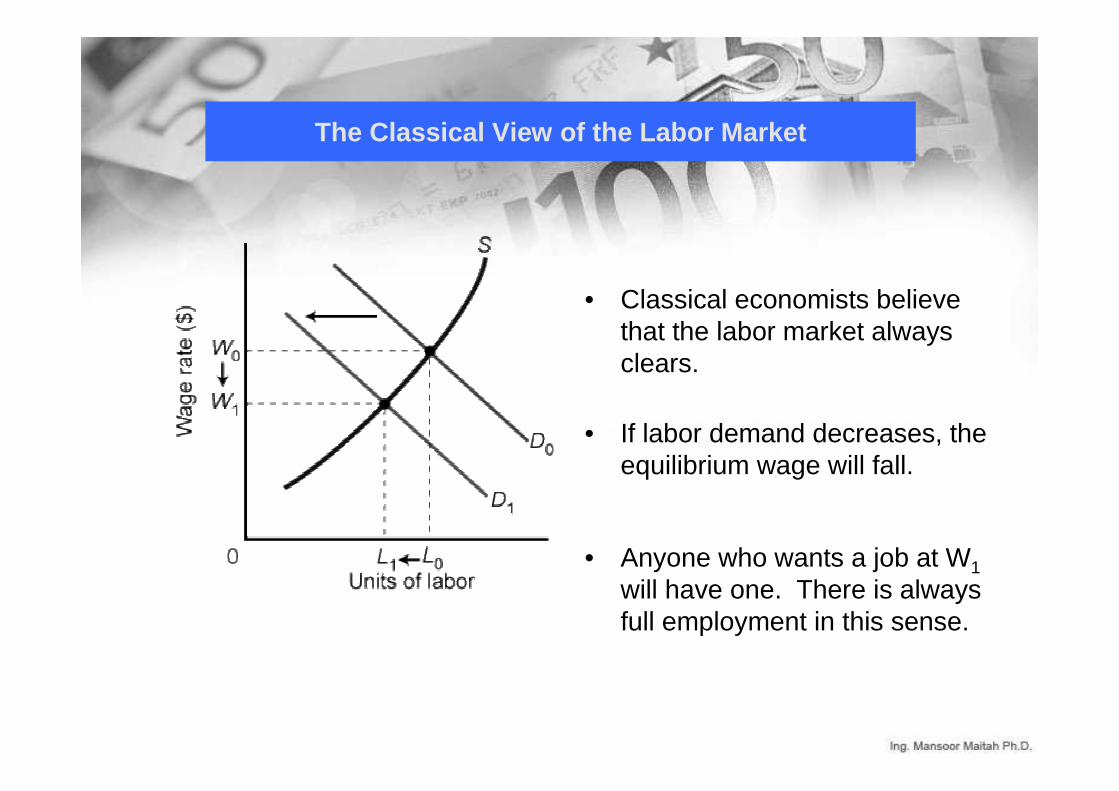
• If labor demand decreases, the equilibrium wage will fall.
• Anyone who wants a job at W1
will have one. There is always full employment in this sense.
• Classical economists believe that the labor market always clears.
The Classical Labor Market and the Aggregate Supply Curve
• The classical idea that wages adjust to clear the labor market is consistent with the view that wages respond quickly to price changes. This means that the AS curve is vertical.
• When the AS curve is vertical, monetary and fiscal policy cannot affect the level of output and employment in the economy.
The Unemployment Rate and the Classical View
• The unemployment rate is not necessarily an accurate indicator of whether the labor market is working properly.
• The unemployment rate may sometimes seem high even though the labor market is working well.
The Unemployment Rate and the Classical View
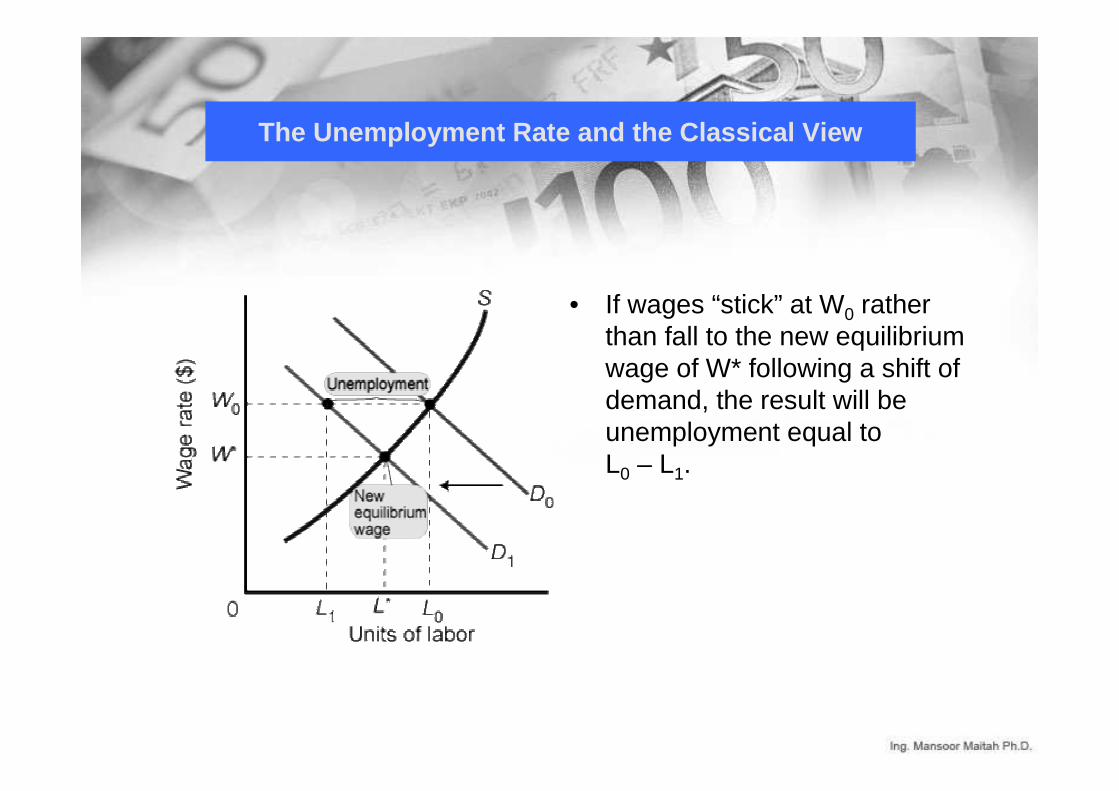
• If wages “stick” at W0 rather than fall to the new equilibrium wage of W* following a shift of demand, the result will be unemployment equal toL0 – L1.
Explaining the Existence of Unemployment
• One explanation for downwardly sticky wages is that firms enter into social, or implicit, contracts,these contracts are unspoken agreements between workers and firms that firms will not cut wages.
• The relative-wage explanation of unemploymentholds that workers are concerned about their wages relative to the wages of other workers in other firms and industries.
Explaining the Existence of Unemployment
• Explicit contracts are employment contracts that stipulate workers’ wages, usually for a period of one to three years. Wages set in this way do not fluctuate with economic conditions.
• Cost of living adjustments (COLAs) are contract provisions that tie wages to changes in the cost of living. The greater the inflation rate, the more wages are raised.
Explaining the Existence of Unemployment
• The efficiency wage theory is an explanation for unemployment that holds that the productivity of workers increases with the wage rate. If this is so, firms may have an incentive to pay wages above the market-clearing rate.
• If firms have imperfect information, they may simply set wages wrong - wages that do not clear the labor market.
• Minimum wage laws set a floor for wage rates, and explain at least a fraction of unemployment.
Competitive Labor Markets and The Equilibrium Wage
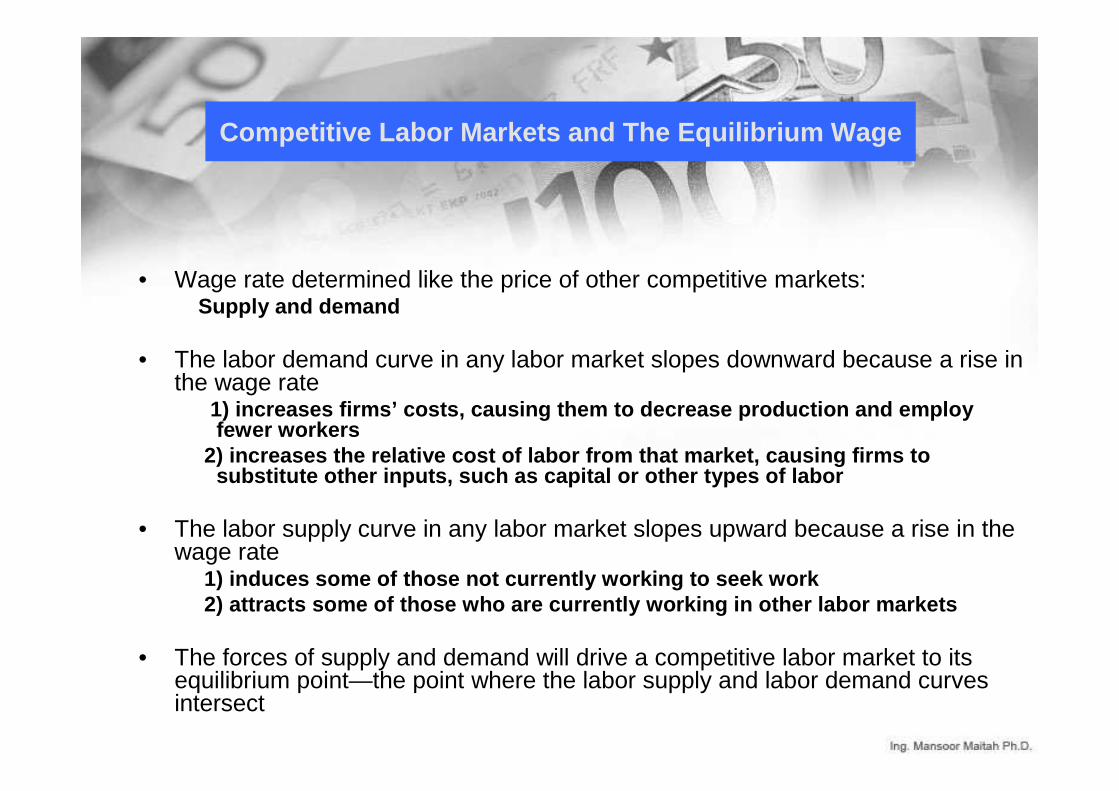
• Wage rate determined like the price of other competitive markets:Supply and demand
• The labor demand curve in any labor market slopes downward because a rise in the wage rate
1) increases firms’ costs, causing them to decrease production and employ fewer workers
2) increases the relative cost of labor from that m arket, causing firms to substitute other inputs, such as capital or other t ypes of labor
• The labor supply curve in any labor market slopes upward because a rise in the wage rate
1) induces some of those not currently working to s eek work2) attracts some of those who are currently working in other labor markets
• The forces of supply and demand will drive a competitive labor market to its equilibrium point—the point where the labor supply and labor demand curves intersect
Why Do Earnings Differ?
• Earnings would be equal if:
– all individuals were identical– all jobs were equally attractive– workers were perfectly mobile among jobs
Wages
Quantity
Wages
Quantity
Du
Ds
Ss
Su
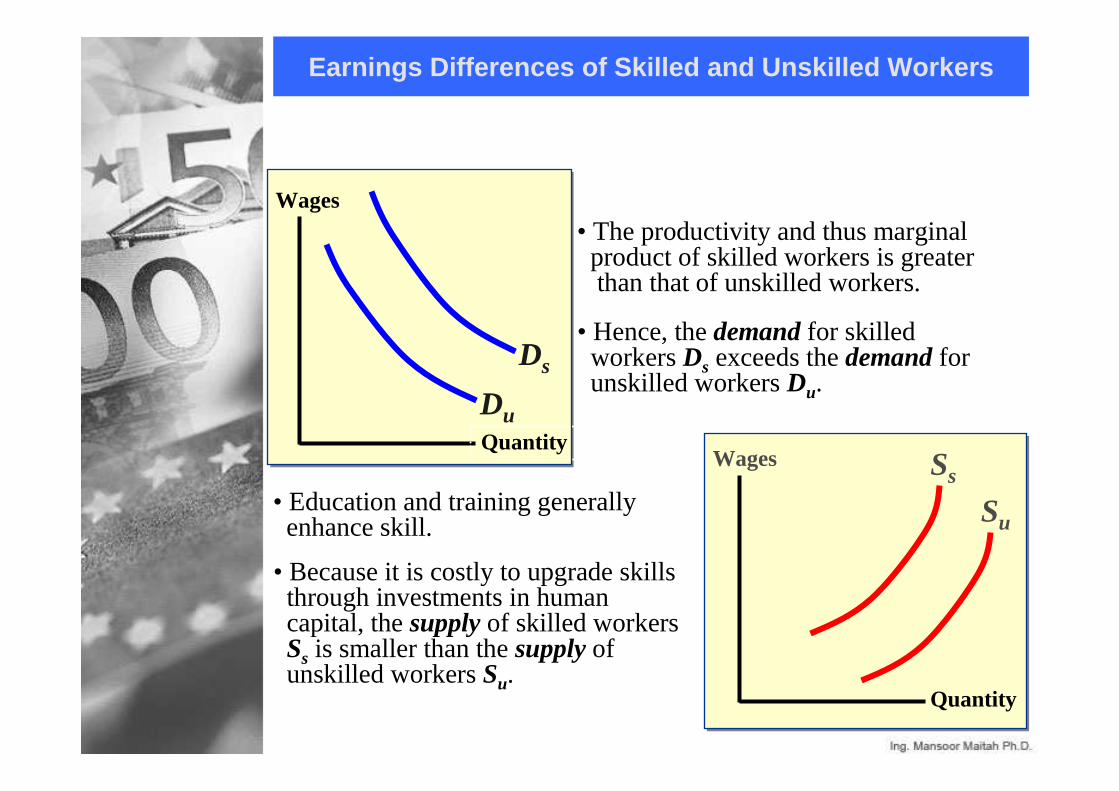
• The productivity and thus marginal product of skilled workers is greaterthan that of unskilled workers.
• Hence, the demand for skilled workers Ds exceeds the demand for unskilled workers Du.
• Education and training generally enhance skill.
• Because it is costly to upgrade skills through investments in human capital, the supply of skilled workers Ss is smaller than the supply of unskilled workers Su.
Earnings Differences of Skilled and Unskilled Workers
Wages
Quantity
Du
Ds
Ss
Su
Ws
Wu
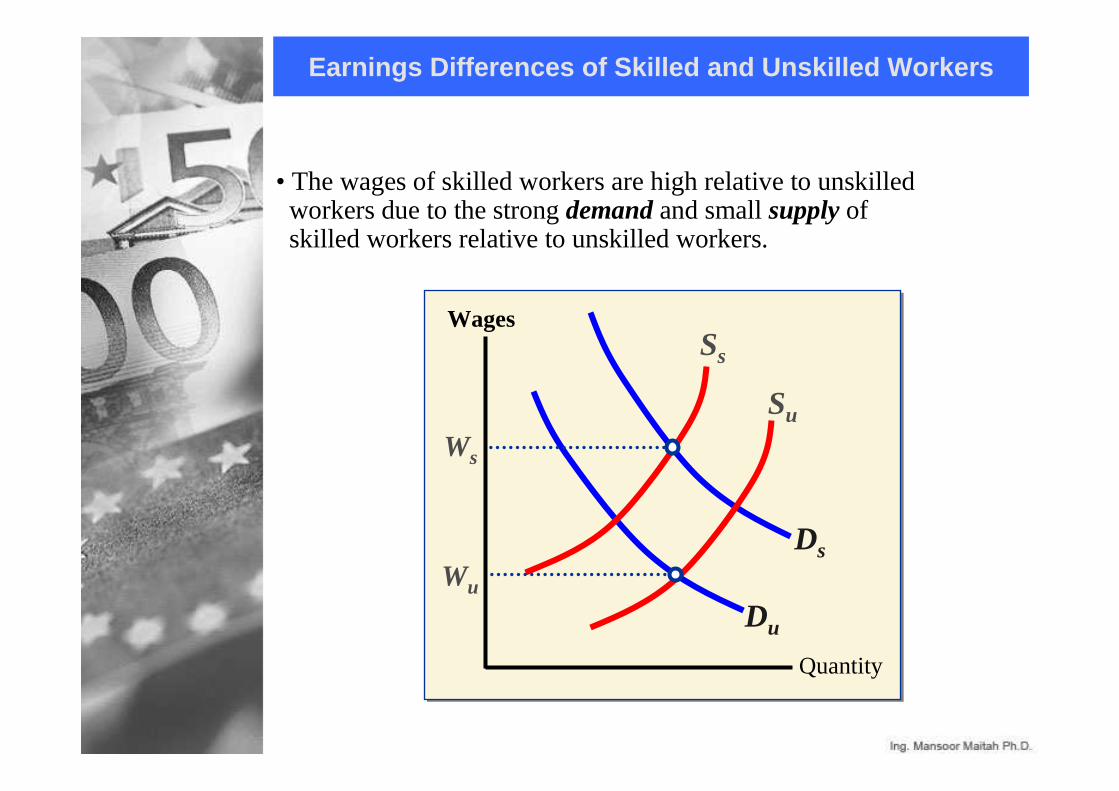
• The wages of skilled workers are high relative to unskilled workers due to the strong demand and small supply of skilled workers relative to unskilled workers.
Earnings Differences of Skilled and Unskilled Workers
Why Do Wages Differ?
• Significant inequality exists in wage rates
– Among different occupations– Among and within occupations in Czech labor market
• Wage inequality is persistent
• Both highest and lowest paid occupations have been so for decades
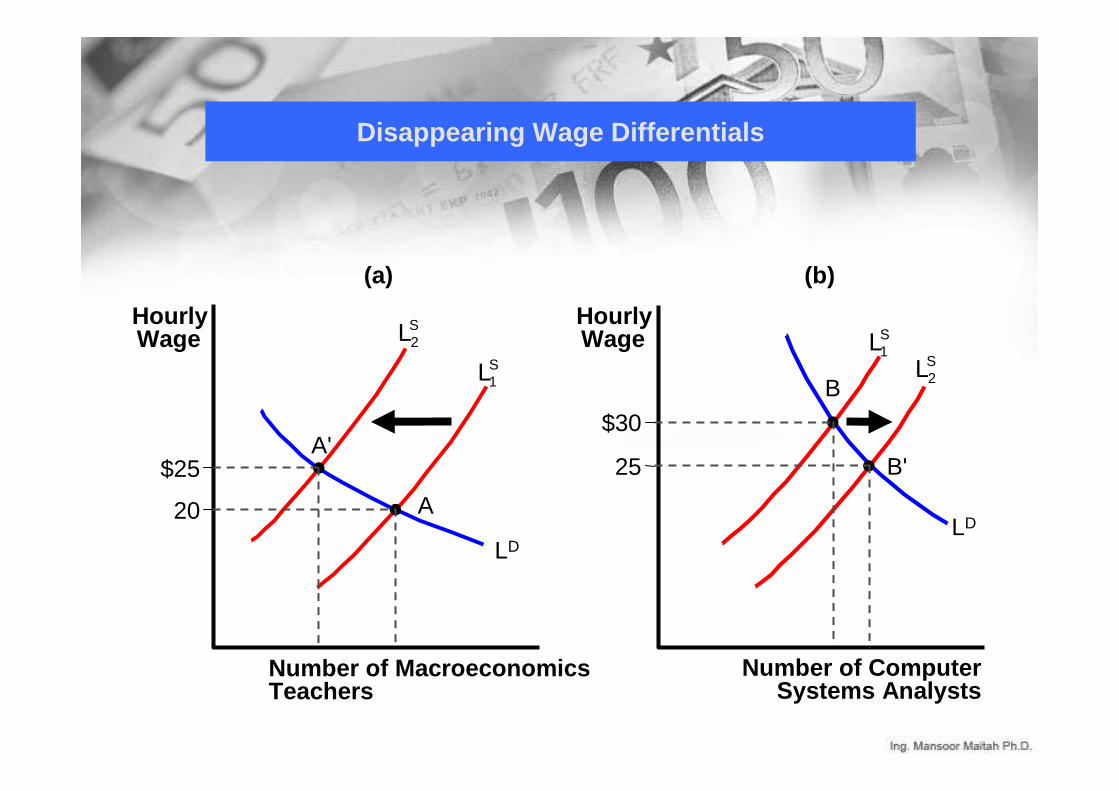
Disappearing Wage Differentials
Number of MacroeconomicsTeachers
HourlyWage
LD
20
A'
A
$25
Number of Computer Systems Analysts
HourlyWage
LD
$30
B'
B
25
(a) (b)
S1L
S2L S
1LS2L
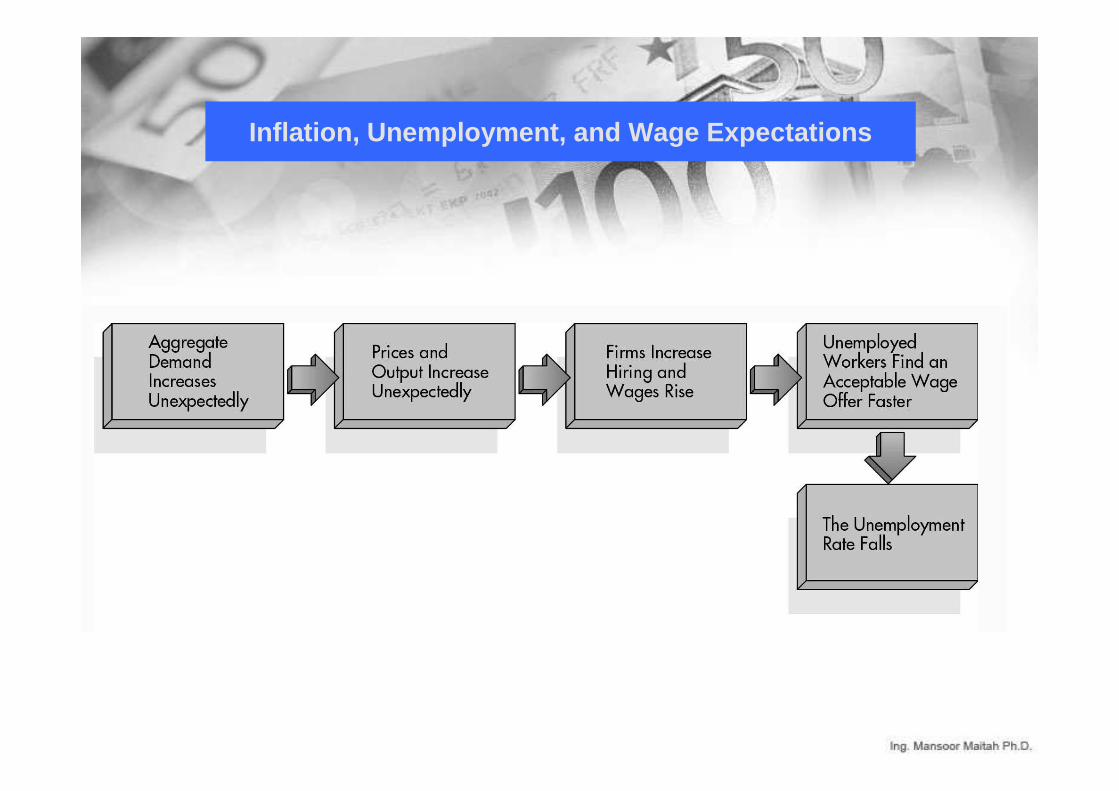
Inflation, Unemployment, and Wage Expectations
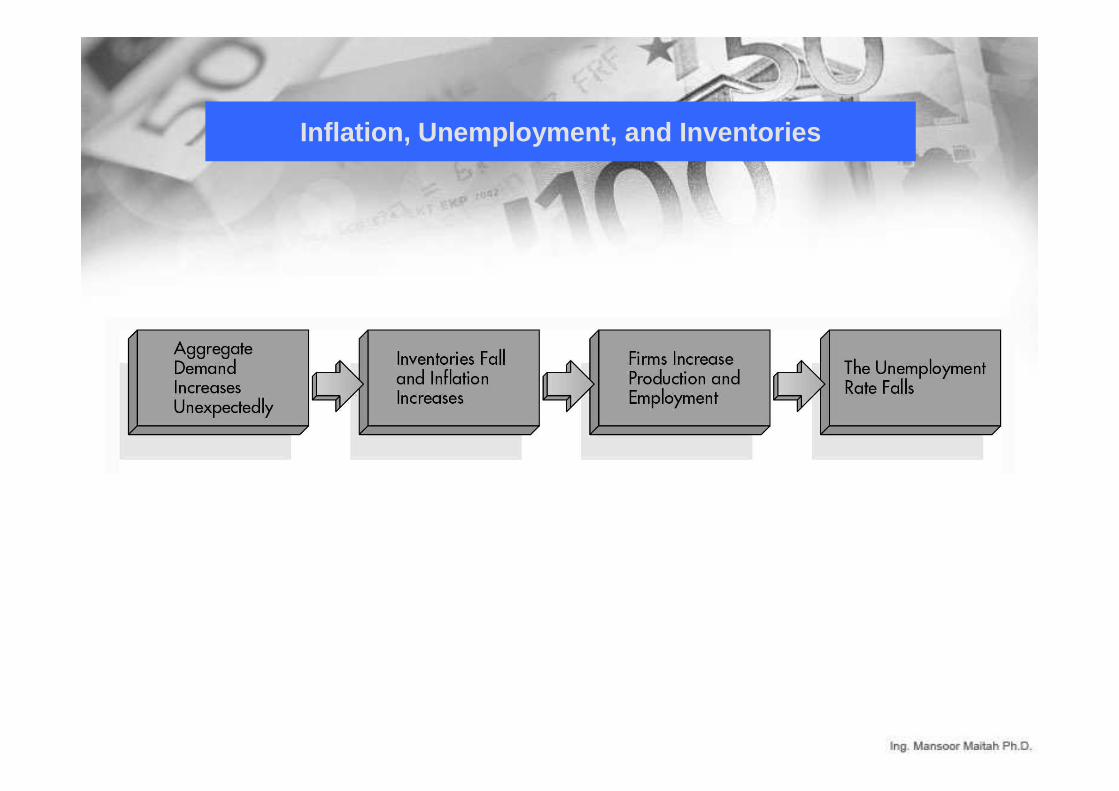
Inflation, Unemployment, and Inventories
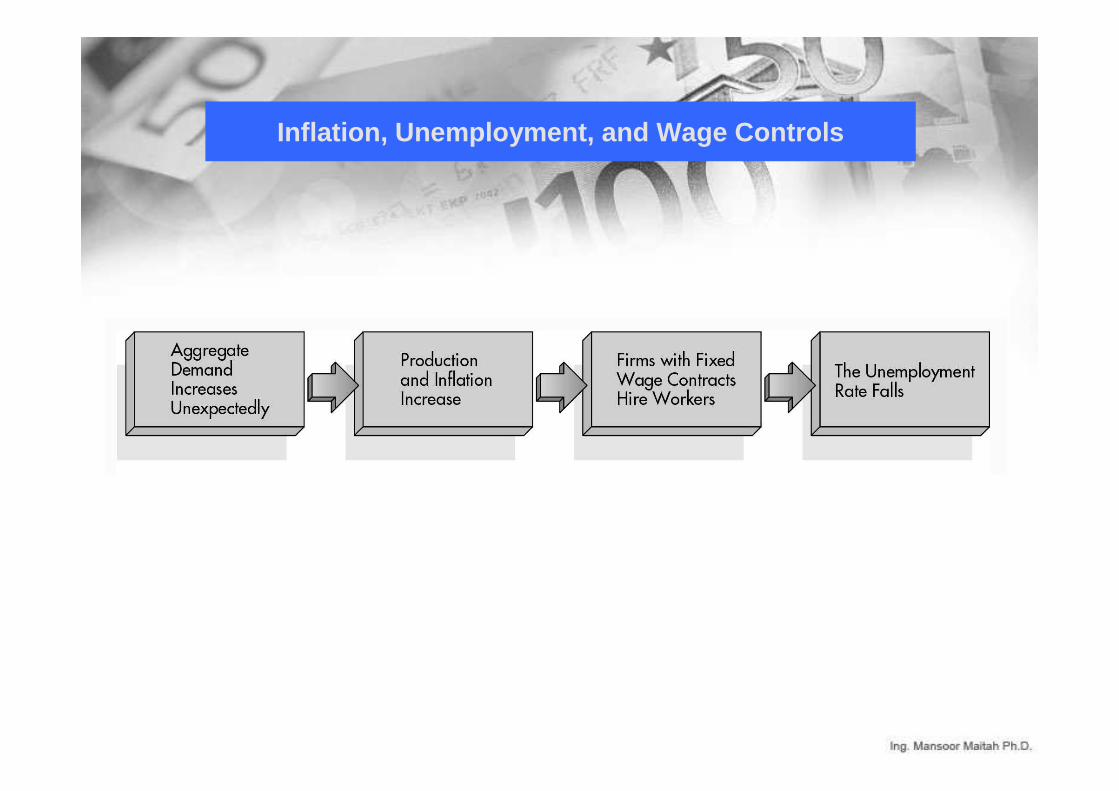
Inflation, Unemployment, and Wage Controls
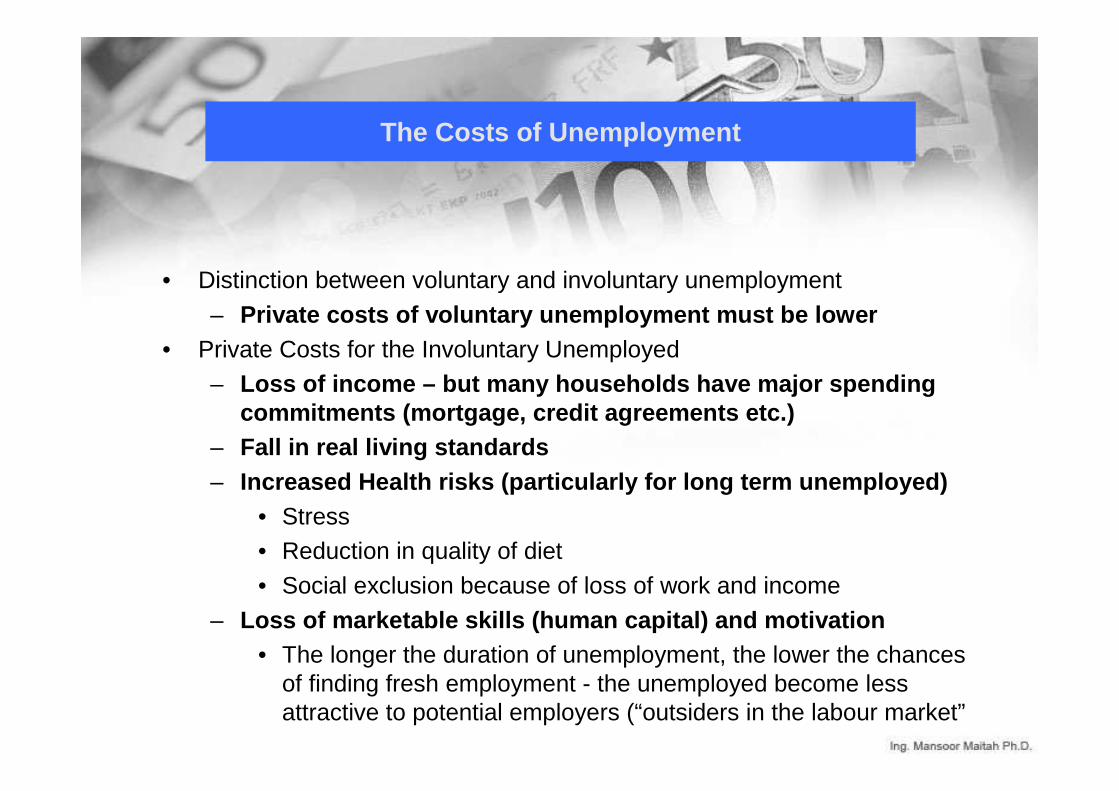
The Costs of Unemployment
• Distinction between voluntary and involuntary unemployment
– Private costs of voluntary unemployment must be low er• Private Costs for the Involuntary Unemployed
– Loss of income – but many households have major spen ding commitments (mortgage, credit agreements etc.)
– Fall in real living standards– Increased Health risks (particularly for long term unemployed)
• Stress• Reduction in quality of diet
• Social exclusion because of loss of work and income
– Loss of marketable skills (human capital) and motiv ation• The longer the duration of unemployment, the lower the chances
of finding fresh employment - the unemployed become less attractive to potential employers (“outsiders in the labour market”
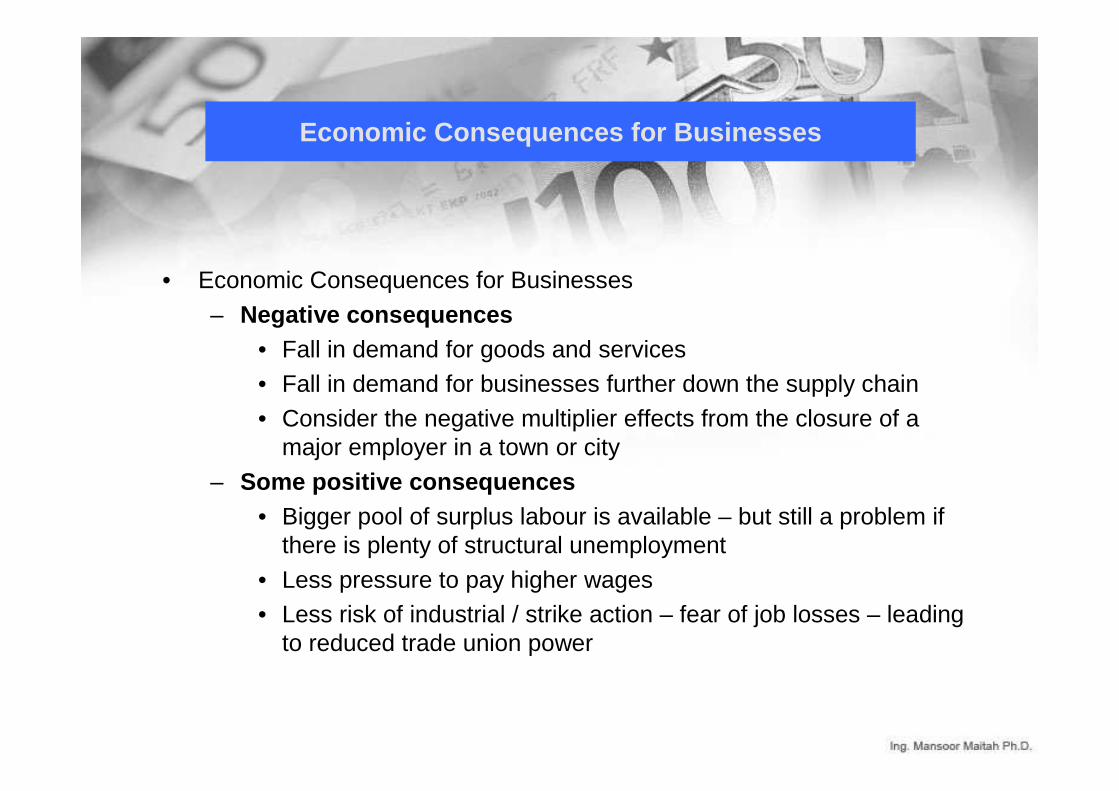
Economic Consequences for Businesses
• Economic Consequences for Businesses
– Negative consequences• Fall in demand for goods and services• Fall in demand for businesses further down the supply chain
• Consider the negative multiplier effects from the closure of a major employer in a town or city
– Some positive consequences• Bigger pool of surplus labour is available – but still a problem if
there is plenty of structural unemployment
• Less pressure to pay higher wages• Less risk of industrial / strike action – fear of job losses – leading
to reduced trade union power
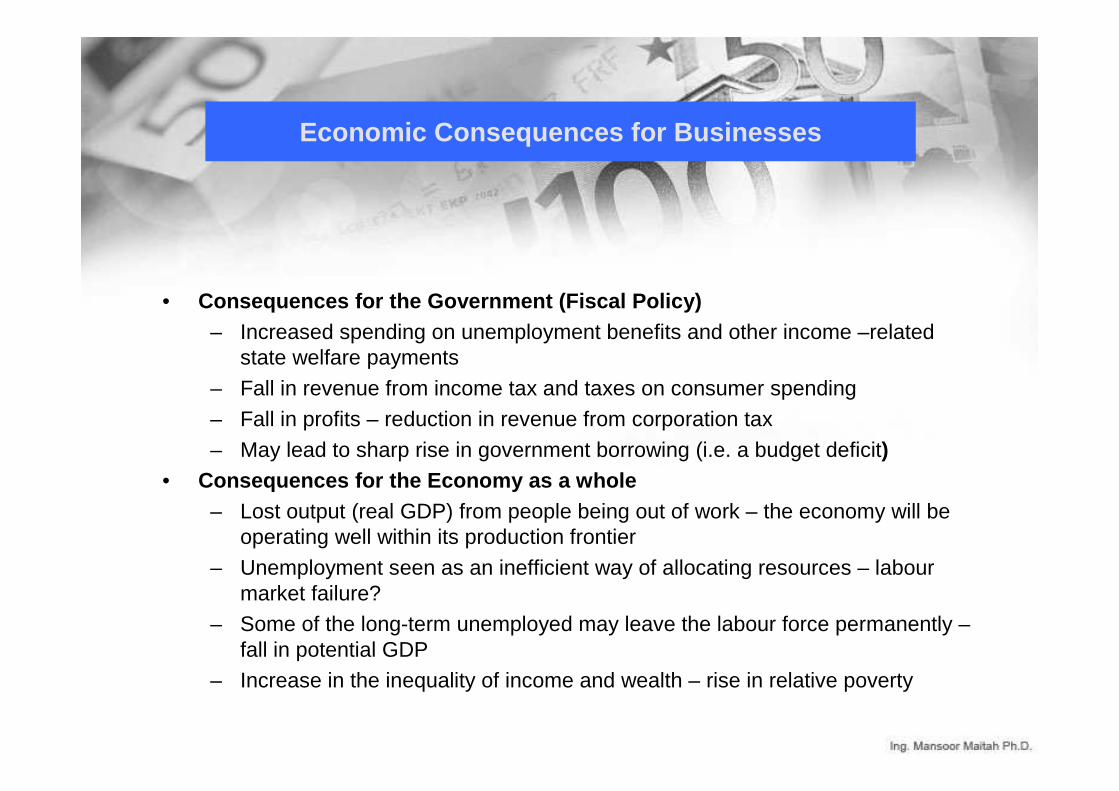
Economic Consequences for Businesses
• Consequences for the Government (Fiscal Policy)– Increased spending on unemployment benefits and other income –related
state welfare payments
– Fall in revenue from income tax and taxes on consumer spending
– Fall in profits – reduction in revenue from corporation tax
– May lead to sharp rise in government borrowing (i.e. a budget deficit)• Consequences for the Economy as a whole
– Lost output (real GDP) from people being out of work – the economy will be operating well within its production frontier
– Unemployment seen as an inefficient way of allocating resources – labour market failure?
– Some of the long-term unemployed may leave the labour force permanently –fall in potential GDP
– Increase in the inequality of income and wealth – rise in relative poverty
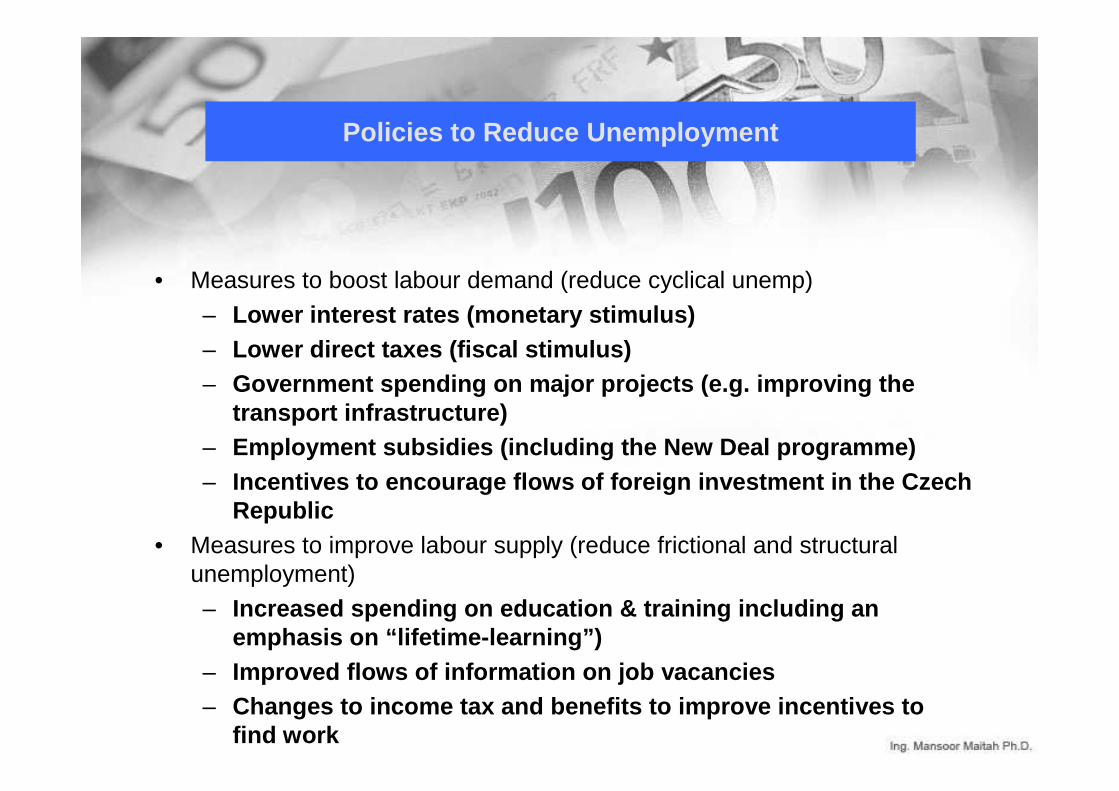
Policies to Reduce Unemployment
• Measures to boost labour demand (reduce cyclical unemp)
– Lower interest rates (monetary stimulus)– Lower direct taxes (fiscal stimulus)– Government spending on major projects (e.g. improvi ng the
transport infrastructure)– Employment subsidies (including the New Deal progra mme)– Incentives to encourage flows of foreign investment in the Czech
Republic• Measures to improve labour supply (reduce frictional and structural
unemployment)
– Increased spending on education & training includin g an emphasis on “lifetime-learning”)
– Improved flows of information on job vacancies– Changes to income tax and benefits to improve incen tives to
find work
Phillips Curve
• ALban William Phillips (1958) published a study of the relationship between the unemployment rate and wage inflation in England.
– The wage inflation rate rose with falling unemployment—there was an inverse relationship between inflation and unemployment.
– In later studies by Paul Samuelson and Robert Solow, consumer price inflation was substituted for wage inflation.
– This inverse relationship became known as the Phillips Curve.
– The downward-sloping curve suggests a policy trade-off between unemployment and inflation.
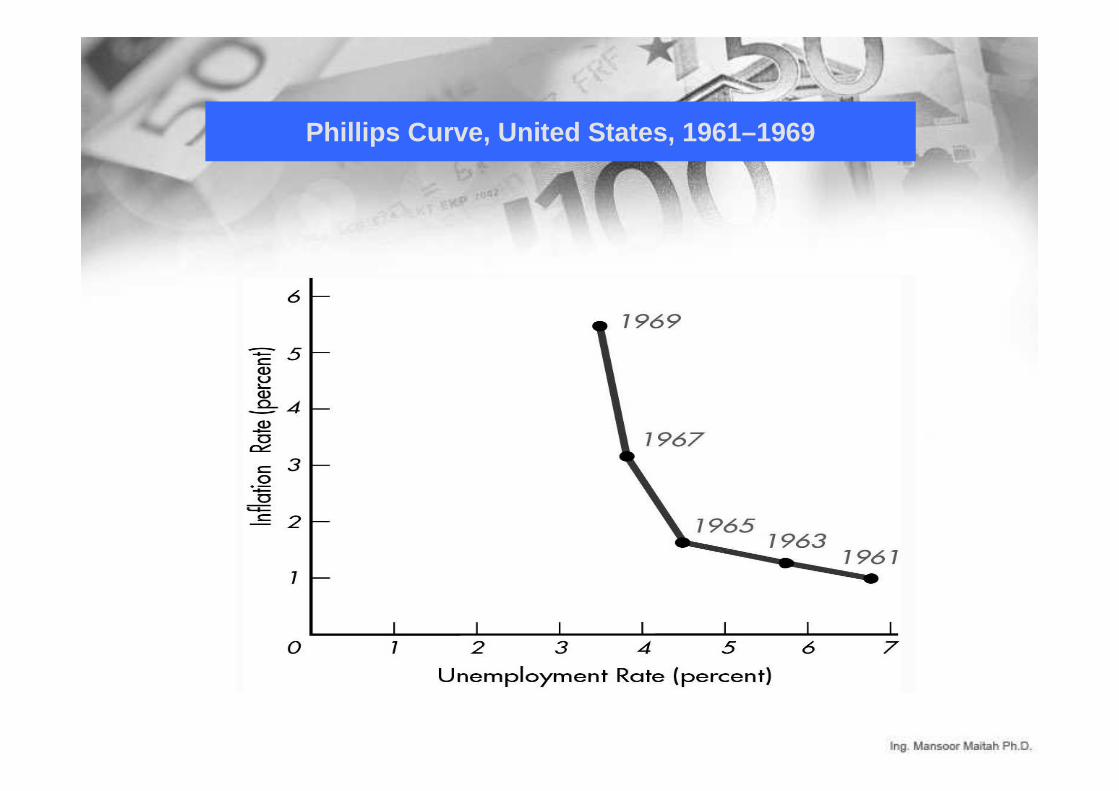
Phillips Curve, United States, 1961–1969
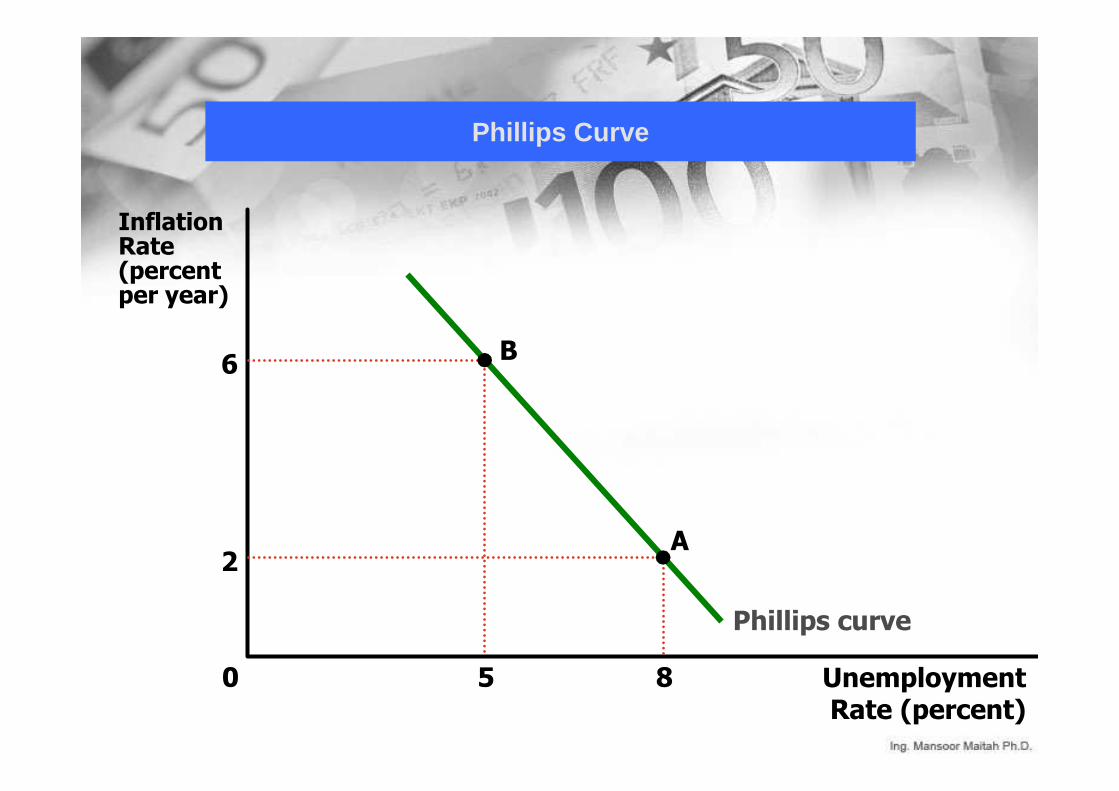
Phillips Curve
Unemployment Rate (percent)
0
Inflation Rate(percent per year)
5
B6
A
8
2
Phillips curve
Phillips Curve
� The Phillips curve shows the short-run combinations of unemployment and inflation that arise as shifts in the aggregatedemand curve move the economy along the short-run aggregate supply curve.
� The greater the aggregate demand for goods and services, the greater is the economy’s output, and the higher is the overall price level.
� A higher level of output results in a lower level of unemployment.
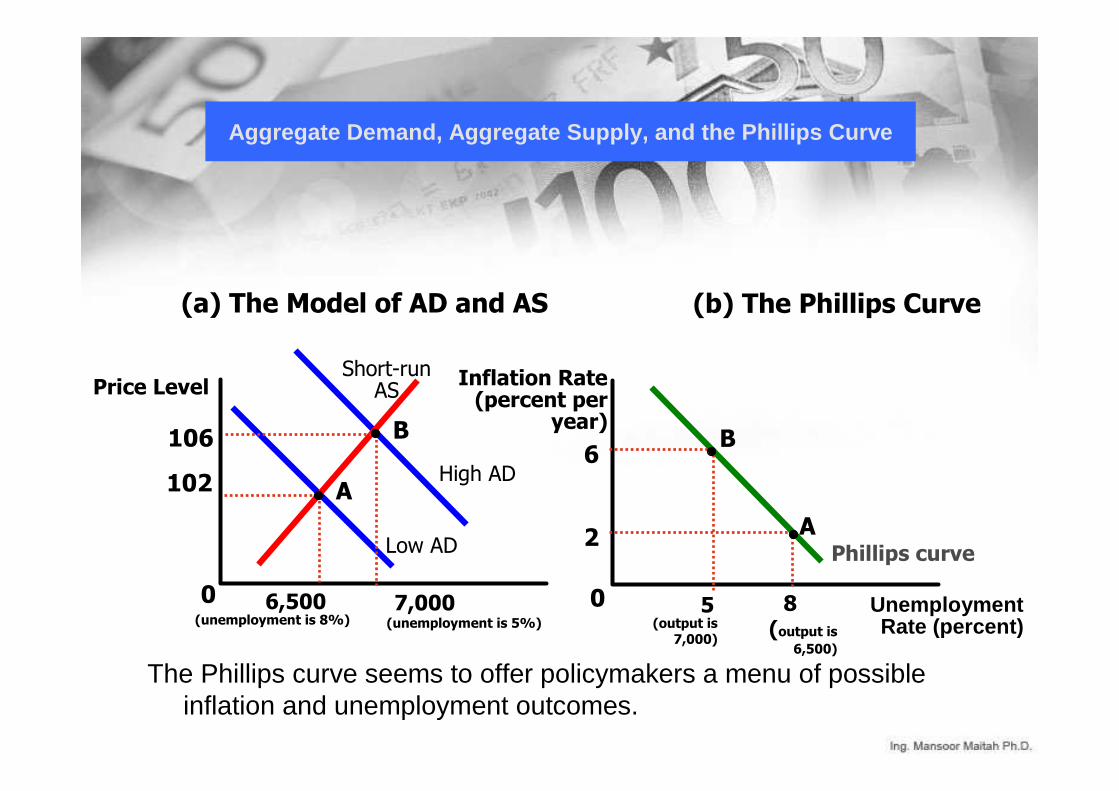
Aggregate Demand, Aggregate Supply, and the Phillip s Curve
Phillips curve
0
(b) The Phillips Curve
Inflation Rate (percent per
year)
Unemployment Rate (percent)
0
(a) The Model of AD and AS
Price Level
Low AD
High AD
B
5
6
(output is 7,000)
A
8
2
(output is 6,500)
A
6,500
102
(unemployment is 8%)
B
7,000
106
(unemployment is 5%)
Short-run AS
The Phillips curve seems to offer policymakers a menu of possible inflation and unemployment outcomes.
The Long - Run Phillips Curve
� In the 1960s, Friedman concluded that inflation and unemployment are unrelated in the long run.
�As a result, the long-run Phillips curve is vertical at the natural rate of unemployment.
�Monetary policy could be effective in the short run but not in the long run.
The Long - Run Phillips Curve
Expectations and the Phillips Curve
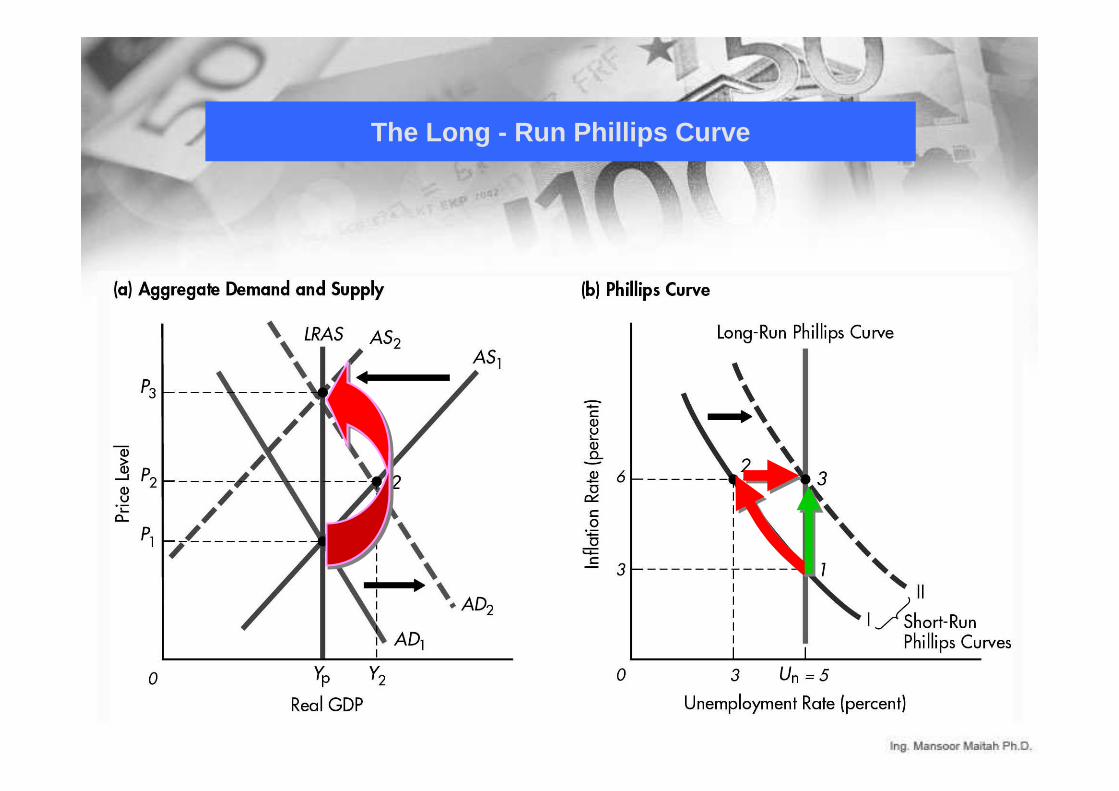
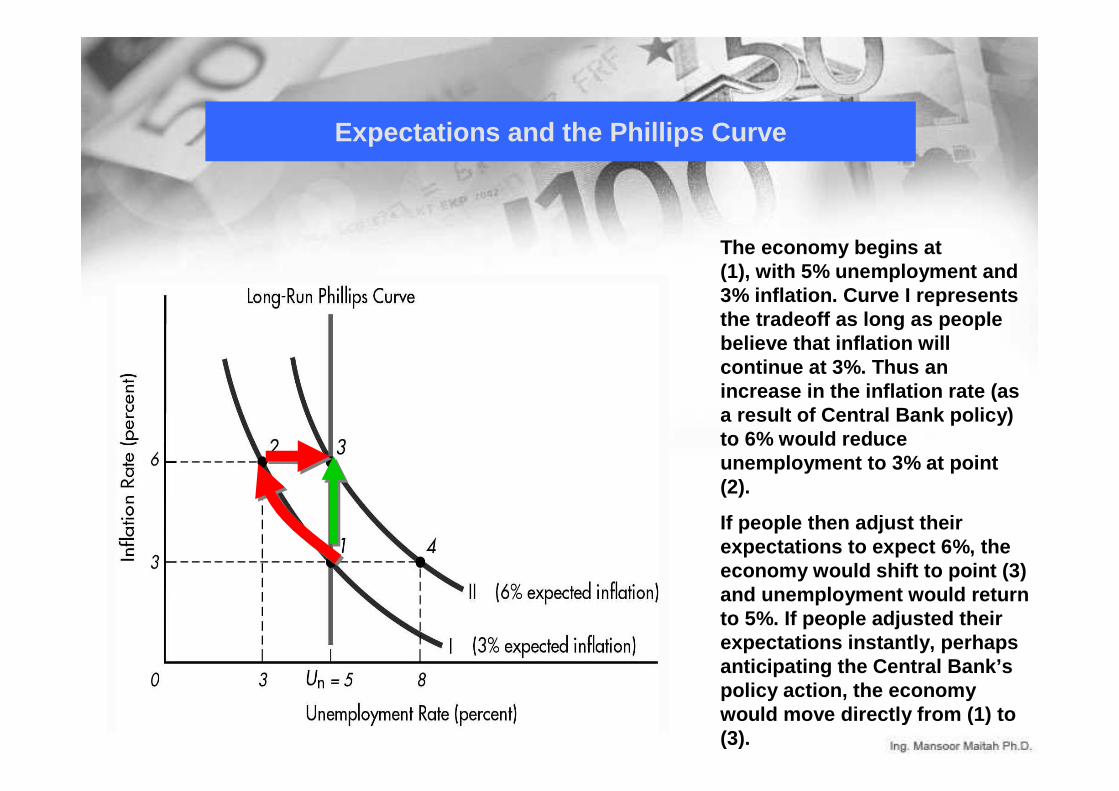
The economy begins at (1), with 5% unemployment and 3% inflation. Curve I represents the tradeoff as long as people believe that inflation will continue at 3%. Thus an increase in the inflation rate (as a result of Central Bank policy) to 6% would reduce unemployment to 3% at point (2).
If people then adjust their expectations to expect 6%, the economy would shift to point (3) and unemployment would return to 5%. If people adjusted their expectations instantly, perhaps anticipating the Central Bank’s policy action, the economy would move directly from (1) to (3).
Model of Aggregate Demand and Aggregate Supply…
Natural rate of unemployment
Long-run Phillips curve
0
(b) The Phillips Curve
Inflation Rate
A
Natural rate of output
0
P1
Aggregate demand, AD1
Long-run aggregate supply
(a) The Model of Aggregate Demand and Aggregate Supply
Price Level
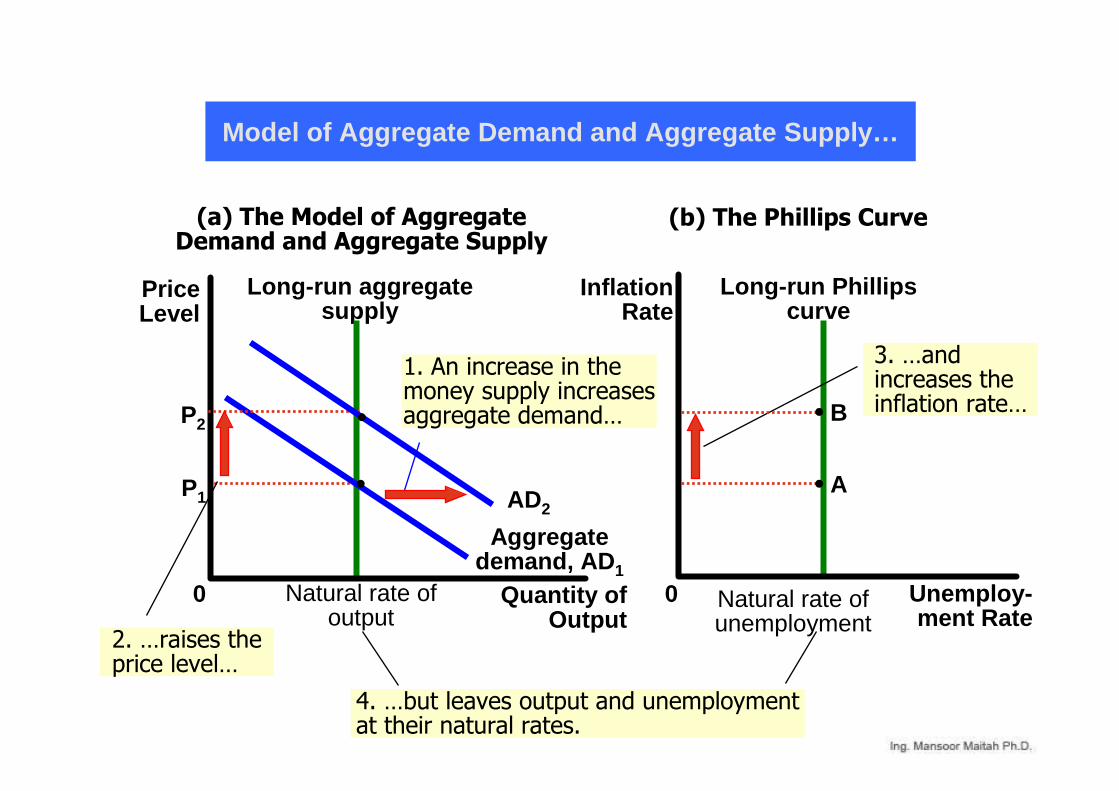
4. …but leaves output and unemployment at their natural rates.
P2
2. …raises the price level…
Quantity ofOutput
Unemploy-ment Rate
1. An increase in the money supply increases aggregate demand…
AD2
B
3. …and increases the inflation rate…
How Expected Inflation Shifts the Short - Run Phillip s Curve...
Unemployment Rate
0 Natural rate of unemployment
Inflation Rate
CB
Long-run Phillips curve
A
Short-run Phillips curve with high expected inflation
Short-run Phillips curve with low expected inflation
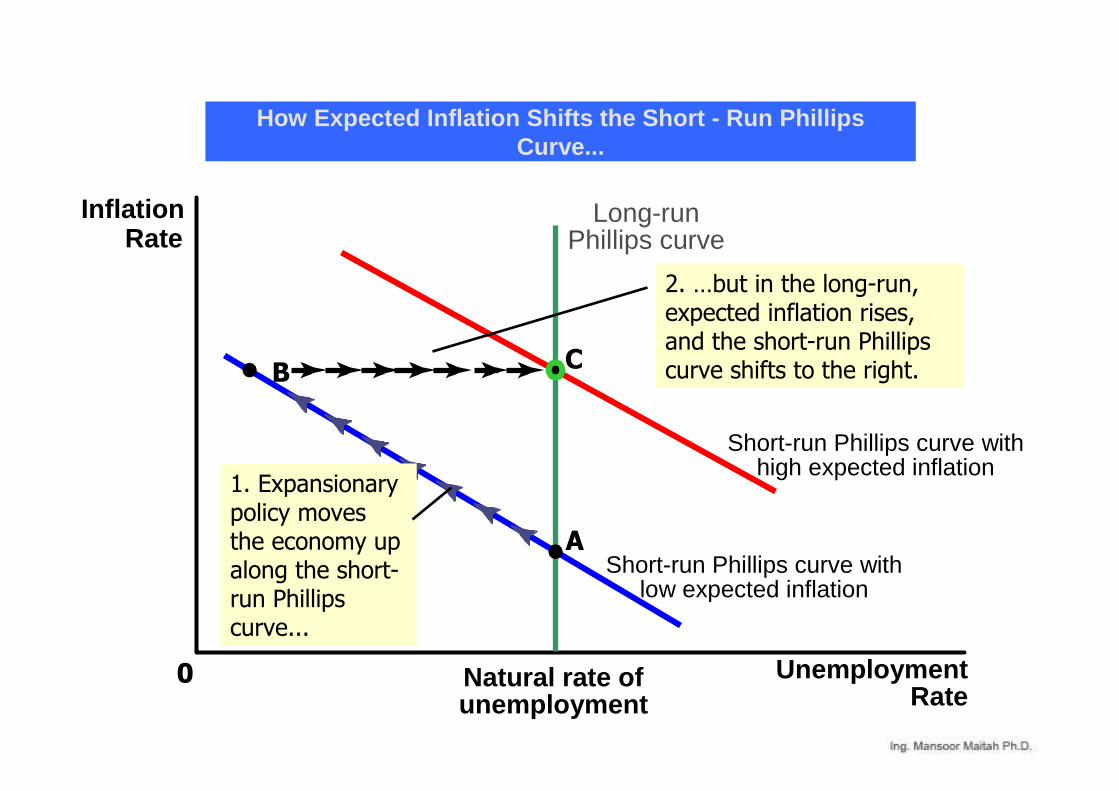
1. Expansionary policy moves the economy up along the short-run Phillips curve...
2. …but in the long-run, expected inflation rises, and the short-run Phillips curve shifts to the right.
Shifts in the Phillips Curve: The Role of Supply Sh ocks
� The short - run Phillips curve also shifts because of shocks to aggregate supply.
�Major adverse changes in aggregate supply can worsen the short-run tradeoff between unemployment and inflation.
�An adverse supply shock gives policymakers a less favorable tradeoff between inflation and unemployment.
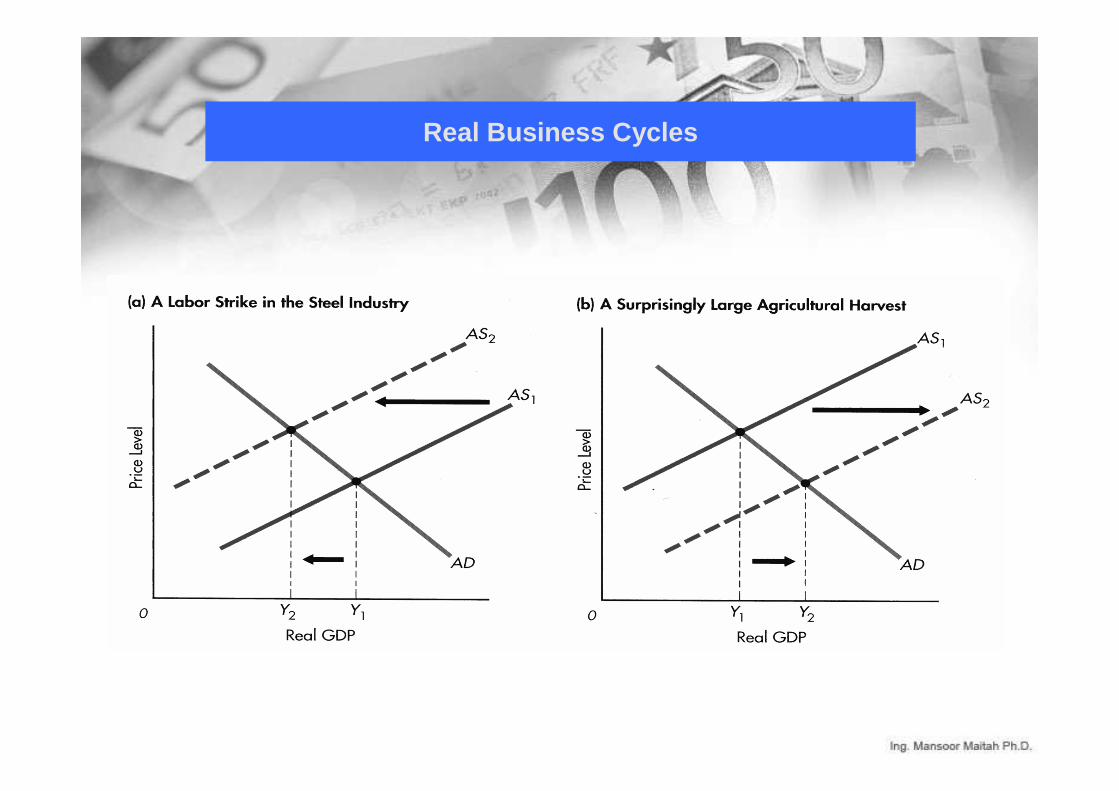
Real Business Cycles
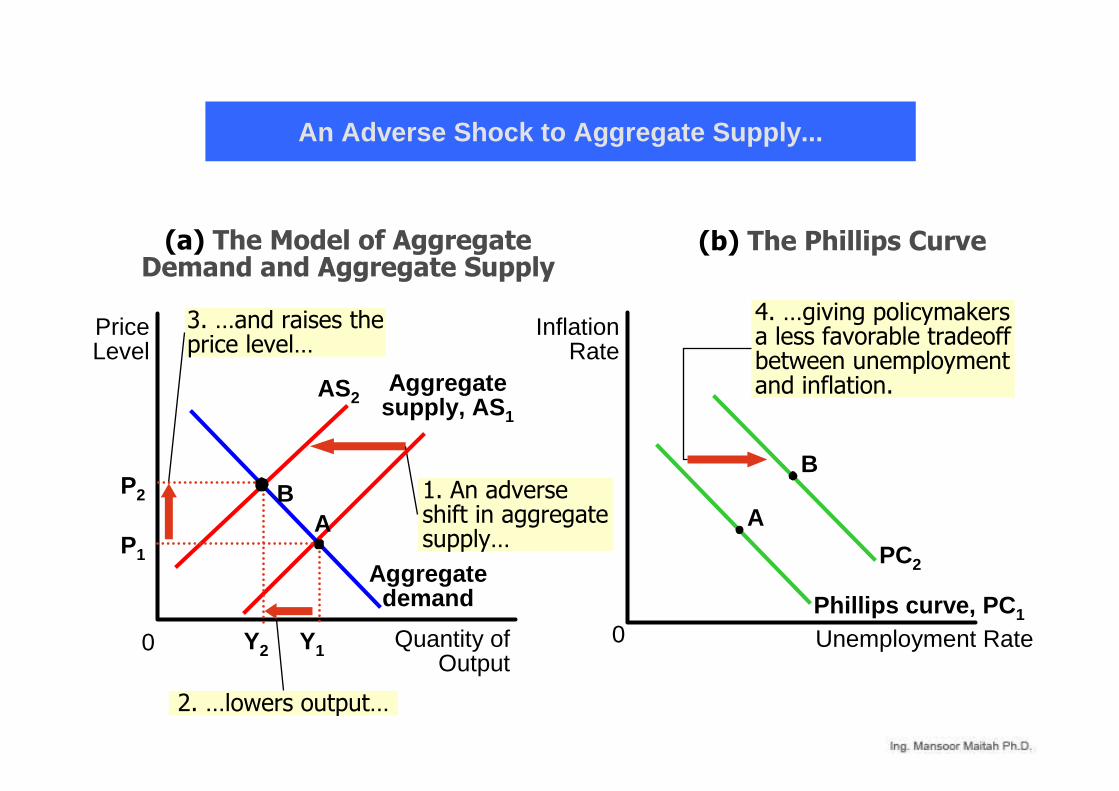
An Adverse Shock to Aggregate Supply...
AS2
1. An adverse shift in aggregate supply…
Quantity ofOutput
0
Price Level
P1Aggregate demand
(a) The Model of Aggregate Demand and Aggregate Supply
Unemployment Rate0
(b) The Phillips Curve
A
Inflation Rate
Phillips curve, PC1
Aggregate supply, AS1
A
Y1
P2
3. …and raises the price level…
B
2. …lowers output…
Y2
B
4. …giving policymakers a less favorable tradeoff between unemployment and inflation.
PC2
Inflation, Unemployment, and Wage Expectations
� In the 1970s, policymakers faced two choices when OPEC cut output and raised worldwide prices of petroleum.
�Fight the unemployment battle by expanding aggregate demand and accelerate inflation.
�Fight inflation by contracting aggregate demand and endure even higher unemployment.
Inflation, Unemployment, and Wage Expectations
� To reduce inflation, the CB has to pursue contractionary monetary policy.
� When the CB slows the rate of money growth, it contracts aggregate demand.
� This reduces the quantity of goods and services that firms produce.
� This leads to a rise in unemployment.
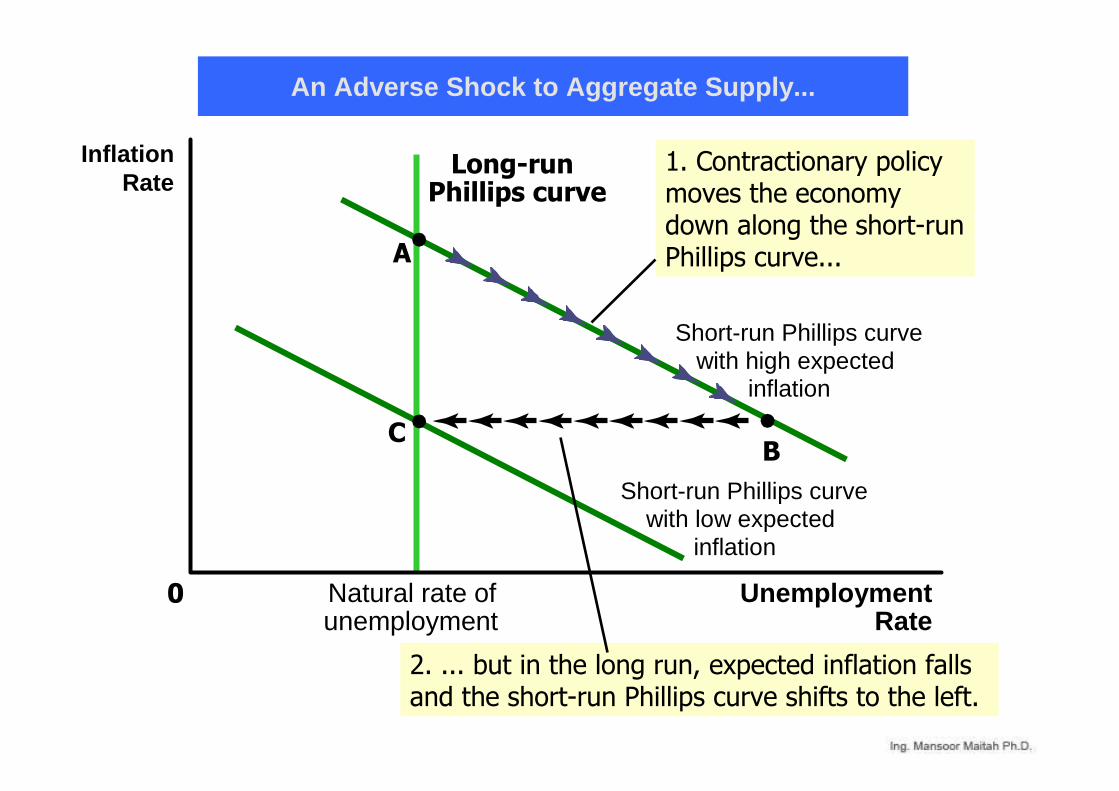
An Adverse Shock to Aggregate Supply...
A
Short-run Phillips curvewith high expected
inflation
1. Contractionary policy moves the economy down along the short-run Phillips curve...
UnemploymentRate
0 Natural rate ofunemployment
InflationRate
Long-runPhillips curve
CB
Short-run Phillips curvewith low expected
inflation
2. ... but in the long run, expected inflation falls and the short-run Phillips curve shifts to the left.
The Cost of Reducing Inflation
� To reduce inflation, an economy must endure a period of high unemployment and low output.
�When the CB combats inflation, the economy moves down the short - run Phillips curve.
�The economy experiences lower inflation but at the co st of higher unemployment.
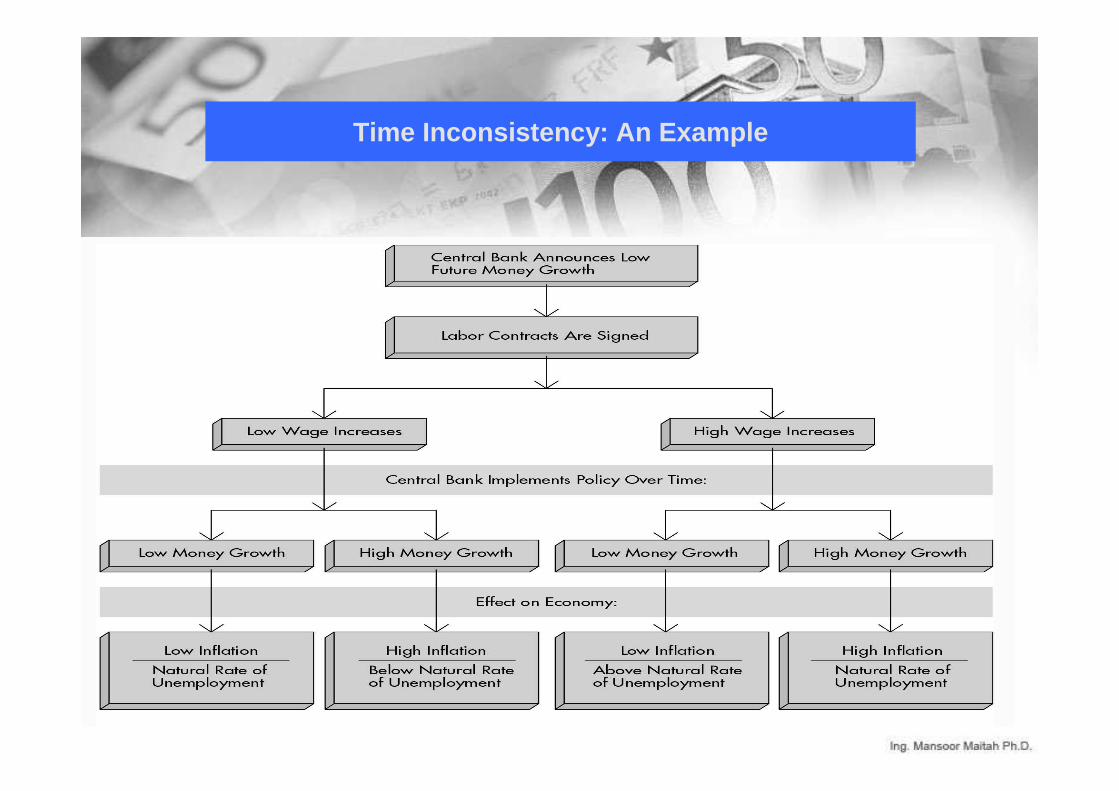
Time Inconsistency: An Example

ThankThankThankThank YouYouYouYou forforforfor youryouryouryour AttentionAttentionAttentionAttention
☺☺☺☺

1 - John F Hall: Introduction to Macroeconomics, 200 5
2 - Fernando Quijano and Yvonn Quijano: Introduction to Macroeconomics
3 - Karl Case, Ray Fair: Principles of Economics, 200 2
4 - Boyes and Melvin: Economics, 2008
5 - James Gwartney, David Macpherson and Charles Skipto n: Macroeconomics, 2006
6 - N. Gregory Mankiw: Macroeconomics, 2002
7- Yamin Ahmed: Principles of Macroeconomics, 2005
8 - Olivier Blanchard: Principles of Macroeconomics, 19 96
Literature


![Index [] · Agriculture employs 668,582 semi- and unskilled workers (Quantec, 2015) - Compared to 607,788 in manufacturing and 383,542 in mining Farm workers experienced real increases](https://img.pdfslide.us/doc/110x75/5eaa57bd73846d7fb565e6da/index-agriculture-employs-668582-semi-and-unskilled-workers-quantec-2015.jpg)