Embed Size (px)
Citation preview
Labor-Friendly Corporate Practices:
Is What is Good for Employees Good
for Shareholders?Olubunmi FaleyeEmery A. Trahan
ABSTRACT. As corporate managers interact with non-
shareholder stakeholders, potential tradeoffs emerge and
questions arise as to how these interactions impact
shareholder value. We argue that this shareholder–stake-
holder debate is an important issue within the overall
corporate governance and corporate policy domain and
examine one such stakeholder group – employees – by
studying labor-friendly corporate practices. We find that
announcements of labor-friendly policies are associated
with positive abnormal stock returns. Labor-friendly firms
also outperform otherwise similar firms, both in terms of
long-run stock market returns and operating results. In
addition, we find that the probability and benefits of
labor-friendliness increase with the demand for highly
skilled labor. Our analysis of excess executive compen-
sation suggests that top management derives no pecuniary
benefits from labor-friendly practices. We interpret our
results as consistent with a genuine concern for employees
translating into higher productivity and profitability,
which in turn facilitate value creation. It appears that the
benefits of labor-friendly practices significantly outweigh
the costs and that what is good for employees is good for
shareholders.
KEY WORDS: corporate social responsibility,
employee stakeholders, stakeholder theory,
agency theory
Introduction
During 1996, First Tennessee National Corp.,
Tennessee’s largest bank and a member of the S&P
500 index, formally declared that employees come
first, followed by customers, and then shareholders.1
The company instituted a wide array of employee-
friendly programs, including childcare subsidies, a
sick-child center, health and fitness programs, and
resources for all kinds of family issues.2 Over the
next 8 years, First Tennessee spent an average of
$67,000 in annual labor costs per employee, com-
pared to mean and median values of $50,000 and
$45,000 for other national commercial banks, and its
average labor expenses ranked above the 90th per-
centile of employee compensation in the industry.
Ron Rector, a senior vice president at First Ten-
nessee, summarized that the bank considers a labor-
friendly culture ‘‘the foundation of its profit chain,
from which employee productivity and retention
follow.’’2 From the standpoint of strategic financial
management and corporate value maximization,
policies such as this raise the question of whether
what is good for employees (or other stakeholders) is
also good for shareholders.
Stakeholder theory suggests that the relation
between corporations and their stakeholders is an
important issue in corporate governance and strategic
management because such relations can have signif-
icant effects on a company’s ability to create value.3
We focus on one key stakeholder class – employees,
and examine labor-friendly practices as a potential
means of fostering value maximization. We define
labor-friendly practices as those that involve the
devotion of significant resources (financial and
otherwise) to enhancing employee welfare and
helping them balance their home and work lives.
As suggested by Ron Rector of First Tennessee in
the above quote, the basic argument in favor of these
programs is their potential to stimulate workforce
loyalty and foster lower absenteeism, reduced turn-
over, better productivity, and, ultimately, improved
profitability and higher market valuation. Yet, labor-
friendly programs are not without their possible
downsides. First, as illustrated in the opening para-
Journal of Business Ethics (2011) 101:1–27 � Springer 2010DOI 10.1007/s10551-010-0705-9
graph, these programs can be quite costly, thereby
resulting in inferior financial performance unless
productivity and other gains outweigh their costs.
Second, labor-friendly programs can create a sense of
entitlement among workers, which reduces the
company’s operating flexibility and ability to adapt
quickly to changing market conditions. Finally,
agency theory suggests that management can pursue
labor-friendly programs to further its self-interest, for
example, by using these programs as a quid pro quo, in
which labor turns a blind eye to managerial excesses
in return for above-market wages and cozy benefits.4
Similarly, Cennamo et al. (2009) show that execu-
tives can incorporate stakeholder expectations into
corporate decision-making as a means of enlarging
their own power because doing so increases mana-
gerial discretion.
We study these issues using two distinct samples,
each with offsetting strengths and limitations. Our
primary sample consists of firms chosen by Fortune
magazine as the ‘‘Best 100 Companies to Work for
in America’’ (Best Companies) between 1998 and
2005. Our second sample consists of firms in the
KLD Research & Analytics’ SOCRATES database.
This database covers about 650 firms, consisting of
all members of the S&P 500 index and those non-
S&P 500 firms belonging to the Domini 400 Social
index created by KLD.
We begin with an event study analysis of the stock
price reaction to the announcement of the Fortune
list. We find a statistically significant average
abnormal return of 1.03%, suggesting that the mar-
ket views investments in labor-friendly programs as
beneficial. We rule out price pressure as a potential
explanation for this result, since we find significantly
positive long-run buy-and-hold abnormal returns
(BHAR) relative to a portfolio of matched firms.
Next, we examine several dimensions of operating
performance: employee productivity, firm-level
total productivity, profitability, and firm value.
Consistent with the event study results, we find that
the Best Companies outperform comparable firms
on all measures. These results are highly robust.
We obtain similar results using the KLD sample.
Specifically, we find a positive relation between our
aggregate measure of labor-friendliness and em-
ployee productivity, total factor productivity, and
firm value. Further analysis shows that beneficial
policies in themselves tend to enhance employee
productivity and firm value while potentially
adversarial labor practices only exert a very mild
negative impact. Thus, the overall effect of labor-
friendliness appears attributable to firms actively
engaging in beneficial practices rather than merely
avoiding potentially adversarial policies.
Next, we consider the question of why firms
engage in labor-friendly practices by focusing on
how the demand for highly skilled human capital
affects the likelihood and benefits of labor-friendli-
ness. In a rational choice regime, we expect firms
whose success depends more on the quality of hu-
man capital to be more likely to adopt labor-friendly
policies both to attract and retain high-quality
employees and encourage them to invest in firm-
specific human capital. Consistent with this, we find
a positive relation between the likelihood of labor-
friendliness and R&D intensity, which we employ as
a proxy for dependence on highly skilled human
capital. We also find that the performance benefits of
labor-friendliness accrue largely to R&D-intensive
firms.
Finally, we examine possible managerial self-
interest motives for adopting labor-friendly policies
by analyzing excess executive compensation. Using
several measures of compensation, we find no sig-
nificant differences in excess compensation between
CEOs of labor-friendly firms and those at compa-
rable firms.
We interpret our results as consistent with rational
choice, noting that the benefits of devoting signifi-
cant resources to employee welfare appear to out-
weigh the costs and that this is more so when the
demand for highly skilled employees is greater. In
this sense, we extend the literature on the valuation
effects of a significant consideration of non-share-
holder constituencies. Fisman et al. (2005) analyze
community stakeholders and find that socially
responsible behavior is more positively related to
profitability in consumer-oriented and competitive
industries. Dowell et al. (2000) show that firms
adopting a stringent environmental standard have
significantly higher valuation than firms adopting less
stringent standards. Our results suggest similar effects
for the devotion of sizeable resources to employee
welfare while identifying the context within which
such practices are most valuable.
A primary limitation of our study is that we focus
on one stakeholder group. Thus, our results do not
2 Olubunmi Faleye and Emery A. Trahan
necessarily generalize to other stakeholders. This is
especially so since employees are unique stakeholders
in the sense that they are intimately involved with
the company’s operations on a daily basis. Results for
other stakeholders not so involved with the com-
pany can conceivably differ from what we report
here. We discuss other limitations and suggestions
for future research in the article’s conclusion.
Background and related studies
A basic tenet of American capitalism is that corpo-
rations are supposed to be run in their shareholders’
best interest, with management choosing policy
variables to maximize firm value.5 Shareholder
wealth maximization is also widely accepted in the
finance and economics literature, where it is pre-
sumed that, given reasonable assumptions, maxi-
mizing shareholder value is consistent with
maximizing the long-run value of the firm and the
welfare of society. For example, Jensen (2001) argues
that ‘‘[t]wo hundred years of work in economics and
finance implies that in the absence of externalities
and monopoly (and when all goods are priced), so-
cial welfare is maximized when each firm in an
economy maximizes its total market value.’’
Some, particularly outside of finance, do not
agree with the consistency between maximizing the
current stock price and long-run firm value. Don-
aldson and Preston (1995, p. 68) argue that the
assumption that the organizational objective is solely
to produce benefits to investors ‘‘now seems to be
confined almost exclusively to the field of finance.’’
A 2007 Business Week article argues that the notion
that management’s primary obligation is to maxi-
mize shareholder value is a key reason why talented
managers fail to innovate because shareholder value
maximization leads managers to focus on quarterly
results and to forgo investments in promising inno-
vations that will hurt short-term financial perfor-
mance.6 Focusing on the objective of shareholder
value maximization leads to similar questions relating
to the treatment of other stakeholders. As manage-
ment interacts with these stakeholders, questions
arise about the implications of these relations for
shareholders and how tradeoffs are assessed.
Donaldson and Preston (1995) and Agle et al.
(2008) provide comprehensive reviews of the many
facets of stakeholder theory. Donaldson and Preston
(1995) note that the hypothesis that corporations
adopting stakeholder practices will perform better
for shareholders than those not adopting such prac-
tices has not been thoroughly tested. Reynolds et al.
(2006) argue that stakeholder theory is widely rec-
ognized as a management theory, but that there is
not much research considering its implications for
individual decision makers. Berrone et al. (2007)
argue that knowledge of the linkages between a
firm’s ethical stance and its performance is limited.
They note that from a theoretical perspective, the
effects of ethics and corporate social responsibility
(CSR) on firm performance is uncertain. Preston
and Sapienza (1990) find that the satisfaction of
multiple stakeholders is not necessarily a zero-sum
game and that benefits to one stakeholder group do
not necessarily come at the expense of another.
Hosmer (1994) and Jones (1995) argue that good
ethics is consistent with shareholder value due to
positive externalities, while Friedman (1970),
Schwab (1996), and Jensen (2001) are more skepti-
cal. Ruf et al. (2001) find some support for the tenet
that shareholders benefit when management meets
the demand of multiple stakeholders. Bird et al.
(2007) summarize a number of papers examining the
reasons for why there is little closure on the direction
of the relation between CSR and corporate perfor-
mance. Reasons include lack of a strong conceptual
foundation, lack of appropriate measures of CSR,
lack of a large enough sample, and lack of meth-
odological rigor. See also, Moore (2001), Ruf et al.
(2001), and Cennamo et al. (2009) for discussions of
stakeholder theory and corporate performance.
The foregoing suggests that there is a need for
more empirical analysis of the relation between
stakeholder treatment and firm performance. Jensen
(2001, 2002) argues that a firm cannot maximize
value if it ignores the interest of its stakeholders, but
that value maximization requires management to
direct an extra dollar toward stakeholders when
doing so generates present value benefits in excess of
the costs. Consistent with this thought, much prior
work has considered if devoting significant corporate
resources to satisfying various stakeholders affect firm
performance. Griffin and Mahon (1997) provide a
comprehensive review. More recently, Fisman et al.
(2005) report differential performance effects for
community-focused CSR, depending on industry
3Labor-Friendly Corporate Practices
characteristics. They find that the impact of socially
responsible behavior on firm value and profitability
increases in the level of industry competition. Stat-
man (2000) and Geczy et al. (2003) evaluate the
performance of mutual funds that invest in socially
responsible firms. They find that these funds gen-
erally perform no worse than comparable funds.
Employees are perhaps the most important value-
relevant stakeholders, since they are the ones who
must execute the firm’s strategies for creating value.
Aoki (1984) argues that shareholders and employees
are the two main stakeholders and that managers
serve as referees between the two. A crucial issue
then is how to align labor’s interest with shareholder
value maximization.7 In this article, we focus on
labor-friendly policies and programs as a potential
tool for fostering the convergence of labor and
shareholder interests. There are several reasons to
expect this convergence. First, labor-friendly prac-
tices can create a strong bond of loyalty to the
company. Social exchange theory and the norm of
reciprocity (Blau, 1964; Eisenberger et al., 1986)
suggest that employees interpret their organization’s
actions and practices as a reflection of its commit-
ment to them, which they then reciprocate in their
loyalty and commitment to the firm. Bridges and
Harrison (2003) show that employee-focused per-
ceptions (as measured by monetary and non-mone-
tary benefits as well as services devoted to
employees) are positively associated with employee
commitment; while Whitener (2001) shows that
employee perception of organizational support is
positively related to their commitment to the firm.
Gellatly (1995, p. 470) argues that committed
employees would exhibit lower absenteeism rates
because they are motivated ‘‘to engage, become
involved, and identify with their work.’’ He also
shows an inverse relation between employee com-
mitment and absence frequency and total days
absent. Similarly, Somers (1995) reports a negative
association between employee commitment and
voluntary turnover. Since absenteeism and turnover
are costly, lower rates can facilitate improved pro-
ductivity and firm performance, thus suggesting a
positive impact for employee-friendly programs.
Furthermore, Batt (2002) finds that employee attri-
tion is lower and sales growth higher at firms that
engage in a variety of employee-friendly practices,
while Gelade and Ivery (2003) find a positive relation
between work climate and a variety of employee
productivity measures.
Besides its effects on current employees, a dem-
onstrated commitment to employee welfare can help
a company to attract and retain better employees as
well as encourage them to invest in firm-specific
human capital. These practices also can create posi-
tive community goodwill for the company, which
can in turn help improve its competitiveness and
performance (Berrone et al., 2007).
Despite these potential benefits, labor-friendly
practices can have detrimental consequences. For
instance, investments in labor-friendly programs are
costly and can exceed potential productivity and
other gains. In addition, such programs can create a
sense of entitlement among employees, thereby
failing to motivate increased productivity while
constraining management’s flexibility to respond to
changing market conditions.
Eisenhardt (1989) argues that agency theory is a
useful addition to organizational theory, and that it is
reasonable to adopt agency theory when investigat-
ing problems that have a principal-agent framework.8
Agency theory suggests that management can use
labor-friendly practices to further its own objectives
at the expense of shareholders. In particular, labor-
friendly policies can create an entrenched, manage-
ment-friendly workforce that ignores managerial
excesses and supports the incumbent in takeovers and
other corporate control situations. Hellwig (2000)
argues of a ‘‘natural alliance’’ between managers and
workers against takeovers and proxy contests, while
Pagano and Volpin (2005) discuss a model in which
management transforms workers into a shark repel-
lant through generous long-term labor contracts and
employees team up with management to resist hostile
takeovers for the purpose of protecting their high
wages. Cennamo et al. (2009) show that managers
can use stakeholder considerations as a means of
increasing their power over the corporation and the
disposition of its resources. Furthermore, labor-
friendly management can extract excessive com-
pensation from the firm since employees may be less
inclined to protest excessive executive pay and perk
consumption when management is generous to or-
dinary employees.9
Our objective is to test these competing effects to
better understand if, and under what circumstances,
shareholders benefit from labor-friendly programs in
4 Olubunmi Faleye and Emery A. Trahan
particular and stakeholder considerations in general.
It is possible that these programs have a positive, a
negative, or no effect on shareholder returns, pro-
ductivity, return on capital, and firm value. A better
understanding of these relationships fills a gap in the
corporate policy, governance, and social responsi-
bility literatures. The topic is also timely, given the
current environment of major cost cutbacks and
concerns about corporate sustainability.
At least two prior studies, which empirically
investigate the relation between the treatment of
employee stakeholders and corporate performance,
are related to our study. Filbeck and Preece (2003)
study firms on the 1998 Fortune list and report posi-
tive abnormal returns associated with being named to
the list and higher buy-and-hold returns before and
shortly after publication of the 1998 list. Bird et al.
(2007) study employee strengths and concerns in the
KLD database. They find some positive relation be-
tween employee strengths and future stock returns
and market-to-book ratio. Our study differs signifi-
cantly from these in many respects. First, while they
both focus on stock market returns, we also analyze
operating performance, providing evidence for sev-
eral measures of productivity, profitability, and value
creation. This permits an understanding of the
sources of the documented improvements in stock
market performance. In addition, we consider the
important question of how individual firm charac-
teristics determine the likelihood of labor-friendliness
and affect the relation between performance and la-
bor-friendliness. We also study potential managerial
self-interest motives in corporate labor policies.
Furthermore, compared to Filbeck and Preece
(2003), our analysis of the KLD sample allows us to
examine the effects of different dimensions of labor-
friendliness on corporate performance and market
valuation. We believe that these are significant issues
that enhance our understanding of the role of labor-
friendly corporate policies and practices.
Sample and data
The Fortune sample
Each January since 1998, Fortune magazine publishes its
list of the ‘‘100 Best Companies to Work for in
America.’’ Fortune selects these companies on the basis
of employee responses to an anonymous survey that
evaluates trust in management, pride in work and/or
company, and camaraderie, as well as company re-
sponses to the 29-page Hewitt People Practices
Inventory and additional corporate materials, including
employee benefits booklets, company newsletters, and
videos.10 Between 1998 and 2005, 248 unique com-
panies appeared on this list. Of these, 131 are public
firms with data available in the Compustat and Center
for Research in Security Prices (CRSP) databases.
They constitute our Fortune sample.
These companies devote significant financial and
non-financial resources to creating a worker-friendly
environment and helping employees balance their
home and work lives. For example, of the 58 pub-
licly traded companies on the 2000 list, 31 offer
on-site university courses and 53 reimburse tuition,
with MBNA topping the list at up to $15,600 a year.
Among firms on the 2002 list, AFLAC has two on-
site childcare centers serving 540 children, while
Genentech provides on-campus bicycles, a rental
library of audio books, an on-site hair salon, free
espresso, and weekly social gatherings. Stratus
Technologies offers on-site mammograms and skin-
cancer testing as well as a concierge service that
makes employee dinner reservations. At Synovus
Financial, supervisors meet with their subordinates at
least three times a year to discuss their career
development. In addition, management appears to
succeed in fostering employee trust. At SRA Inter-
national, 96% of employees say management trusts
them to do a good job, while 97% of Edward Jones
employees say management is honest.11
We present descriptive information for the sample
in Table I. Panel A displays industry distribution,
showing that virtually all broad industry groups are
represented in the sample. The most common broad
industry group is manufacturing, which accounts for
49.6% of the sample and includes firms such as
Amgen, Hewlett-Packard, Texas Instruments, and
Medtronic. Other common industries are financial
services (16.0%, including JP Morgan, First Horizon,
Capital One, and SEI Investments) and business
services (17.5%, including American Management
Systems, IBM, PeopleSoft, and Intuit). Panel B
presents the size distribution of the Best Companies
along with corresponding statistics for the 1998 S&P
500 firms to provide some context. In general, the
Best Companies are large, with median total assets
5Labor-Friendly Corporate Practices
and sales of $4.3 billion and $2.8 billion, respec-
tively. However, the typical Best Company is less
than 60% the size of the typical S&P 500 firms, which
has $7.2 billion in total assets and $5.3 billion in sales.
The Fortune sample has two major strengths.
Principally, it consists of firms that are clearly labor-
friendly, as evidenced by the plethora of benefits and
programs they provide their employees. This gives
us significant power to examine the effect of labor-
friendly practices. Second, the annual publication of
Fortune’s list provides an identifiable event date,
which allows us to study investors’ reaction to
announcements of labor-friendly practices as a
complement to our operating performance tests.
Yet, the sample suffers from one major limitation:
Fortune does not provide consistent details on
the specific programs in place at each company.
In particular, the magazine identifies some but not
all programs offered by each company; thus, it is
possible for a company to offer programs not associ-
ated with it on the list. This makes it impossible to
identify the effects of specific labor-friendly programs.
Our second sample addresses this limitation.
KLD Research & Analytics sample
KLD Research & Analytics provides proprietary
social research and indexes for institutional investors.
Its SOCRATES database consists of ratings of the
social records of a subset of publicly traded U.S.
firms beginning in 1991. In 1998, the database
covered 658 firms, including all S&P 500 firms and
those non-S&P 500 firms in KLD’s DS400 Social
TABLE I
Descriptive statistics
Industry description # Firms %
A: Industry distribution
Manufacturing:
Chemical and allied products 14 10.7
Industrial machinery and equipment 13 9.9
Electronic and other electric equipment 11 8.4
Other manufacturing 27 65 20.6 49.6
Transportation and public utilities 4 3.1
Wholesale and retail trades 14 10.7
Financial services 21 16.0
Business services 23 17.5
Other services 4 3.1
131 100.0
Best companies S&P 500 companies
Assets Sales Assets Sales
B: Comparative summary statistics ($ million)
Minimum 73.623 35.581 366.167 276.600
First quartile 942.846 993.999 3,256.439 2,604.910
Median 4,284.935 2,803.059 7,231.215 5,285.000
Mean 20,942.867 8,329.549 25,603.582 10,233.353
Third quartile 15,579.350 9,278.469 19,961.700 11,967.000
Maximum 365,875.000 158,514.000 617,679.000 158,514.000
Panel A reports industry distribution of firms named to Fortune’s ‘‘100 Best Companies to Work for in America’’ list from
1998 to 2005. Panel B reports summary statistics on assets and sales for the Fortune firms and the S&P 500
6 Olubunmi Faleye and Emery A. Trahan
Index.12 KLD rates each firm on several screens
designed to capture its relationship with numerous
stakeholder groups, including the community,
environment, and employees. These screens are la-
beled ‘‘strengths’’ and ‘‘concerns,’’ and the ratings
are indicated by ‘‘1’’ or ‘‘0,’’ depending on whether
the firm meets the criteria for each screen.
The database includes ratings on 10 labor-related
screens, five strengths and five concerns. KLD de-
fines these screens as follows:
Strengths
1. Union relations: ‘‘1’’ if the company has taken
exceptional steps to treat its unionized work-
force fairly.2. Employee involvement: ‘‘1’’ if the company
strongly encourages worker involvement and/
or ownership through stock options available
to a majority of its employees, gain sharing,
stock ownership, sharing of financial informa-
tion, or participation in management decision-
making.3. Cash profit sharing: ‘‘1’’ if the firm has a cash
profit-sharing program through which it has
recently made distributions to a majority of its
workforce.4. Strong retirement benefits: ‘‘1’’ if the company
has a notably strong retirement benefits pro-
gram.5. Other strength (Safety): ‘‘1’’ if the firm has a
good employee safety record or demonstrates
other noteworthy commitments to its employ-
ees’ well being.
Concerns
1. Union relations: ‘‘1’’ if the company has a his-
tory of notably poor union relations.2. Safety: ‘‘1’’ if the company recently has either
paid substantial fines or civil penalties for will-
ful violations of employee health and safety
standards, or has been otherwise involved in
major health and safety controversies.3. Workforce reductions: ‘‘1’’ if the company has
reduced its workforce by 15% in the most re-
cent year or by 25% during the past 2 years,
or it has announced plans for such reductions.4. Pension/benefits concern: ‘‘1’’ if the company
has either a substantially underfunded defined
benefit pension plan, or an inadequate retire-
ment benefits program.
5. Other concern: ‘‘1’’ if the company has a nota-
ble employee problem not addressed by KLD’s
specific rating categories.
We construct an index of labor-friendliness by
summing over the indicator variables for strengths
and concerns and then subtracting total concerns
from total strengths for each firm. Thus, the index’s
theoretical maximum and minimum values are 5 and
-5, respectively, although the sample maximum is 4
while the minimum is -3. Mean and median values
are 0.33 and 0.00, with a standard deviation of 0.92.
The KLD sample provides a robustness check on
the results obtained with the Fortune sample while
also allowing us to examine the differential effects of
individual dimensions of labor-friendliness beyond
the aggregated results feasible with the Fortune list.
However, it does not permit an examination of
investors’ reaction, since there are no verifiable
announcement dates for the ratings. Perhaps, more
limiting is the fact that KLD’s definitions of strengths
and concerns are somewhat elastic, which potentially
reduces the statistical power of tests based on the
sample.
Empirical analysis
Our empirical tests are divided into two broad
groups. First, we examine the stock price reaction to
announcements of the Fortune list. In an efficient
market, we expect positive announcement returns if
labor-friendly practices are beneficial to sharehold-
ers. The second group of tests focuses on operating
performance.
Event study analysis
We identify the event date for each year by
searching Dow Jones & Reuter’s Factiva for the first
announcement of firms on that year’s Fortune list.
For firms that appear on the list more than once, we
presume that only their first appearance provides
new information to the market. Hence, we include
them in our analysis only in the year in which they
first make the list.13 We also search Factiva for
7Labor-Friendly Corporate Practices
potentially confounding news about each company
over a period of 11 days centered on the event date.
We exclude 13 firms affected by acquisitions, earn-
ings announcements, analyst downgrades/upgrades,
and significant new product announcements. We
then employ event study methodology to calculate
abnormal returns surrounding the announcements
by estimating the market model for each firm over a
period of 255 days (-301, -46) preceding the event
date and using estimated parameters to calculate
abnormal returns for various event windows. Results
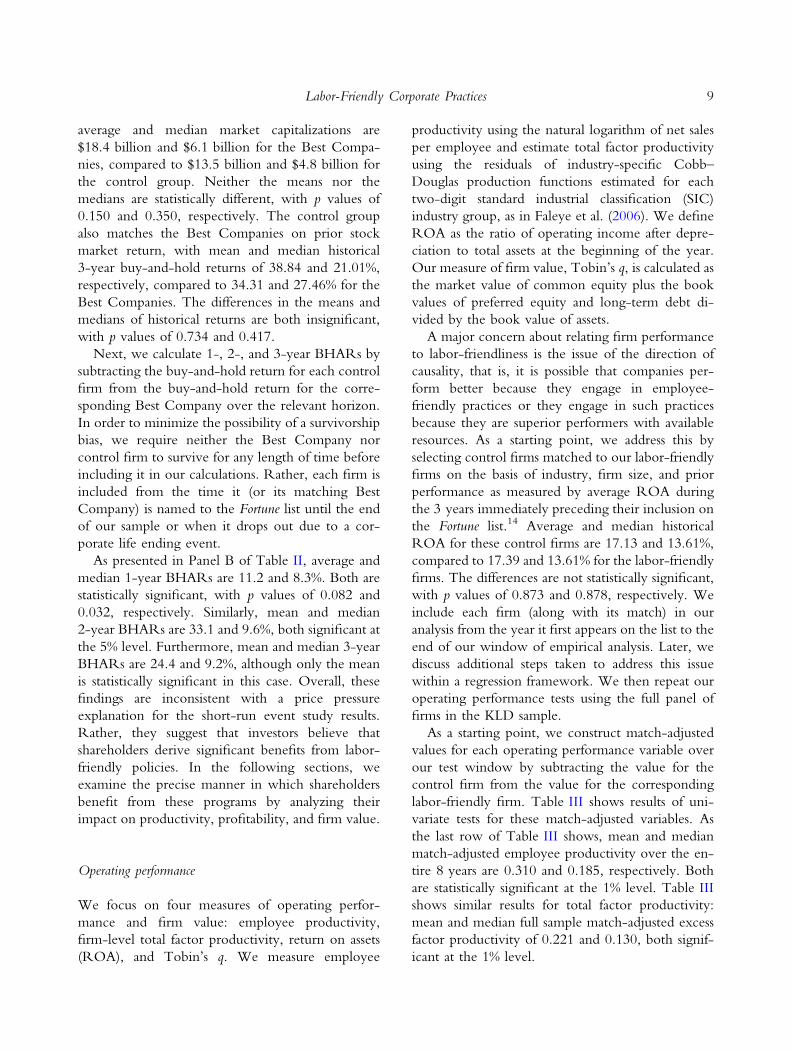
are summarized in Panel A of Table II. As the table
shows, average cumulative abnormal return (CAR)
is positive and statistically significant in each of the
five windows we examine, ranging from 0.93% for
the [-5, +1] window to 1.25% for the [-5, +5]
window.
This suggests that investors view labor-friendly
practices positively, essentially attributing higher
benefits to labor-friendly policies than their imple-
mentation costs. Alternatively, it is possible that the
announcement of the Fortune list has no information
content whatsoever and that the observed price
effect is due to price pressures arising from media
attention. In this case, the price effect will disappear
over the long-run. We examine this possibility by
conducting long-run event studies.
Barber and Lyon (1997) show that the correct
approach for evaluating long-run abnormal perfor-
mance is to calculate BHAR by subtracting the
simple buy-and-hold returns on a portfolio of
appropriately matched firms from the simple buy-
and-hold returns on the sample portfolio. Following
this approach, we create a sample of control firms
matched to the Best Companies on the basis of
book/market equity and market capitalization, both
averaged over the 3 years preceding the year the
sample firm first makes the Fortune list, and the
simple buy-and-hold return calculated over the same
3-year period. Mean and median book/market
equity for the sample firms are 0.297 and 0.240,
compared to 0.290 and 0.237 for the matched
sample. The differences are both insignificant, with
respective p values of 0.841 and 0.982. Similarly,
TABLE II
Market response to announcement of the Best Companies list
Window (days) Sample CAR
A: Short-run event study
[-1, 0] 118 1.25%***
[-1, +1] 118 1.03%***
[-5, 0] 118 1.15%***
[-5, +1] 118 0.93%**
[-5, +5] 118 1.25%**
Horizon (years) Sample Mean Median
B: Long-run buy-and-hold abnormal returns (P values in parentheses)
[-3, 0] 124 1.12% (0.876) 4.39% (0.448)
[0, +1] 124 11.24%* (0.082) 8.28%** (0.032)
[0, +2] 116 33.13%** (0.013) 9.64%** (0.053)
[0, +3] 102 24.38%* (0.103) 9.16% (0.604)
Panel A of this table reports average cumulative abnormal returns (CAR) for announcements of firms on Fortune’s ‘‘100
Best Companies to Work for in America’’ over 1998–2005. The event date for each year is the date of the first
announcement of firms on that year’s list in Dow Jones & Reuter’s Factiva. Firms with confounding news around the
announcement date are excluded from the short-run tests. Panel B reports buy-and-hold abnormal returns for the Best
Companies relative to a portfolio of similar firms matched on the basis of book/market equity and market capitalization,
both averaged over the 3 years preceding the year the sample firm first made the Fortune list, and the simple buy-and-hold
returns calculated over the same 3-year period. Levels of significance are indicated by ***, **, and * for 1, 5, and 10%,
respectively
8 Olubunmi Faleye and Emery A. Trahan
average and median market capitalizations are
$18.4 billion and $6.1 billion for the Best Compa-
nies, compared to $13.5 billion and $4.8 billion for
the control group. Neither the means nor the
medians are statistically different, with p values of
0.150 and 0.350, respectively. The control group
also matches the Best Companies on prior stock
market return, with mean and median historical
3-year buy-and-hold returns of 38.84 and 21.01%,
respectively, compared to 34.31 and 27.46% for the
Best Companies. The differences in the means and
medians of historical returns are both insignificant,
with p values of 0.734 and 0.417.
Next, we calculate 1-, 2-, and 3-year BHARs by
subtracting the buy-and-hold return for each control
firm from the buy-and-hold return for the corre-
sponding Best Company over the relevant horizon.
In order to minimize the possibility of a survivorship
bias, we require neither the Best Company nor
control firm to survive for any length of time before
including it in our calculations. Rather, each firm is
included from the time it (or its matching Best
Company) is named to the Fortune list until the end
of our sample or when it drops out due to a cor-
porate life ending event.
As presented in Panel B of Table II, average and
median 1-year BHARs are 11.2 and 8.3%. Both are
statistically significant, with p values of 0.082 and
0.032, respectively. Similarly, mean and median
2-year BHARs are 33.1 and 9.6%, both significant at
the 5% level. Furthermore, mean and median 3-year
BHARs are 24.4 and 9.2%, although only the mean
is statistically significant in this case. Overall, these
findings are inconsistent with a price pressure
explanation for the short-run event study results.
Rather, they suggest that investors believe that
shareholders derive significant benefits from labor-
friendly policies. In the following sections, we
examine the precise manner in which shareholders
benefit from these programs by analyzing their
impact on productivity, profitability, and firm value.
Operating performance
We focus on four measures of operating perfor-
mance and firm value: employee productivity,
firm-level total factor productivity, return on assets
(ROA), and Tobin’s q. We measure employee
productivity using the natural logarithm of net sales
per employee and estimate total factor productivity
using the residuals of industry-specific Cobb–
Douglas production functions estimated for each
two-digit standard industrial classification (SIC)
industry group, as in Faleye et al. (2006). We define
ROA as the ratio of operating income after depre-
ciation to total assets at the beginning of the year.
Our measure of firm value, Tobin’s q, is calculated as
the market value of common equity plus the book
values of preferred equity and long-term debt di-
vided by the book value of assets.
A major concern about relating firm performance
to labor-friendliness is the issue of the direction of
causality, that is, it is possible that companies per-
form better because they engage in employee-
friendly practices or they engage in such practices
because they are superior performers with available
resources. As a starting point, we address this by
selecting control firms matched to our labor-friendly
firms on the basis of industry, firm size, and prior
performance as measured by average ROA during
the 3 years immediately preceding their inclusion on
the Fortune list.14 Average and median historical
ROA for these control firms are 17.13 and 13.61%,
compared to 17.39 and 13.61% for the labor-friendly
firms. The differences are not statistically significant,
with p values of 0.873 and 0.878, respectively. We
include each firm (along with its match) in our
analysis from the year it first appears on the list to the
end of our window of empirical analysis. Later, we
discuss additional steps taken to address this issue
within a regression framework. We then repeat our
operating performance tests using the full panel of
firms in the KLD sample.
As a starting point, we construct match-adjusted
values for each operating performance variable over
our test window by subtracting the value for the
control firm from the value for the corresponding
labor-friendly firm. Table III shows results of uni-
variate tests for these match-adjusted variables. As
the last row of Table III shows, mean and median
match-adjusted employee productivity over the en-
tire 8 years are 0.310 and 0.185, respectively. Both
are statistically significant at the 1% level. Table III
shows similar results for total factor productivity:
mean and median full sample match-adjusted excess
factor productivity of 0.221 and 0.130, both signif-
icant at the 1% level.
9Labor-Friendly Corporate Practices
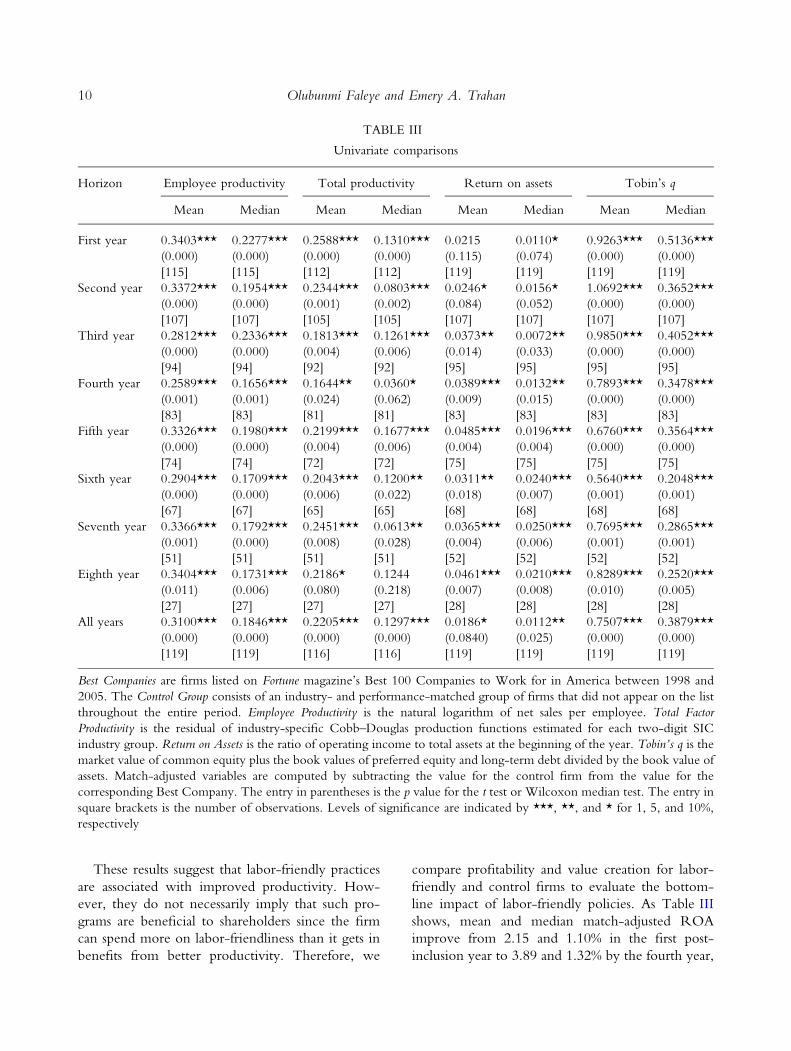
These results suggest that labor-friendly practices
are associated with improved productivity. How-
ever, they do not necessarily imply that such pro-
grams are beneficial to shareholders since the firm
can spend more on labor-friendliness than it gets in
benefits from better productivity. Therefore, we
compare profitability and value creation for labor-
friendly and control firms to evaluate the bottom-
line impact of labor-friendly policies. As Table III
shows, mean and median match-adjusted ROA
improve from 2.15 and 1.10% in the first post-
inclusion year to 3.89 and 1.32% by the fourth year,
TABLE III
Univariate comparisons
Horizon Employee productivity Total productivity Return on assets Tobin’s q
Mean Median Mean Median Mean Median Mean Median
First year 0.3403***
(0.000)
[115]
0.2277***
(0.000)
[115]
0.2588***
(0.000)
[112]
0.1310***
(0.000)
[112]
0.0215
(0.115)
[119]
0.0110*
(0.074)
[119]
0.9263***
(0.000)
[119]
0.5136***
(0.000)
[119]
Second year 0.3372***
(0.000)
[107]
0.1954***
(0.000)
[107]
0.2344***
(0.001)
[105]
0.0803***
(0.002)
[105]
0.0246*
(0.084)
[107]
0.0156*
(0.052)
[107]
1.0692***
(0.000)
[107]
0.3652***
(0.000)
[107]
Third year 0.2812***
(0.000)
[94]
0.2336***
(0.000)
[94]
0.1813***
(0.004)
[92]
0.1261***
(0.006)
[92]
0.0373**
(0.014)
[95]
0.0072**
(0.033)
[95]
0.9850***
(0.000)
[95]
0.4052***
(0.000)
[95]
Fourth year 0.2589***
(0.001)
[83]
0.1656***
(0.001)
[83]
0.1644**
(0.024)
[81]
0.0360*
(0.062)
[81]
0.0389***
(0.009)
[83]
0.0132**
(0.015)
[83]
0.7893***
(0.000)
[83]
0.3478***
(0.000)
[83]
Fifth year 0.3326***
(0.000)
[74]
0.1980***
(0.000)
[74]
0.2199***
(0.004)
[72]
0.1677***
(0.006)
[72]
0.0485***
(0.004)
[75]
0.0196***
(0.004)
[75]
0.6760***
(0.000)
[75]
0.3564***
(0.000)
[75]
Sixth year 0.2904***
(0.000)
[67]
0.1709***
(0.000)
[67]
0.2043***
(0.006)
[65]
0.1200**
(0.022)
[65]
0.0311**
(0.018)
[68]
0.0240***
(0.007)
[68]
0.5640***
(0.001)
[68]
0.2048***
(0.001)
[68]
Seventh year 0.3366***
(0.001)
[51]
0.1792***
(0.000)
[51]
0.2451***
(0.008)
[51]
0.0613**
(0.028)
[51]
0.0365***
(0.004)
[52]
0.0250***
(0.006)
[52]
0.7695***
(0.001)
[52]
0.2865***
(0.001)
[52]
Eighth year 0.3404***
(0.011)
[27]
0.1731***
(0.006)
[27]
0.2186*
(0.080)
[27]
0.1244
(0.218)
[27]
0.0461***
(0.007)
[28]
0.0210***
(0.008)
[28]
0.8289***
(0.010)
[28]
0.2520***
(0.005)
[28]
All years 0.3100***
(0.000)
[119]
0.1846***
(0.000)
[119]
0.2205***
(0.000)
[116]
0.1297***
(0.000)
[116]
0.0186*
(0.0840)
[119]
0.0112**
(0.025)
[119]
0.7507***
(0.000)
[119]
0.3879***
(0.000)
[119]
Best Companies are firms listed on Fortune magazine’s Best 100 Companies to Work for in America between 1998 and
2005. The Control Group consists of an industry- and performance-matched group of firms that did not appear on the list
throughout the entire period. Employee Productivity is the natural logarithm of net sales per employee. Total Factor
Productivity is the residual of industry-specific Cobb–Douglas production functions estimated for each two-digit SIC
industry group. Return on Assets is the ratio of operating income to total assets at the beginning of the year. Tobin’s q is the
market value of common equity plus the book values of preferred equity and long-term debt divided by the book value of
assets. Match-adjusted variables are computed by subtracting the value for the control firm from the value for the
corresponding Best Company. The entry in parentheses is the p value for the t test or Wilcoxon median test. The entry in
square brackets is the number of observations. Levels of significance are indicated by ***, **, and * for 1, 5, and 10%,
respectively
10 Olubunmi Faleye and Emery A. Trahan
and 4.61 and 2.10% by the eighth year. The statis-
tical significance also improves, from p values of
0.115 and 0.074 in the first year to 0.009 and 0.015
in the fourth year, and 0.007 and 0.008 in the eighth
year. Likewise, mean and median match-adjusted
Tobin’s q are positive and statistically significant each
year, with p values of 0.01 or less.
These results suggest that labor-friendly practices
enhance employee productivity, which helps to
increase operating profitability and shareholder va-
lue. However, firm value and operating performance
are affected by other factors besides labor-friendli-
ness. For example, prior research has shown that
several corporate governance variables are correlated
with firm performance. These include board size
(Yermack, 1996), board election method (Bebchuk
and Cohen, 2005; Faleye, 2007), and managerial
ownership (Morck et al., 1988). The availability or
lack of investment opportunities may also affect firm
performance and value. Thus, to isolate the effect of
a labor-friendly environment, we control for these
variables within a regression framework.
We obtain corporate governance data from proxy
statements and annual reports and measure invest-
ment opportunity set using the ratio of capital
expenditures to total assets as in Yermack (1996) and
Faleye (2007). Furthermore, we control for leverage
because debt may enhance or hinder a firm’s per-
formance, for example, by changing its operating
environment through constraints imposed by debt
covenants. Using data from Compustat, we measure
leverage as the ratio of long-term debt to total assets.
Given our focus on labor-friendly practices,
another important consideration is the role of
employee compensation arrangements. Specifically,
it is possible that labor-friendly companies are simply
high-growth firms that compete for employees by
providing comprehensive benefit packages and using
high-powered incentives that can potentially drive
the results. This suggests employee compensation as
an important control variable. However, employee
compensation data are not publicly available for
most of our sample firms. As an alternative, we use
employee option grants to measure rank-and-file
employee compensation incentives. We hand-collect
data on employee stock options from 10-Ks, proxy
statements, and annual reports. The data include the
number of options outstanding, weighted average
term to expiration, and weighted average exercise
price. Using these data and following the method-
ology of Hochberg and Lindsey (2010), we calculate
non-executive employee compensation incentives as
the change in the value of aggregate non-executive
employee option portfolio for a $1 change in the
firm’s stock price divided by the number of
employees. We include this variable as an additional
control variable in our regressions.
Our regressions also include year dummies, two-
digit primary SIC code dummies to control for time-
invariant industry effects, and the natural logarithm
of total assets to control for differences in firm size.
These regressions are pooled time-series cross-sec-
tional regressions, with standard errors corrected for
clustering at the firm level. We present results in
Table IV.
Productivity
The first column of Table IV shows regression
results for labor productivity. The indicator variable
for labor-friendly firms is positive and significant at
the 10% level. The coefficient indicates that, on
average, employees at labor-friendly firms generate
approximately 13% more in sales revenue than
control firm employees. Relative to average sales per
employee of $353,000 for the full sample, this
implies an economically significant $46,900
improvement in annual sales per employee. We
obtain similar results for total factor productivity.
The second column of Table III shows that, relative
to control firms, actual output at labor-friendly firms
is approximately 14.1 percentage points higher than
what we would expect based on factor inputs. These
results are similar to those of Beatty (1995). She finds
enhanced productivity following the adoption of
employee stock ownership plans (ESOP) at compa-
nies where the ESOP does not replace an existing
pension plan but lower productivity where it does.
This suggests that productivity increases when
workers perceive increased commitment to employee
welfare, which is consistent with our findings.
Operating profitability
Regression results for ROA are presented in the
third column of Table IV. As the table shows, the
labor-friendliness variable is positive and statistically
significant at the 1% level. Its coefficient suggests
that labor-friendliness is associated with an increase
of about 5 percentage points in ROA. Mean and
11Labor-Friendly Corporate Practices
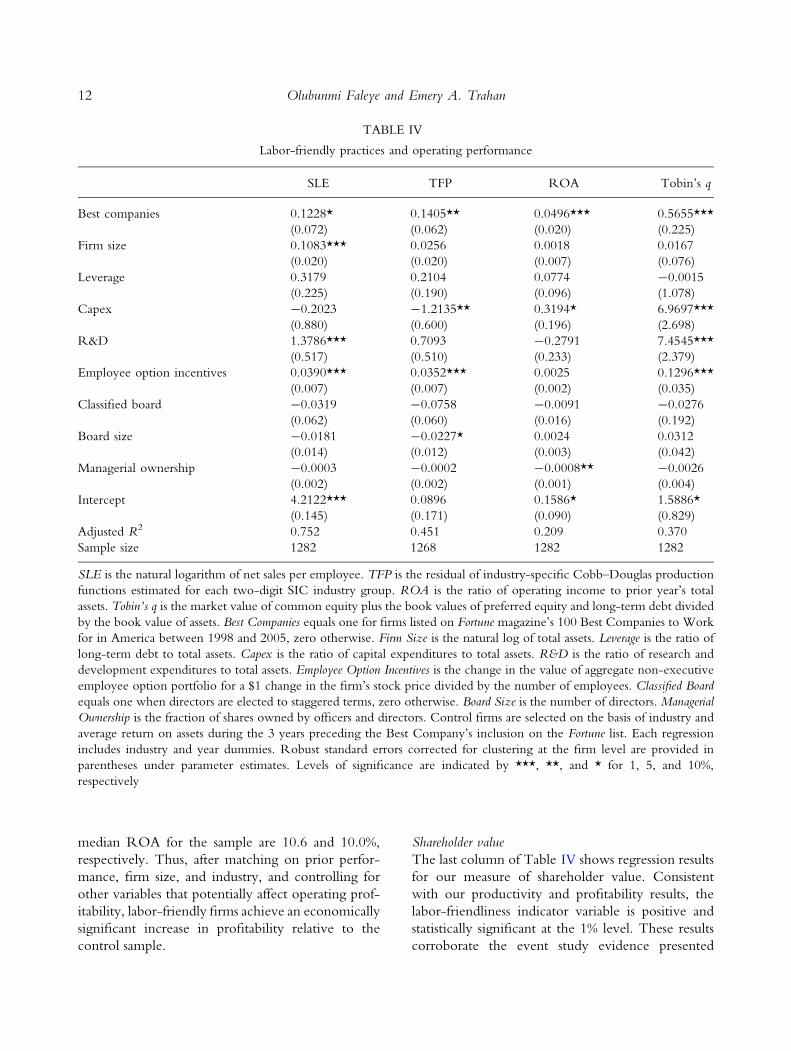
median ROA for the sample are 10.6 and 10.0%,
respectively. Thus, after matching on prior perfor-
mance, firm size, and industry, and controlling for
other variables that potentially affect operating prof-
itability, labor-friendly firms achieve an economically
significant increase in profitability relative to the
control sample.
Shareholder value
The last column of Table IV shows regression results
for our measure of shareholder value. Consistent
with our productivity and profitability results, the
labor-friendliness indicator variable is positive and
statistically significant at the 1% level. These results
corroborate the event study evidence presented
TABLE IV
Labor-friendly practices and operating performance
SLE TFP ROA Tobin’s q
Best companies 0.1228*
(0.072)
0.1405**
(0.062)
0.0496***
(0.020)
0.5655***
(0.225)
Firm size 0.1083***
(0.020)
0.0256
(0.020)
0.0018
(0.007)
0.0167
(0.076)
Leverage 0.3179
(0.225)
0.2104
(0.190)
0.0774
(0.096)
-0.0015
(1.078)
Capex -0.2023
(0.880)
-1.2135**
(0.600)
0.3194*
(0.196)
6.9697***
(2.698)
R&D 1.3786***
(0.517)
0.7093
(0.510)
-0.2791
(0.233)
7.4545***
(2.379)
Employee option incentives 0.0390***
(0.007)
0.0352***
(0.007)
0.0025
(0.002)
0.1296***
(0.035)
Classified board -0.0319
(0.062)
-0.0758
(0.060)
-0.0091
(0.016)
-0.0276
(0.192)
Board size -0.0181
(0.014)
-0.0227*
(0.012)
0.0024
(0.003)
0.0312
(0.042)
Managerial ownership -0.0003
(0.002)
-0.0002
(0.002)
-0.0008**
(0.001)
-0.0026
(0.004)
Intercept 4.2122***
(0.145)
0.0896
(0.171)
0.1586*
(0.090)
1.5886*
(0.829)
Adjusted R2 0.752 0.451 0.209 0.370
Sample size 1282 1268 1282 1282
SLE is the natural logarithm of net sales per employee. TFP is the residual of industry-specific Cobb–Douglas production
functions estimated for each two-digit SIC industry group. ROA is the ratio of operating income to prior year’s total
assets. Tobin’s q is the market value of common equity plus the book values of preferred equity and long-term debt divided
by the book value of assets. Best Companies equals one for firms listed on Fortune magazine’s 100 Best Companies to Work
for in America between 1998 and 2005, zero otherwise. Firm Size is the natural log of total assets. Leverage is the ratio of
long-term debt to total assets. Capex is the ratio of capital expenditures to total assets. R&D is the ratio of research and
development expenditures to total assets. Employee Option Incentives is the change in the value of aggregate non-executive
employee option portfolio for a $1 change in the firm’s stock price divided by the number of employees. Classified Board
equals one when directors are elected to staggered terms, zero otherwise. Board Size is the number of directors. Managerial
Ownership is the fraction of shares owned by officers and directors. Control firms are selected on the basis of industry and
average return on assets during the 3 years preceding the Best Company’s inclusion on the Fortune list. Each regression
includes industry and year dummies. Robust standard errors corrected for clustering at the firm level are provided in
parentheses under parameter estimates. Levels of significance are indicated by ***, **, and * for 1, 5, and 10%,
respectively
12 Olubunmi Faleye and Emery A. Trahan
earlier, further suggesting that devoting significant
resources to employee welfare facilitates higher
productivity, improved performance, and superior
market valuation.
Robustness checks
We recognize that some readers can argue that our
results are attributable to a potential selection bias
that favors high-performing firms. We matched the
labor-friendly firms with a control group of similarly
performing firms of about the same size in the same
industry precisely to address this concern. Here, we
perform additional analysis to reduce the likelihood
of such a spurious relation.
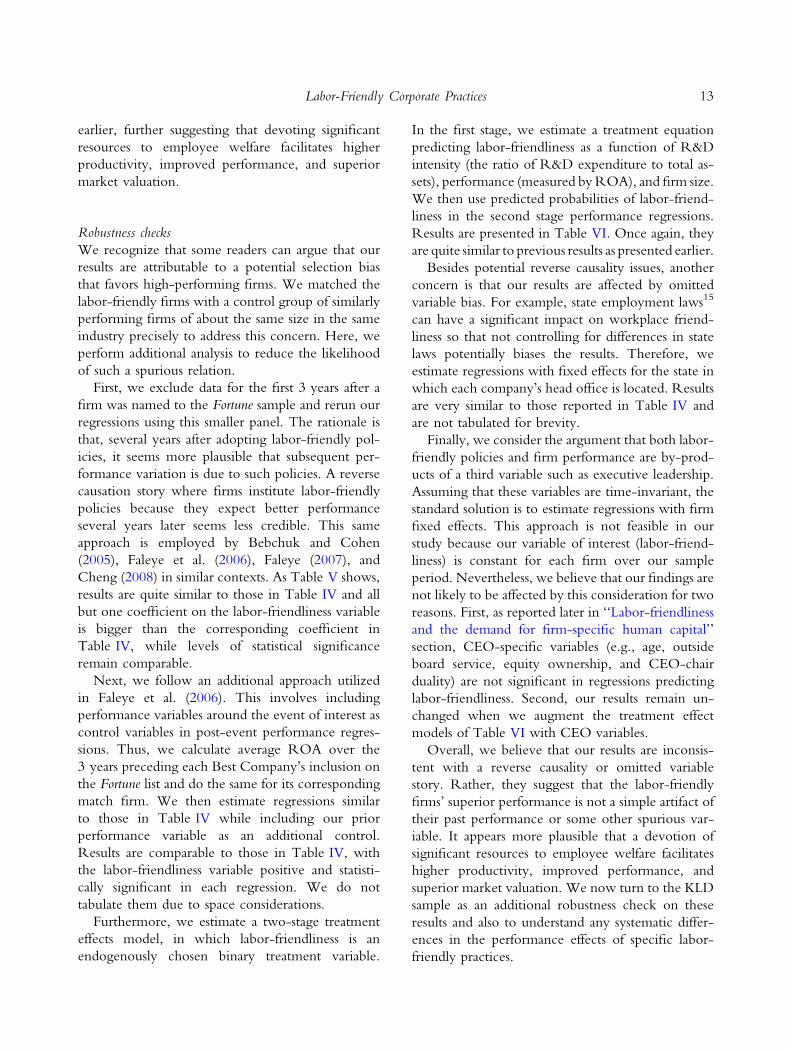
First, we exclude data for the first 3 years after a
firm was named to the Fortune sample and rerun our
regressions using this smaller panel. The rationale is
that, several years after adopting labor-friendly pol-
icies, it seems more plausible that subsequent per-
formance variation is due to such policies. A reverse
causation story where firms institute labor-friendly
policies because they expect better performance
several years later seems less credible. This same
approach is employed by Bebchuk and Cohen
(2005), Faleye et al. (2006), Faleye (2007), and
Cheng (2008) in similar contexts. As Table V shows,
results are quite similar to those in Table IV and all
but one coefficient on the labor-friendliness variable
is bigger than the corresponding coefficient in
Table IV, while levels of statistical significance
remain comparable.
Next, we follow an additional approach utilized
in Faleye et al. (2006). This involves including
performance variables around the event of interest as
control variables in post-event performance regres-
sions. Thus, we calculate average ROA over the
3 years preceding each Best Company’s inclusion on
the Fortune list and do the same for its corresponding
match firm. We then estimate regressions similar
to those in Table IV while including our prior
performance variable as an additional control.
Results are comparable to those in Table IV, with
the labor-friendliness variable positive and statisti-
cally significant in each regression. We do not
tabulate them due to space considerations.
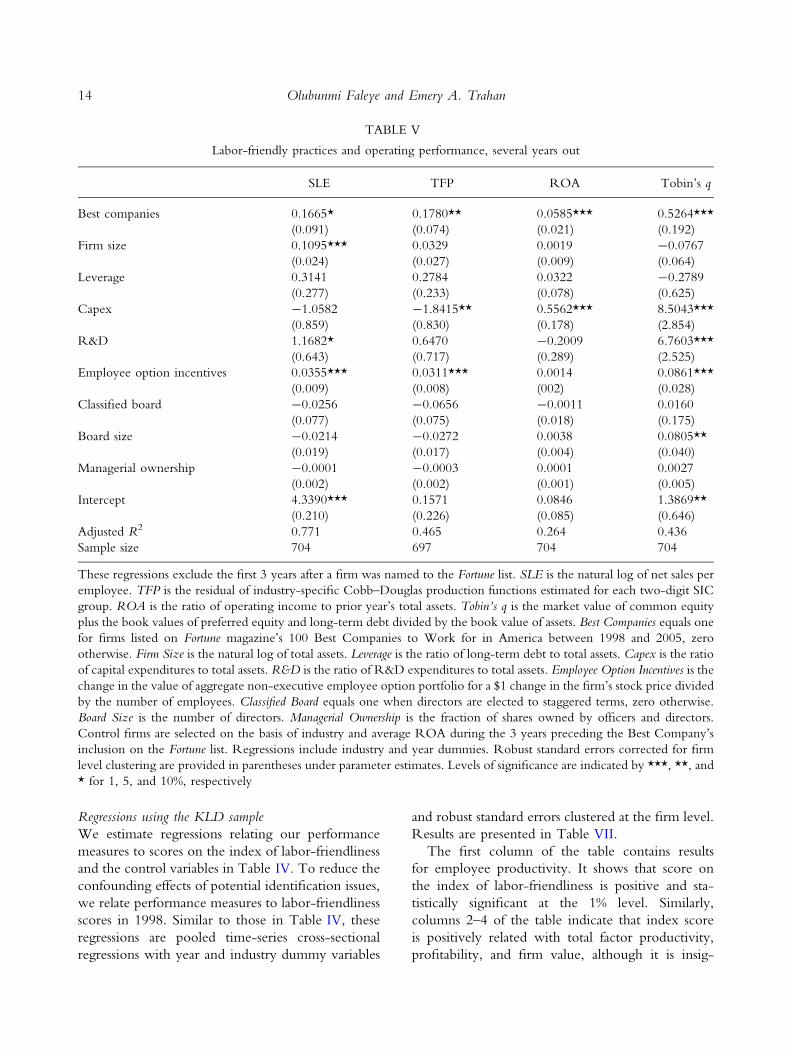
Furthermore, we estimate a two-stage treatment
effects model, in which labor-friendliness is an
endogenously chosen binary treatment variable.
In the first stage, we estimate a treatment equation
predicting labor-friendliness as a function of R&D
intensity (the ratio of R&D expenditure to total as-
sets), performance (measured by ROA), and firm size.
We then use predicted probabilities of labor-friend-
liness in the second stage performance regressions.
Results are presented in Table VI. Once again, they
are quite similar to previous results as presented earlier.
Besides potential reverse causality issues, another
concern is that our results are affected by omitted
variable bias. For example, state employment laws15
can have a significant impact on workplace friend-
liness so that not controlling for differences in state
laws potentially biases the results. Therefore, we
estimate regressions with fixed effects for the state in
which each company’s head office is located. Results
are very similar to those reported in Table IV and
are not tabulated for brevity.
Finally, we consider the argument that both labor-
friendly policies and firm performance are by-prod-
ucts of a third variable such as executive leadership.
Assuming that these variables are time-invariant, the
standard solution is to estimate regressions with firm
fixed effects. This approach is not feasible in our
study because our variable of interest (labor-friend-
liness) is constant for each firm over our sample
period. Nevertheless, we believe that our findings are
not likely to be affected by this consideration for two
reasons. First, as reported later in ‘‘Labor-friendliness
and the demand for firm-specific human capital’’
section, CEO-specific variables (e.g., age, outside
board service, equity ownership, and CEO-chair
duality) are not significant in regressions predicting
labor-friendliness. Second, our results remain un-
changed when we augment the treatment effect
models of Table VI with CEO variables.
Overall, we believe that our results are inconsis-
tent with a reverse causality or omitted variable
story. Rather, they suggest that the labor-friendly
firms’ superior performance is not a simple artifact of
their past performance or some other spurious var-
iable. It appears more plausible that a devotion of
significant resources to employee welfare facilitates
higher productivity, improved performance, and
superior market valuation. We now turn to the KLD
sample as an additional robustness check on these
results and also to understand any systematic differ-
ences in the performance effects of specific labor-
friendly practices.
13Labor-Friendly Corporate Practices
Regressions using the KLD sample
We estimate regressions relating our performance
measures to scores on the index of labor-friendliness
and the control variables in Table IV. To reduce the
confounding effects of potential identification issues,
we relate performance measures to labor-friendliness
scores in 1998. Similar to those in Table IV, these
regressions are pooled time-series cross-sectional
regressions with year and industry dummy variables
and robust standard errors clustered at the firm level.
Results are presented in Table VII.
The first column of the table contains results
for employee productivity. It shows that score on
the index of labor-friendliness is positive and sta-
tistically significant at the 1% level. Similarly,
columns 2–4 of the table indicate that index score
is positively related with total factor productivity,
profitability, and firm value, although it is insig-
TABLE V
Labor-friendly practices and operating performance, several years out
SLE TFP ROA Tobin’s q
Best companies 0.1665*
(0.091)
0.1780**
(0.074)
0.0585***
(0.021)
0.5264***
(0.192)
Firm size 0.1095***
(0.024)
0.0329
(0.027)
0.0019
(0.009)
-0.0767
(0.064)
Leverage 0.3141
(0.277)
0.2784
(0.233)
0.0322
(0.078)
-0.2789
(0.625)
Capex -1.0582
(0.859)
-1.8415**
(0.830)
0.5562***
(0.178)
8.5043***
(2.854)
R&D 1.1682*
(0.643)
0.6470
(0.717)
-0.2009
(0.289)
6.7603***
(2.525)
Employee option incentives 0.0355***
(0.009)
0.0311***
(0.008)
0.0014
(002)
0.0861***
(0.028)
Classified board -0.0256
(0.077)
-0.0656
(0.075)
-0.0011
(0.018)
0.0160
(0.175)
Board size -0.0214
(0.019)
-0.0272
(0.017)
0.0038
(0.004)
0.0805**
(0.040)
Managerial ownership -0.0001
(0.002)
-0.0003
(0.002)
0.0001
(0.001)
0.0027
(0.005)
Intercept 4.3390***
(0.210)
0.1571
(0.226)
0.0846
(0.085)
1.3869**
(0.646)
Adjusted R2 0.771 0.465 0.264 0.436
Sample size 704 697 704 704
These regressions exclude the first 3 years after a firm was named to the Fortune list. SLE is the natural log of net sales per
employee. TFP is the residual of industry-specific Cobb–Douglas production functions estimated for each two-digit SIC
group. ROA is the ratio of operating income to prior year’s total assets. Tobin’s q is the market value of common equity
plus the book values of preferred equity and long-term debt divided by the book value of assets. Best Companies equals one
for firms listed on Fortune magazine’s 100 Best Companies to Work for in America between 1998 and 2005, zero
otherwise. Firm Size is the natural log of total assets. Leverage is the ratio of long-term debt to total assets. Capex is the ratio
of capital expenditures to total assets. R&D is the ratio of R&D expenditures to total assets. Employee Option Incentives is the
change in the value of aggregate non-executive employee option portfolio for a $1 change in the firm’s stock price divided
by the number of employees. Classified Board equals one when directors are elected to staggered terms, zero otherwise.
Board Size is the number of directors. Managerial Ownership is the fraction of shares owned by officers and directors.
Control firms are selected on the basis of industry and average ROA during the 3 years preceding the Best Company’s
inclusion on the Fortune list. Regressions include industry and year dummies. Robust standard errors corrected for firm
level clustering are provided in parentheses under parameter estimates. Levels of significance are indicated by ***, **, and
* for 1, 5, and 10%, respectively
14 Olubunmi Faleye and Emery A. Trahan
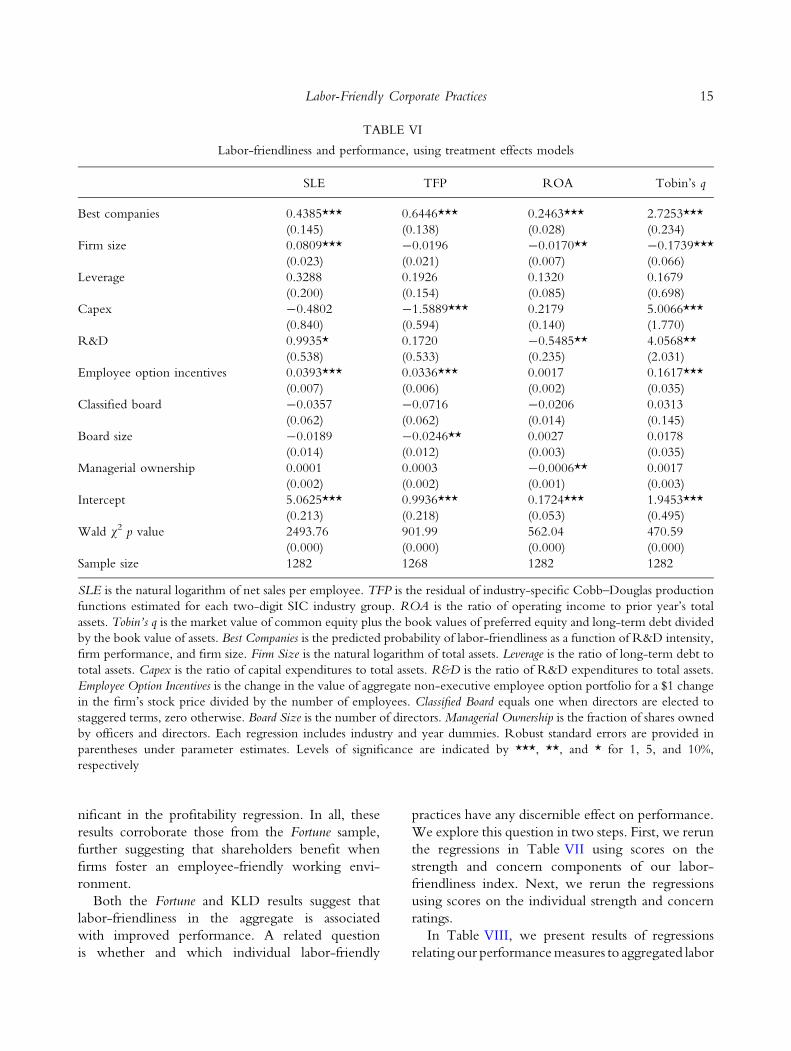
nificant in the profitability regression. In all, these
results corroborate those from the Fortune sample,
further suggesting that shareholders benefit when
firms foster an employee-friendly working envi-
ronment.
Both the Fortune and KLD results suggest that
labor-friendliness in the aggregate is associated
with improved performance. A related question
is whether and which individual labor-friendly
practices have any discernible effect on performance.
We explore this question in two steps. First, we rerun
the regressions in Table VII using scores on the
strength and concern components of our labor-
friendliness index. Next, we rerun the regressions
using scores on the individual strength and concern
ratings.
In Table VIII, we present results of regressions
relating our performance measures to aggregated labor
TABLE VI
Labor-friendliness and performance, using treatment effects models
SLE TFP ROA Tobin’s q
Best companies 0.4385***
(0.145)
0.6446***
(0.138)
0.2463***
(0.028)
2.7253***
(0.234)
Firm size 0.0809***
(0.023)
-0.0196
(0.021)
-0.0170**
(0.007)
-0.1739***
(0.066)
Leverage 0.3288
(0.200)
0.1926
(0.154)
0.1320
(0.085)
0.1679
(0.698)
Capex -0.4802
(0.840)
-1.5889***
(0.594)
0.2179
(0.140)
5.0066***
(1.770)
R&D 0.9935*
(0.538)
0.1720
(0.533)
-0.5485**
(0.235)
4.0568**
(2.031)
Employee option incentives 0.0393***
(0.007)
0.0336***
(0.006)
0.0017
(0.002)
0.1617***
(0.035)
Classified board -0.0357
(0.062)
-0.0716
(0.062)
-0.0206
(0.014)
0.0313
(0.145)
Board size -0.0189
(0.014)
-0.0246**
(0.012)
0.0027
(0.003)
0.0178
(0.035)
Managerial ownership 0.0001
(0.002)
0.0003
(0.002)
-0.0006**
(0.001)
0.0017
(0.003)
Intercept 5.0625***
(0.213)
0.9936***
(0.218)
0.1724***
(0.053)
1.9453***
(0.495)
Wald v2 p value 2493.76
(0.000)
901.99
(0.000)
562.04
(0.000)
470.59
(0.000)
Sample size 1282 1268 1282 1282
SLE is the natural logarithm of net sales per employee. TFP is the residual of industry-specific Cobb–Douglas production
functions estimated for each two-digit SIC industry group. ROA is the ratio of operating income to prior year’s total
assets. Tobin’s q is the market value of common equity plus the book values of preferred equity and long-term debt divided
by the book value of assets. Best Companies is the predicted probability of labor-friendliness as a function of R&D intensity,
firm performance, and firm size. Firm Size is the natural logarithm of total assets. Leverage is the ratio of long-term debt to
total assets. Capex is the ratio of capital expenditures to total assets. R&D is the ratio of R&D expenditures to total assets.
Employee Option Incentives is the change in the value of aggregate non-executive employee option portfolio for a $1 change
in the firm’s stock price divided by the number of employees. Classified Board equals one when directors are elected to
staggered terms, zero otherwise. Board Size is the number of directors. Managerial Ownership is the fraction of shares owned
by officers and directors. Each regression includes industry and year dummies. Robust standard errors are provided in
parentheses under parameter estimates. Levels of significance are indicated by ***, **, and * for 1, 5, and 10%,
respectively
15Labor-Friendly Corporate Practices
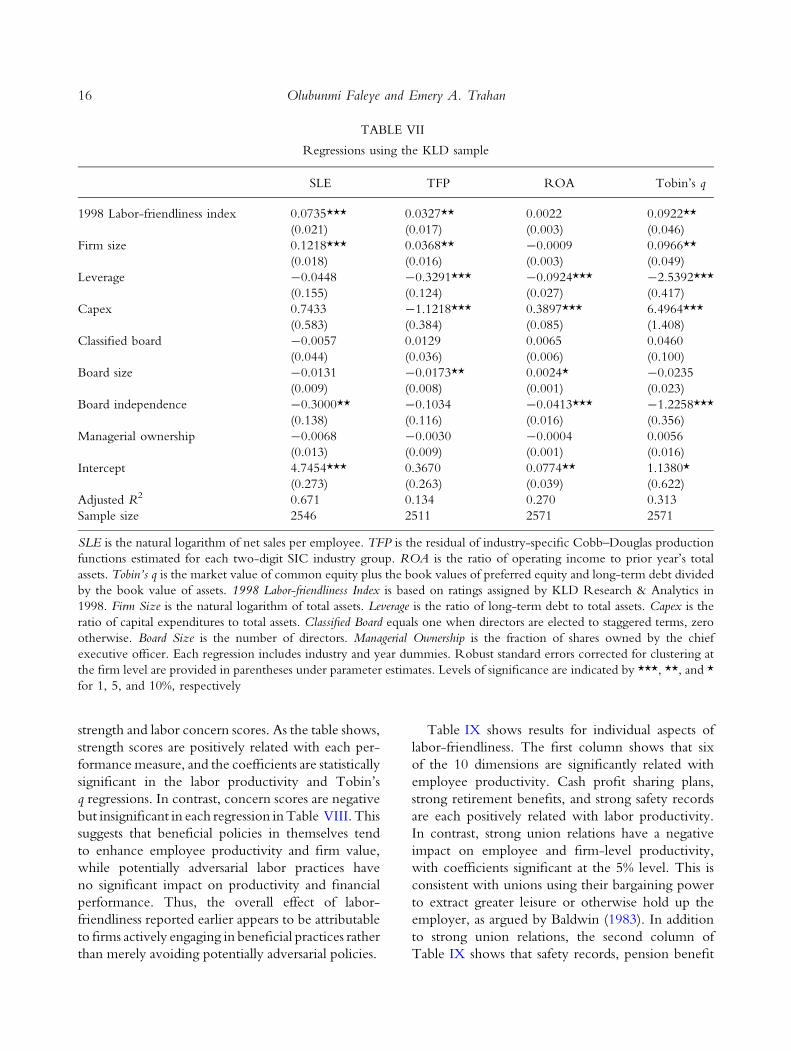
strength and labor concern scores. As the table shows,
strength scores are positively related with each per-
formance measure, and the coefficients are statistically
significant in the labor productivity and Tobin’s
q regressions. In contrast, concern scores are negative
but insignificant in each regression in Table VIII. This
suggests that beneficial policies in themselves tend
to enhance employee productivity and firm value,
while potentially adversarial labor practices have
no significant impact on productivity and financial
performance. Thus, the overall effect of labor-
friendliness reported earlier appears to be attributable
to firms actively engaging in beneficial practices rather
than merely avoiding potentially adversarial policies.
Table IX shows results for individual aspects of
labor-friendliness. The first column shows that six
of the 10 dimensions are significantly related with
employee productivity. Cash profit sharing plans,
strong retirement benefits, and strong safety records
are each positively related with labor productivity.
In contrast, strong union relations have a negative
impact on employee and firm-level productivity,
with coefficients significant at the 5% level. This is
consistent with unions using their bargaining power
to extract greater leisure or otherwise hold up the
employer, as argued by Baldwin (1983). In addition
to strong union relations, the second column of
Table IX shows that safety records, pension benefit
TABLE VII
Regressions using the KLD sample
SLE TFP ROA Tobin’s q
1998 Labor-friendliness index 0.0735***
(0.021)
0.0327**
(0.017)
0.0022
(0.003)
0.0922**
(0.046)
Firm size 0.1218***
(0.018)
0.0368**
(0.016)
-0.0009
(0.003)
0.0966**
(0.049)
Leverage -0.0448
(0.155)
-0.3291***
(0.124)
-0.0924***
(0.027)
-2.5392***
(0.417)
Capex 0.7433
(0.583)
-1.1218***
(0.384)
0.3897***
(0.085)
6.4964***
(1.408)
Classified board -0.0057
(0.044)
0.0129
(0.036)
0.0065
(0.006)
0.0460
(0.100)
Board size -0.0131
(0.009)
-0.0173**
(0.008)
0.0024*
(0.001)
-0.0235
(0.023)
Board independence -0.3000**
(0.138)
-0.1034
(0.116)
-0.0413***
(0.016)
-1.2258***
(0.356)
Managerial ownership -0.0068
(0.013)
-0.0030
(0.009)
-0.0004
(0.001)
0.0056
(0.016)
Intercept 4.7454***
(0.273)
0.3670
(0.263)
0.0774**
(0.039)
1.1380*
(0.622)
Adjusted R2 0.671 0.134 0.270 0.313
Sample size 2546 2511 2571 2571
SLE is the natural logarithm of net sales per employee. TFP is the residual of industry-specific Cobb–Douglas production
functions estimated for each two-digit SIC industry group. ROA is the ratio of operating income to prior year’s total
assets. Tobin’s q is the market value of common equity plus the book values of preferred equity and long-term debt divided
by the book value of assets. 1998 Labor-friendliness Index is based on ratings assigned by KLD Research & Analytics in
1998. Firm Size is the natural logarithm of total assets. Leverage is the ratio of long-term debt to total assets. Capex is the
ratio of capital expenditures to total assets. Classified Board equals one when directors are elected to staggered terms, zero
otherwise. Board Size is the number of directors. Managerial Ownership is the fraction of shares owned by the chief
executive officer. Each regression includes industry and year dummies. Robust standard errors corrected for clustering at
the firm level are provided in parentheses under parameter estimates. Levels of significance are indicated by ***, **, and *
for 1, 5, and 10%, respectively
16 Olubunmi Faleye and Emery A. Trahan
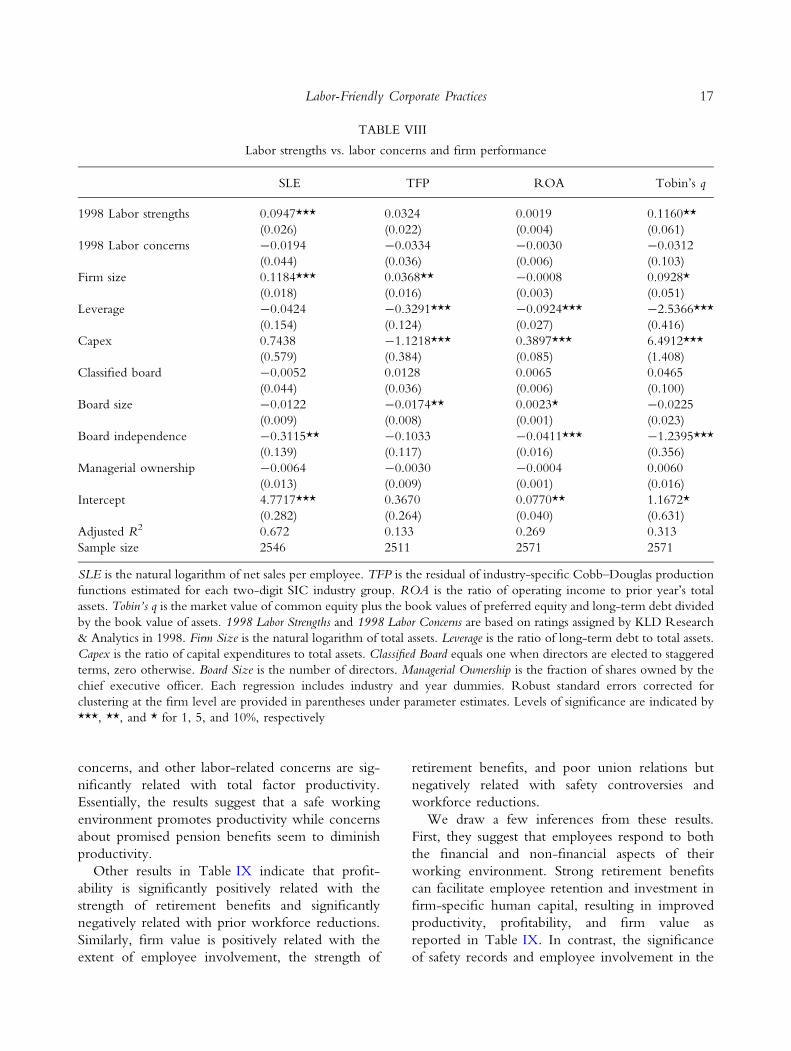
concerns, and other labor-related concerns are sig-
nificantly related with total factor productivity.
Essentially, the results suggest that a safe working
environment promotes productivity while concerns
about promised pension benefits seem to diminish
productivity.
Other results in Table IX indicate that profit-
ability is significantly positively related with the
strength of retirement benefits and significantly
negatively related with prior workforce reductions.
Similarly, firm value is positively related with the
extent of employee involvement, the strength of
retirement benefits, and poor union relations but
negatively related with safety controversies and
workforce reductions.
We draw a few inferences from these results.
First, they suggest that employees respond to both
the financial and non-financial aspects of their
working environment. Strong retirement benefits
can facilitate employee retention and investment in
firm-specific human capital, resulting in improved
productivity, profitability, and firm value as
reported in Table IX. In contrast, the significance
of safety records and employee involvement in the
TABLE VIII
Labor strengths vs. labor concerns and firm performance
SLE TFP ROA Tobin’s q
1998 Labor strengths 0.0947***
(0.026)
0.0324
(0.022)
0.0019
(0.004)
0.1160**
(0.061)
1998 Labor concerns -0.0194
(0.044)
-0.0334
(0.036)
-0.0030
(0.006)
-0.0312
(0.103)
Firm size 0.1184***
(0.018)
0.0368**
(0.016)
-0.0008
(0.003)
0.0928*
(0.051)
Leverage -0.0424
(0.154)
-0.3291***
(0.124)
-0.0924***
(0.027)
-2.5366***
(0.416)
Capex 0.7438
(0.579)
-1.1218***
(0.384)
0.3897***
(0.085)
6.4912***
(1.408)
Classified board -0.0052
(0.044)
0.0128
(0.036)
0.0065
(0.006)
0.0465
(0.100)
Board size -0.0122
(0.009)
-0.0174**
(0.008)
0.0023*
(0.001)
-0.0225
(0.023)
Board independence -0.3115**
(0.139)
-0.1033
(0.117)
-0.0411***
(0.016)
-1.2395***
(0.356)
Managerial ownership -0.0064
(0.013)
-0.0030
(0.009)
-0.0004
(0.001)
0.0060
(0.016)
Intercept 4.7717***
(0.282)
0.3670
(0.264)
0.0770**
(0.040)
1.1672*
(0.631)
Adjusted R2 0.672 0.133 0.269 0.313
Sample size 2546 2511 2571 2571
SLE is the natural logarithm of net sales per employee. TFP is the residual of industry-specific Cobb–Douglas production
functions estimated for each two-digit SIC industry group. ROA is the ratio of operating income to prior year’s total
assets. Tobin’s q is the market value of common equity plus the book values of preferred equity and long-term debt divided
by the book value of assets. 1998 Labor Strengths and 1998 Labor Concerns are based on ratings assigned by KLD Research
& Analytics in 1998. Firm Size is the natural logarithm of total assets. Leverage is the ratio of long-term debt to total assets.
Capex is the ratio of capital expenditures to total assets. Classified Board equals one when directors are elected to staggered
terms, zero otherwise. Board Size is the number of directors. Managerial Ownership is the fraction of shares owned by the
chief executive officer. Each regression includes industry and year dummies. Robust standard errors corrected for
clustering at the firm level are provided in parentheses under parameter estimates. Levels of significance are indicated by
***, **, and * for 1, 5, and 10%, respectively
17Labor-Friendly Corporate Practices
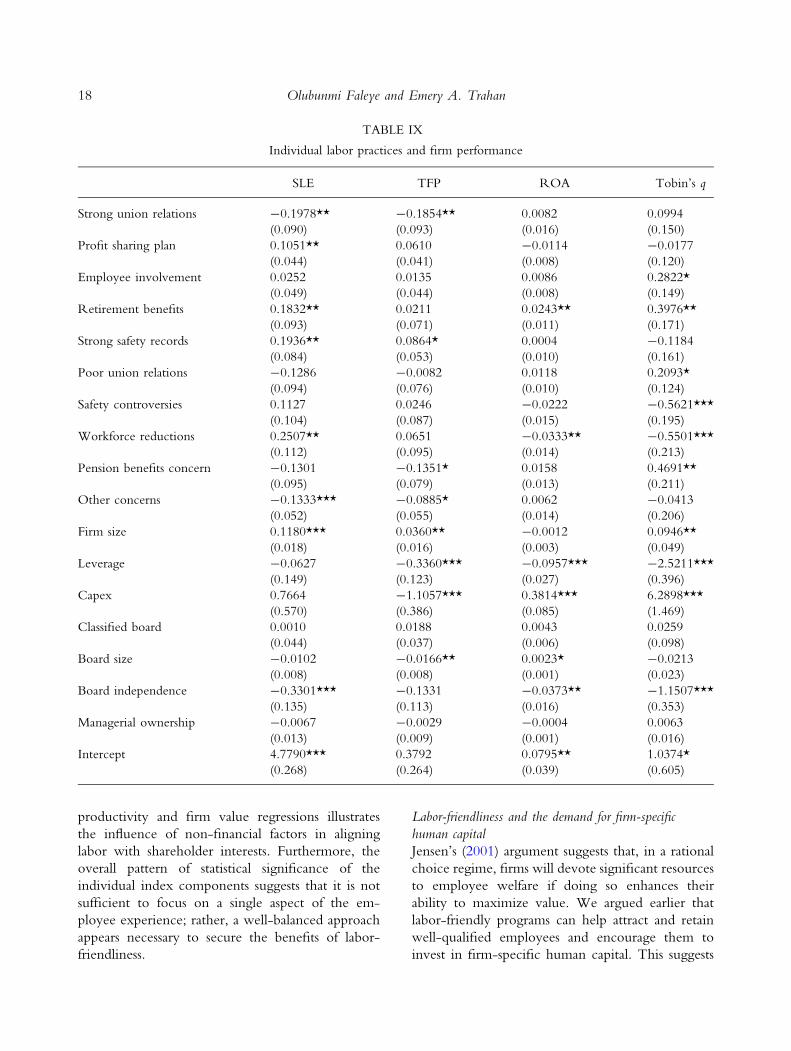
productivity and firm value regressions illustrates
the influence of non-financial factors in aligning
labor with shareholder interests. Furthermore, the
overall pattern of statistical significance of the
individual index components suggests that it is not
sufficient to focus on a single aspect of the em-
ployee experience; rather, a well-balanced approach
appears necessary to secure the benefits of labor-
friendliness.
Labor-friendliness and the demand for firm-specific
human capital
Jensen’s (2001) argument suggests that, in a rational
choice regime, firms will devote significant resources
to employee welfare if doing so enhances their
ability to maximize value. We argued earlier that
labor-friendly programs can help attract and retain
well-qualified employees and encourage them to
invest in firm-specific human capital. This suggests
TABLE IX
Individual labor practices and firm performance
SLE TFP ROA Tobin’s q
Strong union relations -0.1978**
(0.090)
-0.1854**
(0.093)
0.0082
(0.016)
0.0994
(0.150)
Profit sharing plan 0.1051**
(0.044)
0.0610
(0.041)
-0.0114
(0.008)
-0.0177
(0.120)
Employee involvement 0.0252
(0.049)
0.0135
(0.044)
0.0086
(0.008)
0.2822*
(0.149)
Retirement benefits 0.1832**
(0.093)
0.0211
(0.071)
0.0243**
(0.011)
0.3976**
(0.171)
Strong safety records 0.1936**
(0.084)
0.0864*
(0.053)
0.0004
(0.010)
-0.1184
(0.161)
Poor union relations -0.1286
(0.094)
-0.0082
(0.076)
0.0118
(0.010)
0.2093*
(0.124)
Safety controversies 0.1127
(0.104)
0.0246
(0.087)
-0.0222
(0.015)
-0.5621***
(0.195)
Workforce reductions 0.2507**
(0.112)
0.0651
(0.095)
-0.0333**
(0.014)
-0.5501***
(0.213)
Pension benefits concern -0.1301
(0.095)
-0.1351*
(0.079)
0.0158
(0.013)
0.4691**
(0.211)
Other concerns -0.1333***
(0.052)
-0.0885*
(0.055)
0.0062
(0.014)
-0.0413
(0.206)
Firm size 0.1180***
(0.018)
0.0360**
(0.016)
-0.0012
(0.003)
0.0946**
(0.049)
Leverage -0.0627
(0.149)
-0.3360***
(0.123)
-0.0957***
(0.027)
-2.5211***
(0.396)
Capex 0.7664
(0.570)
-1.1057***
(0.386)
0.3814***
(0.085)
6.2898***
(1.469)
Classified board 0.0010
(0.044)
0.0188
(0.037)
0.0043
(0.006)
0.0259
(0.098)
Board size -0.0102
(0.008)
-0.0166**
(0.008)
0.0023*
(0.001)
-0.0213
(0.023)
Board independence -0.3301***
(0.135)
-0.1331
(0.113)
-0.0373**
(0.016)
-1.1507***
(0.353)
Managerial ownership -0.0067
(0.013)
-0.0029
(0.009)
-0.0004
(0.001)
0.0063
(0.016)
Intercept 4.7790***
(0.268)
0.3792
(0.264)
0.0795**
(0.039)
1.0374*
(0.605)
18 Olubunmi Faleye and Emery A. Trahan
a positive relation between labor-friendliness and
the extent to which a firm depends on highly
skilled employees who must invest in idiosyncratic
human capital. It also suggests that such firms de-
rive the most benefit from engaging in labor-
friendly practices. We explore these issues in this
section.
We measure the demand for highly skilled
employees using the ratio of R&D expenditures to
total assets. The intuition is that R&D-intensive
firms depend on highly skilled workers because of
the technical expertise required to reap the risky
firm-specific payoffs associated with R&D expen-
ditures. We calculate average R&D/assets for each
Best Company over the 3 years preceding its year of
membership on the list and do the same for its
matching firm over the same period.
Consistent with our hypothesis, we find that firms
on the Fortune list invest significantly more in R&D
than similar firms in the same industry. Average and
median historical R&D/assets for the Best Compa-
nies are 5.74 and 3.07%, respectively, compared to
3.65 and 0.09% for the control sample. Both dif-
ferences are statistically significant at the 1% level.
We then estimate regressions predicting labor-
friendliness as a function of R&D intensity and other
firm-specific characteristics including profitability,
firm size, availability of investment opportunities,
and leverage. We control for industry differences
with two-digit SIC code dummies. Results indicate
that the likelihood of labor-friendliness increases
with R&D intensity. None of the other variables
(with the exception of firm size, which is significant
at the 10% level) is statistically significant. Results
TABLE IX
continued
SLE TFP ROA Tobin’s q
Adjusted R2 0.682 0.144 0.284 0.334
Sample size 2546 2511 2571 2571
SLE is the natural logarithm of net sales per employee. TFP is the residual of industry-specific Cobb–Douglas production
functions estimated for each two-digit SIC industry group. ROA is the ratio of operating income to total assets. Tobin’s q is
the market value of common equity plus the book values of preferred equity and long-term debt divided by the book
value of assets. Strong Union Relations equals one if the company has taken exceptional steps to treat its unionized
workforce fairly, zero otherwise. Profit Sharing equals one if the company has a cash profit-sharing program through which
it has recently made distributions to a majority of its workforce. Employee Involvement equals one if the company strongly
encourages worker involvement and/or ownership through stock options available to a majority of its employees, gain
sharing, stock ownership, sharing of financial information, or participation in management decision-making. Retirement
Benefits equals one if the company has a notably strong retirement benefits program. Strong Safety Records equals one if the
company has a good employee safety record or demonstrates other noteworthy commitments to its employees’ well being.
Poor Union Relations equals one if the company has a history of notably poor union relations, zero otherwise. Safety
Controversies equals one if the company recently has either paid substantial fines or civil penalties for willful violations of
employee health and safety standards, or has been otherwise involved in major health and safety controversies, zero
otherwise. Workforce Reductions equals one if the company has reduced its workforce by 15% in the most recent year or by
25% during the past 2 years, or it has announced plans for such reductions, zero otherwise. Pension Benefits Concern equals
one if the company has either a substantially underfunded defined benefit pension plan, or an inadequate retirement
benefits program, zero otherwise. Other Concerns equals one if the company has a notable employee problem not addressed
by the other specific rating categories. These ratings are assigned by KLD Research & Analytics and are for 1998. Firm Size
is the natural logarithm of total assets. Leverage is the ratio of long-term debt to total assets. Capex is the ratio of capital
expenditures to total assets. Classified Board equals one when directors are elected to staggered terms, zero otherwise. Board
Size is the number of directors. Board Independence is the fraction of independent directors. Managerial Ownership is the
fraction of shares owned by the chief executive officer. Each regression includes industry and year dummies. Robust
standard errors corrected for clustering at the firm level are provided in parentheses under parameter estimates. Levels of
significance are indicated by ***, **, and * for 1, 5, and 10%, respectively
19Labor-Friendly Corporate Practices
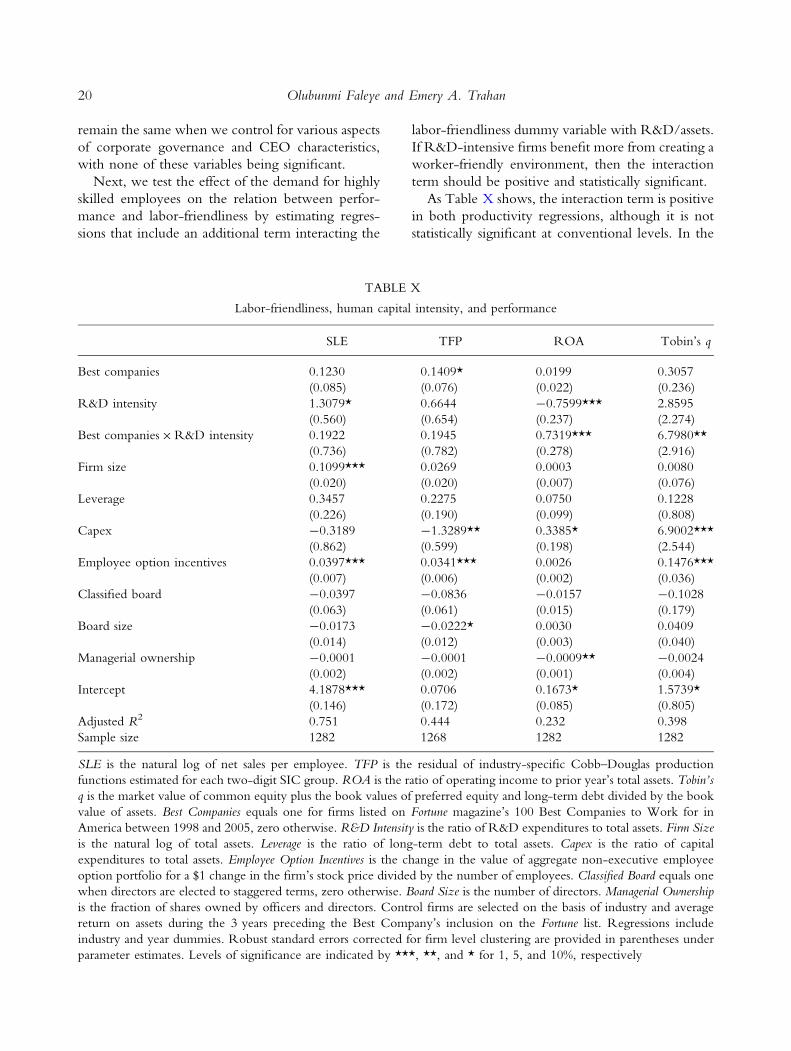
remain the same when we control for various aspects
of corporate governance and CEO characteristics,
with none of these variables being significant.
Next, we test the effect of the demand for highly
skilled employees on the relation between perfor-
mance and labor-friendliness by estimating regres-
sions that include an additional term interacting the
labor-friendliness dummy variable with R&D/assets.
If R&D-intensive firms benefit more from creating a
worker-friendly environment, then the interaction
term should be positive and statistically significant.
As Table X shows, the interaction term is positive
in both productivity regressions, although it is not
statistically significant at conventional levels. In the
TABLE X
Labor-friendliness, human capital intensity, and performance
SLE TFP ROA Tobin’s q
Best companies 0.1230
(0.085)
0.1409*
(0.076)
0.0199
(0.022)
0.3057
(0.236)
R&D intensity 1.3079*
(0.560)
0.6644
(0.654)
-0.7599***
(0.237)
2.8595
(2.274)
Best companies 9 R&D intensity 0.1922
(0.736)
0.1945
(0.782)
0.7319***
(0.278)
6.7980**
(2.916)
Firm size 0.1099***
(0.020)
0.0269
(0.020)
0.0003
(0.007)
0.0080
(0.076)
Leverage 0.3457
(0.226)
0.2275
(0.190)
0.0750
(0.099)
0.1228
(0.808)
Capex -0.3189
(0.862)
-1.3289**
(0.599)
0.3385*
(0.198)
6.9002***
(2.544)
Employee option incentives 0.0397***
(0.007)
0.0341***
(0.006)
0.0026
(0.002)
0.1476***
(0.036)
Classified board -0.0397
(0.063)
-0.0836
(0.061)
-0.0157
(0.015)
-0.1028
(0.179)
Board size -0.0173
(0.014)
-0.0222*
(0.012)
0.0030
(0.003)
0.0409
(0.040)
Managerial ownership -0.0001
(0.002)
-0.0001
(0.002)
-0.0009**
(0.001)
-0.0024
(0.004)
Intercept 4.1878***
(0.146)
0.0706
(0.172)
0.1673*
(0.085)
1.5739*
(0.805)
Adjusted R2 0.751 0.444 0.232 0.398
Sample size 1282 1268 1282 1282
SLE is the natural log of net sales per employee. TFP is the residual of industry-specific Cobb–Douglas production
functions estimated for each two-digit SIC group. ROA is the ratio of operating income to prior year’s total assets. Tobin’s
q is the market value of common equity plus the book values of preferred equity and long-term debt divided by the book
value of assets. Best Companies equals one for firms listed on Fortune magazine’s 100 Best Companies to Work for in
America between 1998 and 2005, zero otherwise. R&D Intensity is the ratio of R&D expenditures to total assets. Firm Size
is the natural log of total assets. Leverage is the ratio of long-term debt to total assets. Capex is the ratio of capital
expenditures to total assets. Employee Option Incentives is the change in the value of aggregate non-executive employee
option portfolio for a $1 change in the firm’s stock price divided by the number of employees. Classified Board equals one
when directors are elected to staggered terms, zero otherwise. Board Size is the number of directors. Managerial Ownership
is the fraction of shares owned by officers and directors. Control firms are selected on the basis of industry and average
return on assets during the 3 years preceding the Best Company’s inclusion on the Fortune list. Regressions include
industry and year dummies. Robust standard errors corrected for firm level clustering are provided in parentheses under
parameter estimates. Levels of significance are indicated by ***, **, and * for 1, 5, and 10%, respectively
20 Olubunmi Faleye and Emery A. Trahan
profitability regression in contrast, the interaction
term is positive and significant at the 1% level, while
the main effect is not. In terms of economic signif-
icance, operating profitability increases by (a statis-
tically insignificant) 2.0 percentage points for the
labor-friendly firm with no R&D investments but
by 5.1 percentage points for the labor-friendly firm
with average investments in R&D. We obtain sim-
ilar results for firm value: the interaction term is
positive and significant at the 5% level while the
main effect is statistically insignificant.
Overall, our results suggest that R&D-intensive
firms, whose success depends more on the ability to
attract and retain high quality human capital, are
more likely to engage in labor-friendly practices and
tend to benefit more from such practices. This is in
the same spirit as Fisman et al. (2005) who find that
community-oriented socially responsible behavior
mainly benefits firms in competitive product mar-
kets where success depends on a favorable public
image.
Possible managerial self-interest motives
The results in ‘‘Operating performance’’ section
above suggest that labor-friendly policies are adopted
for economic reasons. In this section, we explicitly
consider the possibility that management can also
pursue labor-friendly practices to protect its self-
interest by analyzing the impact of labor-friendly
practices on excess managerial compensation.
We define three measures of executive pay: salary,
cash compensation, and total compensation. Cash
compensation is the sum of salary and bonus, while
total compensation includes salary, bonus, the value
of stock options and restricted stock granted during
the year, long-term incentive payouts, and other
miscellaneous annual compensation amounts. These
measures are based on data from Standard and Poor’s
Execucomp database.
Similar to Berger et al. (1997), we calculate excess
CEO compensation using residuals from the fol-
lowing regression that predicts normal compensation
as a function of firm size, market performance,
operating performance, and CEO tenure. Each
regression includes industry and year dummies and is
estimated over all firms in the Execucomp panel.
The subscripts i and t refer to individual firms and
years, respectively.
CEO Compensationi;t ¼ aþ b1 Salesi;t
þ b2 Market Returni;t�1 þ b3 Return on Assetsi;t�1
þ b4 Years as CEOi;t þ c0 Industry Dummiesi
þ /0 Year Dummiest þ ei;t ð1Þ
We recognize that other factors may affect excess
CEO compensation. In particular, it is plausible that
the CEO’s ability to secure excessive compensation
depends on the strength of the firm’s monitoring
mechanisms. Core et al. (1999) show that the level of
CEO compensation is significantly related to board
of director characteristics and ownership structure.
Therefore, we estimate regressions controlling for
variables related to the firm’s corporate governance
structure, including board size, board composition,
CEO duality, the number of external boards on
which the CEO serves, managerial equity ownership,
and CEO age. Each regression also controls for firm
size, leverage, and performance (as measured by
Tobin’s q) as well as industry and year dummies.
Standard errors are clustered at the firm level.
As the third column of Table XI shows, the la-
bor-friendliness variable is negative, albeit statistically
insignificant, in the regression for excess total com-
pensation. The first and second columns show sim-
ilar results for salary and cash compensation. Thus,
the evidence is inconsistent with labor-friendly
CEOs enjoying excessive pay. Rather, it appears that
these CEOs extract similar rents as do their peers at
comparable firms.
These results suggest that management derives no
significant pecuniary benefits from engaging in la-
bor-friendly practices, which complements our ear-
lier findings and lends additional support to the
hypothesis that these practices are adopted to en-
hance shareholder wealth, rather than as a means of
satisfying managerial self-interest motives.
Conclusions
In a recent interview with the Financial Times, Jack
Welch, who was CEO of the General Electric
Company for 20 years, stated that, ‘‘On the face of
it, shareholder value is the dumbest idea in the
world. Shareholder value is a result, not a strat-
21Labor-Friendly Corporate Practices
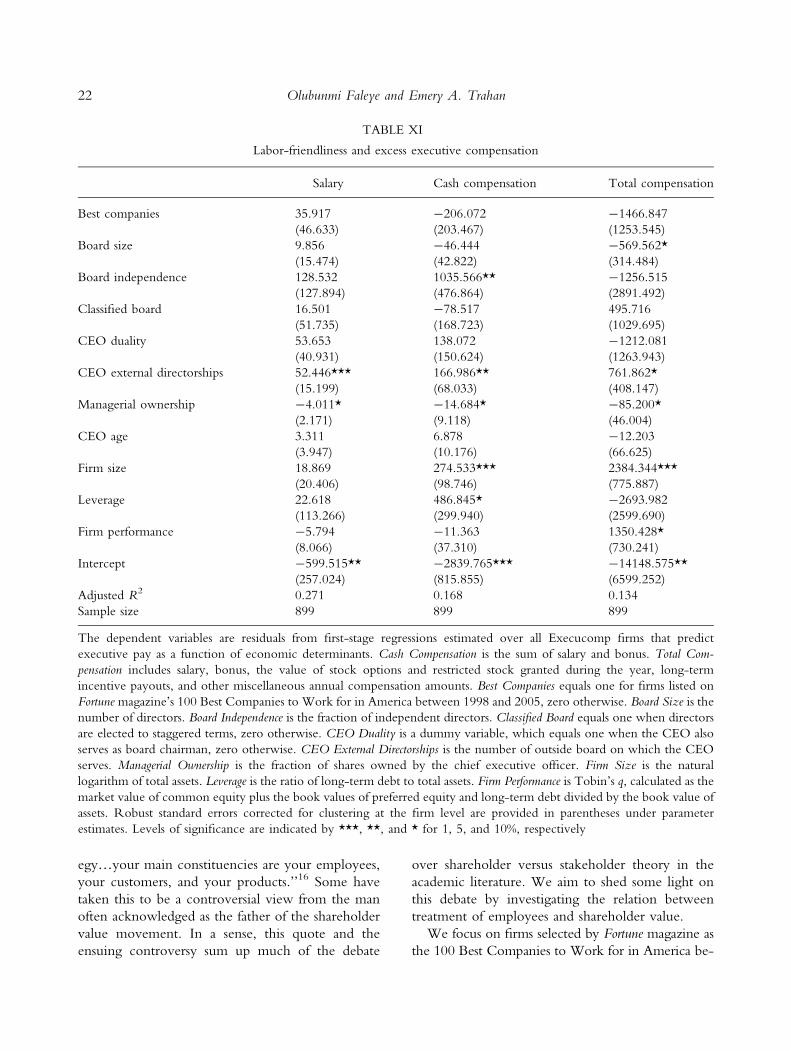
egy…your main constituencies are your employees,
your customers, and your products.’’16 Some have
taken this to be a controversial view from the man
often acknowledged as the father of the shareholder
value movement. In a sense, this quote and the
ensuing controversy sum up much of the debate
over shareholder versus stakeholder theory in the
academic literature. We aim to shed some light on
this debate by investigating the relation between
treatment of employees and shareholder value.
We focus on firms selected by Fortune magazine as
the 100 Best Companies to Work for in America be-
TABLE XI
Labor-friendliness and excess executive compensation
Salary Cash compensation Total compensation
Best companies 35.917
(46.633)
-206.072
(203.467)
-1466.847
(1253.545)
Board size 9.856
(15.474)
-46.444
(42.822)
-569.562*
(314.484)
Board independence 128.532
(127.894)
1035.566**
(476.864)
-1256.515
(2891.492)
Classified board 16.501
(51.735)
-78.517
(168.723)
495.716
(1029.695)
CEO duality 53.653
(40.931)
138.072
(150.624)
-1212.081
(1263.943)
CEO external directorships 52.446***
(15.199)
166.986**
(68.033)
761.862*
(408.147)
Managerial ownership -4.011*
(2.171)
-14.684*
(9.118)
-85.200*
(46.004)
CEO age 3.311
(3.947)
6.878
(10.176)
-12.203
(66.625)
Firm size 18.869
(20.406)
274.533***
(98.746)
2384.344***
(775.887)
Leverage 22.618
(113.266)
486.845*
(299.940)
-2693.982
(2599.690)
Firm performance -5.794
(8.066)
-11.363
(37.310)
1350.428*
(730.241)
Intercept -599.515**
(257.024)
-2839.765***
(815.855)
-14148.575**
(6599.252)
Adjusted R2 0.271 0.168 0.134
Sample size 899 899 899
The dependent variables are residuals from first-stage regressions estimated over all Execucomp firms that predict
executive pay as a function of economic determinants. Cash Compensation is the sum of salary and bonus. Total Com-
pensation includes salary, bonus, the value of stock options and restricted stock granted during the year, long-term
incentive payouts, and other miscellaneous annual compensation amounts. Best Companies equals one for firms listed on
Fortune magazine’s 100 Best Companies to Work for in America between 1998 and 2005, zero otherwise. Board Size is the
number of directors. Board Independence is the fraction of independent directors. Classified Board equals one when directors
are elected to staggered terms, zero otherwise. CEO Duality is a dummy variable, which equals one when the CEO also
serves as board chairman, zero otherwise. CEO External Directorships is the number of outside board on which the CEO
serves. Managerial Ownership is the fraction of shares owned by the chief executive officer. Firm Size is the natural
logarithm of total assets. Leverage is the ratio of long-term debt to total assets. Firm Performance is Tobin’s q, calculated as the
market value of common equity plus the book values of preferred equity and long-term debt divided by the book value of
assets. Robust standard errors corrected for clustering at the firm level are provided in parentheses under parameter
estimates. Levels of significance are indicated by ***, **, and * for 1, 5, and 10%, respectively
22 Olubunmi Faleye and Emery A. Trahan
tween1998 and 2005 to understand how labor-friendly
corporate practices affect shareholder outcomes. We
find significantly positive announcement returns, sug-
gesting that the market values corporate concern for
workers. We also find that companies selected for the
list subsequently outperform comparable firms in terms
of long-run stock returns, productivity, profitability,
and value creation. Thus, it appears that the positive
announcement returns capitalize subsequently higher
productivity as well as superior operating profitability.
We obtain similar results using a different sample based
on the SOCRATES database supplied by KLD
Research & Analytics.
Our results also provide economic rationale for
engaging in labor-friendly practices. We find that
R&D-intensive firms are more likely to be labor-
friendly and that the benefits accrue mostly to these
firms. We do not find that top management derives
significant personal benefits in the form of excessive
pay from labor-friendly practices. We interpret our
results as consistent with a genuine concern for
employees translating into higher productivity and
profitability, which in turn facilitate value creation.
It appears that the benefits of labor-friendly practices
significantly outweigh the costs and that what is
good for employees is good for shareholders.
It is noteworthy that our results are not incon-
sistent with the recent views expressed by Jack
Welch. During Welch’s tenure at GE, he aggres-
sively focused on introducing six-sigma (the relent-
less pursuit of quality) and on training and
developing the best employees. This focus on non-
shareholder stakeholders was Welch’s strategy for
building sustainable competitive advantage, leading
to the result of increased shareholder value.
The question of whether what is good for employees is
good for shareholders raises many complex issues. While
we address this question and provide evidence to
support the conclusion that the benefits of labor-
friendly practices significantly outweigh the costs and
that what is good for employees is good for share-
holders, many unanswered issues in the theoretical
and empirical debates surrounding stakeholder,
agency, and organizational theory remain. Donaldson
and Preston (1995) argue that stakeholder theory is
used in a number of ways that are distinct and use
different methodologies, types of evidence, and cri-
teria or appraisal. They identify descriptive/empirical,
instrumental, and normative aspects of stakeholder
theory. Here, we partially address descriptive/
empirical issues (the labor-friendliness of different
firms) and instrumental issues (connections between
stakeholder management and firm performance),
without contributing to the normative (firms should
consider stakeholder interests regardless of impact on
stockholders) debate. We also provide some evidence
relative to the principal-agent area of agency theory
pertaining to employer–employee issues, as opposed
to the positivist area which focuses more on share-
holder/manager issues (Eisenhardt, 1989). While we
provide a discussion of the shareholder/labor link and
empirical support for the consistency of the interests,
there is a need for more theoretical and empirical
work in these areas. While we suggest some ways that
employee-friendly policies link to firm performance
(e.g., improved employee commitment, reduced
rates of absenteeism, voluntary turnover, and attri-
tion, and improved productivity), there is room to
more carefully examine these linkages. Future re-
search may examine the causal relations between
employee-friendly policies and firm performance in
more detail using methods that examine the inner
workings of individual firms.
Our results provide empirical support for the
conclusions, but certain caveats apply. One is the
issue of measurement of employee friendliness.
McGuire et al. (1988) utilize a different type of
Fortune data and note that the validity and appro-
priateness of the measure requires further examina-
tion. This is also true for our employee friendliness
measures from Fortune. We mitigate this concern by
using a different labor-friendliness dataset from KLD
and find that our results are robust to the choice of
data set. Another empirical issue is that of causality
or endogeneity. McGuire et al. (1988), for example,
find that financial performance is more likely to
influence future CSR than social responsibility is to
influence future financial performance. Similar
concerns apply to the labor-friendliness – perfor-
mance relation. We attempt to control for endoge-
neity concerns through a variety of techniques. We
select control firms matched to our labor-friendly
firms, including a match on prior performance, using
each of our measures of company performance. We
include each firm and its match from the first year it
appears on the Fortune list to the end of our analysis
window. We also follow the approach of Bebchuk
and Cohen (2005) and others and exclude data for
23Labor-Friendly Corporate Practices
the first 3 years after a firm was named to the Fortune
list, and find robust results. We also follow the ap-
proach used in Faleye et al. (2006) and include
performance variables around the event (naming to
the Fortune list) as control variables. Again the results
are robust. Finally, we estimate a two-stage treat-
ment effects model and obtain robust results. While
reverse causality is always a concern, we have taken
several steps to address the issue and believe that our
results are not driven by a reverse causality story.
Stakeholder and agency issues relating to organiza-
tional theory and a firm’s contracting with non-
shareholder stakeholders continue to be a contentious
area in the theoretical and empirical literature. While
more research in this area is warranted, we attempt here
to investigate in a rigorousmanner the relation between
labor-friendliness and company performance. Our
findings are consistent with the notion that what is
good for employees is good for shareholders.
Notes
1 ‘‘The 100 Best Companies to Work for in Amer-
ica,’’ by Robert Levering, et al., Fortune, Jan. 12, 1998,
p. 84.2 ‘‘Businesses’ family policies pay dividends,’’ by
Amy Geisel, The Knoxville News-Sentinel, Sept. 18,
1996, p. B1.3 Donaldson and Preston (1995) provide a compre-
hensive discussion of stakeholder theory.4 Eisenhardt (1989) provides a comprehensive discus-
sion of agency theory.5 See, for example, Friedman (1962, 1970), Fama
and Jensen (1983), and Jensen (2001, 2002).6 ‘‘Put Investors in their Place: Why Pander to Peo-
ple who Now Hold Shares, on Average, Less than 10
Months?’’ by Clayton M. Christensen and Scott D. An-
thony, Business Week, May 28, 2007.7 While employee equity ownership is often sug-
gested for this purpose, the empirical evidence is mixed
at best. For example, see Beatty (1995), Lougee (1999),
and Faleye et al. (2006).8 Eisenhardt (1989) notes that the use of multiple
theories is often appropriate given the complexity of
organizations. This is also consistent with Hirsch et al.
(1987), Sharplin and Phelps (1989), Hill and Jones
(1992), and Donaldson and Preston (1995).9 Commenting on the recently implemented com-
pensation disclosure rules, Mark Reilly, a partner at
Chicago-based Compensation Consulting Consortium,
argues that many firms are cutting back on executive
perks to reduce the likelihood of employee protests.
This suggests that management cares about workers’
opinion on executive compensation. The issue is, he
says, ‘‘How will our employees and shareowners per-
ceive these perquisites? It just sort of provides ammuni-
tion to employee groups and unions to attack your pay
policy.’’ The Wall Street Journal, January 13, 2007, p.
A6.10 According to Fortune, ‘‘we rely on two things: our
evaluation of the policies and culture of each company
and the opinions of the company’s own employees. We
give the latter more weight: Two-thirds of the total
score comes from employee responses to a 57-question
survey …. The survey goes to a minimum of 400 ran-
domly selected employees from each company and asks
about things such as attitudes toward management, job
satisfaction, and camaraderie. The remaining third of
the score comes from our evaluation of each company’s
demographic makeup, pay and benefits programs, and
the like. We score companies in four areas: credibility
(communication to employees), respect (opportunities
and benefits), fairness (compensation, diversity), and
pride/camaraderie (philanthropy, celebrations).’’ January
23, 2006, p. 89.11 These examples are taken from various annual For-
tune issues announcing the 100 Best Companies.12 According to its website, KLD ‘‘uses a two-step
screening process for selecting companies for the
DS400. KLD first excludes from consideration compa-
nies involved in alcohol, tobacco, firearms, gambling,
nuclear power and military-weapons beyond specified
revenue thresholds. These companies are not eligible
regardless of other social and environmental attributes of
these companies. From the remaining universe of com-
panies in the Russell 3000, KLD selects companies for
the DS400 that have positive ESG (environmental, so-
cial and governance) records based on the following is-
sues: environmental stewardship, community relations,
diversity, employee relations, human rights, product
quality and safety, and corporate governance.’’13 Including subsequent appearances for repeat list
members does not change our findings. Changes in
rankings also do not impact our results. Furthermore,
when we examine the market impact of firms being
dropped from the Fortune list, we find no significant ef-
fect. This is not surprising, as firms do not necessarily
become labor-unfriendly when dropped from the list. A
positive reaction for additions to the list but no signifi-
cant impact for deletions is consistent with Chen et al.
(2004) who find positive price responses for additions to
the S&P 500 index but no significant price impacts for
deletions.
24 Olubunmi Faleye and Emery A. Trahan
14 As a robustness check, we create separate matched
samples based on each operating performance measure.
For example, for our Tobin’s q tests, we match the For-
tune firms based on industry, firm size, and prior To-
bin’s q. Results for these samples are similar to those
reported here and are not tabulated due to space con-
siderations.15 Autor et al. (1997) examine the impact of state
employment law on wages and employment.16 ‘‘Welch Rues Short-Term Profit Obsession,’’ by
Francesco Guerrera, Financial Times, March 12, 2009.
Acknowledgments
We gratefully acknowledge comments and suggestions
from seminar participants at the Australian Graduate
School of Management, University of Virginia, Univer-
sity of Pittsburgh, Purdue University, University of Iowa,
York University, University of South Carolina, and the
Center for Institutional Investment Management at the
University at Albany. We also acknowledge helpful
comments and suggestions from Michael Lemmon (FMA
discussant), Thomas Clarke (the Editor), and two anony-
mous referees.
References
Agle, B. R., T. Donaldson, R. E. Freeman, M. C. Jensen,
R. K. Mitchell and D. J. Wood: 2008, ‘Dialogue:
Toward Superior Stakeholder Theory’, Business Ethics
Quarterly 18, 153–190.
Aoki, M.: 1984, The Co-Operative Game Theory of the Firm
(Clarendon Press, Oxford).
Autor, D. H., J. J. Donohue III and S. J. Schwab: 1997,
‘The Costs of Wrongful-Discharge Laws’, The Review
of Economics and Statistics 88, 211–231.
Baldwin, C. Y.: 1983, ‘Productivity and Labor Unions:
An Application of the Theory of Self-Enforcing
Contracts’, Journal of Business 56, 155–185.
Barber, B. M. and J. D. Lyon: 1997, ‘Detecting Long-
Run Abnormal Stock Returns: The Empirical Power
and Specification of Test Statistics’, Journal of Financial
Economics 43, 341–372.
Batt, R.: 2002, ‘Managing Customer Services: Human
Resource Practices, Quit Rates, and Sales Growth’,
Academy of Management Journal 45, 587–597.
Beatty, A.: 1995, ‘The Cash Flow and Informational
Effects of Employee Stock Ownership Plans’, Journal of
Financial Economics 38, 211–240.
Bebchuk, L. A. and A. Cohen: 2005, ‘The Costs of
Entrenched Boards’, Journal of Financial Economics 78,
409–433.
Berger, P. G., E. Ofek and D. L. Yermack: 1997,
‘Managerial Entrenchment and Capital Structure
Decisions’, Journal of Finance 52, 1411–1438.
Berrone, P., J. Surroca and J. A. Tribo: 2007, ‘Cor-
porate Ethical Identity as a Determinant of Firm
Performance: A Test of the Mediating Role of
Stakeholder Satisfaction’, Journal of Business Ethics 76,
35–53.
Bird, R., A. D. Hall, F. Momente and F. Reggiani: 2007,
‘What Corporate Social Responsibility Activities are
Valued by the Market?’, Journal of Business Ethics 76,
189–206.
Blau, P. M.: 1964, Exchange and Power in Social Life
(Wiley, New York, NY).
Bridges, S. and K. J. Harrison: 2003, ‘Employee Per-
ceptions of Stakeholder Focus and Commitment to the
Organization’, Journal of Management Issues 15, 498–
509.
Cennamo, C., P. Berrone and L. R. Gomez-Mejia: 2009,
‘Does Stakeholder Management have a Dark Side?’,
Journal of Business Ethics 89, 491–507.
Chen, H., G. Noronha and V. Singal: 2004, ‘The Price
Response to S&P 500 Index Additions and Deletions:
Evidence of Asymmetry and a New Explanation’,
Journal of Finance 59, 1901–1929.
Cheng, S.: 2008, ‘Board Size and the Variability of
Corporate Performance’, Journal of Financial Economics
87, 157–176.
Core, J. E., R. W. Holthausen and D. F. Larcker: 1999,
‘Corporate Governance, Chief Executive Officer
Compensation, and Firm Performance’, Journal of
Financial Economics 51, 371–406.
Donaldson, T. and L. E. Preston: 1995, ‘The Stakeholder
Theory of the Corporation: Concepts, Evidence, and
Implications’, Academy of Management Review 20(1),
65–91.
Dowell, G., S. Hart and B. Yeung: 2000, ‘Do
Corporate Global Environmental Standards Create or
Destroy Market Value?’, Management Science 46,
1059–1074.
Eisenberger, R., R. Huntington, S. Hutchison and D.
Sowa: 1986, ‘Perceived Organizational Support’,
Journal of Applied Psychology 71, 500–507.
Eisenhardt, K. M.: 1989, ‘Agency Theory: An Assessment
and Review’, Academy of Management Review 14(1),
57–74.
Faleye, O.: 2007, ‘Classified Boards, Firm Value, and
Managerial Entrenchment’, Journal of Financial Economics
83, 501–529.
25Labor-Friendly Corporate Practices
Faleye, O., V. Mehrotra and R. Morck: 2006, ‘When
Labor has a Voice in Corporate Governance’, Journal of
Financial and Quantitative Analysis 41, 489–510.
Fama, E. and M. C. Jensen: 1983, ‘Separation of Own-
ership and Control’, Journal of Law and Economics 26,
301–325.
Filbeck, G. and D. Preece: 2003, ‘Fortune’s Best 100
Companies to Work for in America: Do They Work
for Shareholders?’, Journal of Business Finance and
Accounting 30, 771–797.
Fisman, R., G. Heal and V. B. Nair: 2005, ‘Corporate
Social Responsibility: Doing Well by Doing Good?’
Working Paper, Columbia University, New York.
Friedman, M.: 1962, Capitalism and Freedom (University
of Chicago Press, Chicago, IL).
Friedman, M.: 1970, ‘The Social Responsibility of
Business is to Increase Its Profits’, New York Times
Magazine 13, 32–33.
Geczy, C. C., D. Levin and R. F. Stambaugh: 2003,
‘Investing in Socially Responsible Mutual Funds’,
Working Paper, University of Pennsylvania, Phila-
delphia.
Gelade, G. A. and M. Ivery: 2003, ‘The Impact of
Human Resource Management and Work Climate on
Organizational Performance’, Personnel Psychology 56,
383–404.
Gellatly, I. R.: 1995, ‘Individual and Group Determinants
of Employee Absenteeism: Test of a Causal Model’,
Journal of Organizational Behavior 16, 469–485.
Griffin, J. J. and J. F. Mahon: 1997, ‘The Corporate
Social Performance and Corporate Financial Perfor-
mance Debate: Twenty-Five Years of Incomparable
Research’, Business and Society 36, 5–31.
Hellwig, M.: 2000, ‘On the Economics and Politics
of Corporate Finance and Corporate Control’, in
X. Vives (ed.), Corporate Governance: Theoretical and
Empirical Perspectives (Cambridge University Press,
Cambridge, UK).
Hill, C. W. L. and T. M. Jones: 1992, ‘Stakeholder-
Agency Theory’, Journal of Management Studies 29,
131–154.
Hirsch, P., S. Michaels and R. Friedman: 1987, ‘Dirty
Hands Versus Clean Models: Is Sociology in Danger of
Being Seduced by Economics?’, Theory and Society 16,
317–336.
Hochberg, Y. B. and L. A. Lindsey: 2010, ‘Incentives,
Targeting, and Firm Performance: An Analysis of
Non-Executive Stock Options’, Review of Financial
Studies 23, 4148–4186.
Hosmer, L. T.: 1994, ‘Strategic Planning As If Ethics
Mattered’, Strategic Management Journal 15, 17–34.
Jensen, M. C.: 2001, ‘Value Maximization, Stakeholder
Theory, and the Corporate Objective Function’,
European Financial Management 7(3), 297–317.
Jensen, M. C.: 2002, ‘Value Maximization, Stakeholder
Theory, and the Corporate Objective Function’,
Business Ethics Quarterly 12(2), 235–256.
Jones, T. M.: 1995, ‘Instrumental Stakeholder Theory: A
Synthesis of Ethics and Economics’, Academy of Man-
agement Review 20, 404–437.
Lougee, B.: 1999, ‘An Empirical Investigation of the
Implications of Employee Ownership for the Agency
Problem and the Information Content of Earnings’,
Unpublished Ph.D. Dissertation, Cornell University,
Ithaca, NY.
McGuire, J. B., A. Sundgren and T. Schneeweis: 1988,
‘Corporate Social Responsibility and Firm Financial
Performance’, Academy of Management Journal 31(4),
854–872.
Moore, G.: 2001, ‘Corporate Social and Financial Per-
formance: An Investigation in the U. K. Supermarket
Industry’, Journal of Business Ethics 34, 299–315.
Morck, R., A. Shleifer and R. Vishny: 1988, ‘Mana-
gerial Ownership and Market Valuation: An
Empirical Analysis’, Journal of Financial Economics 20,
293–315.
Pagano, M. and P. Volpin: 2005, ‘Managers, Workers,
and Corporate Control’, Journal of Finance 60, 843–
870.
Preston, L. E. and H. J. Sapienza: 1990, ‘Stakeholder
Management and Corporate Performance’, Journal of
Behavioral Economics 19, 361–375.
Reynolds, S. J., F. C. Schultz and D. R. Hekman: 2006,
‘Stakeholder Theory and Managerial Decision-Making:
Constraints and Implications of Balancing Stakeholder
Interests’, Journal of Business Ethics 64, 285–301.
Ruf, B. M., K. Muralidhar, R. M. Brown, J. J. Janney
and K. Paul: 2001, ‘An Empirical Investigation of the
Relationship Between Change in Corporate Social
Performance and Financial Performance: A Stake-
holder Theory Perspective’, Journal of Business Ethics
32, 143–156.
Schwab, B.: 1996, ‘A Note on Ethics and Strategy: Do
Good Ethics Always Make for Good Business?’, Stra-
tegic Management Journal 17, 499–500.
Sharplin, A. and L. D. Phelps: 1989, ‘A Stakeholder
Apologetic for Management’, Business and Professional
Ethics Journal 8(2), 41–53.
Somers, M. J.: 1995, ‘Organizational Commitment,
Turnover and Absenteeism: An Examination of Direct
and Interaction Effects’, Journal of Organizational
Behavior 16, 49–58.
26 Olubunmi Faleye and Emery A. Trahan
Statman, M.: 2000, ‘Socially Responsible Mutual Funds’,
Financial Analyst Journal 56, 30–39.
Whitener, E. M.: 2001, ‘Do ‘‘High Commitment’’
Human Resource Practices Affect Employee Com-
mitment? A Cross-level Analysis Using Hierarchical
Linear Modeling’, Journal of Management 27, 515–535.
Yermack, D.: 1996, ‘Higher Market Valuation of Com-
panies with a Small Board of Directors’, Journal of
Financial Economics 40, 185–213.
Olubunmi Faleye and Emery A. Trahan
College of Business Administration,
Northeastern University,
Boston, MA 02115, U.S.A.
E-mail: [email protected];
27Labor-Friendly Corporate Practices