Embed Size (px)
Citation preview

University of Wisconsin-Madison
Institute for' Research on Poverty Special Report Series
LABOR SUPPLY AND SOCIAL WELFARE BENEFITS IN THE UNITED STATES
Robert J. Lampman
October 1878
LABOR SUPPLY AND SOCIAL WELFARE BENEFITS IN THE UNITED STATES
Robert J. Lampman
October 1978
SR22
This paper was prepared for the Unemployment Statistics. It is Commission's review procedureo content.
National Commission on Employment and a draft that has not yet been through the The author alone is responsible for the
ABSTRACT.,
Social welfare benefits, including cash and in-kind public payments
for income maintenance, health care, education, and welfare services
amounted to 9% of gross national product (GNP) in 1950 and 21%
in 1976. Wollld the current labor supply be larger than it actually ts if
that increase in social welfare spending had not occurred and, if so, by
how much?
In an effort to isolate the contribution social welfare expenditures
may have made to a reduction in labor supply, we look first to partial
equj_libriu.m theory and second to correlations by empicical researchers.
Following the lead of theorists, we divide the social welfare system into
two elements: (1) the lump-sum grants and the gua1:ant.ees in income- or
earnings-conditioned grants, all of which add to the noniabor income of
beneficiaries; and (2) the taxes that go to finance the benefits and
the benefit·-reduction rates, both of which combine to reduce net wage
rates. Further, we note that the greater part of social welfare benefits
are directed to aged and disabled persons and to female heads of families.
Theory tells us that the substantial increase in 'n6nlabor income
shoul<il. have induced a withdrawal or hold-down of labor supply but it
cannot tell us the <l:l rection cf the effect of the net wage rate reduction.
F.mpirical studies based on fragmentary data suggest that the extra non
labor income may well have depressed the 1976 labor supp.1.y. The effect
of the net ,;,mge rate .rt~Juction would appe.:1r to be in the same direction

1
1, INTRODUCTION
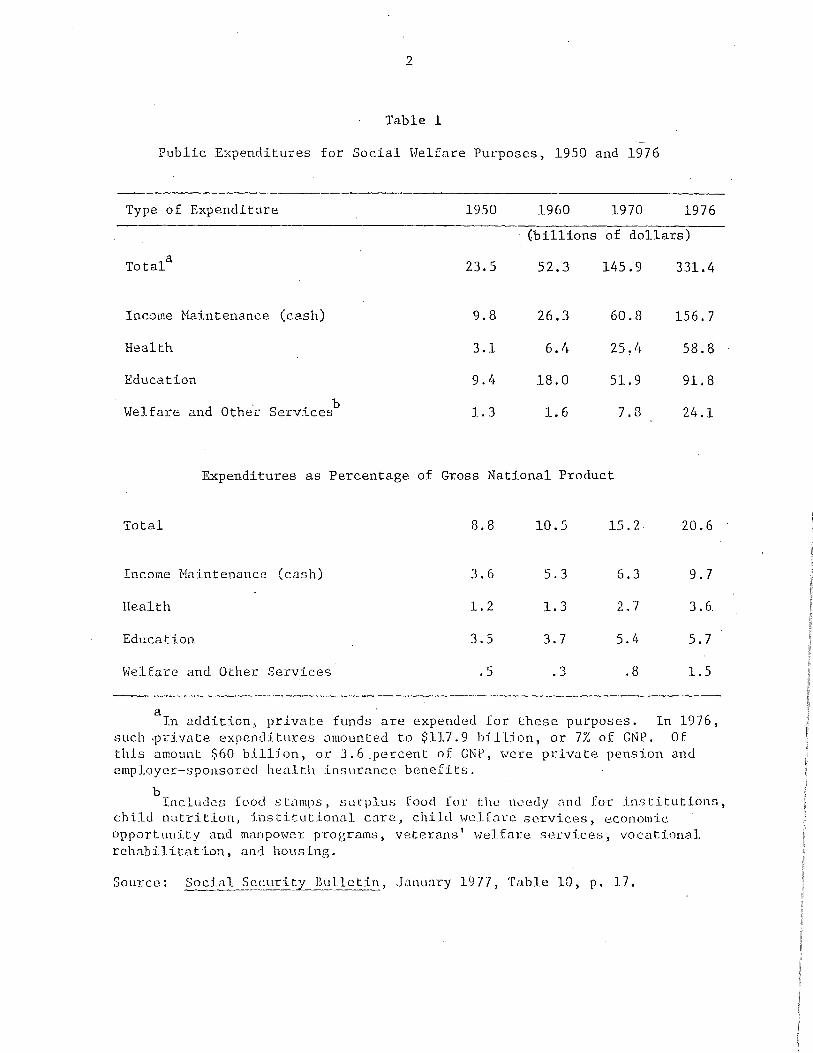
Since the end of World War II, public programs benefits for income
maintenance and health care, education, and certain other goods and
services, have risen from an amount equal to 9% of gross national product
(GNP) to 21% of a much expanded GNP (see Table 1), Over the same time
period, organized private wealth benefits, most notably pension and health
insurance benefits, have moved in a parallel fashion, amounting to about
4% of GNP in 1976.
These benefits all augment the income of recipients even though only
about half of them are paid out as money. Some of the nonmoney items are
vouchers that can be used only to purcha~e particular things, as in the
case of food stamps, and others take the form of a governmentally provided
sefvice, such as schooling. There is at least a strong likelihood that if
these goods and services were not subsidized or p~ovided by governments or
employers, then people would try to buy some quantity of each of them out
of their earnings. In other words, these publicly financed noncash
benefits are substitutes for private goods. By definition, the list of
benefits leaves out what are called "pure public" or "nonrivalrous" goods,
that is, items which yield nonexcludable, direct benefits to all people.
Examples of such goods are national defense and law and order. The line
between goods and services that should and should not be counted as social
welfare benefits is a rather shaky oneo
These money and nonmoney benefit.s come to households as either a
subsidy to the wage rate or as nonlabor income. That is, the recipient
does not get them as a market return for labor in the current period.
2
Table 1
Public Expenditures for Social Welfare Purposes, 1950 and 1976
Type of Expenditure 1950 1960 1970 1976
(billions of dollars)
Total a 23.5 52.3 145.9 331.4
Income Maintenance (cash) 9.8 26.3 60.8 156.7
Health 3.1 6. t. 25 ! li 58.8
Education 9.4 18.0 51. 9 91. 8
Welfar.e and Othe'r s . b ervices 1. 3 1. 6 7.8 24.1
Expenditures as Percentage of Gross National Product
Total 8.8 10.5 15. 2. 20.6
Income :Maintenance (cash) 3.6 5.3 6.3 9.7
Health 1. 2 1. 3 2.7 3 .6.
Education 3.5 3.7 5.4 5.7
Welfare and Other Services . 5 . 3 • 8 1. 5
8In addition, private funds are expended for these purposes. In 1976,
such ~rivate expenditures amounted to $117.9 billion, or 7% of GNP. Of this amount $60 billion, or J.6 ,percent of CNP, were priv.:ite pension and employer-sponsored health insuro.ncc benefits.
b Includc.s food stnmps, surplus food for the Ih:>ecly ,rnd for institutions,
child nutrition, institutional care, child welfare services, economic opportunity and manpower programs) veterans' welfare services, vocational rehabilitation, and houstng.
Source: Social Security Hu_llcti~, January 1977, Table 10, p. 17.

3
HousehOlds do pay for them, hovever, via taxes, or, in the case of private
benefits, via employer contributions. It is at least arguable that the
existence of such benefits may reduce work effort at two points, one where
the beneficiary receives the nonlabor income, and the other where the
worker suffers a wage loss because of the tax or contribution. Following
this line of thought, many people see a conflict between the "welfare
state" goals of security and adequacy of income and minimum levels of
, necessary services for all, on the one hand, and the high employment I
required for economic progress on the other hand.
In the following discussion, we focus on the issue of how the
quantity of labor may be affected. It should be noted, however, that
social welfare benefits and the payments to finance them may have other
direct and indirect effects. They may alter the size of distribution of income;
and they may moderate cyclical swings in employment and output. By
encouraging more expenditure on education and health care, they may improve
the quality of labor. They may lower the intensity of work effort by, for
example, changing people 1·s wi11ingness to make geographical or occupationaf
moves, Such benefits may alter the propensity of households to save and hence
i shift the national balance between consumption and investment. Furthe.r,
they may, by distorting choices in labor and consumer markets, impose what
is called an "excess burden," Le., an unnecessary loss of worker surplus
or consumer surplus, on households. Finally, this set of benefits may
induce changes in the size and economic role of the family. A full evalua-
tion of social welfare expenditures would include an inquiry into all these
possible outcomes and n weighing of the desired versus the undesired 011ttomes.
4
As noted, this paper examines only one hypothesis concerning the welfare
state, namely, that increases in the relative importance of social welfare
spending cause reductions in the quantity supplied. More specifically,
the question is: Would the current labor supply be larger than it actually
is if the great increase in welfare spending had not occurred?
2. THE RECENT CHANGES IN LABOR SUPPLY
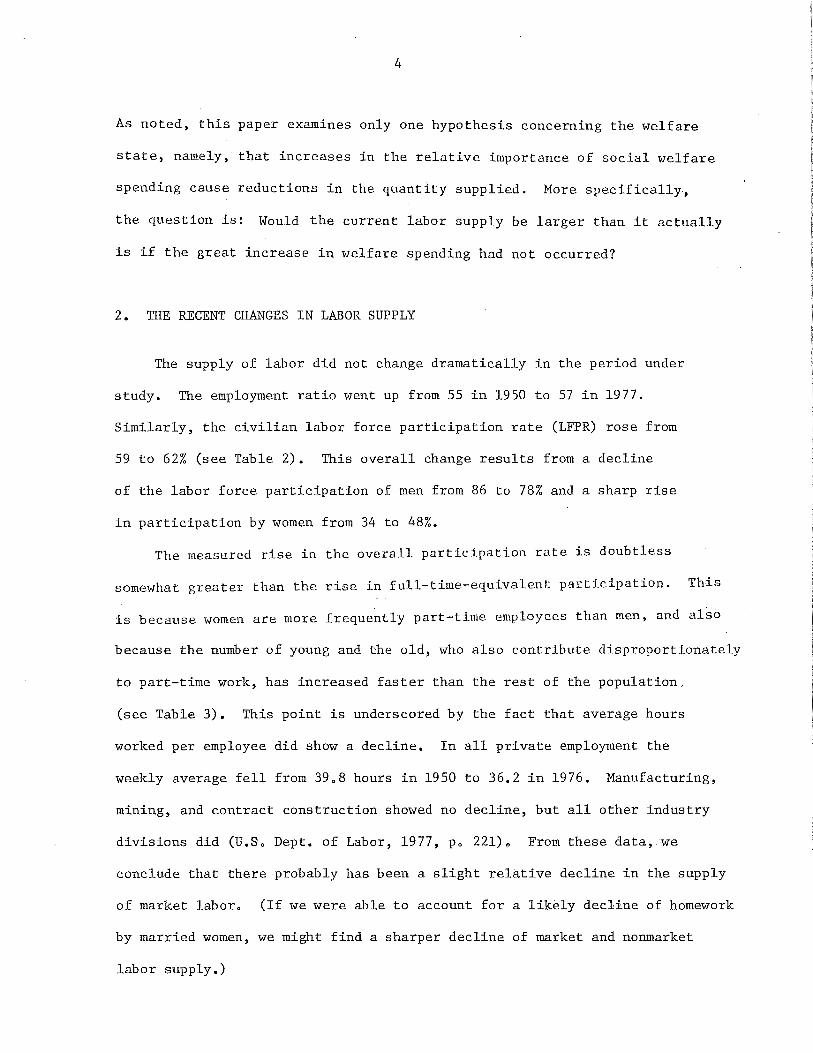
The supply of labor did not change dramatically in the period under
study. The employment ratio went up from 55 in 1950 to 57 in 1977.
Similarly, the civilian labor force participation rate (LFPR) rose from
59 to 62% (see Table 2). This overall change results from a decline
of the labor force participation of men from 86 to 78% and a sharp rise
in participation by women from 34 to 48%.
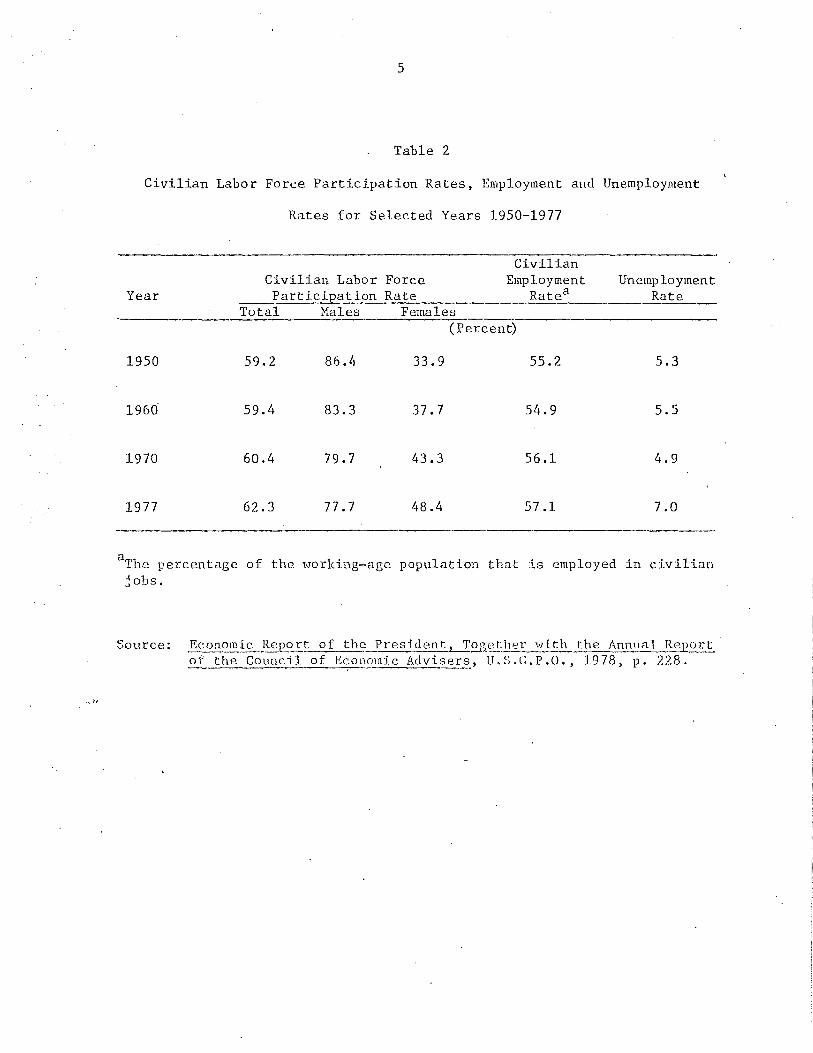
The measured rise in the overall participation rate is doubtless
somewhat greater than the rise in full-time-equivalent participation. This
is because women are more freque~tly part-time employees than men, and also
because the number of young and the old, who also contribute disproportionately
to part-time work, has increased faster than the rest of the population,
(see Table 3). This point is underscored by the fact that average hours
worked per employee did show a decline. In all private employment the
weekly average fell from 3908 hours in 1950 to 36.2 in 1976. Manufacturing,
mining, and contract construction showed no decline, but all other industry
divisions did (U.So Dept. of Labor, 1977, Po 221),, From these data, we
conclude that there probably has been a slight relative decline in the supply
of market laboro (If we were able to account for a likely decline of homework
by married women, we might find a sharper decline of market and nonmarket
labor supply.)
a
5
Table 2
Civilian Labor Force Participation Rates, Employment and Unemployment
Rates for Selected Years 1950-1977
Civilian Civilian Labor Force Employment Unemployment
Year Participation Rate Ratea Rate Total Males Females
(Percent)
1950 59.2 86, l1 33.9 55.2 5.3
59.4 83.3 37.7 54.9 5.5
1970 60.4 79.7 43.3 56.1 4.9
1977 62.3 77. 7 48.4 57.1 7 .0
·-----
The percentage of the. working-age population that is employed in civilian jobs.
Source: Ec_c::>E.omic Report of the President, T£.g_e~11ei:-3J._!:h___!he Annual ~.<:?_rt· of the Council of Economic Adviser:~., U.S.C.P.O., 1978, p. 228 ..
6
Table 3
Total Population 16 Years of Age and Older, by Age, 1950 to 1980
Percentage inc.rease,
Age 1950 1960 1970 1980 19'50-80 (projected)
Total, 16 years and over ·109,1/+l 121,814 142,956 167,659 54
16 to 19 8,542 10,698 15,275 16,682 96
20 to 24 11,680 11,116 17,184 20,908 79
25 to 34 24,036 22,911 29,294 36,157 50
35 to 44 21,637 24,223 23,142 25,702 19
45 to 54 17,453 20,581 23,310 22,640 29
55 to 64 13,396 15,627 18,664 21,047 57
65+ 12,397 16,658 20,087 24,523 105
Source: En:~~ment and Trainir,_g Report of the President, U.S.G.P.O., 1977 1 p. 252.
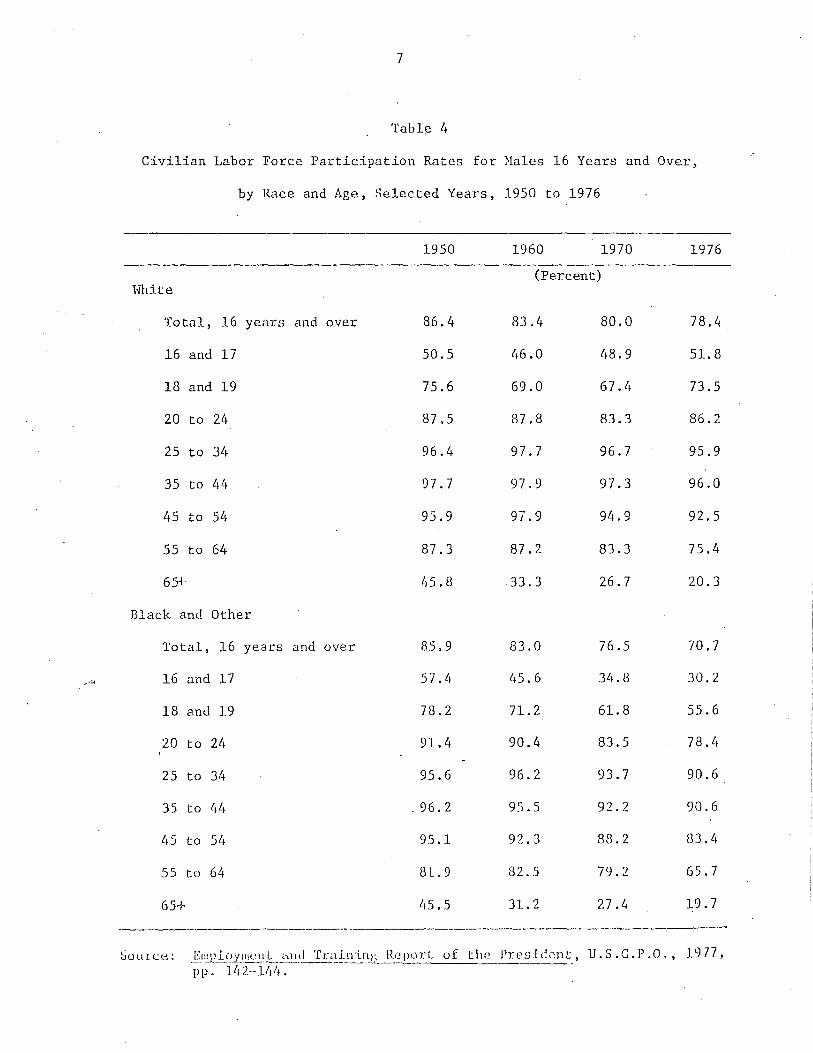
7
Tabl~ I+
Civilian Labor Force Participation Rates for Males 16 Years and Over,
by Race and Age, Selected Years, 1950 to 1976
1950 1960 1970 1976
(Percent) White
Total, 16 years and over 86.4 83.4 80.0 78.4
16 and 17 50.5 46.0 48.9 51. 8
18 and 19 75.6 69.0 67.11 73.5
20 to 24 87.5 87.8 83.3 86.2
25 to 3Lf 96.4 97.7 96. 7 95.9
35 to L14 97.7 97.9 97.3 96.0
L15 to 5Lf 95.9 97.9 94.9 92.5
55 to 64 87.3 87.2 83.3 75.4
65+ 45.8 .33. 3 26.7 20.3
Black and Other
Total, 16 years and over 85.9 83.0 76.5 70.7
.,··~ 16 and 17 57.4 L15. 6 34.8 30.2
18 and 19 78.2 71. 2 61. 8 55.6
20 to 24 91.4 90.4 83.5 78, l1
25 to 34 95.6 96.2 93.7 90.6
35 to !1L1 . 96. 2 95.5 92.2 90.6
45 to 54 95.1 92. 3 88.2 83 .L1
55 to 6L1 81. 9 82.5 79.2 65. 7
65+ L15. 5 31. 2 27.4 19.7
-----· -·---------·----------
Source: EnpJo_y_1ut.:ul.. hl!d TraJn:i.n1l_ R;3port. of the Pres.Ld2nt:, U.S.G.P.O., 1977, pp, ll12-· 1L14.

8
The LFPR of men fell due to declines in specific groups, namely,
black men of all ages, and white men of age 55 and older (see Table 4).
Offsetting the declining participation of men was the rising LFPR of women
in every age group except 65 and over. A most striking increase
in participation (not shown in Table 4) was registered by married women
with husbands present, whose LFPR went up by 21 points, from 24 to 45%.
The possibility of joint decisions on labor supply is suggested
by the simultaneous d~op in the LFPR of married men with wife present from
92 to 82% (U.S. Dept. of Labor, 1977, pp. 189-190).
These dtvergent work trends of men and women were apparent
in the yea:rs ante.cedent to the "explosion" of welfare state benefits.
Men have tended to start work later and retire earlier, and women
have tended to participate increasingly in market work since at
least the turn of the century. The "liberation" of women from home work
is attributable in some measure to the changes in fertility, to changes in
laws and customs impo:,ing responsibilities for rc.latives outside the nuclear
family, and to the invention of appliances that ease the burden of house
hold chores. It may also be due in some part to shifts in the structure of
work opportunities away from agriculture and toward the service occupations.
The trends toward less work by men may be -explained in part by changes in
laws related to work, such a.s child labor and school-leaving age l(1Ws, and
to falling relative prices of goods, such as travel and television, which
are complementary to leisure. But, perhaps the primary reason to suspect
that the trend toward less work began and might have accelerated even in
the absence of a rise in soc:lal wcJ.fare expenditures :l.s that wage rates·,
9
family incomes, and accumulated savings were rising. It is plausible that
as people get richer, they tend to take more leisure. We will return to
this particular proposition later.
All these "explanations" for observed changes in labor supply overlap
and are entangled with the hypothesis that labor supply has responded nega
tively to the expansion of social welfare benefits. Without that expansion,
would the labor supply of men have declined less, and/or would that of women
have increased more? It is, of course, quite impossible empirically to
represent the counterfactual general equilibrium appropriate to answering
that question., We are driven to (1) deductive analysis of a partial
equilibritun variety and (2) empirical testing of hypotheses drm..m from
theory against fragmentary data.
3. THEORY OF LABOR SUPPLY EFFECTS OF TAXES AND BENEFITSl
We turn now to a brief review of the conventional price-theoretic
approach to the question of how taxes and benefits financed by taxes affect
the supply of labor. We dssume that the effects of the private contributions
and benefits referred to above are similar to the effects of the public
programs the-::y resemble.
Many theorists begin with the assumption that "the 11 labor supply curve
slopes upward and to the right. We will go along with this convention but
we must note that the conclusions about the likely effects of some taxes
and ~10mc bcnt'!Llts depend essc:ntlully on thc1t ar_;sumption.
Supposi~ that n tax is imposed on wages and that the wage rate net of
tax the:i~efore falls. One would expect, following the assumption stated
above, that the worker would move back ancl down hi£, pretax supply curve.
10
The market wage would fall by less than the amount of the tax and, most
interesting to us here, the quantity of labor employed would fall. This
·i.s consistent with imagin:Lng that workers have decided that since leisure
"costs" less than it did before the tax, they will take more of it. This
substitution effect overrides their understanding that if they want to
maintain their pretax purchasing power they must work more hours. The
latter under.standing is referred to as an income effec:::, which, in this
casei only partially offsets the substitution effect of the tax.
This theoretical outcome and balance of income and substitution
effects does not follow if the labor supply curve is assumed to be
inelastic with respect to the wage rate or is seen as backward bending.
In the first case, a tax on wages would not affect the quantity of labor
offered or employed at the pretax or nominal wage. In the second case,
such a tax would induce more work effor.t than was forthcoming before the
tax was imposed·(see Figure:l, Panel A).
The type of benefit that is obverse to the tax on wages is a subsidy
to wages. Here, assuming that the labor supply curve slopes upward and to
the right, the result is that the worker will move up and out his supply
curve and offer more labor at the presubsidy wage rate. The designs of
the wage tax and the wage subsidy are shown in Figure 2, Part A. Wage
rates, subsidies, or earnings subsidies are relatively rare in the American
system of transfers, but are represented by the Earned Income Credit of
1976, the WIN tax credit of 1972, and the Employer Tax Credit of 1976.
A more common design for a social welfare benefit is the offer of a
lump-sum grant unrelated to wages. An example of this is the provision ·of
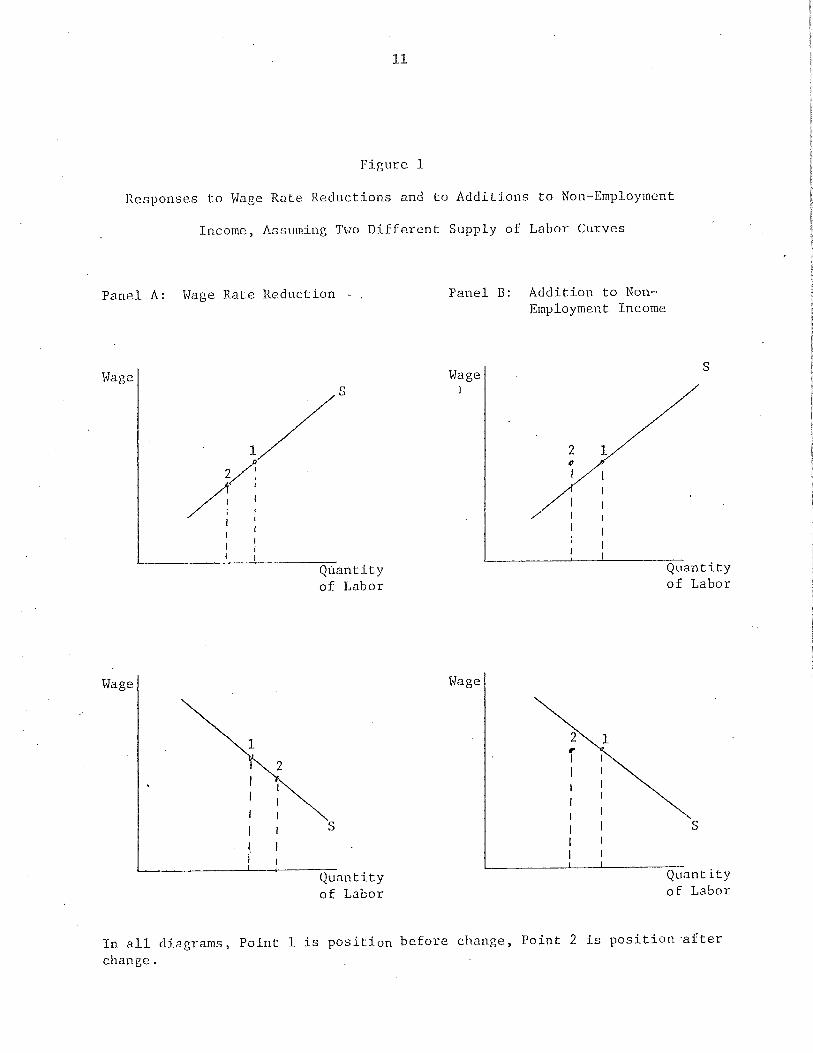
11
Figure 1
Responses to Wage Rate Reductions and lo Additions to Non-Employment
Income, Assuming Two Different Supply of Labor Curves
Panel A: Wage Rate Reduction - .
Wage
1
2
/ I
Wage
1
I j
2
s
Quantity of Labor
s
Quantity of Labor
Panel B: Addition to NonEmployment Income
Wage I
Wage
2 1 f
s
Quantity of Labor
s
Quantity of Labor
In all diagrams, Point 1 is position before change, Point 2 is position ·after change.
12
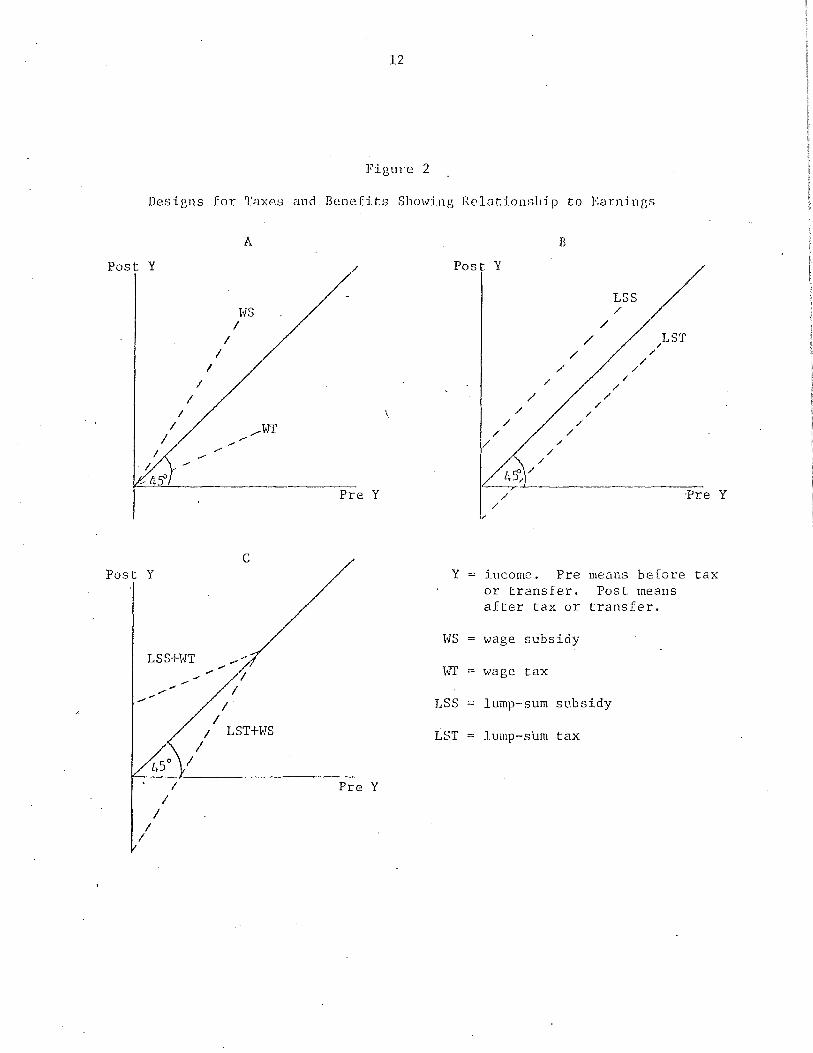
Figure 2
Designs for TaxE~s and Benefits Showing Rel.:1tionsltip to Earnings
Post Y
I
Post Y
LSSHJT
I I
I I
I
I
I
I
I I
I I
A
ws I
C
I I
/ LST+WS I
Pre Y
Pre Y
B
Post Y
y ==
ws ==
WT =
/ /
/ /
/
/
/ /
/ /
/
/ /
l,S',. /
/ /
--r /
income. Pre or transfer. after tax or
wage subsidy
wage tax
/
/
/ /
/
LSS /
/ /
/
/ /
/
LST
·Pre Y
means before tax Post means
transfer.
LSS = lump-·sum subsidy
LST = lump-sum tax
13
free schooling to pupils without regard to the income of their parents.
Such a benefit does not affect the wage rate but, rather, appears in the
household budget as nonlabor income. To the extent the parents were
paying for _schooling before the lump-sun~ grant was initiated, one might
suppose that they would believe that their living standard had gone up and
that they could afford to work less. Since the wage rate is unaffected,
we can represent this as a shift of the supply curve to the left (see
Figure 1, Panel B). The outcome of a reduced labor supply would be the same
whatever the slope of the labor supply curve. The obverse type of tax to
a lump-sum benefit is, of course, a lump-sum tax (see Figure 2, Part B).
Such a tax reduces nonlabor income and thereby induces or coerces more
work effort.
Another design for social welfare benefits is to relate them inversely
to wages. Here we can distinguish two variations. One, a work-conditioned
design, would pay a benefit only in cases where a person is deemed
totally unable to work because of physical disability or involuntary
unemployment. One might think that, by definition, this benefit
design cannot have a work disincentive effect. However, it may encourage
some to feign inability to work or to find work. Moreover, it may have the
indirect effect of freeing a relative of the burden of providing support
for the direct beneficiary and hence adding to the relative's nonlabor
income and thereby shifting his supply of lubor curve to the left.
Only a small portion of all social welfare programs fit this
description of a work-conditioned grarrt under which all benefits are denied
if one has any earnings, Perhaps the best examples of such a design are
.. ,r-
14
Unemployment Insurance :i.n states that do not allow for partial benefits,
and general assistance in some jurisdictions. AFDC for unemployed fathers
has some characteristics of this design with its 100-hour work rule. It is
true, however, that a work-conditioning philosophy enters into what we classify
below as earnings-conditioned benefits to the extent that eligibility
is restricted to persons who are either not able to work or are not
expected to work. Only people in categories defined by health status, age,
and child-rearing responsibilities are eligible for some benefits. Aside
from schooling, the greater part of all social welfare benefits go to the
aged. The logic of this is that people who are less able to work are not
likely to reduce work effort very much and, moreover, whatever reduction
doe.s occur may not be viewed by society as a bad thing. However,
unexpected differences in leisure responses to benefits do sometimes
complicate the problem of achieving what voters will consider a just
distribution of income and leisure.
The second variation of benefits related inversely to wages is one
that may be called the income-conditioned or earnings-conditioned benefit.
In this more common variation of the two the benefit is scaled to diminish
to zero as earnings or total incomes rise (see Figure 2, Part C). This
scaling may involve a benefit reduction rate of (as in the case of the
"notch" in Medicaid benefits) more than 100%, or as is the case in the
food stamp program, far less than 100%, The earnings-conditioned
benefit may be seen as having two parts. One is a lump-sum grant, which
adds to nonlabor income and is assumed to have an income effect of shifting
the supply of labor to the left. The other part is the benefit-reduction

15
rate, which is like a tax in that it reduces the wage rate. This reduction
in wage rate has both an income and a substituU.on effect and will, if the
supply curve of labor :::lopes upward and to the right, move the beneficiary
to a lower point on his new labor supply curve., Presumably, a 100%
benefit reduction rate would lower the net wage to zero, and the beneficiary
would offer little, if any, labor. Thus, both the lump-sum grant or
guarantee and the benefit-reduction rate contribute to a reduction in work
effort. This design is the obverse of a lump-sum tax in tandem with a wage
subsidy (see Figure 2, Part C). The two parts of the latter design combined
would theoretically provide the maximum incentive to work. To further
promote work> one could add to this design a tax on goods that are comple
mentary to leisure and a subsidy on goods, such as child day care, commuter
service, and training, which are complementary to W@rk.
The contemporary American system of transfers may be characterized as
having three' main features. (1) It is largely financed by what can be
treated as taxes on earnings. (2) Its benefit side is dominated by lump
sum and earnings-conditioned grants. About one-third of all social
welfare benefits, most notably certain education and health care benefits,
are distributed on a per capita basis and are invariant to earnings.
These.fit the description given above of lump-sum grants. Almost two-
thirds of all benefits some of them in c;ish and some in kind -- :.1re
earnings-conditioned benefits. These include Old Age and Disability
Insurance, Unemployment Insurance, public assistance, food stamps, public
housing, Medicaid, some higher education benefits, and child day care.
Wage subsidies and work-conditioned benefits make up only small parts of

16
the overall total of social welfare benefits. (3) The greater part of
earnings-conditioned benefits go to aged and disabled persons and to female
heads of families.
Theoretical Discussion Summarized
Both the taxes that go to finance the benefits, and the benefit
reduction rates in the earnings-conditioned benefits have the effect of
reducing wage rates. The lump-sum grants and the guarantee element of the
income-conditioned grants add to the non-labor income of beneficiaries.
According to the theory reviewed above, a reduction in the wage rate will
have the effect of reducing the quantity of labor supplied, assuming that
the labor supply curve slopes upward and to the right. At the same time,
an j_ncrease in nonlabor income will induce less work whether or not the
labor supply curve slopes upward and to the right. One might guess that
noncash benefits-have less effect per dollar in this regard than do cash
benefits, but all of the effects work in the same direction. It is this
reinforcing of the work disincentive,that leads to the conclusion that there
is an inevitable trade-off between income redistribution and income growth
and, in the extreme case where all earnings are taxed away and all goods
are distributed free of charge to consumers, to a trade-off of free choice
by workers. As one text puts it, "This, indeed, is the dilemma of
utopian conununism, where a person should contribute to the community's
output according to his ability, and compensation (the distribution of
goods among individuals) should be according to need. In the absence of
a self-interest oriented economic motivation, another mechanism of work
allocation and stimulus to effort would be needed (Musgrave and Musgrave,
1976, p. 487)." That "other mechanism" may be regimentation and coercion of
workers.
17
However, theory cannot tell us how strong the effect of an increase
in nonlabor income may be, nor can it tell us, since it does not establish
the slope of the labor supply curve, the direction or the magnitude of
the effect of a wage-rate reduction, Hence it is critical that we find
empirical evidence of labor responses to wage rate changes and to additions
to nonlabor income,
4. EMPIRICAL STUDY OF LABOR RESPONSE TO NONLABOR INCOME
We note at the outset that empirical researchers have paid little
or no attention to the question of how nonlabor income in the form of
such in-kind, lump-sum benefits as education and health care may affect the
quantity of labor supplied. However, many scholars have noted that women
are influenced in their labor decision by the receipt of nonlabor income
in the form of husband's income. It still seems to be the case that, all
other things being the same, married women do less market work the higher
their husbands' incomes, although that relationship is less strong than it
once was. On the other hand, it is harder to establish that men's labor
supply is influenced by wives' earnings (Flaim, 1977, pp. 16-18). We
should also note that empirical studies have yielded widely divergent
findings with respect to work response to cash social welfare benefits,
Program records from public assistance and social insurance files can
be used to study the work effects of these types of nonlabor income. By
· comparing program records from two or more jurisdictions having varying
levels of benefits, we may be able to measure a marginal change in work
effort. Similarly, we may observe the before and after work effort
associated with a change in benefits in one program in a single jurisdiction.

18
In both instances, one has to take account of variations across space or
time in all relevant program characteristics and in all relevant environ-
mental conditions and personal attributes. Cross sectional and longitudinal
studies using program records have been .done with reference to specific
public assistance and social insurance program variations. They tell us,
with varying degrees of credibility, that more people will apply for and
receive e.ssistance benefits if benefit levels are more generous, people
will retire earlier if eligibility is extended to younger workers, and
people will work less if unemployment insurance benefit·s are raised and
extended for longer periods (Brehm and Saving, 1969; Gallaway, 1965;
Ehrenberg and Oaxaca, 1976).
Household surveys of income by source, together with information. on
wage rates, hours worked, health status,,age, sex, family status, school
attendance and so on, provide another entree for econometric study of work
response to nonlabor income. Such data enable one to compare the work
behavior of those who have a high level of nonlabor income with those of
like characteristics who do not. Numerous studies of this kind have been
done using household survey data.2
They vary as to methodology; some
exclude spouses' earnings; other leave out work-conditioned benefits; most
count social benefits net of the effect of benefit-reduction rates as
nonlabor income. (The latter procedure, as opposed to counting the gross
benefit, may result in an overstatement of the effect per dollar of
nonlabor incomea) Some exclude persons who are unable to work. All such
studies find it hard to fill all the cells, so to speak. For example, most
data bases provide few cases of people with low wage rates who have much
private nonlabor income.
19
These studies all tend to find that work effort declines with
increases in nonlabor income. The most recent, by Stanley Masters and
Irwin Garfinkel (1978), :finds a smaller response than do most earlier
studies. According to Masters and Garfinkel each increase of $1,000 in
nonlabor income is associated with a reduction of 1% in the labor supply of
prime-age, healthly men. This response is greater among aged persons,
i.eo, 10%. It is about 4% for women, and for young, single persons. The
authors use these findings to simulate a negative income tax with guarantees
at poverty-line levels and a 50% benefit reduction rate applicable only to
intact, non-aged families. According to this simulation, the work effort
of those eligible for benefits would fall by about 15%. The 15% change in
work effort by the beneficiaries would amount to 2.5 % of the national
total of work time.
None of these studies tell us much about how higher wage-earners
respond to nonlabor income nor, as we noted earlier, about how people in
general respond to nonmoney social welfare benefits. Empirical studies,
do, however, confirm the theoretical hypothesis that people do work less
in response to provision of nonlabor income.
5. EMPIRICAL STUDY OF LABOR RESPONSE TO WAGE-RATE REDUCTIONS
Theory tells us that social welfare benefits may discourage work in
two ways, namely, by adding nonlabor income and by reducing the net wage
rate by a combination of benefit-reduction rates and tax rates. What do
empirical studies tell us about work response to reductions in wage rates?
The leading studies on this question have been done by Paul H. Douglas
and his associates, who have estimated labor supply functions using time
20
series of hours worked per year in several industries and cross-section
data on hours worked and labor force participation rates (Bowen and
Finegan, 1969). Their major finding is that men's labor supply curve is
highly inelastic and slightly backward-sloping with respect to wage rates.
Other studies, including those by Jacob Mincer and Glen G. Cain, find that
married women have a supply curve that slopes upward and to the right
(Mincer, 1967; Cain, 1966). This would suggest that men respond one way
to a wage rate reduction and women respond in another way. The difference
is thought to be due to the fact that while men substitute leisure for
work, women substitute market work for home work.
Three widely cited studies of the effects of changes in marginal
tax rates on high-income earners reported no significant change in work
effort (Sanders, 1951; Break, 1957; Barlow, Brazer, and Morgan, 1966).
Thomas Sanders studied the effect of taxes on 160 executives in the United
States. Break studied 306 solicitors and accountants in England, and
Robin Barlow, Harvey Brazer, and James Morgan asked similar questions of
957 high-income individuals. These studies seem to confirm the Douglas
finding that the supply of labor for men is inelastic.
Studies based on social welfare program cha~ges yield mixed findings
about the effects of benefit-reduction rates. One study found that Social
Security recipients worked more when benefit-reduction rates were lowered.
Another, reported in 1961, found that few welfare mothers responded to
lower benefit-reduction rates in AFDC (Gallaway, 1966; Colorado Dept. of
Public Welfare, 1961). The 1967 AFDC change from a 100% to a 67%
benefit-reduction rate and more deductions for work expenses produced little
change in the work effort of beneficiaries.
,-21
Studies based on household surveys have not established that variations
in benefi.t··reducl:ion rates meik.e rnuch difference in work supplied by men.
The Masters and Garfinkel study (1978) referred to earlier did estimate, however,
that~ IO-percentage-point increase in the benefit-reduction rate would
lead female heads of families ~o reduce work effort by 2%, and
wives to reduce wo;:k effort by 4 %. Data limitations prevent
estimates of the. effect of benefit-reduction rates approaching 100~,.
The method used in this study is to compare the work behavior of similar
individuals who have the same level of nonlabor income but different wage
rates, The different wage rates are a stand-in for varying benefit
reduction rates. Not surprisingly, surveys provide few examples of people
working at a zero wage rate.
Experiments with negative income taxation have yielded some new
evidence on labor supply responses. Unfortunately, the results to date do
not en8:ble separate estimates of response to nonlabor income and wage rate
reductions. The first of these experiments; which is referred to as the
New Jersey_ experiment, concentrated its attention on families headed by
able-bodied, prime-age men. The main finding of the 3-year experiment
was that in the experimental families, considered as a group, male family
heads reduced hours worked by 6% and wives by 30% (Watts and Rees, 1977).
Again, data limitations prevent a good measure of the separate work effects
of high benefit-reduction rates~ There are reasons to doubt the point
estimates of the results of an experiment of this type. It was of only
3 year's duration and was applied to people in scattered locations. Hence,
there was no opportunity to observe changes in the labor market or in the
community that might accompany a nation-wide, permanent benefit program.
22
Moreover, the New Jersey experiment suffered from the "contamination" by the
AFDC-U program, which was introduced in New Jersey after the experiment was
underway (Pechman and Timpane, 1977).
The Seattle-Denver experiment has yielded similar findings of
disincentives to work associated with a negative income tax. Among the
families that were offered a guarantee at the poverty-line and a 50%
benefit-reduction rate, husbands reduced hours of work by 6% and wives
by 22%. This amounted to a 10% reduction of work effort by all
husband-wife families receiving benefits or a 3.5% reduction by all
husband-wife families, including those who receive no benefits (Keeley
et al., forthcoming)o The latter figure is comparable to the Masters
Garfinkel simulation, cited above, of a 2.5% reduction of work time.
We conclude from this review of empirical studies of the effects of
changes in wage rates that men do not work much, if any, less in response
to a "moderate" reduction in wage rates, but that married women and female
heads of families do work less in response to such a change.
6. APPLICATION OF FINDINGS TO LABOR SUPPLY
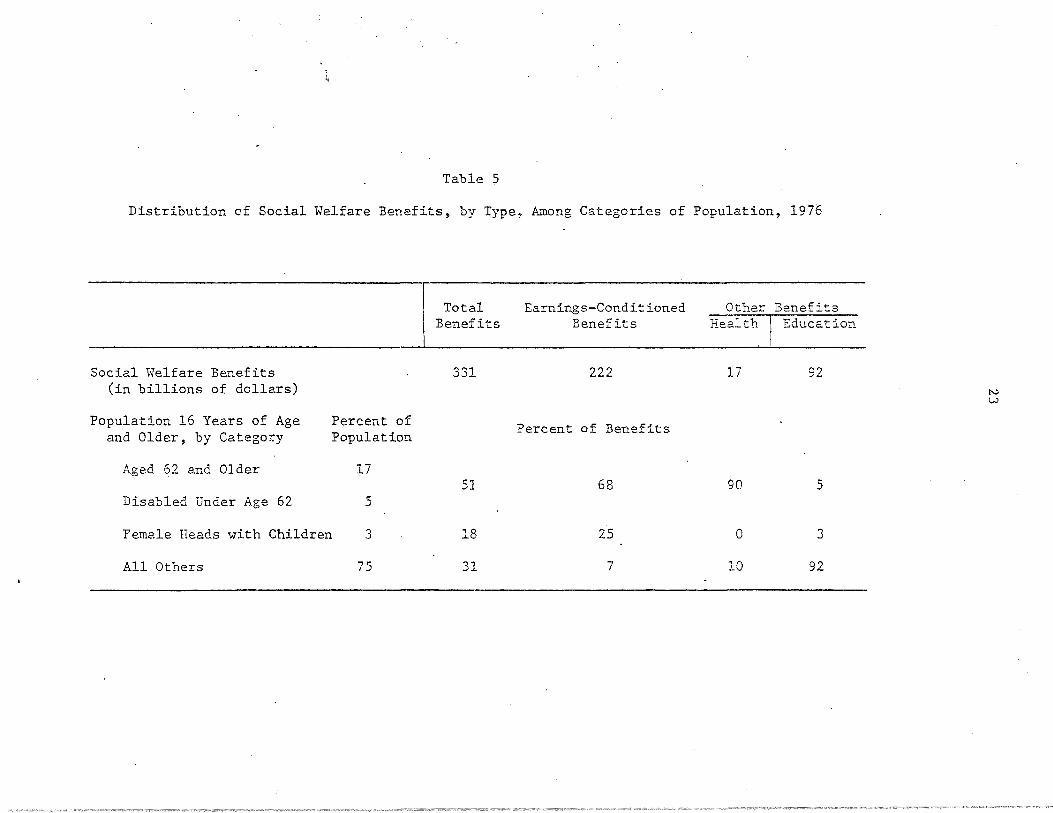
As we stated earlier, the present-day American system of transfers
directs the greater part of its cash and in-kind benefits to the minority
of the population who are aged (62 and older), disabled, or in broken
families. Table 5 shows that 25% of the population aged 16 years and older
are in these categories. We estimate that people in those categories
receive about 69% of social welfare expenditures. The other 75% of the
population get about 31% of total expenditures, but most of that is in the
form of education benefits which are not earnings-conditioned, This
characteristic of the transfer system means that the greatest disincentive
.,
Table 5
Distribution of Social Welfare Benefits, by Type, Among Categories of Population, 1976
Total Earnings-Conditioned Other Benefits Benefits Benefits Health l Education
Social Welfare Benefits 331 222 17 92 (in billions of dollars) N
w
Population 16 Years of Age Percent of Percent of Benefits and Older, by Category Population
Aged 62 and Older 17 51 68 90 5
Disabled Under Age 62 5
Female Heads with Children 3 18 25 0 3
All Others 75 31 7 10 92
24
effects are aimed at categories of people who are not expected to work.
Conversely, those who are most clearly expected to work are relatively
shielded from disincentives of nonlabor income and benefit-reduction
rates.
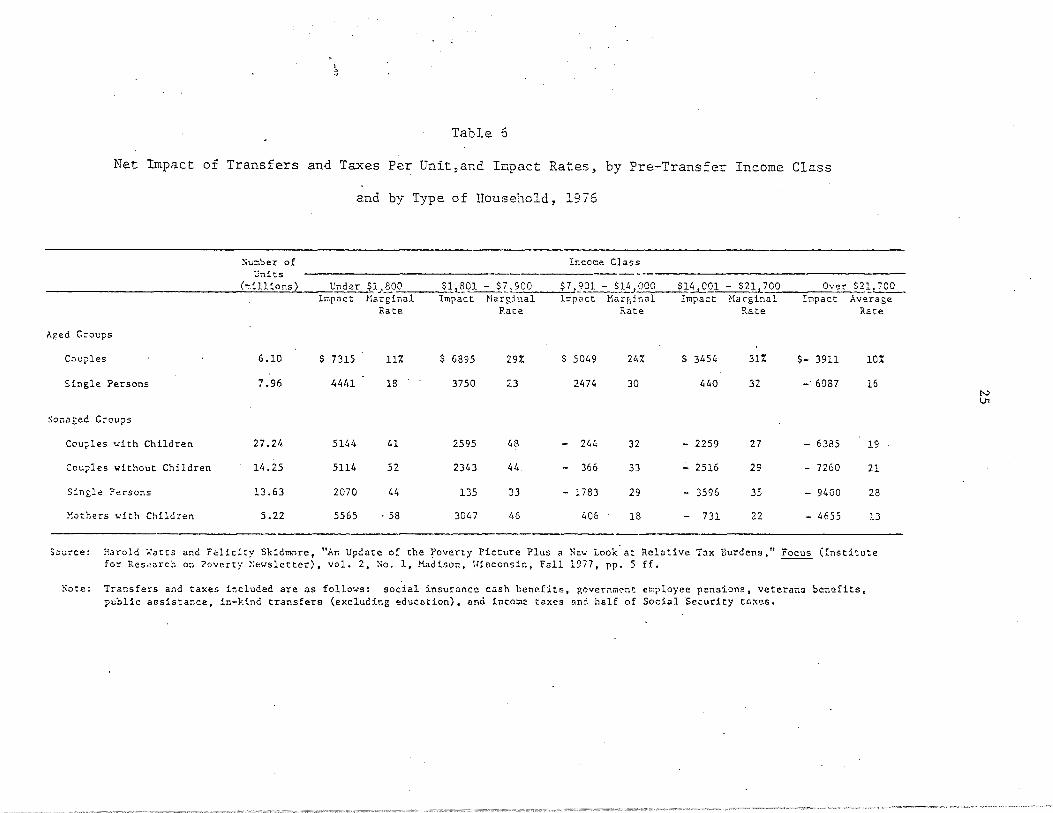
Table 6 gives us a partial picture of how the system of taxes and
transfers impacts on groups of households in the several pretransfer income
classes, by household type. It shows that average transfers net of taxes
paid are particularly large relative to income in the lowest income class,
that the breakeven point (where transfers equal taxes) is well below the
median income for non-aged couples and single persons, and that benefit
reduction rates and tax rates combined (referred to in the table:. as "impact
rates") are above 40% for non-aged households below the breakeven points.
It also suggests the degree to which the system favors the aged. However,
this finding is somewhat misleading since education .benefits are excluded.
A comparison wlth the 1961 system of taxes and transfers is afforded
by an earlier study, which examined only money transfers and an assumed
7% proportional tax. This study represented the 1961 picture as
follows for four-person families, (Compare with "couples with children"
in Ta.ble 6.) Net benefits were $1650 (in 1961 prices) for the lowest
income class; the breakeven point was at about $5,000 of pretransfer
income, and the combined benefit-reduction and tax ra·tes were a,.bout 30;~
for households below the breakeven point (Lampman, 1966).
Nonlabor income in the form of social welfare benefits amounted to $331
billion in 1976. This figure is $187 billion greater than it would have
been if such benefits were equnl to 9% of GNP as they were in 1950.
Since then per capita benefits r~se. from $355 to $1, 51Li in constant, 1976,
prices. Breakeven polnts do not appear to have changed much relative to
~
Table 6
Net Impact of Transfers and Taxes Per Unit,and Impact Rates, by Pre-Transfer Income Class
and by Type of Household, 1976
::.u:::ber of lncoc:e Class Units
(:::ill ions) t:nder $1.800 1:a'"z.ginal
$1,_~01 - $7_ 900 $7 901 - $14JOOO $1~01 - $211700 Over $21:_,.IQQ_
;~ged Groups
C0uples
Single Persons
~onagec. Groups
Cou;,les •..;ith Children
Co~ples without Children
S:n.;le Persons
~"'thers \:ith Children
6.10
7.96
27.24
14 .25
13.63
5.22
Impact
$ 7315
4441
5144
5114
2070
5565
Rate
lH
lS
41
52
44
· 58
Impact
$ 6895
3750
2595
2343
135
3047
Naq:)nal Rate
29%
:1.3
43
44
33
46
li::pact
$ 5049
2474
244
366
- 1783
406
Marp,lnal Impact Macginal Impact Average Rate Rate Rate
2l,7. $ 3454 31'.4 $- 3911 10%
30 440 32 -· 6087 16
32 - 2259 27 - 6385 19
33 - 2516 29 - 7260 21
29 - 3596 35 - 9400 28
18 - 731 22 - 4655 13
Source: Harold -.:ans and Fdicity Skidmore, "Ar. Update of the Poverty Picttrre Plus a for Res<!arc:., on ?overty ~:ewsletter), vol. 2, No. l, !fa.dison, \.lieconsin, Fall
Nev Look at Relative T:ix Burdens," Focus (Institu~e 1977, pp. 5 ff.
~ote: Transfers and taxes included are as follows: social insurance cash benefitB, iovernrnent employee pensions, veterans benefits, public aasistance, in-kind transfers (excluding education}, and incom~ taxes and half of Social Security taxes.
N u,
- 26
median incomes. However, the share of benefits that are earnings
conditioned has risen from 55 to 67% and benefit-reduction rates are
somewhat higher.3
Moreover, since 1950, tax rates have had to rise to
accommodate the expansion of social welfare benefits from an amount equal
to 9% of GNP to 21%. This latter point alone mBans that net wage rates
4 could have been 12% higher in 1976 than they in fact were.
We can make only a very rough guess as to how the considerable increase
in guarantees, benefit-reduction rates, and tax rates may have affected the
size of the labor supply over the last quarter of a century. We are not
aware of any efforts by anyone else to supply a quantitative answer to this
particular question, Our guess is that the quantity of labor supplied in
1976 would have been about 7% greater than it actually was if social
welfare e..xpenditures had been maintained at 9% of GNP.
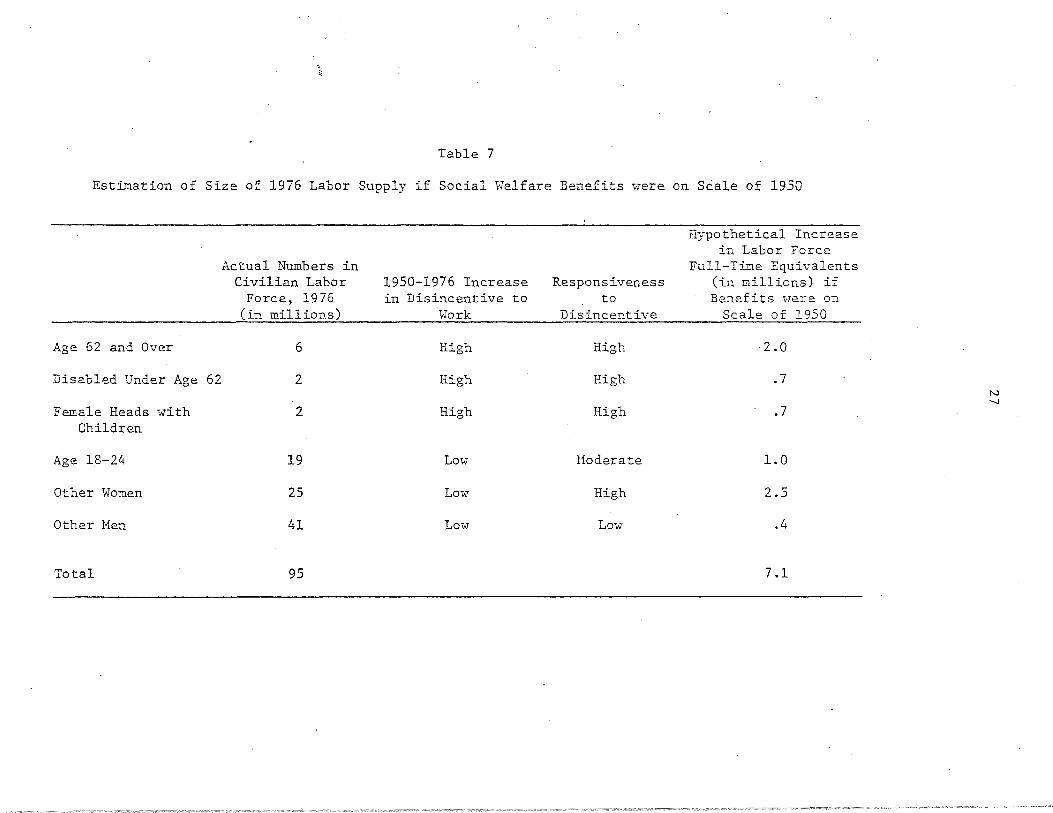
We come to that number by noting 9 first, that the greatest :Lncreases
,u in disincentives have been aimed at relatively small constituents of the
labor force, namely, the aged, the disabled, and the female heads, For
the larg0.r groups in the labor force, the extra nonlabor income and the
reductions in net wage rates have been relatively small (see Table 7,
column 2).
Second, we apply the fj_ndings of empirical studies reviewed above
that some groups are more responsive than others to a given stimulus.
The findings indicate that older men and disabled persons are highly
responsive to increases in guarantees and that women are moderately
responsive. Additionally, women are more responsive than men to reductions i
fnwage rates (see Table 7, column 3).
·, ~
Table 7
Estimation of Size of 1976 Labor Supply if Social Welfare Benefits were on Scale of 1950
Age 62 and Over
Disabled Under Age 62
Female Heads with Children
Age 1.8-24
Other Women
Other Men
Total
Actual Numbers in Civilian Labor
Force, 1976 (in millions)
6
2
2
19
25
41
95
1950-1976 Increase in Disincentive to
Work
High
High
High
Low
Low
Low
Responsiveness to
Disincentive
High
High
High
Hoderate
High
Low
Hypothetical Increase ia Labor Force
Full-Time Equivalents (in millions) if Benefits were on
Scale of 1950
·2.0
.7
.7
1.0
2.5
.4
7.1
N -...J
28
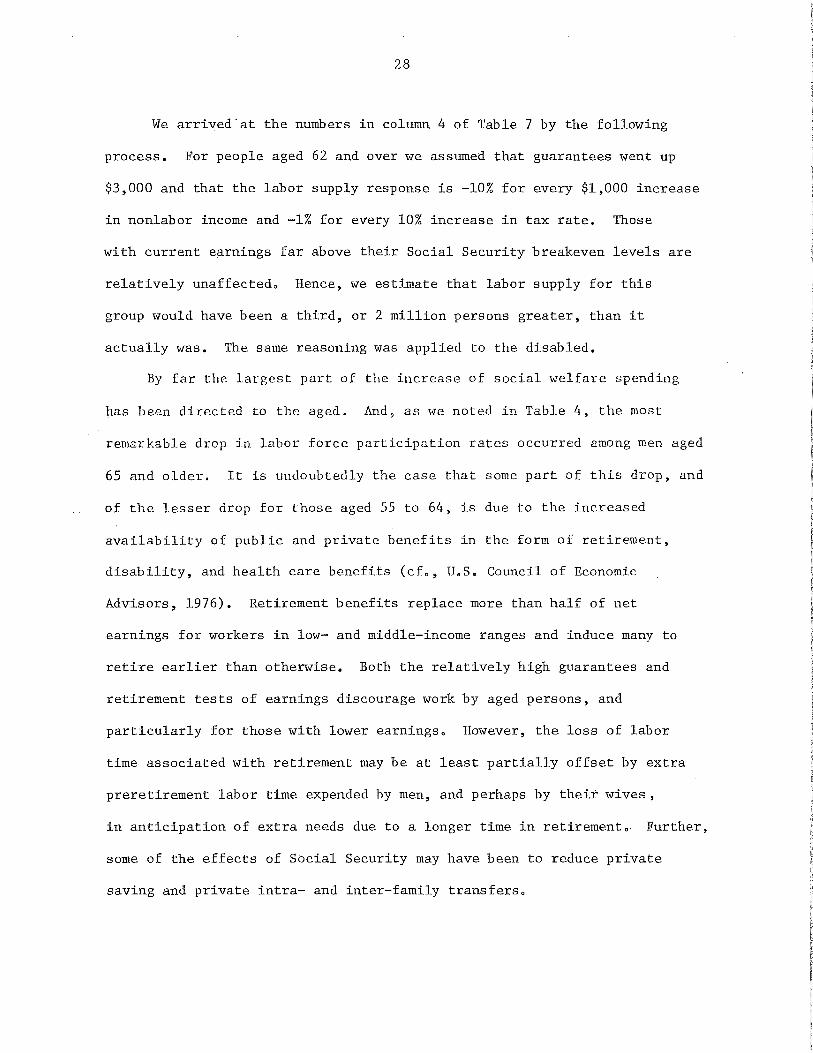
We arrived.at the numbers in column 4 of Table 7 by the following
process. For people aged 62 and over we assumed that guarantees went up
$3,000 and that the labor supply response is -10% for every $1,000 increase
in nonlabor income and -1% for every 10% increase in tax rate. Those
with current earnings far above their Social Security breakeven levels are
relatively unaffectedo Hence, we estimate that labor supply for this
group would have been a third, or 2 million persons greater, than it
actually was. The same reasoning was applied to the disabled.
By far the largest part of the increase of social welfare spending
has been directed to the aged. And, as we noted in Table 4, the most
remarkable drop in labor force participation rates occurred among men aged
65 and older. It is undoubtedly the case that some part of this drop, and
of the lesser drop for those aged 55 to 64, is due to the increased
availability of public and private benefits in the form of retirement,
disability, and health care benefits (cfo, U.S. Council of Economic
Advisors, 1976). Retirement benefits replace more than half of net
earnings for workers in low- and middle-income ranges and induce many to
retire earlier than otherwise. Both the relatively high guarantees and
retirement tests of earnings discourage work by aged persons, and
particularly for those with lower earningso However, the loss of labor
time associated with retirement may be at least partially offset by extra
preretirement labor time expended by men, and perhaps by their wives,
in anticipation of extra needs due to a longer time in retiremento Further,
some of the effects of Social Security may have been to reduce private
saving and private intra- and inter-family transferso
29
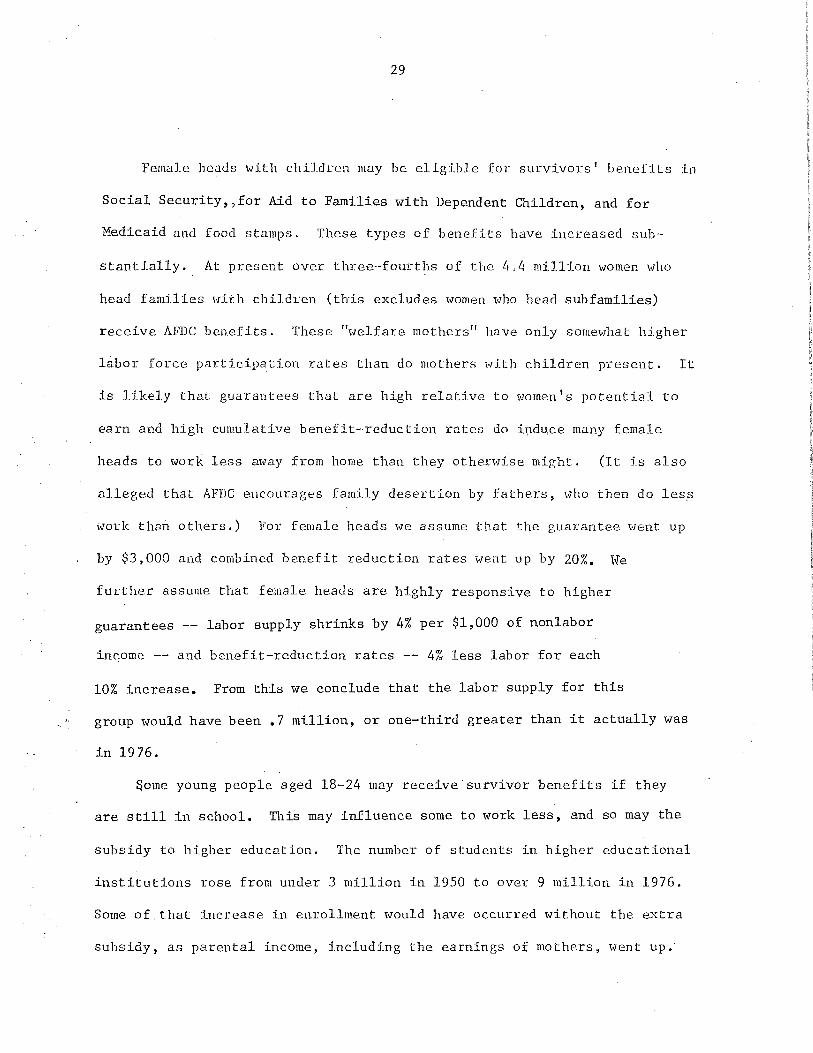
Female heads wJ.th children may be elig:i.ble for survi.vors' benefits in
Social Security,,for Aid to Families with Dependent Children, and for
Medicaid and food stamps. These types of benefits have increased sub
stantially, At present over three-fourt~1s of the. Lf, 4 million women who
head families with children (this excludes women who head subfamilies)
receive AFDC benefits. These "welfare mothers" have only somewhat higher
labor force participation rates than do mothers with children present. It
is likely that guarantees that are high relative to women's potential to
earn and high cumulative benefit--reduction rates do indu,ce many female
heads to work less away from home than they otherwise might. (It is a-lso
alleged that AFDC encourages family desertion by fathers, who then do les.s
w01:k than others.) For female heads we assume that the guarantee went up
by $3,000 and combined benefit reduction rates went up by 20%. We
further assume that female heads are highly responsive to higher
guarantees -- labor supply shrinks by 4% per $1,000 of nonlabor
income -- a~d benefit-reduction rates -- 4% less labor for each
10% increase. From this we conclude that the labor supply for this
group would have been .7 million, or one-third greater than it actually was
in 1976.
~ome young people aged 18-24 may receive survivor benefits if they
are still in school. This may influence some to work less, and so may the
subsidy to higher education. The number of students in higher educational
institutions rose from under 3 million in 1950 to over 9 million in 1976.
Some of.that increase in enrollment would have occurred without the extra
subsidy, as parental income, including the earnings of mothers, went up.·
30
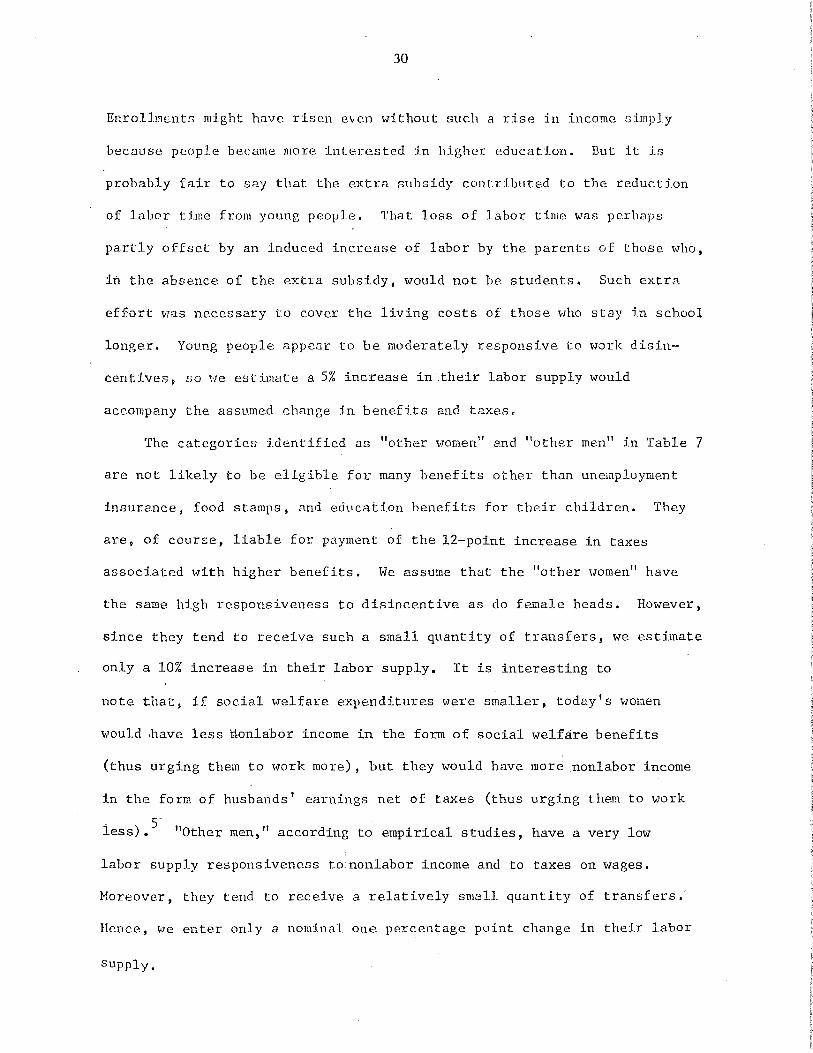
Enrollments might have risen e1.,en without such a rise in income simply
because people be.came more :l.nterested in higher eclucati.on. But it is
probably fair to say tl1at the extra subsidy contributed to the reduction
of labor ti.me from young people. That loss of labor time was perhaps
partly offset by an induced increase of labor by the parents of those who,
in the absence of the extra subsidy, would not be students. Such extra
effort was necessary to cover the living costs of those who stay in school
longer. Young people appear to be moderately responsive to work disin
centives, so we estimate a 5% increase in :their labor supply would
accompany the assumed change in benefits and taxes.
The categories identified as "other women" and 11other men" i.n Table 7
are not likely to be eligible for many benefits other than unemployment
insurance, food stamps, and education benefits for their children. They
are, of course, liable for payment of the 12-point increase in taxes
associated with higher benefits. We assume that the "other women" have
the same high responsiveness to disincentive as do female heads. However,
since they tend to receive such a small quantity of transfers, we estimate
only a 10% increase in their labor supply. It is interesting to
note that) if social welfare expenditures were smaller, today's women
would ,have less tionlabor income in the form of social welfare benefits
(thus urging them to work more), but they would have more .nonlabor income
in the form of husbands' earnings net of taxes (thus urging them to work
iess).5
- "Other men," according to empirical studies, have a very low
labor supply responsiveness to nonlabor income and to taxes on wages.
Moreover, they tend to receive a relatively small quantity of transfers.·
Hence, we enter only a nominal one percentage point change in their labor
Supply.
, . .;.i::
31
Our best guess is that the total "loss" of labor time due to the
increase of soc:lal welfare expenditures from 9 to 21% of GNP is on
the order of 7% of the 1976 total of labor time. Most of that loss
is allocable to those who are aged and di.sabled~ women. or young people.
It is perhaps unnecessary to ppint out thc:it output thus "lost" is
considerably leBs than 7% of GNP.
7. RELATIONSHIP OF SOCIAL WELFARE BENEFITS TO MEASURED UNEMPLOYMENT
Our 11 gue.stin1ate 11 that the increase of social welfare spending may
have induced a nloss" of about 7% of potential labor time does not
indicate. how that time breaks down in.to lowered labor force participation
rates, increased unemployment rates. and reduced hours worked by those
who are counted as employi?.d.
It is likely that all three of these numbers are affected by social
welfare benefits. In general, such benefits weaken the direct and
indirect beneficiaries' attachments to the labor market by softening the
penalties for not working and by reducing the rewar~s for extra work.
P~esumably· the offer of increased nonlabor income and the simultaneous
reduction of net wage income converts some potentially full-time, full
year workers into part-time, part-year workers. It en.ables and encourages .
people to make more gradual transitions from high school to the world of
work, to stay out of the labor force while rec.overing from the loss of a
father, and to move more gradually out of the labor force into retirement.
The increase in social welfare spending may have restrained the rate of
increase of women's participation in the labor market. To that extent,
such spending and taxing has kept the number of women who are still in
32
transttion toward a new and permanently higher level of market-labor
activity at a higher level than it would othen.d.se be (Ross and Sawhill, 1975).
The size of the measured labor force is most clearly reduced by the
increase in retirement and disability benefits. At the same time, however,
such benefits may encourage a rise in the number of aged and disabled
persons wl10 are working part time or part year in order to supplement
social benefits. Since limited work of this sort is associated with more
frequent job searches, it is likely that the number of· une.mployed persons
among those populations may rise. The same reasoning perhaps applies to
AFDC and Unemployment Insurance (UI), The relatively high rate of earnings
replace..ment (where the benefit is related to wages ne.t of taxes on earnings
and expenses of working) attracts people on to the.benefit roles, the
work-test keeps them in the measured labor force, and the high benefit
reduction rate discourages extra hours at work. Several studies suggest
that recent UI changes affecting the J.abor supply side may have added as
much as one-half a percentage point to the unemployment rate. Other
studies suggest that job-search requirements recently imposed with respect
to AFDC and food stamps may have added a somewhat smaller amount to the
measubed unemployment rate (Hamermesh, 1977; Cagan, 1977)0
Increased outlays for schools, associated with greater enrollments,
do not appear to have reduced the labor force participation rates of;16 to 24-
year--olds. Howcve.r, they have probably contributed to higher unemployment
rates and shorter hcurs in this age group. On the other hand, increased
enrollments in manpower training and work-experience programs add people·
33
to the labor force and to the number counted- as employed. In 19 76,
3% of the labor force was enrolled in such programs. 6
In offering these several speculations about the ways in which sc.,cial
welfare spending may alter conventional labor market measures> we are pain
fully aware of the part.ial nature of the analysis that underlies them. In
:t'eality t there are numerous interactions and intertemporal adjustments
among family members and between public and private transfers which we are
unable to account for. Moreover, there may have be.en important changes on
the demand side of the labor market which we have not examined. 7
Another difficulty is the lack of congruence between the concepts
customarily used in analyzing the state of the labor market and those used
in discussing the determinants of labor supply. The unit for counting the
labor force and unemployment is, of course. the individual, while the
approach used by labor supply analysts underlines t!ie significance of the
family unit. (Wives now earn 15% of total family income.) The
time period in labor force measurement is a week, but :lt is usually a year
or longer in studies of labor supply. Further, the two approaches differ
in the concept of income that is used. While labor market analysts
consider only wages, labor supply analysts emphasize the significance of
nonwage components of income, including home production and leisure. (At
the same U.me, we note the incompleteness of some labor supply studies
that relate quantity of labor supplied to wages unadjusted for in-kind
benefits or taxes or benefit-reduction rates.)
One important step toward harmonizing the two approaches, and one
which would recognize the transformation in the supply side of the labor
34
market associaXcd with the growth of social welfare spending, would be to
develop better measures of the number of persons who are searching for
only part-time or part-year jobs and the amount of fractional unemployment
actually experienced. Such measures would highlight the tentative and
transitional nature of labor force involvement of some persons who are
particularly affected by social welfare benefits and their concomitant
taxes and benefit-reduction rates. A second step would be for labor
market analysts to relate work sought and work performed to broadened
definitions of income and income-receiving units, thereby relating labor
supply to both net wage rates and to needs and preferences of inter-
dependent persons.
8. SUMMARY
This paper has addressed the question: would the current labor supply
be larger than it actually is if the post-1950 increases in the relative
importance of soc.ial welfare spending had not occurred, and if so, by how
much? We first concluded that there has in fact been some relative decline
in the quantity of labor supplied, but that there are more than sufficient
alternative explanations for this dee.line, To isolate the effect of
social welfare e.xpenditures we looked first to partial equilibrium theory
and second to correlations found by empirical researchers.
Following the lead of theorists, we divided the social welfare system
into two elements: (1) the lump--sum grants and the guarantees in earnings-
conditioned grants, all of which add to the nonlabor income of beneficiaries;
and (2) the taxes that go to finance the benefits and the-benefit-reduction
rates in the earnings-conditioned benefits, all of which combine to reduce
35
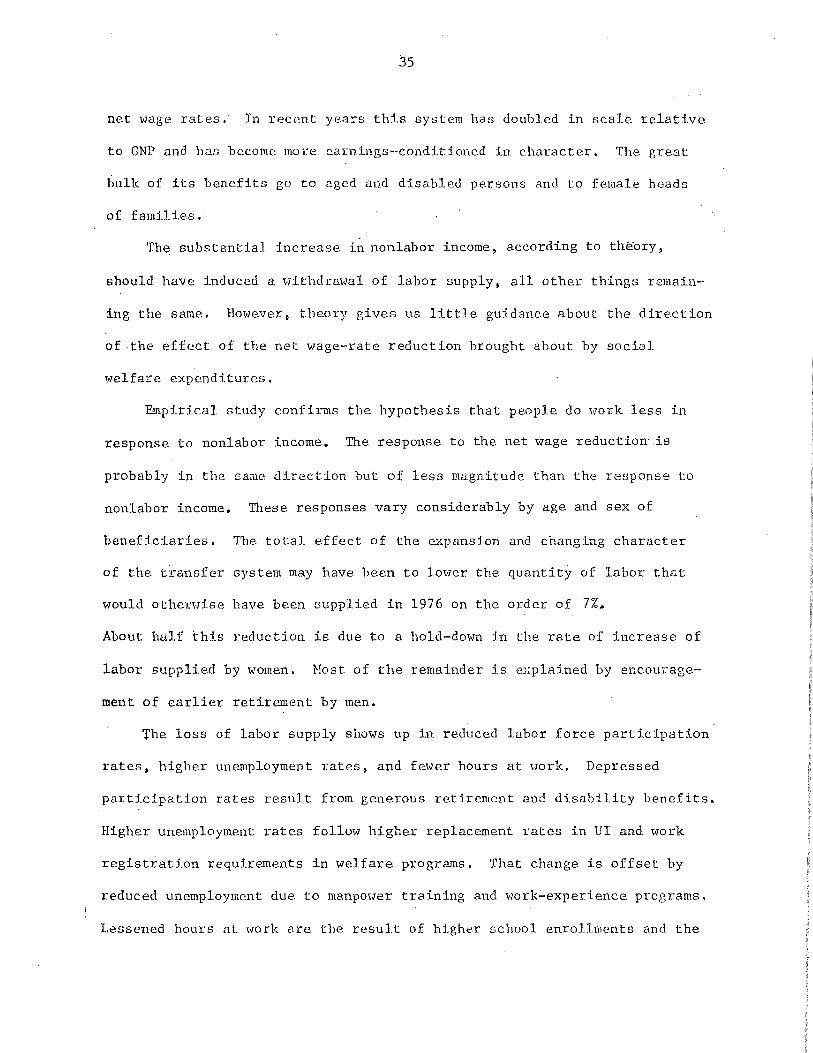
net wage rates.· In recent yea:::-s this system has doubled in scale relative
to GNP and has become mo1:e earnings--condit1oned in character, The great
bulk of its benefits go to aged and disabled persons and to female heads
of famil:Les,
Th~ substantial increase in n.onlabor income, according to theory,
should have induced a withdrawal of labor supply, all other things remain
ing the same, Howevert theory gives us little guidance about the direction
of the effect of the net wage-rate reduction brought about by social
welfare expenditures.
Empirical study confirms the hypothesis that people do work less in
response to nonlabor income. The response to the net wage reduction- .is
probably in the same direction but of less magnitude than the response to
nonlabor income. These responses vary considerably by age and sex of
beneficiaries. The total effect of the expansion and chang:Lng character
of the transfer Gystem may have been to lower the quantit)' of labor ths.t
would otherwise have been supplied in 1976 on the order of 7%i,
About half this reduction is due to a hold-down in the rate of increase of
labor supplied by women. Host of the remainder is explained by encourage
ment of earlier retirement by men.
'fhe loss of labor supply shows up in reduced labor force participation
rates, higher unemployment rates, and fewer hours at work. Depressed
participation rates result from generous retirement and disability benefits.
Higher unemployment rates follow higher replacement rates in UI and work
registration requirements in welfare programs. That change is offset by
reduced unemployment due to manpower training and work-experience programs.
Lessened hours at work are the result of higher school enrollments and the

36
general increase in nonlabor income and the wage rate reductions associated
with the growth of the social welfare system. Labor market analysts could
adapt measures of unemployment to reflect the increasingly tentative and
transitional nature of labor force involvement of people who are responding
to separate elements of income and who have varying family need.
37
NOTES
1rn this section, we rely heavily on Musgrave and Musgrave (1976).
2A major part of this literature is to be found in Cain and Watts
(1973).
3 Recently there has been a trend toward extremely high benefit-
reduction rates for some beneficiaries. This is particularly the case
for those people who simultaneously receive several income-conditioned
benefits and thereby are exposed to cumulative benefit-reduction rates
in the range of 100%. See Lampman (1975).
4A detailed, careful study of all taxes and expenditures found that
the fiscal system of 1970 was only slightly more redistributive than the
fiscal system of 1950. This outcome is partly explained by the fact that
the overall tax system became less progressive. See Reynolds and Smolensky
(1977).
5one recent study finds that the great bulk of "under-utilized earnings
capacity" is still that of females. Excluding the aged, students, and
military personnel, 21% of the total of such "slack" is attributed
to male heads and 11% to female heads and 68% to wives. See
Garfinkel and Haveman (1977, p. 25).
6s ' f h d ' f h 1 t t d t ome estimates o t ere uction o t e unemp oymen ra e ue o
these programs range around three-tenths of one percentage point. See
Cagan (1977).
7 The weakness of demand for labor is emphasized in the following
comment by Levitan and Taggart, "There is surely a tradeoff

38
between higher welfare standards and the number1of persons who work.
But considering the low productivity of the workers, their difficulty
in finding employment and the number of workers they would displace if
they found employment, the drag on the economy from their being on
welfare is small. It is iproper to resent handouts to those who can find
work, but it is wrong to view most recipients of social welfare as
loafers. As long as the policy of fighting inflation with unemployment
continues, the majority of beneficiaries do not have any choice between
work and welfare. The loss in output due to withdrawal from the work
force because of the availability of welfare payments is dwarfed by
involuntary unemployment [1976, pp. 285-286]."
39
REFERENCES
Barlow, R., Brazer, H., and Morgan, J. N. 1966. Economic behavior of
the affluent. Washington.,· D. C.: Brookings_ Institution.
Bowen, W. G., and Finegan, T. A. 1969. The economics of labor force
participation. Princeton,_ N.J.: ·Princeton University Press.
Break, G. F. 1957. Income taxes and incentives to work: An empirical
study. American Economic Review,!±]_, 529-549.
Brehm, C. T., and Saving, T. R. 1969. The demand for general assistance
payments. American Economic Review,~' 1002-1018.
Cagan, P. 1977. The reduction of inflation and the magnitude of
unemployment. Contemporary Economic Problems. Washington,_ D .C.: The
American Enterprise Institute.
Cain, G. G. 1966. Married women in the labor force. Chicago: University
of Chicago Press.
---, and Watts, H. W. (Eds.). 1973. Income maintenance and labor
supply: Econometric studies. Chicago: Rand McNally.
Colorado State Department of Public Welfare and the Denver Department of
Welfare. 1961. The incentive budgeting demonstration project, final
report. Denver, Colorado.
Cousineau, J.M., and Green, C. 1976. Causes of high unemployment in
Canada: 1970-1975. Paper presented at the Annual Meetings of the
Canadian Economic Association, May 31.
Economic Report of the President. 1978. Washington;· D .C.: Government Printing
Office.
Ehrenberg, R. G., and Oaxaca, R. L. 1976. Unemployment insurance,
duration of unemployment, and subsequent wage gain. American
Economic Review,_§_§__, 754-766.
40
Flaim, P. O. 1977. Impact of demographic and other noncyclical factors
on the unemployment rate. Unpublished paper.
Gallaway, L. E. 1966. Negative income tax rates and the elimination of
poverty. National Tax Journal, 19, 298-307.
1965. The retirement decision: An exploratory essay. U.S.
Department of Health, Education and Welfare, Research Report No. 9.
Washington, D.C.: Government Printing Office.
Garfinkel, I., and Haveman, R.H. 1977. Earnings capacity, poverty,
and inequality. New York: Academic Press.
Hamermesh, D. S. 1977. Jobless pay and the economy. Baltimore: Johns
Hopkins University Press.
Lampman, R. J. 1966. How much does the american system of transfers
benefit the poor? In L. H. Goodman (Ed.), Economic progress and
social welfare. New York: Columbia University Press.
1975. Scaling welfare benefits to income: An idea that is
being overworked. Policy Analysis,..!_, 1-10.
Levitan, S. A., and Taggart, R. 1976. The promise of greatness: 'The
social programs, ,of the last decade and their achievements.
Cambridge: Harvard University Press.
Mangum, G. L. 1976. Employability, employment; and income. Salt Lake
City: Olympus Publishing Co.
Masters, s. H., and Garfinkel, I. 1978. Estimating labor·supply·effects
of income maintenance alternatives. New York: Academic Press.
Mincer, J. 1967. Labor force participation of married women. Aspects
of Labor Economics, The National Bureau of Economic Research.·
Princeton: Princeton University Press.

41
Musgrave, R. A., and Musgrave, P. B. 1976. Public finance in theory
and practice (2d ed.), New York: McGraw Hill.
Pechman, J. A., and Timpane, P. M. (Eds.). 1977. Work incentives and
income guarantees: The New Jersey negative income tax experiment.
Washington, D.C.: Brookings Institution.
Rees, A. 1973. The economics of work and pay. New York: Harper.
Reynolds, M., and Smolensky, E. 1977. Public expenditures, taxes, and
the distribution of income: The United States, 1950; 1961; 1970.
New York: Academic Press.
Ross, H. L., and Sawhill, I. V. 1975. A time of transition. Washington, D.C.
The Urban Institute.
Sanders, T. 1951. Effects of taxation on executives. Boston: Graduate
School of Business Administration.
U.S. Department of Health, Education and Welfare. 1977. Social Security
Bulletin. Washington, D.C.: Government Printing Office.
U.S. Department of Labor. 1977. Employment and training report of the
president. ,Washington, D.C.: Government Printing. Office.
Watts, H. W. , and Rees, A. (Eds.) . 19 77. The New Jersey income maintenance
experiment, vol. 2: Labor supply responses. New York: Academic
Press.
---, and Skidmore, F. 1977. An update of the.poverty picture plus a
new look at relative tax burdens, Focus. Madison, WI:: Institute
for Research on Poverty, vol. 2.