Embed Size (px)
Citation preview

DI
SC
US
SI
ON
P
AP
ER
S
ER
IE
S
Forschungsinstitut zur Zukunft der ArbeitInstitute for the Study of Labor
Labor Disputes and Labor Flows
IZA DP No. 5677
April 2011
Henri FraisseFrancis KramarzCorinne Prost

Labor Disputes and Labor Flows
Henri Fraisse Banque de France
and IZA
Francis Kramarz CREST-INSEE, CEPR and IZA
Corinne Prost
CREST-INSEE
Discussion Paper No. 5677 April 2011
IZA
P.O. Box 7240 53072 Bonn
Germany
Phone: +49-228-3894-0 Fax: +49-228-3894-180
E-mail: [email protected]
Any opinions expressed here are those of the author(s) and not those of IZA. Research published in this series may include views on policy, but the institute itself takes no institutional policy positions. The Institute for the Study of Labor (IZA) in Bonn is a local and virtual international research center and a place of communication between science, politics and business. IZA is an independent nonprofit organization supported by Deutsche Post Foundation. The center is associated with the University of Bonn and offers a stimulating research environment through its international network, workshops and conferences, data service, project support, research visits and doctoral program. IZA engages in (i) original and internationally competitive research in all fields of labor economics, (ii) development of policy concepts, and (iii) dissemination of research results and concepts to the interested public. IZA Discussion Papers often represent preliminary work and are circulated to encourage discussion. Citation of such a paper should account for its provisional character. A revised version may be available directly from the author.

IZA Discussion Paper No. 5677 April 2011
ABSTRACT
Labor Disputes and Labor Flows* About one in four workers challenges her dismissal in front of a labor court in France. Using a data set of individual labor disputes brought to French courts over the years 1996 to 2003, we examine the impact of labor court activity on labor market flows. First, we present a simple theoretical model showing the links between judicial costs and judicial case outcomes. Second, we exploit our model as well as the French institutional setting to generate instruments for these endogenous outcomes. In particular, we use shocks in the supply of lawyers who resettle close to their university of origin. Using these instruments, we show that labor court decisions have a causal effect on labor flows. More trials and more cases won by the workers cause more job destructions. More settlements, higher filing rates, and a larger fraction of workers represented by a lawyer dampen job destructions. Various robustness checks confirm these findings. JEL Classification: J32, J53, J63, K31 Keywords: employment protection legislation, labor flows, labor judges, unfair dismissal,
France Corresponding author: Henri Fraisse Banque de France 31 Rue Croix-des-Petits Champs 75001 Paris France E-mail: [email protected]
* We are grateful to John Abowd, David Autor, Jed DeVaro, Marc Ferracci, Joop Hartog, Larry Kahn, and Iona Marinescu for useful comments. We also thank seminar participants at the Banque de France, Crest, MIT, New York University, University of Chicago, Yale University as well as participants at the EDHEC-GAIN-ADRES conference, IZA summer school, EALE conference, CPB workshop, and ESSLE conference. The opinions expressed here are the authors’ own and do not necessarily reflect the views of the Banque de France and Insee.

2
1 Introduction Following the seminal paper by Lazear (1990), the effects of employment protection legislation (EPL,
hereafter) on labor markets have been extensively examined through cross-country analyses, using
indicators supposed to capture the national strictness of EPL (see Freeman, 2005, for a critical review).
A recent strand of literature assesses the impact of EPL within countries, using changes in the
legislation. This strategy typically involves measuring the impact of a change in legislation targeted to
a specific category within a whole country or -- in the case of the US -- the impact of the differential
timing in the introduction of a new EPL across different states. Autor, Donohue, and Schwab (2006)
take advantage of the between-state variation in the timing of the introduction of labor laws in the US;
they find that the “implied-contract” exception law, meaning that the employer implicitly promised not
to terminate a worker without good cause, has reduced state employment rate by 0.8 to 1.7%. Boeri
and Jimeno (2005), using the 1990s tightening of the Italian regulation for firms with less than 15
employees, find that the threshold does matter in conditioning layoff and hiring probabilities but find
no significant impact on employment growth. Bauer, Bender and Bonin (2007) find no effect of the
change in the German EPL exemption for small firms on worker turnover. Martins (2009) reaches the
same conclusion using Portuguese matched employer-employee data. Marinescu (2009) finds that the
1999 change in employment seniority before being eligible to go to court in the UK – it went from 200
days to 100 – had a substantial impact on the firing hazard of the workers with one to two years of
tenure. Virtually all of these studies use some form of discontinuity across time and space in laws.1
Because there is no such variation in France where most legislation is set nationally (labor laws,
minimum wages...), such strategies are hard to translate into the French context.
This strand of research suffers from downsides other than its lack of applicability in France. First,
these studies do not provide information concerning the degree of enforcement of labor regulations.
To which extent these regulations were used by workers to defend their own interests? Are these
regulations actually binding for employers? For instance, in the case of the US, even if judicial
breaches to the employment-at-will doctrine have been judged by some state courts, we have little
evidence on the extent to which they are used or even known by the workers. Therefore, we do not
know if they act as a credible threat to the employment-at-will policy. The state of California
recognized the application of the covenant of good faith and fair dealing to employment relationships
in 1980. In March and April 1986, about 100 cases were filed in Los Angeles which implies an
approximate number of 1,000 for the entire year in the entire state2 (hence, about 80 cases per million
1 This is true of most of the other studies not cited in this paragraph. 2 In 1986, civil case filings in Los Angeles represented about 60% of all civil activity in the state of California.

3
workers).3 In comparison, for France, with a population and GDP close to those of California, 160,000
cases take place in any given year. Of course, one could argue that the law can act on the employer in
a pre-emptive way but, to capture any effect in the data, this impact should be very strong (or
conversely the impact on employment of labor courts should be extreme in France). Second, labor
laws are subject to court interpretation and tend to vary over time and space. As pointed out by The
OECD 2004 Employment Outlook, even if an employer may be sanctioned in case of non-respect of
EPL, “these provisions are subject to court interpretation and this may constitute a major (but often
hidden) source of variation in EPL strictness both across countries and over time”.
Therefore, opening the black box of the labor courts seems a promising path, in particular in the case
of France with little other source of meaningful variation, as mentioned above. Enforcement of the law
may indeed matter more than its content (see for example Bhattacharya and Daouk, 2002 who find
that insider trading laws decrease the cost of equity only when a case has been prosecuted). Yet,
empirically, problems of endogeneity abound: court interpretation with the ensuing impact might not
be exogenous as market conditions are likely to have an impact on the leniency of the courts, the
introduction of new laws, or workers’ propensity to go to court. Ichino, Polo and Rettore (2003), using
micro data on labor court cases, focus on this institutional endogeneity of EPL enforcement. Studying
the case of an Italian bank with roughly 20,000 employees among which 409 workers were fired and
86 of them went to trial over more than 20 years, they show that a higher unemployment rate increases
worker’s probability of winning her case. In contrast, Marinescu (2008) - using data from a 1992
survey of Employment Tribunal Applications in Great Britain - finds that a higher unemployment rate
leads to more decisions against the workers, in particular when they were already re-employed.
In this paper, we make the best of the constraints induced by the French system by using labor courts
to analyze the judicial process and its impact on the labor market. The French EPL system --
characterized by large separation costs, high workers coverage by collective bargaining agreements,
powerful unions -- is usually considered by international organizations as one of the strictest in the
developed world. It also produces every year a large amount of legal procedures related to individual
labor disputes (roughly 160,000 new cases every year, as we will see). About 1 in 4 dismissed workers
indeed challenges her dismissal in front of a labor court. These procedures are complex, costly, and
can last for months. It is these legal procedures that we analyze in this paper. We examine their
impact on employment flows. However, in contrast with virtually all of the literature, we do not focus
on legislation changes but on the judicial process itself. We measure case outcomes – trial rates,
conciliation rates… -- directly using all cases that took place in France between 1996 and 2003. We
relate these outcomes to the legal environment of each French local jurisdiction. We then try to
3 These figures are taken from Dertouzos (1988). Notice though that arbitrators operate in the US before intervention of the courts, but their efforts are not recorded in any registry (a point made by John Abowd).
4
understand how these legal outcomes affect job creations and job destructions within the jurisdiction
of each court, using flows measured at those establishments that are within the court jurisdiction.
To illustrate the links between judicial activity and labor dynamics, we build a simple model relating
firing costs to judicial activities of the courts. The firing costs have a direct effect on the probabilities
of hiring and firing for the firms (see for instance Bentolila and Bertola, 1990 for the theory and the
papers cited above for the empirics).
We use our model to look for potential instruments that could be applied in our empirical analysis. We
also use it to understand how indicators of judicial activity are linked to separations costs. The
complexity of this link comes from composition effects of those cases that go to court. These
composition effects have direct consequences on final separation costs: for instance, if only
“expensive” cases come to court, on one side the firm economizes on the extensive margin (less cases)
but pays more on the intensive margin (more expensive). Therefore, measured case outcomes do not
have a simple and univocal interpretation in terms of separation costs: a positive shock on the number
of trials may imply larger separation costs if the extensive margin is the main driving factor of the
costs, but it may also entail lower separation costs when those cases that go to court become
“cheaper”. This result does not only apply to labor courts but also to divorce or more generally to any
legislation that alters the decisions of workers, couples, firms when they contract, sue, or indeed go to
court.4
On the empirical side, our contribution is fourfold. First, we consider measures of judicial case
outcomes directly coming from legislation enforcement with variation across space and time. In
France, workers can contest the conditions of a firing by filing a case to one of the 264 local labor
courts. We use information collected by the French Ministry of Justice on all cases that were filed over
the 1996-2004 period to compute, for each geographical jurisdiction and each year, various indicators
characterizing the enforcement of the labor laws: the percentage of dismissed workers who litigate in
employment tribunals, the fraction of cases leading to a conciliation between parties, to a trial,
resulting in a worker’s victory, or the fraction of cases in which workers were legally represented. We
match these local indicators with local measures of the legal environment (lawyers, labor court judges,
and administrative staff in the tribunal) as well as local measures of job flows à la Davis and
Haltiwanger (1992).
Second, as we work at the level of France, a country in which many institutions are centralized and do
not vary across the French territory (minimum wage, unemployment benefits, wage bargaining…), we
4 This has not escaped some analysts; see for instance Stevenson (2007) on legislation and divorce rates.
5
are able to “control” for most of the French labor market institutions. Third, thanks to the precise
French institutional setting and those local measures of legal environment, we use an instrumental
variable strategy to correct for the endogeneity from which estimation of the relation between
economic conditions, including labor flows, and application of the labor laws might suffer. These
instruments rely on the location of universities training French lawyers, irrespective of their legal
specialization as well as on administrative features presiding over the allocation of judges and judicial
clerks across French territory. All these features are shown to be disconnected from local business
conditions. Then, we measure the effect of various case outcomes on employment flows. Fourth, as
noted above, because labor laws in France do not vary across local areas (see however Chemin and
Wasmer, 2009, on the noticeable exception of the working time reduction laws in one French region,
Alsace-Moselle and the one presented in this paper as a robustness check), a difference in difference
approach on changes in the legislation is difficult to implement in a French setting. Our local
enforcement indicators approach (paired with the appropriate instruments) offers one of the few
credible substitutes to this classic identification strategy, in addition one that has never been used, to
analyze France.5
As in all of the empirical papers we are aware of, our paper focuses on the impact of labor regulations
on labor market characteristics and leave aside the welfare gains from job stability which must be
taken into account for policy recommendations.6 However, and in contrast with the existing empirical
literature, our labor court outcomes capture some dimensions of the quality of labor relations which
according to Blanchard and Philippon (2004) or Algan and Cahuc (2009) are related to the evolution
of labor market conditions.
To briefly summarize our results, we show that labor court decisions have a causal effect on labor
flows. More trials and more cases won by the workers cause more job destructions. More settlements,
higher filing rates, and a larger fraction of workers represented by a lawyer dampen job destructions.
Section 2 describes the French labor courts institutional setting. Section 3 presents a simple theoretical
model relating the case outcomes to firing costs. Section 4 describes our data sets and the instrumental
variables. Section 5 explains our empirical methodology to capture causal effects and presents our
regression results on labor flows. We briefly conclude.
5 See however Bertrand and Kramarz (2002) who use political instruments to capture the impact of zoning regulations on retail employment. 6 See Bertola (2004) for a theoretical model considering risk-averse workers and potential positive effect of EPL on welfare.

6
2 Labor Courts in France: the Institutional Setting
2.1 French Firing Laws Under the current French law, separations are classified in two types: dismissals for a personal motive
and dismissals for an economic motive. Economic dismissals are redundancies due to a slowdown in
the business activity. Individual dismissals (personal motive) occur when the firm’s decision to fire a
worker is triggered by a grave misconduct of the worker or an insufficient level of competencies. In
France as in many European countries, an economic dismissal entails a more complicated and time
consuming process as well as the payment of large severance fees. On the contrary, a dismissal for
misconduct is a faster process - if not challenged by the worker or if confirmed by the labor court.
Thus the dismissal for “just” cause implies a lower firing cost than a redundancy. When fired, a
French worker might sue the firm.7 Since a bill passed in 1973, every individual dismissal must be
justified by a “real and serious cause” and the firm has the burden of proof. Without delving deep into
30 years of jurisprudence that have made this concept simultaneously blurred and precise, “real”
means that the wrongdoing justifying the dismissal must be objectively defined, accurate, and in line
with the mandatory firing notification letter. For example, being ten minutes late does not mean being
seventy minutes late; a lack of performance or a lack of trust is not considered “real” if it is not
objectively measured. The cause is considered as “serious” only if it is related to the professional
activity of the worker and if it makes the labor relation impossible to continue. There are various
degrees of “seriousness”. Some lead to “grave misconduct” (for example brawl or thievery) which
allows the employer to fully deprive the worker of severance payment (in this case, the employee may
lose her unemployment benefits).
2.2 French Labor Courts
The French labor justice is mainly dispensed by the “Prud’hommes” which is the relevant jurisdiction
to every labor dispute arising at the individual level in France. In the 90’s, 264 Prud’hommes
jurisdictions were spread all over metropolitan France, a tribunal being at most within a radius of 30
miles from any establishment.
There are several sections in each Prud’hommes. As the legislators wanted to take into account
industry characteristics of the cases brought to court, each Prud’homme is divided into 4 sections
according to the main activity of the firm: Agriculture, Retail Trade, Manufacturing, and Other
Activities (mainly Services). A fifth section is dedicated to cases involving “managers, engineers, and
professionals” irrespective of the activity of the firm.
7 The worker has to leave the firm when fired, even if she sues the employer. In the end, the court may reinstate the worker within the former employing firm, but this is extremely rare.

7
The judges in the Prud’hommes are not professional judges and are seen by some as performing a
public duty. Each labor court comprises judges representing employers and judges representing
employees in equal number. These judges are elected every five years within lists established by
worker unions and employer federations. On the employee side, the electoral body includes all private
sector workers with a labor contract.
Prud’hommes are supposedly not very formal and should be seen as conciliation boards. They were
designed to foster agreements rather than trials. Therefore a first and mandatory step in each trial is a
conciliation audience where plaintiffs and defenders explain their grievance and judges try to push for
an agreement.8 If they do not, the case is judged. If, in the end, an equal number of judges decide in
favor of a worker and against her, there is a tie (“solution de départage”). In this case, a single
professional judge decides the outcome of the trial.9
A majority of plaintiffs are represented by a lawyer.10 The plaintiff or the defender can appeal the
decision of the court if the stake is larger than a given threshold (about 5,000 euros in 2006). It is
worth noting that 60% of the decisions were appealed in 2004. Among them, 55% of these appeals did
not overrule the Prud’hommes’ decision, 30% confirmed it “partially”.11
For any given case filed in a labor court, the range of outcomes is wide. A case can lead to a full
tribunal hearing and be lost or won. It can be classified as null and void if the plaintiff has not shown
due diligence in the conduct of her case. The case can also be crossed out. Finally, a case can either be
conciliated during the conciliation step or outside the tribunal with a formal agreement sent to the
court.
The motives for suing are multiple. The nullification of a dismissal is asked in the majority of cases
(58%).12 21% of plaintiffs ask for some compensation that was not paid by their former employer
whereas 9% of plaintiffs do not agree with the level of their severance payment. In this paper, we do
not distinguish between these different motives.
8 It is worth noting that to this respect, the French setting is close to almost every OECD country, where courts usually attempt to reach a compromise solution at the start of formal legal proceedings (see Venn, 2009). 9 Moreover, in case of an emergency, a summary judgment can be made. However, such judgments are only temporary and might be overruled afterwards. In this paper, we do not consider these summary judgments. 10 Firms are also often represented by a lawyer. 11 Munoz-Perez and Serverin (2006). Unfortunately, current available data sets do not allow us to track the cases across the levels of jurisdictions; whether the decision is appealed by the worker or the firm is unknown. 12 In the very vast majority of the cases won by the workers, they are not reinstated but receive a compensatory award.

8
3 Judicial Activity and Firing Costs: a Simple Theoretical Model We develop a simple analytical model determining the relationships between judicial activities and
firing costs, taking specifically into account the conciliation step in the judicial process. Our intention
is not to break new theoretical ground but rather to focus ideas. We do not study here the theoretical
impact of firing costs on labor market variables. This has been extensively examined elsewhere.
Larger firing costs should entail slower and smaller adjustments than separations inducing no costs
(see for instance Bentolila and Bertola, 1990 and Bertola, 1992).
To illustrate how firing costs are related to case outcomes, we depart from the traditional model of
litigation proposed by Priest and Klein (1984) or Bebchuk (1984) or more recently Card and McCall
(2009) to run a cost-benefit analysis similar to the one proposed by Flanagan (1989) for disputes
related to the compliance to the National Labor Relations Act in the US. For simplicity, the model that
we describe below has no uncertainty, no asymmetric information that would explain why trials take
place; everything is known and predictable; we will come back later on this topic and discuss how our
results are affected by asymmetric information.
In our analysis, the employer can deliberately choose to pay a minimal firing cost with the risk to be
sued by the worker; or to pay a larger amount, which corresponds to the payment a plaintiff would
accept in order to give up any further possibility of lawsuit. Important to note here that this last sum is
not negotiated between the firm and the worker, but is directly coming from legal precedents
(jurisprudence). In France, it amounts to one to two years of earnings. Another way of understanding
the model is as follows: a firm chooses to dismiss the worker either for a personal motive, paying a
small severance payment, or to dismiss the worker for an economic motive (redundancy) with larger
severance payments.13 Our hypothesis, then, is that when firms pay the severance payment
corresponding to a redundancy, the workers never choose to sue the firm (indeed, 97.5% cases in our
data come from dismissals for personal motive rather than redundancies). When the worker goes to
court after a dismissal, the firm has to prove that the case is a legitimate dismissal for personal motive
rather than a redundancy.
In the case of a dismissal for personal motive, the firm incurs a minimum severance payment (cm) if
the dismissal remains unchallenged by the worker. This payment cm is lower than the maximum
severance payment cM , which leads the worker not to sue the firm. Yet the firm has to take into
account the facts that the worker can file a suit (pf =1 if he does, pf =0 otherwise) and that he can then
end the case with a formal agreement in front of the judge (pc =1 if he does, pc =0 otherwise). The firm
also knows the probability that the worker wins if the trial occurs, pw. We assume that during the 13 For an empirical illustration of a trade-off between two litigation processes, see Oyer and Schaefer (2000).

9
conciliation step, the judge tries to reach an agreement using an “intermediary” severance payment cc,
given by the jurisprudence, always lower than cM. Note that in order to simply introduce the co-
existence of a conciliation stage and a trial stage we consider cc to be constant. The firm cannot
increase cc in order to avoid the trial.
Uncertainty of the entire process is summarized through pw. The firm and the employee share this
value. In this cost-benefit analysis, we assume that the quality of each case is known by both parties
and is related to observed characteristics of the workers and of the firms.14 For instance, union or
personnel delegates or pregnant women are very well protected by the law, and the judges are very
strict against dismissals of such individuals. Several past statements of judgments also show that
judges demand more stringent evidence when a firm has had large positive profits in the years
preceding the trial.15
At this point, the model has no uncertainty, no asymmetric information that explains why trials take
place. Theoretically, firms and workers should agree on a payment in order to avoid the litigation
costs. Two features could be added to the model in order to explain why firms and workers go first to
the Prud’hommes and then, if ever, to trial. First, costs for reaching an agreement without any
mediator like the judge could be larger than the costs at the conciliation stage. This seems plausible
since the Prud’hommes institution is seen as a public good and the conciliation stage is essentially
free. Second, in line with the literature in which trial is an equilibrium outcome, we can assume that
the worker and the firm have different and irreconcilable expectations on the outcome of the trial. This
assumption would lead to a “contract zone” where a settlement amount can be found (see Bebchuk,
1984). When the expectations are not in the contract zone, the trial takes place; else an agreement can
be found at the conciliation stage. Because there is a need to model expectations, computations
become much less tractable. The model loses its simplicity without gaining much insight for our
purpose. In addition, as underlined by Spier (2007) such a model does not fully solve the litigation
puzzle since the conciliation stage should help the expectations to narrow. Again, it is possible to
assume two stages of narrowing expectations, one leading to conciliation, one to the trial.16 From this
discussion, it is however interesting to note that workers employed in large firms are virtually absent
from the Prud’hommes. In line with the above discussion, the various probabilities should be better
known by the human resources management and union delegates that are always present in the larger
firms. Hence, they should escape trials and easily agree on separation payments, as is observed. In
small firms, conflicts become often personal and difficult to solve without the help of a neutral third
party, a role apparently played by the Prud’hommes. 14 As mentioned above, this assumption is discussed below. 15 Unfortunately, the data do not contain a firm identifier. Hence, it is not possible to directly relate firm and worker behavior. 16 Computations not included in the Appendix are available from the authors.

10
Now, let us go back to our model. If choosing cm the expected firing cost for the firm is:
( ) ( ) ( )[ ]{ } ( ) mftmwmwccccf cplcpFcpplcppcE −++−++−++= 11)1()(
where F is a compensatory award for the worker, cl is the firm’s litigation cost when the parties reach
an agreement at the conciliation stage, and tl is the firm’s litigation cost when the parties go to trial.
Otherwise, the severance payment is Mc .
As for the worker, if the firm chooses cm, the expected severance payment is:
( ) ( ) ( )[ ]{ } ( ) mftmwmwccccf cpkcpFcppkcppsE −+−−++−+−= 11)1()(
ck being the cost of litigation for the worker at the conciliation stage, tk being the cost at the trial
stage. Otherwise, the received payment is Mc .
The parameters pf and pc result from the optimization from the firm and the worker and equal one or
zero. The worker chooses to go to court or not; and in that case to accept the conciliation or not. The
firm chooses to pay cm or cM; and, if at the court, to accept the conciliation or not.
We define: Fkp t
w = , F
kkccp ctmcw
−+−= ,
Fllccp ctmc
w
+−−=* , and
Flcc
p tmMw
−−=**
Under several assumptions (see Appendix), there are four equilibria, depending on the value of wp :
Equilibrium (1): for small probabilities ww pp < , the firm pays cm and the worker does not go to
court ( 0=fp and 0=cp ) since the firm would refuse the conciliation and the gain at trial would be
negative for the worker.
Equilibrium (2): when www ppp << , the expected gain of the worker at trial is positive. She can
credibly threat the firm to go to a full hearing. Since ww pp <* the firm accepts to settle with the
worker. The settlement amount is lower than the expected loss of the firm at trial but larger than the
expected gain of the worker. ( 1=fp and 1=cp ).
Equilibrium (3): when **www ppp << , the worker is better off at the trial stage and refuses to
conciliate anymore ( 1=fp and 0=cp ).

11
Equilibrium (4): when **ww pp > , the firm pays Mc since it would be too costly to go to court.
The firing cost, depending on the probability of winning of the case, is shown on Figure 1.
Fig. 1: Firing Cost
Discussion: We consider that firms are facing an invariant distribution of case quality. This model
shows that changes in the litigation costs have intuitive impacts on the global firing costs; yet the
results on the case outcomes are ambiguous. For instance, an increase in the firm’s litigation cost at
trial tl implies a decrease in **wp (see Figure 2). The firm will be more likely to fire high probability
workers with an economic motive to avoid lawsuits. It will also increase the relative cost of a trial with
respect to conciliation. The expected firm’s cost at trial will rise. All these changes lead to an increase
in the firing cost, a decrease in the trial and filing rates. Hence, a smaller number of trials and filing
cases appear to be associated (in some cases at least) with more EPL.
wp mc
Mc
( ) tmwmw lcpFcp +−++ 1)(
**wp
wp
no judicial case no judicial case conciliation trial
wp
cc lc +

12
Fig. 2: Firing Cost, Case Outcomes and an Increase in the Litigation Costs for the Firm
Let us study the following case that stands in stark contrast with the previous one (see Figure 3). An
increase in workers’ litigation costs kt will induce a decreased probability for the workers to file a case
(through a higher wp ) as well as more workers that prefer to conciliate (through a higher wp ). In this
situation (contrasting with the previous one), a smaller number of trials is associated with lower total
firing costs. In fact, our model shows that firing costs directly depend on variation in input costs; yet
the link with case outcomes is ambiguous.
wp mc
Mc
( ) tmwmw lcpFcp +−++ 1)(
**wp
wp
no judicial case no judicial case conciliation trial
wp
cc lc +

13
Fig. 3: Firing Cost, Case Outcomes and an Increase in the Litigation Costs for the Worker
4 Data and Methodology
4.1 Judicial Cases Data
Our data source on individual cases comes from administrative records made at the level of each
geographical jurisdiction and collected by the statistical department of the French Ministry of Justice.
The primary goal of these data is to monitor the activity of labor courts with an emphasis on speed of
treatment. The data source is exhaustive for the period 1996 to 2003. It includes approximately 1.5
millions individual cases.17
For each case, the starting date, the ending date, the motives for dismissal, and the court decision are
recorded. An average case takes approximately one year (343 days) with a standard deviation of 9
months.18 For each case, we know the legal representation chosen by the firm and the plaintiff. Few
characteristics of the employee-plaintiff are available: mainly gender and age. As for firms’
characteristics, we know the industry, the size (more or less than 10 workers), and the Prud’hommes 17 We will not consider the 2% of cases involving employers as plaintiffs. 18 Because we use jurisdiction-level information for our analysis, rather than case-level information, our Tables will report jurisdiction-year statistics. All case-level statistics are available from the authors on request.
wp mc
Mc
( ) tmwmw lcpFcp +−++ 1)(
**wp
wp
no judicial case no judicial case conciliation trial
wp
cc lc +

14
section of the employing firm (i.e. the industry broadly defined). The size of the firm has to be known
by labor court judges because labor laws differ for small firms; more specifically, they are less
stringent and try to ease the financial costs of firing that could hurt them irreversibly. Small firms are
overrepresented with 56% of the filed cases whereas they comprise 25% of the labor force.
These data on individual cases are used to compute several aggregate measures of the cases examined
in each jurisdiction-year pair. The first indicator relates to litigiousness: the filing rate, number of
cases over the number of dismissed persons.19 The second indicator relates to representation: the
worker lawyer rate, number of cases where the worker is represented by a lawyer over the number of
cases. The three other indicators describe the main outcomes of the cases, which are: the worker and
the firm manage to conciliate, or they go to trial, and in that case, either the worker wins or not. Thus
we build three indicators: the conciliation rate, number of cases conciliated or having led to an
agreement over the number of cases; the trial rate, number of cases having reached trial over the
number of cases;20 the worker winning rate, number of cases having led to a victory for the worker
over the number of cases (see Table 1 for the definition of the indicators).
Admittedly starting from a high base, we do not observe in France a strong increase in the number of
cases brought to the labor courts over our period; during this period, no change were made to the labor
laws. In absolute terms, the number of filed cases increased by 10% over the 1990 to 2004 period. The
number of cases treated by labor courts appears to be stable over the period, in stark contrast with
what happened in some countries such as the UK where a sharp increase took place (see Figure 4 and
Burgess, Popper and Wilson, 2001). It is important to note that the percentage of filed cases among the
dismissed persons is large (mean of 22%, see Table 2). Almost one dismissal over four ends at the
labor court.
Despite the conciliation step which is mandatory, and promotes a quick and costless resolution of the
cases, about 60% of cases end by a trial, among which 75% lead to a worker’s victory (see Table 2).
Of all filed cases, only 20% end at the conciliation stage, or lead to an agreement notified to the court,
or to a withdrawal on the worker’s side. In comparison with what is observed in a country such as the
UK, almost half of the workers are represented by a lawyer despite other available means of
representation.
19 No exhaustive statistics give the number of dismissed persons in France; we are thus obliged to have a proxy through the number of registered unemployed who declare being unemployed because of a dismissal. These figures come from a data set compiling the unemployed registered at the national employment service (ANPE at this time) in each city, distinguishing the reasons for being unemployed (dismissal, entry into the labor force, end of temporary contract…). As for labor flows (see below), we aggregate these data at the jurisdiction level. 20 Because cases can also be dropped, the sum of the conciliation and of the trial rates is smaller than one.

15
All indicators of judicial activity display a very strong variance over time and across jurisdictions.
Our model can help us understanding two main sources of variability: business cycle and litigation
costs. Section 4.3 will discuss the links between the business cycle and the judicial activity, which are
a source of endogeneity. Then we will explain that institutional variability in the number of judges,
lawyers and staff, entail different litigation costs at the jurisdiction level. This will give us our
instruments.
4.2 Labor Flows Data
Local employment flows at the establishment level are computed from the SIRENE files, maintained
at the French statistical institute (INSEE). These files give the precise location (city) for each
establishment. We compute a set of Davis and Haltiwanger (1992) indicators over the 1996-2004
period: job creation, job destruction, and net job creation rates. Job creation is positive for an
expanding or new business, and null for other establishments. On the opposite, job destruction is
positive for a shrinking or exiting business, and null for others.
These measures are aggregated at the jurisdiction level, using a 1999 correspondence between cities
and jurisdictions provided by the Ministry of Justice. The rates of job creations and job destructions
from year t to year t+1 are computed relative to average employment in the two years. In comparison
with cross-country analyses, these indicators also show a high heterogeneity across periods and across
the 264 geographical jurisdictions. The job creation rate and the job destruction rate evolve around an
average of 16%; thus the mean of the net job creation rate is zero (see Table 2).
To measure local unemployment, we use the number of unemployed as registered at the public
employment office (ANPE) for each city as well as the city labor force as measured at the 1999
Census. Unfortunately, there is no data set giving us, at the local level of the city, the size of the
temporary help service industry. Hence, we cannot perform an analysis as done in Autor (2003).
However, in contrast with other European countries (such as Spain), the fraction of temporary workers
in French total private employment is low (about 2.5% in 2009).
4.3 Instrumental Variables: Discussion and First Stage
We want to assess the causal effect of our indicators describing labor disputes on labor flows. Yet the
judicial activity is likely to be endogenous. Our model can be used to discuss the endogeneity
problems that we will face when estimating the relations between case outcomes and labor market
characteristics. For instance, an adverse shock on the labor market conditions can affect case
16
outcomes. First, according to the legislator, F compensates the worker for past and future potential
wage losses, in particular by taking into account the difficulty of finding a new and comparable job.
The magnitude of F is therefore likely to be countercyclical.21 An economic downturn pushes wp ,
wp , and **wp downwards which results, other things being equal, in higher firing costs. Moreover, if
workers exert more effort on the job during a downturn (with an efficiency wage story in mind), the
overall distribution of pw will shift upwards. Third, economic conditions might also alter the overall
distribution of pw through judges’ behavior. Judges showing a pro-worker bias when labor market
conditions deteriorate increase the firing costs faced by the firms (see Ichino et al., 2003).
Thus we need instruments which explain the average outcomes observed at the level of the jurisdiction
and are exogenous to current labor market developments. We claim that the local legal environment
and the institutional settings of the jurisdictions themselves both provide us with convincing potential
instruments because, as our model discussed, they are related to case outcomes by affecting various
payments and costs of litigation and because their variations within each jurisdiction are essentially
random.
a) Lawyers
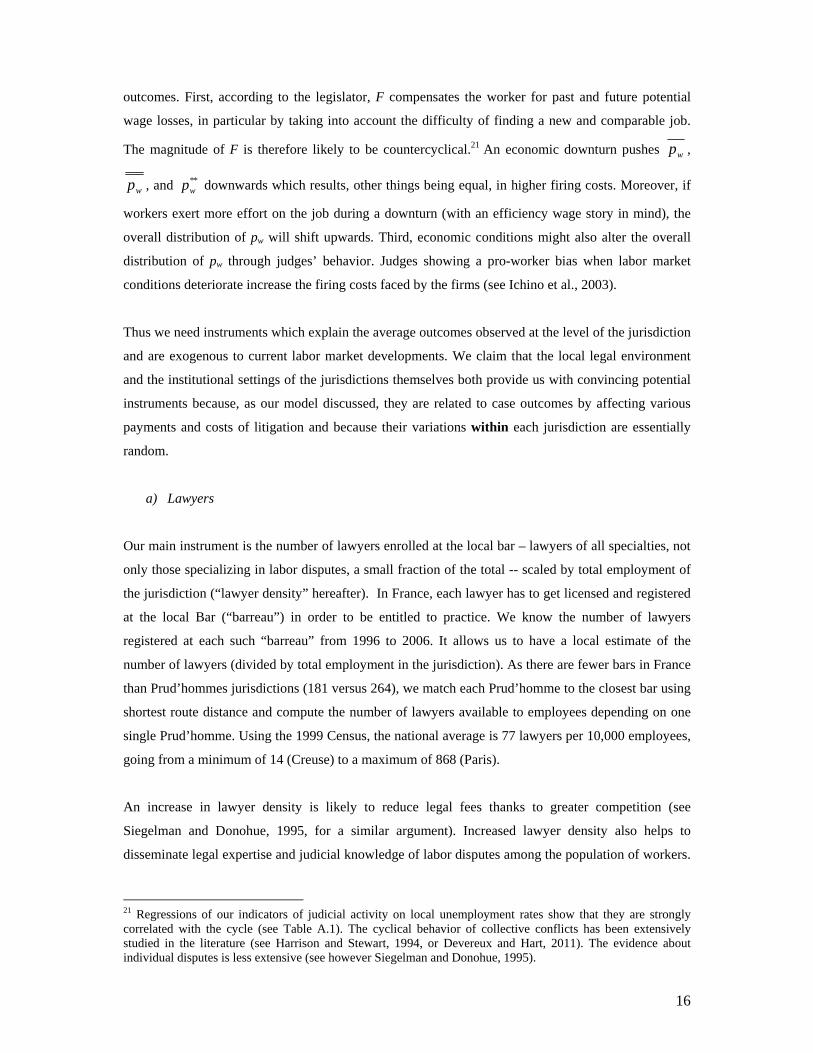
Our main instrument is the number of lawyers enrolled at the local bar – lawyers of all specialties, not
only those specializing in labor disputes, a small fraction of the total -- scaled by total employment of
the jurisdiction (“lawyer density” hereafter). In France, each lawyer has to get licensed and registered
at the local Bar (“barreau”) in order to be entitled to practice. We know the number of lawyers
registered at each such “barreau” from 1996 to 2006. It allows us to have a local estimate of the
number of lawyers (divided by total employment in the jurisdiction). As there are fewer bars in France
than Prud’hommes jurisdictions (181 versus 264), we match each Prud’homme to the closest bar using
shortest route distance and compute the number of lawyers available to employees depending on one
single Prud’homme. Using the 1999 Census, the national average is 77 lawyers per 10,000 employees,
going from a minimum of 14 (Creuse) to a maximum of 868 (Paris).
An increase in lawyer density is likely to reduce legal fees thanks to greater competition (see
Siegelman and Donohue, 1995, for a similar argument). Increased lawyer density also helps to
disseminate legal expertise and judicial knowledge of labor disputes among the population of workers.
21 Regressions of our indicators of judicial activity on local unemployment rates show that they are strongly correlated with the cycle (see Table A.1). The cyclical behavior of collective conflicts has been extensively studied in the literature (see Harrison and Stewart, 1994, or Devereux and Hart, 2011). The evidence about individual disputes is less extensive (see however Siegelman and Donohue, 1995).

17
It should correspond to a lower cost of litigation for the worker ( tk and ck in our model) and hence
influence the judicial activity and the case outcomes. This result of our model is true even without
assuming that being represented by a lawyer increases the probability of winning.
One could argue that the lawyer’s choice of location depends on local economic conditions. First,
labor disputes are only a small amount of the total number of civil cases (11% at the national level22).
Second, in order to get a license to practice, a lawyer must enroll the local bar which jurisdiction the
Prud’homme belongs to. This requirement and the building of a reputation and a clientele induce a low
mobility of lawyers from one region to another. Moreover, a lawyer typically enrolled the bar the city
where she studied and, hence, her location preference is likely to be unrelated to the incidence of labor
disputes litigation. To see this, first note that there are only twelve law schools spread over French
territory (see Figure 5). Then, observe the strong overlap between these areas where lawyers are
trained and those that see the strongest increase in lawyer density over our time period (see Figure 6).
Further supporting the identifying assumption that local labor market conditions are disconnected from
the increase in lawyer density, lagged labor flows are found to have no predicting power on lawyer
density when including jurisdiction fixed effects and year dummies (see Appendix Table A.2). Thus
changes in lawyers’ density within a Prud’homme should influence judicial outcomes through the cost
and the efficiency of the litigation process. These changes are likely to be exogenous with respect to
current labor market developments because lawyers’ mobility is mostly driven by exogenous supply
shocks due to lawyers’ location preferences, therefore making it a plausible instrument.
b) Judges and Judicial Staff
We also consider as instruments the number of judges and staff in charge of dealing with judicial cases
(scaled by the local 1999 labor force). Both categories obviously have an impact on judicial decisions
as well. Judicial activity can be modeled as a production function for the case disposition. Beenstock
and Haitovsky (2004) using a panel data on Israeli courts find that judges complete more cases as their
caseloads grow and complete fewer cases when new judges are appointed to their court. In the case of
Prud’homme, the sociological literature23 supports this result and states that facing an increasing
number of cases and having to meet some productivity requirements, judges tend to be more
meddlesome implying crossing out more cases for administrative reasons to speed up the process and
lighten their burden. More judges or staff would imply a decreasing marginal cost of challenging the
22 See available on line Info Stat justice (2005) « Une évaluation de l’activité des juridictions en 2004 » n° 80. 23 See Bonafé-Schmidt (1987).

18
dismissal following Buchanan’s club theory of public goods and thus increase the firing costs through
a smaller tk .24
Judges
Prud’hommes’ judges are unequally spread over the French territory. Before 1979 when the “Réforme
Boulin” took place, the administrative cost of the Prud’hommes was borne by the local administration
and their creation mostly depended on a bargaining process between unions, firms, and this local
administration. For instance, in those years (before 1979), 6 “départements”25 out of 95 did not have a
single labor court. In 1979, a legislation strongly supported by the Minister of Labor Robert Boulin
transformed the financing and made it depend exclusively on central government resources. In
addition, at least one labor court had to be present in every zone that also had a civil tribunal
(“Tribunal de Grande Instance”). Since then, every additional change in the number of judges within a
labor court or the opening of a new labor court depends on the outcome of a bargaining between the
unions, the employers’ federations, the local, and the national government. The process is supervised
by a national agency (“Conseil national de la Prud’hommie”). This system generated strong rigidities
with the consequence of essentially freezing the number of judges. This number stayed roughly the
same from 1979 until 2008, with some small changes in 2002; every bargaining party preferring the
status-quo. In 2008, the reform of the judicial map leading to the closing of 66 Prud’hommes out of
264 took stock of the misallocation of judges across the French territory.
The rigidities can partly be explained by the role of the unions within the Prud’hommes system. As
explained before, labor courts are divided into 4 “sections” according to the industry of the firm
(Agriculture, Retail Trade, Manufacturing, Services) and a fifth section for the “Cadres” (engineers,
managers, and executives). Then, voting for the employees’ unions and for employers’ federations
takes place every 5 years in order to elect judges. These elections are crucial for trade unions as they
are the only way to assess unions’ representativeness at the national level.26
However, the number of judges is decided by a different procedure. Over our sample period, 2 rounds
of elections took place, in 1997 and in 2002. For each round, we collected from the Ministry of Labor
24 In our approach, the congestion of the labor courts increases the cost of litigation which deters workers either to file or to refuse the settlement and therefore decreases the firing cost. Two recent papers by Besancenot and Vranceanu (2009) and Stähler (2008) relate labor courts to labor markets through the existence of “judicial mistakes”. The congestion of the court pushes upward the number of judicial mistakes. Bad type workers – that is workers that have rightly been fired for a personal motive – have an incentive to go to court gambling on a judicial mistake. This is found under some assumptions – and contrasting with our view – to have an increasing impact on the firing costs. 25 A French “département” is equivalent to an American county. 26 See Andolfatto (1992) for a political analysis of these elections.

19
the share of judges affiliated with each union as well as the number of judges by section at the
jurisdiction level. The number of judges did not change between 1996 and 2001 (see Table 3).
Changes took place only in 2002 (see Table 4).27 Digging into administrative archives of the French
Ministry of Labor, the number of cases brought to labor courts seems to be the main apparent
quantitative indicator used to decide these changes.28 But, even after the minor changes that took place
in 2002, the number of judges is far from being tightly related to labor market size or court activity
and seems to be the outcome of complex negotiations with little relations with labor market
developments, even more so for the changes that took place between 2001 and 2002. One empirical
illustration of this disconnection is given in Table A.2 where lags of labor flows are unable to predict
the number of judges. Another illustration is given in Table A.3. The disconnection between labor
market changes (changes in the shares of industries) and the changes in the number of judges mainly
stem from the role of the CGT, the most important union in France. The CGT is traditionally well
represented in manufacturing and is reluctant to accept a reduction in the number of judges allocated
to the manufacturing section, even if the share of workers employed in the manufacturing industry has
declined in the geographical area. To illustrate this point, we regress the changes in the number of
judges that took place in 2002 on the changes in employment between 1993 and 2002 in the same
industry. We clearly see that there is no significant association between these changes in
manufacturing and that the service and the trade industries are both locally under-represented (both
initially and in the changes). Hence, we believe that the process of allocation of judges is independent
of local labor market developments and reflect “political” forces.
Judicial Staff
In the vein of our lawyer density indicator, we consider the total number of civil servants from the
Ministry of Justice working at the civil court independently of the type of cases they deal with. We
obtained the number of “greffiers” (clerks) employed by the Ministry of Justice attached to tribunals in
the area of each “Tribunal d’instance”29, closest to the labor court (“Staff” hereafter) over the 1992-
2004 period. “Greffiers” are civil servants in charge of all the administrative tasks, which include
assisting the workers in filing their cases as well as writing the judgment terms.
The allocation of these clerks is centrally set (by the Ministry of Justice). Their allocation planned at
the national level responds to budget constraints and changes in the local caseload. At stressed before,
27 Hence, within Prud’hommes, the number of judges does not show a huge amount of variation. This will force us to use judges as a “secondary” instrument, mostly for robustness checks. 28 In the US, the Administrative Office of the United States Court uses statistics over the average time spent by judges to handle a case of a given type to give an appraisal of judge allocation. 29 As there are more “tribunal d’instance” than Prud’hommes (460 versus 264), we use again orthodromic distance for the matching.

20
Prud’hommes’ cases represent a small share of the total civil case load and their steady number across
the years is unlikely to have driven massive reallocations of judicial personnel. We check again that
the clerks’ density cannot be predicted by lagged labor flows (see again Table A.2).
The staff densities influence the disposition of the cases through a congestion effect. Their allocation
depends on institutional settings, which generate outcomes that seem largely disconnected from local
economic developments and let us think that they offer the characteristics of good instruments.
Notice the variety of origins of our instruments: “staff” comes from the allocation by the central
government of civil servants into local jurisdictions; “judges” are set by the institutional and political
settings of the Prud’hommes; the “lawyers” instrument is related to location preferences of the
lawyers.
c) First Stages and Reduced-Form Regressions
Table 5a presents the instrumental regressions (first stage) for each of our indicators of judicial
activity on the full set of potential instruments, controls (year and business cycle indicators,
appropriately transformed as will be described later), and jurisdiction fixed effects. The F-statistics
(test of the null of the equality to zero of the selected instruments) and its associated p-value are given
in the last row of the Table. When all instrumental variables are included, even though each regression
has at least one significant instrument, the F-statistics are small with only one above 10, one around 8
and other values being smaller. Interestingly, the lawyer instrument is significantly different from zero
in all regressions (at a level of 1% in four out of the five regressions). More precisely, lawyer density
positively affect the worker lawyer rate, hence supply shocks favor the use of lawyers by workers. It
also encourages filing and conciliation but negatively affect trials and workers’ victory. Hence, an
important supply of lawyers appears to favor the rule of law (more filings) and reinforce the
negotiating role of lawyers over its trial-lawsuit role.
Table 5b presents the same first-stage regressions with our first instrument, the local supply of
lawyers. Now, as was likely from Table 5a, most F-statistics are larger and close to the limit of 10,
with the exception of the worker lawyer rate. Hence, lawyers will constitute our main instrument.
However, we will use judges and staff for robustness checks. We do this for two reasons. First, first-
stage estimates presented in Table 5c show that judges appear to provide a better F-statistic for the
worker lawyer rate whereas lawyers and staff yield also a larger F-statistic for the conciliation rate. In
addition, the option of having two instruments will allow for a test of over-identifying restrictions.
Still, these results will all be compared with those obtained with the supply of lawyers as the main
instrumental variable and check their robustness.

21
Focusing on the effects presented in Table 5b (judicial indicators and lawyer density), we examine
now whether these estimates are consistent with our model. Consider the number of lawyers and
assume that an increase in the number of lawyers induces a decrease in the costs of litigation for the
worker ( tk and ck ), the decrease being larger for the cost at the trial stage than at the conciliation
stage. We assume that the impact on the costs of litigation for the firm is negligible.
Under such assumptions, the model shows that wp decreases more than wp : more workers file a case
since it is less costly, and as a proportion more end the case at the conciliation stage than at the trial
stage. Finally, the firing cost increases for the firms (see Figure 7). This is consistent with the results
of the first stage in Table 5b: more lawyers imply a higher filing rate, a higher conciliation rate, and a
lower trial rate. It also implies a lower worker winning rate since the new workers who litigate have
smaller probabilities of winning.
Fig. 7: Firing Cost, Case Outcomes and a Decrease in the Lawyers’ Costs
To check that our instruments are well correlated with the labor flows, we estimate a set of reduced-
form regressions. The results are presented in Table 6. First, judge and lawyer densities have a strong
negative effect on job destructions, resulting in a clear positive effect on net job creations since job
wp
mc
Mc
( ) tmwmw lcpFcp +−++ 1)(
**wp
wp
no judicial case no judicial case conciliation trial
wp
cc lc +

22
creations are barely affected. The relations between staff density and flows are not significant (though
close); still the effect is significantly different from zero (positive) on net job creations.
5 Main Empirical Results Now, we can turn to our main econometric model:
tptptptptptp dJudicialInBCBCFlows ,,1,2,1, εγδβαα +++++= − (1)
where tpdJudicialIn , is an indicator of judicial activity where the unit of observation is a
Prud’hommes court p for year t. BCp,t is a business cycle indicator. Our labor market variables Flowsp,t
are the labor flows at the jurisdiction level p at date t. δp is a jurisdiction fixed effect; γt is the year
indicator, and εp,t is the residual. In each regression, observations are clustered at the local jurisdiction
level. The jurisdiction areas display a large heterogeneity in size (measured by labor force or
employment). Half of the jurisdictions account for about 80% of the 1991 total employment. We
weight our regressions by the 1999 labor force of the jurisdiction area (results are unchanged when
using total employment in 1991 or some other weighting scheme).
Table 7 presents estimates of model (1) using OLS. All case outcome indicators except the filing rate
are significantly correlated with job destructions, the trial rate and worker winning rate positively so
whereas the worker lawyer rate and the conciliation rate negatively so. However, none of these case
outcome indicators are significantly correlated with job creations. Finally, worker lawyer rate and
conciliation rate are positively correlated with net job creations. The signs of the coefficients are
consistent with the results of the first stage regressions and the reduced-form regressions, presented
above.
To estimate the parameter β measuring the causal impact of judicial activity on labor market flows, we
adopt an instrumental approach by projecting our outcome indicators on our instruments Z, business
cycle indicators, year dummies and local labor market fixed effects:
tptptptptptp ZBCBCOutcome ,,1,2,1, υγδλµµ +++++= − (2)
We cannot use a business indicator such as the local unemployment rate, which is clearly too directly
correlated to the labor flows. Local unemployment rate probably reflects unobserved economic shocks
which impact simultaneously the quality of the cases brought to labor court, bias the judges in their
decisions, and affect the labor flows. Thus we build an indicator of the business cycle, which takes
into account the initial differences across jurisdictions and reflects the national business cycle. To do
so, we instrument the measure of the local business cycle (number of unemployed registered at the

23
local employment agency divided by the 1999 local labor force) by the national unemployment rate
(in the spirit of Bartik, 1991 or Blanchard and Katz, 1992) using the following relation:
tpaggregatetptptp UU ,, ηµγδ +++= (3)
Then, we use the predicted value tpU ,ˆ of tpU , by (3) to compute our exogenous measure of cycle BC
as p
tpp
U
UU )ˆ( ,− where pU is the average of the predicted local unemployment rate tpU ,
ˆ .
Our IV results are given in Table 8. The structure of the Table is the following. For each case
outcomes indicator we give estimates with Lawyers as the only instrument. In addition, for the two
variables with relatively smaller F-statistics in Table 5.b (worker lawyer rate and conciliation rate), we
present estimates with those instruments that have valid F-statistics in Table 5.c, as robustness checks.
In addition, for the conciliation rate, which is the only indicator for which we use two instruments, we
present a test of over-identifying restrictions.
The results of the IV procedure mostly confirm those from the OLS procedure. As usual with IV
regressions, the coefficients and standard errors are both larger. The results confirm that larger
conciliation rate and worker lawyer rate dampen job destructions when larger trial rate and worker
winning rate increase job destructions. Interestingly, increased filing rates dampen both job creation
and job destruction, with a small positive aggregate effect.
All signs are consistent with our previous analysis. To sum up, a larger lawyer density encourages
workers to file their case, presumably because it is less costly for them to challenge their dismissals.
Hence, more workers go to the court, with lower probabilities of winning. Proportionally, more of
them find an interest in ending the case at the conciliation stage rather than at the trial stage. Thus, the
conciliation rate increases, the trial rate decreases; and the worker winning rate decreases since those
workers that go to the trial stage also have a lower probability of winning.
The estimated effects are large, much larger than the estimates coming from the OLS regression. This
is usual when using instrumental methods that yield local estimates of the effects. A one standard-
deviation increase in the conciliation rate or in the filing rate decrease the job destruction rate of 1.8
standard deviations. A one standard deviation increase in the trial rate increases the job destruction
rate by 2 standard deviations. The largest effects are obtained for the worker lawyer rate and the
worker winning rate: their impact is close to 4 standard deviations. The effects on net job creations are
smaller: they stand between 0.6 and 1.8 standard deviations (in absolute value).

24
That judicial activity has an immediate causal effect on labor flows might seem surprising. First,
similar regressions using lagged (one year) indicators of judicial give similar results. Second, even
though the dynamics our indicators is not easy to understand, it is important to remember that the
outcomes of cases are measured in the year when the case ends. Hence, most cases have started in the
year before (or even more). Firms therefore have a relatively clear view of the process as well as of the
probability of winning their case. All the more so that (roughly) one fourth of dismissals end in court;
most employers have experienced multiple trials.
Robustness Checks The effects of our judicial outcomes on job flows are large. In order to assess their plausibility we
provide several robustness assessments. As a first check, Table 8 reports IV estimates with other
instruments than the lawyers’ availability rate. All estimates are extremely similar to those with the
lawyer instrument.
The second check exploits a natural experiment ran at the local level in the jurisdiction of Grenoble.
Grenoble is a city located at the foot of the French Alps in southeastern France. The jurisdiction of the
labor court of Grenoble is the 15th largest jurisdiction in terms of its 1999 labor force (254,567). In
1996, in order to facilitate dispute resolution the French Parliament passed a law empowering the
judges to mandate a mediator. This law went unheeded since labor courts were already supposed to
invite the parties to stop the case before trial thanks to the mandatory stage of conciliation. In 1995,
the judge Blohorn-Brenneur was appointed at the Circuit court of appeals of Grenoble and decided to
exploit the possibilities offered by this law in order to boost the conciliation process. Starting in 1998,
this was done by a) sending out an information letter and a questionnaire to the parties in order to
increase parties’ awareness of mediation, b) offering mediation and conflict management training to
the judges of Grenoble, and c) organizing specific hearings where mediation services were proposed to
the parties. 30 We will see that this experiment led to a strong increase in the conciliation rate from
1998 onwards at the Grenoble jurisdiction. In order to assess its impact on job flows, we run a simple
difference in difference regression of the form:
,1,2,1, tptptptptp Post1998GrenobleBCBCFlows εγδβαα +++××++= − (4)
30 See Blohorn-Brenneur (2010) in « Refondation du droit social, concilier protection des travailleurs et efficacité économique », Jean Barthélémy et Gilbert Cette, Rapport du Conseil Economique et Social. The summary in English of the whole report is to be found page 191-197. The Judge Blohorn-Brenneur founded with others the European Association of Judges for Mediation in 2003.

25
where Grenoble is an indicator equal to one for the jurisdiction of Grenoble interacted with an
indicator equal to one during the treatment period (1998-2003). We present in Table 9 the estimates of
equation (4) using different control groups. First, we use all other French jurisdictions. Results are
presented in the first panel of Table 9. Then, because some local specific shocks might put at risk the
identifying assumption of this first difference-in-difference method, we consider the following control
groups 1) the jurisdictions of similar sizes (i.e. with a 1999 labor force between 150,000 and 400,000)
and 2) the jurisdictions surrounding the Grenoble jurisdiction (the other jurisdictions within Isère, the
‘département’ where Grenoble is located and the jurisdictions belonging to ‘départements’ contiguous
to Isere). Results are presented in the second and third panel of Table 9, respectively. The last column
of this table presents the estimated impact of the experiment on the conciliation rate (i.e. the estimates
of β associated with equation (4) where the conciliation rate is the endogenous variable). First,
focusing on this last column, and as claimed above, the Grenoble experiment increased substantially
the conciliation rate by around 8 percentage points, i.e. about one standard deviation of the
conciliation rate measured across years and jurisdictions. The difference is similar when Grenoble is
compared to contiguous jurisdictions and jurisdictions of similar size. Turning to the impact of the
experiment on labor flows, as already obtained in our instrumental approach, a higher conciliation rate
dampens job destructions. Although obtained on slightly different time periods and with different
identification strategies, (interpretable as a local average treatment effect, as suggested by Imbens and
Angrist, 1994), the two measures of the causal impact of the conciliation rate on job destructions have
similar magnitudes. A one standard deviation increase in the conciliation rate leads to an increase in
the job destruction rate of 2-4 percentage points (e.g. one standard deviation) using the difference-in-
difference estimates and of 6 percentage points using the instrumental regressions (i.e. 1.5 standard
deviation).
As an additional test, we propose a falsification procedure based on the different provisions protecting
from unfair dismissals different types of workers. By law, firing constraints are reduced for workers
who have less than two years of seniority. In their case, the severance payment due for the absence of
“real and serious cause” is not subject to the minimum amount of 6 months of wage but is limited to a
compensatory award, potentially equal to zero if the worker has found a new job. Therefore,
destruction flows for such workers should not be affected by judicial outcomes. Because we need a
source with seniority when leaving a firm, we use the French labor force survey, in order to compute
the ratio of workers that have been dismissed within the year with seniority less than two years over
the number of employees in the private sector. Unfortunately, the labor force survey does not allow
locating the place of work within each jurisdiction. The indicators are thus built at a slightly larger
geographical level, the ‘département” level with one ‘département’ comprising on average three
jurisdictions.
26
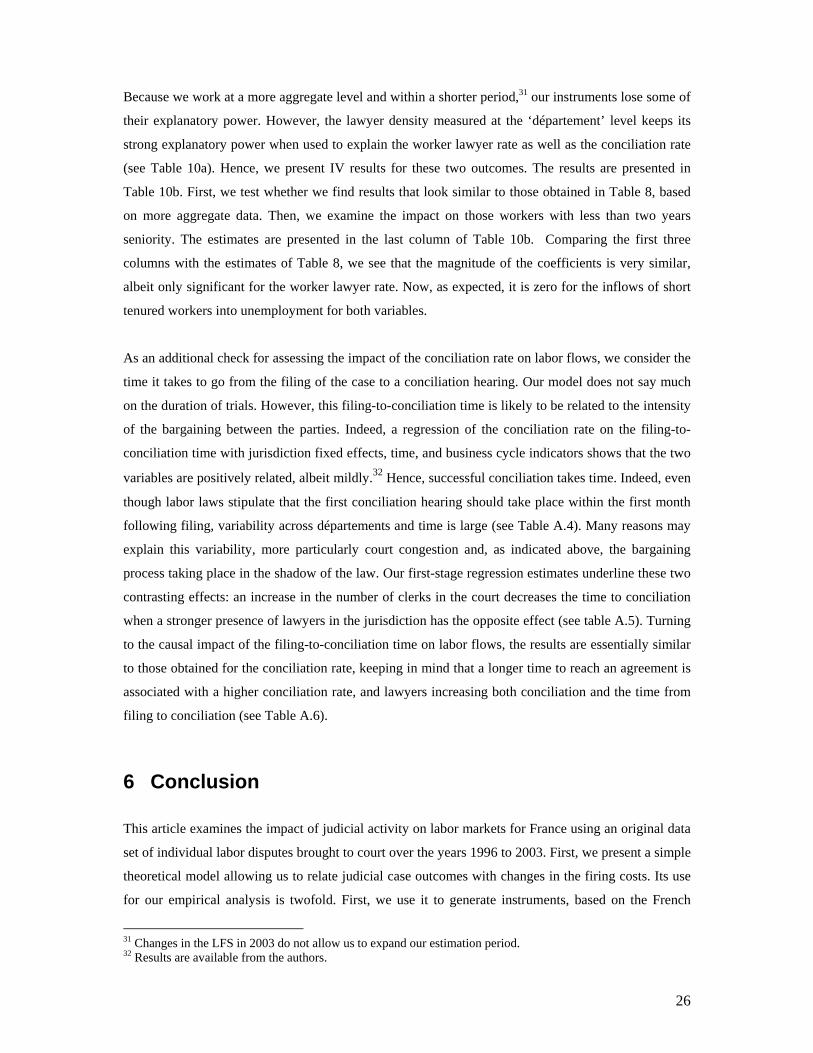
Because we work at a more aggregate level and within a shorter period,31 our instruments lose some of
their explanatory power. However, the lawyer density measured at the ‘département’ level keeps its
strong explanatory power when used to explain the worker lawyer rate as well as the conciliation rate
(see Table 10a). Hence, we present IV results for these two outcomes. The results are presented in
Table 10b. First, we test whether we find results that look similar to those obtained in Table 8, based
on more aggregate data. Then, we examine the impact on those workers with less than two years
seniority. The estimates are presented in the last column of Table 10b. Comparing the first three
columns with the estimates of Table 8, we see that the magnitude of the coefficients is very similar,
albeit only significant for the worker lawyer rate. Now, as expected, it is zero for the inflows of short
tenured workers into unemployment for both variables.
As an additional check for assessing the impact of the conciliation rate on labor flows, we consider the
time it takes to go from the filing of the case to a conciliation hearing. Our model does not say much
on the duration of trials. However, this filing-to-conciliation time is likely to be related to the intensity
of the bargaining between the parties. Indeed, a regression of the conciliation rate on the filing-to-
conciliation time with jurisdiction fixed effects, time, and business cycle indicators shows that the two
variables are positively related, albeit mildly.32 Hence, successful conciliation takes time. Indeed, even
though labor laws stipulate that the first conciliation hearing should take place within the first month
following filing, variability across départements and time is large (see Table A.4). Many reasons may
explain this variability, more particularly court congestion and, as indicated above, the bargaining
process taking place in the shadow of the law. Our first-stage regression estimates underline these two
contrasting effects: an increase in the number of clerks in the court decreases the time to conciliation
when a stronger presence of lawyers in the jurisdiction has the opposite effect (see table A.5). Turning
to the causal impact of the filing-to-conciliation time on labor flows, the results are essentially similar
to those obtained for the conciliation rate, keeping in mind that a longer time to reach an agreement is
associated with a higher conciliation rate, and lawyers increasing both conciliation and the time from
filing to conciliation (see Table A.6).
6 Conclusion
This article examines the impact of judicial activity on labor markets for France using an original data
set of individual labor disputes brought to court over the years 1996 to 2003. First, we present a simple
theoretical model allowing us to relate judicial case outcomes with changes in the firing costs. Its use
for our empirical analysis is twofold. First, we use it to generate instruments, based on the French
31 Changes in the LFS in 2003 do not allow us to expand our estimation period. 32 Results are available from the authors.

27
institutional setting and the local legal environment. For instance, because lawyers tend to open their
practice close to the university they were enrolled at, changes in their numbers are unrelated to the
number of cases in each labor court except through the litigation costs. Second, the model shows that
changes in litigation costs have ambiguous effects. To see this, consider the fraction of cases that go to
trials. Firms faced with a negative shock on litigation costs will fire their personnel for personal
motive and risk litigation more often rather than fire them for economic motives, avoid lawsuits but
pay a large (and regulated) firing cost. In this situation, a larger trial rate is associated with lower firing
costs. However, workers faced with a negative shock on litigation costs are more likely to sue the firm.
By contrast, a larger trial rate is now associated with higher firing costs. The empirical analysis will
help us resolve this ambiguity.
Using the lawyer instrument, as well as other instruments to assess robustness of our results, we show
that case outcomes have a causal effect on labor flows. More trials and a higher victory rate at trial for
workers cause increased job destruction. More settlements/conciliations before trial, higher filing
rates, larger fractions of workers represented at trial dampen job destruction. We conduct various
checks using alternative strategies that confirm our results.
The web of legislations and the variety of local situations affect the enforcement of legislation and
court outcomes. In turn, the process of job creation and job destruction is affected. Micro-analyses
using specificities of the situation at hand appear to be useful, at least in the French context, to identify
the mechanisms underlying such process.

28
References Algan, Y. and P. Cahuc, (2009), “Civic Virtue and Labor Market Institutions,” American Economic Journal: Macroeconomics, 1 (1): 111–45. Andolfatto D., (1992), L'univers des élections professionnelles. Travail et société au crible des urnes. Paris, Editions de l'Atelier. Autor, D. H., (2003), “Outsourcing at Will: The Contribution of Unjust Dismissal Doctrine to the Growth of Employment Outsourcing,” Journal of Labor Economics, 21 (1), January, 1 – 42. Autor D. H., J. J. Donohue and S. J. Schwab, (2006), “The Costs of Wrongful-Discharge Laws,” The Review of Economics and Statistics, 88 (2), 211-231. Bartik, T. J., (1991), Who Benefits from State and Local Economic Development Policies? Kalamazoo, Mich.: W. E. Upjohn Institute for Employment Research. Bauer, T., S. Bender, and H. Bonin, (2007), “Dismissal Protection and Worker Flows in Small Establishments,” Economica, 74 (296), 804-821. Bebchuk L. A., (1984), “Litigation and Settlement under Imperfect Information,” The RAND Journal of Economics, 15 (3), 404-415. Beenstock M., and Y. Haitovsky, (2004), “Does the appointment of judges increase the output of the judiciary ?”, International Review of Law and Economics, 24, 351-369. Bentolila S. and G. Bertola, (1990), ”Firing Costs and Labor Demand: How Bad is Eurosclerosis?”, The Review of Economic Studies, 57 (3), 381-402. Bertola, G., (1992), “Labor Turnover Costs and Average Labor Demand,” Journal of Labor Economics, 10, 389-411. Bertola, G., (2004), ”A Pure Theory of Job Security and Labour Income Risk,” Review of Economic Studies, 71 (1), 43-61. Bertrand, M., and F. Kramarz, (2002), "Does Entry Regulation Hinder Job Creation? Evidence From The French Retail Industry," Quarterly Journal of Economics, 107 (4), 1369-1413. Besancenot, D. and R. Vranceanu, (2009), “Multiple equilibria in a firing game with impartial justice,” Labour Economics, 16 (3), 262-271. Bhattacharya, U. and H. Daouk, (2002), “The World Price of Insider Trading,” Journal of Finance, 57, 75-108. Blanchard O., and L. F. Katz, (1992), “Regional Evolutions,” Brookings Papers on Economic Activity, 1, 1-75. Blanchard, O. and T. Philippon, (2004), “The Quality of Labor Relations and Unemployment,” NBER Working Paper 10590. Blohorn-Brenneur, B., (2010), “La médiation prud’homale,” in « Refondation du droit social, concilier protection des travailleurs et efficacité économique », Jean Barthélémy et Gilbert Cette, Rapport du Conseil Economique et Social, 143-151. Boeri, T., and J. F. Jimeno, (2005), “The effects of employment protection: Learning from variable enforcement,” European Economic Review, 49 (8), 2057-2077. Bonafé-Schmidt J. P., (1987), “Les prud'hommes: du conseil de discipline à la juridiction de droit commun du travail,” Le Mouvement social, 141, Les Prud’hommes XIXe-XXe Siècle, 121-148. Burgess, S., Popper, C. and D. Wilson, (2001) “Explaining the growth in the number of applications to employment tribunals 1972-1997.” Department of Trade and Industry.

29
Card, D., and B. P. McCall, (2009), “When to Start a Fight and When to Fight Back: Liability Disputes in the Workers' Compensation System,” Journal of Labor Economics, 27 (2), 149-178. Chemin, M and E. Wasmer, (2009). ‘The employment effects of 35-hour workweek regulation in France: using Alsace-Moselle local laws to build a diff-in-diff’, Journal of Labor Economics, 27 (4), 487-524. Davis S., and J. C. Haltiwanger, (1992), “Gross Job Creation, Gross Job Destruction, and Employment Reallocation,” Quarterly Journal of Economics, 819-864. Dertouzos, J. N., (1988), “The End of Employment-at-Will: Legal and Economic Costs,” Report P-7441. Santa Monica, Calif.: Rand Corp. Devereux P. and R. Hart, (2011), “A good time to stay out? Strikes and the business cycle,” British Journal of Industrial Relations (forthcoming). Flanagan, M., (1989), “Compliance and Enforcement Decision under the National Labor Relations Act,” Journal of Labor Economics, 7 (3), 257-280. Freeman R. B., (2005), “Labor Market Institutions Without Blinders: The Debate over Flexibility and Labor Market Performance,” NBER Working Paper 11286. Harrison A. and M. Stewart, (1994), “Is Strike Behavior Cyclical ?”, Journal of Labor Economics, 12 (4), 524-553. Ichino, A., M. Polo and E. Rettore, (2003), “Are Judges Biased by Labor Market Conditions ?”, European Economic Review, 47 (5), 913-944. Lazear E. P., (1990), “Job Security Provision and Employment”. Quarterly Journal of Economics, 105 (3), 699-726. Marinescu, I., (2008), “Are Judges Sensitive to Economic Conditions? Evidence from UK Employment Tribunals,” working paper.
Marinescu, I., (2009), “Job Security Legislation and Job Duration ? Evidence from the UK,” Journal of Labor Economics, 27 (3), 475-486.
Martins, P. S., (2009), “Dismissals for Cause: The Difference That Just Eight Paragraphs Can Make,” Journal of Labor Economics, 27 (2), 257-280.
Munoz-Perez B., and E. Serverin, (2006), “Le sort des demandes prud’homales en 2004,” Bulletin d’information statistique, Ministère de la Justice, 87. OECD, (2004), Employment Outlook, OECD Publication, Paris. Oyer, P., and S. Schaefer, (2000), “Layoffs and Litigation,” The RAND Journal of Economics, 31 (2), 345-358. Priest, G. and B. Klein, (1984), “The selection of disputes for litigation,” Journal of Legal Studies, 13, 1-55. Siegelman, P., and J. J, III, Donohue, (1995), “The Selection of Employment Discrimination Disputes for Litigation: Using Business Cycle Effects to Test the Priest-Klein Hypothesis,” Journal of Legal Studies, 24 (2), 427-62. Spier, K., (2007), “Litigation” in The Handbook of Law and Economics (A. M. Polinsky and S. Shavell, eds., North Holland). Stähler, N., (2008), “Firing costs, severance payments, judicial mistakes and unemployment,” Labour Economics, 15 (6), 1162-1178.

30
Stevenson, B., (2007), “The Impact of Divorce Laws on Investment in Marriage Specific Capital,” Journal of Labor Economics, 25 (1), 75-94. Venn, D., (2009), “Legislation, Collective Bargaining and Enforcement: Updating the OECD Employment Protection Indicators”, OECD Social, Employment and Migration Working Papers, 89.

31
Model Appendix: The employer dismisses the worker at the minimum cost, instead of paying the maximum severance payments, if:
( ) ( )[ ]{ } ( ) Mmftmwmwccccf ccplcpFcpplcpp <−++−++−++ 11)1()(
As for the worker, she chooses to challenge her dismissal ( 1=fp ) if her expected gain at trial or at the conciliation stage is larger than the minimum severance payment:
( ) ( ) mtmwmw ckcpFcp >−−++ 1 or mcc ckc >− Thus the worker chooses to go to court if the gain at trial is large enough
( ( ) ( ) mtmwmw ckcpFcp >−−++ 1 , that isFk
pp tww => ). The worker would prefer the
agreement ( 1=cp ) than the trial when ( ) ( ) cctmwmw kckcpFcp −<−−++ 1 , i.e.
Fkkcc
pp ctmcww
−+−=<
Yet the firm can refuse the agreement. On the firm side, the firm dismisses the worker offering the minimum cost if:
( ) ( ) Mtmwmw clcpFcp <+−++ 1 that is:
Flccpp tmM
ww−−
=< **
We assume that the compensatory award F is large enough so that when the firm is certain to lose at trial, it is less costly to pay the maximum severance payment. That is: tmM lFcc ++< and thus
.1** <wp In addition, the firm accepts the conciliation only if it is less costly than going to trial, that is:
( ) ( ) cctmwmw lclcpFcp +>+−++ 1 which means:
Fllcc
pp ctmcw w
+−−=> *
In order a conciliation to exist, suing must be a credible threat to the employer. Therefore, we impose that ww pp <* that is ttcmc lklcc +<+− . In addition, there must a probability range where the
worker is better off to conciliate than going to trial. We must have ww pp < that is ccm kcc −< . Finally, for the trial stage to exist, the firm must be better off in some probability range to go to trial
rather than giving the compensatory award cM that protects against any suing: **ww pp < .
To summarize, we have five assumptions: Assumptions:
Condition (1): tcmct llcck −+−> : the cost of trial is sufficiently large ( ww pp <* )

32
Condition (2): mcc ckc >− : the gain for the worker at the conciliation stage is larger than the
severance payment she receives in case of firing for a personal motive ( ww pp < ).
Condition (3): Mcc clc <+ : the cost for the firm at the conciliation stage is smaller than the
severance payment received by the worker in case of firing for an economic motive.
Conditions (1), (2) and (3) taken together allow for the possibility of a conciliation stage.
Condition (4): The compensatory award F is large enough so that when the firm is certain to lose
at trial, it is less costly to pay the maximum severance payment. That is: tmM lFcc ++< . It
implies 1** <wp and excludes an equilibrium in which the law has no deterrent effect, every
worker being fired for a personal motive.
Condition (5): Mttcc clkkc <++− : there is a probability range for a trial to exist. The firm is
better off at trial than paying cM. Result: Under these assumptions we end up with four equilibria: - 0=fp and 0=cp if ww pp < - 1=fp and 1=cp if www ppp << (with ww pp <* ) - 1=fp and 0=cp if
**www ppp <<
- the firm pays Mc if **ww pp >

33
Figure 4: Number of Filed Cases
0
20000
40000
60000
80000
100000
120000
140000
160000
180000
1990 1991 1992 1993 1994 1995 1996 1997 1998 1999 2000 2001 2002 2003 2004
Figure 5: Map of the Universities Training Lawyers
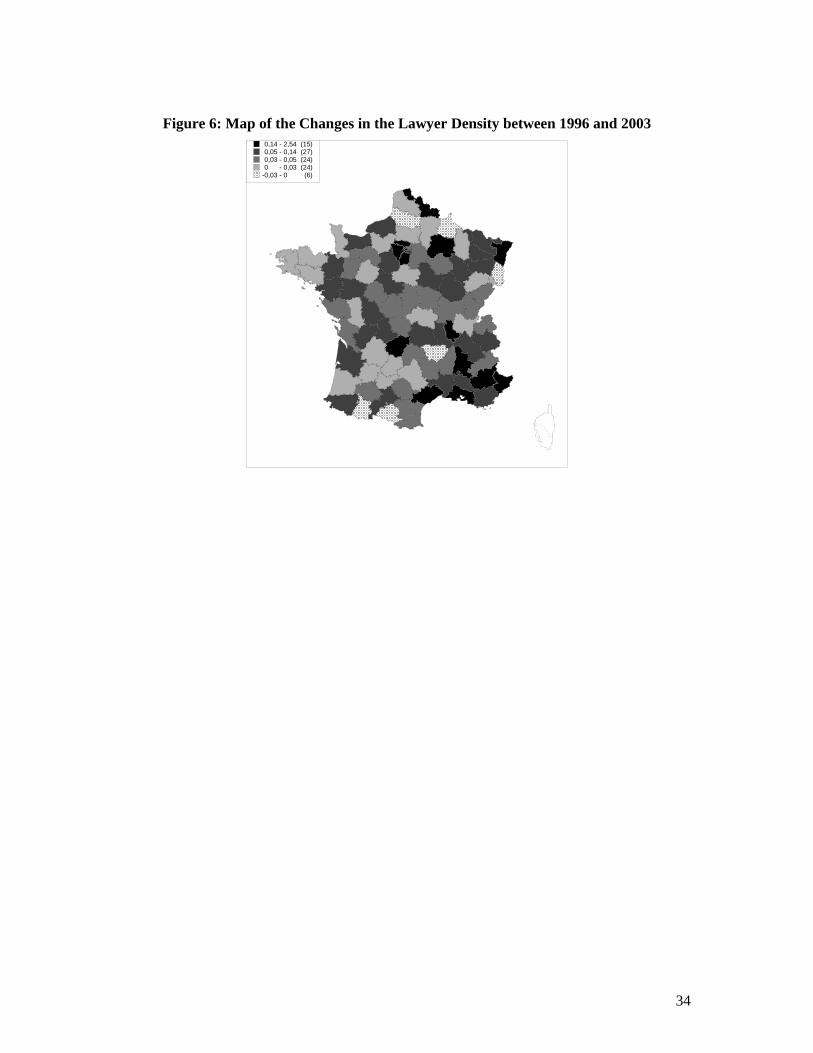
34
Figure 6: Map of the Changes in the Lawyer Density between 1996 and 2003 0,14 - 2,54 (15)0,05 - 0,14 (27)0,03 - 0,05 (24)0 - 0,03 (24)
-0,03 - 0 (6)

35
Names DefinitionFiling rate Number of cases fi led over number of dismissals
Worker Lawyer rate Number of cases where the worker is represented by a lawyer over the total number of cases
Conciliation rate Number of cases leading to a conciliation or an agreement between the parties over the total number of cases
Trial rate Number of cases reaching the trial stage over the total number of cases
Winning rate Number of cases won by the worker at trial over the total number of cases
Notes: These variables are computed at the jurisdiction level (jurisdiction*year)
Table 1: Judicial Indicators: Definition of Variables
Number of judges in 1992 1997/1992 2002/1997Manufacturing 1,881 0 -9Service 1,266 0 11Trade 1,923 0 1Management 1,406 0 4Total 6,522 0 1
Change in % between term t and term t-1 Table 3: Number of Judges by Section and Change over the Electoral Terms
Mean Std. Min MaxJudicial Indicators:
Filing rate 0,22 0,11 0,03 0,98Worker Lawyer rate 0,48 0,15 0,00 0,95Conciliation rate 0,20 0,09 0,00 0,77Trial rate 0,61 0,10 0,19 0,95Worker winning rate 0,45 0,09 0.09 0,93
Job Flows:Job Destructions 0,16 0,04 0,07 0,52Job Creations 0,16 0,06 0,05 0,71Net Job Creations 0,00 0,07 -0,63 0,43
Table 2: Summary Statistics: Judicial Indicators and Job Flows
Notes: Means of the jurisdition*year indicators, over the 264 jurisdictions and the years 1996-2003. Becausecases can also be dropped, the sum of the trial rate and of the conciliation rate is smaller than 1.
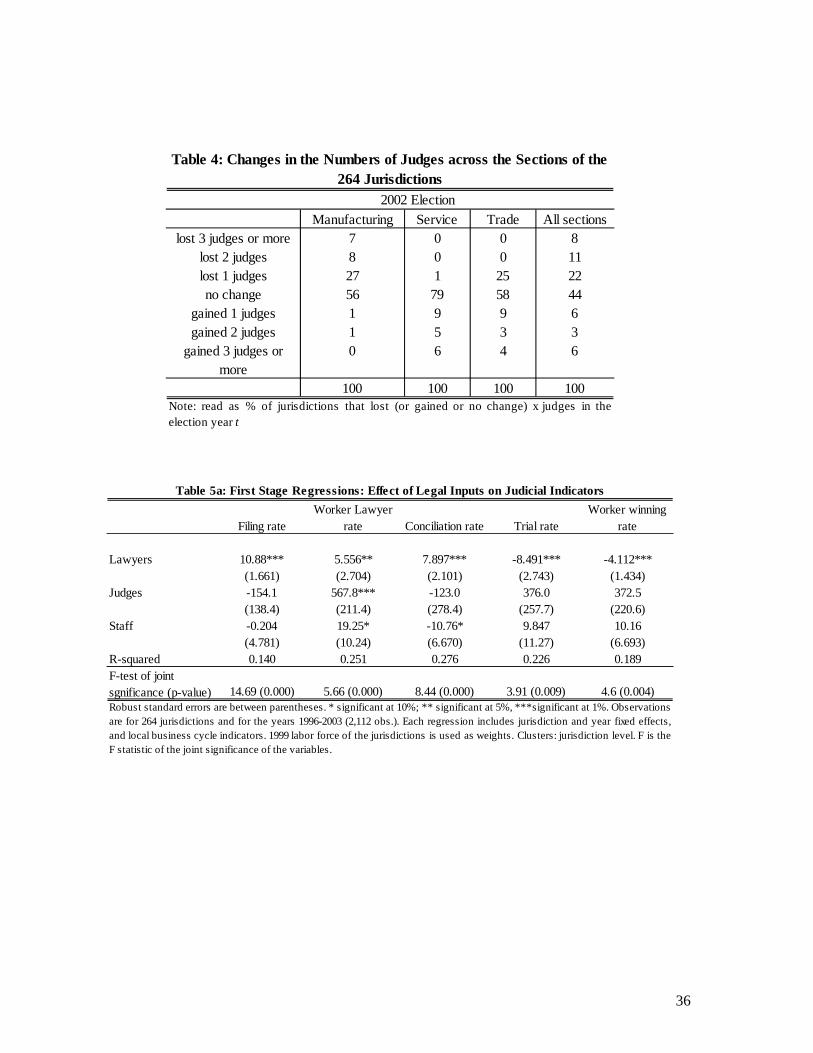
36
Manufacturing Service Trade All sectionslost 3 judges or more 7 0 0 8
lost 2 judges 8 0 0 11lost 1 judges 27 1 25 22no change 56 79 58 44
gained 1 judges 1 9 9 6gained 2 judges 1 5 3 3
gained 3 judges or more
0 6 4 6
100 100 100 100
2002 Election
Note: read as % of jurisdictions that lost (or gained or no change) x judges in theelection year t
Table 4: Changes in the Numbers of Judges across the Sections of the 264 Jurisdictions
Filing rateWorker Lawyer
rate Conciliation rate Trial rateWorker winning
rate
Lawyers 10.88*** 5.556** 7.897*** -8.491*** -4.112***(1.661) (2.704) (2.101) (2.743) (1.434)
Judges -154.1 567.8*** -123.0 376.0 372.5(138.4) (211.4) (278.4) (257.7) (220.6)
Staff -0.204 19.25* -10.76* 9.847 10.16(4.781) (10.24) (6.670) (11.27) (6.693)
R-squared 0.140 0.251 0.276 0.226 0.189F-test of joint sgnificance (p-value) 14.69 (0.000) 5.66 (0.000) 8.44 (0.000) 3.91 (0.009) 4.6 (0.004)
Table 5a: First Stage Regressions: Effect of Legal Inputs on Judicial Indicators
Robust standard errors are between parentheses. * significant at 10%; ** significant at 5%, ***significant at 1%. Observations are for 264 jurisdictions and for the years 1996-2003 (2,112 obs.). Each regression includes jurisdiction and year fixed effects,and local business cycle indicators. 1999 labor force of the jurisdictions is used as weights. Clusters: jurisdiction level. F is theF statistic of the joint significance of the variables.

37
Filing rateWorker Lawyer
rate Conciliation rate Trial rateWorker winning
rate
Lawyers 10.39*** 5.524* 7.331*** -7.539*** -3.864***(1.629) (2.833) (2.059) (2.647) (1.347)
R-squared 0.140 0.243 0.273 0.221 0.186F-test of joint sgnificance (p-value) 40.68 (0.000) 3.8 (0.052) 12.67 (0.000) 8.11 (0.004) 8.21 (0.000)
Table 5b: First Stage Regressions: Effect of Legal Inputs on Judicial Indicators
Robust standard errors are between parentheses. * significant at 10%; ** significant at 5%, ***significant at 1%. Observations are for 264 jurisdictions and for the years 1996-2003 (2,112 obs.). Each regression includes jurisdiction and year fixed effects,and local business cycle indicators. 1999 labor force of the jurisdictions is used as weights. Clusters: jurisdiction level. F is theF statistic of the joint significance of the variables.
Worker Lawyer rate Conciliation rate
Lawyers 7.772***(1.934)
Judges 646.8***(187.8)
Staff -10.80*(6.675)
R-squared 0.259 0.276F-test of joint sgnificance (p-value) 11.93 (0.000) 12.39 (0.000)
Table 5c: First Stage Regressions: Effect of Legal Inputs on Judicial Indicators
Robust standard errors are between parentheses. * significant at 10%; ** significant at 5%, ***significant at 1%. Observationsare for 264 jurisdictions and for the years 1996-2003 (2,112 obs.). Each regression includes jurisdiction and year fixed effects,and local business cycle indicators. 1999 labor force of the jurisdictions is used as weights. Clusters: jurisdiction level. F is theF statistic of the joint significance of the variables.

38
Job Destructions Job Creations Net Job CreationsLawyers -5.734*** -0.832 4.902***
(1.181) (1.065) (1.650)Judges -511.4*** -158.7* 352.7**
(139.8) (83.26) (149.1)Staff 6.863 -2.125 -8.989**
(4.263) (2.037) (3.647)
R-squared 0.433 0.457 0.565Robust standard errors are between parentheses. * significant at 10%; ** significant at 5%, ***significant at 1%.Observations are for 264 jurisdictions and for the years 1996-2003 (2,112 obs.). Each regression includes jurisdictionand year fixed effects, and local business cycle indicators. 1999 labor force of the jurisdictions is used as weights.Clusters: jurisdiction level.
Table 6: Judicial Indicators on Job Flows: Reduced-form Regressions
Job Destructions Job Creations Net Job CreationsFiling rate 0.0169 -0.00703 -0.0239
(0.0188) (0.0126) (0.0212)R-squared 0.43 0.48 0.59Worker Lawyer rate -0.0469** -0.00588 0.0410**
(0.0182) (0.0103) (0.0199)R-squared 0.41 0.47 0.56Conciliation rate -0.0439** -0.00504 0.0389*
(0.0222) (0.0134) (0.0221)R-squared 0.40 0.47 0.56Trial rate 0.0363** 0.00431 -0.0320
(0.0180) (0.0114) (0.0209)R-squared 0.40 0.47 0.56Worker Winning rate 0.0382** 0.00704 -0.0312
(0.0185) (0.0117) (0.0211)R-squared 0.40 0.47 0.56Robust standard errors are between parentheses. * significant at 10%; ** significant at 5%, ***significant at 1%. Observationsare for 264 jurisdictions and for the years 1996-2003 (2,112 obs.). Each regression includes jurisdiction and year fixed effects,and local business cycle indicators. 1999 labor force of the jurisdictions is used as weights. Clusters: jurisdiction level.
Table 7: Judicial Indicators on Job Flows: OLS Estimates

39
Job Destructions Job Creations Net Job CreationsFiling rate -0.674*** -0.272** 0.402*
(0.179) (0.131) (0.214)Instruments: Lawyers R-squared 0.215 0.314 0.459Worker Lawyer rate -1.132* -0.191 0.941
(0.603) (0.159) (0.629)Instruments: Lawyers R-squared 0.201 0.172 0.286Worker Lawyer rate -1.065*** -0.205* 0.859**
(0.373) (0.116) (0.371)Instruments: Judges R-squared 0.375 0.355 0.56Conciliation rate -0.853*** -0.144 0.709**
(0.297) (0.142) (0.314)Instruments: LawyersR-squared 0,443 0.411 0.246Conciliation rate -0.772*** -0.0699 0.702***
(0.216) (0.129) (0.268)Test of overidentifying restrictions (p-value) 0.805 0.151 0.856Instruments: Lawyers and staff
R-squared 0.278 0.446 0.253Trial rate 0.829** 0.140 -0.689**
(0.344) (0.168) (0.278)Instruments: Lawyers R-squared 0.735 0.401 0.132Worker Winning rate 1.617*** 0.273 -1.345**
(0.608) (0.305) (0.541)Instruments: Lawyers R-squared 0,31 0.281 0.191Robust standard errors are between parentheses. * significant at 10%; ** significant at 5%, ***significant at 1%. Observations are for 264jurisdictions and for the years 1996-2003 (2,112 obs.). Each regression includes jurisdiction and year fixed effects, and local business cycleindicators. 1999 labor force of the jurisdictions is used as weights. Clusters: jurisdiction level.
Table 8: Judicial Indicators on Job Flows: 2SLS Estimates
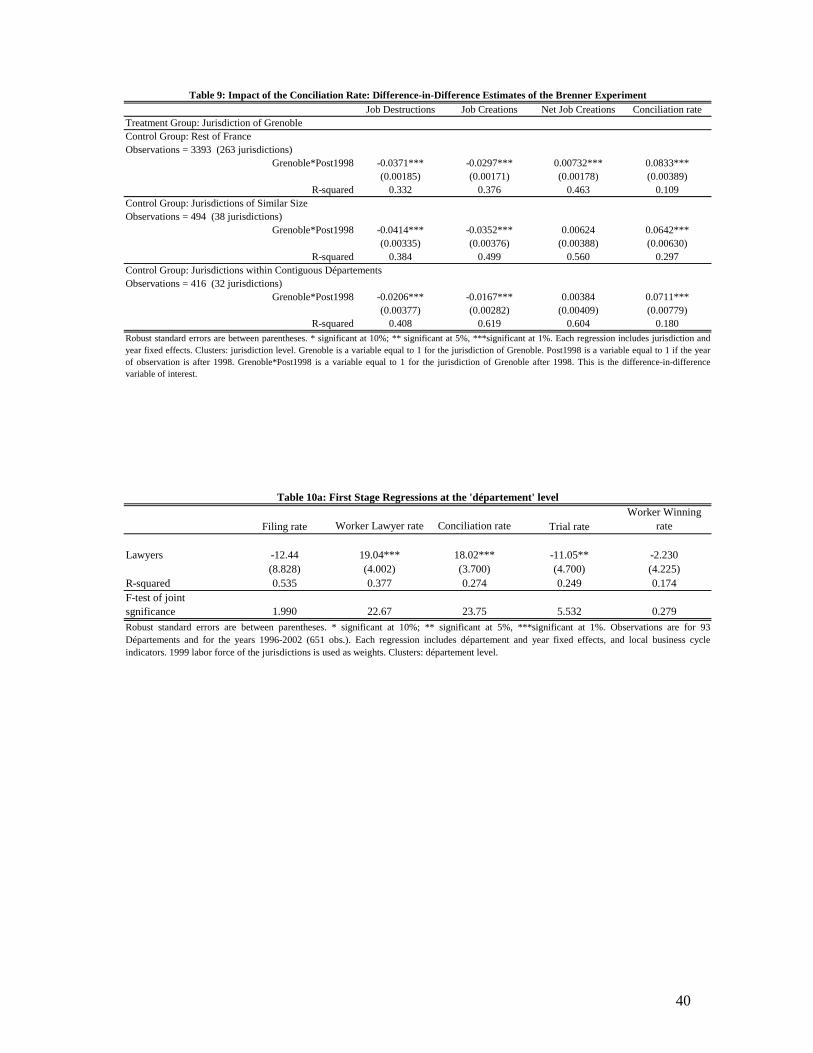
40
Job Destructions Job Creations Net Job Creations Conciliation rateTreatment Group: Jurisdiction of GrenobleControl Group: Rest of FranceObservations = 3393 (263 jurisdictions)
Grenoble*Post1998 -0.0371*** -0.0297*** 0.00732*** 0.0833***(0.00185) (0.00171) (0.00178) (0.00389)
R-squared 0.332 0.376 0.463 0.109Control Group: Jurisdictions of Similar Size Observations = 494 (38 jurisdictions)
Grenoble*Post1998 -0.0414*** -0.0352*** 0.00624 0.0642***(0.00335) (0.00376) (0.00388) (0.00630)
R-squared 0.384 0.499 0.560 0.297Control Group: Jurisdictions within Contiguous DépartementsObservations = 416 (32 jurisdictions)
Grenoble*Post1998 -0.0206*** -0.0167*** 0.00384 0.0711***(0.00377) (0.00282) (0.00409) (0.00779)
R-squared 0.408 0.619 0.604 0.180Robust standard errors are between parentheses. * significant at 10%; ** significant at 5%, ***significant at 1%. Each regression includes jurisdiction andyear fixed effects. Clusters: jurisdiction level. Grenoble is a variable equal to 1 for the jurisdiction of Grenoble. Post1998 is a variable equal to 1 if the yearof observation is after 1998. Grenoble*Post1998 is a variable equal to 1 for the jurisdiction of Grenoble after 1998. This is the difference-in-differencevariable of interest.
Table 9: Impact of the Conciliation Rate: Difference-in-Difference Estimates of the Brenner Experiment
Filing rate Worker Lawyer rate Conciliation rate Trial rateWorker Winning
rate
Lawyers -12.44 19.04*** 18.02*** -11.05** -2.230(8.828) (4.002) (3.700) (4.700) (4.225)
R-squared 0.535 0.377 0.274 0.249 0.174F-test of joint sgnificance 1.990 22.67 23.75 5.532 0.279
Table 10a: First Stage Regressions at the 'département' level
Robust standard errors are between parentheses. * significant at 10%; ** significant at 5%, ***significant at 1%. Observations are for 93Départements and for the years 1996-2002 (651 obs.). Each regression includes département and year fixed effects, and local business cycleindicators. 1999 labor force of the jurisdictions is used as weights. Clusters: département level.

41
Job Destructions Job Creations Net Job Creations
Dismissed persons with seniority less
than 2 years Worker Lawyer rate -0.225* -0.198* 0.0273 -0.0364
(0.139) (0.117) (0.0948) (0.0442)Instruments: Lawyers R-squared 0.306 0.460 0.508 0.382Conciliation rate -0.235 -0.208 0.0271 -0.00386
(0.209) (0.167) (0.105) (0.0584)Instruments: Lawyers R-squared 0.317 0.494 0.504 0.400Robust standard errors are between parentheses. * significant at 10%; ** significant at 5%, ***significant at 1%. Observations are for 93Départements and for the years 1996-2002 (651 obs.). Dismissed persons with seniority less than 2 years is the ratio of workers laid-offwithin the year with a job tenure of less than 2 years over total employment. By law, these workers can not obtain the minimum of 6months of severance payment but only compensatory awards. Each regression includes département and year fixed effects, and localbusiness cycle indicators. 1999 labor force of the jurisdictions is used as weights. Clusters: département level.
Table 10b: 2SLS Estimates: Falsification Test
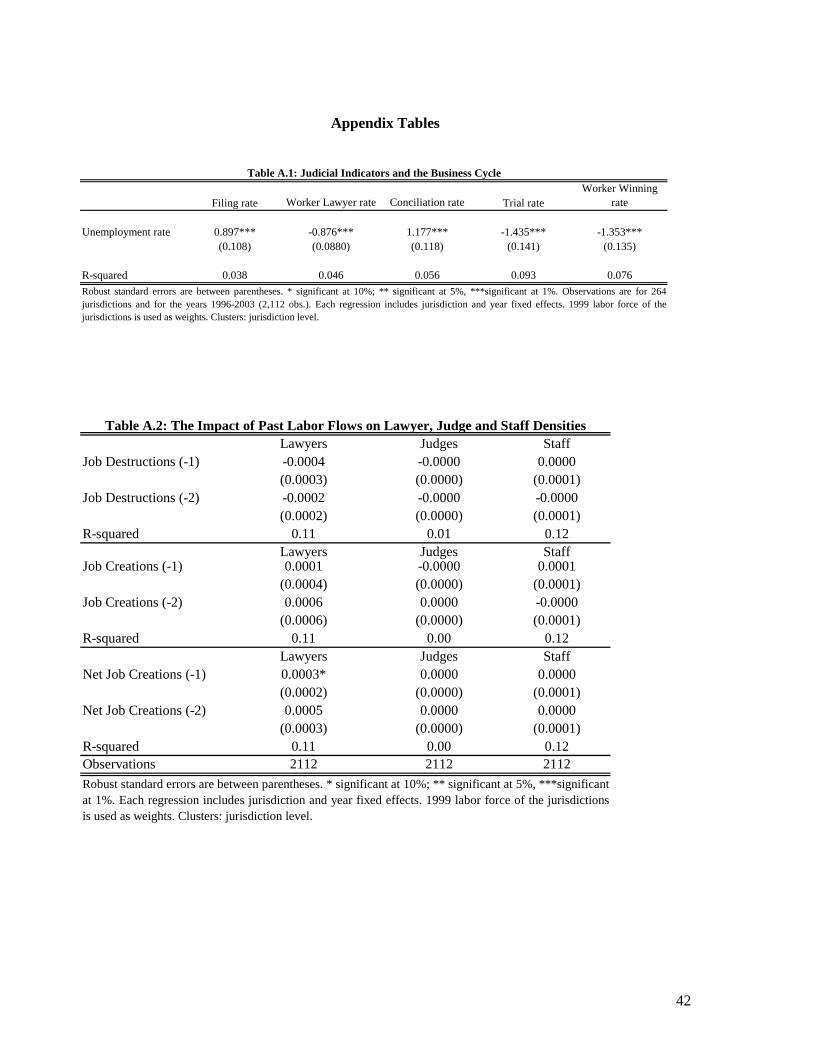
42
Appendix Tables
Filing rate Worker Lawyer rate Conciliation rate Trial rateWorker Winning
rate
Unemployment rate 0.897*** -0.876*** 1.177*** -1.435*** -1.353***(0.108) (0.0880) (0.118) (0.141) (0.135)
R-squared 0.038 0.046 0.056 0.093 0.076Robust standard errors are between parentheses. * significant at 10%; ** significant at 5%, ***significant at 1%. Observations are for 264jurisdictions and for the years 1996-2003 (2,112 obs.). Each regression includes jurisdiction and year fixed effects. 1999 labor force of thejurisdictions is used as weights. Clusters: jurisdiction level.
Table A.1: Judicial Indicators and the Business Cycle
Lawyers Judges StaffJob Destructions (-1) -0.0004 -0.0000 0.0000
(0.0003) (0.0000) (0.0001)Job Destructions (-2) -0.0002 -0.0000 -0.0000
(0.0002) (0.0000) (0.0001)R-squared 0.11 0.01 0.12
Lawyers Judges StaffJob Creations (-1) 0.0001 -0.0000 0.0001
(0.0004) (0.0000) (0.0001)Job Creations (-2) 0.0006 0.0000 -0.0000
(0.0006) (0.0000) (0.0001)R-squared 0.11 0.00 0.12
Lawyers Judges StaffNet Job Creations (-1) 0.0003* 0.0000 0.0000
(0.0002) (0.0000) (0.0001)Net Job Creations (-2) 0.0005 0.0000 0.0000
(0.0003) (0.0000) (0.0001)R-squared 0.11 0.00 0.12Observations 2112 2112 2112
Table A.2: The Impact of Past Labor Flows on Lawyer, Judge and Staff Densities
Robust standard errors are between parentheses. * significant at 10%; ** significant at 5%, ***significantat 1%. Each regression includes jurisdiction and year fixed effects. 1999 labor force of the jurisdictionsis used as weights. Clusters: jurisdiction level.

43
Manufacturing Trade Service
Change in the employment in the industry over 1993-2002 0.00473 -0.0303*** -0.0109*** -0.0563***(0.0472) -0,0099 -0,0019 (0.0154)
R-squared 0.000 0.035 0.11 0.048Observations 264 264 264 264
Table A.3: (Mis)allocation of Judges by IndustryDependent variable: Change in the number of judges by section in 2002
Notes: Columns (2) (3) and (4) display the regressions of the change in the local number of judges on the change in employment beween 1993 and 2002.Over 1993-2002, the number of judges has been constant at the local level. Standard errors in parentheses. * significant at 10%; ** significant at 5%,***significant at 1%.
All sections
Mean Std. Min MaxJudicial Indicators:
Time Delay to the Conciliation Stage 45 13 18 222Time Delay to the Trial Stage 176 86 32 543Total Duration of the Case 271 76 95 754
Table A.4: Summary Statistics: Duration of the Cases (in days)
Notes: Means of the jurisdition*year indicators, over the 264 jurisdictions and the years 1996-2003. "Time delay to the conciliationstage" is the time it takes to get a conciliation hearing. "Time delay to the trial stage" is the time it takes to get a judgment hearing whenthe conciliation fails. Total duration of the case is the average duration to the termination of the case whatever the outcome of thejudicial process is (trial, conciliation...).
Dependent Variable: Time Delay to the Conciliation Hearing
Lawyers 25.47*** 25.48***(6.540) (6.628)
Staff -57.62*(32.02)
R-squared 0.08 0.09F-test of joint sgnificance (p-value) 15.17 (0.000) 8.91 (0.000)Robust standard errors are between parentheses. * significant at 10%; ** significant at 5%, ***significant at 1%. Observations are for 264 jurisdictions and for the years 1996-2003 (2,112 obs.). Each regression includes jurisdiction and year fixed effects, and local business cycle indicators. 1999 labor force of the jurisdictions is used as weights. Clusters: jurisdiction level. F is the F statistic of the joint significance of the variables.
Table A.5: First Stage Regressions: Effect of Legal Inputs on Time Delay to the Conciliation Hearing

44
Job Destructions Job Creations Net Job CreationsTime Delay to Conciliation (log) -0.245*** -0.0410 0.204**
(0.0711) (0.0374) (0.0872)Instruments: Lawyers R-squared 0.18 0.441 0.378Time Delay to Conciliation (log) -0.200*** -0.0120 0.188***
(0.0552) (0.0339) (0.0695)Test of overidentifying restrictions (p-value) 0.34 0.19 0.72Instruments: Lawyers and staff
R-squared 0.116 0.456 0.406Robust standard errors are between parentheses. * significant at 10%; ** significant at 5%, ***significant at 1%. Observations are for264 jurisdictions and for the years 1996-2003 (2,112 obs.). Each regression includes jurisdiction and year fixed effects, and localbusiness cycle indicators. 1999 labor force of the jurisdictions is used as weights. Clusters: jurisdiction level.
Table A.6: Time Delay to the Conciliation Hearing and Job Flows: 2SLS Estimates