Embed Size (px)
Citation preview

289
CHAPTER 6
Labor and GovernmentChapters 2 and 3 focused on the 26 economies in emerging Europe, analyzing their economic links with the 19 countries in the EU15 and European Free Trade Association (EFTA) economies. In assessing trade and finance, the chapters paid special attention to services, which comprise more than two-thirds of the European economy and are believed to be performing worse than in America and Asia. Chapters 4 and 5 shifted the focus to the 27 member states of the European Union. The link between the chapters on enterprise and innovation was productivity, whose pace of improvement is less than satisfactory. Chapters 6 and 7 widen the scope to all of Europe’s 45 countries. The link between the chapters on labor and government is that the population is aging, which provides the strongest imperatives for rethinking the European model of work and government.
Most parts of the world have to contend with aging, but Europe must do so with a model of work that might be least suited to deal with the approximately 50-million-person decline in the workforce expected over the next 50 years, much of which will be occurring in the next two decades. Europe’s work model is marked by unprecedented security for those with jobs, relatively generous benefits for those without, and easy pension eligibility. Chapter 6 finds that this model is making Europe uncompetitive. To address this, most countries in Europe have to increase labor force participation and make it easier for younger people to get jobs that “insiders” have secured for themselves. Collectively, Europe has to decide how to unify its labor market and by how much, and how to attract global talent. Labor has become one of the weak components of the European economic model.
Finding a better work-life balance has meant that most European governments are about a fifth larger than their peers and that they spend about 10 percent of GDP more than governments in other parts of the world. Much of this difference is due to spending on social protection (pensions, unemployment insurance, and social assistance). Well-organized governments in Europe manage to keep their economies growing despite the high taxes needed to finance this spending; others have begun to stagnate and accumulate debt. Chapter 7 discusses what helps some economies with large governments—such as Sweden and Finland—keep growing. It requires considerable discipline in delivering social services, making it easy to pay taxes and conform with regulations, and allowing enterprises the economic freedom to compete abroad. Others can make governments more efficient by reforming social protection and social services: this should be the long-term objective. But it is not easy to increase the efficiency of governments. In the meantime, chapter 7 reasons that many European governments must shrink. Their ability to consolidate spending during the 1990s—and the willingness of many to do so during the sovereign debt crisis of 2010-11—should be cause for optimism.

290
Golden Growth
291
CHAPTER 6
LaborIn February 2000, the world watched as France instituted the 35-hour workweek, down from the 39 hours expected of French workers and the more than 40 in most developed countries. The reasoning was that because there are only so many hours of work needed, it would be better to share them among more workers. Unemployment in late 1999 was about 10 percent, so cutting the number of hours by about 10 percent might take care of the problem. Economists call this the “lump of labor fallacy.” Another reason was the belief that French workers should be rewarded for their high productivity by allowing them to work less. Researchers had found that the output per hour worked was higher in France than in almost every other country. Getting employers to pay overtime wages for work beyond 35 hours would help labor capture more of the benefits of high productivity.
What happened over the next few years? Unemployment did not fall by much, though the new requirements might have encouraged workers to move to smaller firms that were not covered by the law (Estevão and Sá 2006). The 35-hour workweek has since been watered down, but no government has tried to repeal it. Instead, businesses have been given ways around the problem, and the regulations have become more complicated. In the meantime, productivity growth has slowed in Western Europe and sped up in the United States. Between 1990 and 2000, output per hour worked in manufacturing—the sector with the most reliable data—grew at roughly 4 percent a year in both France and the United States. Between 2000 and 2007, it accelerated to 6 percent in the United States, while French productivity growth slowed to 3.3 percent (U.S. Department of Labor 2011).
Chapter 6
Is there a European work model?Given demographic changes, how can Europe achieve a stable and more productive workforce?Are employment and social protection practices inhibiting labor participation and efficiency?Is Europe taking full advantage of the benefits associated with internal labor mobility?How can Europe become a global magnet for talent?
292
GoLDEn GRoWTH
The “lump of labor fallacy” might also be responsible for attitudes toward mobility and immigration in Europe. If there is only so much work to divvy up, people from other EU states—not to mention, other parts of the world—should not be allowed in. Prime Minister Gordon Brown, reacting to reports that Italian and Portuguese workers were being hired for construction contracts during the financial crisis, called for “British jobs for British workers.” In contrast, Australia, Canada, new Zealand, and the United States, partly freed from this fallacy by their tradition as centers of immigration, have attracted the best and brightest from around the world. They have succumbed occasionally to the same instincts, even though many studies have found that workers mainly move to places where there are jobs that locals are not willing or able to do (Vedder and Gallaway 1997). But the flow of immigrants serves to inject economic adrenaline in a manner that is less evident in Europe.
Although institutions and social norms vary across Europe, the stereotype is that Americans “live to work” and Europeans “work to live.” Few would argue that the two weeks of leave that many workers in the United States get is good for their productivity and for national economic growth. Americans who have traveled or lived in Europe often lament the imbalance between work and life in the United States, and attribute the rise in stress and tensions in family life to the importance Americans give to work. The stubbornly high rates of unemployment since the financial crisis have encouraged skeptics of the “U.S. work model” to question the benefit of its flexibility. These skeptics point out that the U.S. work model seems to deliver a much higher level of inequality and “working poor” than the European work model. one could be forgiven for wondering whether in the years since Europe’s “Golden Age” of growth between 1950 and 1973, Europeans have been drifting to the opposite but equally questionable extreme. In the 1970s, the French worked the longest hours among advanced countries. By 2000, they worked about 300 fewer hours each year—a month and a half less—than Americans. In France, just 1 in 10 people aged 60–65 works; in the United States, the ratio is 1 in 2.
Europeans have a choice: work more productively to maintain the European social model or give up a substantial part of it, with major cuts in the generosity of benefits. It will probably end up being a mixture of both. With few exceptions, the labor force will be shrinking everywhere in Europe. nowhere on the continent is this more apparent than in Europe’s emerging economies. For them, the problem has an added dimension: they have become old before they could become rich. The wealthy part of Europe could tap into its assets to finance part of their benefits. But the way labor markets are regulated in emerging Europe and the comprehensive social entitlements available to households are quickly starting to resemble those in their far wealthier neighbors. For a middle-income country, the combination of a shrinking labor force and EU-type labor market and social institutions could create an insurmountable high debt/low growth trap. As chapter 7 on government will document, spending on pensions is already as much as 15 percent of GDP in some countries such as Serbia and Ukraine. Europe as a whole now spends 10 percent of GDP on pensions, about twice the spending on education. This cannot be good for growth.
293
CHAPTER 6
As people cut their work lives in most of Europe, populations in all European countries are aging, shaping their economic potential for years to come. The European Union’s labor force (including the EFTA’s) is expected to decline by about 39 million by 2060. If the Balkans, Turkey, the Russian Federation, Ukraine, and Belarus are included, the decline is about 50 million; the projected increase of 6 million in Turkey’s labor force is more than offset by the decline elsewhere. only if actual retirement age were to increase substantially (by around 10 years) and participation rates—especially in Turkey and among women—were to increase to levels seen in northern Europe could Europe offset the decline in the labor force. none of these outcomes, though, would prevent its aging. Europe needs to make its labor force more productive and to attract more productive workers from abroad.
Europe is not alone in feeling the force of aging populations. Japan and other developed parts of northeast Asia already find themselves under the strains of low fertility and increasing longevity. In the Southern Cone of Latin America, Argentina, Chile, and Uruguay also feel the effects of aging. Even China faces this challenge, sooner than it would have if it did not have its one-child policy. But the most “European” features of the work model—unprecedented job security, generous benefits for the unemployed, and easy pension eligibility—make the imperatives created by an aging population most acute in Europe.
The first imperative is to counter the shrinking of the labor force. The second is to increase labor force productivity. Europe’s adverse demography also means that its human capital has to be better leveraged. Labor market regulations, interventions, and institutions have to become more “pro-work.” To ease the brakes on growth caused by aging, it is necessary to have labor market regulations that encourage more people to work, to work longer, and to work more productively. Changes that make jobs more contestable will increase productivity. And increasing the productivity of the labor force will require that Europeans become more mobile. But even if Europe can put its human resources to best use, the pace of aging and the decline of the labor force will leave a demographic deficit that can be closed only by tapping into talent from abroad. Europe will have to rid itself of the obstinate “lump of labor” fallacy that impedes smart immigration policy. This chapter aims to answer the most pertinent questions about work and economic growth in Europe.
Is Europe’s approach to work making it uncompetitive? Yes. Most countries in Europe are not making the best use of their scarcest asset: workers. European countries must offset the impending labor force decline by increasing the labor force participation of people of all ages, regardless of gender, ethnicity, or socioeconomic background. They must also increase labor productivity, especially by equipping workers with more generic skills that allow them to redeploy their human capital more flexibly across jobs. European countries must improve regulations and interventions so that labor is allocated more efficiently, within and across countries. Europe must change immigration policies to make them respond more to economic imperatives and less to politics.

294
GoLDEn GRoWTH
This chapter arrives at these conclusions in five steps. Each step involves answering a question:
· Is there a European work model? A common approach sets Europe apart. Europe’s approach for balancing economic freedom for employers and social protection for workers is unique. By and large, non-European oECD countries feature less generous protection benefits and more flexible labor markets. In much of Europe, these arrangements do not work well. But the features and performance across countries vary considerably. over the next decade, two developments—unprecedented in size—will strain the European work model even more. The first is a demographic shift at home, with a quick aging of the population. The second is competition from workers outside Europe, most notably a billion increasingly educated Chinese and Indian workers. Europe must contend with both.
· Given the demographic changes underway, how can Europe achieve a stable and productive labor force? Labor markets will need to become more inclusive, with increasing participation among women, youth, the elderly, and excluded groups. none of these measures, however, would prevent the aging of the European labor force. Given the scale and nature of the challenges, Europe needs to make its labor force more productive through better regulation of labor markets and better design of social welfare. In emerging Europe and in parts of southern Europe, skill gaps will need to be closed. Immigration will have to be part of the solution: Europe will have to become a magnet for talented young people from other parts of the world.
· Are employment and social protection practices inhibiting labor participation and efficiency? In most parts of Europe, they are. Current policies allow “insiders” to make their jobs incontestable through strict employment protection, while creating considerable work disincentives for “outsiders” through ill-designed social benefits, especially those in low-wage segments. European workers cannot ignore the fact that more than a billion workers have entered the global market over the last decade. Strict employment protection and weak work incentives undermine labor participation and efficiency in Europe. Many governments in the region have been making the labor market more contestable, and others can learn from them.
· Is Europe taking advantage of the greater potential for labor mobility arising from economic integration? The short answer is no. Although migration between EU countries is higher than in other parts of the world, intra-EU migration falls short of the European Union’s aspiration of a fully integrated labor market. In addition, internal labor mobility in most countries is low. The explanations (beside the obvious difference in language and culture between EU countries): housing markets are inefficient, wages do not signal labor shortages and surpluses, and the absence of a Europe-wide social safety net makes moving too risky.
· How can Europe become a global magnet for talent? With more self-interested immigration policies. Without changes in labor force participation, the European Union will need about a million immigrants a year for the next five decades to offset its population decline. Immigration policies in
295
CHAPTER 6
most European countries focus too much on political factors, such as family reunification, asylum, and human rights, and too little on economics, such as the demands of employers and skill shortages. Though morally laudable, this tilt may make Europe a loser in the competition for globally mobile talent. Some countries have introduced demand-driven residency and work permits, but even their systems struggle to keep up with shifts in shortages and demand for new talent. Immigration policy needs to be complemented with policies that make risk-taking, entrepreneurship, and skills more profitable.
Europe is aging and its labor force shrinking. This is not news. But the speed and size of these developments may shock readers, and should motivate policy responses. Labor market regulations, interventions, and institutions are restraining growth, and they must be updated. Education and training systems will need reform to enable workers to move to more productive jobs, with greater ease and to greater profit. Europeans are still less likely to move than people in other parts of the world, and the success of the Single Market for Services depends on their becoming more mobile. Much more can be done to make Europe a global—not just a regional—magnet for talented people. To do all this, Europe’s policymakers will have to convince themselves and their constituents that the rewards of hard work can be shared sensibly without treating labor as a lump.
The European work modelIf a “European work model” exists, it likely features structures that grant greater power and protection to workers and greater importance to security, possibly at a cost to entrepreneurial risk-taking and individual enterprise. Because any “model” is likely to reflect social norms or values, microdata from the European Values Survey and World Values Survey can be used to examine attitudes toward work. Country-level indicators constructed by the oECD in Paris and the Institute for the Study of Labor in Bonn can also be used to capture structural differences in labor markets and to try to categorize European countries and their non-European peers into work-model types.
Attitudes and values toward workPeople who study social norms and preferences speak of “work centrality” in reference to the importance that work plays in a person’s life. In societies where work centrality is greater, work ethics rest on the belief that work is desirable and rewarding in its own right (Hirschfeld and Feild 2000). Economists focus analysis of work centrality on differences in working hours, and quite a bit has been written on the differences in hours worked between the United States and Europe. Some theorists relate the increased working hours in the United States to the long-standing cultural differences possibly rooted in America’s puritan Calvinist heritage: “new England’s Puritan settlers avidly struck long-standing religious holidays off the calendar (including Christmas) and thereby increased their total work days significantly” (Alesina, Glaeser, and Sacerdote 2006, p. 46). However, Europeans actually worked longer hours than Americans up until the late 1960s.1 Blanchard (2004) asks whether the large decrease in hours worked in Europe should be interpreted as a growing preference for leisure as productivity increased, or as the result of increasing distortions, such as high taxes on work, early retirement programs, and so on.

296
GoLDEn GRoWTH
A large body of empirical research finds that taxation (Rosen 1997; Prescott 2004; Davis and Henrekson 2005), unionization and regulation (Alesina, Glaeser, and Sacerdote 2006), and individual preferences (Blanchard 2004) all lead to Europeans’ working fewer hours than people in other countries. When reasonable elasticity estimates are used, however, differences in tax rates and distortions explain only about half the discrepancy between hours worked in the United States and Europe.2 Attributing the fall in hours worked since the mid-1970s to increases in tax rates and regulation alone depends on unrealistic assumptions about utility and the strength of income and substitution effects (Blanchard 2004).
In Ireland, average hours worked per year fell from 2,140 in 1970, to 1,670 in 2000 (25 percent), and during this period the Irish economy boomed, with major in-migration, an increase in labor participation rates, and low unemployment, together with a small increase in the average tax rate. Using this example, Blanchard (2004, p.9) argues that “a large part of the decrease in hours per capita over the last 30 years in Europe reflects … a choice that is likely to be made voluntarily by workers”. From analysis of 10 years of microdata from Germany, and country-level data from 12 oECD countries, Alesina, Glaeser, and Sacerdote (2006) conclude that “Europeans seem to be happy to work less and less. Whether they internalize the macroeconomic effects of working less, like relative shrinking of the size of their economies relative to emerging countries, or a decline in the relative prominence of Europe as an economic superpower, is of course a different matter” (p. 55).
Several researchers have looked at the relationship between work satisfaction and overall reported happiness. Clark (1997) argues that an understanding of job satisfaction provides “an additional route towards the understanding of certain important labour market behaviours,” and that job satisfaction is “… as close as we are likely to come to a proxy measure of utility at work” (p. 344). There is a strong positive correlation between job satisfaction and subjective measures of happiness, and a negative correlation between annual working hours and job satisfaction (r = –0.65, figures 6.1 and 6.2). A large body of empirical research,
Figure 6.1: Self-reported measures of happiness are positively associated with job satisfaction
Figure 6.2: People who work fewer hours report higher levels of job satisfaction
Source: Torgler 2011, based on European Values Survey and World Values Survey.

297
CHAPTER 6
for example, shows a strong link between low job satisfaction and quitting behavior, absenteeism, and lower work performance.3
A negative correlation (r = –0.47) between work and leisure preferences is reported by respondents to the European and World Values Surveys (figure 6.3). Sweden is an outlier. Excluding Sweden strengthens the negative correlation (r = –0.75). The broader European neighborhood is different, with a positive correlation (r = 0.44) between the reported importance of work and leisure (figure 6.4). Excluding Albania, the positive correlation increases significantly (r = 0.77). Somewhat counterintuitively, given the rising concern for a tradeoff between work and family life, the data show a strong and positive correlation between the importance of work and that of family centrality (r = 0.76), particularly in newer EU members and countries in the broader European neighborhood. There is a similarly positive—but a substantially smaller—correlation (r = 0.37) for the wealthier countries of Western Europe.
Including a wider set of variables to control for individual, household, and other characteristics, regression analysis conducted for this report using the microdata from the European Values Survey and World Values Survey indicates that work centrality is significantly greater in the European Union’s newest members and further in Central and Eastern Europe. The results of this analysis are reported in annex 6.2.
Living in emerging Europe rather than in wealthy Western Europe increases the probability that work is viewed as very important by 5–7 percentage points (figures 6.5 and 6.6). It also increases by around 10 percentage points the probability of strong agreement to the statement “Work should always come first.” Perhaps unsurprisingly, part-time workers (those who work less than 30 hours a week) are less likely to care more about work than full-time employees. Again not surprisingly, work is more central to the lives of the self-employed than it is to full-time employees. Less in line with earlier research, though, analysis of the microdata shows not only a positive correlation between religious activity and work centrality but an observable impact of being Protestant (controlling for religiosity and church attendance) on extreme work
Figure 6.3: In advanced Europe, a clearer tradeoff between preferences for work over leisure
Figure 6.4: In emerging Europe, a tradeoff between work and leisure is less apparent
Source: Torgler 2011, based on European Values Survey and World Values Survey.

298
GoLDEn GRoWTH
centrality (“work should always come first, even if it means less spare time”). Ideology is important: people who are “conservative” are more likely to rank work higher. By contrast, there is a negative correlation among income, level of education, and work centrality.4
Europe’s policies regulating work are distinctInterest among academics and policymakers in identifying a European work model became apparent in the mid-1990s, as part of broader discussion of a “European social model” to combine economic growth with social cohesion. The European social model distinguished economic policy in Europe from that in the United States. In the early 2000s, identifying and promoting a European work model and European social model became an official EU project, and the Lisbon Agenda was forged as a response to declining growth and increasing unemployment in Europe. The Lisbon objective was to make Europe “the most competitive and dynamic knowledge-based economy of the world, capable of sustainable economic growth with more and better jobs and greater social cohesion by 2010.”5
Since then, there have been several attempts to identify the components of the model—or models—that set work in Europe apart from that in other countries with similar economic and institutional development. The most prominent attempt examines indicators of labor market outcomes and poverty rates. Sapir (2005, p.1), for example, differentiates between the “nordic” and “Anglo-Saxon” models (“both efficient, but only the former manages to combine equity and efficiency”) and the “Continental” and “Mediterranean” models (“which together account for two-thirds of the GDP of the entire EU[25] and 90 per cent of the GDP of the [12-member] eurozone” that are “inefficient and unsustainable”).
Is there indeed a European model, or rather several distinct ones, and do the differences across work models matter for the functioning of the labor market? To answer this question, the oECD, European Union, and other European
Figure 6.5: The importance of work is only weakly associated with the importance of family in the EU15
Figure 6.6: In emerging Europe, the importance of work and family are closely associated
Source: Torgler 2011, based on European Values Survey and World Values Survey.

299
CHAPTER 6
countries are mapped—using principal component analysis—into groups based on labor market policies (regulations, interventions, and institutions).6 These policies try to mitigate a tradeoff in the labor market between flexibility and security. Flexibility refers to the costs to firms of hiring, maintaining, and firing workers, which is determined by regulation (employment protection legislation, minimum wage, and maximum length of temporary contracts), interventions (the level of the tax wedge indicating the cost of hiring workers), and institutions (the bargaining power of workers, measured by union density). “Security” refers to the state’s ability to help workers manage labor market transitions and provide them with appropriate safety nets and work conditions (spending on employment assistance programs and social assistance, gross replacement rates of unemployment benefits, unemployment benefit duration, and days of paid annual leave).
The principal component analysis yields four different groups of countries along the dimensions of flexibility and protection (figure 6.7). Group 1 comprises countries with fairly high labor market flexibility and worker protection; group 2 countries display low labor market flexibility but high worker protection; group 3 countries have low labor market flexibility and offer little worker protection; and group 4 countries have high labor market flexibility but low worker protection.7
The groups that emerge indicate that there is a European work model, distinct from that of other oECD countries. Based on the extent of labor market regulation and the nature of interventions and institutions, all non-European oECD countries fall into group 4 (flexible labor markets but less generous safety nets and social assistance).
Within Europe there is significant variation. The four models do not always coincide with geographic groupings within Europe, especially when considering a set of countries larger than wealthier Western Europe. That said, some
Figure 6.7: Europe’s approach is distinct—but there are differences within Europe
(four work models, based on flexibility and protection, 2007)
note: Classification is obtained through principal component analysis (see annex 1). Countries with highly flexible labor markets (higher values) are those with low employment protection legislation, low union density, low tax wedge, low minimum wages, and high maximum duration of temporary contracts; countries with high protection (higher values) are those with higher spending on “active” employment assistance programs, social assistance benefits, high replacement rates of unemployment benefits, long duration of unemployment benefits, and annual leave. The value 0 represents the average position in flexibility and protection across all countries in the sample.Source: World Bank staff calculations, based on data on labor regulation, interventions, and institutions from the Institute for the Study of Labor, oECD, and the World Bank. See annex 1 for more information.

300
GoLDEn GRoWTH
countries have managed to achieve both high labor market flexibility and high worker protection (group 1). Denmark’s flexicurity model is the most salient example, but Austria, Ireland, Switzerland, and the United Kingdom also fall into group 1. Most of the other EU15 countries, together with norway, Slovenia, and Serbia, also provide significant worker protection, but their labor markets are fairly rigid (group 2). The majority of transition countries and Turkey are in group 3, with rigid labor markets and low worker protection. Some transition countries—most notably Georgia, but also Albania, Moldova, and Montenegro among others—can also be found in group 4, together with the non-European oECD countries.
In general, there seems to be a tradeoff between flexibility and protection in labor markets, with a negative correlation between flexibility and protection across countries. This correlation is even stronger when considering only high-income countries. As discussed above, there seems to be a split among high-income countries, with the EU15 countries concentrating in group 2 and the non-European oECD countries in group 4. This suggests that as incomes increase, countries gravitate toward one of two work models: one that forgoes flexibility or one that forgoes protection. In that sense, transition countries might embark on a path toward one of the two work models. Some already seem to have chosen—Georgia, for example, the high flexibility/low protection model, and Slovenia, the low flexibility/high protection model.
Similar policies can yield different resultsSimilar labor policies can lead to different outcomes. Efficiency is higher in countries with higher than median labor force participation rates and lower than average unemployment rates, youth unemployment rates, and long-term unemployment rates (table 6.1). Countries with structurally high labor force participation rates and low unemployment rates are considered efficient; all others, inefficient.8 Equity is measured by the Gini coefficient in consumption/income.9 Labor market outcomes across countries can vary with different
Table 6.1: Similar policies can lead to different outcomes
(labor market efficiency versus equity, 2007)
Low equity High equity
High “efficiency” in labor markets Canada, Estonia, Latvia, New Zealand, Switzerland, United Kingdom, United States
Australia, Austria, Denmark, Ireland, Japan, Netherlands, Norway, Slovenia, Sweden
Low “efficiency” in labor markets
Albania, Azerbaijan, Bosnia and Herzegovina, Bulgaria, Georgia, Greece, Lithuania, Macedonia FYR, Mexico, Moldova,
Montenegro, Portugal, Romania, Turkey
Armenia, Belgium, Croatia, Czech Republic, Finland, France, Germany, Hungary, Italy, Republic of Korea, Poland, Serbia, Slovak
Republic, Spain, Ukraine
note: Color coding corresponds to the work models as defined in figure 6.7, based on labor market instruments and outcomes: purple (group 1); brown (group 2); yellow (group 3); and black (group 4). Equity classification is based on Gini coefficients for consumption and income and does not reflect equality in opportunities.Source: World Bank staff calculations, based on data from the Institute for the Study of Labor, oECD, and the World Bank; and ILo 2010. See annex 6.1 for more information.

301
CHAPTER 6
instruments and institutions, especially in efficiency and equity. Countries that have a similar work model, as defined above and indicated in the table by the color codes, can actually have very different labor market outcomes.
What can we learn from this exercise? For wealthy countries, the tradeoff between equity and efficiency might be overstated. Many countries—the nordic countries and Australia, Austria, Ireland, Japan, the netherlands, and Slovenia—have achieved equity and efficiency. At the other extreme, many others achieve neither (table 6.1). As reasoned by Sapir (2005), the discussion of the “European social model” and of equity and efficiency in labor markets suggests that in some countries the current model may not be sustainable, and this report concurs. Given the current fiscal and demographic pressures, models that underperform in efficiency have become unsustainable or will soon be. At the same time, many countries with efficient labor markets display low equity, among them many non-European oECD countries such as the United States.
The experience of some countries in Europe provides reason to believe that increasing labor market efficiency need not mean a big loss of equity. Countries with both equity and efficiency are among the richest in Europe. These countries arguably have strong institutions in place that cannot easily be replicated. In countries where institutions are not as mature, there might be a tradeoff between equity and efficiency. Europe is not left with many choices.
More—and more productive—workersLooking ahead, Europe will have to counter the aging and shrinking of its working-age population by having workers work more, recruiting more workers from at home and abroad, and critically, making workers more productive by equipping them with the right skills for a competitive global economy. As outlined in the previous section, workers in Europe benefit from the most effective protection against abuse by employers and the most comprehensive job security and nonwage benefits, such as unemployment insurance, paid leave, and retirement pensions, which sustain shorter work hours than in most of the developed world. In many ways, these characteristics set Europe apart from other regions and are a triumph of economic development and liberal democracy. But given changes in Europe and the rest of the world since the end of the continent’s “Golden Age” between 1950 and the mid-1970s (see spotlight one), and the speed of global economic integration since, many features of the European work model are coming under critical scrutiny. These challenges are exacerbated by a shrinking and aging labor force. This in turn reinforces the need to develop human capital that is relevant in a constantly changing labor market, especially among excluded groups, by rethinking education, training, and lifelong learning policies.
The decline of workPeople in many countries are working less than they used to. As countries have grown richer, people have consumed more leisure, and the average number of hours worked in a year has declined in most middle- and high-income countries (figure 6.8). Where this reduction in hours worked is matched by gains in productivity—the output of the average worker—the decline should be expected and treated as healthy, as in Ireland, Poland, and the Slovak Republic. Yet, the

302
GoLDEn GRoWTH
speed of the decline in hours worked in France, Italy, and Spain since 1995 raises concern when juxtaposed with their modest gains in labor productivity during the last two decades (figure 6.9).
Several countries in Europe hold the dubious distinction of having rates of labor participation among the lowest in the world. This is a feature that marks both high- and middle-income countries in the region. The percentage of working-age people who participate in the labor market has fallen at a faster pace in several large European economies than in other member countries of the oECD (figure 6.10). In Europe’s southern periphery, a rare coincidence threatens future prosperity: women have low participation rates and low fertility, adding less to both today’s economic output and tomorrow’s.
Figure 6.8: The decline in hours worked was faster in Europe than elsewhere in the OECD
(reported average hours worked per year, 2008, 1990 = 100)
Figure 6.9: Europe has both productivity leaders and laggards
(GDP per hour of work, 2008, 1990 = 100)
Source: World Bank staff calculations, based on the oECD Productivity Database.
Source: World Bank staff calculations, based on ILo 2010.
Figure 6.10: The decline in work participation has been faster in Europe
(change in the labor force participation of men ages 15–64, percentage point difference 1980–2008)
Figure 6.11: Europeans are retiring at earlier ages than they used to
(change in the average effective retirement age of men, number of years difference 1965–2007)
Source: World Bank staff calculations, based on WDI. Source: World Bank staff calculations, based on updated data from oECD 2006.
303
CHAPTER 6
Europeans have also been withdrawing from the labor market to retire at a much earlier age than previously (figure 6.11). In France and Spain, for example, the effective age of retirement of men has fallen about twice as much as it has in Canada, Japan, and the United States. With the notable exception of the Czech Republic and Germany, where workers are staying active a bit longer than they used to, the trend in Europe is toward earlier retirement, despite efforts of governments in many countries to make qualifying for pensions more difficult. This contrasts with the gentler decline in the effective retirement age of workers in the United States, and sharply with the relative stability in the age of retirement in high-income East Asian countries. Men in the Republic of Korea, for example, are actually working almost six years longer than they were in 1965.
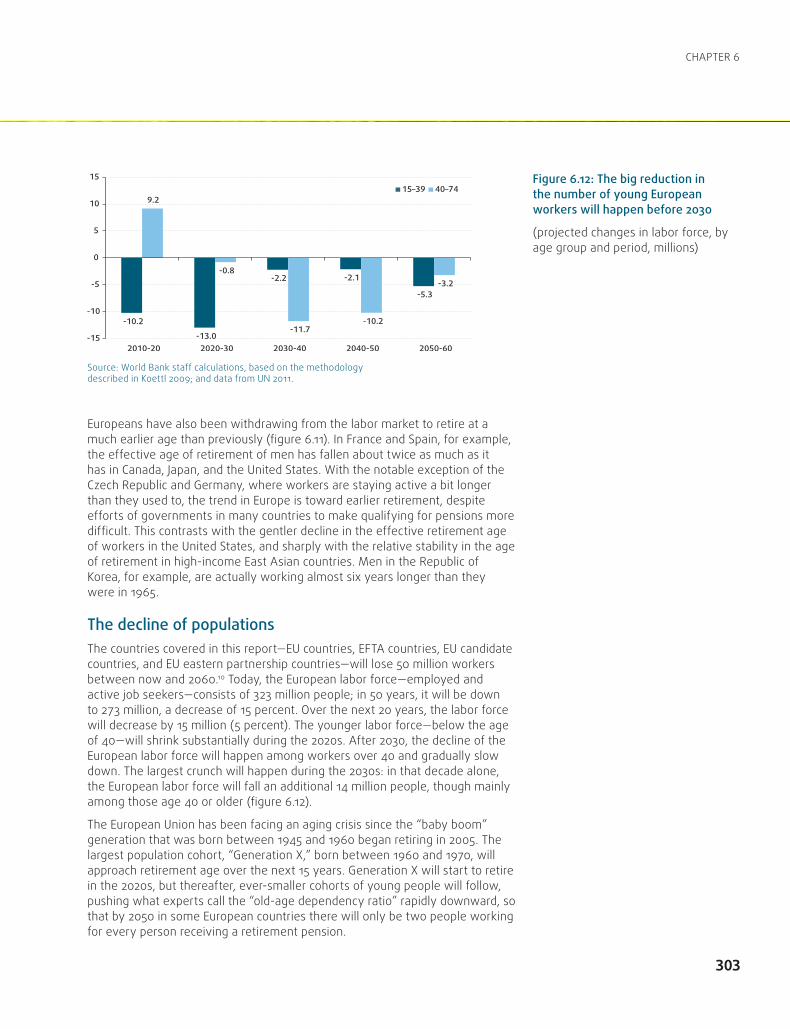
The decline of populationsThe countries covered in this report—EU countries, EFTA countries, EU candidate countries, and EU eastern partnership countries—will lose 50 million workers between now and 2060.10 Today, the European labor force—employed and active job seekers—consists of 323 million people; in 50 years, it will be down to 273 million, a decrease of 15 percent. over the next 20 years, the labor force will decrease by 15 million (5 percent). The younger labor force—below the age of 40—will shrink substantially during the 2020s. After 2030, the decline of the European labor force will happen among workers over 40 and gradually slow down. The largest crunch will happen during the 2030s: in that decade alone, the European labor force will fall an additional 14 million people, though mainly among those age 40 or older (figure 6.12).
The European Union has been facing an aging crisis since the “baby boom” generation that was born between 1945 and 1960 began retiring in 2005. The largest population cohort, “Generation X,” born between 1960 and 1970, will approach retirement age over the next 15 years. Generation X will start to retire in the 2020s, but thereafter, ever-smaller cohorts of young people will follow, pushing what experts call the “old-age dependency ratio” rapidly downward, so that by 2050 in some European countries there will only be two people working for every person receiving a retirement pension.
Figure 6.12: The big reduction in the number of young European workers will happen before 2030
(projected changes in labor force, by age group and period, millions)
Source: World Bank staff calculations, based on the methodology described in Koettl 2009; and data from Un 2011.
304
GoLDEn GRoWTH
The decrease in labor force participation varies considerably across European countries. The main reason is that fertility rates in Europe range from around 1.2 to 1.5 in the Eastern, Central, and Southern European countries, to 1.6 to 2.0 in the Benelux and northern European countries. This is lower than the demographic replacement rate of 2.1 required to keep the size of the population stable.
The fall in the labor force will be particularly severe for EU and EFTA countries. Their labor force will decrease by 39 million people (18 percent) over the next 50 years. The other Eastern European countries do not fare much better, with an equally steep decline of 16 percent. The only exception is Turkey, where the labor force is projected to increase 12 percent until 2060.
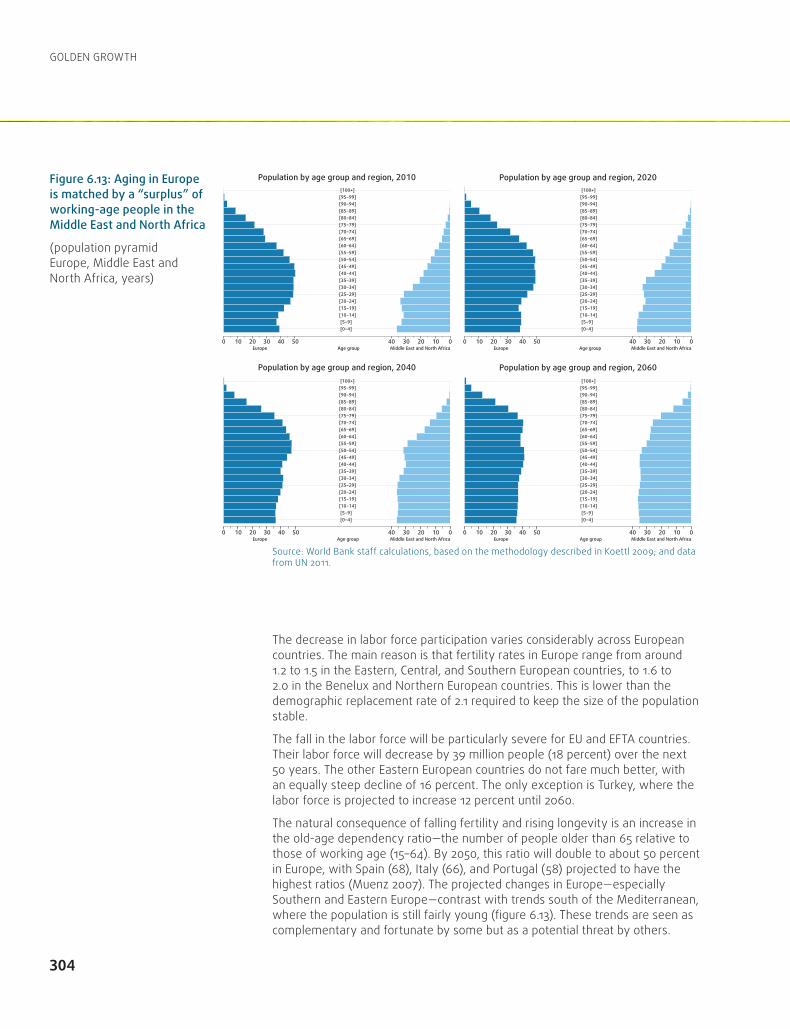
The natural consequence of falling fertility and rising longevity is an increase in the old-age dependency ratio—the number of people older than 65 relative to those of working age (15–64). By 2050, this ratio will double to about 50 percent in Europe, with Spain (68), Italy (66), and Portugal (58) projected to have the highest ratios (Muenz 2007). The projected changes in Europe—especially Southern and Eastern Europe—contrast with trends south of the Mediterranean, where the population is still fairly young (figure 6.13). These trends are seen as complementary and fortunate by some but as a potential threat by others.
Figure 6.13: Aging in Europe is matched by a “surplus” of working-age people in the Middle East and North Africa
(population pyramid Europe, Middle East and north Africa, years)
Source: World Bank staff calculations, based on the methodology described in Koettl 2009; and data from Un 2011.
305
CHAPTER 6
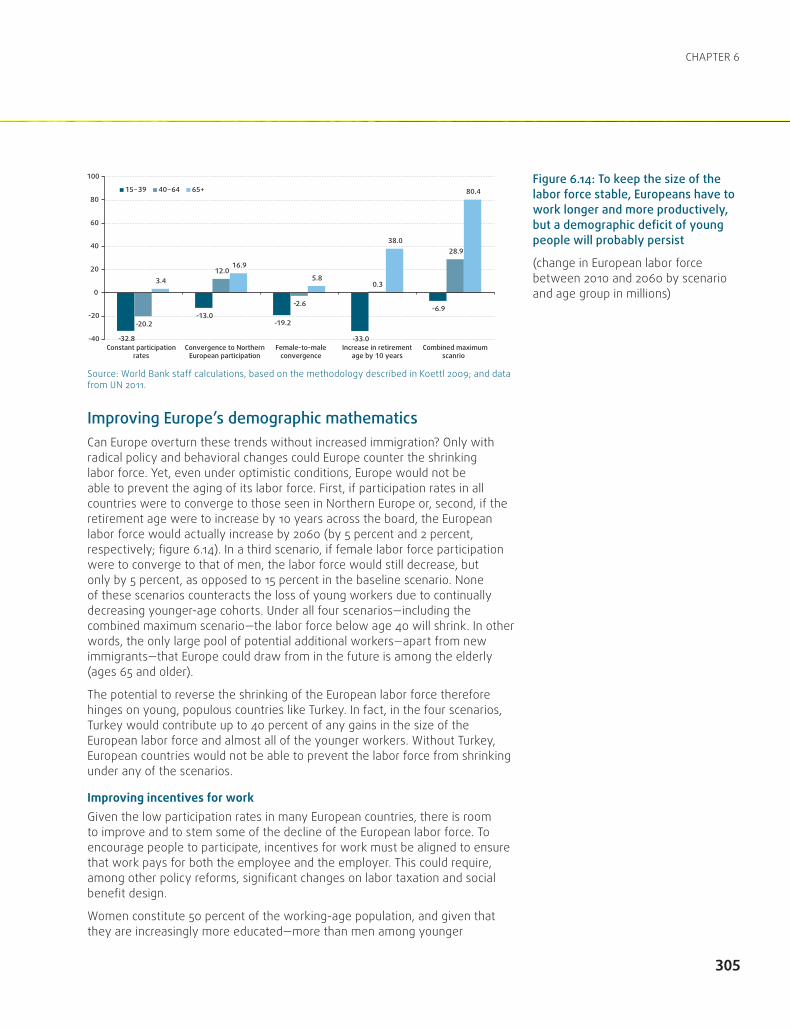
Improving Europe’s demographic mathematicsCan Europe overturn these trends without increased immigration? only with radical policy and behavioral changes could Europe counter the shrinking labor force. Yet, even under optimistic conditions, Europe would not be able to prevent the aging of its labor force. First, if participation rates in all countries were to converge to those seen in northern Europe or, second, if the retirement age were to increase by 10 years across the board, the European labor force would actually increase by 2060 (by 5 percent and 2 percent, respectively; figure 6.14). In a third scenario, if female labor force participation were to converge to that of men, the labor force would still decrease, but only by 5 percent, as opposed to 15 percent in the baseline scenario. none of these scenarios counteracts the loss of young workers due to continually decreasing younger-age cohorts. Under all four scenarios—including the combined maximum scenario—the labor force below age 40 will shrink. In other words, the only large pool of potential additional workers—apart from new immigrants—that Europe could draw from in the future is among the elderly (ages 65 and older).
The potential to reverse the shrinking of the European labor force therefore hinges on young, populous countries like Turkey. In fact, in the four scenarios, Turkey would contribute up to 40 percent of any gains in the size of the European labor force and almost all of the younger workers. Without Turkey, European countries would not be able to prevent the labor force from shrinking under any of the scenarios.
Improving incentives for workGiven the low participation rates in many European countries, there is room to improve and to stem some of the decline of the European labor force. To encourage people to participate, incentives for work must be aligned to ensure that work pays for both the employee and the employer. This could require, among other policy reforms, significant changes on labor taxation and social benefit design.
Women constitute 50 percent of the working-age population, and given that they are increasingly more educated—more than men among younger
Figure 6.14: To keep the size of the labor force stable, Europeans have to work longer and more productively, but a demographic deficit of young people will probably persist
(change in European labor force between 2010 and 2060 by scenario and age group in millions)
Source: World Bank staff calculations, based on the methodology described in Koettl 2009; and data from Un 2011.
306
GoLDEn GRoWTH
cohorts—they represent a large pool of untapped talent. Even if their entry into the market in larger numbers does not produce the payoff in additional workers that increasing the retirement age does, it could have a large productivity payoff. Increasing female labor force participation would require interventions that allow women to better juggle multiple roles by providing, for example, child care facilities and flexible work arrangements (World Bank 2011e). The latter might also play an important role for keeping elderly workers in the labor force by allowing them to phase in retirement on a part-time basis.
To increase labor force participation across the board, both employees and employers need the right incentives. Currently, it seems that disincentives for (formal) work are substantial in many European countries, especially for low-productivity workers. For example, Koettl and Weber (forthcoming) show that when comparing formal jobs with informal jobs, the benefits of formal jobs would have to be quite large to offset their costs in terms of taxes, social security contributions, and withdrawn social benefits. A similar result might hold for a comparison between formal jobs and inactivity. This leads to the conclusion that formal (part-time) jobs at low wage levels may not be an economically viable option for low-productivity job seekers in many European countries. For employers, high labor taxation has similar implications as it increases the total costs of labor and makes it less attractive to hire (see also chapter 7 on labor and corporate income taxation). A microeconometric analysis using EU-Statistics on Income and Living Conditions data suggests that there is a negative correlation between the incidence of formal employment and work disincentives at the individual level.
Two main levers can make (formal) work pay for low-productivity workers and their employers: decreasing the labor tax wedge at lower wage levels and “smoothing” incentives with changes to social assistance, housing, and family benefits. Regarding the tax wedge, current social protection financing in several countries discriminates against lower-wage earners. options for reducing the labor tax wedge include incentives linked to wage subsidies, social insurance contribution credits, or so-called “in-work” or employment-conditional benefits—cash benefits or refundable income tax credits conditional on formal employment—for low-wage earners. With regard to the design of social assistance, housing, and family benefits, the key is to keep the marginal effective tax rate in mind when designing eligibility conditions and the ways that benefits are withdrawn. The goal is to reform these benefits toward so-called “smart safety nets,” making social protection benefits more compatible with work. In particular, any additional wage should also increase beneficiaries’ net incomes, including benefits. otherwise, additional work does not pay, and beneficiaries will prefer not to work at all, to work informally, or to underreport their earnings.11
Developing skillsBesides getting more people to work, Europe will have to enable workers to contribute at their highest potential. Doing so requires continual reform of education and training systems.
As discussed in chapters 4 and 5, skills are critical for innovation and firms’ growth. Recent studies from oECD and developing countries spotlight the
307
CHAPTER 6
importance of skills—cognitive, socioemotional, technical—in determining productivity. For example, Hanushek and Woessmann (2011) have shown that cognitive skills (proxied by Programme for International Student Assessment scores) explain a sizable part of the variation in growth rates observed in oECD countries, including Western Europe.12 In fact, the evidence suggests that generic skills also have substantial growth payoffs, even in advanced economies. Unsurprisingly, skills are at the center of the policy agenda of the European Union and Europe at large, as reflected in the European Union’s growth strategies (Lisbon Agenda, Europe 2020) and numerous strategic and policy documents (European Commission 2010b; Sondergaard and Murthi 2011).
Skills include not only technical ability, but also generic cognitive skills (literacy, numeracy, problem solving) and generic noncognitive skills (socioemotional and behavioral attributes such as teamwork, self-discipline, and perseverance). A solid base of generic skills seems to be a prerequisite for further acquisition of technical skills, whether through post-secondary education or on the job.13
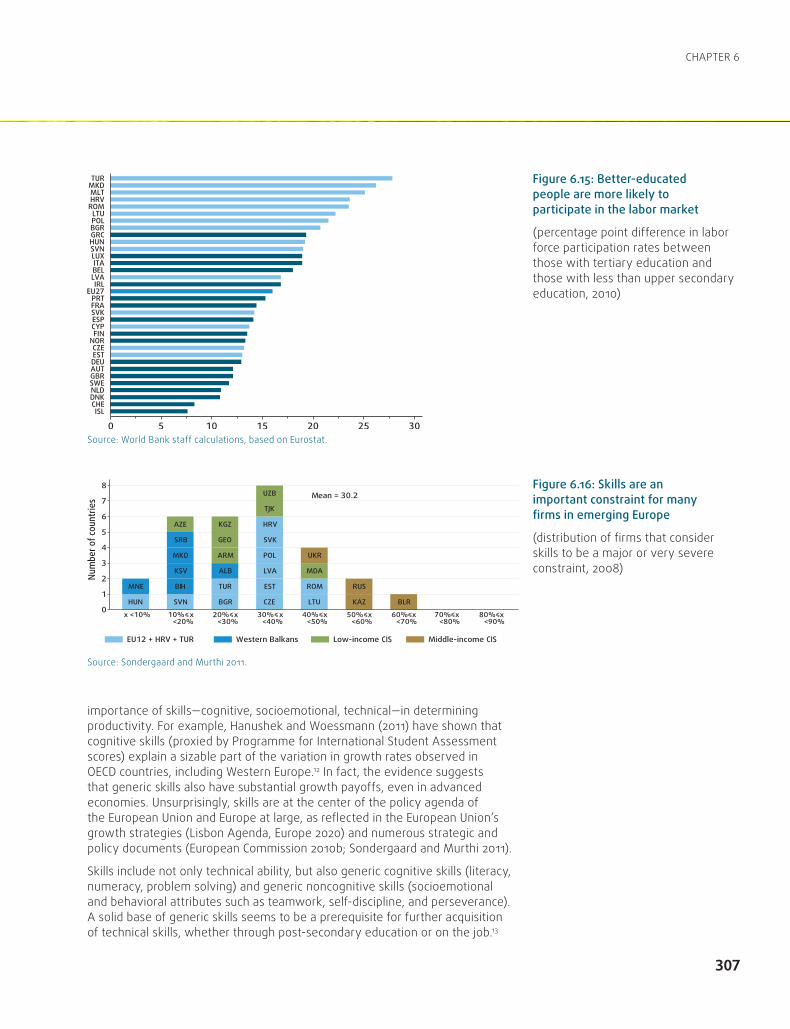
Figure 6.15: Better-educated people are more likely to participate in the labor market
(percentage point difference in labor force participation rates between those with tertiary education and those with less than upper secondary education, 2010)
Source: World Bank staff calculations, based on Eurostat.
Figure 6.16: Skills are an important constraint for many firms in emerging Europe
(distribution of firms that consider skills to be a major or very severe constraint, 2008)
Source: Sondergaard and Murthi 2011.

308
GoLDEn GRoWTH
Further, the foundation for the development of generic skills is built early in life and during adolescence and hinges on having access to adequate nutrition, nurturing environments, and high-quality basic education (World Bank 2011b). Efforts by the oECD and the World Bank to measure the availability of and demand for cognitive and noncognitive skills are underway.14
Skills not only matter for economywide productivity but also individual labor market outcomes. Heckman, Stixrud, and Urzua (2006) document the evidence for the United States, while Brunello and Schlotter (2011) review the emerging literature for Western Europe. Differences in labor force participation rates between those with tertiary education and those with less than upper secondary education range from about 8 percentage points in Iceland to 28 percentage points in Turkey (figure 6.15). In other words, in Turkey the higher-educated are 28 percent more likely to participate than those with lower education. This could be of particular importance for excluded groups. In Bulgaria, Romania, and Serbia, the share of the Roma working-age population with at least some secondary education is 60 percentage points lower than that of the non-Roma. not surprisingly, there are also significant gaps in the labor force participation of the two groups, especially among women. In some countries, the Roma could be a quarter of labor market entrants in the near future. Helping them become more productive is not only a matter of social inclusion, it could also increase economic growth (World Bank 2010).
Firm surveys show that skills have in recent years become increasingly binding for productivity and job creation in emerging Europe. Skilled-labor shortages have become the second-most commonly reported constraint to growth in the enterprise surveys across all countries in Eastern Europe, behind only tax rates (Sondergaard and Murthi 2011). on average, 30 percent of firms considered education and skills to be a major or severe constraint in 2008 (figure 6.16). Upwards of 40 percent of firms were dissatisfied with the availability of skilled workers in the former Yugoslav Republic of Macedonia and Ukraine. These surveys have found that in addition to technical skills, the lack of noncognitive generic skills appears especially binding (World Bank 2009 and Rutkowski 2010). Also in oECD countries and some middle-income countries, noncognitive skills are as important as cognitive and technical skills in firms’ hiring decisions.15
Despite overall success in increasing student enrollment, the quality of education needs to be improved. The picture of education quality in Europe is diverse. outcomes—as measured by the Programme for International Student Assessment—appear particularly poor in Azerbaijan, Bulgaria, Montenegro, and Romania, which have students in early grades that underperform relative to the country’s level of development (figure 6.17). For another group of countries (Bulgaria, Croatia, the Czech Republic, and FYR Macedonia), the performance in cognitive tests worsened between 2006 and 2009. Worrisome for labor market outcomes, upper secondary and tertiary education students may be graduating with the wrong skill sets (Sondergaard and Murthi 2011). There is evidence that after the transition, the obsolescence of technical skills was not addressed and that vocational education systems have not performed well. As a result, employers today often assert that it is difficult to find graduates with adequate technical skills.

309
CHAPTER 6
Effective policy interventions can address many of these problems. As discussed in a recent World Bank report, interventions should focus on overcoming failures in information and quality assurance. Countries in emerging Europe have to reorganize their school networks to deal with shrinking student populations. Countries should also rethink their training and education systems to avoid specialization in narrow (technical) fields too early in a student’s career. Countries should also ensure that preschool and basic education curricula and pedagogic practice pay adequate attention to the development of cognitive and noncognitive skills. The experience with related reforms and interventions in Europe and the rest of the world can offer useful lessons. Lifelong learning will become increasingly important given the demographic trends (Chawla, Betcherman, and Banerji 2007; European Commission 2006). In short, it is the formation of the right skills rather than diplomas that should be the focus of reforms (Sondergaard and Murthi 2011). To that end, more information is needed on the learning and employment outcomes of students and graduates.
Making jobs more contestableEconomists view competition much like most people view exercise. At some abstract level, we all know it is good for us, but go to surprising lengths to avoid it. Economic agents—individuals or enterprises—are constantly hunting for an opportunity to monopolize a market. Just as we accept that exercise is a good thing, paying ever-higher fees to go to the gym and be put through a punishing workout by a personal trainer, as taxpayers we finance government agencies to eliminate uncompetitive practices. The rationale for the government’s role in the labor market is much the same: to protect workers from a lack of competition among employers for their labor and human capital.
Figure 6.17: Cognitive skills are adequate in most European countries
(reading competency of 15-year-olds on the Programme for International Student Assessment 2009 versus income)
note: The figure shows a log-linear regression line representing countries’ predicted reading score in the Programme for International Student Assessment on their GDP per capita. The blue line is the oECD mean reading score.Source: Sondergaard and Murthi 2011.
310
GoLDEn GRoWTH
Yet, these policies are from a time in Europe’s history when large-scale manufacturing dominated economies, and a few (and in some places even single) employers could set the price of labor and manage their human resources with impunity. Images come to mind of the abuses in Victorian-era Britain, where workers toiled for 14-hour shifts and could be dismissed at the employer’s whim. The balance of information and power between those who seek jobs and those who offer them has shifted considerably in the decades since. And along with this shift, the changing economic structure of most European countries—away from large-scale industry toward varied services—has made the labor market more “atomistic.” As more and more services become tradable (see chapter 2), it is harder for employers and workers to avoid competition.
But labor market policy has not kept up with these changes. The policies prevalent in Europe—and parts of the world that Europeans trade and compete with—make its labor markets more difficult to contest, especially for new, younger entrants. This lack of contestability may discourage some from entering the labor market at all, impede the efforts of others to match up with employers who could most benefit from their skills and attitudes, and increase the incidence and duration of unemployment. Recent evidence shows that in countries where the labor market is less contestable—especially due to restrictions on dismissal—individuals and firms are more likely to take their activities into the shadows of unregulated and untaxed markets, depriving the state and society of public goods and holding back economies from fulfilling their growth potential.
Box 6.1: Is a flexible labor market necessary for successful monetary union?For some countries, the last few years has been difficult, being part of a currency union during, particularly one as large and economically diverse as the eurozone. Depreciation could have come in handy, as it did in the Czech Republic and Poland. But for euro area members and those with currencies pegged to the euro, this was not an option. For the few such as Latvia that made it easier to adjust wages downward, being linked to a strong currency was less of a problem.
The 2008 crisis and contraction put these strains into sharp relief. But tensions had been growing long before. Differences in real unit labor costs (RULCs) between euro area members have persisted since the start of the Economic and Monetary Union, widening during the crisis. RULCs reflect prices and nominal labor costs, and on both indicators euro area members have diverged. This is most noticeable in shifts in nominal unit labor costs since 2003: while in Germany the growth rate in nominal unit labor costs has been well below the euro area average, reflecting a stronger wage discipline, in Greece, Ireland,
and Spain nominal unit labor costs have increased noticeably compared with the average.
Widening or persisting differentials in RULCs are at odds with the expectation that adopting a common currency—and hence a common anchor for inflation—should have facilitated convergence in prices and wages across euro area countries, narrowing growth differentials in RULCs. Three reasons seem to explain the divergence:
• Technologicalfactors,withcapitalaccumulation and increases in the price of intermediates both leading to higher growth in RULCs. This would be consistent with capital and labor not being easy substitutes.
• Externalfactors,capturedforexampleby the degree of openness, leading to downward pressure on RULCs due to both the disciplining effect on wage increases and the positive impact on labor productivity as a result of more access to new technologies and markets.
• Institutionalfactors,reflectingthedegreeofcompetition in product and labor markets. Higher replacement rates in unemployment benefits and wage bargaining centralization are associated with higher RULCs as they strengthen the bargaining power of workers; stringent labor regulations for hiring and firing workers could be associated with lower RULCs because they come with lower employment.
Since the divergence in labor costs across euro area members is partly the result of structural differences in the labor and product markets, better policy and institutional alignment could reduce the gaps. With a single currency and low inflation, closing the gaps in RULC growth can be painful, requiring wage cuts and possible unemployment increases. A smaller gap is needed for lagging countries to be competitive within the eurozone; given Europe’s increasing integration with the global economy, to remain competitive the convergence in RULCs will have to be downward.
Source: Based on Lebrun and Pérez 2011.

311
CHAPTER 6
Does it matter if Europe’s labor markets are inflexible and uncontestable? The broad divergence in the speed with which employment rates are recovering in the wake of the global financial crisis and recession suggests that it does. In countries that forgo the macroeconomic shock absorber offered by a flexible exchange rate (that is, all current euro area members and those preparing to join by tying their currencies to the euro), the impact of a sudden fall in demand on the product and labor markets can be mitigated if wages are allowed to fall, hours are flexible, and workers at the margin can be dismissed (World Bank 2011c; box 6.1).
When examining the relationship between labor market structures and outcomes, it is helpful to distinguish between regulations, interventions, and institutions. Regulations set work’s legal parameters, in the form of a minimum wage and/or restrictions on dismissal. The state deploys interventions to correct market failures, such as the inability of private financial markets to viably insure the risk of unemployment (unemployment insurance) and differences in how much information employers and job seekers have (job-seeking assistance). Institutions are the structures and agreed procedures for exerting influence and carrying out decisions. For the labor market, the best example is the space afforded in the legal code of most countries for collective bargaining through labor unions.
Hiring and firing workers is costlyA legislated minimum wage increases labor costs for firms and can dissuade them from offering employment to workers whose marginal productivity does not exceed the minimum. This effect will be stronger for workers with lower productivity, especially younger, unskilled, less experienced workers (Montenegro and Pagés 2005). Priced out of jobs on the formal (regulated and taxed) market for labor, they can join those genuinely unemployed, take an informal (unregulated and untaxed) job, or pretend to look for a job while
Figure 6.18: Minimum wages in the newest EU member countries are increasing faster
(level and growth, 2000-07)
note: Dark blue bars represent Western Europe, and light blue emerging European economies.Source: Fialová and Schneider 2011.
312
GoLDEn GRoWTH
working informally. But a minimum wage might also motivate workers to increase productivity or persuade job seekers and some outside the labor market to hold out for a job on the formal market, even if plenty of informal employment is on offer (Rebitzer and Taylor 1995; Manning 1995).
All new members of the European Union introduced legislated minimum wages. Although several older members do not have legally binding minimum wages, an effective minimum wage is secured through the collective bargaining process in Austria, Denmark, France, Germany, Italy, and Sweden. Generally, legislated minimum wages in the European Union’s new members are considerably lower than the legislated or effective minimum wages in the older member states. over the past decade, however, these have been on a clear upward trend. Since 2000, the minimum wage as a percentage of average wages has risen fastest in Bulgaria and the Czech Republic (figure 6.18).
A second common set of labor laws, employment protection legislation (EPL), restricts employers’ ability to dismiss workers—reducing flows into unemployment but also out of it. Strict EPL can slow new employment if restrictions on dismissing workers make employers wary of hiring someone new. For this reason, restrictions on dismissal can increase unemployment, the duration of unemployment, and the attraction of fixed-term contracts. Past a certain threshold, it can even cause employers to turn to the untaxed, unregulated labor market. Beyond affecting flows into and out of employment, EPL creates an “insider-outsider” divide. Those who have a protected job (“insiders”) are relatively guarded from losing it, while the inactive and unemployed (“outsiders”) find it more difficult to gain employment. EPL changes the distribution of jobs, with important implications for first-time job seekers, youth (especially), women, the disabled, and other disadvantaged groups.
Using the oECD’s measure of the strictness of employment protection (oECD 1999, oECD 2004, and Venn 2009)—and its application by Lehmann and Muravyev (2010) to non-oECD European countries—the least restrictive conditions for employers are in Denmark, Hungary, Ireland, and the Slovak
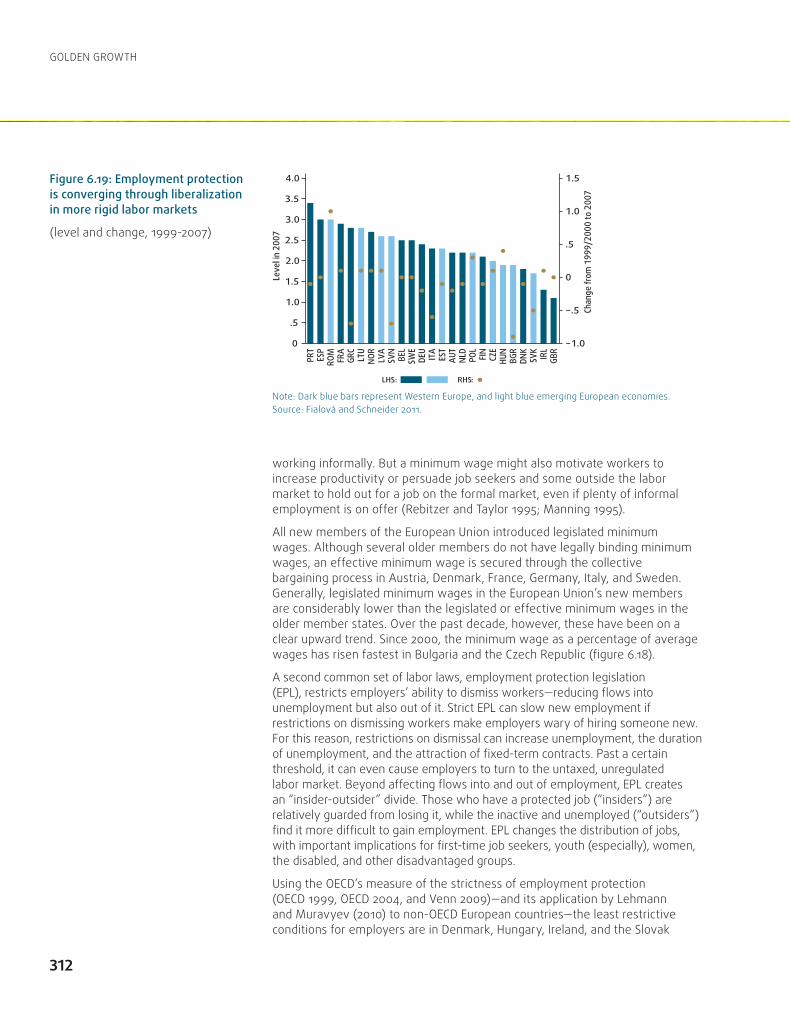
Figure 6.19: Employment protection is converging through liberalization in more rigid labor markets
(level and change, 1999-2007)
note: Dark blue bars represent Western Europe, and light blue emerging European economies.Source: Fialová and Schneider 2011.

313
CHAPTER 6
Republic. France, Greece, Portugal, and Spain have the most restrictive regulations. In Austria, Greece, Italy, Portugal, and the Slovak Republic, employment protection has been noticeably relaxed. Partly, this relaxation has come in the form of more temporary contracts, especially in Italy and Spain (box 6.2). But over the same period, Hungary, Ireland, and Poland have tightened their EPL. EPL in the European Union’s newest member states is lower than in the older members, but there has been convergence driven both by liberalization in parts of the west and growing restrictions among members in the east (figure 6.19). Lithuania and Slovenia had the most restrictive legislation, though Slovenia has liberalized recently. Romania, by contrast, recently tightened its EPL and, after Portugal and Spain, now has the most restrictive regulation.
Box 6.2: Do temporary contracts make labor markets flexible?
During the past decades, employment protection legislation (EPL) reform in Europe was mostly “partial” or “two-tier.” In the mid-1980s, several European countries, with high levels of EPL, introduced temporary contracts to increase labor market flexibility. Many countries deregulated the use of temporary contracts substantially but maintained strict protection for permanent ones. There is substantial evidence on these reforms, based largely on the Spanish experience (Dolado, GarcÍa-Serrano, and Jimeno 2002; Bentolila, Dolado, and Jimeno 2008). Because temporary contracts involve much lower firing costs, both in severance payments and legal costs, their incidence increased significantly.
Spain is a good example of labor market dualism, with the highest incidence of temporary contracts. In 1984, a two-tier EPL reform liberalized the use of temporary contracts. Spain registered the most rapid growth in temporary jobs, from 11 percent of total employment in 1983 to about 35 percent in 1995 (GÜell and Petrongolo 2007). But Spain is far from unique. According to the European Commission (2010a), EU member states that introduced two-tier EPL reforms have seen an increase in temporary employment since the mid-1980s. Countries with relatively less stringent regulations for permanent contracts—like Denmark, Ireland, and the United Kingdom—do not show any trend increase in the incidence of temporary employment.
Temporary contracts affect young workers more. In most EU member states, 40 percent of young people (ages 15–39) are on temporary contracts, especially among those under
25 years of age. The share of temporary employment among workers in the 15-to-24 age group ranges from more than 50 percent in countries like France, Germany, Poland, Slovenia, and Spain to less than 20 percent in Bulgaria, the Czech Republic, Latvia, Lithuania, Romania, the Slovak Republic, and the United Kingdom.
Temporary contracts have both positive and adverse effects. They can help firms to evaluate workers’ suitability for jobs. In that sense, temporary jobs could act as a stepping stone to more stable jobs. Temporary contracts could also act as a shock absorber, protecting firms from temporary demand fluctuations by avoiding costly adjustments to their core labor force. Boeri and Garibaldi (2007) and Boeri (2011) show that the “flexibility at the margin” provided by temporary contracts increases both hiring and firing rates for newly created jobs, as firms try to restrict firing costs through reduced conversion. of course, temporary contracts can be an easy way for firms to reduce labor costs, substituting temporary for permanent workers (Layard 2005).
Temporary contracts can help make labor markets more dynamic. Two-tier EPL reforms have dramatically raised the proportion of new recruitments of temporary contracts (Cahuc and Postel-Vinay 2002). Bover and GÓmez (2004) found that in Spain, exit rates from unemployment into temporary contracts were 10 times larger than exit rates into permanent ones between 1987 and 1994.
Using a sample of large Spanish firms in 1993–94, GarcÍa-Serrano (1998) found that
turnover rates varied by type of employment contract. In particular, a rise of one percentage point in the share of temporary employment increased flows from employment to unemployment, unemployment to employment, and employment to employment by 0.26 percentage points. Bentolila, Dolado, and Jimeno (2008) found that, insofar as the use of temporary contracts implies a rise in the hiring rate, they have helped decrease long-term unemployment, especially in periods of high growth.
Despite helping to create labor market dynamism and employment, temporary contracts can adversely affect productivity and investment in skills. Greater turnover and low conversion rates can reduce incentives to invest in firm-specific human capital (Dolado, GarcÍa-Serrano, and Jimeno 2002; Bentolila, Dolado, and Jimeno 2008). GÜell and Petrongolo (2007) argue that the negative impact of temporary work on vocational training depends on whether temporary contracts are used mainly to lower wage costs or to screen for entry-level jobs. Boeri and Garibaldi (2007) found that the share of temporary workers in Italy has a large negative impact on firm-level productivity growth. The authors argue that rising employment, in the aftermath of two-tier EPL reforms, led to falling labor productivity through decreasing marginal returns for labor.
In conclusion, the Spanish experience is mixed. It suggests that the two-tier EPL reform led to an increase in worker turnover, and a reduction in long-term unemployment. But it also is associated with a fall in investment in firm-specific human capital and productivity.
314
GoLDEn GRoWTH
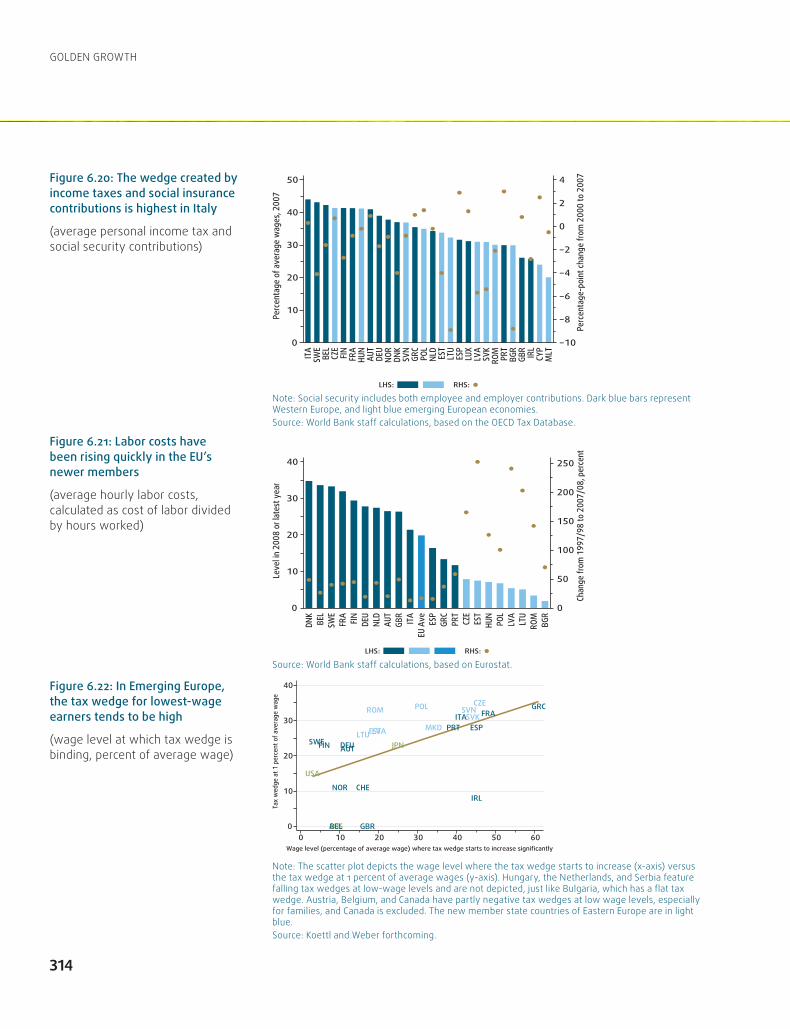
Figure 6.20: The wedge created by income taxes and social insurance contributions is highest in Italy
(average personal income tax and social security contributions)
note: Social security includes both employee and employer contributions. Dark blue bars represent Western Europe, and light blue emerging European economies.Source: World Bank staff calculations, based on the oECD Tax Database.
Figure 6.21: Labor costs have been rising quickly in the EU’s newer members
(average hourly labor costs, calculated as cost of labor divided by hours worked)
Source: World Bank staff calculations, based on Eurostat.
Figure 6.22: In Emerging Europe, the tax wedge for lowest-wage earners tends to be high
(wage level at which tax wedge is binding, percent of average wage)
note: The scatter plot depicts the wage level where the tax wedge starts to increase (x-axis) versus the tax wedge at 1 percent of average wages (y-axis). Hungary, the netherlands, and Serbia feature falling tax wedges at low-wage levels and are not depicted, just like Bulgaria, which has a flat tax wedge. Austria, Belgium, and Canada have partly negative tax wedges at low wage levels, especially for families, and Canada is excluded. The new member state countries of Eastern Europe are in light blue.Source: Koettl and Weber forthcoming.
315
CHAPTER 6
Labor market interventions—“active” labor market programs such as training and job search assistance, and “passive” unemployment benefits such as unemployment insurance and other forms of social insurance—are common in the European Union, including the new member states. These interventions are typically financed directly through a tax on earnings. In much of Europe, the cost of these interventions raises the cost of labor, creating a “tax wedge” between what employers pay for work and what workers take home (figure 6.20). The largest component of the tax wedge comes as personal income tax and contributions to pensions and health insurance, but financing these interventions also adds to labor costs. A higher tax wedge contributes to higher labor costs in the formal sector and can dissuade employers from taking on workers or increase demand for informal ways of contracting workers (Davis and Henrekson 2005; figure 6.21). not only is the level of labor taxation important, but also how it progresses over income levels. In the new member states of Eastern Europe, labor taxation tends to be high on low-wage earners, potentially making it more difficult for them to work in the formal sector (figure 6.22). Moreover, the wage level at which labor taxes start to increase is also fairly high, making labor taxation less progressive in these countries.
When well designed and administered, such programs may improve labor market performance. Active programs that enhance skills or eliminate information asymmetries that delay or frustrate matching in the labor market should shorten the job search period. Active programs might lower the search and training costs of firms and indirectly subsidize the creation of better jobs. Passive programs, such as unemployment benefits, can remove the urgency of finding a new job and improve the quality of matches. But the record of active programs is mixed at best, and if unemployment benefits are overly generous or poorly designed, they can lower peoples’ motivation to look for and accept a job.
Finally, it is difficult to isolate institutions that impact only the labor market from those that also shape other social and economic interactions. one is especially relevant: collective bargaining as proxied by the strength of labor unions. The impact of labor unions is felt largely through the importance of minimum wages, EPL, and active and passive interventions already discussed
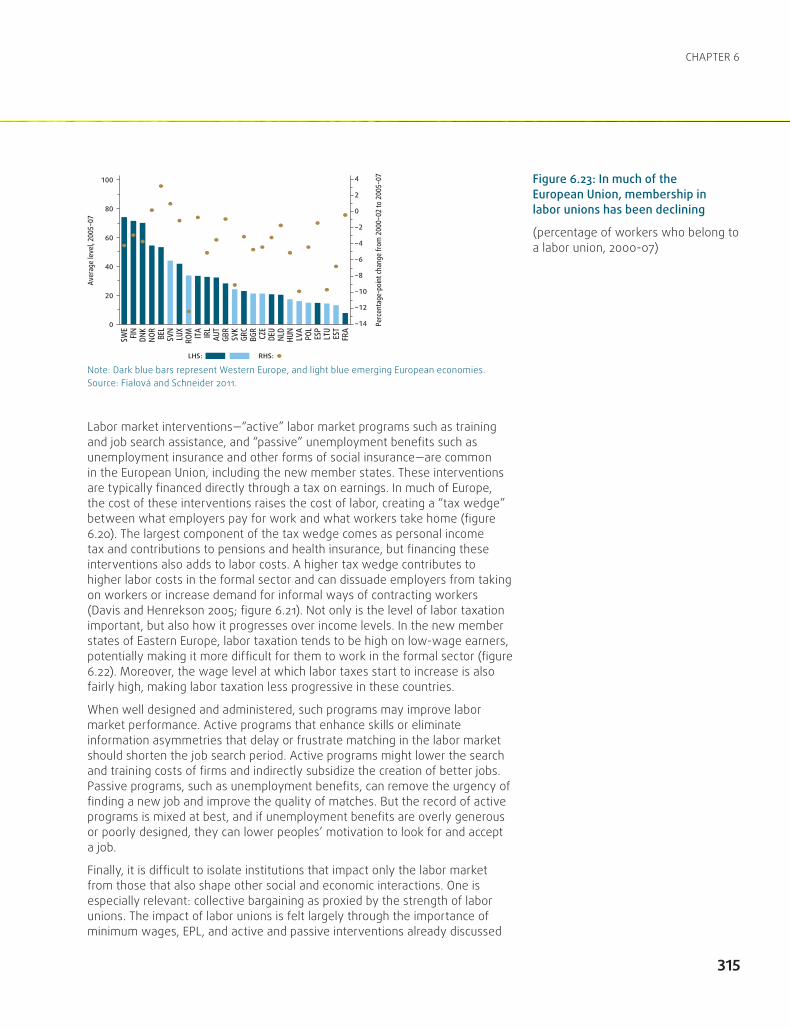
Figure 6.23: In much of the European Union, membership in labor unions has been declining
(percentage of workers who belong to a labor union, 2000-07)
note: Dark blue bars represent Western Europe, and light blue emerging European economies.Source: Fialová and Schneider 2011.

316
GoLDEn GRoWTH
(figure 6.23). But strong labor unions can shape the labor market beyond the direct impact of regulation and interventions. For example, even where the share of the total labor force that is unionized is small, it may be high in the public administration and the provision of essential services including education, health, and transportation. The labor code in some countries even augments collective bargaining and the power of unions: the salaries and benefits that unions succeed in negotiating for their members become binding for others in regulated employment, whether they are members or not.16
Work is being pushed out of (regulated) marketsTaxes and regulations can create incentives for people to consume more “own-provided” services at home and for workers and employers to transact “in the shadow” on the unregulated and untaxed market (Rosen 1997; Davis and Henrekson 2005). The likelihood that they will transact informally increases where a government’s capacity to enforce regulation is low. Conventional textbook models show how restrictions on firing, a relatively high minimum wage, and the taxes on labor that finance active and passive assistance programs can segment insiders who benefit from the labor code from outsiders who cannot. Less conventionally, in countries where governments fail to provide or sustain high-quality services, employers and workers can become disenchanted with complex labor regulation and consider taxes and compliance efforts not worthwhile. There is evidence that high taxes increase nonmarket or home production of services in northern Europe, and they push legal market activities into the informal market in the south (figure 6.24).
What helps, what hurtsBecause there is no simple mapping between labor market outcomes and social protection policies, a more rigorous analysis of the links between the two is needed, controlling for country characteristics. Country-level data from the oECD, the Institute for the Study of Labor, the International Labour organization, and the European Bank for Reconstruction and Development can be used to assess how the institutions, regulations, and interventions discussed above are associated with the performance of Europe’s labor markets relative to those
Figure 6.24: Informal self-employment is most prevalent in Greece, Italy, Portugal, and Spain
(unregulated, untaxed work, percentage of labor force)
Source: World Bank 2011a, based on Hazans 2011a.

317
CHAPTER 6
Figure 6.25: In Europe, active labor programs are associated with higher labor force participation
(percentage point change in the working-age population working or searching for a job: estimated impact of a unit change in statistically significant explanatory variables)
Figure 6.26: Rigid employment protection legislation is associated with lower employment rates
(percentage point change in employment rate: estimated impact of a unit change in statistically significant explanatory variables)
note: only coefficients significant at the 1 percent and 5 percent levels are shown in the figure. Full results and more information are available in annex 2.Source: Fialová 2011.
note: only coefficients significant at the 1 percent and 5 percent levels are shown in the figure. Full results and more information are available in annex 2.Source: Fialová 2011.
Figure 6.27: Rigid laws and high taxes are associated with higher unemployment, active labor programs with lower unemployment
(percentage point change in unemployment and long-term unemployment rates: estimated impact of a unit change in statistically significant explanatory variables)
Change in unemployment Change in long-term unemployment
note: only coefficients significant at the 1 percent and 5 percent levels are shown in the figure. Full results and more information are available in annex 6.2.Source: Fialová 2011.
318
GoLDEn GRoWTH
of other countries.17 This approach also complements the firm-level analysis provided in chapter 4, focusing on country-level legal and institutional variables, which are not captured in that analysis. The cross-country analysis also complements microeconomic evidence at the individual level when analyzing disincentives for formal work originating in the tax and benefit system, as discussed in the subsection on work disincentives.
Fialová (2011) examines the impact of policies on four indicators of labor market performance: the activity rate (AR); employment rate (ER); unemployment rate (UR); and long-term unemployment rate (LTUR). This is done for three sets of countries: the European Union and other oECD members,18 the European Union,19 and EU new member states, accession countries, and others in the European neighborhood (figures 6.25–6.27).20
With regard to employment protection, stricter EPL is mostly associated with lower participation rates—except in Western Europe—and higher unemployment rates. Similarly, higher labor taxation is negatively correlated with labor force participation—with the exception of the new member states—and positively correlated with unemployment rates, though the latter result is less robust. High labor taxation, associated with long-term unemployment, appears to be a major problem in Europe. overall, the strictness of EPL and high labor taxes lower the employment rate.
Box 6.3: Denmark’s “flexicurity”: increasing contestability, the gentler wayEvery year, about 20 percent of Danes lose their jobs. But they do not lose their incomes. Unemployment benefits replace close to two-thirds of their earnings, and the government helps them find work. Flexicurity, the combination of flexibility for employers and income security for workers, has been in place since at least the 1970s, but it has evolved over time as the active component has been strengthened. And it seems to work well. Between 1995 and 2008, Danish unemployment rates averaged 4.9 percent, while the rest of the EU15 suffered rates close to 8.5 percent. Denmark has been getting a lot of attention among policymakers.
Danish employment laws have evolved from the “Gent system,” when labor and trade unions, not the government, paid unemployment benefits. In the 1970s and 1980s, unemployment rates remained high, while those without jobs got good incomes. The arrangements became too expensive and were reformed in the 1990s. The new approach is sometimes called the “Golden Triangle,” because it added both generous unemployment benefits and active labor market programs to flexible hiring and firing laws.
• Thefirstcomponent,flexibilityoffiringandhiring, remained practically unchanged. The oECD employment protection legislation
index for Denmark fell from 2.4 in 1983 to 1.5 in 2009; the oECD average is 1.9. Relatively flexible laws work in Denmark because the country has a history of self-regulation by employers and unions, going back to the “September Compromise” of 1899, which set rules for resolving labor disputes.
• ThesecondpartoftheDanishmodelisunemployment insurance financed from contributions and taxes. Membership is voluntary, but it covers around 80 percent of the labor force. Benefits last up to four years, and replacement rates cannot exceed 90 percent of wages, capped currently at €2,173 a month. After four years of benefits, recipients have to switch to social assistance, which means a reduction of between 20 and 40 percent of their benefit income (Andersen and Svarer 2007).
• Thenewsystemusesactivelabormarketprograms like job search assistance and training to nudge the unemployed back to work. The spending on these programs is sizable: out of €13 billion spent on labor market programs in 2010, about 75 percent was on active instruments.
How well does flexicurity work? The unemployment rate dropped from 10 percent in 1993 to 3.3 percent in 2008. The incidence of long-term unemployment (being out of work
for more than a year) decreased from a third of total unemployment in 1994 to a tenth in 2009. Despite liberal firing and hiring practices, employment has not fluctuated too much in response to output variability. All this is good.
There are some qualifications. First, though official unemployment has fallen, there is a gap between actual unemployment (adding up the unemployed, those in “activation,” and early retirees) and official statistics. Second, it is difficult to assess how much of the fall in unemployment is due to flexicurity on its own. Economic performance matters too: active labor policies are useless if the economy is not producing jobs. Finally, the already high fiscal burden can become enormous in a protracted slowdown. The Danish model costs 4.5 percent of GDP in terms of active and passive labor market measures. And Denmark spent 2.6 percent of GDP for labor market programs in 2008 (a good year), compared with 1.4 percent for the oECD as a whole, 1.5 for Sweden, 2.2 for Finland, and 2.3 in the netherlands. The Danes have flexicurity because of their history and can afford it in part due to high participation rates of 81 percent; the oECD average in 2009 was 71 percent. Those wishing to learn from the Danes should note this.
Source: Andersen and Svarer 2007; Bredgaard and Larsen 2007; Hansen 2010; oECD 2010.

319
CHAPTER 6
Minimum wages are also negatively correlated with participation rates. This appears counterintuitive: the prospect of a higher wage should entice people into the market, not keep them out. But workers priced out of jobs as a result of minimum wages might be discouraged from further participating in the labor market—especially younger people and women. The minimum wage is also associated with higher unemployment rates—especially long-term unemployment rates—and lower employment rates.
Unionization is positively associated with participation in the labor market and employment rates, and seems to reduce long-term unemployment (in the European Union). Spending on active labor market programs is associated with higher rates of participation, lower unemployment rates, and higher employment rates. The relationship between the generosity of passive labor market programs and labor market outcomes appears more complex: while generosity tends to increase participation in Europe, it appears to have the opposite effect in non-European oECD countries. The generosity of unemployment benefits is also associated with lower unemployment and higher employment in Europe.21
Box 6.4: Germany’s Hartz reforms: modernizing social welfare and unemployment benefitsGermany experienced high unemployment rates of almost 10 percent between 1993 and 2004. By contrast, U.S. unemployment was about 5 percent. By 2004, almost 4.5 million Germans were unemployed according to the Federal Labor Agency. Less-skilled and older workers had higher unemployment rates; vocational school graduates and high school dropouts had unemployment rates of about 18 percent.
In February 2002, a commission suggested ways to modernize the labor market. Volkswagen’s personnel director Peter Hartz headed the commission, which comprised business executives, trade unionists, politicians, and scientists. no economists were invited to join.
The commission proposed a three-part reform strategy: improve employment services and active labor market programs, reform unemployment and social assistance benefit programs, and foster employment by deregulating the labor market.
The reforms were implemented between 2003 and 2005. They modernized public employment services and social welfare centers, modified existing active labor programs, and introduced new active labor programs. The reforms changed the institutional and legal framework for the rights and responsibilities of the unemployed and the beneficiaries of social assistance. Employment protection was reduced for parts of the labor market.
• Publicemploymentservicesandsocialwelfare centers adopted results-based accountability and outsourced services through competition between public and private providers. Employment offices were (partly) merged with social welfare units and converted into centers that provided job search assistance, social services, and benefit payments.
• Unemploymentandsocialbenefitlevelsand duration were reduced. Eligibility for subsistence allowances was changed according to a person’s ability to work rather than previous history of contributions. Benefits were cut if recipients did not meet their responsibilities.
• Wagesubsidiesandstart-upgrantswereprovided to entrepreneurs. Jobs with reduced social security contributions were introduced (“midi-jobs”), and the regulations for jobs exempt from such contributions were reformed (“mini-jobs”). The objective was to lower the cost of hiring low-skilled workers.
Between January and october 2006, the number of claimants in jobs requiring social insurance contributions rose 47 percent. The number of claimants working part-time grew 30 percent, and the number in marginal employment (“mini-jobs”) rose 14 percent. Workers who had survived on low wages without income support could now supplement their incomes with Hartz IV benefits. The reform of temporary work regulations increased employment in fixed-term jobs after
the reform. But evaluations have found limited impact on mini-jobs.
The Hartz reforms helped reduce unemployment. Despite the crisis, Germany’s unemployment rate today is about 7.5 percent, lower than the U.S. rate of more than 8.5 percent. Many of the newly introduced part-time and temporary jobs have served as a bridge to regular jobs. But the reforms might also have reduced the income of low-wage earners, which has declined 16–22 percent over the last decade. net real monthly income of workers in mini-jobs declined from €270 in 2000 to €211 in 2010, while income of workers in midi-jobs declined from €835 to €705. This is mainly due to an increase in the number of people in temporary work and part-time jobs.
The reforms raise several questions. First, given the difficulty of comprehensive labor reforms, does a partial liberalization targeted at some groups or sectors work? Second, do allowances in the labor code for more flexible forms of employment lead to a “two-tier” market and a legally sanctioned underclass of workers? Third, do flexible and temporary forms of employment serve as a step toward advancement, or are people who enter through a midi- or mini-job experience scarred in ways that limit their future options? Germany’s experience appears to be promising, but these doubts will be raised in countries that try to adopt strategies similar to the one proposed by the Hartz Commission.
Source: Zimmermann 2007; Goethe Institut (2007); Goebel and Grabka (2011).
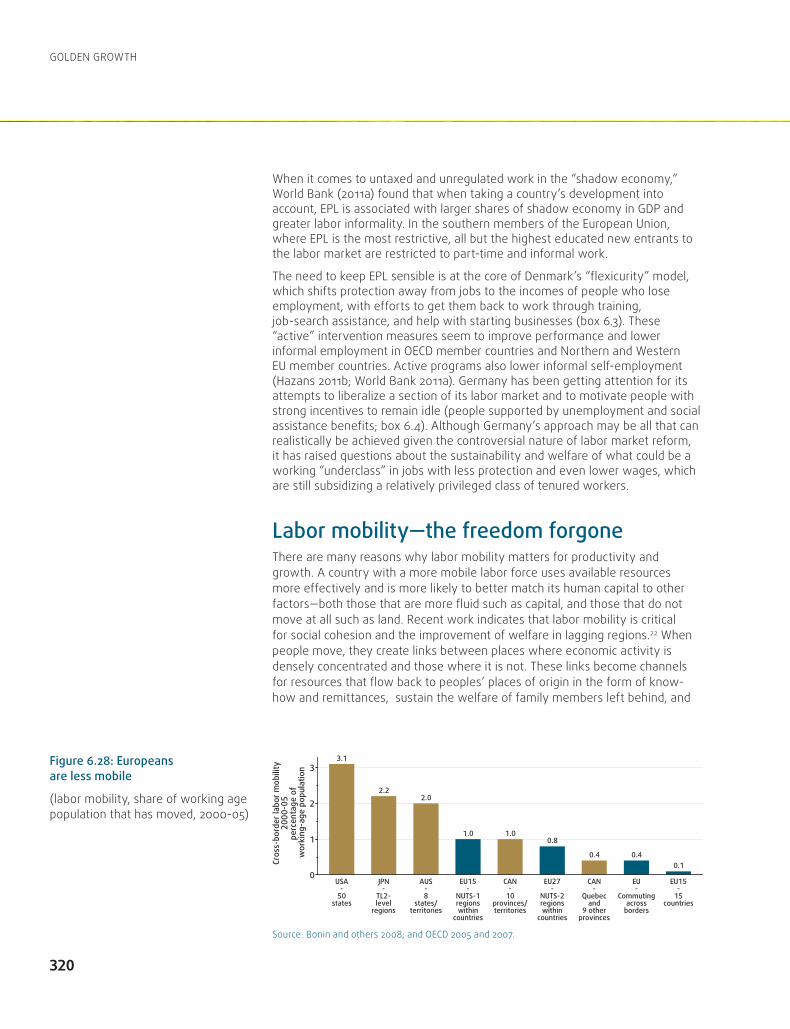
320
GoLDEn GRoWTH
When it comes to untaxed and unregulated work in the “shadow economy,” World Bank (2011a) found that when taking a country’s development into account, EPL is associated with larger shares of shadow economy in GDP and greater labor informality. In the southern members of the European Union, where EPL is the most restrictive, all but the highest educated new entrants to the labor market are restricted to part-time and informal work.
The need to keep EPL sensible is at the core of Denmark’s “flexicurity” model, which shifts protection away from jobs to the incomes of people who lose employment, with efforts to get them back to work through training, job-search assistance, and help with starting businesses (box 6.3). These “active” intervention measures seem to improve performance and lower informal employment in oECD member countries and northern and Western EU member countries. Active programs also lower informal self-employment (Hazans 2011b; World Bank 2011a). Germany has been getting attention for its attempts to liberalize a section of its labor market and to motivate people with strong incentives to remain idle (people supported by unemployment and social assistance benefits; box 6.4). Although Germany’s approach may be all that can realistically be achieved given the controversial nature of labor market reform, it has raised questions about the sustainability and welfare of what could be a working “underclass” in jobs with less protection and even lower wages, which are still subsidizing a relatively privileged class of tenured workers.
Labor mobility—the freedom forgoneThere are many reasons why labor mobility matters for productivity and growth. A country with a more mobile labor force uses available resources more effectively and is more likely to better match its human capital to other factors—both those that are more fluid such as capital, and those that do not move at all such as land. Recent work indicates that labor mobility is critical for social cohesion and the improvement of welfare in lagging regions.22 When people move, they create links between places where economic activity is densely concentrated and those where it is not. These links become channels for resources that flow back to peoples’ places of origin in the form of know-how and remittances, sustain the welfare of family members left behind, and
Figure 6.28: Europeans are less mobile
(labor mobility, share of working age population that has moved, 2000-05)
Source: Bonin and others 2008; and oECD 2005 and 2007.
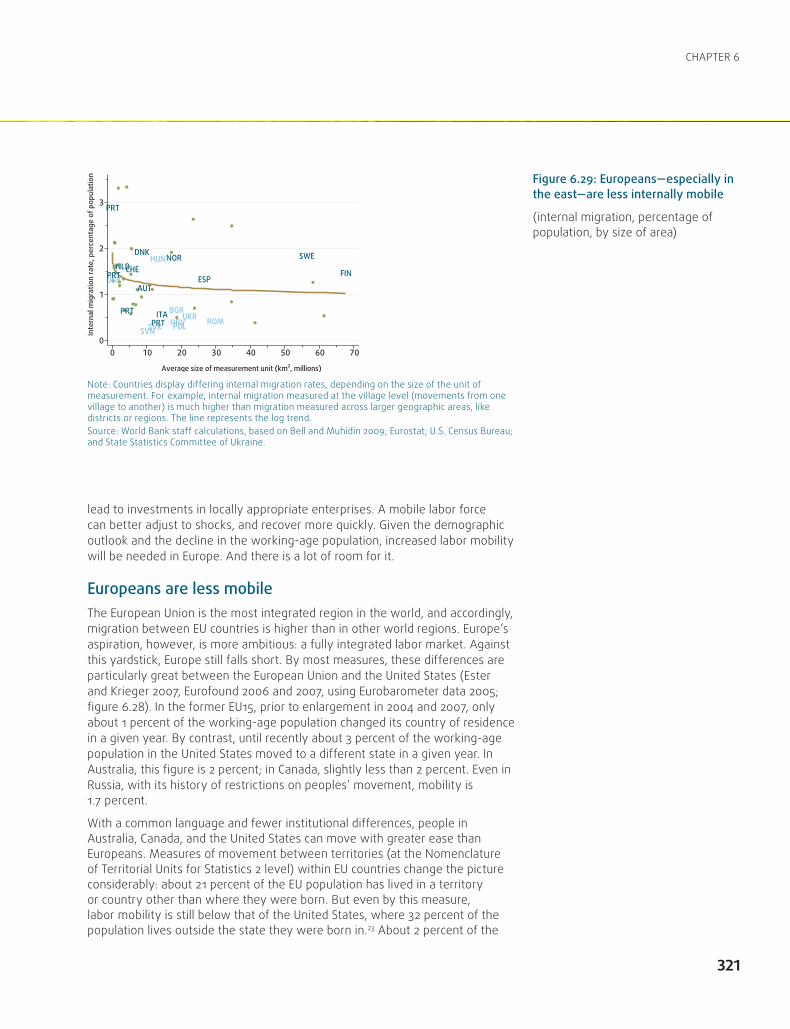
321
CHAPTER 6
lead to investments in locally appropriate enterprises. A mobile labor force can better adjust to shocks, and recover more quickly. Given the demographic outlook and the decline in the working-age population, increased labor mobility will be needed in Europe. And there is a lot of room for it.
Europeans are less mobileThe European Union is the most integrated region in the world, and accordingly, migration between EU countries is higher than in other world regions. Europe’s aspiration, however, is more ambitious: a fully integrated labor market. Against this yardstick, Europe still falls short. By most measures, these differences are particularly great between the European Union and the United States (Ester and Krieger 2007, Eurofound 2006 and 2007, using Eurobarometer data 2005; figure 6.28). In the former EU15, prior to enlargement in 2004 and 2007, only about 1 percent of the working-age population changed its country of residence in a given year. By contrast, until recently about 3 percent of the working-age population in the United States moved to a different state in a given year. In Australia, this figure is 2 percent; in Canada, slightly less than 2 percent. Even in Russia, with its history of restrictions on peoples’ movement, mobility is 1.7 percent.
With a common language and fewer institutional differences, people in Australia, Canada, and the United States can move with greater ease than Europeans. Measures of movement between territories (at the nomenclature of Territorial Units for Statistics 2 level) within EU countries change the picture considerably: about 21 percent of the EU population has lived in a territory or country other than where they were born. But even by this measure, labor mobility is still below that of the United States, where 32 percent of the population lives outside the state they were born in.23 About 2 percent of the
Figure 6.29: Europeans—especially in the east—are less internally mobile
(internal migration, percentage of population, by size of area)
note: Countries display differing internal migration rates, depending on the size of the unit of measurement. For example, internal migration measured at the village level (movements from one village to another) is much higher than migration measured across larger geographic areas, like districts or regions. The line represents the log trend.Source: World Bank staff calculations, based on Bell and Muhidin 2009; Eurostat; U.S. Census Bureau; and State Statistics Committee of Ukraine.

322
GoLDEn GRoWTH
EU labor force was born in a member state different from their current state of residence; approximately 4 percent of the EU population have lived in another EU country at some point in their life; and 3 percent have lived in a country outside the European Union (Eurofound 2006).
Internal mobility is difficult to compare across countries because its measurement depends on the size of the measurement unit. If the measurement unit is small—for example, the municipality—the corresponding internal migration rate will be high, because many more people move across municipalities than between provinces. Plotting the average size of the unit of measurement (like region or district) against the corresponding internal migration rate controls for the size of administrative units (figure 6.29). Applying a log trend, the exercise reveals that many European countries, especially the transition economies, have low labor mobility.
Table 6.2: Internationally, the Irish are the most mobile Europeans
(percentage of population, by type of mobility)
Local move Move in country Move inside the European UnionIreland 44.5 18.8 14.5Luxembourg 53.8 19.4 13.2Cyprus 47.8 17.2 8.1Denmark 62.6 36.2 7.5Sweden 65.9 41.8 7.1United Kingdoma 52.3 23.7 6.6Finland 64.5 34.7 5.1Germany 59.4 18.1 4.9Belgium 59.6 13.0 4.5Spain 46.6 9.9 4.5Greece 34.7 16.4 4.4Netherlands 55.0 21.6 4.4Portugal 41.7 8.6 4.2Austria 54.1 9.4 3.4Malta 27.6 6.2 2.7France 58.2 28.8 2.6Latvia 44.2 22.5 2.0Czech Republic 41.9 8.2 1.6Italy 43.8 7.9 1.6Slovenia 38.2 9.6 1.6Slovak Republic 34.2 5.8 1.4Estonia 50.5 23.4 1.1Poland 40.6 7.1 1.0Hungary 47.5 9.9 0.7Latvia 57.4 7.4 0.7
a. Includes northern Ireland.note: The table shows weighted averages. Multiple answers allowed.Source: Bonin and others 2008.

323
CHAPTER 6
But lower labor mobility within a single market could reflect the smaller size of countries and shorter distances between centers of economic activity. Why move when you can commute? In a 2008 report on labor mobility in Europe, the Institute for the Study of Labor adopted a broad definition of geographic mobility that included not only changes of residency within countries and across borders but also cross-border and regional commuting (Bonin and others 2008, using the European Labor Force Survey). The report showed that ,even by the broader definition, between 2000 and 2005, workers’ mobility within the European Union was barely 1 percent each year and that the movement of people in Europe was still lower than mobility across Australian (2 percent) and U.S. (3 percent) states.
The Institute for the Study of Labor report also showed that in the EU15, the share of the active working-age, foreign-born population from an EU27 country increased during the previous decade. Spain had the largest increase, followed by Greece, Denmark, Portugal, Sweden, Ireland, the United Kingdom, and Austria. Among the newer member states, those with the highest initial share of foreign-born people (Latvia and Estonia) showed a decline over time. In most EU15 countries, foreign nationals from another EU15 country comprise only a small share of foreign nationals. An exception can be found in the United Kingdom: the largest nonnative resident minority group in London is from France.
These statistics present a paradox. The movement of people within the European Union is one of the Four Freedoms, and probably the one that comes most immediately to the average European’s mind when asked why the European Union is important. The Eurobarometer survey in 2005 showed that European citizens view geographical mobility positively (table 6.2). Yet, a large majority (almost 70 percent) had no intention of moving in the near future.
This may be changing. The same survey showed that mobile Europeans are younger and have higher levels of education than those who have no intention of moving. In these respects, they are similar to mobile people in many countries, both wealthy and poor (Mansoor and Quillin 2006). Students in Europe are among the most mobile, enthusiastically taking advantage of such cross-border education programs as Erasmus. For many, these programs lead to longer-term resettlement
Figure 6.30: Low labor mobility can keep unemployment high
Source: Hassler and others 2005.
(labor mobility and unemployment rates in the nine largest oECD countries, 1980–95)
(labor mobility and unemployment rates in EU member states, 1995–2006)
Source: World Bank staff calculations, based on Bonin and others 2008; and Eurostat.

324
GoLDEn GRoWTH
for employment. Recent statistics show an increase in mobility. In 2008, about 2.3 percent of EU citizens (11.3 million people) resided in a member state other than their citizen state, according to the European Commission.24 That number has grown more than 40 percent since 2001.
A lack of movement is often blamed for high unemployment rates in areas that lag and for labor shortages that drive up wages in places that lead. This negative correlation between mobility and unemployment is apparent in data from selected oECD countries for 1980 to 1995 (Hassler and others 2005; figure 6.30). Labor markets can respond differently to shocks, often resulting in differences in the impact on jobs across areas. Adjustment to regional shocks in Europe has been achieved more through unemployment rates and changes in labor force participation (people stop looking for work if a region goes into economic decay) and less through mobility of labor.25 By contrast, in the United States, labor mobility leads to greater agility in responding to differences in wages and job opportunities across states, reducing disparities in unemployment rates and real wages.
Table 6.3: Not a single market for new members
(EU15 restrictions on workers from newer member states)
Entry of EU8 workers Entry of workers from Bulgaria and Romaniaa
May 2004 to April 2006 May 2006 to April 2009 2007–08
Austria Restricted Restricted Restricted
Belgium Restricted Restricted Restricted
Denmark Restricted Restricted Restricted
Finland Restricted Open Open
France Restricted Restrictedb Restrictedb
Germany Restricted Restricted Restricted
Greece Restricted Open Restricted
Ireland Open Open Restricted
Italy Restricted Openc Restrictedd
Luxembourg Restricted Restricted Restricted
Netherlands Restricted Opene Restricted
Portugal Restricted Open Restricted
Spain Restricted Open Restricted
Sweden Open Open Open
United Kingdom Open Open Restricted
a. Bulgarian and Romanian workers also face restrictions in Hungary and Malta.b. Except for health care, transport, construction, hotels, and catering.c. Since July 2006.d. Procedures for obtaining work permits are simplified in certain sectors.e. Since May 2007. Between May 2006 and April 2007, the Dutch labor market was open to EU8 workers in a large number of sectors.Source: oECD 2007.

325
CHAPTER 6
But does a mobile labor force really make much of a difference for a country’s economic prospects? Policymakers are aware of statistics showing the relative immobility of Europeans and eager to know what they can do about it. The phased withdrawal of restrictions on the movement of people from the newest member states of the European Union will bring a gradual disappearance of an obvious obstacle. Yet people from the newer member states still face explicit barriers to mobility within the European Union (table 6.3).26 Lessons from how different EU15 members have managed this aspect of enlargement are still being absorbed, but evidence from movements since 2004 and in reaction to the crisis indicate that the member states that embraced newcomers from the newest member countries have benefited.
Looking beyond adjustment to shocks and recovery from the recession, a growing literature provides evidence that internal labor mobility tends to have positive effects on countries’ productivity and growth. For example, without mobile labor, the growth rate of the United States would likely have been only half of what it actually has been (Rutkowski 2010). In Canada, the movement of people across provinces contributed to economic growth (Sharpe, Arsenault, and Ershov 2007). Due to the high volume of movement from low-productivity eastern provinces to high-productivity western provinces, Canada benefited from a huge boost to economic growth in 2006. net output gains arising from interprovincial movement are estimated to be 0.074 percent of GDP in constant 1997 prices and 0.137 percent of GDP in current prices. Interprovincial movement accounted for 1.56 percent of trend labor productivity growth in Canada over 1987–2006 and 6.23 percent of actual labor productivity growth in 2006 (Sharpe, Arsenault, and Ershov 2007).
Further, countries with higher labor mobility have better-performing labor markets and higher rates of employment. For instance, the three European countries that have reached the Lisbon employment targets—the netherlands, Sweden, and the United Kingdom—all have labor mobility rates in the top quartile (figure 6.31). Conversely, countries with the highest dispersion in employment rates across their territories (Italy, Spain, Hungary, and the Slovak Republic) have mobility rates below the European average.27
Figure 6.31: Greater labor mobility is associated with higher rates of employment in Europe
(correlation between labor mobility rate [average 1996–2006, horizontal axis] and employment rate [average 1996–2006, vertical axis], selected European countries: coefficient 0.677)
note: Labor mobility is the share of the population that moved from one region (nomenclature of Units for Territorial Statistics level 2) to another within a given year.Source: World Bank staff calculations, based on Bonin and others 2008; and Eurostat.
70
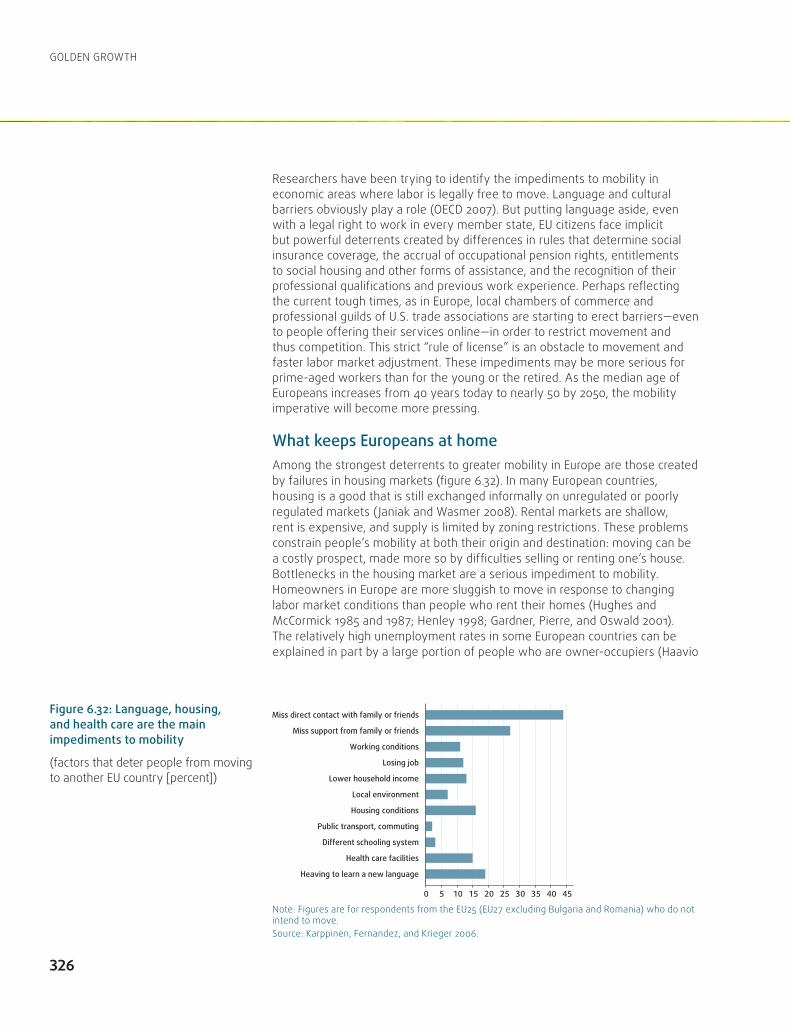
326
GoLDEn GRoWTH
Researchers have been trying to identify the impediments to mobility in economic areas where labor is legally free to move. Language and cultural barriers obviously play a role (oECD 2007). But putting language aside, even with a legal right to work in every member state, EU citizens face implicit but powerful deterrents created by differences in rules that determine social insurance coverage, the accrual of occupational pension rights, entitlements to social housing and other forms of assistance, and the recognition of their professional qualifications and previous work experience. Perhaps reflecting the current tough times, as in Europe, local chambers of commerce and professional guilds of U.S. trade associations are starting to erect barriers—even to people offering their services online—in order to restrict movement and thus competition. This strict “rule of license” is an obstacle to movement and faster labor market adjustment. These impediments may be more serious for prime-aged workers than for the young or the retired. As the median age of Europeans increases from 40 years today to nearly 50 by 2050, the mobility imperative will become more pressing.
What keeps Europeans at homeAmong the strongest deterrents to greater mobility in Europe are those created by failures in housing markets (figure 6.32). In many European countries, housing is a good that is still exchanged informally on unregulated or poorly regulated markets (Janiak and Wasmer 2008). Rental markets are shallow, rent is expensive, and supply is limited by zoning restrictions. These problems constrain people’s mobility at both their origin and destination: moving can be a costly prospect, made more so by difficulties selling or renting one’s house. Bottlenecks in the housing market are a serious impediment to mobility. Homeowners in Europe are more sluggish to move in response to changing labor market conditions than people who rent their homes (Hughes and McCormick 1985 and 1987; Henley 1998; Gardner, Pierre, and oswald 2001). The relatively high unemployment rates in some European countries can be explained in part by a large portion of people who are owner-occupiers (Haavio
Figure 6.32: Language, housing, and health care are the main impediments to mobility
(factors that deter people from moving to another EU country [percent])
note: Figures are for respondents from the EU25 (EU27 excluding Bulgaria and Romania) who do not intend to move.Source: Karppinen, Fernandez, and Krieger 2006.
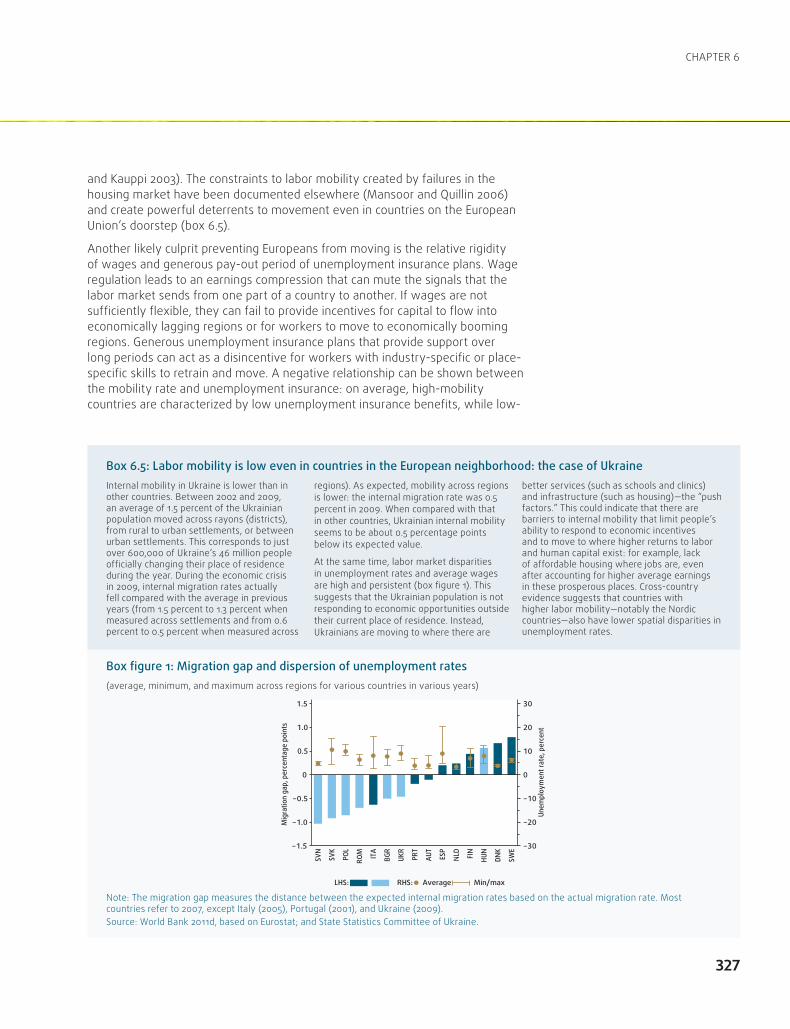
327
CHAPTER 6
Box 6.5: Labor mobility is low even in countries in the European neighborhood: the case of UkraineInternal mobility in Ukraine is lower than in other countries. Between 2002 and 2009, an average of 1.5 percent of the Ukrainian population moved across rayons (districts), from rural to urban settlements, or between urban settlements. This corresponds to just over 600,000 of Ukraine’s 46 million people officially changing their place of residence during the year. During the economic crisis in 2009, internal migration rates actually fell compared with the average in previous years (from 1.5 percent to 1.3 percent when measured across settlements and from 0.6 percent to 0.5 percent when measured across
regions). As expected, mobility across regions is lower: the internal migration rate was 0.5 percent in 2009. When compared with that in other countries, Ukrainian internal mobility seems to be about 0.5 percentage points below its expected value.
At the same time, labor market disparities in unemployment rates and average wages are high and persistent (box figure 1). This suggests that the Ukrainian population is not responding to economic opportunities outside their current place of residence. Instead, Ukrainians are moving to where there are
better services (such as schools and clinics) and infrastructure (such as housing)—the “push factors.” This could indicate that there are barriers to internal mobility that limit people’s ability to respond to economic incentives and to move to where higher returns to labor and human capital exist: for example, lack of affordable housing where jobs are, even after accounting for higher average earnings in these prosperous places. Cross-country evidence suggests that countries with higher labor mobility—notably the nordic countries—also have lower spatial disparities in unemployment rates.
Box figure 1: Migration gap and dispersion of unemployment rates(average, minimum, and maximum across regions for various countries in various years)
note: The migration gap measures the distance between the expected internal migration rates based on the actual migration rate. Most countries refer to 2007, except Italy (2005), Portugal (2001), and Ukraine (2009).Source: World Bank 2011d, based on Eurostat; and State Statistics Committee of Ukraine.
and Kauppi 2003). The constraints to labor mobility created by failures in the housing market have been documented elsewhere (Mansoor and Quillin 2006) and create powerful deterrents to movement even in countries on the European Union’s doorstep (box 6.5).
Another likely culprit preventing Europeans from moving is the relative rigidity of wages and generous pay-out period of unemployment insurance plans. Wage regulation leads to an earnings compression that can mute the signals that the labor market sends from one part of a country to another. If wages are not sufficiently flexible, they can fail to provide incentives for capital to flow into economically lagging regions or for workers to move to economically booming regions. Generous unemployment insurance plans that provide support over long periods can act as a disincentive for workers with industry-specific or place-specific skills to retrain and move. A negative relationship can be shown between the mobility rate and unemployment insurance: on average, high-mobility countries are characterized by low unemployment insurance benefits, while low-
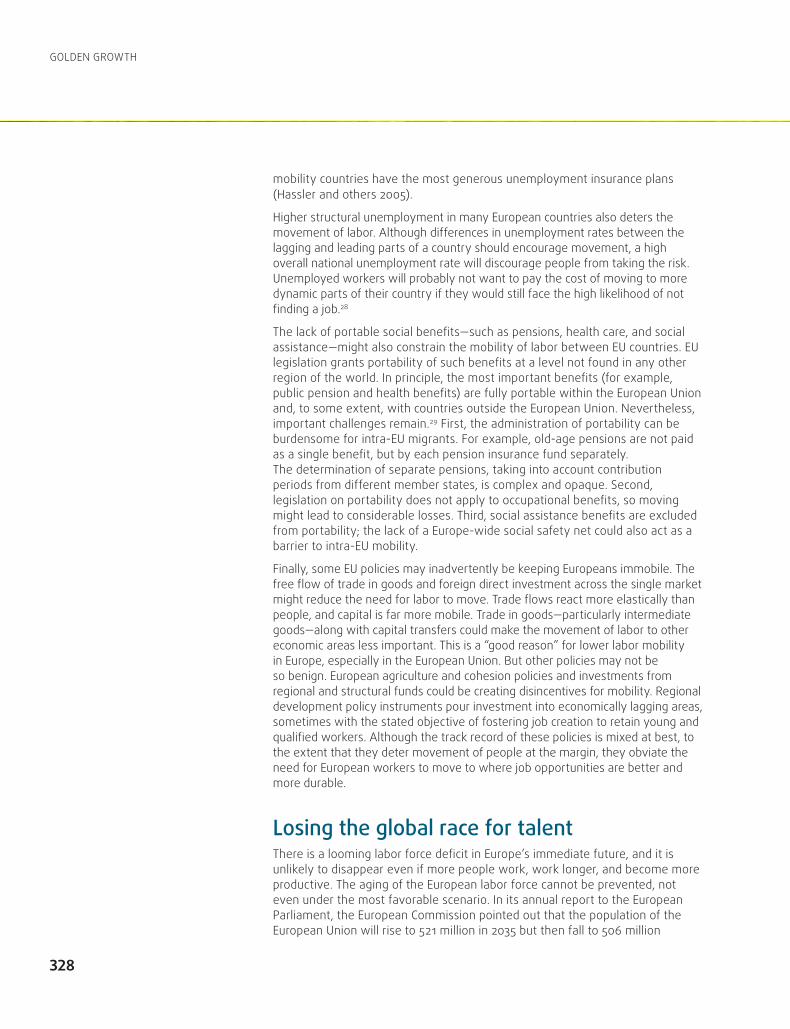
328
GoLDEn GRoWTH
mobility countries have the most generous unemployment insurance plans (Hassler and others 2005).
Higher structural unemployment in many European countries also deters the movement of labor. Although differences in unemployment rates between the lagging and leading parts of a country should encourage movement, a high overall national unemployment rate will discourage people from taking the risk. Unemployed workers will probably not want to pay the cost of moving to more dynamic parts of their country if they would still face the high likelihood of not finding a job.28
The lack of portable social benefits—such as pensions, health care, and social assistance—might also constrain the mobility of labor between EU countries. EU legislation grants portability of such benefits at a level not found in any other region of the world. In principle, the most important benefits (for example, public pension and health benefits) are fully portable within the European Union and, to some extent, with countries outside the European Union. nevertheless, important challenges remain.29 First, the administration of portability can be burdensome for intra-EU migrants. For example, old-age pensions are not paid as a single benefit, but by each pension insurance fund separately. The determination of separate pensions, taking into account contribution periods from different member states, is complex and opaque. Second, legislation on portability does not apply to occupational benefits, so moving might lead to considerable losses. Third, social assistance benefits are excluded from portability; the lack of a Europe-wide social safety net could also act as a barrier to intra-EU mobility.
Finally, some EU policies may inadvertently be keeping Europeans immobile. The free flow of trade in goods and foreign direct investment across the single market might reduce the need for labor to move. Trade flows react more elastically than people, and capital is far more mobile. Trade in goods—particularly intermediate goods—along with capital transfers could make the movement of labor to other economic areas less important. This is a “good reason” for lower labor mobility in Europe, especially in the European Union. But other policies may not be so benign. European agriculture and cohesion policies and investments from regional and structural funds could be creating disincentives for mobility. Regional development policy instruments pour investment into economically lagging areas, sometimes with the stated objective of fostering job creation to retain young and qualified workers. Although the track record of these policies is mixed at best, to the extent that they deter movement of people at the margin, they obviate the need for European workers to move to where job opportunities are better and more durable.
Losing the global race for talentThere is a looming labor force deficit in Europe’s immediate future, and it is unlikely to disappear even if more people work, work longer, and become more productive. The aging of the European labor force cannot be prevented, not even under the most favorable scenario. In its annual report to the European Parliament, the European Commission pointed out that the population of the European Union will rise to 521 million in 2035 but then fall to 506 million
329
CHAPTER 6
by 2060. In 2010, there were 3.5 people of working age (20–64 years) for every person age 65 or older. In 2060, there will be half as many (European Commission 2011).
Europe will need immigrantsThe European Commission’s report shows that immigration from outside the single market and even from far beyond the European neighborhood countries will be the main driver of population change in the European Union. In 2009, net immigration to the European Union was 857,000 people, contributing to 63 percent of total population growth. At the start of 2003, the number of third-country nationals in the EU25 was 16.2 million, or 3.6 percent of the population. But by 2010, 20.2 million non-EU27 citizens were living in the European Union (4 percent of the total population). The European Commission noted that foreign citizens living in the EU27 were significantly younger (median age of 34.4 years) than the population of EU27 nationals (median age of 41.5 years). For this reason, immigrants are likely to help close the demographic deficit and meet the quickly rising costs of population aging.
People have been crossing seas, mountains, rivers, and political borders into, out of, and throughout Europe for centuries. During the first great period of globalization in the late nineteenth century, right up to the interwar period, Europe sent large waves of people to the Americas, Africa, and the Antipodes. Postwar immigration to Europe on a mass scale is a recent phenomenon, with roots in the guest-worker programs that became common in the late 1950s and early 1960s to help sustain the fast pace of Europe’s Golden Age (Maselnik 2010).
Between 1950 and 1990, the resident foreign-born population in the EU15 grew more than fourfold, from 3.8 million (1.7 percent of the population) to 16 million (4.5 percent). Between 2005 and 2009, the resident foreign-born population increased on average by 1.6 to 2 million immigrants each year, and accounted for approximately 80 percent of the overall population growth. During this period, only 20 percent of the population increase in the EU27 could be attributed to natural growth (live births minus deaths). Ironically, the countries that lead the statistics of recorded live births are all also the largest immigrant destinations in the EU27: France, the netherlands, Spain, and the United Kingdom.
Figure 6.33: European countries host fewer immigrants than other OECD countries
(percentage of the population that is foreign-born, various oECD member countries)
Source: oECD 2008.
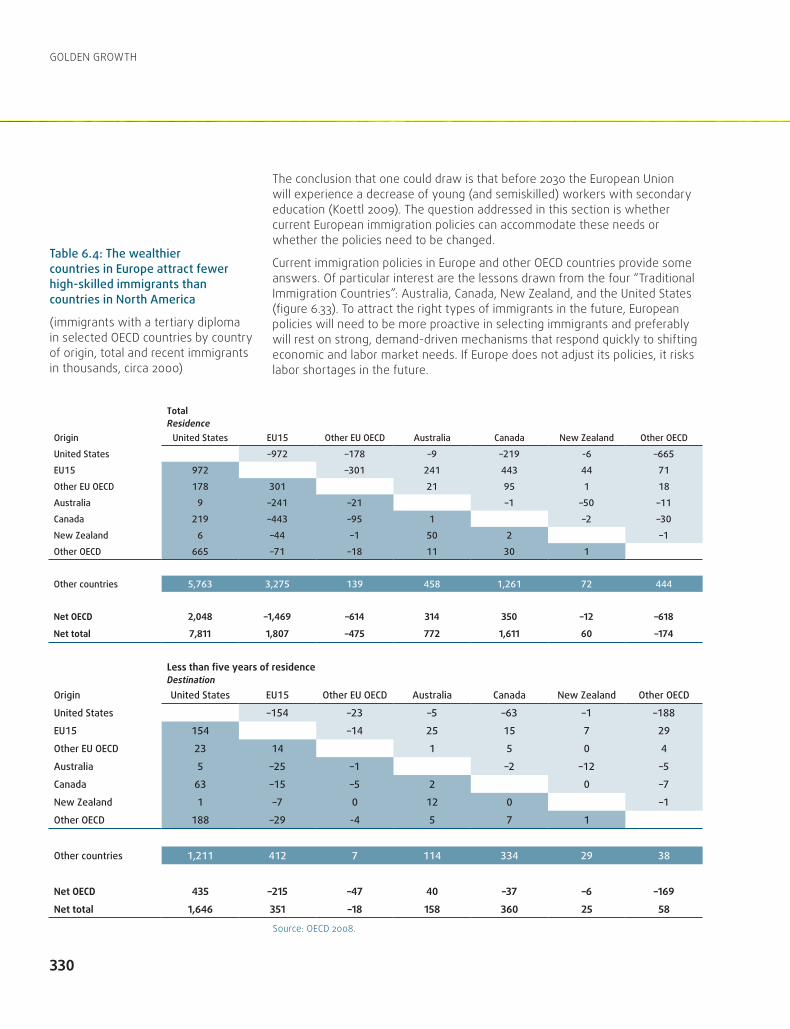
330
GoLDEn GRoWTH
The conclusion that one could draw is that before 2030 the European Union will experience a decrease of young (and semiskilled) workers with secondary education (Koettl 2009). The question addressed in this section is whether current European immigration policies can accommodate these needs or whether the policies need to be changed.
Current immigration policies in Europe and other oECD countries provide some answers. of particular interest are the lessons drawn from the four “Traditional Immigration Countries”: Australia, Canada, new Zealand, and the United States (figure 6.33). To attract the right types of immigrants in the future, European policies will need to be more proactive in selecting immigrants and preferably will rest on strong, demand-driven mechanisms that respond quickly to shifting economic and labor market needs. If Europe does not adjust its policies, it risks labor shortages in the future.
TotalResidence
Origin United States EU15 Other EU OECD Australia Canada New Zealand Other OECD
United States –972 –178 –9 –219 -6 –665
EU15 972 –301 241 443 44 71
Other EU OECD 178 301 21 95 1 18
Australia 9 –241 –21 –1 –50 –11
Canada 219 –443 –95 1 –2 –30
New Zealand 6 –44 –1 50 2 –1
Other OECD 665 –71 –18 11 30 1
Other countries 5,763 3,275 139 458 1,261 72 444
Net OECD 2,048 –1,469 –614 314 350 –12 –618
Net total 7,811 1,807 –475 772 1,611 60 –174
Less than five years of residenceDestination
Origin United States EU15 Other EU OECD Australia Canada New Zealand Other OECD
United States –154 –23 –5 –63 –1 –188
EU15 154 –14 25 15 7 29
Other EU OECD 23 14 1 5 0 4
Australia 5 –25 –1 –2 –12 –5
Canada 63 –15 –5 2 0 –7
New Zealand 1 –7 0 12 0 –1
Other OECD 188 –29 -4 5 7 1
Other countries 1,211 412 7 114 334 29 38
Net OECD 435 –215 –47 40 –37 –6 –169Net total 1,646 351 –18 158 360 25 58
Source: oECD 2008.
Table 6.4: The wealthier countries in Europe attract fewer high-skilled immigrants than countries in North America
(immigrants with a tertiary diploma in selected oECD countries by country of origin, total and recent immigrants in thousands, circa 2000)

331
CHAPTER 6
Europe’s immigrants are mostly unskilledRelative to other popular oECD destination countries, EU countries mainly attract low-skilled immigrants—those with at most primary education—in stark contrast to the Traditional Immigration Countries, which attract much lower shares of primary-educated migrants and far higher shares of tertiary-educated migrants. Migration outcomes occur on many dimensions, just as migration policies take effect through a wide range of institutions. It can thus be helpful to distinguish immigrants by their motivation to migrate, their legal status, their duration of stay, and their education and skills. With regard to government policies, the framework of ananlysis will distinguish between policies with a direct effect on the size and composition of migrant flows and stocks, like immigration rules, and policies with indirect effects, like social policies, labor market policies, and integration policies.
The limited data currently available on the educational attainment of immigrant populations suggest that the 49 percent of the EU25+ immigrant population originating from outside the EU25+ are primary-educated, while only 25 percent have secondary education, and 21 percent have tertiary education (table 6.4).
Box 6.6: Beyond the white cliffs: immigration to the United KingdomThe United Kingdom is a major destination for immigrants in Europe, especially the highly educated. Among European countries, the United Kingdom enjoyed the third-highest inflow of permanent immigrants, amounting to 347,000 people in 2008—the foreign-born accounted for 10.8 percent of the British population—and attracted the second-highest number of permanent highly skilled immigrants seeking employment (box figure 1). The United Kingdom was one of the few countries that did not impose any restrictions on labor from the newest member states of the European Union and is one of the hotspots for international students, hosting on average 132,700 international students between 2003 and 2008.
The strength of the United Kingdom’s policy
orientation toward immigration is that it favors people who want to come to work. The employment rate among immigrants was 80 percent, 5 percentage points above the oECD average. According to estimates by the British Treasury, immigrants grew the working-age population by 0.5 percent a year between 2001 and 2006 and GDP by around £6 billion in 2006.
Due to a large volume of immigrants since 2004, and to mitigate a possible threat to social cohesion, the United Kingdom introduced a points-based system, focusing more on the quality of immigrants than the quantity. The new system consists of five tiers, tier 1 for highly skilled migrants, tier 2 for skilled workers required in certain sectors, tier 3 for low-skilled workers, tier 4 for
students, and tier 5 for tourists, athletes, and musicians. A special cap of 21,700 for 2011–12 non-EU work visas was introduced, limiting the number of economic immigrants per year. However, immigrants who are earning more than £150,000 were excluded from the cap.
There have also been problems related to integration of immigrants. According to Huddleston and niessen (2011), British immigration policies are less favorable toward integration, to some extent due to the fact that immigrants are excluded from some social benefits. But the strong points of the British immigration policy are: education, with a well-tailored living-in-diversity training, and anti-discrimination regulation. The weakest element is the difficulty in obtaining permanent residence and nationality.
Box figure 1: Immigrants in OECD countries and share of foreign-born with tertiary education, 2008
Source: oECD 2008; and oECD International Migration Database.

332
GoLDEn GRoWTH
By contrast, the Traditional Immigration Countries have much higher shares of tertiary-educated migrants. About 40 percent of immigrants to Australia, new Zealand, and the United States have a tertiary education. Accordingly, their shares of primary-educated migrants are fairly low (16–30 percent). The range for secondary-educated migrants is wider, from 12 percent in Canada to 35 percent in the United States.
Looking only at immigrants originating from the Middle East and north Africa, the outcomes for Europe appear worse. Almost two-thirds of the 2.5 million migrants from the Middle East and north Africa residing in the European Union have only a primary education, while those with secondary or tertiary education each comprise 17 percent. Again, the Traditional Immigration Countries attract much higher shares of tertiary- and secondary-educated migrants from the same Middle East and north Africa countries.
These statistics show the obvious importance of geographical distance in determining the composition of immigration flows. Europe attracts a high share of low-skilled migrants from the southern Mediterranean, just as the United States attracts a relatively higher share of low-skilled migrants from Central America. of migrants from Central America in the United States, 46 percent
Box 6.7: The smarter North Americans? Immigration to CanadaCanada has one of the highest percentages of immigrants among developed countries, with highly favorable policies toward immigrants’ integration. In 2008, Canada’s foreign-born labor force accounted for 21.2 percent of total employment. Moreover, one in five people living in Canada was foreign-born. Between 15 and 20 percent of foreign students remain in Canada and start working.
According to MIPEX III, Canadian policies toward immigrants’ integration are very favorable, ranking third. This high ranking pays dividends in the form of immigrants with top-notch skills. Canada has the second-highest share of immigrants with tertiary education among all oECD countries (box figure 1). In
drawing foreign talent, Canada relies on a well-managed selection process. With its scoring system of visa applications, Canada prioritizes certain features of the labor force that are crucial for the country’s development. Canada chooses whom to grant visas based on a system that ranks candidates according to their profile—having a job offer or tertiary education, for example, grants additional points. Highly skilled, talented immigrants without a job offer can be admitted to the country.
The Canadian system is designed to treat all immigrants equally, regardless of ethnicity, race, religion, or nationality. Permanent immigrants have the same access-to-work
opportunities as Canadian citizens, including setting up a business. Immigration policy provides stable solutions for fostering family reunion.
Another aspect of integration policy is universal access to education for all children, regardless of immigration status. Political participation is one of the few aspects of life from which permanent immigrants are excluded. To become a citizen, one must pass a citizenship test, which measures language abilities and basic knowledge about the country. According to MIPEX, Canada has one of the most professional citizenship tests from all countries included in the ranking
Box figure 1: Immigrants in OECD countries and share of foreign-born with tertiary education, 2008
Source: oECD 2008; and oECD International Migration Database.
333
CHAPTER 6
have just a primary education, compared with 23 percent of the overall immigrant population of the United States. If, in addition, the host country relies mainly on family reunification as its immigration policy—as the European Union does—and does not apply proactive economic immigration programs—as in the United States—the share of primary-educated migrants originating from these countries is likely to remain high.
Europe is losing the competition for highly skilled migrants to the Traditional Immigration Countries. The exception is perhaps the United Kingdom (box 6.6). Indeed, the European Union is losing some of its most skilled people to the United States. Currently, the United States hosts 1.7 million tertiary-educated migrants from the European Union, while the European Union hosts roughly 200,000 tertiary-educated U.S. emigrants—a net drain of 1.5 million people educated mostly at the expense of European taxpayers.
Does this imply that the European Union should copy the Traditional Immigration Countries’ policies of large-scale permanent immigration programs and, in particular, systems like Canada’s, which seems to attract by far the highest share of tertiary-educated migrants (box 6.7)? Should the European Union imitate demand-driven temporary worker programs for specialized migrants like those in the United States, which seems to attract the highest share of secondary-educated migrants? or is there a genuinely European guest-worker program that will help master future challenges of migration? It appears that countries in Europe will have to adopt some of the attributes of more successful immigration policies, both in and outside Europe.
Needed: a more self-interested immigration policyWhen assessing the effects of institutional arrangements on immigration, it is useful to distinguish between types of migration. First, one can distinguish migration according to the intended duration of stay: temporary, transitional, or permanent. Temporary and permanent immigration are straightforward concepts. Temporary migrants arrive in the host country with no intention to stay long-term, leaving after a short period of time once their work contract or assignment expires, their education or training has finished, or their business objective is accomplished. Permanent migrants, by contrast, arrive in the host country to settle indefinitely, with no intention to return to their home country.
In reality, a large part of migrants fall somewhere in between, in the category of transitional migrants. These are migrants who arrive on temporary visas and work permits with no intention to stay permanently but eventually become long-term or permanent settlers. Many migrants who arrived in Europe through the guest-worker programs of the 1960s in Austria, France, and Germany probably never imagined they would stay on. Yet, as they performed inherently permanent jobs they integrated into the labor market and developed nation-specific expertise. They evolved into permanent migrants, generally with the support of their employers and host governments.
one might distinguish between immigrants by their main motivation for moving: humanitarian, family reunification, or economic migration. Family reunification should not be seen separately from good economic management of immigration, as it is essential for the integration of immigrants. If these rules are too generous,
334
GoLDEn GRoWTH
though, family reunification programs can become the driving factor of a country’s immigration policy, as has been the case for years in some countries in Europe and even the United States. When family reunification becomes the main driver of immigration policy, it can bias the selection of immigrants. The same holds for humanitarian migration, based on the right to asylum and refugee status. Initiatives to legalize undocumented migrants are a part of many immigration policies, sometimes nearly replacing a proactive immigration policy with purely reactive regularization, as in Spain.
European immigration policies will have to be geared toward Europe’s economic and labor market needs, and immigration policies that focus on demand-driven elements may be the best way to do so. Well-designed immigration programs for temporary and transitional migrants are the best models for the “new Immigration Countries” of Europe to select the right types of migrants for their economies.
Demand-driven programs have the advantage of being flexible and reacting quickly to changes in the labor market. They require less research and government planning, putting the administrative burden on employers. The disadvantage is that they need more monitoring of compliance and enforcement efforts by the government. Static models—in particular, points systems for permanent immigration—are less flexible, requiring more capacity to determine labor market needs and ensure a consistent selection process. Successful demand-driven immigration programs for temporary migrants offer jobs of a truly temporary nature, like seasonal jobs in agriculture and tourism. In addition, certain jobs in sectors with a highly competitive goods market can be subcontracted to foreign companies through trade in services, opening the gates for a new type of temporary migration, through Mode 4 of the World Trade organization’s General Agreement on Trade in Services.
Well-designed immigration programs for transitional migrants help identify successful newcomers by granting migrants temporary access to the host country—with full or limited access to the labor market—and offering a clear option for permanent residency and work permission. Three main avenues of transitional migration exist: education-to-residency, business-to-residency, and work-to-residency.
Governments’ capacities to assess labor market needs and plan responsive immigration and labor market policies are not limitless. Immigration policies are more likely to be effective if designed to require less government planning (Hopkins 2002). For example, Koettl (2009) finds that Europe will need both highly skilled and semiskilled migrants with secondary education. Yet, all projections—especially long-term forecasts—are uncertain. European economies might develop faster than anticipated toward a more knowledge-based economy, or the flow of highly skilled migrants to other countries might increase. Both scenarios would shift the demand toward tertiary-educated migrants. At the same time, the need for low-skilled service providers might shift demand toward primary-educated migrants, as suggested by the increasing numbers of undocumented migrants.
Planned immigration programs—like well-designed points systems—require the government to assess labor shortages and adjust the selection process of immigrants accordingly, which require resources and time, without a guaranteed good outcome. For example, although Canada’s points system attracts the largest
335
CHAPTER 6
share of tertiary-educated migrants, many end up overqualified for their jobs (Reitz 2011). This suggests that somewhere in the Canadian immigration system, there is a mismatch of supply and demand. The program seems designed to select highly skilled migrants, but the Canadian labor market either does not recognize immigrants’ skills or it simply demands less-skilled immigrants. Too many overqualified immigrants can be as distorting as too many underqualified immigrants. Allowing employers more say in the process could help reduce these mismatches.
Points systems can include demand-driven components by granting additional credit to migrants with a job offer, as the Australian system does. This is complemented by a special visa type granted to visitors interested in obtaining a job, making the Australian immigration system more responsive to shifting labor market needs. nevertheless, the system puts the government in the driver’s seat, with all the associated responsibilities and administrative costs this role implies.
The biggest risk of government-controlled selection criteria is that they might fall prey to lobbying efforts. Such efforts could come either from the employers or from native workers. Demand-driven programs, by contrast, are less likely to be influenced by lobbying efforts because they decentralize the decision process, putting the employer in control. If well-designed, they also put the administrative and cost burden on the employer. The U.K. Work Permits program, for example, can issue a visa and work permit within 24 hours of the employer’s request—assuming the employer provides adequate documentation. Similarly, the U.S. H1-B visa procedure is initiated and sponsored by the employer for a specific migrant, though the bureaucratic procedures and costs are far more burdensome for the employer. The drawback of employer-driven programs, however, is that they require regulations to prevent employers from abusing the system and to ensure that employers hire migrants only in sectors and skills segments with labor shortages. For this, a so-called “labor market test” is usually administered, requiring the employer to first post the job vacancy for native workers; only after sufficient time has passed with the post unfilled can the employer turn to migrant labor.
Europe can learn from the strengths and weaknesses of the Traditional Immigration Countries’ immigration policies. There is no one good program that addresses all the challenges of a well-crafted immigration policy. Points programs, employer-based programs, and General Agreement on Trade in Services Mode 4 programs all have their merits, but they serve different objectives. The underlying principle of a good immigration policy is its ability to respond to changing labor market needs. In this sense, European immigration policy has to become more selfish. But what immigration policies alone can achieve is limited. If Europe wants to win the global race for talent, it will need to make working and living in Europe more attractive for the world’s brightest. This can mean paying higher premiums on skills, increasing rewards for risk-taking, and encouraging entrepreneurship.
The European work model—reworkedThe countries covered by this report—members of the European Union, the EFTA countries, the candidate countries, and the Eastern European partnership countries—will lose 50 million workers between now and 2060. Today, the

336
GoLDEn GRoWTH
European labor force—the employed and active job seekers—consists of 323 million people; in 50 years, it will be down to 273 million, a decrease of 15.3 percent. over the next 20 years, the labor force will lose 15 million workers (5 percent). The largest reduction will happen during the 2030s, when the European labor force is expected to fall an additional 14 million people. The fall will be especially severe for the European Union and EFTA countries. Their labor force will decrease by almost 40 million people (18 percent) over the next 50 years. The other Eastern European countries will not fare much better, with an equally steep decline of 16 percent. The only exception is Turkey, where the labor force is projected to increase by 12 percent until 2060.
The current trends should not be allowed to persist. Many Europeans—especially women, youth, elderly, and some minorities—do not work at all, and they should be encouraged to work. Many Europeans retire too early, and they should work longer. Some unemployed Europeans do not look hard enough for work, and they should be encouraged to look harder. only with radical policy and behavioral changes could Europe counter the shrinking labor force. Yet, even under such optimistic scenario, Europe would not be able to prevent its labor force from aging. If participation rates in all countries were to converge to those in northern Europe, or the retirement age were to increase by 10 years across the board, the European labor force would actually increase by 2060 (by 5 percent and 2 percent, respectively). If the participation in the labor force of women were to converge to that of men, the labor force would still decrease, but only by 5 percent, as opposed to 15 percent in the baseline scenario. none of these scenarios counteracts, however, the loss of young workers due to continually decreasing younger-age cohorts. Increased migration will also have to be part of the solution. With revamped immigration policies that combine the altruism of a humanitarian stance with the self-interest of an economic approach, Europe can attract bright Africans, Americans, and Asians.
This chapter is perhaps best concluded with simple (but uncomfortable) answers to the questions posed at the start. Is there a European work model? Yes. And it makes Europe less competitive. A central aspect is that European model gives disproportionate power to those with protected jobs—the “insiders”—through employment protection legislation. This approach would have become difficult to sustain even without the onset of rapid aging. With this aging, it is already unsustainable. Countries such as Austria, Denmark, and the netherlands, which have kept unemployment low and labor force participation high during the last decade, have done so in some measure by reducing this protection. They have made jobs more contestable.
In the context of demographic change, how can Europe achieve a stable, more productive labor force? Countering the decline of the European labor force through increasing participation rates is important but not sufficient. Such measures cannot prevent a substantial aging of the labor force. In addition to immigration, boosting productivity of the labor force through increased investments in human capital is necessary. This requires harnessing the full potential of existing workers by prioritizing investments in the skills that are most relevant for the labor market today, and those that will allow them to adjust to changing labor demands tomorrow. Interventions should focus on overcoming failures in information and quality assurance that lead many people
337
CHAPTER 6
to make suboptimal skills investments (too few engineers, technicians, and competent managers).
Are employment and social protection practices inhibiting labor participation and efficiency? Yes, by creating powerful insiders with well-protected jobs at the cost of marginalizing others. In the broadest terms, reforms will have to reduce job security while modernizing how income security is provided. In wealthier countries, reduced employment protection can be combined with relatively generous unemployment benefits and social assistance, as long as there are strong incentives and effective assistance programs to return the unemployed to work and to encourage the inactive to participate. Governments capable of administering programs that supplement employment protection legislation with well-designed income support and job search assistance should institute them. But to work well, this “flexicurity” requires high labor force participation rates that are many years away for many in Europe, as well as institutional maturity and fiscal and administrative resources that are out of reach for most. Especially in the east and south, there may be no alternative but to reconsider the extent of employment protection and the generosity of social protection. But all countries should synchronize social insurance for the unemployed with social assistance for the unlucky in order to align incentives for work, as Germany did between 2003 and 2005.
Is Europe taking advantage of the greater potential for labor mobility due to economic integration? Undoubtedly, the European Union is the most integrated region in the world, and migration between EU countries is higher than in other world regions. Europe’s aspiration is, however, more ambitious: the aim is a fully integrated labor market with no borders. Against this yardstick, Europe still falls short. Significant challenges to improving labor mobility, even within European countries, remain. Mobility does come with social costs—missing the support of family and friends—that governments cannot easily reduce. But the costs related to education, housing, and health care can and should be reduced. These are some of the features that make the United States the most mobile economy in the world, and Europe can learn without losing its uniqueness.
How can Europe attract the best and brightest? A million people emigrate to Europe every year, but less than one in five has more than a high school diploma—and three of five do not even have that. Attracting global talent would require looking closer at successful, demand-driven schemes from the Traditional Immigration Countries—Australia, Canada, new Zealand, and the United States. Immigration policies should focus less on political factors such as family reunification, asylum, and human rights and respond more to the demands of employers and longer-term assessments of skill shortages. Changes in immigration policies need to be combined with reforms aimed at making Europe a good place to innovate, start businesses, and reward risks. Similarly, increased immigration without more contestable jobs and reformed social safety nets could undermine the success of immigration reform.
over the last decade and a half, emerging Europe may have done better than advanced Europe in taking advantage of expanding opportunities for trade, finance, and enterprise. The prospects ahead are bleaker. Demographic shifts threaten Central and Eastern Europe just as much as most countries in Western Europe, which have been reforming labor market policies and can more easily
338
GoLDEn GRoWTH
become attractive destinations for immigrants. The exception is Southern Europe, which has not done well in recent years and is projected to shrink and age over the next decade. Greece, Italy, Portugal, and Spain illustrate most starkly how work is simultaneously the weakest part of the European economic model and one of its most attractive attributes. Changing how the labor market is regulated and replenished will be difficult for politicians, but it is none the less urgent. nor is it hopeless: countries such as Denmark, Germany, Ireland, and Sweden have shown that the European work model’s characteristics can be changed while keeping its character distinctly European.
European economies generally have more stringent employment protection and more generous social benefits than their peers in north America and East Asia.Increased participation can help stem the decline of the workforce, but more competition for jobs, greater mobility within Europe, and measures to attract global talent will still be necessary.Employment protection gives too much power to those with jobs while banishing others to the fringes of the labor market, and generous social benefits weaken the incentives to work.Migration among and within countries in Europe is still low, and even intra-EU migration falls short of the European Union’s aspiration of a fully integrated labor market.Europe needs an approach to global talent with policies that link immigration to labor markets, and a business climate that rewards skills and entrepreneurship.
Answers to questions on page 291
339
CHAPTER 6
Chapter 6: AnnexesAnnex 6.1: Principal component analysisPrincipal component analysis is a way to identify patterns in data with high dimension, which is otherwise hard to simplify. It is a mathematical procedure that uses an orthogonal transformation to convert a set of observations of possibly correlated variables into a set of values of uncorrelated variables—called principal components. The main advantage of principal component analysis is that it can compress the data by reducing the number of dimensions, without much loss of information. For it to work properly, the main criterion is to subtract the mean from each data dimension. The weighting of indicators maximizes the variance of the components across countries.
The following instruments are used for the protection component: active labor market program spending as percentage of GDP, social assistance spending as percentage of GDP, gross replacement rate of unemployment benefits, minimum paid annual leave days, and duration of unemployment benefits.
For the labor market flexibility component, the following indicators were used: the employment protection legislation (EPL) index as developed by the oECD and applied by the Institute for the Study of Labor to other countries, the tax wedge ratio, union density, minimum wage as a percentage of value added per worker, and maximum time limit in months of fixed-term contracts.
The instruments in the first group (protection) are unidirectional, where higher values indicate more protection. The instruments in the flexibility group are, however, not unidirectional. To make them unidirectional, and to make the higher value representative of higher flexibility, the negative of EPL and the tax wage ratio was used. This transformation does not lead to loss of information, because principal component analysis is sensitive to relative scaling but not to the linear transformation of vectors. So, countries with highly flexible labor markets (higher values) are those with low EPL, low union density, low tax wedge, low minimum wages, and high maximum duration of temporary contracts; countries with high protection (higher values) are those with higher spending on “active” employment assistance programs, social assistance benefits, high replacement rates of unemployment benefits, and long duration of unemployment benefits and annual leave. The value 0 represents the average position in terms of flexibility and protection across all countries in the sample.
Annex 6.2: Modeling procedure and results The regression exercise uses two-stage least squares estimation with instrumental variables. Standard panel estimation procedures (random or fixed-effects estimation) were not employed because of insufficient explanatory power of these models and/or not enough data (tables A6.1–A6.4). Data were mainly from the organisation for Economic Co-operation and Development (oECD), with supplements from the Institute for the Study of Labor, the World Bank, and Eurostat for the explanatory variables, and the International Labour organization and European Bank for Reconstruction and Development for dependent variables.
340
GoLDEn GRoWTH
Three data samples are examined:
· Sample 1: EU and OECD members in other regions (particularly North America and East Asia) Data come from the oECD and cover only oECD members. Time period is 2001–07.30
· Sample 2: The EU15 and new member states31 Data come from the oECD. Use of the larger sample from the Institute for the Study of Labor was not possible due to a lack of relevant data. Thus, the sample covers three new member states with data available only (the Czech Republic, Hungary, and Poland). Time period is 2001–07.32
· Sample 3: EU new member states and aspirants in the European neighborhood Data come from the Institute for the Study of Labor database and time period covers years 1999, 2003, and 2007.33 nine new member states (data for Cyprus, Lithuania, and Malta were not available) are covered.34
The model examines the impact of institutional factors on four indicators of labor market performance (Eurostat methodology): unemployment rate (UR), long-term unemployment rate (LTUR), employment rate (ER), and activity rate (AR). In line with the previous research, the dependent variables are represented in logs. The regression equation has the following form:
lnXti = α + β1 EPLti + β2 MWti + β3 TUti + β4 TAXti + β5 ALMPti + + β6 UBRRti + β7 InFLti + β8 LEFTti + εti (1),
where X takes the form of UR, LTUR, ER, and AR in consequent regressions.
Explanatory variables are the following: employment protection legislation (EPL) is the second version of the oECD employment protection legislation index, covering a wide spectrum of employment protection policies. Minimum wage (MW) is a cluster variable constructed according to minimum wage level and its relative share on median wage in the economy. This variable was omitted in the analysis on Sample 3 due to unavailability of the data. The trade unions’ power is represented by the trade union density (TU).35 Tax system consequences are reflected by total tax wedge on labor (TAX).36 To reflect the influence of labor market policies (LMP), expenditure on active LMP as percentage of GDP per percentage point of unemployment (ALMP) and initial unemployment benefits replacement rate (UBRR) is included. Active labor market policies expenditure is instrumented.37 In the analysis on Sample 3, two other indices available from the Institute for the Study of Labor replaced the initial unemployment benefits replacement rate—the average unemployment benefit (UnBEn) and maximum duration of unemployment benefits (UnBEnDUR)—to reflect the effects of passive labor market policy spending.38
The actual unemployment rate is used in the regressions, but labor market institutions affect the equilibrium unemployment. To reflect this, an additional variable was used in the model―the change in the annual rate of inflation (InFL; nickell 1997). This variable captures the influence of economic cycles and may also be considered an indicator of macroeconomic policy stance. Finally, unemployment level might also be influenced by political preferences of governments and conflict of interest over the power resources (Korpi 1991). To account for these political factors, one more variable was added in the regression model―the government orientation with respect to the economic
341
CHAPTER 6
policy. Variable LEFT is a dummy acquiring 1 for parties defined as communist, socialist, social-democratic, or left-wing, where greater orientation on social issues resulting in lower unemployment is expected.39 As economic policy takes time to influence labor market performance, the LEFT dummy is used with a one-year lag.
The model analyzes the correlations between labor market performance and labor market institutions. Its deeper explanatory power is rather limited, due to the lack of data on more countries and other relevant variables that might affect the dependent variables.40 Moreover, only three new member states are covered in Sample 2. It is thus impossible to run a separate analysis for this group. Generally, only the differences in the role of institutions between the whole region and one particular subsample—and their implications for the other subsample—are examined, using a modified Chow test (see also Cazes and nesporova 2003).41

342
GoLDEn GRoWTH
Table A6.1: Regression estimation results: activity rate
OECD European Union NMS EU+European Neighborhood
Total OECD EU OECD non-EU OECD Total EU Old EU NMS EU Total NMS EU Neighborhood
ALMP 0.072 *** 0.101 *** -0.017 0.091 *** 0.117 *** -0.081 -0.077 -0.036 -1.257
TAX -0.004 *** -0.004 *** 0.000 -0.004 *** -0.005 *** 0.005 ** 0.003 -0.015 ** 0.011
EPL -0.029 *** 0.016 -0.106 *** 0.018 0.033 ** 0.092 0.017 -0.019 0.060
MW -0.006 -0.016 *** -0.014 *** -0.017 *** -0.019 *** -0.042 ***
TU 0.001 *** 0.001 * 0.006 *** 0.001 *** 0.001 ** 0.017 *** -0.001 ** 0.004 *** -0.001
UBRR 0.003 *** 0.002 ** -0.003 *** 0.002 *** 0.001 * 0.002 *
UNBEN 0.001 0.001 0.000
UNBENDUR 0.000 -0.004 0.011
INFL -0.001 0.000 -0.003 -0.001 -0.001 -0.005 0.001 0.005 ** 0.002
LEFT 0.008 0.011 0.017 ** 0.007 0.000 -0.079 *** -0.065 *** -0.054 -0.120
constant 4.257 *** 4.215 *** 4.490 *** 4.225 *** 4.243 *** 3.547 *** 4.081 *** 4.835 *** 3.725 ***
R sq. 0.486 0.643 0.973 0.660 0.638 0.903 0.443 0.743 0.933
N 168 119 49 126 105 21 30 19 11
Prob > F 0.000 0.000 0.000 0.000 0.000 0.000 0.018 0.000 0.081
Chow test F p-value 0.5648 0.9999 0.8413
***, **, and * denote significance at the 1 percent, 5 percent, and 10 percent levels, respectively.note: Regression method is a pooled two-stage least squares procedure with instrumental variables on panel data; robust standard errors are used. ALMP = active labor market policies, TAX = total tax wedge on labor, EPL = employment protection legislation, MW = minimum wage, TU = trade union density, UBRR = unemployment benefits replacement rate, UnBEn = average unemployment benefit, UnBEnDUR = maximum duration of unemployment benefits, InFL = change in annual rate of inflation, LIFT = leftward-leaning government.Source: Fialová 2011.
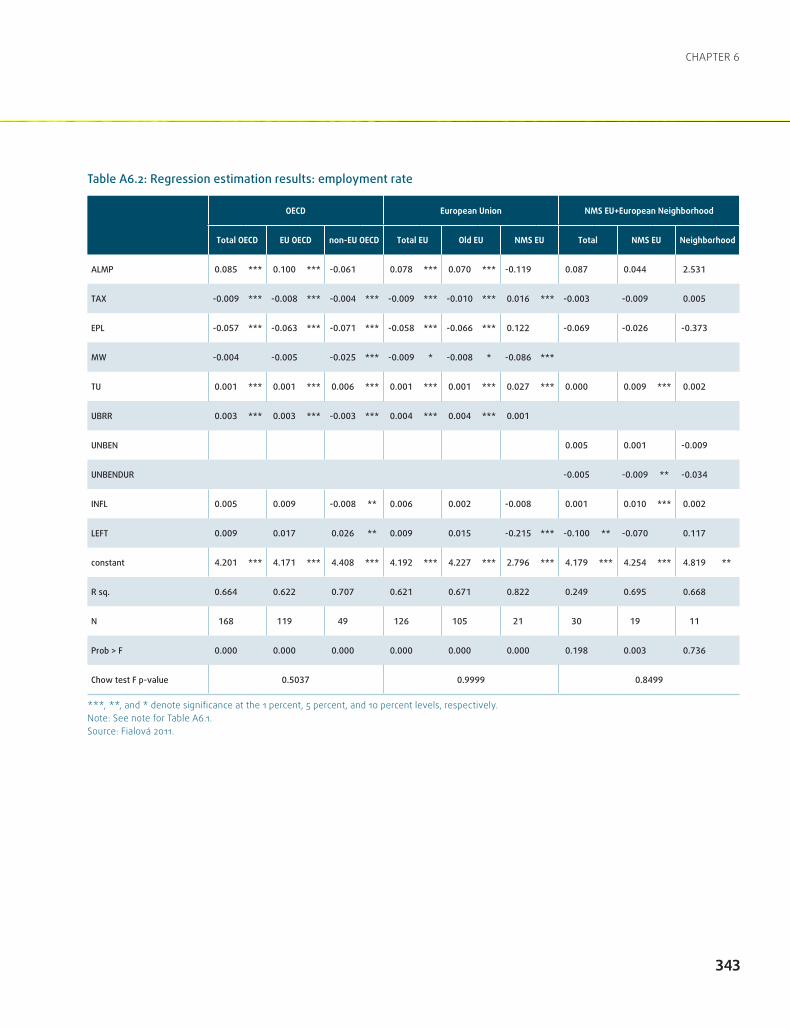
343
CHAPTER 6
Table A6.2: Regression estimation results: employment rate
OECD European Union NMS EU+European Neighborhood
Total OECD EU OECD non-EU OECD Total EU Old EU NMS EU Total NMS EU Neighborhood
ALMP 0.085 *** 0.100 *** -0.061 0.078 *** 0.070 *** -0.119 0.087 0.044 2.531
TAX -0.009 *** -0.008 *** -0.004 *** -0.009 *** -0.010 *** 0.016 *** -0.003 -0.009 0.005
EPL -0.057 *** -0.063 *** -0.071 *** -0.058 *** -0.066 *** 0.122 -0.069 -0.026 -0.373
MW -0.004 -0.005 -0.025 *** -0.009 * -0.008 * -0.086 ***
TU 0.001 *** 0.001 *** 0.006 *** 0.001 *** 0.001 *** 0.027 *** 0.000 0.009 *** 0.002
UBRR 0.003 *** 0.003 *** -0.003 *** 0.004 *** 0.004 *** 0.001
UNBEN 0.005 0.001 -0.009
UNBENDUR -0.005 -0.009 ** -0.034
INFL 0.005 0.009 -0.008 ** 0.006 0.002 -0.008 0.001 0.010 *** 0.002
LEFT 0.009 0.017 0.026 ** 0.009 0.015 -0.215 *** -0.100 ** -0.070 0.117
constant 4.201 *** 4.171 *** 4.408 *** 4.192 *** 4.227 *** 2.796 *** 4.179 *** 4.254 *** 4.819 **
R sq. 0.664 0.622 0.707 0.621 0.671 0.822 0.249 0.695 0.668
N 168 119 49 126 105 21 30 19 11
Prob > F 0.000 0.000 0.000 0.000 0.000 0.000 0.198 0.003 0.736
Chow test F p-value 0.5037 0.9999 0.8499
***, **, and * denote significance at the 1 percent, 5 percent, and 10 percent levels, respectively.note: See note for Table A6.1.Source: Fialová 2011.
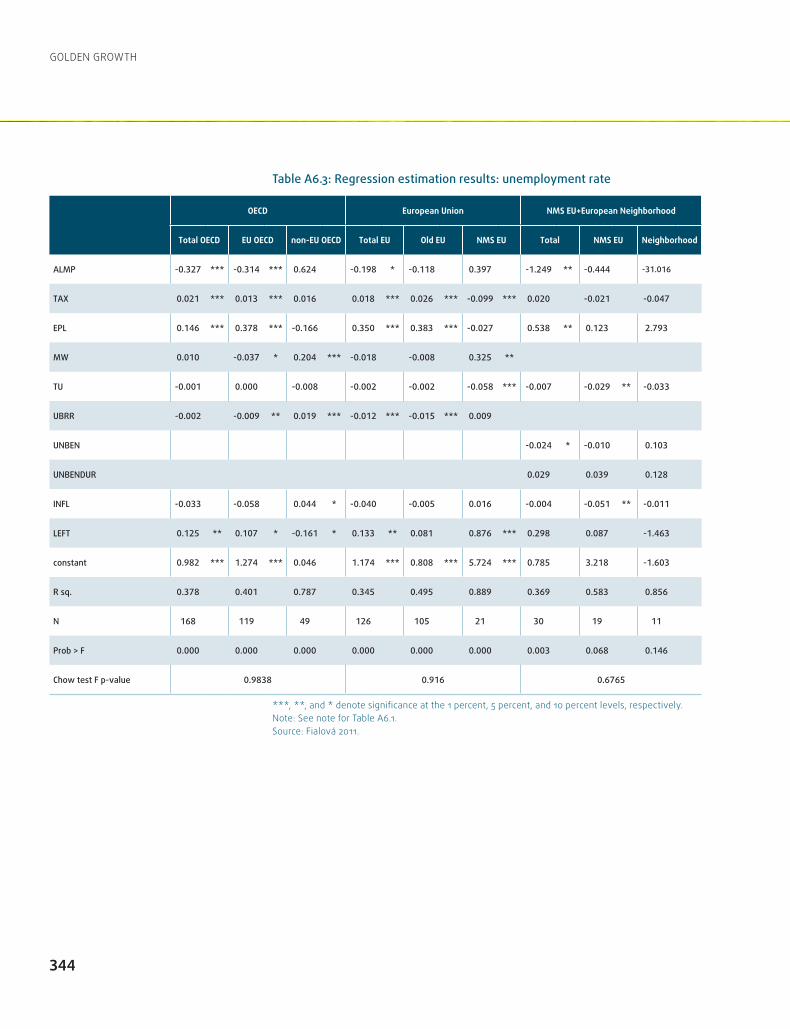
344
GoLDEn GRoWTH
Table A6.3: Regression estimation results: unemployment rate
OECD European Union NMS EU+European Neighborhood
Total OECD EU OECD non-EU OECD Total EU Old EU NMS EU Total NMS EU Neighborhood
ALMP -0.327 *** -0.314 *** 0.624 -0.198 * -0.118 0.397 -1.249 ** -0.444 -31.016
TAX 0.021 *** 0.013 *** 0.016 0.018 *** 0.026 *** -0.099 *** 0.020 -0.021 -0.047
EPL 0.146 *** 0.378 *** -0.166 0.350 *** 0.383 *** -0.027 0.538 ** 0.123 2.793
MW 0.010 -0.037 * 0.204 *** -0.018 -0.008 0.325 **
TU -0.001 0.000 -0.008 -0.002 -0.002 -0.058 *** -0.007 -0.029 ** -0.033
UBRR -0.002 -0.009 ** 0.019 *** -0.012 *** -0.015 *** 0.009
UNBEN -0.024 * -0.010 0.103
UNBENDUR 0.029 0.039 0.128
INFL -0.033 -0.058 0.044 * -0.040 -0.005 0.016 -0.004 -0.051 ** -0.011
LEFT 0.125 ** 0.107 * -0.161 * 0.133 ** 0.081 0.876 *** 0.298 0.087 -1.463
constant 0.982 *** 1.274 *** 0.046 1.174 *** 0.808 *** 5.724 *** 0.785 3.218 -1.603
R sq. 0.378 0.401 0.787 0.345 0.495 0.889 0.369 0.583 0.856
N 168 119 49 126 105 21 30 19 11
Prob > F 0.000 0.000 0.000 0.000 0.000 0.000 0.003 0.068 0.146
Chow test F p-value 0.9838 0.916 0.6765
***, **, and * denote significance at the 1 percent, 5 percent, and 10 percent levels, respectively.note: See note for Table A6.1.Source: Fialová 2011.
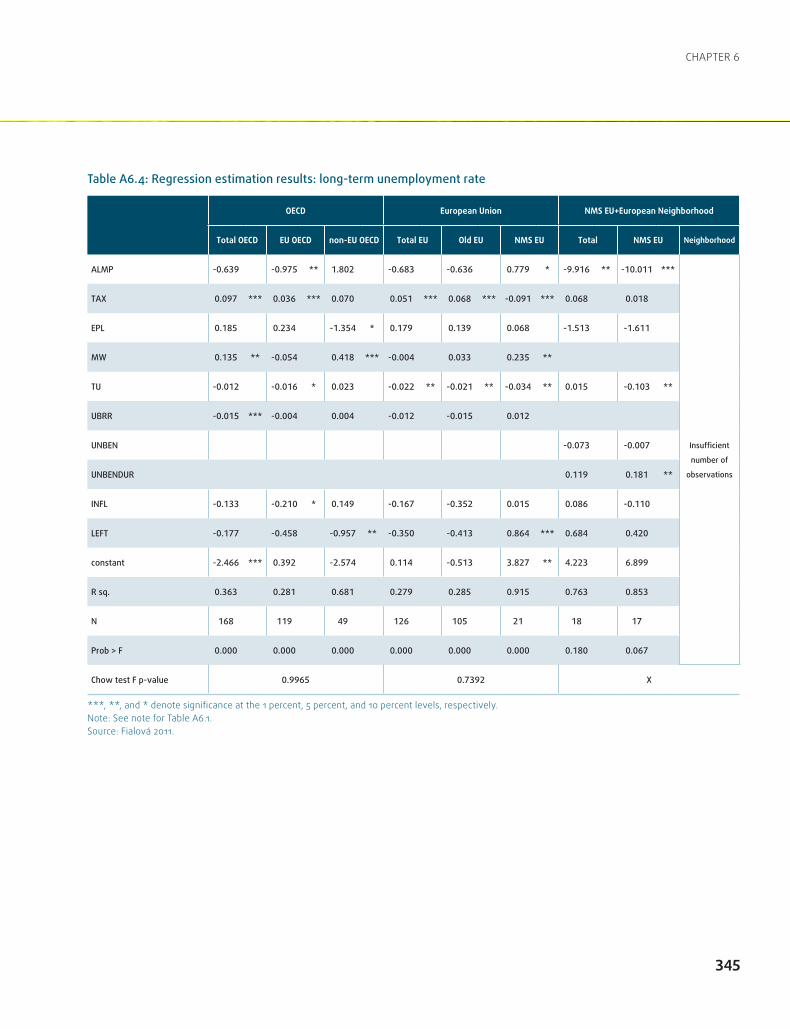
345
CHAPTER 6
Table A6.4: Regression estimation results: long-term unemployment rate
OECD European Union NMS EU+European Neighborhood
Total OECD EU OECD non-EU OECD Total EU Old EU NMS EU Total NMS EU Neighborhood
ALMP -0.639 -0.975 ** 1.802 -0.683 -0.636 0.779 * -9.916 ** -10.011 ***
Insufficient
number of
observations
TAX 0.097 *** 0.036 *** 0.070 0.051 *** 0.068 *** -0.091 *** 0.068 0.018
EPL 0.185 0.234 -1.354 * 0.179 0.139 0.068 -1.513 -1.611
MW 0.135 ** -0.054 0.418 *** -0.004 0.033 0.235 **
TU -0.012 -0.016 * 0.023 -0.022 ** -0.021 ** -0.034 ** 0.015 -0.103 **
UBRR -0.015 *** -0.004 0.004 -0.012 -0.015 0.012
UNBEN -0.073 -0.007
UNBENDUR 0.119 0.181 **
INFL -0.133 -0.210 * 0.149 -0.167 -0.352 0.015 0.086 -0.110
LEFT -0.177 -0.458 -0.957 ** -0.350 -0.413 0.864 *** 0.684 0.420
constant -2.466 *** 0.392 -2.574 0.114 -0.513 3.827 ** 4.223 6.899
R sq. 0.363 0.281 0.681 0.279 0.285 0.915 0.763 0.853
N 168 119 49 126 105 21 18 17
Prob > F 0.000 0.000 0.000 0.000 0.000 0.000 0.180 0.067
Chow test F p-value 0.9965 0.7392 X
***, **, and * denote significance at the 1 percent, 5 percent, and 10 percent levels, respectively.note: See note for Table A6.1.Source: Fialová 2011.

346
GoLDEn GRoWTH
1 Alesina, Glaeser, and Sacerdote (2006) find no real correlation between the proportion of Protestants in a population and the average hours of work.
2 Alesina, Glaeser, and Sacerdote (2006) indicate that the impact of taxes on labor supply disappears when controlling for unionization or labor market regulation. In an analysis of 16 oECD countries, they find a fairly strong negative correlation between hours worked and the percentage of the labor force covered by collective bargaining agreements. Working hours in Europe ßmight also be influenced by the strong political power of unions over welfare states.
3 See, for example, Clark, Georgellis, and Sanfey (1998); Drago and Wooden (1992); Freeman (1978); Gordon and Denisi (1995); and Judge and others (2001).
4 However, “trust in the education system” is positively associated with work centrality, which may indicate strongly held beliefs that effort is fairly rewarded.
5 See Lisbon Council Presidency Conclusions at http://www.europarl.europa.eu/aboutparliament/en/0044c3dd41/EU-fact-sheets.html;jsessionid=BD54698E30F3A038BA1D36B3E4FCBB8E.node1
6 As a robustness check, this analysis was also carried out using clustering techniques, with similar results.
7 only 2007 data are used because of restricted data availability, but also to avoid capturing increases in social spending that took place in most European countries in response to the 2008–10 crisis.
8 Countries that are “mixed”—low labor force participation and low unemployment rates or high labor force participation and high unemployment rates—are considered “inefficient.”
Notes9 The Gini coefficient data are from the WDI
and do not distinguish between equity in income and consumption. Inequality in outcomes goes far beyond labor markets, as social transfers are likely to play an important role here. one option would have been to look at inequality in wages or labor income more generally, but no such data are available for many countries, especially in emerging Europe.
10 This projection assumes that overall immigration and participation rates by sex and age group remain at current levels.
11 For a more detailed discussion on incentivizing formal work, see World Bank (2011a).
12 See Hanushek and Woessmann (2008) for a literature review of the empirical relationship between economic growth and school attainment.
13 See Carneiro and Heckman (2002) for U.S evidence, Brunello and Schlotter (2011) for Europe, and World Bank (2011b) for summary evidence in middle-income countries.
14 The oECD has initiated its Program for the International Assessment of Adult Competencies to measure cognitive skills in the working-age population (a complement to the Programme for International Student Assessment). The World Bank’s Skills toward Employment and Productivity initiative complements the Program for the International Assessment of Adult Competencies initiative by also measuring noncognitive skills. First results are expected by 2013.
15 See, for example, Bowles and Gintis (2000) for evidence of employer surveys from the United Kingdom and the United States, Blom and Saeki (2011) for a study for India, and World Bank (2011b) for evidence from Latin America.
347
CHAPTER 6
21 The generosity of unemployment benefits seems to have the reverse effect in non-European oECD countries.
22 Bertola and Ichino (1995) argue that the persistence of unemployment in Europe in the 1980s and 1990s was caused by a lack of labor mobility and by people remaining in lagging areas.
23 However, Ester and Krieger (2007) and Eurofound (2006 and 2007) present data that indicate a decrease in interstate mobility in the United States over 2000–05.
24 See European Commission (2010c). In 2008, 37 percent (11.3 million people) of nonnationals in EU27 countries were citizens of another member state. The number of nonnationals in EU27 has increased 42 percent since 2001 (for further details, see Eurostat Statistics in focus 94/2009).
25 Tatsiramos (2009) makes reference to important work by Decressin and Fatás (1995) and Jimeno and Bentolila (1998) about European trends. For the United States, Tatsiramos quotes Blanchard and Katz (1992).
26 Restrictions on the freedom to work can be maintained for up to seven years after the entry of new member states into the European Union. The last restrictions were lifted on workers from the EU8 countries in May 2011. Restrictions will be lifted on workers from Bulgaria and Romania in December 2013.
27 Using nomenclature of Units for Territorial Statistics 2 data from the European Commission’s data source Eurostat http://ec.europa.eu/eurostat/ramon/nomenclatures/index.cfm?TargetUrl=LST_CLS_DLD&Strnom=nUTS_33&StrLangua geCode=En
28 See, for instance, Bentolila (1997) for Spain; Pissarides and Wadsworth (1989) for the United Kingdom; and Fidrmuc (2004) for transition economies.
16 For an extensive treatment of the impact of labor unions on labor market outcomes in Europe, see Alesina, Glaeser, and Sacerdote (2006).
17 Following Fialová and Schneider (2009 and 2011), Fialová (2011) uses two-stage least squares regression estimation with instrumental variables on pooled data. Standard panel estimation procedures (random or fixed effects estimation) were not employed for insufficient explanatory power of these models and/or too few data. Data were mainly from oECD with some supplements from the Institute for the Study of Labor, International Labour organization, and European Bank for Reconstruction and Development.
18 The data are from the oECD, for 2001–07. The sample covers Australia, Austria, Belgium, Canada, the Czech Republic, Denmark, Finland, France, Germany, Greece, Hungary, Ireland, Italy, Japan, the Republic of Korea, the netherlands, norway, new Zealand, Poland, Portugal, Spain, Sweden, the United Kingdom, and the United States. of them, 17 are classified as EU oECD and 7 as non-EU oECD.
19 The sample covers Austria, Belgium, the Czech Republic, Denmark, Finland, France, Germany, Greece, Hungary, Ireland, Italy, the netherlands, norway, Poland, Portugal, Spain, Sweden, and the United Kingdom. of them, 15 are classified as old European Union and 3 as new member states of the European Union.
20 Data are from the Institute for the Study of Labor database, for 1999, 2003, and 2007. The sample covers Albania, Bulgaria, Croatia, the Czech Republic, Estonia, Hungary, the Kyrgyz Republic, Latvia, Macedonia FYR, Moldova, Poland, Romania, the Slovak Republic, Slovenia, and Ukraine. of them, 9 are classified as new member states of the European Union and 6 as European neighborhood.
29 For a detailed discussion on conceptual issues regarding portability of social benefits, see Holzmann and Koettl (2011).
30 The sample covers Australia, Austria, Belgium, Canada, the Czech Republic, Denmark, Finland, France, Germany, Greece, Hungary, Ireland, Italy, Japan, the Republic of Korea, the netherlands, norway, new Zealand, Poland, Portugal, Spain, Sweden, the United Kingdom, and the United States. of them, 17 are classified as EU oECD and 7 as non-EU oECD.
31 For this analysis, the new member states group generally consists of countries acceding to the European Union in 2004 and 2007.
32 The sample covers Austria, Belgium, the Czech Republic, Denmark, Finland, France, Germany, Greece, Hungary, Ireland, Italy, the netherlands, norway, Poland, Portugal, Spain, Sweden, and the United Kingdom. of them, 15 are classified as old European Union and 3 as new member states of the European Union.
33 For some countries, only some of these years with data available were covered.
34 The sample covers Albania, Bulgaria, the Czech Republic, Estonia, Croatia, Hungary, the Kyrgyz Republic, Latvia, Macedonia FYR, Moldova, Poland, Romania, the Slovak Republic, Slovenia, and Ukraine. of them, nine are classified as new member states of the European Union and six as European neighborhood.
35 Trade union density refers to the share of workers who were trade union members. However, even if the density is low in some countries, it is a common practice to extend trade union agreements to nonunionized workers, thus covering a large share of employees in the economy (France and Spain, for example). Thus, the real degree of collective bargaining coverage—the share of all salary earners whose wage is determined by a collective agreement in a legal extension of bargained wage rates to nonunionized workers—would be a preferred indicator; unfortunately, such data are not available for the examined period and country sample.

348
GoLDEn GRoWTH
36 Total tax wedge on labor represents the combined central and subcentral government income tax plus employee and employer social security contribution taxes, as a percentage of labor costs, defined as gross wage earnings plus employer social security contributions; the tax wedge includes cash transfers. The indicator is calculated for a single individual without children, earning the average wage.
37 This variable is endogenous because it relates the expenditure to the actual rate of unemployment. For this reason, this variable was instrumented by a new variable relating the expenditure to the average unemployment rate in a five-year period before the actual year.
38 Average unemployment benefit is the average benefit as a percentage of the average wage. This definition deviates from the estimates typically used by the oECD because oECD replacement rates are not very meaningful in the transition countries due to the caps on the size of the benefit in many countries. Maximum duration of unemployment benefits is defined as the period for which a 40-year-old person who has been employed for 22 years prior to unemployment receives unemployment benefits, wherever possible. Data are from the Institute for the Study of Labor.
39 Data are from the World Bank’s database of political institutions; for details, see Beck and others (2001) and Keefer and Stasavage (2003).
40 These are, for example, the role of product market reforms (Boeri 2005; Griffith, Harrison, and Macartney 2007) or the importance of adverse economic shocks (Blanchard and Wolfers 2000).
41 A modified version of the test hypothesis and statistics was used, because the number of observations in the new member states group is smaller than the number of parameters, nnMS < k, and thus the standard methods in this case cannot be used. The hypothesis tested is H0 :E ( y | X; βoE) = E ( y | X; βnMS).

349
CHAPTER 6
Alesina, A., E. Glaeser, and B. Sacerdote. 2006. “Work and Leisure in the United States and Europe: Why so Different?” In nBER Macroeconomics Annual 2005, Volume 20, ed. M. Gertler, and K. Rogoff: 1–100. Cambridge, MA: MIT Press.Andersen, T., and M. Svarer. 2007. “Flexicurity—Labour Market Performance in Denmark.” CESifo Economic Studies 53 (4): 389–429.Beck, T., G. Clarke, A. Groff, P. Keefer, and P. Walsh. 2001. “new Tools in Comparative Political Economy: The Database of Political Institutions.” The World Bank Economic Review 15 (1): 165–176.Bell, M., and S. Muhidin. 2009. “Cross-national Comparisons of Internal Migration.” Human Development Research Paper 2009/30, United nations Development Programme, new York, nY.Bentolila, S. 1997. “Sticky Labor in Spanish Regions.” European Economic Review 41 (3–5): 591–598.Bentolila, S., J. Dolado, and J. Jimeno. 2008. “Two-tier Employment Protection Reforms: The Spanish Experience.” CESifo DICE Report 4/2008, Center for Economic Studies and Ifo Institute for Economic Research, Munich.Bertola, G., and A. Ichino. 1995 “Wage Inequality and Unemployment: United States vs. Europe.” In nBER Macroeconomics Annual 1995, Volume 10, ed. B. Bernanke, and J. Rotemberg: 13–66. Cambridge, MA: MIT Press.Blanchard, o. 2004. “The Economic Future of Europe.” The Journal of Economic Perspectives 18 (4): 3–26.Blanchard o., and J. Wolfers. 2000. “The Role of Shocks and Institutions in the Rise of European Unemployment: The Aggregate Evidence.” The Economic Journal 110 (462): C1–C33.Blanchard, o., and L. Katz. 1992. “Regional Evolutions.” Brookings Papers on Economic Activity 1992 (1): 1–61.Blom, A., and H. Saeki. 2011. “Employability and Skill Set of newly Graduated Engineers in India.” Policy Research Working Paper 5640, World Bank, Washington, DC.Boeri, T. 2005. “Reforming Labor and Product Markets: Some Lessons from Two Decades of Experiments in Europe.” IMF Working Paper 05/97, IMF, Washington, DC.
References
Boeri, T. 2011. “Institutional Reforms and Dualism in European Labor Markets.” In Handbook of Labor Economics, Volume 4, Part B, ed. o. Ashenfelter, and D. Card: 1173–1236. Amsterdam: ElsevierBoeri, T., and P. Garibaldi. 2007. “Two Tier Reforms of Employment Protection: A Honeymoon Effect?” The Economic Journal 117 (521): F357–F385.Bonin, H., W. Eichhorst, C. Florman, M. Hansen, L. Skiöld, J. Stuhler, K. Tatsiramos, H. Thomasen, and K. Zimmermann. 2008. “Geographic Mobility in the European Union: optimising its Economic and Social Benefits.” IZA Research Report 19, Institute for the Study of Labor, Bonn.Bover, o., and R. Gómez. 2004. “Another Look at Unemployment Duration: Exit to a Permanent vs. a Temporary Job.” Investigaciones Económicas 28 (2): 285–314.Bowles, S., and H. Gintis. 2000. “Does Schooling Raise Earnings by Making People Smarter?” In Meritocracy and Economic Inequality, ed. K. Arrow, S. Bowles, and S. Durlauf: 118–136. Princeton, nJ: Princeton University Press.Bredgaard, T., and F. Larsen. 2007. “Comparing Flexicurity in Denmark and Japan.” CARMA Research Paper 5, Centre for Labour Market Research, Aalborg University, Aalborg.Brunello, G., and M. Schlotter. 2011. “non Cognitive Skills and Personality Traits: Labour Market Relevance and Their Development in Education & Training Systems.” IZA Discussion Paper 5743, Institute for the Study of Labor, Bonn.Cahuc, P., and F. Postel-Vinay. 2002. “Temporary Jobs, Employment Protection and Labor Market Performance.” Labour Economics 9 (1): 63–91.Carneiro, P., and J. Heckman. 2002. “The Evidence on Credit Constraints in Post-Secondary Schooling.” The Economic Journal 112 (482): 705–734.Cazes, S., and A. nesporova. 2003. Labour Markets in Transition: Balancing Flexibility and Security in Central and Eastern Europe. Geneva: ILo.Chawla, M., G. Betcherman, and A. Banerji. 2007. From Red to Gray: The “Third Transition” of Aging Populations in Eastern Europe and the Former Soviet Union. With A. Bakilana, C. Feher, M. Mertaugh. Washington, DC: World Bank.
Clark, A. 1997. “Job Satisfaction and Gender: Why Are Women so Happy at Work?” Labour Economics 4 (4): 341–372.Clark, A., Y. Georgellis, and P. Sanfey. 1998. “Job Satisfaction, Wage Changes and Quits: Evidence from Germany.” In Research in Labor Economics, Volume 17, ed. S. Polachek: 95–121. Greenwich, CT: JAI Press.Davis, S., and M. Henrekson. 2005 “Tax Effects on Work Activity, Industry Mix and Shadow Economy Size: Evidence from Rich Country Comparisons.” In Labour Supply and Incentives to Work in Europe, ed. R. Gomez-Salvador, A. Lamo, B. Petrongolo, M. Ward, and E. Wasmer: 44–104. Cheltenham: Edward Elgar Press.Decressin, J., and A. Fatás. 1995. “Regional Labor Market Dynamics in Europe.” European Economic Review 39 (9): 1627–1655.Dolado, J., C. García-Serrano, and J. Jimeno. 2002. “Drawing Lessons from the Boom of Temporary Jobs in Spain.” The Economic Journal 112 (480): F270–F295.Drago, R., and M. Wooden. 1992. “The Determinants of Labor Absence: Economic Factors and Workgroup norms across Countries.” Industrial and Labor Relations Review 45 (4): 764–778.Ester, P., and H. Krieger. 2007. “Labour Mobility in a Transatlantic Perspective – Conference Report.” Report prepared for presenting the conclusions from a seminar on labour mobility in a transatlantic perspective, Dublin, october 30–31, 2007.Estevão, M., and F. Sá. 2006. “Are the French Happy with the 35-Hour Workweek?” IMF Working Paper 06/251, IMF, Washington, DC.Eurofound (European Foundation for the Improvement of Living and Working Conditions). 2006. Long-Distance Mobility in Europe: Getting the Balance Right. Dublin: Eurofound.Eurofound (European Foundation for the Improvement of Living and Working Conditions). 2007. “Mobility in Europe: The Way Forward.” Foundation Findings, november 2007, Eurofound, Dublin.European Commission. 2006. “Adult Learning: It Is never too Late to Learn.” Communication from the Commission, CoM(2006) 614, European Commission, Brussels.
350
GoLDEn GRoWTH
European Commission. 2010a. Employment in Europe 2010. Brussels: European Commission.European Commission. 2010b. “Europe 2020: A Strategy for Smart, Sustainable, and Inclusive Growth.” Communication from the Commission, CoM(2010) 2020, European Commission, Brussels.European Commission. 2010c. “Reaffirming the Free Movement of Workers: Rights and Major Developments.” Communication from the Commission to the Council, the European Parliament, the European Economic and Social Committee and the Committee of the Regions, CoM(2010) 0373, European Commission, Brussels.European Commission. 2011. “Annual Report on Immigration and Asylum (2010).” Communication from the Commission to the European Parliament and the Council, CoM (2011) 291, European Commission, Brussels.Fialová, K. 2011. “Labor Market Institutions and Their Effect on Labor Market Performance in oECD and European Countries.” Mimeo, World Bank, Washington, DC.Fialová, K., and o. Schneider. 2009. “Labor Market Institutions and Their Effect on Labor Market Performance in the new EU Member Countries.” Eastern European Economics 47 (3): 57–83.Fialová, K., and o. Schneider. 2011. “Labor Institutions and Their Impact on Shadow Economies in Europe.” Policy Research Working Paper 5913, World Bank, Washington, DC.Fidrmuc, J. 2004. “Migration and Regional Adjustment to Asymmetric Shocks in Transition Economies.” Journal of Comparative Economics 32 (2): 230–247.Freeman, R. 1978. “Job Satisfaction as an Economic Variable.” The American Economic Review 68 (2): 135–141.García Serrano, C. 1998. “Worker Turnover and Job Reallocation: The Role of Fixed-Term Contracts.” oxford Economic Papers 50 (4): 709–725.Gardner, J., G. Pierre, and A. oswald. 2001. “Moving for Job Reasons.” Mimeo, Department of Economics, University of Warwick, Coventry.
Goethe Institut. 2007. “Hartz IV—More Dependency on the State.” Available at www.goethe.de/ges/soz/soz/en2606706.htm. Accessed September 22, 2011.Goebel, J., and M. Grabka. 2011. “Entwicklung der Altersarmut in Deutschland.“ SoEP Paper 378, German Socio-Economic Panel, German Institute for Economic Research, Berlin.Gordon, M., and A. Denisi. 1995. “A Re-examination of the Relationship between Union Membership and Job Satisfaction.” Industrial and Labor Relations Review 48 (2): 222–236.Griffith, R., R. Harrison, and G. Macartney. 2007. “Product Market Reforms, Labour Market Institutions and Unemployment.” The Economic Journal 117 (519): C142–C166.Güell, M., and B. Petrongolo. 2007. “How Binding are Legal Limits? Transitions from Temporary to Permanent Work in Spain.” Labour Economics 14 (2): 153–183.Haavio, M., and H. Kauppi. 2003. “Housing Markets and Labor Mobility.” Mimeo, Department of Economics, University of Helsinki, Helsinki.Hansen, L. 2010. “Flexicurity and Danish Labour Market Policy.” PowerPoint slides, Copenhagen, September 2010. Available at www.thl.fi/fi_FI/web/fi/tutkimus/hankkeet/askel/foorumit/tanska. Accessed September 14, 2011.Hanushek, E., and L. Woessmann. 2008. “The Role of Cognitive Skills in Economic Development.” Journal of Economic Literature 46 (3): 607–668.Hanushek, E., and L. Woessmann. 2011. “How Much Do Educational outcomes Matter in oECD Countries?” Economic Policy 26 (67): 427–491.Hassler, J., J. Rodríguez Mora, K. Storesletten, and F. Zilibotti. 2005. “A Positive Theory of Geographic Mobility and Social Insurance.” International Economic Review 46 (1): 263–303.Hazans, M. 2011a. “Informal Workers across Europe: Evidence from 30 European Countries.” Policy Research Working Paper 5912, World Bank, Washington, DC.
351
CHAPTER 6
Hazans, M. 2011b. “What Explains Prevalence of Informal Employment in European Countries: The Role of Labor Institutions, Governance, Immigrants, and Growth.” Policy Research Working Paper 5917, World Bank, Washington, DC.Heckman, J., J. Stixrud, and S. Urzua. 2006. “The Effects of Cognitive and noncognitive Abilities on Labor Market outcomes and Social Behavior.” Journal of Labor Economics 24 (3): 411–482.Henley, A. 1998. “Residential Mobility, Housing Equity and the Labour Market.” The Economic Journal 108 (447): 414–427.Hirschfeld, R., and H. Feild. 2000. “Work Centrality and Work Alienation: Distinct Aspects of a General Commitment to Work.” Journal of organizational Behavior 21 (7): 789–800.Holzmann, R., and J. Koettl. 2011. “Portability of Pension, Health, and other Social Benefits: Facts, Concepts, Issues.” IZA Discussion Paper 5715, Institute for the Study of Labor, Bonn.Hopkins, M. 2002. Labour Market Planning Revisited. new York, nY: Palgrave Macmillan.Huddleston, T., and J. niessen. 2011. Migrant Integration Policy Index III. With E. Chaoimh, and E. White. Brussels: British Council and Migration Policy Group.Hughes, G., and B. McCormick. 1985. “Migration Intentions in the U.K.: Which Households Want to Migrate and Which Succeed?” The Economic Journal 95, Supplement, Conference Papers: 113–123.Hughes, G., and B. McCormick. 1987. “Housing Markets, Unemployment and Labour Market Flexibility in the UK.” European Economic Review 31 (3): 615–641.ILo (International Labour office). 2010. Key indicators of the Labour Market, Sixth Edition. Geneva: ILo.Iwulska, A. 2011. “Country Benchmarks.” Prepared for this report. Available at www.worldbank.org/goldengrowth. Accessed January 23, 2012.Janiak, A., and E. Wasmer. 2008. “Mobility in Europe—Why It Is Low, the Bottlenecks and the Policy Solutions.” European Economy Economic Papers 340, European Commission, Brussels.
Jimeno, J., and S. Bentolila. 1998. “Regional Unemployment Persistence (Spain, 1976–1994).” Labour Economics 5 (1): 25–51.Judge, T., C. Thoresen, J. Bono, G. Patton. 2001. “The Job Satisfaction–Job Performance Relationship: A Qualitative and Quantitative Review.” Psychological Bulletin 127 (3): 376–407.Karppinen, J., E. Fernandez, and H. Krieger. 2006. “Geographical Mobility: Challenges and opportunities.” Discussion paper presented at the conference to launch the European Year of Workers’ Mobility 2006, Brussels, February 20–21, 2006.Keefer, P., and D. Stasavage. 2003. “The Limits of Delegation: Veto Players, Central Bank Independence, and the Credibility of Monetary Policy.” The American Political Science Review 97 (3): 407–423.Koettl, J. 2009. “Prospects for Management of Migration between Europe and the Middle East and north Africa: Demographic Trends, Labor Force Projections, and Implications for Policies of Immigration, Labor Markets and Social Protection.” Background paper for the World Bank report, Shaping the Future: A Long-Term Perspectives of People and Job Mobility for the Middle East and north Africa. Washington, DC: World Bank.Koettl, J., and M. Weber. forthcoming. “Does Formal Work Pay? The Role of Labor Taxation and Social Benefit Design in Providing Disincentives for Formal Work in the new Member States.” Research in Labor Economics.Korpi, W. 1991. “Political and Economic Explanations for Unemployment: A Cross-national and Long-Term Analysis.” British Journal of Political Science 21 (3): 315–348.Layard, R. 2005. Happiness: Lessons from a new Science. new York: The Penguin Press.Lebrun, I., and E. Pérez. 2011. “Real Unit Labor Costs Differentials in EMU: How Big, How Benign and How Reversible?” IMF Working Paper 11/109, IMF, Washington, DC.Lehmann, H., and A. Muravyev. 2010. “Labor Market Institutions and Labor Market Performance: What Can We Learn from Transition Countries?” Department of Economics Working Paper 714, Università di Bologna, Bologna.
Manning, A. 1995. “How Do We Know that Real Wages are Too High?” The Quarterly Journal of Economics 110 (4): 1111–1125.Mansoor, A., and B. Quillin, ed. 2006. Migration and Remittances: Eastern Europe and the Former Soviet Union. Washington, DC: World Bank.Maselnik, S. 2010. “Is European Economic Prosperity Dependent on Mass Immigration?” Blog post on Faustian Europe, June 17. Available at faustianeurope.wordpress.com/2010/06/17/is-european-economic-prosperity-dependent-on-mass-immigration-2. Accessed november 8, 2011.Montenegro, C., and C. Pagés. 2005. “Who Benefits from Labor Market Regulations? Chile 1960–1998.” In Labor Markets and Institutions, Edition 1, Volume 8, ed. J. Restrepo, A. Tokman, n. Loayza, and K. Schmidt-Hebbel: 77–114. Santiago: Central Bank of Chile.Muenz, R. 2007. “Aging and Demographic Change in European Societies: Main Trends and Alternative Policy options.” Social Protection Discussion Paper 0703, World Bank, Washington, DC.nickell, S. 1997. “Unemployment and Labor Market Rigidities: Europe versus north America.” The Journal of Economic Perspectives 11 (3): 55–74.oECD (organisation for Economic Co-operation and Development). 1999. oECD Employment outlook 1999. Paris: oECD.oECD (organisation for Economic Co-operation and Development). 2004. oECD Employment outlook 2004. Paris: oECD.oECD (organisation for Economic Co-operation and Development). 2005. oECD Employment outlook 2005. Paris: oECD.oECD (organisation for Economic Co-operation and Development). 2006. Live Longer, Work Longer. Paris: oECD.oECD (organisation for Economic Co-operation and Development). 2007. oECD Economic Surveys: European Union 2007. Paris: oECD.oECD (organisation for Economic Co-operation and Development). 2008. A Profile of Immigrant Populations in the 21st Century: Data from oECD Countries. Paris: oECD.
352
GoLDEn GRoWTH
oECD (organisation for Economic Co-operation and Development). 2010. Employment outlook 2010: Moving Beyond the Jobs Crisis. Paris: oECD.Pissarides, C., and J. Wadsworth. 1989. “Unemployment and the Inter-regional Mobility of Labour.” The Economic Journal 99 (397): 739–755.Prescott, E. 2004. “Why Do Americans Work So Much More Than Europeans?” Federal Reserve Bank of Minneapolis Quarterly Review 28 (1): 2–13.Rebitzer, J., and L. Taylor. 1995. “The Consequences of Minimum Wage Laws: Some new Theoretical Ideas.” Journal of Public Economics 56 (2): 245–255.Reitz, J. 2011. “Taxi Driver Syndrome: Behind-the-scenes Immigration Changes are Creating new Problems on Top of old ones.” Literary Review of Canada, March.Rosen, S. 1997. “Public Employment, Taxes and the Welfare State in Sweden.” In The Welfare State in Transition: Reforming the Swedish Model, ed. R. Freeman, R. Topel, and B. Swedenborg: 76–108. Chicago: University of Chicago Press.Rutkowski, J. 2010. “Demand for Skills in FYR Macedonia.” Report supported by the Multidonor Trust Fund, “Labor Markets, Job Creation, and Economic Growth,” World Bank, Washington, DC.Sapir, A. 2005. “Globalisation and the Reform of European Social Models.” Bruegel Policy Brief 2005/01, Bruegel, Brussels.Sharpe, A., J-F. Arsenault, and D. Ershov. 2007. “The Impact of Interprovincial Migration on Aggregate output and Labour Productivity in Canada, 1987-2006.” CSLS Research Report 2007-02, Centre for the Study of Living Standards, ontario.Sondergaard, L., and M. Murthi. 2011. Skills, not Just Diplomas: Managing Education for Results in Eastern Europe and Central Asia. With D. Abu-Ghaida, C. Bodewig, and J. Rutkowski. Washington, DC: World Bank.Tatsiramos, K. 2009. “Geographic Labour Mobility and Unemployment Insurance in Europe.” Journal of Population Economics 22 (2): 267–283.Torgler, B. 2011. “Work Values in Western and Eastern Europe.” Mimeo. World Bank, Washington, DC. Background paper for this report.
Un (United nations). 2011. World Population Prospects: The 2010 Revision, CD-RoM Edition. new York, nY: Un.U.S. Department of Labor. 2011. “International Comparisons of Manufacturing Productivity and Unit Labor Cost Trends.” news Release USDL-11-1469, october 13. Available at www.bls.gov/news.release/prod4.htm. Accessed December 19, 2011.Vedder, R., and L. Gallaway. 1997. out of Work. Unemployment and Government in Twentieth-Century America. new York: nYU Press.Venn, D. 2009. “Legislation, Collective Bargaining and Enforcement: Updating the oECD Employment Protection Indicators.” oECD Social, Employment and Migration Working Paper 89, oECD, Paris.World Bank. 2009. Ukraine Labor Demand Study. Washington, DC: World Bank.World Bank. 2010. “Roma Inclusion: An Economic opportunity for Bulgaria, Czech Republic, Romania and Serbia.” ECA Policy note, World Bank, Washington, DC.World Bank. 2011a. “In from the Shadow: Integrating Europe’s Informal Labor.” World Bank Report 63078-ECA, World Bank, Washington, DC. World Bank. 2011b. “Peru: Strengthening Skills and Employability in Peru.” World Bank Report 61699-PE, World Bank, Washington, DC.World Bank. 2011c. The Jobs Crisis: Household and Government Responses to the Great Recession in Eastern Europe and Central Asia. Washington, DC: World Bank.World Bank. 2011d. “Ukraine Labor Mobility and Just-in-Time Support.” Project Concept note, World Bank, Washington, DC. World Bank. 2011e. World Development Report 2012: Gender Equality and Development. Washington, DC: World Bank.Zimmermann, K. 2006. “An Evaluation of the ‘Hartz Reforms’ in Germany.” PowerPoint slides, Milan, February 3, 2006.