Embed Size (px)
Citation preview

1
LABILITY OF DRINKING-WATER TREATMENT RESIDUALS (WTR) IMMOBILIZED PHOSPHORUS: IMPLICATIONS FOR LONG-TERM STABILITY
By
SAMPSON AGYIN-BIRIKORANG
A DISSERTATION PRESENTED TO THE GRADUATE SCHOOL OF THE UNIVERSITY OF FLORIDA IN PARTIAL FULFILLMENT
OF THE REQUIREMENTS FOR THE DEGREE OF DOCTOR OF PHILOSOPHY
UNIVERSITY OF FLORIDA
2006

2
Copyright 2006
by
Sampson Agyin-Birikorang

3
This PhD dissertation is dedicated to my family.

4
ACKNOWLEDGMENTS
To God be the glory for the great things he has done in my life.
I am very grateful to my parents, Kwasi and the late Comfort Agyin-Birikorang for
devoting their entire life to their children. I give thanks to my siblings, Emmanuel, Christiana,
Mabel and Kwadwo for their continued support and encouragement. I am indebted to my dear
wife, Elizabeth, and children, Andrew, Anthony, Comfort and Doreen for their love, support, and
for sacrificing so much to ensure that I complete this program successfully.
I wish to express my deepest appreciation to Dr. G.A O’Connor, my major advisor, not
that it is customary to do so but out of a sincere, grateful heart. Dr. O’Connor has not only been
my mentor and friend, but together with Mrs. Donna O’Connor, they made sure my family and I
felt at home in Gainesville. I am greatly indebted to my advisory committee members: Drs. K.R.
Reddy, T.A. Obreza, R.C. Littell and J.C. Bonzongo for making major contributions to my
research and being there for me at all times, even at odd times. Special thanks go to Drs. Don.
Graetz and Andy Ogram of the Soil and Water Science Department at the University of Florida,
and Dr. Gill Brubaker of Particle Engineering and Research Center at the University of Florida
for making their laboratory facilities available for my use. I am grateful to Dr. Lee Jacobs and
Mr. Gary Zehr of Michigan State University for their collaboration in the Michigan field study. I
wish to express my appreciation to Drs. Eric Van Ranst and Fillip Tack of University of Gent,
Belgium, for their continued intrest in my progress and for their encouragement and support. I
am very grateful to Mr. Scott Brinton, Olawale Oladeji, Dr. M.L. Silveira, Dr. K.C. Makris, and
all the members of the Environmental Soil Chemistry Laboratory for their major contribution to
my work and their friendship. I wish to thank the entire faculty, staff and graduate students of the
Soil and Water Science Department for all the help they gave me in diverse ways to make my
stay in the department a memorable one. Last but not the least, I wish to express my profound

5
appreciation to the USEPA (research grant CP-82963801) for funding the research. Thank you
and may God bless you all.
6
TABLE OF CONTENTS page
ACKNOWLEDGMENTS ...............................................................................................................4
LIST OF TABLES...........................................................................................................................9
LIST OF FIGURES .......................................................................................................................11
ABSTRACT...................................................................................................................................14
CHAPTER
1 INTRODUCTION AND LITERATURE REVIEW ..............................................................16
2 CHARACTERISTICS OF FOUR DRINKING-WATER TREATMENT RESIDUALS AND THREE SOILS..............................................................................................................26
Introduction.............................................................................................................................26 Materials and methods............................................................................................................28
Collection of WTRs and Soils Used................................................................................28 Characterization of WTRs and Soils Used......................................................................29 Phosphorus Sorption Isotherms and Pmax of WTR Determination ..................................30 Phosphorus Sorption Kinetics by WTRs Used................................................................31
Results and Discussion ...........................................................................................................32 Physicochemical Characterization of the WTRs.............................................................32 Soil Characterization .......................................................................................................35 Phosphorus Sorption by WTRs .......................................................................................37 Phosphorus Sorption Kinetics by WTRs.........................................................................39
3 STABILITY OF WTR IMMOBILZED PHOSPHORUS: KISSIMMEE FIELD STUDY ...43
Introduction.............................................................................................................................43 Materials and Methods ...........................................................................................................45
Field layout and Amendments Application.....................................................................45 Soil and Amendment Characterizations ..........................................................................46 Periodic Soil Sampling and Analysis ..............................................................................46 Quality Control ................................................................................................................47 Statistical Analyses..........................................................................................................48
Results and Discussion ...........................................................................................................48 Soil and Amendments Characteristics.............................................................................48 Effects of Phosphorus Sources and Rates of Application ...............................................51 Impacts of WTR on Phosphorus Solubility.....................................................................55 Evidence of Field Contamination through Hurricane-induced Flooding ........................60 Stability of WTR immobilized Phosphorus ....................................................................64
7
4 AGING AND pH EFFECTS ON LABILITY OF DRINKING-WATER TREATMENT RESIDUALS (WTR) IMMOBILIZED PHOSPHORUS.......................................................70
Introduction.............................................................................................................................70 Materials and Methods ...........................................................................................................73
Sample Preparation..........................................................................................................73 Thermal Incubation .........................................................................................................74 Wet-and-Dry Incubation..................................................................................................75 Determination of Labile Pools of Phosphorus.................................................................75 Determination of Oxalate Extractable Phosphorus .........................................................76 Quality Control ................................................................................................................76 Statistical Analyses..........................................................................................................77
Results and Discussion ...........................................................................................................77 Relative Effectiveness of the WTRs................................................................................77 Aging and pH Effects on Phosphorus Lability................................................................80 Phosphorus Extractability of Thermally Incubated WTRs .............................................80
Labile Phosphorus Concentration of Thermally Incubated WTR Amended Soil....82 Phosphorus Extractability of Wet-and-Dry-Incubated WTRs ........................................88
Labile Phosphorus Pools of WTR amended Soil Aged via Wetting and Drying ....89 Evaluation of the Aging Techniques ...............................................................................93
5 LONG-TERM PHOSPHORUS IMMOBILIZATION BY A DRINKING-WATER TREATMENT RESIDUAL: MICHIGAN FIELD STUDY ..................................................95
Introduction.............................................................................................................................95 Materials and Methods ...........................................................................................................97
Field Layout and Amendments Application....................................................................97 Soil Sampling ..................................................................................................................98 Laboratory Analyses........................................................................................................98 Statistical Analyses..........................................................................................................99
Results and Discussion ...........................................................................................................99 Extractable Phosphorus, iron and Aluminum over Time ..............................................100 Changes in Water Soluble Phosphorus with Time ........................................................110 Labile Pools of Phosphorus as a Function of pH ..........................................................112
Labile Phosphorus in Control Plots........................................................................112 Effects of WTR Amendments of Labile Phosphorus.............................................113
6 LONG-TERM EFFECTS OF A DRINKING-WATER TREATMENT RESIDUAL ON RUNOFF AND LEACHATE QUALITY............................................................................118
Introduction...........................................................................................................................118 Materials and Methods .........................................................................................................120
Soils and Sampling ........................................................................................................120 Rainfall Simulation Experiment ....................................................................................120 Leachate and Runoff Analyses......................................................................................121 Statistical Analysis ........................................................................................................122
Results and Discussion .........................................................................................................122

8
Runoff and Leachate Concentrations ............................................................................124 Effects of WTR on Runoff and Leachate Phosphorus Losses ......................................127
7 MODELING SOLID PHASES CONTROLING SOLUBILITY OF WTR IMMOBILIZED PHOSPHORUS ........................................................................................135
Introduction...........................................................................................................................135 Materials and Methods .........................................................................................................137
Soil Samples Used.........................................................................................................137 Soil Extraction ...............................................................................................................138 Equilibrium Modeling ...................................................................................................139 Constant Capacitance Modeling....................................................................................140
Results and Discussion .........................................................................................................144 Chemical Speciation of Soil Solutions ..........................................................................144
Field-aged Samples ................................................................................................144 Artificially-aged Samples.......................................................................................146
Solid Phase Equilibria ...................................................................................................151 Field-aged Samples ................................................................................................153 Artificially-aged Samples.......................................................................................157
Predicting P adsorption and desorption by WTRs ........................................................163
8 LONG-TERM STABILITY OF DRINKING-WATER TREATMENT RESIDUALS (WTR) IMMOBILIZED PHOSPHORUS............................................................................170
LIST OF REFERENCES.............................................................................................................177
BIOGRAPHICAL SKETCH .......................................................................................................191

9
LIST OF TABLES
Table page 2-1 General physicochemical properties of drinking-water treatment residuals used.. ...........33
2-2 Selected physicochemical properties of the Michigan soils and the Immokalee sand.. ....36
2-3 Phosphorus sorbed by four drinking-water treatment residuals with time. .......................40
2-4 Determination coefficients of the reaction rates and 2nd order rate constants for the drinking-water treatment residuals used. ...........................................................................41
3-1 Selected chemical properties of amendments utilized in the Kissimmee field study. .......50
3-2 Selected chemical characteristics of the Immokalee soil used in the Kissimmee field study...................................................................................................................................52
3-3 Total- and oxalate (200 mM) extractable phosphorus, iron and aluminum concentrations of soil samples collected from the A horizon (0-5 cm) in June 2003 and Jan. 2004. ....................................................................................................................53
3-4 Total- and oxalate (200 mM) extractable phosphorus, iron and aluminum concentrations of soil samples collected from the A horizon (0-15 cm) in March 2004....................................................................................................................................54
3-5 Water-, iron strip- and Mehlich 1 extractable phosphorus concentrations of soil samples collected from the A horizon (0-5 cm) in Dec. 2004. ..........................................63
4-1 Oxalate (5 mM) extractable phosphorus concentrations measured from the artificially-aged, phosphorus impacted WTR at the initial and final incubation periods................................................................................................................................78
4-2 Oxalate (5 mM) extractable phosphorus concentrations of the artificially-aged, phosphorus impacted WTR amended soil.. .......................................................................79
4-3 Labile phosphorus concentrations of the artificially-aged, phosphorus impacted WTR amended soils.....................................................................................................................80
6-1 Masses of the various phosphorus forms measured in runoff and leachate from both sites of the Michigan field study......................................................................................123
6-2 pH and Electrical conductivity values measured in runoff and leachate from both sites of the Michigan field study......................................................................................123
6-3 Regression equations relating soluble reactive phosphorus of runoff and leachate with Bray-1 phosphorus for Michigan soil samples. .......................................................131

10
7-1 Distribution of major phosphorus chemical species predicted for site 1 of the Michigan field..................................................................................................................147
7-2 Distribution of major phosphorus chemical species predicted for site 2 of the Michigan field..................................................................................................................148
7-3 Distribution of major phosphorus chemical species predicted for the thermally incubated at equilibrated at pH 5.. ...................................................................................149
7-4 Distribution of major phosphorus chemical species predicted for the thermally incubated at equilibrated at pH 7.. ...................................................................................150
7-5 Distribution of major phosphorus chemical species predicted for the thermally incubated at equilibrated at pH 3. ....................................................................................152
7-6 Soil solution saturation indices for phosphorus solid phases predicted for site 1 of the Michigan field..................................................................................................................154
7-7 Soil solution saturation indices for phosphorus solid phases predicted for site 2 of the Michigan field..................................................................................................................155
7-8 Soil solution saturation indices for phosphorus solid phases predicted for the thermally incubated at equilibrated at pH 5.....................................................................159
7-9 Soil solution saturation indices for phosphorus solid phases predicted for the thermally incubated at equilibrated at pH 7.....................................................................160
7-10 Soil solution saturation indices for phosphorus solid phases predicted for the thermally incubated at equilibrated at pH 3.....................................................................162

11
LIST OF FIGURES
Figure page 2-1 Phosphorus sorption isotherms of four drinking-water treatment residuals ......................38
3-1 Differences in degree of phosphorus saturation from the Kissimmee A horizon samples taken in June 2003 and Jan. 2004.. ......................................................................57
3-2 Differences in water extractable phosphorus values from the Kissimmee A horizon samples taken in June 2003 and Jan. 2004... .....................................................................58
3-3 Differences in the total iron and aluminu concentrations from the Kissimmee A horizon samples taken in June 2003 and Jan. 2004.. .........................................................59
3-4 Changes in total phosphorus values from the Kissimmee A horizon samples taken from June 2003 to Dec.2004..............................................................................................61
3-5 Changes in total iron and aluminum concentrations from the Kissimmee A horizon samples taken from June 2003 to Dec.2004. .....................................................................62
3-6 Differences in iron strip phosphorus values from the Kissimmee A horizon samples taken in Dec. 2004.. ...........................................................................................................65
3-7 Differences in water extractable phosphorus values from the Kissimmee A horizon samples taken in Dec. 2004... ............................................................................................65
3-8 Differences in total iron and aluminum concentrations from the Kissimmee A horizon samples taken in Dec. 2004.. ................................................................................66
3-9 Differences in degree of phosphorus saturation values from the Kissimmee A horizon samples taken in Dec. 2004.. ................................................................................67
3-10 Changes in total phosphorus concentrations from the Kissimmee Bh horizon samples taken from June 2003 to Dec.2004.. ..................................................................................68
4-1 Changes in the mean oxalate (200 and 5 mM)-extractable phosphorus concentrations of the phosphorus impacted aluminum-based WTR with thermal incubation time. .........81
4-2 Changes in labile phosphorus concentrations of thermally incubated, phosphorus impacted Immokalee soil samples as a function of pH......................................................83
4-3 Changes in labile phosphorus concentrations of phosphorus impacted Immokalee soil samples as function of pH..................................................................................................85
4-4 Changes in labile phosphorus concentrations of thermally incubated, phosphorus impacted Immokalee soil samples as function of pH. .......................................................85
12
4-5 Changes in labile phosphorus concentrations of thermally incubated, phosphorus impacted Immokalee soil samples with time .....................................................................86
4-6 Changes in oxalate (5 mM)-extractable phosphorus concentrations of thermally incubated WTR amended Immokalee soil. ........................................................................87
4-7 Changes in the mean oxalate (200 and 5 mM)-extractable phosphorus concentrations with incubation time (incubation through wetting and drying). ........................................88
4-8 Changes in labile phosphorus concentrations as a function of pH for the Immokalee soil samples incubated via wet-and dry cycles for 2 years. ...............................................89
4-9 Changes in labile phosphorus concentrations as a function of impacted phosphorus levels for Immokalee soil samples artificially aged via wet-and dry cycles for 2 years. ..................................................................................................................................90
4-10 Changes in labile phosphorus concentrations with time for the Immokalee soil samples aged through wet-and dry cycles. ........................................................................91
4-11 Changes in oxalate (5 mM)-extractable phosphorus with incubation time of the phosphorus impacted Immokalee soil samples..................................................................92
4-12 Relationship between labile phosphorus concentrations of the WTR amended phosphorus impacted samples incubated either thermally or via wetting and drying. .....94
5-1 Changes in total phosphorus concentrations of the Michigan soil samples with time ....101
5-2 Changes in oxalate (200 mM) - extractable phosphorus concentrations of the Michigan soil samples with time. ....................................................................................102
5-3 Changes in oxalate-extractable iron and and Aluminum concentrations of the Michigan soil samples with time. ....................................................................................104
5-4 Phosphorus saturation ratio values of the Michigan soil samples with time. ..................105
5-5 Changes in Bray-1 phosphorus values of the Michigan soil samples with time. ............108
5-6 Changes in Oxalate (5mM) extractable phosphorus values of the Michigan soil samples with time ............................................................................................................109
5-7 Changes in water soluble phosphorus values of the Michigan soil samples with time. ..111
5-8 Changes in labile phosphorus concentrations of the Michigan soil samples with time...114
5-9 Changes in labile phosphorus concentrations of the Michigan soil samples as a function of pH..................................................................................................................115
5-10 Changes in labile phosphorus concentrations of the Michigan soil samples equlubrated at pH 3..........................................................................................................116
13
6-1 Relationship between soluble reactive phosphorus and water soluble phosphorus for the first rainfall event. ......................................................................................................125
6-2 Total dissolved phosphorus masses of the various dissolved phosphorus forms of the Michigan soil samples......................................................................................................128
6-3 Relationship between runoff bioavailable phosphorus and molar oxalate extractable iron and aluminum content of the Michigan soil samples. ..............................................129
6-4 Flow-weighted total dissolved phosphorus concentrations of the Michigan soil samples.............................................................................................................................130
6-5 Percentages of total phosphorus mass loss represented by the various phosphorus forms. ...............................................................................................................................132
6-6 Flow-weighted bioavailable phosphorus loads in runoff of the Michigan soil samples.............................................................................................................................133
7-1 Phosphorus “adsorption envelope” of aluminum-based WTR system............................166
7-2 Phosphorus “adsorption envelope” of iron-WTR system...............................................167
7-3 Phosphorus adsorption isotherms on aluminum-WTR system for the experimental data and the model prediction ..........................................................................................168
7-4 Relationship between adsorbed and desorbed phosphorus by aluminum- and iron-WTRs equilibrated at pH 6. .............................................................................................169

14
Abstract of Dissertation Presented to the Graduate School of the University of Florida in Partial Fulfillment of the Requirements for the Degree of Doctor of Philosophy
LABILITY OF DRINKING-WATER TREATMENT RESIDUALS (WTR) IMMOBILIZED PHOSPHORUS: IMPLICATIONS FOR LONG-TERM STABILITY
By
Sampson Agyin-Birikorang
December 2006
Chair: George A. O’Connor Major Department: Soil and Water Science
Drinking-water treatment residuals (WTR) are by-products of the drinking-water treatment
process and are physical mixtures of aluminum or iron hydr(oxides) that originate from
flocculant (aluminum or iron salts) additions made during the processing of drinking-water.
Short-term studies have demonstrated WTR efficacy in reducing soluble phosphorus (P)
concentrations in runoff and leaching from P-impacted soils. However, the long-term stability of
P sorbed by WTR has only been qualitatively addressed in laboratory experiments. Field
experiments and other approaches to accurately quantify P lability were needed to test WTR
efficacy in reducing soluble P concentrations and to confirm trends observed in, or inferred from,
laboratory studies. We artificially aged WTR amended soils either through repeated wetting and
drying for two years, or via elevated temperatures (46 and 70 degree Celsius) for 4.5 years, to
simulate natural long-term weathering processes that could influence the stability of sorbed P.
Then using a modified isotopic dilution technique, coupled with a stepwise acidification
procedure, we evaluated the changes in lability of WTR immobilized P due to aging and changes
in pH. We also monitored the longevity of WTR effects on P lability for 7.5 years from one-time
WTR amended manure-impacted soils at two sites. Amendment with WTR reduced labile P
concentration in the artificially-aged sample by at least 70% and in field sites by at least 60%.

15
The WTR immobilized P was stable within pH range of 4 – 7 throughout the aging and
monitoring periods. The combined data from the field study and the laboratory aging
experiments suggest that WTR amendment should reduce P losses from P-impacted soils, and do
so for a long time. To confirm this, we investigated P losses in runoff and leachate from P-
impacted soils, 7.5 years after WTR application. Amendment with WTR decreased total
dissolved P and bioavailable P masses in runoff and leachate by more than 50%. From the
various studies, we conclude that WTR is an effective amendment to control labile P in P-
impacted soils and that WTR immobilized P is stable and will remain fixed for a long time,
independent of common soil pH values.
16
CHAPTER 1 INTRODUCTION AND LITERATURE REVIEW
Intense agricultural activities often result in excessive phosphorus (P) inputs to soils. Large
P inputs rarely have negative agronomic effects, but can degrade water quality. Phosphorus loss
from soils is one of the major factors responsible for accelerated eutrophication of surface waters
in many locations in Florida and other eastern states of USA where soils that retain P poorly are
abundant. These sandy (coarse-textured) soils not only sorb P poorly, but are often accompanied
by high water tables. The combination of these characteristics makes such soils vulnerable to P
losses and negative impacts on water quality (He et al., 1999; Novak et al., 2000). The Lake
Okeechobee and Kissimmee watersheds, for example, have prolonged history of using P sources
such as P fertilizers, manures and biosolids to increase soil fertility and crop yields. Applications
of organic sources of P are typically based on crop nitrogen (N) requirements, which usually
provide P in excess of crop needs. Off-site migration of P to surface waters is a major concern
because P is the limiting nutrient for eutrophication of most freshwaters, leading to algal blooms
and growth of aquatic weeds (Elliott et al., 2002 a,b). Besides being unsightly and rendering
surface waters unfit for recreation, aquatic plants can clog water treatment filters and, upon plant
death and subsequent decomposition, cause fish kills due to decreased oxygen levels in the fresh
water. Some algae produce toxins that can result in death if ingested by animals (Sharpley et al.,
1994). Fish kills have also resulted from outbreaks of the bacteria Pfiesteria piscicida (Kratch,
1997). These dinoflagellates cause lethal lesions on fish and have been linked to skin rashes,
respiratory problems, and memory loss among people who come in contact with water
containing these algae. Usually the microbes are not toxic, but excessive P loadings into water
bodies promote the production of the toxic form of Pfiesteria (Kratch, 1997). In the fall of 1997,
after a particularly bad outbreak of Pfiesteria along the east coast, the popular press blamed the

17
poultry producers and land application of poultry manure for accelerated eutrophication of
surface waters (Kratch, 1997).
Soils in the Lake Okeechobee and Kissimmee watersheds (e.g., Immokalee sand and
Myakka sand) sorb P poorly and, thus, there is concern that large P inputs to the soils represent
an increased risk for nonpoint-source pollution of surface waters (Elliott et al., 2002 a,b;
O’Connor et al., 2002). One suggested way to mitigate this problem is to increase the P sorption
capacity of soils in the watershed by amending the soils with drinking-water treatment residuals
(WTRs), the residues from municipal water treatment plants (O’Connor et al., 2002; Makris and
O’Connor, 2006).
Drinking-water treatment facilities produce millions of liters of potable water every day.
The process of producing potable water from surface water supplies typically involves
coagulation and flocculation of suspended solids. The precipitated material is separated by
filtration or gravity and the solid material is known as drinking-water treatment residual (WTR).
Common coagulants include aluminum sulfate (A12(SO4)3), ferric chloride (FeC13), ferric sulfate
(Fe2(SO4)3) and calcium carbonate (CaCO3). Although new drinking-water treatment
technologies (membrane separation, ion exchange, precipitative softening, granular activated
carbon, and disinfection/UV) have emerged, there are still over 1000 drinking-water treatment
plants in the United States which use alum, Al2(SO4)3·14H2O, as a coagulant for efficient
removal of particulate solids and colloids from surface water supply. More than 2 million metric
tons of WTR are generated daily from drinking-water treatment plants (Prakash and SenGupta,
2003). Alum is converted during the coagulation process into insoluble aluminum hydroxide, a
major component (50-75%) of the solids in WTR, along with suspended inorganic particles,
natural organic matter, and trace amounts of heavy metal precipitates (Prakash and SenGupta,

18
2003). Drinking-water treatment residuals can be disposed: a) directly to a receiving stream; b)
to sanitary sewers; c) to a landfill, assuming that the residual contains no free-draining water and
does not have toxic characteristics as defined by the TCLP test; and d) by land application
(Chwirka et al., 2001). A 1991 survey of 612 utilities serving populations of > 50,000 showed
that landfill disposal was the predominant disposal method followed by land application >
sanitary sewer disposal > direct stream discharge > lagooning (Kawczyinski and Achtermann,
1991). In the state of Florida, the most acceptable long-term disposal method of WTRs is
landfilling (Townsend et al., 2001) and land application (O’Connor et al., 2005). The disposal
(via landfill) cost of non-hazardous WTRs is estimated at < $50 Mg-1 (Meng et al., 2001). Land
application is an attractive and less expensive alternative means of WTRs disposal and may have
the added benefit of immobilizing P in poorly P-sorbing soils. Land application of WTRs can be
a cost-effective treatment for effectively sorbing excess levels of labile P in soils. The high
amorphous aluminum (Al) or iron (Fe) content of the WTRs can increase a soil’s P sorption
capacity (Elliott et al., 1990; Novak and Watts, 2004; Dayton and Basta, 2005; Rhoton and
Bigham, 2005). Land-application of WTRs can significantly reduce runoff-P from agricultural
fields. Haustein et al. (2000) documented decreasing soluble P concentrations in runoff from
fields excessively high in soil test P following amendment with an Al-WTR (rates up to 18 Mg
ha-1). Gallimore et al. (1999) applied an Al-WTR to poultry litter-amended soils, and reduced
soluble P in surface runoff. Peters and Basta (1996) significantly reduced (~ 50 % of the initial
values) soil test-extractable P concentrations of an acidic and a calcareous soil incubated with
high loading rates of two Al-WTRs (~ 60 and 200 Mg ha-1).
Because of the wide variation among the drinking-water treatment procedures and source
waters, each WTR is unique, making it difficult to predict P sorption based on water treatment

19
method alone. A better approach is to identify the WTR components responsible for P sorption.
A comprehensive study (Dayton et al., 2003), generated by a 17 hour batch equilibration, using
21 Al-based WTR from Oklahoma utilities, examined WTR chemical components related to P
sorption. The P sorption maxima (Pmax) of the WTRs were related to amorphous Al-oxide (Alox)
concentrations (Dayton et al., 2003). However, further studies showed these short-term
equilibration studies greatly underestimated the true adsorption capacity of WTRs (Ippolito, et
al., 2003; Dayton and Basta, 2005; Makris et al., 2005).
O'Connor et al. (2002) showed that P movement from P-enriched sandy soils to freshwater
supplies is reduced when the soils were treated with WTRs. The primary purpose of their study
was to investigate the ability of three WTRs produced in Florida to reduce soluble P levels in
Florida soils amended with fertilizer, manure, and biosolids-P sources. Phosphorus was
hypothesized to be immobilized by specific adsorption and /or precipitation. The Al-WTR used
had an especially large P-sorption capacity of at least 5000 mg P kg-1. Sorption of P by the Al-
WTR and a Fe-WTR was independent of pH (4-8), and essentially irreversible. The combined
data suggested that WTRs could be effective amendments to improve P retention in poorly P-
sorbing Florida soils when applied at practical rates of several Mg ha-1. Brown and Sartain
(2000) showed that a 25 g kg-1 Fe-WTR application rate significantly reduced P leaching from
applied fertilizer P, with minimal negative impact on bermudagrass (Cynodon dactylon) P
uptake. Thus, WTR can be a cost-effective amendment for immobilizing P in contaminated sites.
Elliott et al. (2002b) compared the ability of water treatment residuals {aluminum sulfate
(Al-WTR), and ferric sulfate (Fe-WTR), a lime softening residual (Ca-WTR)} and pure hematite
to alter P solubility and leaching in low P-sorbing, Immokalee sand amended with dewatered
biosolids and triple superphosphate (TSP) fertilizer. In the absence of WTRs, 21% of TSP total P

20
and 11% of biosolids total P leached from laboratory columns over 4 months. When co-applied
with WTRs, the losses from TSP treated columns were reduced to 3.5% (Fe-WTR), 2.5% (Ca-
WTR) and < 1% (Al-WTR) of applied P. For the biosolids treatments, all WTRs retarded
downward P flux such that leachate P was not statistically different from those of the control
(soil only) columns.
Alum additions to poultry litter are known to reduce P solubility and reduce P losses from
poultry litter-amended soils (Peters and Basta, 1996; Moore, 1998; Gallimore et al., 1999).
Aluminum-WTR was expected to be equally effective and less expensive than alum. Laboratory
work confirmed that alum and Al-WTR, on a per mole of oxalate-extractable Al basis, were
equally effective in controlling P solubility (Makris et al., 2005c). Thus, when Al-WTR is
available, its use can reduce costs associated with alum, and when Al-WTR is in short supply,
alum may be substituted to meet the Al demand for P solubility control.
Phosphorus sorption kinetics by WTRs exhibit a slow phase that followed a rapid initial
phase, as typically occurs with metal hydroxides (Makris et al., 2005a, b; Makris and Harris,
2006). The slow phase continued for at least 80 d, and suggested continued slow penetration of P
into the WTR structure. Electron microprobe analysis of cross-sectional, P-treated particles
suggested three-dimensional P sorption that was time-limited by P diffusion through abundant
microporosity in the WTRs (Makris et al., 2004a). Estimates of the effective P diffusion
coefficient were very small (Makris et al., 2004b) and consistent with the slow P-sorption
kinetics once surface sites (fast kinetics) were occupied.
Two main concerns with the land application of WTRs are the potential for induced plant P
deficiencies and Al toxicity (Basta et al., 2000). Studies have shown that application of WTR >
10g WTR kg-1 (~20 Mg WTR ha-1) reduced tissue P concentrations, but did not induce other

21
nutrient deficiencies or toxicities (Elliott and Singer, 1988; Heil and Barbarick, 1989; Cox et al.,
1997). Harris-Pierce et al. (1993) reported minimal negative effects of WTR (5.6 to 22.4 Mg ha-
1) and biosolids (11.2 Mg ha-1) co-applied on native rangeland vegetation. Gallimore et al. (1999)
found that land application of WTR at rates of 11.2 and 44.8 Mg ha-1 did not increase dissolved
solids or Al in surface runoff. Haustein et al (2000) reported no significant increase of dissolved
Al in surface runoff of Al-WTR amended soils (2.2 to 18 Mg ha-1). Equilibrium soluble Al
concentrations in the Al-WTR systems were usually less than 1 mg L-1 (and decreased further as
Al-WTR rates increased), suggesting minimal Al phytotoxicity hazard.
Short-term lab, greenhouse, and rainfall simulation studies have demonstrated WTR
efficacy in reducing soluble P concentrations in runoff (Basta and Storm, 1997; Dayton et al.,
2003; Novak and Watts, 2004; 2005; Dayton and Basta, 2005; Elliott et al., 2005), and leaching
(Elliott et al., 2002a; Silveira et al., 2006) from soils impacted with animal manure.
Concentrating the WTRs in strips of land, rather than applying the residuals to an entire
watershed, reduces the amount of WTR needed while protecting surface waters from P pollution
(Basta et al., 2003). The authors concluded that such buffer strips are a best management practice
to reduce surface water pollution, and the effectiveness of the strips can be greatly improved by
amendment with WTRs (Basta et al., 2003). Silveira et al. (2006) reported that mixing WTRs
with a manure-impacted Spodosol reduced soluble P concentration in leachates by as much as
99.8%, compared with samples without WTR.
The long-term stability of sorbed P on soil oxide components, however, is an issue that has
not been thoroughly explained or documented. Time constraints associated with conducting
long-term (> 20 years) field experiments to test the stability of soil metal oxides inhibit improved
understanding of the fate of sorbed oxyanions in soils. Investigations of the long-term P
22
immobilization capacity of WTRs are necessary, as well as studies of management practices that
will enhance stable immobilization of P without adversely affecting the productivity of
agricultural soils.
Several approaches can be used to address the long-term stability of solid phase-
immobilized contaminants, including chemical extractions, spectroscopic measurements,
equilibrium (modeling) calculations, and the use of radioisotopes to quantify contaminant
lability. The various approaches require samples of various “ages” to address long-term stability.
The use of radioisotopes has significantly assisted in the study of the behavior of both
nutrient and toxic elements in soil (Hamon et al., 2002). Many elements have useful
radioisotopes that can be used to study retention and plant uptake processes in soil. Several
researchers have used the isotopic dilution methodology to quantify element partitioning
between labile and non-labile pools (Fujii and Corey, 1986; Gao et al., 2004). The isotopic
exchange (E-value) method has been applied successfully to investigate the stability of solid-
phase associations of various elements (Fujii and Corey, 1986; Hamon et al., 2002; 2004; Lombi
et al., 2003; Gao et al., 2004). Isotopic dilution techniques can provide insight into changes in the
distribution of P between labile (isotopically exchangeable) and fixed (nonisotopically
exchangeable) pools following incorporation of remediation materials.
The use of isotopes to assess the solid ⇔ solution phase partitioning of elements in soils
relies on the following principles: (a) that addition of the isotope does not perturb the equilibrium
of the system because only a negligible quantity of isotope is introduced and (b) that the isotope
behaves exactly as the natural element in the soil (Hamon et al., 2002). Assuming these
principles hold, an isotope introduced to a soil will partition such that, at time t = ∞, Cs/Ctot =
Is/Itot, where C and I are the concentrations of element and introduced isotope, respectively, in

23
solution (s) and total (tot) in the soil. At any given time t<∞, the extent of isotope partitioning to
the solid phase indicates the exchangeability (lability or E value) of the element associated with
the solid phase (Hamon et al., 2002).
Several researchers have used the isotopic exchange and dilution techniques as useful tools
to examine the lability of metals in soils (Fujii and Corey, 1986; Hamon et al., 2002; 2004;
Lombi et al., 2003; Gao et al., 2004). When isotopic tracers are added to soil solution, they
rapidly exchange with the surface-bound metal that is in direct equilibrium with the soil solution.
In contrast, metals tightly held in crystalline mineral precipitates or occluded in mineral lattices
are only very slowly exchangeable (Hamon et al., 2002; Lombi et al., 2003). The labile pool (Ea)
of the metal is calculated as follows
Ea = (Csol / C§sol) * R * (V/W) (1)
where Csol is the concentration of the metal in solution (µg mL-1), C§sol is the
concentration of radioisotope (Bq mL-1) remaining in solution after the equilibration time, R is
the total amount of the radioisotope that was added to the sample (Bq mL-1), and V/W is the ratio
of solution to sample. The amount of isotopically exchangeable metal associated specifically
with the solid phase (Ee) is calculated as follows
Ee = (Csol / C§sol) * (R - C§
sol) * (V/W) (2)
The samples to evaluate long-term stability of WTR immobilized-P can be obtained from
long-term field studies or from laboratory studies of artificially-aged materials. Artificial aging
can be accomplished using elevated temperatures (Ford et al., 1997; Makris et al., 2005c), or
repeated wetting and drying cycles, (Kennedy et al., 2004). Incubation at elevated temperatures
or repeated wetting and drying results in dissolution, crystallization and re-crystallization of
metal oxides (Ma and Uren, 1997). Aging results in the transformation of the metal oxides, and
24
eventually affects their sorption capacities. Temperature controls the transformation of
amorphous to crystalline solid phases. Hematite formation is optimum at temperatures > 90°C,
whereas goethite can be optimally synthesized at temperatures < 40°C (Schwertmann and
Cornell, 1991). Work done by Kennedy et al. (2004) showed that repeated wetting and drying
induces structural changes in metal oxides.
Makris (2004) utilized both field and artificially-aged (through thermal incubation)
samples and applied chemical extractions and spectroscopic approaches to study the stability of
WTR- immobilized P. His work showed that adsorption of P by WTRs was strongly hysteretic.
Once sorbed in the internal micropores of WTR, P release is unlikely because of very high
bonding energy of P to surfaces and structural limitations to P movement through “bottle-necks”
consisting of complex metal-organic C assemblages (Makris, 2004). Samples of WTRs and
WTR amended soils were thermally incubated to artificially “age” the materials, and to
encourage reactions expected to occur in the field in the long-term. Both spectroscopic and
chemical (extractants) techniques were utilized to characterize the “aged” samples. Collectively,
the data supported earlier conclusions that immobilized-P is stable; in particular, there were no
indications that heat-induced reorganization of amorphous WTR structures caused P to be
excluded (released) from the structure (Makris, 2004). Though spectroscopic studies showed no
crystallinity of the WTR aged at elevated temperatures, Makris (2004) suggested that elevated
temperatures accelerated diffusion of the sorbed P into the micropores of the WTR and that
structural changes prevented the sorbed P from being released. The thermal incubation data,
however, did not show any pronounced differences in spectroscopic characteristics between the
samples incubated at room temperature (23 oC) and those incubated at elevated temperatures (70
oC). Chemical analysis of field samples of both the control (unamended) and the WTR
25
treatments showed a reduction in desorption of the sorbed P. These results suggest that a
different approach is needed to determine the solubility of the sorbed P over time to precisely
predict the long-term stability of the WTR-sorbed P.
Additional approaches include the use of radioisotopes (32P) to investigate the lability of
the WTR-sorbed P as a function of soil pH; chemical equilibrium modeling to predict possible
solid phases (if any) controlling the solubility of the WTR immobilized P, and runoff studies
(via rainfall simulation) to determine the longevity of WTR immobilization of P. This additional
information should improve our ability to predict the long-term stability of the WTR-sorbed P.
Appropriate hypotheses were formulated as follows:
• H1. Soil amendment with WTR will reduce P solubility in P impacted soils under natural (field) conditions.
• H2. Aging will induce changes in the nature of WTR-P binding that will prevent desorption of WTR immobilized P.
• H3. Sorbed P will remain unaffected by reasonably anticipated changes in important soil parameters (e.g. pH).
• H4. WTR application will reduce labile P concentrations in runoff and leachate, thus improving runoff and leachate quality.
• H5. Stable Al- and Fe-phosphate minerals will control solubility of WTR immobilized P, thus ensuring that WTR immobilized P remains stable in the long-term.
The overall objective is to assess the long-term stability of WTR immobilized P. Specific
objectives addressed in this dissertation are to:
• evaluate changes in lability of WTR immobilized P with time
• determine pH effect on lability of WTR immobilized P
• assess the stability and longevity of WTR immobilized P under field conditions
• evaluate long-term effectiveness of WTR in improving leachate and runoff quality
• predict solid phases controlling solubility of WTR immobilized P, and evaluate the stability of the predicted solid phases.
26
CHAPTER 2 CHARACTERISTICS OF FOUR DRINKING-WATER TREATMENT RESIDUALS AND
THREE SOILS
Introduction
Drinking-water treatment plants use different water sources and different chemicals (types
and rates) as coagulants. Thus, the WTRs produced by different drinking-water treatment plants
and at different times by the same drinking-water treatment plants can have widely different
physical characteristics, elemental compositions and sorption capacities (Makris and O’Connor,
2006). Drinking-water treatment residuals are commonly characterized by broad particle size
distributions. Very coarse fragments (> 2 mm) exist in small numbers, and the greatest number
of WTR particles is usually found in the micrometer (1 - 5 µm) size range (Makris and
O’Connor, 2006). The broad size distribution is evidenced by the predominance of large amounts
(% number distribution) of small particles (0.1 - 10 µm) (Makris, 2004).
Elliott et al. (2002b) explained differences in P-fixing capacities of an Al- and a Fe-WTR
by variations in the reactive Fe- and Al-hydroxide contents, as measured by oxalate extraction.
Their results indicated that an Al-WTR was more effective in sorbing P than a Fe-WTR. Dayton
et al. (2003) found that variations in oxalate-extractable Al concentrations of 20 Al-WTRs
explained differences in runoff-P reductions by WTRs (r2 = 0.69, quadratic model). However,
Dayton et al. (2003) used short (15 h) equilibration times and modest initial P loads (up to 2,500
mg kg-1). A recent attempt to improve P sorption maxima predictions for the same Al-WTRs
utilized a different solid:solution ratio (1:100), smaller size aggregates (< 150 µm), and longer
equilibrations times (6-d), and resulted in a significant (r2 = 0.91) linear relationship between
oxalate-extractable Al and P sorption maxima (Pmax) for Al-WTRs (Dayton and Basta, 2005).
Similar work was not conducted for either Fe-, or Ca-based WTRs. Surprisingly, the linear
model reported by Dayton and Basta (2005) suggests significant P retention (11.3 g kg-1) at zero
27
oxalate extractable Al. Thus, the empirical regression model predicts that a material with
negligible oxalate-extractable Al concentrations would sorb more than 1 % soluble P (1.1 %). In
a long-term (up to 80 days) P sorption study utilizing P loads of 10,000 mg kg-1 and 7 Fe-, and
Al-based WTRs (< 2-mm), no significant correlation existed between oxalate-extractable Fe +Al
concentrations with P sorption maxima for the 7 WTRs, despite the high oxalate extractable Fe
and Al levels (Makris et al., 2005a). Oxalate-extractable [Fe+Al] accounted for 50 to 65 % of
total [Fe+Al] for the Fe-WTRs and 80 to 90 % of total [Fe+Al] for Al-WTRs (Makris et al.,
2005a).
Phosphorus sorption maxima differ among WTRs with contrasting physicochemical
properties. Dayton et al. (2003) reported a wide range in P sorption among 21 WTRs (0.5 - 5.0 g
kg-1). The authors suggested that the large variability in WTR sorption was probably due to
differences in water treatment processes (i.e. how much coagulant was used) and differences in
particle size distribution (Dayton et al., 2003). Phosphorus sorption experiments (25 oC) with one
Al-WTR showed a maximum P sorption capacity of 12.5 g kg-1 (Ippolito et al., 2003). Butkus et
al. (1998) were able to load a Fe-WTR with ~ 20 % P by wt. (200 g kg-1). Makris (2004) reacted
Al- and Fe-WTR particles with inorganic P solutions at P loads up to 10 g P kg-1. Almost all of
the added P was sorbed by most WTRs, although some WTRs sorbed little P.
There are two contrasting views about P sorption kinetics by WTRs. Makris et al. (2005a)
suggested that P sorption kinetics of WTRs are usually biphasic. Novak and Watts (2005), on the
other hand, suggested that first order kinetics adequately describe the reactions. Nevertheless,
both models suggest that P sorption reactions with < 2-mm WTR particles may not reach
equilibrium in short contact times (up to 1 or 2 days).
28
The WTRs utilized in the study were obtained from different drinking-water treatment
plants, and the WTRs were expected to have different physicochemical characteristics and
different P sorption kinetics. The objectives of this work were, therefore, to characterize the
WTRs used in this study, ascertain their P sorption kinetics and characterize the soils used to
know their initial physicochemical properties before applying any amendment.
Materials and methods
Collection of WTRs and Soils Used
Four WTRs were used in this study: three were Al-based, and one was Fe-based. The Al-
WTRs were obtained from one water treatment plant in Bradenton, Florida, one plant in Holland,
Michgan, and one plant in Lowell, Arkansas. The Fe-WTR was obtained from a plant in Cocoa
Beach, Florida.
The Bradenton WTR was used in a joint South Florida Water Management District
(SFWMD) and Florida Department of Environmental Protection (FDEP) project in Kissimmee
watershed, FL, seeking to control P loss in surface runoff and leachates. The material was
obtained from the Manatee Co. water treatment plant in Bradenton, FL. Samples of the WTR,
similar (in chemical characteristics) to the one that was land-applied in the field study were
shipped to our laboratory in 2004. Another Al-WTR used came from the Holland, MI water
treatment plant. This material is produced by alum addition to raw water. The material was used
in a field experiment at Holland, MI to evaluate the longevity (~7.5 years) of WTR effects in
waste-amended soils high in soil test P levels. Subsamples were transferred to our laboratory
from the initial stockpile that was land-applied in 1998 (Jacobs and Teppen, 2000). The third Al-
WTR came from the Beaver Water treatment plant in Lowell, AR. This material was
successfully used to reduce runoff-P in rainfall simulation plots of soils (Haustein et al., 2000)
with high soil test P levels. However, a different batch than the one used by Haustein et al.

29
(2000) was shipped to us, as was later evidenced by differences in chemical composition. The
Fe-based WTR came from the Taylor Creek Surface water treatment plant, Cocoa Beach, FL,
where iron sulfate is coupled with powdered activated carbon (PAC), (100 tonnes) and polymer
(7 tonnes) additions, annually.
Soils from three field sites were used for the various studies: One site located at
Immokalee, FL and two field sites (sites 1 and 2) located in western Michigan were used for this
study. Native Immokalee sand (sandy, siliceous, hyperthermic Arenic Alaquods) samples not
contaminated by manure depositions and having ‘very low’ soil test P and very coarse texture
were collected from the University of Florida Research and Education Center in Immokalee, FL.
Multiple random samples were collected from the A horizons (0-15 cm), and were thoroughly
mixed to yield a composite sample. The two test sites in Michigan (Jacobs and Teppen, 2000)
were selected in 1998 for evaluation of WTR effects on P extractability in soils having “very
high” Bray-1 soil test P concentrations. Soils from both sites have a long-term (> 10 yr) history
of heavy chicken manure applications (actual application rates unknown). Soil at site 1 was a
Granby fine sandy loam (sandy, mixed, mesic Typic Endoaquolls) with “very high” Bray-1 soil
test P levels of 265 mg kg-1. Soil at the second site was Granby loamy sand (sandy, mixed, mesic
Typic Endoaquolls) with an even greater soil test P value of 655 mg kg-1.
Characterization of WTRs and Soils Used
Samples of both soils and WTRs were air-dried and passed through a 2 mm sieve before
analyses. Particle size distribution of the samples was determined by the pipette method (Day,
1965). The pH of both WTR and soil samples was determined in a 1:2 WTR to 0.01 M CaCI2
solution using a glass electrode (McLean, 1982). Electrical conductivity (EC) of the WTR was
determined in a 1:2 WTR to deionized water solution (Rhoades, 1996). Total C and N of both
WTR and soil samples were determined by combustion at 1010 oC using a Carlo Erba NA-1500
30
CNS analyzer. Soluble reactive P (SRP) in the WTR was measured in a 0.01 M KCl solution at a
1:10 solid:solution ratio, after 40 days reaction, whereas the SRP of the soil samples was
measured after reaction for 24 hours. Extracts were filtered (Whatman No 42) and analyzed
colorimetrically for P with the Murphy and Riley (1962) method. Total P, Fe, and Al in both
WTR and soil samples were determined by ICP-AES (Perkin-Elmer Plasma 3200) following
digestion according to the EPA Method 3050A (USEPA, 1986). Oxalate (200 mM) extractable
P, Fe, and Al of both the WTR and soil samples were determined by ICP-AES after extraction at
a 1:60 solid:solution ratio, following the procedures of Schoumans (2000). Oxalate-extractable
Fe and Al represent noncrystalline and organically complexed Fe and Al present in the solid
(McKeague et al., 1971). Values of the P saturation ratio (PSR) (Maguire et al., 2001), and P
saturation index (PSI) (Elliott et al., 2002a) were calculated for the soils and WTRs, respectively.
These indices are similar to the degree of P saturation (DPS) index, but omit the saturation
factor, α (α = 0.3-0.5) in the ratio (Schoumans, 2000). Small PSR and PSI values (< 0.1) suggest
excess P sorption capacity and limited P lability.
Typical QA / QC protocols of matrix spike (5 % of the set) recoveries were used in all the
experiments. Method reagent blanks, certified check standard analyses, and new standard curves
for each set of samples were used.
Phosphorus Sorption Isotherms and Pmax of WTR Determination
Statistical analyses of the P sorption means versus incubation time showed that three of the
four WTRs reached equilibrium conditions after 96 hours. Consequently, the Pmax, values for
each WTR were determined by using a modified batch equilibration technique (Nair et al.,
1984), which involved conducting the incubation for 96 instead of 24 hours. One gram (oven-dry
equivalent) samples of each air-dry WTR (<2mm diameter) were respectively placed into
triplicate 25-ml glass centrifuge tubes. Ten milliliter of solution containing the appropriate

31
amount of inorganic P (250 to 1000 mg P L-1) was added to each tube. The inorganic P solutions
were made from KH2PO4 dissolved in 0.01 M CaC12. After the 96-hour equilibration, solutions
were filtered through a 0.45µm filter membrane and P was determined colorimetrically (Murphy
and Riley, 1962). The P lost from the initial solution was assumed to be sorbed to the soil. The P
sorption isotherms were plotted by using the mean quantity of P sorbed (Q, mg g-1) and the mean
equilibrium P concentration (C, mg L-1). The sorption data were also plotted by using the linear
version of the Langmuir equation:
C/Q = (1/Pmax)(C) + 1/(k)(Pmax)
where Pmax (mg g-1) is the P sorption maxima, and k (L mg-1) is a sorption constant relative
to P binding energy (Olsen and Watanabe, 1957).
A linear regression analyses was performed between C and C/Q, and Pmax values were
calculated from the inverse of the slope from the regression equation. Previously sorbed P was
subtracted from all isotherms values before plotting to obtain corrected Pmax values.
Phosphorus Sorption Kinetics by WTRs Used
Representative air-dried (< 2 mm) samples of the WTRs were reacted for 1, 7, 14, 21, 28,
35 and 42 days with P solutions that resulted in P loads of 2,500 to 10,000 mg P kg-1 in a 1:10
WTR:0.01 M KCl suspensions. The same tests allowed determination of P sorption capacities
and kinetics of P retention by the materials at 23 ± 2 oC. The selection of the above range of P
loads was based on sorption experiments reported by Dayton et al. (2003), Makris et al. (2005b)
and Novak and Watt (2005). Initial P concentrations far exceed those typically found in P-
enriched soils, but were selected to account for cases where repeated annual P-source
applications or dairy-impacted systems occur. The pH was not controlled and suspensions were
not shaken during the equilibration period. No mechanical energy (shaking) was applied to the
samples since shaking is not a field process and Makris (2004) observed no significant difference

32
in P sorption after 10 days between shaken and non-shaken samples. Following the reaction
periods, suspensions were centrifuged, filtered (0.45 µm), and analyzed for P colorimetrically
using the method of Murphy and Riley (1962).
Results and Discussion
Physicochemical Characterization of the WTRs
The WTRs were analyzed for selected physicochemical properties (Table 2-1). All the
WTRs had large percentage of coarse (> 0.02 - 2 mm) size fraction. However, the Al-WTRs had
relatively high percentage of fine (< 0.02 mm) size fraction. The relatively high percentage of the
fine-sized fraction of the Al-WTRs implies that such WTRs will have greater surface area to
rapidly sorb P than the coarse-textured Fe-WTR aggregates. Novak and Watts (2005) observed
that WTR aggregate size was inversely related to the Pmax of the WTR. Thus, crushing WTRs
into smaller diameter aggregates can increase the Pmax values between 1- and 2-fold (Novak and
Watts, 2005). The pH of Al-WTRs was circumneutral (6.5- to 7.1), within the normal range for
soils (Bohn et al., 1985), and may result from pH adjustment with alkaline materials (i.e.,
calcium hydroxide) during drinking-water treatment. Makris and O’Connor (2006) observed that
pH of Al-WTRs is commonly circumneutral (5.0 - 7.0), although some WTRs exhibit pH values
as great as 8.2. The EC values of the Al-WTRs ranged from 1.02 to 1.49 dS m-1, well below the
4.0 dS m-1 associated with soil salinity problems (Brady and Weil, 2002). The KCl-P represented
only a small fraction of total P, and ranged from 0.3- to 0.6 % of total P. Phosphorus solubility
(KCl-extractable P) in WTRs is typically low and represents only a small fraction (< 0.2 to 0.7
%) of total P for all three WTR classes (Makris and O’Connor, 2006). The KCl-extractable P is
considered the most available pool of P and varies among different P sources (Elliott et al.,
2002b). The very low amounts of KCl-P in WTRs implies that they would be poor sources of P
in soils and can serve as additional sinks for P immobilization in poorly P-sorbing soils.
33
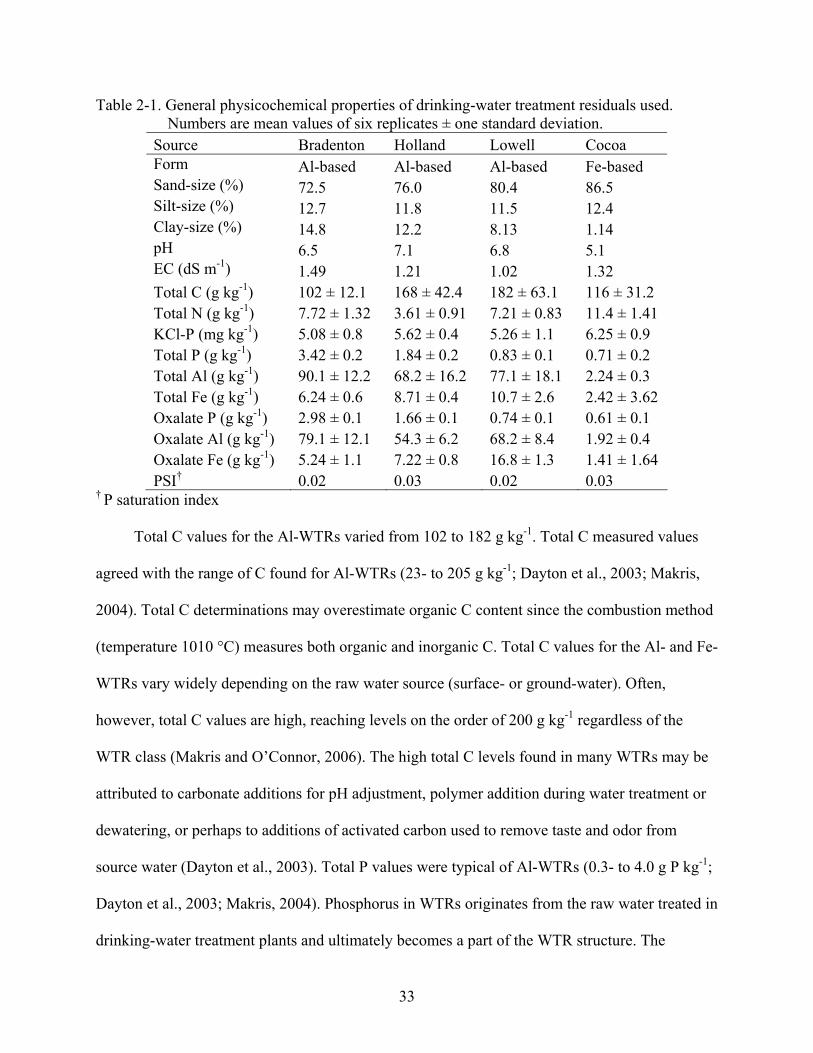
Table 2-1. General physicochemical properties of drinking-water treatment residuals used. Numbers are mean values of six replicates ± one standard deviation.
Source Bradenton Holland Lowell Cocoa Form Al-based Al-based Al-based Fe-based Sand-size (%) 72.5 76.0 80.4 86.5 Silt-size (%) 12.7 11.8 11.5 12.4 Clay-size (%) 14.8 12.2 8.13 1.14 pH 6.5 7.1 6.8 5.1 EC (dS m-1) 1.49 1.21 1.02 1.32 Total C (g kg-1) 102 ± 12.1 168 ± 42.4 182 ± 63.1 116 ± 31.2 Total N (g kg-1) 7.72 ± 1.32 3.61 ± 0.91 7.21 ± 0.83 11.4 ± 1.41 KCl-P (mg kg-1) 5.08 ± 0.8 5.62 ± 0.4 5.26 ± 1.1 6.25 ± 0.9 Total P (g kg-1) 3.42 ± 0.2 1.84 ± 0.2 0.83 ± 0.1 0.71 ± 0.2 Total Al (g kg-1) 90.1 ± 12.2 68.2 ± 16.2 77.1 ± 18.1 2.24 ± 0.3 Total Fe (g kg-1) 6.24 ± 0.6 8.71 ± 0.4 10.7 ± 2.6 2.42 ± 3.62 Oxalate P (g kg-1) 2.98 ± 0.1 1.66 ± 0.1 0.74 ± 0.1 0.61 ± 0.1 Oxalate Al (g kg-1) 79.1 ± 12.1 54.3 ± 6.2 68.2 ± 8.4 1.92 ± 0.4 Oxalate Fe (g kg-1) 5.24 ± 1.1 7.22 ± 0.8 16.8 ± 1.3 1.41 ± 1.64 PSI† 0.02 0.03 0.02 0.03
† P saturation index
Total C values for the Al-WTRs varied from 102 to 182 g kg-1. Total C measured values
agreed with the range of C found for Al-WTRs (23- to 205 g kg-1; Dayton et al., 2003; Makris,
2004). Total C determinations may overestimate organic C content since the combustion method
(temperature 1010 °C) measures both organic and inorganic C. Total C values for the Al- and Fe-
WTRs vary widely depending on the raw water source (surface- or ground-water). Often,
however, total C values are high, reaching levels on the order of 200 g kg-1 regardless of the
WTR class (Makris and O’Connor, 2006). The high total C levels found in many WTRs may be
attributed to carbonate additions for pH adjustment, polymer addition during water treatment or
dewatering, or perhaps to additions of activated carbon used to remove taste and odor from
source water (Dayton et al., 2003). Total P values were typical of Al-WTRs (0.3- to 4.0 g P kg-1;
Dayton et al., 2003; Makris, 2004). Phosphorus in WTRs originates from the raw water treated in
drinking-water treatment plants and ultimately becomes a part of the WTR structure. The

34
relatively high total P content of the Al-WTRs is probably due to concentration in the WTR after
removal from contaminated raw water during treatment. As the KCl-extractable P data show,
most of the P in WTRs is insoluble in aqueous suspensions. Other data (Makris et al., 2004b)
showed that the P is occluded in the WTR structure and is minimally released over time. Total Al
ranged from 38 to 90 g Al kg-1, within normal ranges reported by others (15- to 177 g Al kg-1;
Dayton et al., 2003; Makris, 2004; 15 to 300 g Al kg-1; Makris and O’Connor, 2006). The great
variability in total Al and Fe concentrations in the WTRs can partially be explained by the fact
that different drinking-water treatment facilities add different amounts of Al / Fe salts in the
treatment of raw waters, and by differences in the chemical composition of inorganic colloids
suspended in the raw water. Aluminum (hydr)oxides are sorbents for oxyanions such as
phosphate, thus the high Al content of the WTR suggests that they will be major sorbents for P.
Oxalate-extractable Al values were close to total Al (80-90 % of the total), suggesting an
amorphous nature of the Al- WTRs. This is consistent with the findings of O’Connor et al.
(2001) that the traditional 200 mM oxalate-extractable P, Al and Fe concentrations are typically
80-90 % of the respective WTRs’ total elemental concentrations. X-ray diffraction analysis of
Fe- and Al-WTRs (Makris, 2004) suggests that amorphous Al or Fe hydroxides dominate the Al-
and the Fe-WTRs, respectively, with no apparent crystalline components (Makris, 2004).
Oxalate-extractable P, Fe, and Al are usually associated with the amorphous phase of the
particles. Oxalate-extractable Al values are highly variable, but typically represent 30-90 % of
total Al of Al-WTRs (Dayton et al., 2003; Makris, 2004, Dayton and Basta, 2005), which
supports the amorphous model of Al-WTRs. Phosphorus retention is strongly related to
amorphous Fe and Al concentrations. Gallimore et al. (1999), Dayton et al. (2003) and Dayton
and Basta (2005) concluded that the amorphous (oxalate-extractable), rather than the total Al
35
content of WTRs, determines their effectiveness in reducing runoff-P. Thus, the high oxalate-
extractable metal percentage in Al-WTRs suggests high P sorption effectiveness. This suggestion
is consistent with the very small PSI values (~0.02), which gives an indication that the Al-WTRs
can be effective sorbents for P.
The Fe-based WTR (Cocoa WTR) had acidic pH (5.1). Typically, Fe-based WTRs are
alkaline (pH values 7.2 - 9.2; Makris and O’Connor, 2006) although the pH values for two Fe-
WTRs investigated by Makris (2004) were 4 and 5.6. Similar to the Al-WTRs, KCl-P in the Fe-
WTR represented only a small fraction (0.3 %) of total. Total C value was 198 g kg-1, within the
range of organic C values measured in Al-WTRs (23- to 205 g kg-1, Dayton et al., 2003, Makris,
2004). The Fe-WTR had C:N ratio of 19, suggesting an abundant N pool for plant uptake. Total
P content was 0.7 g P kg-1, whereas total Fe was 242 g Fe kg-1. Total Fe measurements were
above typical values found for WTRs (50 to150 g kg-1, ASCE, 1996). Large total Fe values may
not necessarily correlate well with elemental bioavailability or increased P sorption capacities.
Oxalate-extractable Fe accounted for 58.6 % of the total Fe concentration, suggesting an
amorphous nature of the WTR. X-ray diffraction analysis (Makris, 2004) suggested that
amorphous Fe (hydr)oxides dominated all Fe-WTRs, with no apparent crystalline Fe
(hydr)oxides. Iron-based WTRs had reduced oxalate-extractable Fe values as a percentage (45 to
64 %; Makris and O’Connor, 2006) of total Fe compared with the Al-WTRs. This difference
might suggest reduction in P sorption effectiveness of the Fe-WTRs compared with Al-WTRs.
However, the low PSI value (0.03) suggests that the Fe-WTR can also be an effective P sorbent.
Soil Characterization
The soil samples collected from both sites of the Michigan field study have near neutral pH
(Table 2-2). Soil collected at site 2 had greater (1.2 g kg-1) total P than site 1 (0.7 g kg-1) soil. The
high total P values reflect the long history of poultry manure application to the fields (Jacobs and

36
Teppen, 2000). The KCl extractable P accounted for 3.3 and 4.2 %, respectively, of the total P
contents at sites 1 and 2. The high KCl-P concentrations at both sites suggest that the soils can
contribute significantly to P loss in runoff. The soil from site 1 had greater total Fe and Al
content than site 2, suggesting that site 1 had greater potential to sorb excess soil P than the soil
from site 2. Soil from site 2 had a relatively high PSR value (> 1), which suggest that site 2 could
contribute significant amounts of P in surface runoff. The PSR value of site 1 was relatively low
(~ 0.3) and less than one-third of the PSR value of site 2. Site 2 had about twice the STP and
one-half the total Fe and Al concentrations of site 1 (Table 2-1). Despite the low PSR value of
site 1, a value of 0.3 suggests that the site can contribute some amount of P in runoff from the
site.
Table 2-2. Selected physicochemical properties of the Michigan soils (sites1 and 2) and the Immokalee sand. Units for all measurements (except pH and particle size values) are expressed in mg kg-1. Numbers are mean values of six replicates ± one standard deviation. Michigan site 1 Michigan site 2 Immokalee Sand Sand 60 % 76 % 89 % Silt 28 % 16 % 5 % Clay 12 % 8 % 6 % pH 6.4 ± 0.2 6.8 ± 0.2 5.6 ± 0.3 Total C 18200 ± 334 24000 ± 586 7400 ± 59.4 KCl-P 22.1 ± 2.3 58.1 ± 5.1 4.36 ± 1.4 Oxalate P 512 ± 27.5 970 ± 81.3 11.7 ±2.6 Oxalate Al 2400 ± 221 710 ± 38.5 42.1 ± 9.1 Oxalate Fe 730 ± 48.3 290 ± 12.8 84.2 ± 8.2 Total P 710 ± 47.1 1200 ± 24.3 23.8 ± 4.21 Total Al 7000 ± 235 3400 ± 32.5 61.3 ± 12.3 Total Fe 2700 ± 198 1800 ± 6.7 114 ± 21.6 PSR† 0.32 ± 0.11 1.14 ± 0.04 0.09 ± 0.02
† P saturation index
The Immokalee fine sand collected from the University of Florida Research and Education
Center in Immokalee for the study is acidic (pH = 5.6) and contains small amounts of total
carbon and Fe and Al (Table 2-2). The soil contains low amounts of total P, but KCl-P

37
represents ~ 18 % of total P, a likely consequence of the soil’s low Al and Fe contents, which are
major sorbents of P. The soil has a PSR value of < 0.1, suggesting that the soil will not be source
of P supply in runoff.
Phosphorus Sorption by WTRs
The alum-based WTRs (Bradenton, Holland, and Lowell) have vastly different P sorption
characteristics than the Fe-based WTR (Cocoa) (Figure 2-1). All the WTRs sorbed 100% of the
initial P in solution at concentrations < 500 mg P L-1. Isotherms were conducted using solutions
containing greater initial P concentrations (> 500 mg P L-1) to obtain suitable isotherm points for
plotting (Figure 2-1). At the greatest initial P load, the Bradenton material sorbed the greatest
amount of P, followed by Holland, Lowell, and Cocoa in that order. Langmuir-sorption maxima
could not be determined for the Bradenton and Holland WTRs because isotherms did not exhibit
obvious equilibrium conditions. Langmuir-sorption maxima were determined for only the Lowell
(alum-based) and Cocoa (Fe-based) WTRs. Both of these WTRs had significantly different P
sorption isotherms (Figure 2-1) and there was a 5-fold difference in Pmax values between the
WTRs. The linear form of the Langmuir equation (linear regression relationships between C and
C Q-1) fits the data sets of the two WTRs very well (both r2 = 0.99, p < 0.001). The slopes of the
regression equations for the Lowell and Cocoa WTRs were 0.133 and 0.667, respectively,
corresponding to Pmax values of 7.5 and 1.5 g P kg-1, respectively. The much greater Pmax values
for the Lowell Al-WTR is consistent with its elevated oxalate extractable metal content (Table 2-
1). Dayton et al. (2003) reported that WTRs Pmax values were statistically correlated to their Alox
content. The greater Pmax of the Lowell WTR can also be related to its greater percentage of fine
aggregate sizes (Table 2-1). Novak and Watts (2005) showed that as aggregate size decreased
from > 4.0 to < 0.5 mm Pmax values generally increased, and attributed the change to increased
surface area and numbers of reactive sites. Ippolito et al. (2003) also reported a greater P sorption
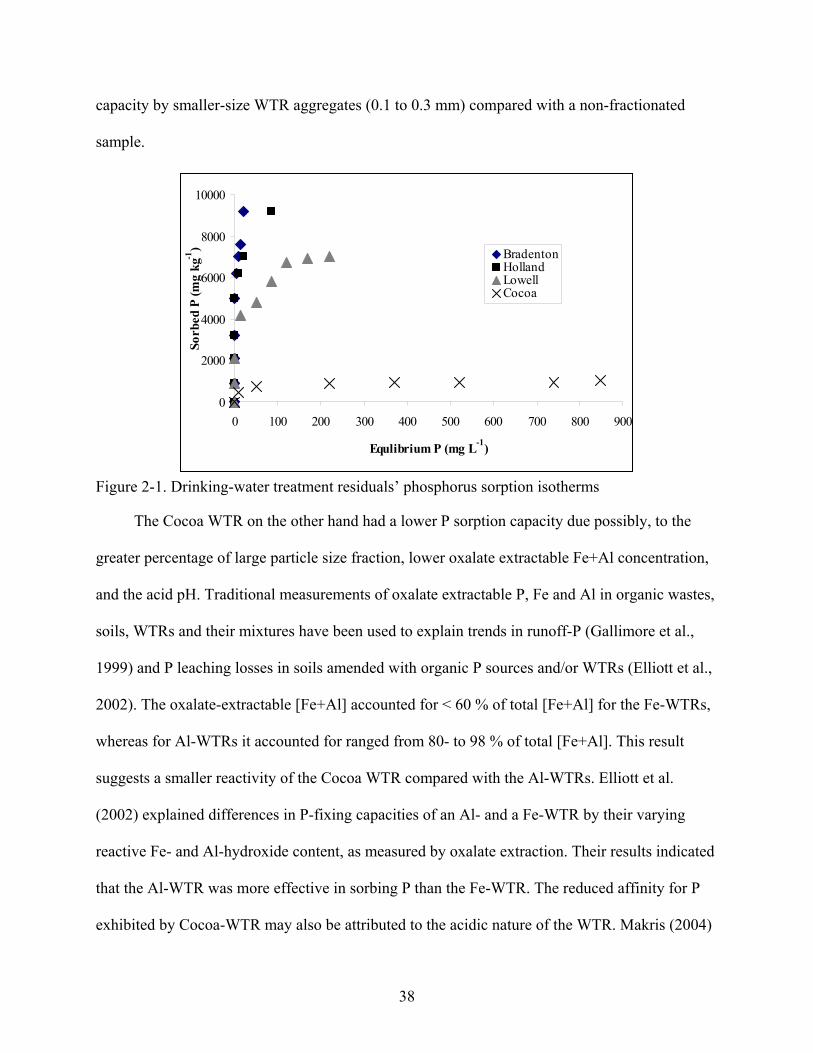
38
capacity by smaller-size WTR aggregates (0.1 to 0.3 mm) compared with a non-fractionated
sample.
0
2000
4000
6000
8000
10000
0 100 200 300 400 500 600 700 800 900
Equlibrium P (mg L-1)
Sorb
ed P
(mg
kg-1
) BradentonHollandLowellCocoa
Figure 2-1. Drinking-water treatment residuals’ phosphorus sorption isotherms
The Cocoa WTR on the other hand had a lower P sorption capacity due possibly, to the
greater percentage of large particle size fraction, lower oxalate extractable Fe+Al concentration,
and the acid pH. Traditional measurements of oxalate extractable P, Fe and Al in organic wastes,
soils, WTRs and their mixtures have been used to explain trends in runoff-P (Gallimore et al.,
1999) and P leaching losses in soils amended with organic P sources and/or WTRs (Elliott et al.,
2002). The oxalate-extractable [Fe+Al] accounted for < 60 % of total [Fe+Al] for the Fe-WTRs,
whereas for Al-WTRs it accounted for ranged from 80- to 98 % of total [Fe+Al]. This result
suggests a smaller reactivity of the Cocoa WTR compared with the Al-WTRs. Elliott et al.
(2002) explained differences in P-fixing capacities of an Al- and a Fe-WTR by their varying
reactive Fe- and Al-hydroxide content, as measured by oxalate extraction. Their results indicated
that the Al-WTR was more effective in sorbing P than the Fe-WTR. The reduced affinity for P
exhibited by Cocoa-WTR may also be attributed to the acidic nature of the WTR. Makris (2004)

39
reported that low pH values (< 5.5) affected organic molecules configuration on the surface of
WTRs. Low pH leaves the majority of surface functional groups unionized, such that molecules
may lie flat on the surface and block the free transfer of water or solutes in and out of pores,
which reduce P accessibility to sorption sites (Makris, 2004). Makris et al. (2005) showed that
adjusting the pH to 7 doubled the P sorption capacity of the Cocoa material.
The difference in Pmax values between the Lowell WTR and the Cocoa-WTR exemplifies
the P sorption potential of Al-WTRs (Makris, 2004). The Lowell Al-WTR Pmax value (7.5 g kg-1)
is greater than Pmax values reported for alum-based WTR produced in Oklahoma (0.30 to 5.14 g
P kg-1, Dayton et al., 2003) and in Florida (5 g P kg-1, O'Connor et al., 2002), but lower than
some Al-WTRs produced in North Carolina (8.5 g P kg-1, Novak and Watts, 2004).
Heterogeneity in residuals Pmax values is expected, as water treatment facilities vary the
concentrations of added alum or other flocculating agents (e.g., Ca or Fe cationic salts),
depending on the quality of the raw water (Gallimore et al., 1999).
Phosphorus Sorption Kinetics by WTRs
The Bradenton and Holland WTRs had the greatest and most rapidly expressed affinity for
P. Within 7 days, the WTRs sorbed 84 and 91 %, respectively, of the initial load of 10,000 mg P
kg-1 (Table 2-3). By 14 days, both Al-WTRs sorbed essentially all P from solution. Given
enough time (42 days), the Lowell WTR also sorbed a substantial amount (~ 70 % of initial P
load) of P from solution. The Cocoa WTR sorbed the least amount of P of all WTRs after 42
days (~12 %).
The WTR-P sorption process is generally described as an initial rapid reaction (primarily
on external surfaces), followed by a slower reaction representing P migration into interstitial
micropores within aggregates (Makris et al., 2004a,b; Wilson et al., 2004). Phosphorus sorption
data presented here (Table 2-3) followed those trends. Initial P sorption was rapid, followed by

40
slower P sorption. Phosphorus sorption by other WTRs (Makris et al., 2005a) was also initially
fast, and was followed by a slow P sorption stage. The fast stage of P sorption presumably
characterized P retention on highly accessible surfaces like particle exteriors and macropores
(Van Riemsdjik and Lyklema, 1980). The slower stage has been characterized as P association,
via diffusion, in micropores (Axe and Trivedi, 2002; Makris et al., 2004b). Phosphorus sorption
kinetics by metal hydroxides and soils are well characterized and generally show a fast sorption
phase, followed by a slower reaction rate where sorption may never reach true equilibrium
(Bolan et al., 1985).
Table 2-3. P sorbed by four drinking-water treatment residuals with time. (Initial P load = 10,000 mg kg-1).
1 day 7 days 14 days 21 days 28 days 35 days 42 daysWTR source P sorbed† by WTRs (mg kg-1) Bradenton 4820 9100 10000 10000 10000 10000 10000 Holland 4560 8400 10000 10000 10000 10000 9980 Lowell 3790 5200 5800 6250 6550 6700 7000 Cocoa 720 835 910 1020 1090 1150 1200
† P sorbed was assumed to be P lost from the initial solution
The fast reaction is ascribed to low-energy, external surface site binding via ligand
exchange (Bolan et al., 1985). The slow reaction between P and metal hydroxides proceeds for
days, months, and even years, and has been attributed to continuing surface precipitation
reactions (Van Riemsdijk and Lyklema, 1980; Nooney et al., 1998) or intraparticle diffusion into
micropores (Axe and Trivedi, 2002; Makris et al., 2004a). Makris et al. (2004a) identified the
latter mechanism as prominent in the retention of P by WTRs, and suggested that P immobilized
by WTRs should be essentially irreversibly bound.
Novak and Watts (2005) suggested that first order kinetics adequately describe P sorption
reactions by WTRs, but kinetic data for all the Al-WTRs examined in this study were best fit to a
second order reaction rate model (Table 2-4), suggesting a biphasic nature of P sorption. Azizian

41
(2004) and Makris et al. (2005a) reported similar results and indicated that P sorption reactions
by WTRs are best described by second order kinetics. However, P sorption kinetic data for the
Fe-WTR (Cocoa WTR) did not fit either a first- nor second order reaction rate model, possibly,
due to limited P sorption of the Cocoa WTR (Table 2-4). This result is consistent with the
observation of Makris et al. (2005a). The second order reaction rate coefficients increased with
the P sorption capacities of the WTRs. The faster the reaction, as suggested by larger rate 2nd
order coefficients, the greater the amount of P sorbed. The Bradenton and Holland WTRs had the
greatest second order rate coefficients, suggesting little effect of the slow P stage on the overall P
reaction with the solid. The two WTRs exhibited the fastest removal of P from solution and
depleted all of the added soluble P within 14 days. The Cocoa material exhibited the smallest 2nd
order rate coefficient, suggesting a greater effect of the slow P sorption stage compared with the
other Al-WTRs. The slow P stage in the Cocoa material was rate limiting for P sorption.
Table 2-4. Determination coefficients (r2) of the reaction rates and 2nd order rate constants for the drinking-water treatment residuals used. Source Form Rate fit (r2) Rate constants (k) 1st order 2nd order (L s-1 mg-1) Bradenton Al-based 0.82 0.96 1.36 * 10-4 Holland Al-based 0.89 0.97 1.59 *10-4 Lowell Al-based 0.90 0.96 2.82 * 10-5 Cocoa Fe-based 0.34 0.49 7.25 * 10-9
The Al-WTR P sorption data conflict with the suggestion of Butkus et al. (1998) that
adding P to WTR as a pretreatment converts WTR from a P consumer to a P supplier. Our results
indicate that P is highly sorbed, over time becomes strongly chemisorbed to the WTR, and would
represent a poor P supplier. Bowman et al. (1998) concluded that reactive Fe and Al oxide
surfaces, along with CaCO3, play a role in determining transitional or intermediate P levels. Over
time, a more resistant P pool is formed. The specific binding of P has been described by Bohn et
42
al. (1985), where adsorption occurs at the hydrous aluminum oxide interface with phosphate
replacing singly coordinated OH- groups and then reorganizes into a very stable binuclear bridge
between cations. Hingston et al. (1972) proposed specific adsorption of phosphate ions at the
oxide interface, where the formation of coordination complexes occur. Peak et al. (2002) used X-
ray absorption near edge structure spectroscopy, and showed a conversion of alum to an
amorphous Al(OH)3 precipitate in alum-amended poultry litter. The amorphous Al(OH)3 then
reacted with poultry litter-borne P via an adsorption mechanism. Similar mechanisms may also
describe P adsorption on aluminum-containing WTR.

43
CHAPTER 3 STABILITY OF WTR IMMOBILZED PHOSPHORUS: KISSIMMEE FIELD STUDY
Introduction
Phosphorus loss from agricultural cropland is one of the major factors responsible for
accelerated eutrophication of surface waters in many locations in the USA, including the Great
Lakes, Chesapeake and Delaware Bays, Lake Okeechobee, and the Everglades (Sharpley et al.,
1996; Daniel et al., 1998; Sims et al., 1998; Sims et al., 2000; Maguire et al., 2001). Lake
Okeechobee, the major aquatic resource for water storage, wildlife, and recreation in south
Florida, is threatened by cultural eutrophication from excessive P loading in the surrounding
basins. The Kissimmee watershed has a prolonged history of using P sources such as P
fertilizers, manures and biosolids to increase soil fertility and crop yields. However, applications
of organic sources of P are typically based on crop N requirements, which provide P in excess of
crop needs. Eghball and Power (1999) showed a significant accumulation of plant available P in
the top 15 cm of soil following N-based beef cattle manure or compost application, but no
accumulation occurred with P-based applications. Phosphorus build-up in the soil is not
detrimental to crops, but off-site migration to surface waters is a major concern because P is the
limiting nutrient for eutrophication of most freshwaters (Elliott et al., 2002 a; O’Connor and
Chinault; 2006). Soils in the Kissimmee watershed (e.g. Immokalee sand and Myakka sand)
sorb P poorly, and there is concern that such high-P soils represent an increased risk for
nonpoint-source pollution of surface waters (Elliott et al., 2002a; O’Connor et al., 2002).
Concerns about P pollution from biosolids, in particular, have resulted in land application
guidelines that limit application rates to those based on crop-P removals (typically, ≤ 2 Mg ha-1).
Such rates are so low (uneconomical and impractical) that the beneficial recycling of biosolids to
lands in the watershed is seriously threatened (O’Connor and Chinault, 2006).

44
Excessive soluble P concentrations can be controlled with environmentally-benign and
cost-effective P-sorbing amendments such as alum (Moore, 1998) or drinking-water treatment
residuals (WTRs) (Elliott et al., 2002b). Numerous P sorption-desorption studies and rainfall
simulation studies have demonstrated WTR efficacy in reducing soluble P from P-impacted soils
(Elliott et al., 2002a; Dayton et al., 2003; Makris, 2004; Makris et al., 2004a,b). Although in the
short term, WTR is effective in reducing soluble P levels, field studies to ascertain the long-term
stability of WTR immobilized P are scarce. The stability of sorbed P by WTRs has been
qualitatively addressed in lab experiments (Makris et al., 2004a,b). The lab experiments
suggested that intraparticle P diffusion into the WTRs, coupled with minimal (highly hysteretic)
P desorption represented irreversible P sorption by the WTRs. Field experiments are needed to
test WTR efficacy in reducing soluble P concentrations and to confirm trends observed in, or
inferred from, lab studies.
The initial objective of this study was to determine the effects of WTR on P losses to
surface and groundwater from land amended with different P sources (biosolids, manure and
inorganic fertilizer) applied at P- and N-based rates. However, this objective could not be
pursued to its logical conclusion due to a natural disaster. The fall of 2004 was an especially
busy hurricane season in south FL, and the experimental plots were heavily flooded and berms
separating the plots were breached. The flooding appears to have contaminated (moved soil and
associated treatments) across plots, which forced early termination of the experiment. In view of
this mishap, we also modified the initial objective of our study to focus on the effectiveness of
WTRs as a best management practice to minimize P solubility in P-amended, low P sorbing
Florida soil, and to assess the stability of WTR immobilized P when the hydrology of WTR
amended soil changes.

45
Materials and Methods
Field layout and Amendments Application
The study was carried out at a cattle-pasture (Kirton Ranch) located on the eastern border
of Okeechobee County, seven miles (11.3 km) northeast of Okeechobee, and north of Lake
Okeechobee. The soil at the project site is the Immokalee fine sand, a typical Spodosol, classified
in the Arenic Alaquods taxonomic group, with a distinct A, E and Bh horizons.
The experimental design was a 48-plot randomized complete block design (RCBD)
consisting of three blocks with each block evaluating four P-sources: A) two biosolids: a
"moderate-soluble P" source from Pompano Beach, FL, and a "high-soluble P" source from Boca
Raton, FL, B), poultry manure from Indiantown, FL, and C) inorganic fertilizer (TSP). The P
sources were applied with and without WTR (aluminum-based, obtained from Manatee Co.
Water Treatment Plant in Bradenton). An extra plot per block was left untreated as the “control”.
The pasture was fenced to prevent cattle from entering the study field. Two application rates for
the P sources were utilized to attain P-based and N-based nutrient management. The 39.6 kg P
ha-1 rate represents the IFAS recommended rate for bahiagrass (Hanlon, 1995). The plots
receiving this nutrient rate represent the P-based rate treatment. Similarly, the 179 kg N ha-1 rate
represents the recommended (Hanlon, 1995) N-based rate. The TSP fertilizer N-based rate was
128 kg P ha-1, and approximates the rate of P applied when biosolids or manure are applied at an
N-based rate. The N and P concentrations and the percent solids of the biosolids, and the poultry
manure (Table 3-1) were used to calculate the quantities of materials to be applied. The Al-WTR
(10 g kg-1, 22.4 Mg ha-1) was applied on May 9-13, 2003. The two biosolids were applied from
May 13-14, 2003. The poultry manure was applied on May 14, 2003. The TSP fertilizer was
applied on May 19, 2003. Ammonium nitrate was applied from May 23-26, 2003, to the P-based
treatments of the biosolids and the manure to equalize the N supplied by the amendments that

46
differ in total N levels. No ammonium nitrate was applied to the N-based treatments except for
the TSP. The study field was mowed a week prior to application of materials. The study
continued for two growing seasons (terminated Dec 2004), but amendments were applied only in
2003.
Soil and Amendment Characterizations
General and P-specific characterization was done on the soil samples and the amendments
(materials actually applied). Portions of the applied amendments were air-dried and ball-milled
for analysis. The soil samples were air-dried and passed through a 2 mm sieve before analysis.
The amendments and soil samples were analyzed for total P, Fe, Al, Ca, Mg by ICP-AES
following digestion according to the EPA Method 3050A (USEPA, 1986). Oxalate (200 mM)
extractable P, Fe, Al, Ca, and Mg were determined by ICP-AES after extraction at a 1:60
solid:solution ratio, following the procedures of Schoumans (2000). Total C and N of the
amendments were determined by combustion at 1010 °C using a Carlo Erba NA-1500 CNS
analyzer. Total C, but not N, was analyzed for representative soil samples, and pH measurements
were performed on fresh materials (1:2 solid or soil:solution ratio). Percent solids were
determined by drying materials at 105 °C (Sparks, 1996).
Periodic Soil Sampling and Analysis
Composite soil samples (formed by mixing twenty 2.5-cm-diameter core samples) were
obtained from each plot of the study site. Soil sampling to characterize initial conditions of the
field after amendment application occurred in June, 2003. A second sampling occurred in
January 2004 (8 months after the material application). For both samplings, samples were taken
from the upper 5 cm of the A horizon, the middle of the E horizon (~ 45-55 cm from the top);
and the top 10 cm of the Bh horizon. The impact of the amendments on the P chemistry in the
entire A horizon (0-15 cm) was determined in another sampling in March 2004. A final sampling

47
was done in December 2004, following the termination of the field study. Samples were taken
from the A horizon (0-5 cm and 0-15 cm), the middle of the E horizon (~ 45-55 cm), and the top
10 cm of the Bh horizon, to provide comparisons with the samples taken previously. Soil
samples were air-dried and passed through a 2-mm sieve before analysis.
The samples were analyzed for total- and oxalate extractable P, Al and Fe as described
above. The degree of phosphorus saturation (DPS) was calculated for the soil samples, and
represents the moles of oxalate P divided by the sum of moles of oxalate-200mM (Fe + Al),
assuming a saturation factor (α) value of 0.55 as suggested by Nair et al., (2004) for Florida soils.
The DPS of surface soils is a measure of P loss potential from the soil, and a critical value of
25% has been suggested for FL soils (Nair et al., 2004). The soil samples were also analyzed for
Mehlich 1-P, Iron-strip P and water extractable P as measures of available P. Water extractable P
was determined by reacting the soil samples with deionized water at a ratio of 1:10 soil:solution
ratio for one hour (Kuo, 1996). The P concentration was analyzed colorimetrically with the
Murphy and Riley method (1962). Mehlich 1-P was determined on the samples by shaking the
soil samples with 0.0125 M H2SO4 in 0.03 M HCl solution at a ratio of 1:4 soil:solution ratio for
5 minutes (Hanlon et al., 1997). Extracts were filtered through Whatman No 42 filter paper and
analyzed colorimetrically (Murphy and Riley, 1962). The Iron-strip P was determined by
reacting the soil samples with Fe-impregnated (0.65 M FeCl3 in 0.6 M HCl) filter paper and then
extracting the P adsorbed with 0.1 M H2SO4 (Van der Zee, 1987). The extractable P was
analyzed colorimetrically (Murphy and Riley, 1962).
Quality Control
All sample collection/handling/chemical analysis was conducted according to a standard
QA/QC protocol. For each set of samples, a standard curve was constructed (r2 > 0.998). Method
reagent blanks were appropriately used, as well as certified standards from a source other than

48
normal calibration standards. Percent recovery ranged from 97-103% of values obtained by the
calibration curve. A 5% matrix spike of the set was used to determine the accuracy of the data
obtained, with recoveries ranging from 96-103% of the expected values. Another 5% of the set
was used to determine the precision of the measurements (triplicates). Analyses that did not
satisfy the above QA/QC protocol were rerun.
Statistical Analyses
Differences among treatments were statistically analyzed as a factorial experiment with a
randomized complete block design (RCBD), using the general linear model (GLM) of the SAS
software (SAS Inst., 1999). The means of the various treatments were separated using a single
degree of freedom orthogonal contrast procedure.
Results and Discussion
The samples collected from the field in June, 2003 and Jan and Mar, 2004 (before the
occurrence of the hurricanes) enabled us to assess the impacts of the P sources and rates of
application on the P chemistry of the soil and to evaluate the effectiveness of the applied WTR in
reducing soluble P levels under field conditions. Although the hurricanes precluded continuing
the study, sufficient data were collected to evaluate the stability of WTR immobilized P over
time.
Soil and Amendments Characteristics
The soil and organic amendments were analyzed for selected chemical properties (Tables
3-1 and 3-2). The pH values of the P sources ranged from 6.8 for the poultry manure to 8.2 for
the Boca Raton biosolids. The percent solids also varied with amendment; the biosolids (Boca
Raton and Pompano biosolids) had similar values (~ 14 %), whereas the manure had ~27 %.
Boca Raton biosolids had the greatest amount of total P (39 g kg-1), followed by the Pompano
biosolids (24.1 g kg-1). These values are consistent with values reported for most biosolids (~3 -
49
40 g kg-1, Elliott et al., 2002a,b; O’Connor et al., 2004). The poultry manure had the least total P
content, but the observed value (18.9 g kg–1) is close to the average value (20 g kg-1) reported for
chicken manure total P by Barnett (1994). The Boca Raton biosolids had the greatest ‘available’
P (water-, iron strip-, and Mehlich-1 extractable P) value, consistent with the total P content of
the P sources. However, unlike the trends in total P values, poultry manure had greater
‘available’ P than the Pompano biosolids. The lower ‘available’ P content of the Pompano
biosolids probably reflects the relatively high Fe + Al content of the material. The high total and
‘available’ P content of the Boca Raton biosolids, coupled with the low C:N ratio of the material
suggests that the Boca Raton Biosolids will be a good P supplier and is likely to pose
environmental problems if applied in excess of the crop P requirement. The total Al + Fe
concentrations varied among the organic P sources and ranged from ~2.5 g kg-1 (poultry manure)
to ~ 42 g kg-1 for the Pompano biosolids. Total Fe + Al contents in the range of (~2 – 80 g kg-1)
have been reported for biosolids (Elliott et al., 2002a,b; O’Connor et al., 2005). The poultry
manure had little total Al and Fe (2.4 g kg-1) and was dominated by calcium (102 g kg-1), a basic
ingredient of poultry diet (Barnett, 1994). Oxalate extractable P, Fe, and Al are usually
associated with the amorphous phase of particles. Oxalate extractable Fe + Al in the Boca Raton
biosolids was ~26 g kg-1, and ~32 g kg-1 for the Pompano biosolids, well within the typical range
(10-80 g kg-1) for biosolids (Elliott et al., 2002a,b; O’Connor et al., 2005). We also calculated the
phosphorus saturation index (PSI = [Pox]/ [Alox + Feox]) of the P sources (Elliott et al., 2002a;
Schoumans, 2000) from the moles of oxalate- extractable P, Fe, and Al data (Table 3-1). The
index is used here as an indication of the degree to which biosolids P is potentially bound with
Fe and Al in the biosolids. Thus, PSI values of < 1 suggest excessive Fe and Al for binding of P
(little available P), whereas values of > 1 suggest abundant P not associated with Fe and Al

50
precipitates (abundant available P). Soil oxalate-extractable Fe and Al can affect P
phytoavailability once biosolids are land-applied, but the PSI value of biosolids has been
suggested as an a priori index of biosolids P lability (Elliott et al., 2002a). Since only oxalate-
extractable P, Fe, and Al are considered, the index is not as useful for Ca-dominated materials.
The PSI qualitatively identified the Boca Raton material as a good “labile” P source. The
Pompano (high Fe) material is qualitatively identified as a poor labile P source.
Table 3-1. Selected chemical properties of amendments (oven dry basis) utilized in the Kirton Ranch field study. Units for all measurements (except pH, % Solids and PSI) are expressed in g kg-1. Numbers are mean values of six replicates ± one standard deviation
Form Manure Biosolids Al-WTR
Source Indiantown
Boca Raton
Pompano Bradenton
pH 6.8 8.2 7.9 5.6
Total C 32.0 34.7 36.6 13.9
Total N 8.4 8.0 7.03 0.7
% Solids 27.0 ± 4.2 13.4 ± 1.6 15.4 ± 3.4 40.6 ± 6.2
Total P 18.9 ± 3.8 38.7 ± 2.3 24.1 ± 4.2 4.69 ± 0.7
Total Al 0.94 ± 0.1 9.37 ± 0.4 9.26 ± 1.4 107 ±- 8.3
Total Fe 1.53 ± 0.3 24.3 ± 3.1 32.8 ± 6.4 6.08 ± 0.4
Total Ca 102 ± 11.2 27.5 ± 1.1 47.0 ± 5.5 1.53 ± 0.1
Total Mg 5.82 ± 0.8 10.0 ± 0.8 4.15 ± 0.6 0.44 ± 0.02
Oxalate P 10.4 ± 1.2 26.4 ± 3.9 28.5 ± 3.2 4.33 ± 0.8
Oxalate Al 0.79 ± 0.1 6.50 ± 0.9 7.41 ± 0.6 84.3 ± 6.2
Oxalate Fe 0.82 ± 0.3 19.4 ± 2.3 24.7 ± 4.2 5.16 ± 1.0
Oxalate Ca 4.25 ± 0.1 19.7 ± 3.1 43.7 ± 6.1 0.36 ± 0.1
Oxalate Mg 4.27 ± 0.3 8.93 ± 0.6 3.24 ± 0.3 145 ± 8.9
Mehlich 1-P 4.90 ± 1.2 8.76 ± 2.4 2.30 ± 0.4 -
Fe strip P 1.34 ± 0.3 6.42 ± 1.2 1.05 ± 0.2 - Water P 0.85 ± 0.1 2.59 ± 0.6 0.34 ± 0.1 - PSI† 21.7 ± 0.6 1.44 0.7 0.02
† Phosphorus saturation index ‡ Not applicable
51
The WTR used for the study had ~ 40 % solids. With the exception of the total C and total-
and oxalate-extractable P and Al contents, which were all greater in the WTR actually applied,
all the other chemical characteristics were similar to those determined for the Bradenton WTR
(Table 2-1) utilized in other studies. The slight differences in the chemical contents of the WTRs
from the same drinking-water treatment plant collected at different times can be attributed to
differences in quality of the water source, which can influenced the treatment procedure (rates of
coagulant used and the level of pH adjustment).
General chemical characteristics of the Immokalee fine sand collected from the project site
are given in Table 3-2. The A-horizon soil samples used in this experiment had characteristics
similar to the unimpacted Immokalee soil characterized previously (Table 2-1). The measured
values obtained for the lower horizons (E and Bh) are similar to those observed for another
Spodosol (Myakka) located in the Okeechobee watershed (Nair et al., 1995). However, the data
generated for the 3 horizons showed that the soil of the project site was very heterogeneous,
which was reflected in the large variability among chemical measurements of the same
treatments.
Effects of Phosphorus Sources and Rates of Application
Mean values of total- and oxalate (200 mM) extractable P, Fe and Al for the A (0-5 cm)
horizon sampled from the field in June 2003 and January 2004 are provided in Table 3-3; values
of soils sampled from the A (0-15 cm) in March 2004 are presented in Table 3-4. The general
chemical characteristics of the E, and Bh horizons sampled from the field in June 2003 and
January 2004 were similar to those sampled to initially characterize the field (Table 3-2) and are
not presented.
The greatest absolute total- and oxalate extractable P values from the A horizon were
found in the Boca Raton biosolids-treated plots, followed by Pompano-, poultry manure- and the

52
TSP fertilizer-treated plots (Tables 3-3 and 3-4). As expected, the plots treated with N-based
rates of amendments had greater absolute total- and oxalate extractable P values than plots
treated at P-based amendment rates. The total- and oxalate extractable P concentrations of the
samples taken in June 2003 through March 2004 were significantly greater than values of the
initial soil samples (before the amendments were applied) taken to characterize the site (Table 3-
1). Clearly, the application of the amendments significantly increased the P load of the soil.
Although the values of Mehlich extractable P concentrations for the various treatments were
significantly lower that the respective total- and oxalate extractable P values, Mehlich 1
extractable P data followed the same trend as the total-and oxalate extractable P data (data not
presented).
Table 3-2. Selected chemical characteristics of the Immokalee soil (oven dry basis) used in the field study. Units for all measurements (except pH and DPS) are expressed in mg kg-
1. Numbers are mean values of six replicates ± one standard deviation Horizons Chemical
characteristics A (0-10cm) E (~ 40 -45 cm)
Bh (top 10 cm)
pH 5.5 5.9 5.1
Total P 24.5 ± 5.46 7.9 ± 4.56 24.5 ± 11.3
Total Al 72 ± 23.3 33.6 ± 7.55 1280 ± 170
Total Fe 101 ± 39.6 38.5 ± 6.21 94.8 ± 23.2
Oxalate P 10.0 ± 2.95 3.76 ± 2.76 23.8 ± 13.7
Oxalate Al 54.8 ± 6.74 15.8 ± 5.35 970 ± 418
Oxalate Fe 61.7 ± 8.52 13.0 ± 5.98 39.0 ± 5.08
Mehlich 1-P 13.3 ± 6.54 1.88 ± 1.33 12.1 ± 2.82
WEP† 4.07 ± 0.78 0.77 ± 0.32 3.31 ± 0.5
Fe-strip-P 9.6 ± 0.11 1.36 ± 0.12 16.4 ± 3.2
DPS‡ 0.10 0.14 0.02 † Water extractable P ‡ Degree of phosphorus saturation
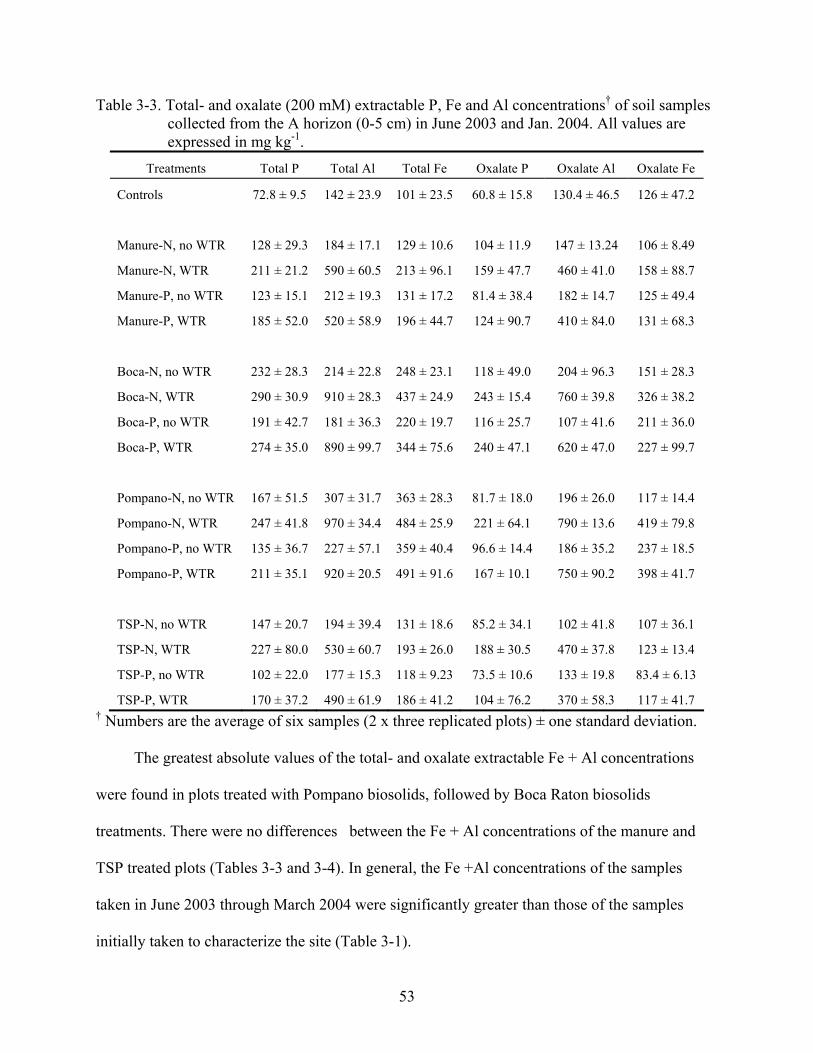
53
Table 3-3. Total- and oxalate (200 mM) extractable P, Fe and Al concentrations† of soil samples collected from the A horizon (0-5 cm) in June 2003 and Jan. 2004. All values are expressed in mg kg-1.
Treatments Total P Total Al Total Fe Oxalate P Oxalate Al Oxalate Fe
Controls 72.8 ± 9.5 142 ± 23.9 101 ± 23.5 60.8 ± 15.8 130.4 ± 46.5 126 ± 47.2
Manure-N, no WTR 128 ± 29.3 184 ± 17.1 129 ± 10.6 104 ± 11.9 147 ± 13.24 106 ± 8.49
Manure-N, WTR 211 ± 21.2 590 ± 60.5 213 ± 96.1 159 ± 47.7 460 ± 41.0 158 ± 88.7
Manure-P, no WTR 123 ± 15.1 212 ± 19.3 131 ± 17.2 81.4 ± 38.4 182 ± 14.7 125 ± 49.4
Manure-P, WTR 185 ± 52.0 520 ± 58.9 196 ± 44.7 124 ± 90.7 410 ± 84.0 131 ± 68.3
Boca-N, no WTR 232 ± 28.3 214 ± 22.8 248 ± 23.1 118 ± 49.0 204 ± 96.3 151 ± 28.3
Boca-N, WTR 290 ± 30.9 910 ± 28.3 437 ± 24.9 243 ± 15.4 760 ± 39.8 326 ± 38.2
Boca-P, no WTR 191 ± 42.7 181 ± 36.3 220 ± 19.7 116 ± 25.7 107 ± 41.6 211 ± 36.0
Boca-P, WTR 274 ± 35.0 890 ± 99.7 344 ± 75.6 240 ± 47.1 620 ± 47.0 227 ± 99.7
Pompano-N, no WTR 167 ± 51.5 307 ± 31.7 363 ± 28.3 81.7 ± 18.0 196 ± 26.0 117 ± 14.4
Pompano-N, WTR 247 ± 41.8 970 ± 34.4 484 ± 25.9 221 ± 64.1 790 ± 13.6 419 ± 79.8
Pompano-P, no WTR 135 ± 36.7 227 ± 57.1 359 ± 40.4 96.6 ± 14.4 186 ± 35.2 237 ± 18.5
Pompano-P, WTR 211 ± 35.1 920 ± 20.5 491 ± 91.6 167 ± 10.1 750 ± 90.2 398 ± 41.7
TSP-N, no WTR 147 ± 20.7 194 ± 39.4 131 ± 18.6 85.2 ± 34.1 102 ± 41.8 107 ± 36.1
TSP-N, WTR 227 ± 80.0 530 ± 60.7 193 ± 26.0 188 ± 30.5 470 ± 37.8 123 ± 13.4
TSP-P, no WTR 102 ± 22.0 177 ± 15.3 118 ± 9.23 73.5 ± 10.6 133 ± 19.8 83.4 ± 6.13
TSP-P, WTR 170 ± 37.2 490 ± 61.9 186 ± 41.2 104 ± 76.2 370 ± 58.3 117 ± 41.7 † Numbers are the average of six samples (2 x three replicated plots) ± one standard deviation.
The greatest absolute values of the total- and oxalate extractable Fe + Al concentrations
were found in plots treated with Pompano biosolids, followed by Boca Raton biosolids
treatments. There were no differences between the Fe + Al concentrations of the manure and
TSP treated plots (Tables 3-3 and 3-4). In general, the Fe +Al concentrations of the samples
taken in June 2003 through March 2004 were significantly greater than those of the samples
initially taken to characterize the site (Table 3-1).
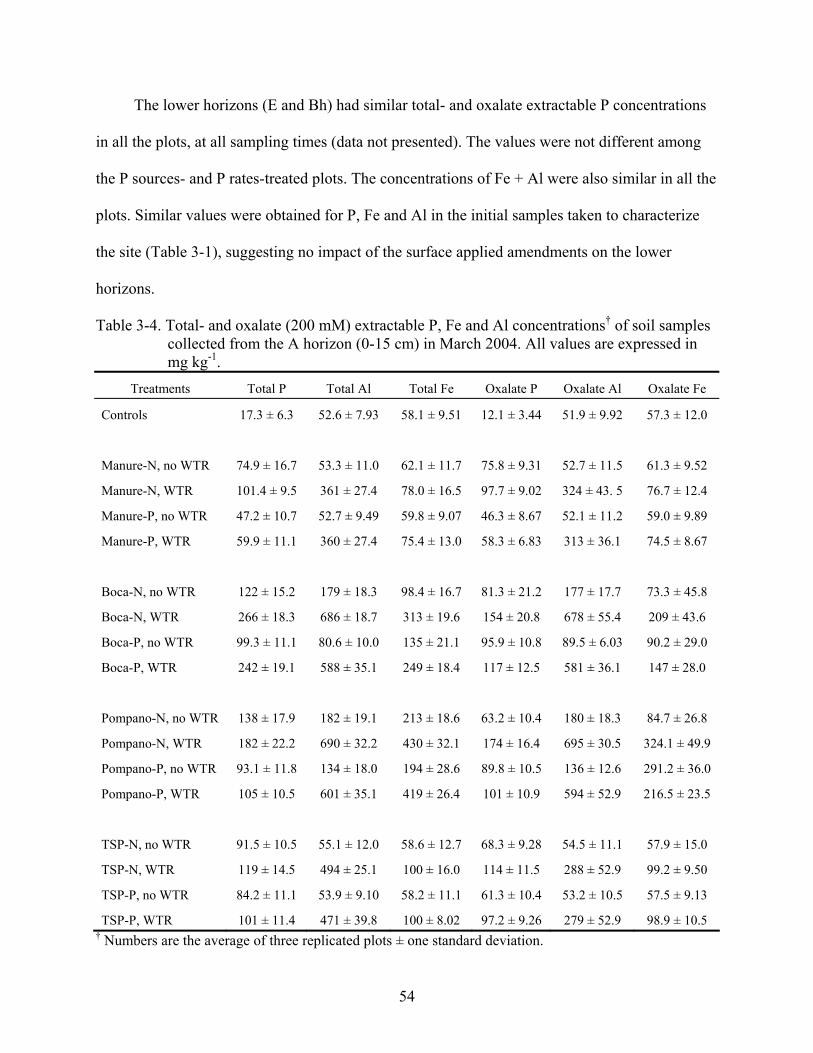
54
The lower horizons (E and Bh) had similar total- and oxalate extractable P concentrations
in all the plots, at all sampling times (data not presented). The values were not different among
the P sources- and P rates-treated plots. The concentrations of Fe + Al were also similar in all the
plots. Similar values were obtained for P, Fe and Al in the initial samples taken to characterize
the site (Table 3-1), suggesting no impact of the surface applied amendments on the lower
horizons.
Table 3-4. Total- and oxalate (200 mM) extractable P, Fe and Al concentrations† of soil samples collected from the A horizon (0-15 cm) in March 2004. All values are expressed in mg kg-1.
Treatments Total P Total Al Total Fe Oxalate P Oxalate Al Oxalate Fe
Controls 17.3 ± 6.3 52.6 ± 7.93 58.1 ± 9.51 12.1 ± 3.44 51.9 ± 9.92 57.3 ± 12.0
Manure-N, no WTR 74.9 ± 16.7 53.3 ± 11.0 62.1 ± 11.7 75.8 ± 9.31 52.7 ± 11.5 61.3 ± 9.52
Manure-N, WTR 101.4 ± 9.5 361 ± 27.4 78.0 ± 16.5 97.7 ± 9.02 324 ± 43. 5 76.7 ± 12.4
Manure-P, no WTR 47.2 ± 10.7 52.7 ± 9.49 59.8 ± 9.07 46.3 ± 8.67 52.1 ± 11.2 59.0 ± 9.89
Manure-P, WTR 59.9 ± 11.1 360 ± 27.4 75.4 ± 13.0 58.3 ± 6.83 313 ± 36.1 74.5 ± 8.67
Boca-N, no WTR 122 ± 15.2 179 ± 18.3 98.4 ± 16.7 81.3 ± 21.2 177 ± 17.7 73.3 ± 45.8
Boca-N, WTR 266 ± 18.3 686 ± 18.7 313 ± 19.6 154 ± 20.8 678 ± 55.4 209 ± 43.6
Boca-P, no WTR 99.3 ± 11.1 80.6 ± 10.0 135 ± 21.1 95.9 ± 10.8 89.5 ± 6.03 90.2 ± 29.0
Boca-P, WTR 242 ± 19.1 588 ± 35.1 249 ± 18.4 117 ± 12.5 581 ± 36.1 147 ± 28.0
Pompano-N, no WTR 138 ± 17.9 182 ± 19.1 213 ± 18.6 63.2 ± 10.4 180 ± 18.3 84.7 ± 26.8
Pompano-N, WTR 182 ± 22.2 690 ± 32.2 430 ± 32.1 174 ± 16.4 695 ± 30.5 324.1 ± 49.9
Pompano-P, no WTR 93.1 ± 11.8 134 ± 18.0 194 ± 28.6 89.8 ± 10.5 136 ± 12.6 291.2 ± 36.0
Pompano-P, WTR 105 ± 10.5 601 ± 35.1 419 ± 26.4 101 ± 10.9 594 ± 52.9 216.5 ± 23.5
TSP-N, no WTR 91.5 ± 10.5 55.1 ± 12.0 58.6 ± 12.7 68.3 ± 9.28 54.5 ± 11.1 57.9 ± 15.0
TSP-N, WTR 119 ± 14.5 494 ± 25.1 100 ± 16.0 114 ± 11.5 288 ± 52.9 99.2 ± 9.50
TSP-P, no WTR 84.2 ± 11.1 53.9 ± 9.10 58.2 ± 11.1 61.3 ± 10.4 53.2 ± 10.5 57.5 ± 9.13
TSP-P, WTR 101 ± 11.4 471 ± 39.8 100 ± 8.02 97.2 ± 9.26 279 ± 52.9 98.9 ± 10.5 † Numbers are the average of three replicated plots ± one standard deviation.

55
Impacts of WTR on Phosphorus Solubility
The total- and oxalate extractable P concentrations of the WTR amended plots were
significantly greater than the P concentrations of the plots not treated with WTR, suggesting that
the extractants were sufficiently rigorous to extract P otherwise immobilized by, or contained in,
the WTR (Tables 3-3 and 3-4). The same trend was observed with the Mehlich-1 extraction data
(data not presented).
The effect of WTR amendment on surface soil P chemistry is most dramatic when the
oxalate extractable P concentrations (in moles) are divided by the corresponding oxalate Fe and
Al values (in moles) times a saturation coefficient (α) value of 0.55. The resulting value is the
Degree of P saturation - DPS (Nair et al., 2004) and correlates negatively with expected P losses
from a site. Pautler and Sims (2000) found that P solubility increased significantly (r2 = 0.70) as
soil P saturation increased in 41 agricultural soils in Delaware. Hooda et al. (2000) found that the
degree of soil P saturation was significantly related to soil P desorption. The critical DPS values
for FL soils is 0.25 (25 %) (Nair et al., 2004); soils with DPS values > 25% are expected to
release significant P to surface runoff or leaching, whereas soils with DPS values < 25 % are not.
Amendment with WTR significantly (p < 0.001) reduced DPS values in surface soils amended
with any P-source at any rate (Figure 3-1).
The DPS values of the WTR amended plots from the TSP treated plots decreased by 86 %
(N-based) and 82 % (P-based) relative to the same treatments without WTR amendment.
Similarly, DPS values of the manure-treated plots decreased by 83 % (N-based) and 82 % (P-
based). The decrease of the DPS values from the WTR amended plots treated with biosolids was
also significant (p = 0.013). For the plots treated with Boca Raton biosolids, the reduction in the
DPS values ranged between 49 % (N-based) to 60 % (P-based). For the Pompano biosolids-
treated plots, the reduction ranged from 48 % (N-based) to 53 % (P-based). The magnitude of

56
DPS reduction due to WTR effect was less in the biosolids-amended plots because the biosolids
contained moderate amounts of Fe and Al. For example, Boca Raton biosolids contained 9.4 g Al
kg-1 and 24.3 g Fe kg-1 and the Pompano biosolids contained 9.2 g Al kg-1 and 32.8 g Fe kg-1
(Table 3-1). The poultry manure (N-based) - and the TSP-treated plots, without WTR
amendments, had DPS values of 84 to 93 %, respectively, which suggest that these treatments
could contribute significant amounts of P in runoff and/or leaching.
Plots amended with WTR also had significantly lower water extractable P (Figure 3-2)
concentrations than the plots without WTR amendment. Similar trends were observed for the Fe-
strip extractable P concentrations (data not presented). Thus, the effectiveness of WTR in
reducing soluble P levels was observed with Fe strip and water extraction data. For all P sources
and rates of application, WTR amended plots released significantly less P (had lower WEP
values) than the plots not treated with WTR (Figure 3-2). Immobilization of P by WTR also
masked differences in P-source and P-rate. There were no differences in soil WEP values among
the P sources and the rate of application (N-based and P-based) when the soil was amended with
WTR. In the absence of WTR, there were differences among both the P sources and between the
rates of application.
As expected, the total- and oxalate extractable Fe+Al concentrations of the samples were
significantly greater in the WTR amended plots than the plots not amended with the WTR
(Figure 3-3). Iron and Al hydroxides are major sorbents for oxyanions in soil. An increase in the
sorbent content of the amended plots is expected to increase the P sorption capacity of the
amended plots. Dayton et al. (2003) found a significant relationship (r2 = 0.69, p = 0.01)
between oxalate extractable Al concentration (Alox) and the maximum P sorption capacity (Pmax).
Elliott et al. (2002b) found that the P sorbing ability of different types of WTR (Al-or Fe-based),

57
when added to a sandy soil amended with biosolids, could be predicted based on the amorphous
metal oxide content of the WTRs. Similarly, Lookman et al. (1995) found that after 880 hours,
soil P desorption from 44 German soils was inversely related to soil (Feox + Alox). The increased
Fe and Al concentrations in the soils studied here were reflected in the DPS analysis, which
showed significantly (p < 0.001) lower DPS values for the WTR amended plots than for the
unamended plots (Figure 3-1). The lower DPS values indicate the potential of WTR amendments
to immobilize soluble P and to reduce P-source impacts on water quality.
0
0.2
0.4
0.6
0.8
1
1.2
Controls
Manure-
N, no W
TR
Manure-
N, WTR
Manure-
P, no W
TR
Manure-
P, WTR
Boca-N, n
o WTR
Boca-N, W
TR
Boca-P, n
o WTR
Boca-P, W
TR
Pompano-N
, no W
TR
Pompano-N
, WTR
Pompano-P, n
o WTR
Pompano-P, W
TR
TSP-N, n
o WTR
TSP-N, W
TR
TSP-P, no W
TR
TSP-P, WTR
Treatments
DPS
WTR amended vs. control NS Plots without WTR vs. control ***Plots without WTR vs. WTR amended ***WTR amended N rate vs. P rate NS n 102
*** indicates significance at p< 0.001; NS indicates non-significant Figure 3-1. Differences in degree of phosphorus saturation (DPS) in A horizon (0-5 cm) samples
taken in June 2003 and Jan. 2004. Error bars denote one standard deviation.

58
0
2
4
6
8
10
12
14
16
18
20
Controls
Manure-
N, no W
TR
Manure-
N, WTR
Manure-
P, no W
TR
Manure-
P, WTR
Boca-N, n
o WTR
Boca-N, W
TR
Boca-P, n
o WTR
Boca-P, W
TR
Pompano-N
, no W
TR
Pompano-N
, WTR
Pompano-P, n
o WTR
Pompano-P, W
TR
TSP-N, n
o WTR
TSP-N, W
TR
TSP-P, no W
TR
TSP-P, WTR
Treatments
Wat
er e
xtra
ctab
le P
(mg
kg-1
)
WTR amended vs. control NS Plots without WTR vs. control *** Plots without WTR vs. WTR amended *** WTR amended N rate vs. P rate NS n 102
*** indicates significance at p< 0.001; NS indicates non-significant Figure 3-2. Differences in water extractable P values in A horizon soil samples (0-5 cm) taken in
June 2003 and Jan. 2004. Error bars denote one standard deviation.
Total- and oxalate extractable -P, Fe and Al values for the E and Bh horizon samples from
plots with and without WTR amendments were similar for various amendments (data not
presented), and similar to values from the samples collected to initially characterize the site
(Table 3-2). The data suggest no impact of the surface applied amendments on the lower
horizons. The samples taken in January 2004 showed a slight increase in both total- and 200 mM
oxalate extractable P in the Bh horizons of the plots treated with poultry manure or TSP without
WTR amendments (data not presented). Although these increases in P contents were not
statistically significant, they may suggest P losses from the A horizon and subsequent
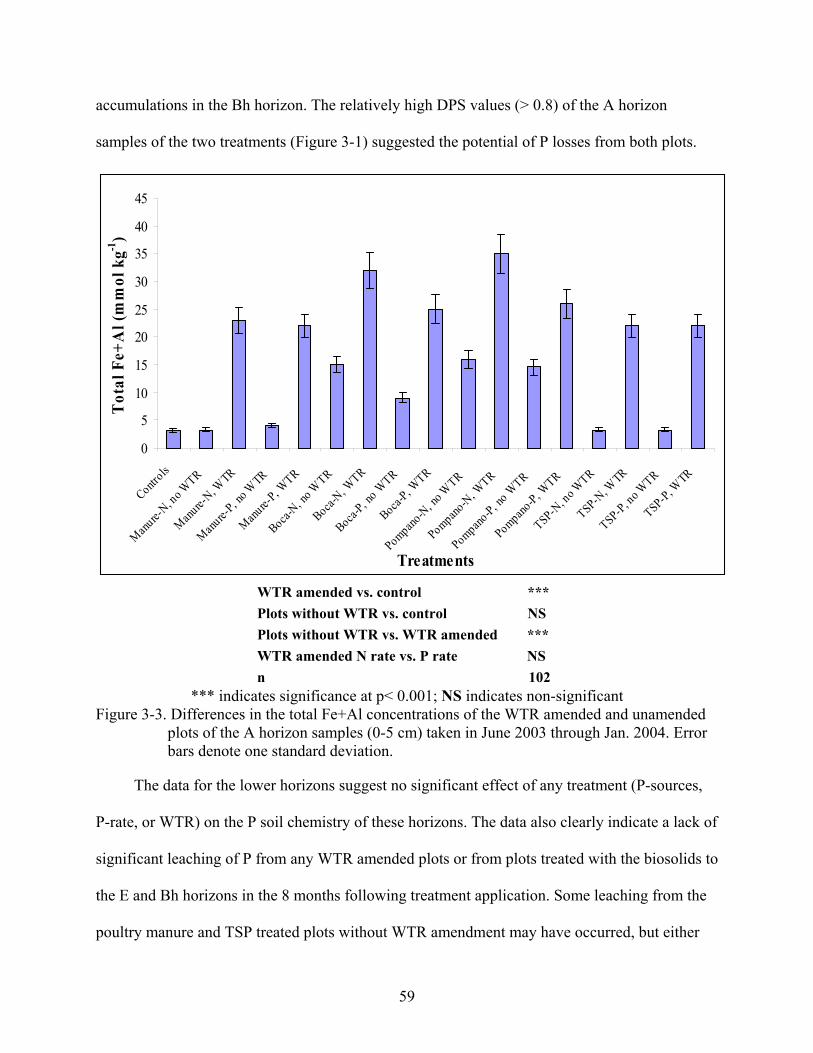
59
accumulations in the Bh horizon. The relatively high DPS values (> 0.8) of the A horizon
samples of the two treatments (Figure 3-1) suggested the potential of P losses from both plots.
0
5
10
15
20
25
30
35
40
45
Controls
Manure-
N, no W
TR
Manure-
N, WTR
Manure-
P, no W
TR
Manure-
P, WTR
Boca-N, n
o WTR
Boca-N, W
TR
Boca-P, n
o WTR
Boca-P, W
TR
Pompano-N
, no W
TR
Pompano-N
, WTR
Pompano-P, n
o WTR
Pompano-P, W
TR
TSP-N, n
o WTR
TSP-N, W
TR
TSP-P, no W
TR
TSP-P, WTR
Treatments
Tot
al F
e+A
l (m
mol
kg-1
)
WTR amended vs. control *** Plots without WTR vs. control NS Plots without WTR vs. WTR amended *** WTR amended N rate vs. P rate NS n 102
*** indicates significance at p< 0.001; NS indicates non-significant Figure 3-3. Differences in the total Fe+Al concentrations of the WTR amended and unamended
plots of the A horizon samples (0-5 cm) taken in June 2003 through Jan. 2004. Error bars denote one standard deviation.
The data for the lower horizons suggest no significant effect of any treatment (P-sources,
P-rate, or WTR) on the P soil chemistry of these horizons. The data also clearly indicate a lack of
significant leaching of P from any WTR amended plots or from plots treated with the biosolids to
the E and Bh horizons in the 8 months following treatment application. Some leaching from the
poultry manure and TSP treated plots without WTR amendment may have occurred, but either
60
the effect was small and insignificant or the leached P was not captured in the depths or
frequency of sampling.
The data from the Kirton Ranch field study support the conclusions made from the lab
study (chapter 2) and some other studies (Elliott et al., 2002b; Dayton et al., 2003; Makris et al.,
2004a,b; 2005abc; O’Connor et al, 2005) that WTR is effective in immobilizing P. The field data
suggest that application of alum-based WTRs to P-impacted soils could serve as a practical
chemical-based BMP. Applying alum-based WTRs to soils can increase soil P sorption capacity,
thereby, potentially reducing off-site P movement from fields via runoff and leaching. Reducing
off-site P transport may lower P loads into nutrient sensitive surface water systems, thereby
minimizing the occurrence of eutrophication. However, the magnitude of the soil P sorption
increase will depend on the P binding effectiveness of the WTRs. Different WTRs have widely
different characteristics (chapter 2), therefore for such field studies, it is imperative to identify
effective WTRs through preliminary lab studies.
Evidence of Field Contamination through Hurricane-induced Flooding
The soil P-related measurements taken in the samples collected after the hurricanes in fall
2004 (Dec. 2004) were not consistent with those observed for the samples collected in June
2003, Jan 2004, or March 2004. The total P concentrations of the A horizon (0-5 cm) soil
samples taken from the WTR amended plots in Dec. 2004 were significantly less (p = 0.02) than
those taken in June 2003 and Jan. 2004 (Figure 3-4). The reduction of P concentrations in the
WTR amended plots cannot be attributed to WTR immobilization because similar reductions
were observed for total Fe + Al concentrations (Figure 3-5) and oxalate extractable Fe + Al
concentrations in the WTR amended plots of A horizon (both 0-5 cm) soil samples (data not
presented). Conversely, total P concentrations increased in the control plots and the plots not
amended with WTR (Figure 3-4). There were no intentional P applications to these plots after the
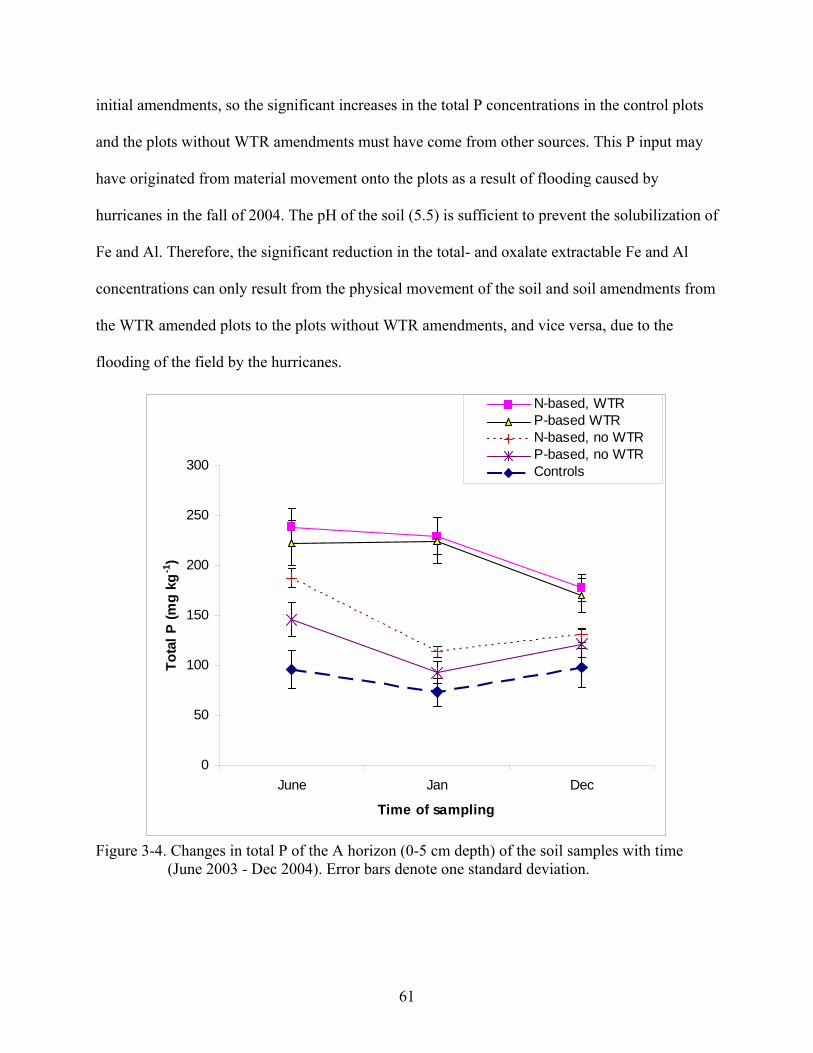
61
initial amendments, so the significant increases in the total P concentrations in the control plots
and the plots without WTR amendments must have come from other sources. This P input may
have originated from material movement onto the plots as a result of flooding caused by
hurricanes in the fall of 2004. The pH of the soil (5.5) is sufficient to prevent the solubilization of
Fe and Al. Therefore, the significant reduction in the total- and oxalate extractable Fe and Al
concentrations can only result from the physical movement of the soil and soil amendments from
the WTR amended plots to the plots without WTR amendments, and vice versa, due to the
flooding of the field by the hurricanes.
0
50
100
150
200
250
300
June Jan Dec
Time of sampling
Tota
l P (m
g kg
-1)
N-based, WTRP-based WTRN-based, no WTRP-based, no WTRControls
Figure 3-4. Changes in total P of the A horizon (0-5 cm depth) of the soil samples with time
(June 2003 - Dec 2004). Error bars denote one standard deviation.

62
0
20
40
60
80
100
120
140
160
180
June Jan Dec
Time of sampling (mo)
Tota
l Fe+
Al (m
mol
kg
-1)
N-based, WTRP-based WTRN-based, no WTRP-based, no WTRControls
Figure 3-5. Changes in total Al + Fe of the A horizon (0-5 cm depth) of the soil samples with
time (June 2003 - Dec 2004). Error bars denote one standard deviation.
Compared to data from the June 2003 and Jan. 2004 samples, the Mehlich 1- (M1-P), Iron
strip- (ISP), and water extractable P (WEP) values of the samples taken in Dec. 2004 showed
greater variability. The M1-P, ISP, and WEP values of the samples taken from the A (0-5 cm)
horizon in Dec. 2004 (Table 3-5) showed inconsistent trends among the respective P values
(compared to samples taken in June 2003 and Jan. 2004). The M1-P and the ISP values of the
WTR amended plots sampled in Dec. 2004 were significantly greater than values in Jan. 2004
samples, but not statistically different from the results of the June 2003 samples (data not
presented). The reduction of the ISP in the Jan 2004 samples of the WTR amended plots
(compared to June 2003 samples) was attributed to P immobilization by WTR. The sudden

63
increase (Dec 2004) in ISP values of the WTR amended plots is difficult to explain since there
had not been any intentional P application to the fields.
Table 3-5. Water-, iron strip- and Mehlich 1 extractable P concentrations of soil samples collected from the A horizon (0-5 cm) in Dec. 2004. All values are expressed in mg kg-1.
Treatments WEP ISP M-1P Controls 11.1 ± 1.31† 10.5 ± 0.94† 18.4 ± 13.5††
Manure-N, no WTR 14.5 ± 11. 5†† 21.3 ± 14.2†† 29.7 ± 22.9†† Manure-N, WTR 4.45 ± 3.15†† 10.8 ± 3.51† 28.6 ± 2.81††
Manure-P, no WTR 12.0 ± 1.20† 17.4 ± 6.11†† 43.5 ± 23.4† Manure-P, WTR 7.71 ± 9.91†† 25.7 ± 15.9†† 40.4 ± 16.8†† Boca-N, no WTR 21.0 ± 7.10† 25.2 ± 3.60† 25.7 ± 4.42† Boca-N, WTR 2.59 ± 0.64† 16. 6 ± 7.52†† 72.4 ± 33.9†† Boca-P, no WTR 25.6 ± 15.6† 28.2 ± 12.6†† 26.0 ± 18.0†† Boca-P, WTR 3.79 ± 3.02†† 10.5 ± 4.73† 32.0 ± 14.1† Pompano-N, no WTR 17.1 ± 1.33† 19.9 ± 1.60† 24.7 ± 11.7† Pompano-N, WTR 5.65 ± 7.21†† 12.8 ± 8.21†† 41.7 ± 27.9† Pompano-P, no WTR 17.5 ± 12.9† 16.3 ± 14.5† 39.8 ± 20.1† Pompano-P, WTR 5.07 ± 3.89† 12.2 ± 5.32† 26.5 ± 2.44† TSP-N, no WTR 14.6 ± 7.03† 16.5 ± 12.4† 21.3 ± 19.1† TSP-N, WTR 5.98 ± 3.44† 13.5 ± 0.54† 27.3 ± 12.8† TSP-P, no WTR 12.4 ± 4.50† 11.2 ± 3.02† 24.9 ± 3.83† TSP-P, WTR 5.78 ± 6.14† 9.71 ± 4.10† 28.3 ± 18.1†
† Numbers are the average of three replicated plots ± one standard deviation. †† Numbers are the average of six samples (two samples each from three replicated plots) ± one standard deviation.
The absolute values of the ISP and M1-P values of the samples from plots without WTR
amendments were slightly increased from those observed in Jan. 2004, but the increase was not
significant. The control plots, however, showed a continuous decrease in ISP concentrations
from June 2003 through Dec. 2004, but an increase in M1-P values in Dec. 2004 samples
(compared to Jan. 2004 samples). The water extractable P (WEP) values showed a similar
behavior to the ISP values, but the increases in the WEP values from the Jan. 2004 data were not
significant. The inconsistencies observed in the M1-P, ISP and WEP values are difficult to
explain, but are consistent with the contention that physical movement of soil and soil

64
amendments occurred in the field as a result of the flooding, which affected P chemistry of the
field sites.
Stability of WTR immobilized Phosphorus
Despite the hurricane-induced flooding of the field that resulted in the contamination of the
individual plots, some P values of the samples collected after the hurricanes still showed the
effectiveness of WTR in reducing soluble P levels. The ISP and WEP values measured from the
A (0-5 cm) horizon plots amended with WTR were significantly lower (p = 0. 03 and 0. 01,
respectively) than values from the plots without WTR amendments (Figures 3-6 and 3-7).
Similar behavior was observed in the A (0-15 cm) soil samples (data not presented). The ISP and
WEP data suggest that, despite the flooding of the field, most of the WTR immobilized P
remained stable.
The persistent effect of the WTR amendment was also clearly shown in the increase of
Fe+Al concentrations of the plots of the surface (0-5 cm) horizon (Figure 3-8). There was a
highly significant (p = 0.01) increase of total Fe+Al content of the WTR amended plots, across
P-sources and source-rate treatments. The consistently high Al and Fe content of the WTR
amended plots suggests that those plots maintained the capacity to sorb P.
The DPS values of the WTR amended plots sampled in Dec. 2004 were significantly (p =
0.01) smaller than those of the plots without WTR amendments (Figure 3-9). The DPS values of
the WTR amended plots from the TSP treated plots decreased by 74 % (N-based) and 72 % (P-
based) compared to the same treatments without WTR. Similarly, DPS values of the manure-
treated plots decreased by 70 % (N-based) and 78 % (P-based). The decrease of the DPS levels
from the WTR amended plots treated with biosolids was also significant (p = 0.020). For the
plots treated with Boca Raton biosolids, the reduction in the DPS values ranged between 53 %
(N-based) to 46 % (P-based).

65
0
5
10
15
20
25
30
Control P-based, No WTR P-based, + WTR N-based, No WTR N-based, + WTR
Treatments
Iron-
strip
ext
ract
able
P (m
g kg
-1)
Figure 3-6. Differences in iron strip P values from the A horizon (0-5 cm) of the soil samples
taken in Dec. 2004. Error bars denote one standard deviation.
0
5
10
15
20
25
Control P-based, No WTR P-based, + WTR N-based, No WTR N-based, + WTR
Treatments
Wat
er e
xtra
ctab
le P
(mg
kg-1)
Figure 3-7. Differences in water extractable P values from the A horizon (0-5 cm) of the soil
samples taken in Dec. 2004. Error bars denote one standard deviation.

66
For the Pompano biosolids-treated plots, the reduction ranged from 55 % (N-based) to 51
% (P-based). The loss of P (through leaching and/or runoff), coupled with the “mixing” of
treatments in the soil surface resulted in a significant reduction of the DPS values in the control
plots and the plots without WTR amendments, compared to the DPS values obtained for the June
2003 to March 2004 soil samples (Figure 3-1). Nevertheless, the DPS values of the WTR
amended plots remained below the threshold value of 25% (Nair et al., 2004). This suggests that,
despite the flooding of the field, the WTR amended plots retained the capacity to retard P
movement.
0
5
10
15
20
25
30
Control P-based, No WTR P-based, + WTR N-based, No WTR N-based, + WTR
Treatments
Tota
l Fe+
Al c
onc.
mm
ol k
g-1)
Figure 3-8. Differences in total Fe + Al concentrations from the A horizon (0-5 cm) soil samples
taken in Dec. 2004. Error bars denote one standard deviation.
The E horizons had similar total- and oxalate extractable P concentrations among all the
plots sampled in Dec. 2004 (data not presented). The respective P concentrations obtained with
the other extractants (Water, Iron-strip and Mehlich 1) were also similar among the P sources-
and P rates-treated plots, with and without WTR amendment (data not presented). The total- and

67
oxalate extractable Fe and Al concentrations were similar in all the plots as well (data not
presented). Similar values were obtained for P, Fe and Al in the samples taken in June 2003 and
Jan 2004, suggesting that there were no impacts of the surface applied amendments on the E
horizon. If P leached, P movement was unrestricted through the E horizon.
0
0.1
0.2
0.3
0.4
0.5
0.6
0.7
0.8
0.9
Controls
Manure-
N, no W
TR
Manure-
N, WTR
Manure-
P, no W
TR
Manure-
P, WTR
Boca-N, n
o WTR
Boca-N, W
TR
Boca-P, n
o WTR
Boca-P, W
TR
Pompano-N
, no W
TR
Pompano-N
, WTR
Pompano-P, n
o WTR
Pompano-P, W
TR
TSP-N, n
o WTR
TSP-N, W
TR
TSP-P, no W
TR
TSP-P, WTR
Treatments
DPS
Figure 3-9. Differences in DPS values of the WTR amended and unamended plots of the A
horizon (0-5) samples taken in Dec. 2004. Error bars denote one standard deviation of three replicates.
The absolute values of the total- and oxalate extractable P concentrations of the samples
taken in the Bh horizon were greater in the control plots and the plots without WTR amendments
than those found in the WTR amended plots (data not presented). Similar behavior was observed
for the water extractable P, Fe-strip P and Mehlich 1- P data (data not presented). Comparing the
WEP values with those observed previously (June 2003 and Jan. 2004), a significant (p = 0.03)
increase in the WEP values was observed in the control plots and the plots without WTR
amendments (Figure 3-10). The WEP values of the WTR amended plots did not significantly
increase, although the absolute values increased slightly. Similar behavior was observed for the
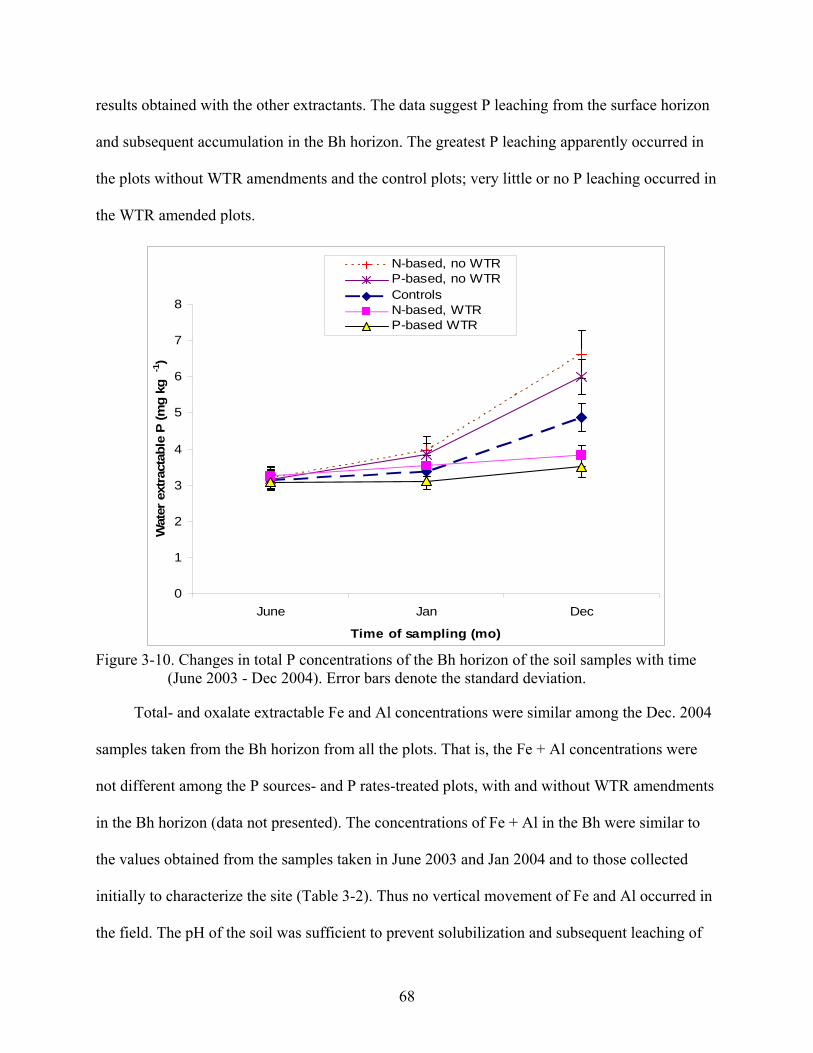
68
results obtained with the other extractants. The data suggest P leaching from the surface horizon
and subsequent accumulation in the Bh horizon. The greatest P leaching apparently occurred in
the plots without WTR amendments and the control plots; very little or no P leaching occurred in
the WTR amended plots.
0
1
2
3
4
5
6
7
8
June Jan Dec
Time of sampling (mo)
Wat
er e
xtra
ctab
le P
(mg
kg-1)
N-based, no WTRP-based, no WTRControlsN-based, WTRP-based WTR
Figure 3-10. Changes in total P concentrations of the Bh horizon of the soil samples with time
(June 2003 - Dec 2004). Error bars denote the standard deviation.
Total- and oxalate extractable Fe and Al concentrations were similar among the Dec. 2004
samples taken from the Bh horizon from all the plots. That is, the Fe + Al concentrations were
not different among the P sources- and P rates-treated plots, with and without WTR amendments
in the Bh horizon (data not presented). The concentrations of Fe + Al in the Bh were similar to
the values obtained from the samples taken in June 2003 and Jan 2004 and to those collected
initially to characterize the site (Table 3-2). Thus no vertical movement of Fe and Al occurred in
the field. The pH of the soil was sufficient to prevent solubilization and subsequent leaching of

69
Fe and Al into lower horizons. This observation suggests that the increased P content of the Bh
horizon may have occurred through leaching from the overlying A horizon. The data suggest that
there was significant leaching of P from the surface horizon following the hurricane-induced
flooding of the field. The amounts of P leached from the plots without WTR amendments were
significantly greater than from WTR amended plots. Thus, despite the extensive flooding of the
fields, the WTR was able to retain the immobilized P, and prevent excessive P leaching.
The combined data from this field study strongly suggest that WTR is effective in reducing
P mobility and could be relied upon to reduce P movement in surface runoff and leachates. In a
column leaching study, Silveira et al. (2006) observed that Al-WTR continued to reduce the
concentration of P leached for 36 weeks, and concluded that WTR immobilized P is stable.
Based on the results of spectroscopic studies, Makris and O’Connor (2006) concluded that once
P reaches the WTR microsites, very strong adsorption, and highly hysteretic desorption
apparently occurs. Thus, once immobilized by the WTR particles, the P is likely irreversibly
bound, unless the structure of the WTR is destroyed under very extreme conditions.

70
CHAPTER 4 AGING AND pH EFFECTS ON LABILITY OF DRINKING-WATER TREATMENT
RESIDUALS (WTR) IMMOBILIZED PHOSPHORUS
Introduction
The use of drinking-water-treatment residuals (WTRs) to control excessive soluble P
concentrations in highly P-impacted soils has received increased attention in recent years. Short-
term laboratory, greenhouse, and rainfall simulation studies have demonstrated WTR efficacy in
reducing soluble P concentrations in runoff and leaching from areas amended with animal
manure, biosolids and/or inorganic P fertilizers (Peters and Basta, 1996; Basta and Storm, 1997;
Elliott et al., 2002a,b; O’Connor et al., 2002; Dayton et al., 2003; Makris, 2004; Makris et al.,
2004a,b; Novak and Watts, 2004; Dayton and Basta, 2005; Elliott et al., 2005; Makris et al.,
2005a,b,c; Novak and Watts, 2005; Silveria et al., 2006). The long-term stability of WTR
immobilized P, however, is an issue that has not been thoroughly explained or documented.
Time constraints associated with conducting long-term (> 20 years) field experiments to test the
stability of WTR sorbed P inhibit improved understanding of the fate of sorbed P in soils. One
approach to overcome this constraint is to artificially “age” freshly amended soil samples to infer
the long-term stability of WTR immobilized P. Artificial aging of fresh WTR amended soil
samples can be achieved through incubation at elevated temperatures or through repeated wetting
and drying. Aging transforms metal oxides (dissolution, crystallization and re-crystallization)
and affects their sorption capacities (Ma and Uren, 1997; Frau, 2000; Kennedy et al., 2004;
Makris et al., 2005c).
Contrasting theories exist for the solubility of aged suspensions of ions sorbed onto Fe and
Al oxides. The classic theory holds that structural reorganization of an amorphous solid phase
results in the incorporation of a sorbed ion into the solid structure of the metal oxide forming a
“solid solution” (Spadini et al., 1994). The solubility of long-range ordered oxides is orders of
71
magnitude less than that of the amorphous solid, and the vulnerability of these oxides to
microbial iron reduction is also reduced (Postma and Jakobsen, 1996). Martinez and McBride
(1998) synthesized aged Cd, Cu, Pb and Zn coprecipitates with amorphous iron hydroxides at
70 °C thermal heating for 2 months. The aging process decreased Cd and Zn solubility when the
coprecipitate was formed by slow titration (0.03 mL min-1). Ainsworth et al. (1994) observed the
incorporation of Co and Cd into the hydrous iron oxide structure after 20 weeks of aging at room
temperature.
The classic theory of decreasing metal solubility as pure minerals or soil solid phases age
with time, however, does not apply to all metals. Martinez et al. (1999) demonstrated that Pb
initially sorbed onto soil oxides and ferrihydrite [Fe(OH)3.xH2O], was released into solution after
thermally-treating the minerals for 2 months at 70 °C. Ford et al. (1997) conducted an aging
experiment (pH 6, heating at 40-70 °C for 2-6 weeks) and attributed Pb desorption from an
amorphous Fe solid phase to the reduction in available sorption sites due to crystallization of an
iron (hydr)oxide structure. Martinez et al. (2001) studied Pb solubility at 70 ºC after prolonged
aging (1.5 years) of suspensions of soil samples containing noncrystalline aluminosilicates and
oxides of Fe and Al as predominant reactive surfaces. Crystallization of the Fe phases to goethite
occurred and Pb was released into solution
Kennedy et al. (2004) showed that repeated wetting and drying can induce structural
changes in metal oxides. The researchers dried synthetic MnO at 37 oC for 24 hours, and then
hydrated it for 24 hours, with wetting and drying cycles repeated three times, over 7 days.
Repeated wetting and drying resulted in a non-reversible decrease in particle size. After the
seven-day incubation period, total proton binding capacities determined by acid-base titrations
decreased with cyclically re-wetting and drying. However, visual inspection by scanning electron

72
microscopy revealed fine-grained, amorphous particles and XRD results indicated no
crystallinity (Kennedy et al., 2004). The authors therefore concluded that detectable bulk
changes in crystallinity would only occur over longer timescales in natural low temperature
surface environments. Frau (2000) also reported that precipitation and dissolution cycles of some
secondary iron and manganese oxides are strongly influenced by seasonal wetting and drying
cycles, and accelerate structural changes. In an incubation study, drying and rewetting cycles led
to irreversible formation of a hydration layer on goethite that accounted for stability of goethite
crystals deposited from aqueous suspension (Frau, 2000).
Misra and Teixera (2001) used soil phenomenon to explain the structural changes
occurring as a result of wetting and drying, and suggested that the entry of water into a dry soil
produced internal and external forces that promoted aggregate breakdown. Internal forces due to
water entry may arise from the release of entrapped air (Marshall et al., 1996). Aggregate
breakdown can change soil structure by modifying the size and stability of aggregates and soil
porosity. Upon drying, soil material may reorganize leading to coalescence of neighboring soil
material. The process of aggregate breakdown and reorganization resulting from cycles of
wetting and drying may induce similar structural changes in WTRs.
Drinking-water treatment residuals are enriched in amorphous Fe or Al hydroxides, and
aging is expected to produce similar physicochemical transformations as observed for metal
oxides. Makris (2004) observed decreased specific surface area (SSA) of an Al-WTR thermally
incubated at 46 oC and 70 oC for 2 years. We hypothesized that the structural reorganization
associated with aged metal oxides contained in the WTRs would stabilize immobilized P, even
when important soil properties (e.g. pH) change. This study was, therefore, conducted to (i)
evaluate the changes in lability of WTR immobilized P in artificially aged WTR amended soil

73
samples, and (ii) determine the effect of pH on the lability of WTR immobilized P using a
modified isotopic dilution technique coupled with a stepwise acidification procedure.
Materials and Methods
Sample Preparation
Four WTRs, three alum-based with high P sorption capacities (Bradenton, Lowell and
Holland WTRs) and one iron-based (Cocoa WTR) with a low P sorption capacity (chapter 2)
were utilized for this study. Subsamples (< 2 mm) of each WTR were reacted for 7 days with P
solutions at a P load of 10,000 mg P kg-1 in 1:10 WTR:0.01 M KCl suspensions (P-impacted
WTRs). The pH was not controlled and the suspensions were not shaken during the equilibration
period. After equilibration with added P, the WTRs were air dried. Non-treated (no added P)
WTR samples were also included in an incubation experiment, described later.
Unamended surface soil from the Immokalee fine sand (sandy, siliceous, hyperthermic
Arenic Alaquods) and collected from the University of Florida Research and Education Center in
Immokalee, FL, was used for incubation studies. (Detailed descriptions of the soil and WTR
properties are presented in chapter 2). The soil was air-dried and passed through a 2 mm sieve
before amending with 25 g kg-1 of air-dried subsamples of the four WTRs (not P-impacted)
described above. Phosphorus was added as triple superphosphate (TSP) solution at three rates:
zero, low, and high to roughly mimic field application rates. The “low rate” of 43 mg P kg-1
(~86 kg ha-1) still exceeds the range (44-65 kg P ha-1) recommended for pasture grass raised for
hay on P deficient soils (Adjei and Mislevy, 2001). The “high” P rate equals 100 mg P kg-1 soil,
and represents a highly P-impacted soil. Fertilizer-P was dissolved in 0.01 M KCl and added to
generate a solid:solution ratio of 1:10. The soil-WTR suspensions were reacted for 7 d at room
temperature, without stirring. After the equilibration the amended soil suspensions were
centrifuged and the supernatants were decanted.
74
Three replicates were used and a total of forty-five samples were studied. The experimental
design was a completely randomized design (CRD) with treatments as:
no P, no WTR low P, no WTR high P, no WTR no P, WTR (BR) low P, WTR (BR) high P, WTR (BR) no P, WTR (HL) low P, WTR (HL) high P, WTR (HL) no P, WTR (LW) low P, WTR (LW) high P, WTR (LW) no P, WTR (CO) low P, WTR (CO) high P, WTR (CO)
where letters in parentheses are abbreviations for the four WTRs: BR = Bradenton,
HL = Holland, LW = Lowell and CO = Cocoa WTRs.
Thermal Incubation
Subsamples of the equilibrated samples (both the WTR and WTR amended soil samples)
were placed in incubators maintained at 23, 46, and 70 oC. P-treated and untreated samples of the
four WTRs were incubated in the lab for 4.5 years. No attempt was made to control soil moisture
during incubation. The heat treatment was applied to encourage structural changes that might
mimic long-term weathering reactions in the field. We hypothesized that elevated temperatures
would provide the necessary thermal energy for structural rearrangements with time. The
changes in particle conformation, towards a lower free energy of the system, would either
exclude or occlude sorbed P by the Al-WTR. Two batches of samples were thermally incubated
concurrently. The first batch was started in spring 2002 for spectroscopic studies, detailed by
Makris (2004), but the incubation was allowed to continue for the current P lability study. Since
no lability data for the samples had been generated in the first years of incubation, a second batch
of identically prepared samples were incubated, beginning in summer 2005, to measure the
‘initial’ labile P concentrations. Subsamples were collected at time zero, 1 month, 5 months, 1
year (for the ‘second batch’ samples), and at 3.5, 4 and 4.5 years (for the ‘first batch’ samples)
after the initiation of the incubation. Subsamples were analyzed for labile P concentrations using
a modified isotopic dilution technique coupled with a stepwise acidification procedure.
75
Wet-and-Dry Incubation
Phosphorus-equilibrated samples (both the WTR and WTR amended soil samples) were
placed in an incubator at 23 oC and kept wet (~ 80 % of water holding capacity) for 7 days, and
then allowed to dry for 7 d. The wet and dry cycles (54) continued for 2 years. Representative
samples were taken at time zero, 5 months, 1 year, 1.5 years, and 2 years of incubation and
analyzed for labile P concentrations using a modified isotopic dilution technique coupled with a
stepwise acidification procedure.
Determination of Labile Pools of Phosphorus
Two grams (oven-dry equivalent) of each soil or WTR sample was placed in centrifuge
tubes to which 20 mL of deionized water was added, giving a solid-to-solution ratio of 1:10, as
suggested by Morel and Torrent (1997). Two drops of toluene were added to each suspension
and appropriate aliquots of diluted HCl and NaOH were added daily to the samples to provide a
series of 5 pH levels (3-7) for each treatment. The soil suspensions were equilibrated for 4 days
in an end-over-end shaker. The samples were then spiked with 50 µL of a solution containing 32P
(500 kBq mL-1) and returned to the shaker to isotopically equilibrate for 3 days. After
equilibration, samples were centrifuged at 4200 x g for 10 min and filtered through 0.2-µm filters
(Sartorius). Activities of radioactive P in the filtrates were assessed using liquid scintillation
(Beckman LS 5801) counting. Water extractable P was determined colorimetrically using the
method of Murphy and Riley (1962). All analyses were performed in triplicate and included
blanks. The total activity introduced in each sample was determined by analyzing spiked
solutions, without soil, in parallel with the soil suspensions (Lombi et al., 2003). The labile pools
(E) of P were determined as reported in Hamon et al. (2002):
E = (Csol/C§sol) R * (V/W) [1]
76
where Csol is the concentration of water extractable P in solution (µg mL-1), C§sol is the
activity of radioisotope remaining in solution after equilibration (Bq mL-1), R is the total activity
of radioisotope added to each sample (Bq mL-1), and V/W is the ratio of solution to sample,
which in this case was 10 mL g-1.
The percent labile P (% E) recovered was calculated as:
% E = E / (total P at ‘native’ pH of soil) * 100 [2]
where E is the labile pool of P calculated from equation [1]
Total P was determined using ICP-AES following digestion with the USEPA 3050A method
(USEPA, 1986).
Preliminary experiments were conducted to determine the suitability of the isotopic
dilution technique to assess P lability in WTRs and WTR amended soils. The effects of soil
(or WTR):solution ratio, equilibration time, filter size, and centrifuge speed on the P
concentrations in solution were also determined.
Determination of Oxalate Extractable Phosphorus
Two oxalate extract concentrations (5 and 200 mM) in buffered solutions (Schoumans,
2000) were utilized to determine the P concentrations of the sampled WTR and amended soil. A
1:60 soil (or WTR):solution ratio, shaken for 4 hours in the dark and filtered (0.45 µm), were
analyzed for P, Al, and Fe by ICP-AES (Perkin-Elmer Plasma 3200. The insensitivity of the
200 mM oxalate treatment in extracting P from WTRs prompted us to also use a milder
extractant (5 mM oxalate). The 5 mM oxalate extract has also been used to assess P availability
in soils (Bhatti et al., 1995).
Quality Control
All sample collection/handling/chemical analysis was conducted according to a standard
QA/QC protocol. For each set of samples, a standard curve was constructed (R2 > 0.998).
77
Method reagent blanks were appropriately used. A 5% matrix spike of the set was used to
determine the accuracy of the data obtained, with recoveries ranging from 96-103% of the
expected values. Another 5% of the set was used to determine the precision of the measurements
(triplicates). Analyses that did not satisfy the above QA/QC protocol were rerun.
Statistical Analyses
Data were analyzed as a factorial experiment with the completely randomized design
(CRD) using the general linear model, PROC GLM, procedure of the SAS software (SAS Inst.,
1999). The means of the various treatments were separated using a single degree of freedom
orthogonal contrast procedure. Correlation analysis, with the PROC CORR procedure of the SAS
software (SAS Inst., 1999), was used to evaluate the relationship between the two incubation
(thermal and wet-and-dry) methods.
Results and Discussion
The isotopic dilution technique has been widely employed for estimating the total available
pool of P in soils, often termed the ‘E-value’ (e.g. Talibudeen; 1957; Tran et al., 1988; Morel and
Plenchette, 1994), as well as P availability in different fertilizer sources (e.g. Hendricks and
Dean, 1947; Frossard et al., 1996). However, preliminary studies showed that the isotopic
dilution technique was not appropriate for determining the labile pools of P in WTRs. The high
P-sorption capacity of the WTRs led to sorption of the added 32P, instead of isotopic exchange
with the WTR-P (31P), which over-estimated the labile P pools of the WTRs. The oxalate
extraction procedure (5 and 200 mM) was used instead to assess the effect of aging on P
extractability from the WTRs.
Relative Effectiveness of the WTRs
Incubations were performed with four WTRs (Holland, Bradenton, Lowell, and Cocoa),
and soils amended with these four WTRs, with and without prior P addition (P-impacted WTR).
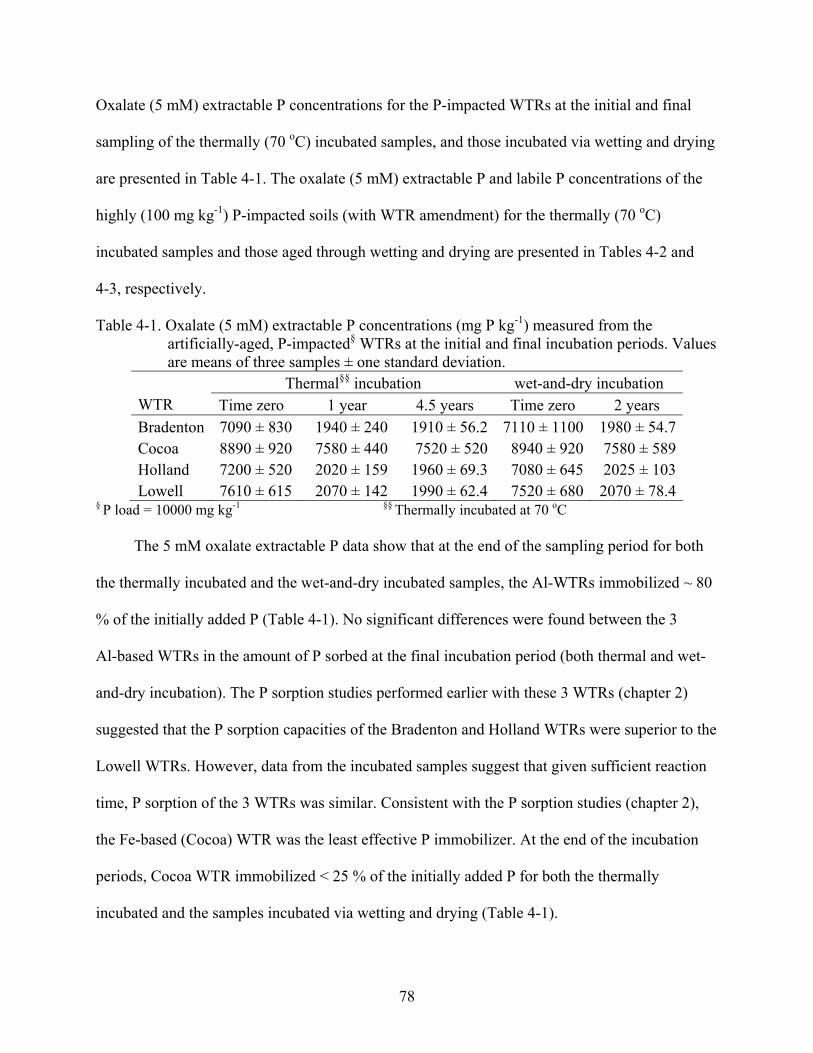
78
Oxalate (5 mM) extractable P concentrations for the P-impacted WTRs at the initial and final
sampling of the thermally (70 oC) incubated samples, and those incubated via wetting and drying
are presented in Table 4-1. The oxalate (5 mM) extractable P and labile P concentrations of the
highly (100 mg kg-1) P-impacted soils (with WTR amendment) for the thermally (70 oC)
incubated samples and those aged through wetting and drying are presented in Tables 4-2 and
4-3, respectively.
Table 4-1. Oxalate (5 mM) extractable P concentrations (mg P kg-1) measured from the artificially-aged, P-impacted§ WTRs at the initial and final incubation periods. Values are means of three samples ± one standard deviation.
Thermal§§ incubation wet-and-dry incubation WTR Time zero 1 year 4.5 years Time zero 2 years Bradenton 7090 ± 830 1940 ± 240 1910 ± 56.2 7110 ± 1100 1980 ± 54.7Cocoa 8890 ± 920 7580 ± 440 7520 ± 520 8940 ± 920 7580 ± 589Holland 7200 ± 520 2020 ± 159 1960 ± 69.3 7080 ± 645 2025 ± 103Lowell 7610 ± 615 2070 ± 142 1990 ± 62.4 7520 ± 680 2070 ± 78.4
§ P load = 10000 mg kg-1 §§ Thermally incubated at 70 oC
The 5 mM oxalate extractable P data show that at the end of the sampling period for both
the thermally incubated and the wet-and-dry incubated samples, the Al-WTRs immobilized ~ 80
% of the initially added P (Table 4-1). No significant differences were found between the 3
Al-based WTRs in the amount of P sorbed at the final incubation period (both thermal and wet-
and-dry incubation). The P sorption studies performed earlier with these 3 WTRs (chapter 2)
suggested that the P sorption capacities of the Bradenton and Holland WTRs were superior to the
Lowell WTRs. However, data from the incubated samples suggest that given sufficient reaction
time, P sorption of the 3 WTRs was similar. Consistent with the P sorption studies (chapter 2),
the Fe-based (Cocoa) WTR was the least effective P immobilizer. At the end of the incubation
periods, Cocoa WTR immobilized < 25 % of the initially added P for both the thermally
incubated and the samples incubated via wetting and drying (Table 4-1).

79
The oxalate (200 mM) data did not show any treatment and time effect. No significant time
and treatment interaction effect was also observed using this extractant (data not presented).
Unlike the data generated with the oxalate 5 mM extractant, no significant differences were
observed among the different WTRs. The extractable P values measured in the samples at time
zero were not significantly different from those measured during the experimental period and the
final measurement. As observed previously (chapter 3), 200 mM oxalate was rigorous enough to
extract P contained in the WTRs; hence, no WTR effect was detected.
Consistent with the data for the WTRs, the oxalate (5 mM) extractable P and the labile P
concentrations of the P-impacted soils suggest that the Al-WTRs were more effective in reducing
P mobility than the Fe-WTR (Tables 4-2 and 4.3). At the end of the incubation period, the
Al-WTRs reduced oxalate (5 mM) extractable P and labile P concentrations for both the
thermally incubated and wet-and-dry incubated samples by > 70 %, whereas the reductions due
to the Fe-WTR was ≤ 20 %. The combined data suggest that the Al-WTRs were more effective
in P immobilization than Fe-WTR, consistent with the P sorption kinetics data presented in
chapter 2 of this dissertation.
Table 4-2. Oxalate (5 mM) extractable P concentrations (mg P kg-1) of the artificially-aged, high P-impacted§ WTR amended soil, measured at the initial and final incubation periods. Values are means of three samples ± one standard deviation.
Thermal§§ incubation wet-and-dry incubation Treatment Time zero 1 year 4.5 years Time zero 2 years No-WTR 107 ± 8.4 99.8 ± 4.4 99.4 ± 6.3 105 ± 5.8 102 ± 7.1 ABR† 93.4 ± 6.1 27.4 ± 2.1 24.4 ± 2.1 89.2 ± 5.3 30.2 ± 2.6 ACO‡ 99.2 ± 3.9 86.3 ± 5.2 82.1 ± 5.2 99.8 ± 4.2 75.4 ± 7.2 AHL†† 92.5 ± 4.1 30.8 ± 3.8 26.4 ± 3.2 94.3 ± 4.9 35.1 ± 4.1 ALW‡‡ 94.2 ± 3.6 39.6 ± 3.4 35.4 ± 2.8 95.2 ± 6.1 37.6 ± 2.8
§ P load = 100 mg kg-1 §§ Thermally incubated at 70 oC † Soil amended with Bradenton WTR †† Soil amended with Holland WTR
‡ Soil amended with Cocoa WTR ‡‡ Soil amended with Lowell WTR
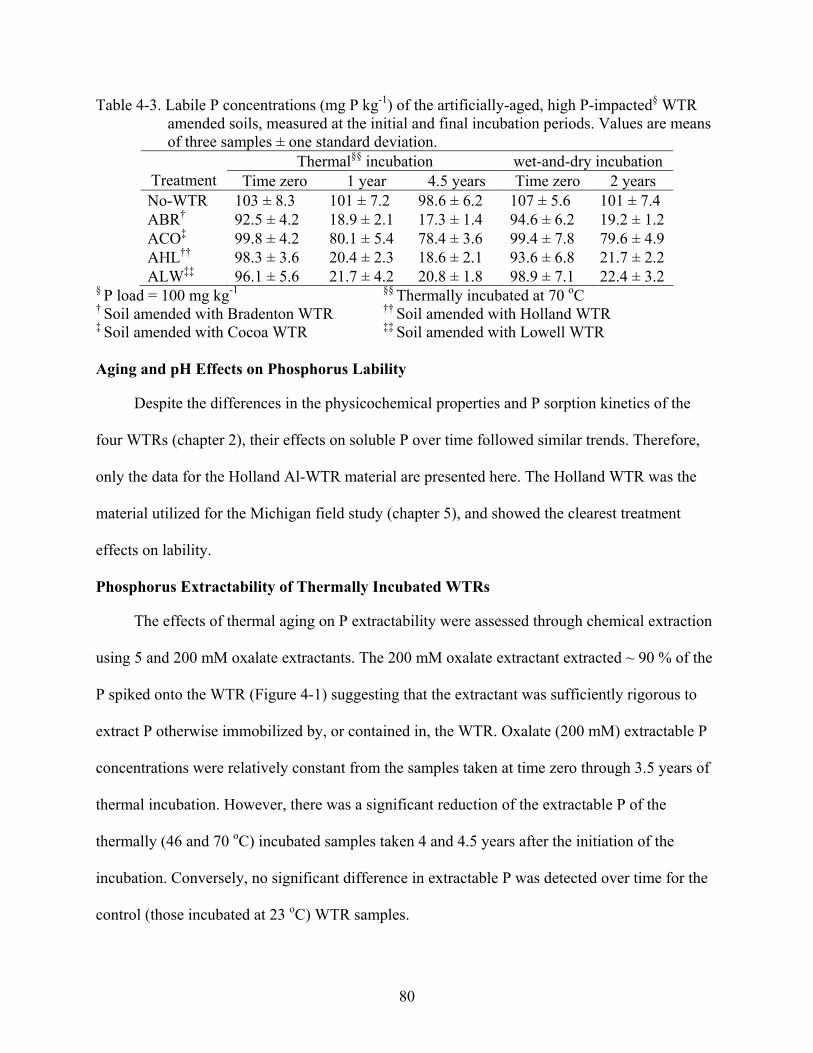
80
Table 4-3. Labile P concentrations (mg P kg-1) of the artificially-aged, high P-impacted§ WTR amended soils, measured at the initial and final incubation periods. Values are means of three samples ± one standard deviation.
Thermal§§ incubation wet-and-dry incubation Treatment Time zero 1 year 4.5 years Time zero 2 years No-WTR 103 ± 8.3 101 ± 7.2 98.6 ± 6.2 107 ± 5.6 101 ± 7.4 ABR† 92.5 ± 4.2 18.9 ± 2.1 17.3 ± 1.4 94.6 ± 6.2 19.2 ± 1.2 ACO‡ 99.8 ± 4.2 80.1 ± 5.4 78.4 ± 3.6 99.4 ± 7.8 79.6 ± 4.9 AHL†† 98.3 ± 3.6 20.4 ± 2.3 18.6 ± 2.1 93.6 ± 6.8 21.7 ± 2.2 ALW‡‡ 96.1 ± 5.6 21.7 ± 4.2 20.8 ± 1.8 98.9 ± 7.1 22.4 ± 3.2
§ P load = 100 mg kg-1 §§ Thermally incubated at 70 oC † Soil amended with Bradenton WTR †† Soil amended with Holland WTR
‡ Soil amended with Cocoa WTR ‡‡ Soil amended with Lowell WTR Aging and pH Effects on Phosphorus Lability
Despite the differences in the physicochemical properties and P sorption kinetics of the
four WTRs (chapter 2), their effects on soluble P over time followed similar trends. Therefore,
only the data for the Holland Al-WTR material are presented here. The Holland WTR was the
material utilized for the Michigan field study (chapter 5), and showed the clearest treatment
effects on lability.
Phosphorus Extractability of Thermally Incubated WTRs
The effects of thermal aging on P extractability were assessed through chemical extraction
using 5 and 200 mM oxalate extractants. The 200 mM oxalate extractant extracted ~ 90 % of the
P spiked onto the WTR (Figure 4-1) suggesting that the extractant was sufficiently rigorous to
extract P otherwise immobilized by, or contained in, the WTR. Oxalate (200 mM) extractable P
concentrations were relatively constant from the samples taken at time zero through 3.5 years of
thermal incubation. However, there was a significant reduction of the extractable P of the
thermally (46 and 70 oC) incubated samples taken 4 and 4.5 years after the initiation of the
incubation. Conversely, no significant difference in extractable P was detected over time for the
control (those incubated at 23 oC) WTR samples.

81
0
2000
4000
6000
8000
10000
12000
t(0) 1 month 6 months 1 year 3.5 years 4 years 4.5 years
Incubation time
Oxa
late
ext
ract
able
P (m
g kg
-1)
200 mM - 70 C200 mM - 46 C200 mM - 23 C5 mM - 70 C5 mM - 46 C5 mM - 23 C
Figure 4-1. Changes in the mean oxalate (200 and 5 mM)-extractable P concentrations with
incubation time at 23, 46 and 70 oC of the P impacted Al-WTR.
Particle surface transformations due to temperature or sorbate additions would be difficult
to detect using a high concentration of oxalate (200 mM), so we also used a weaker (5 mM)
concentration. The 5 mM oxalate extractant extracted significantly (p<0.001) less P from the
WTR than 200 mM oxalate at all incubated temperatures over the incubation period (Figure 4-1).
For the P-impacted WTR, 5 mM oxalate-extractable P significantly (p = 0.015) decreased 1
month after thermal (46 and 70 °C) incubation (Figure 4-1). Extractable P continued to decrease
as the thermal incubation continued for another 11 months; thereafter, the system appeared to be
at steady state. In contrast, 200 mM oxalate extracted significantly less P only after 4 years of
thermal incubation. Although the absolute values of 5 mM oxalate-extractable P in the control
samples (those incubated at 23 oC) decreased after 1 month, the reduction was not significantly
different from the values of the extracted P at the initial sampling. The reduction in extractable P
values of the control samples became significant after 6 months of incubation and stabilized
thereafter (Figure 4-1). Untreated WTR (no P added) had oxalate (5 mM)-extractable P levels
close to the instrument’s detection limit of 0.03 mg P L-1 (data not presented). Phosphorus
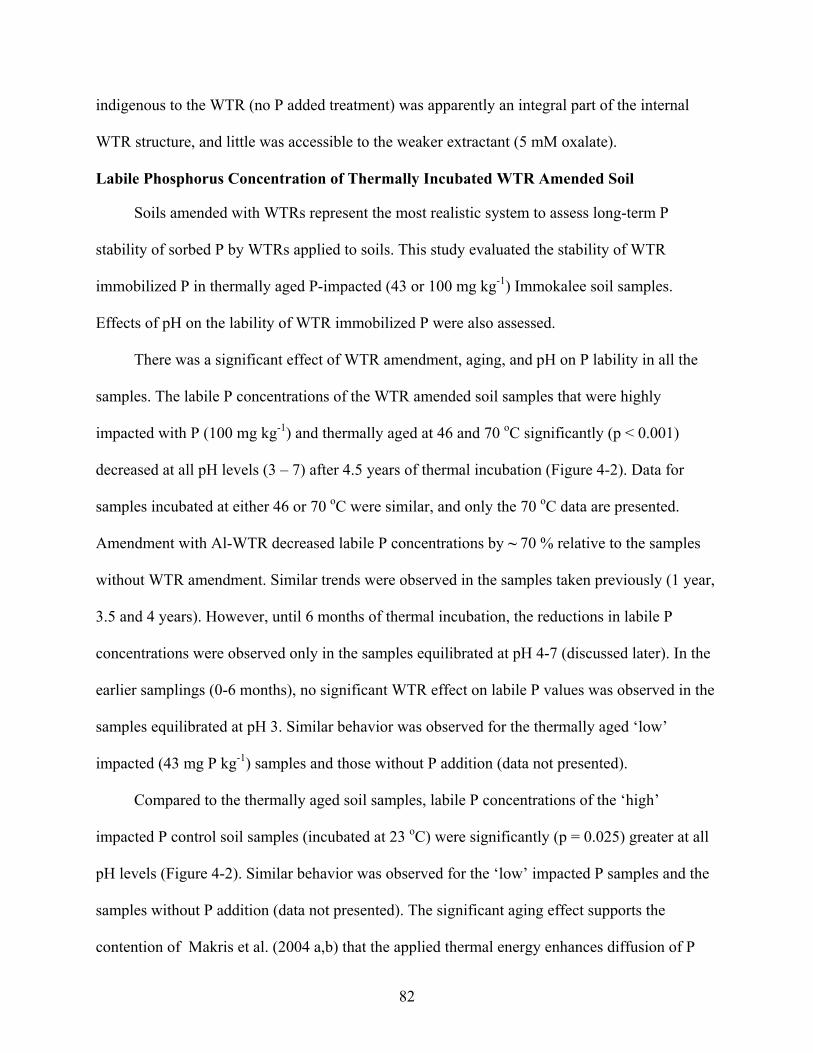
82
indigenous to the WTR (no P added treatment) was apparently an integral part of the internal
WTR structure, and little was accessible to the weaker extractant (5 mM oxalate).
Labile Phosphorus Concentration of Thermally Incubated WTR Amended Soil
Soils amended with WTRs represent the most realistic system to assess long-term P
stability of sorbed P by WTRs applied to soils. This study evaluated the stability of WTR
immobilized P in thermally aged P-impacted (43 or 100 mg kg-1) Immokalee soil samples.
Effects of pH on the lability of WTR immobilized P were also assessed.
There was a significant effect of WTR amendment, aging, and pH on P lability in all the
samples. The labile P concentrations of the WTR amended soil samples that were highly
impacted with P (100 mg kg-1) and thermally aged at 46 and 70 oC significantly (p < 0.001)
decreased at all pH levels (3 – 7) after 4.5 years of thermal incubation (Figure 4-2). Data for
samples incubated at either 46 or 70 oC were similar, and only the 70 oC data are presented.
Amendment with Al-WTR decreased labile P concentrations by ~ 70 % relative to the samples
without WTR amendment. Similar trends were observed in the samples taken previously (1 year,
3.5 and 4 years). However, until 6 months of thermal incubation, the reductions in labile P
concentrations were observed only in the samples equilibrated at pH 4-7 (discussed later). In the
earlier samplings (0-6 months), no significant WTR effect on labile P values was observed in the
samples equilibrated at pH 3. Similar behavior was observed for the thermally aged ‘low’
impacted (43 mg P kg-1) samples and those without P addition (data not presented).
Compared to the thermally aged soil samples, labile P concentrations of the ‘high’
impacted P control soil samples (incubated at 23 oC) were significantly (p = 0.025) greater at all
pH levels (Figure 4-2). Similar behavior was observed for the ‘low’ impacted P samples and the
samples without P addition (data not presented). The significant aging effect supports the
contention of Makris et al. (2004 a,b) that the applied thermal energy enhances diffusion of P
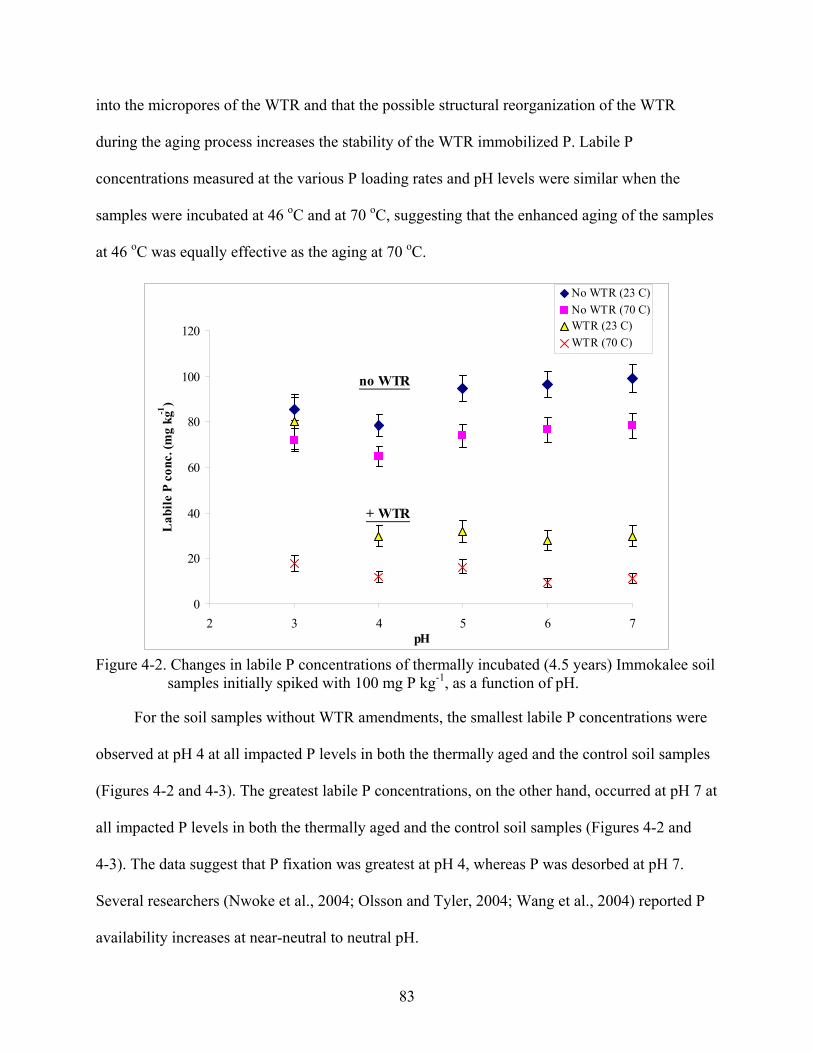
83
into the micropores of the WTR and that the possible structural reorganization of the WTR
during the aging process increases the stability of the WTR immobilized P. Labile P
concentrations measured at the various P loading rates and pH levels were similar when the
samples were incubated at 46 oC and at 70 oC, suggesting that the enhanced aging of the samples
at 46 oC was equally effective as the aging at 70 oC.
0
20
40
60
80
100
120
2 3 4 5 6 7pH
Lab
ile P
con
c. (m
g kg
-1)
No WTR (23 C)No WTR (70 C)WTR (23 C)WTR (70 C)
no WTR
+ WTR
Figure 4-2. Changes in labile P concentrations of thermally incubated (4.5 years) Immokalee soil
samples initially spiked with 100 mg P kg-1, as a function of pH.
For the soil samples without WTR amendments, the smallest labile P concentrations were
observed at pH 4 at all impacted P levels in both the thermally aged and the control soil samples
(Figures 4-2 and 4-3). The greatest labile P concentrations, on the other hand, occurred at pH 7 at
all impacted P levels in both the thermally aged and the control soil samples (Figures 4-2 and
4-3). The data suggest that P fixation was greatest at pH 4, whereas P was desorbed at pH 7.
Several researchers (Nwoke et al., 2004; Olsson and Tyler, 2004; Wang et al., 2004) reported P
availability increases at near-neutral to neutral pH.
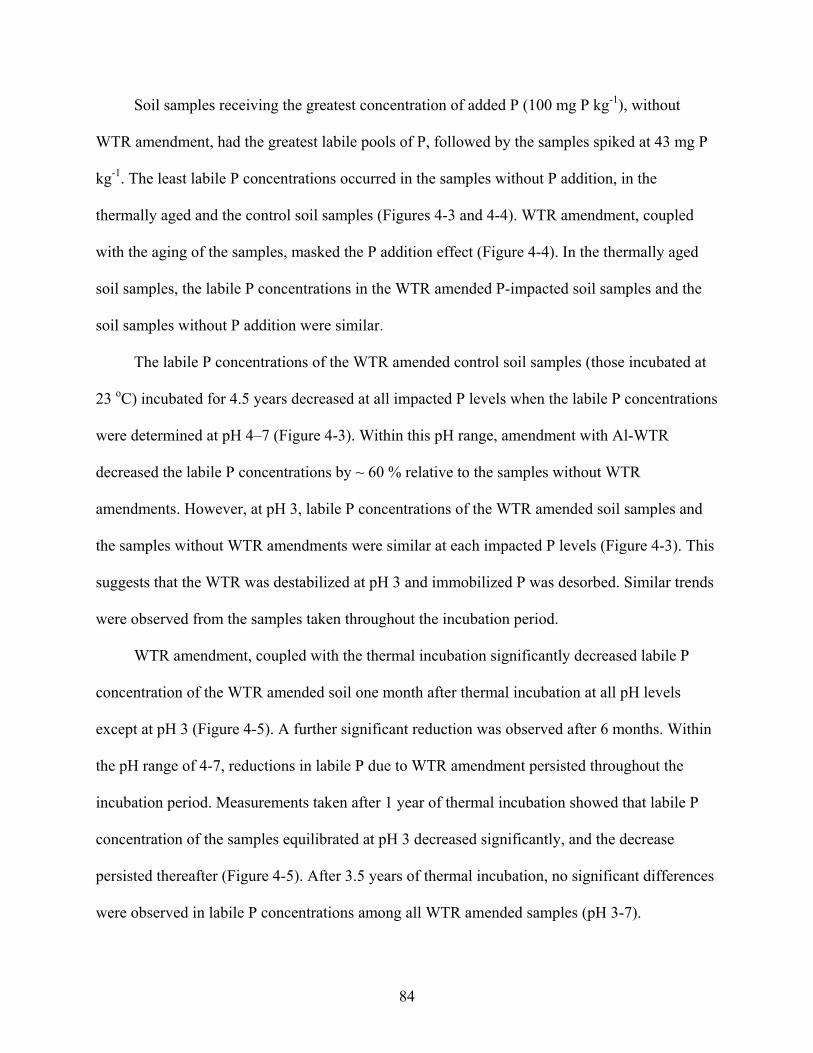
84
Soil samples receiving the greatest concentration of added P (100 mg P kg-1), without
WTR amendment, had the greatest labile pools of P, followed by the samples spiked at 43 mg P
kg-1. The least labile P concentrations occurred in the samples without P addition, in the
thermally aged and the control soil samples (Figures 4-3 and 4-4). WTR amendment, coupled
with the aging of the samples, masked the P addition effect (Figure 4-4). In the thermally aged
soil samples, the labile P concentrations in the WTR amended P-impacted soil samples and the
soil samples without P addition were similar.
The labile P concentrations of the WTR amended control soil samples (those incubated at
23 oC) incubated for 4.5 years decreased at all impacted P levels when the labile P concentrations
were determined at pH 4–7 (Figure 4-3). Within this pH range, amendment with Al-WTR
decreased the labile P concentrations by ~ 60 % relative to the samples without WTR
amendments. However, at pH 3, labile P concentrations of the WTR amended soil samples and
the samples without WTR amendments were similar at each impacted P levels (Figure 4-3). This
suggests that the WTR was destabilized at pH 3 and immobilized P was desorbed. Similar trends
were observed from the samples taken throughout the incubation period.
WTR amendment, coupled with the thermal incubation significantly decreased labile P
concentration of the WTR amended soil one month after thermal incubation at all pH levels
except at pH 3 (Figure 4-5). A further significant reduction was observed after 6 months. Within
the pH range of 4-7, reductions in labile P due to WTR amendment persisted throughout the
incubation period. Measurements taken after 1 year of thermal incubation showed that labile P
concentration of the samples equilibrated at pH 3 decreased significantly, and the decrease
persisted thereafter (Figure 4-5). After 3.5 years of thermal incubation, no significant differences
were observed in labile P concentrations among all WTR amended samples (pH 3-7).
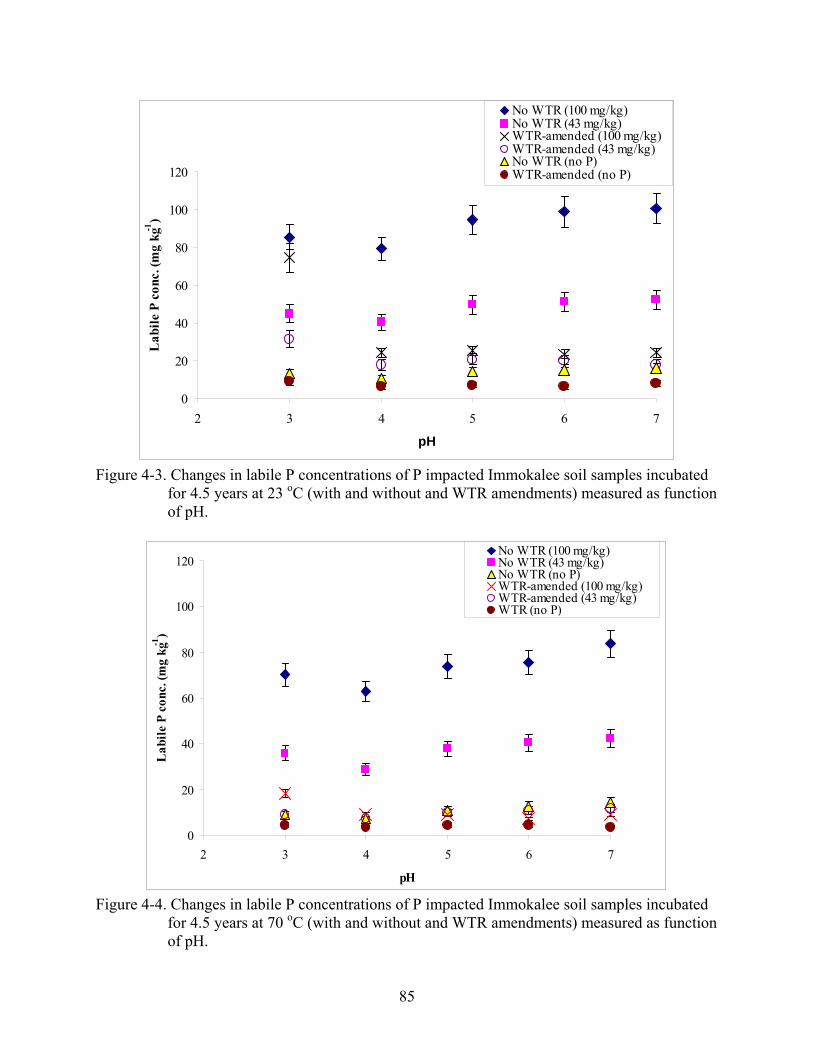
85
0
20
40
60
80
100
120
2 3 4 5 6 7
pH
Lab
ile P
con
c. (m
g kg
-1)
No WTR (100 mg/kg)No WTR (43 mg/kg)WTR-amended (100 mg/kg)WTR-amended (43 mg/kg)No WTR (no P)WTR-amended (no P)
Figure 4-3. Changes in labile P concentrations of P impacted Immokalee soil samples incubated
for 4.5 years at 23 oC (with and without and WTR amendments) measured as function of pH.
0
20
40
60
80
100
120
2 3 4 5 6 7
pH
Lab
ile P
con
c. (m
g kg
-1)
No WTR (100 mg/kg)No WTR (43 mg/kg)No WTR (no P)WTR-amended (100 mg/kg)WTR-amended (43 mg/kg)WTR (no P)
Figure 4-4. Changes in labile P concentrations of P impacted Immokalee soil samples incubated
for 4.5 years at 70 oC (with and without and WTR amendments) measured as function of pH.

86
0
20
40
60
80
100
120
t(0) 1 month 6 months 1 year 3.5 years 4 years 4.5 yearsIncubation time
Lab
ile P
con
c. (m
g kg
-1)
No WTR (pH 7)No WTR (pH 3)No WTR (pH 4)WTR-amended (pH 3)WTR-amended (pH 4)WTR-amended (pH 7)
Figure 4-5. Changes in labile P concentrations with time, of the Immokalee soil samples spiked
with 100 mg P kg-1 and thermally incubated at 70 oC for 4.5 years.
After 4.5 years of thermal incubation, a significant decrease in labile P pools was still
observed at all pH values, including pH 3. Thus, if thermal incubation truly predicts long-term
aging under field conditions ( Postma and Jacobsen, 1996; Ford et al.,1997; Martinez et al.,
2001), not only will the WTR immobilized P remain fixed for a long time in soils with typical
pH values, but the destabilization of the WTR immobilized P at pH 3 will also be eliminated
over time.
Oxalate extractions were also performed on soil samples collected over time during the
incubation period. The 5 mM oxalate extractable P data also showed significant WTR
amendment and aging effects (Figure 4-6). After one month of thermal incubation, the
extractable P concentrations of the WTR amended soils spiked with ‘high’ P load significantly
decreased in the samples incubated at 23 or 70 oC. The extractable P concentration continued to
decline for 6 months, but no significant decrease occurred thereafter. The rate of decrease in the

87
values of extractable P concentration in samples incubated at 70 oC was, however, greater than
the rate for samples incubated at 23 oC. Heat treatment apparently enhanced the immobilization
process by hastening diffusion of P into the micropores of the WTR, as suggested by Makris et
al. (2004a,b).
0
20
40
60
80
100
120
t(0) 1 month 6 month 1 year 3.5 years 4 years 4.5 years
Incubation time
Oxa
late
ext
ract
able
P (m
g kg
-1)
No WTR (23 C)No WTR (70 C)WTR (23 C)WTR (70 C)
Figure 4-6. Changes in oxalate (5 mM)-extractable P concentrations with incubation time at 23,
and 70 oC of WTR amended and unamended (no WTR) Immokalee soil samples that received ‘high’ (100 mg kg-1) P load.
The oxalate-200 mM P concentrations in soils not amended with WTR or TSP did not
change with time at any incubation temperature (data not presented). The unamended (no WTR)
soil samples with high (100 mg P kg-1) P treatment showed a similar trend except that the
absolute values of the thermally incubated samples declined after 1 year of incubation, but the
decreases in extractable values were not significant (data not presented). The WTR amended, P-
impacted soil samples, however, showed significant incubation time and temperature interaction
effects. For the control samples (those incubated at 23 oC), the 200 mM oxalate extractable P
values did not change with time, but the absolute values of the extractable P concentration of the
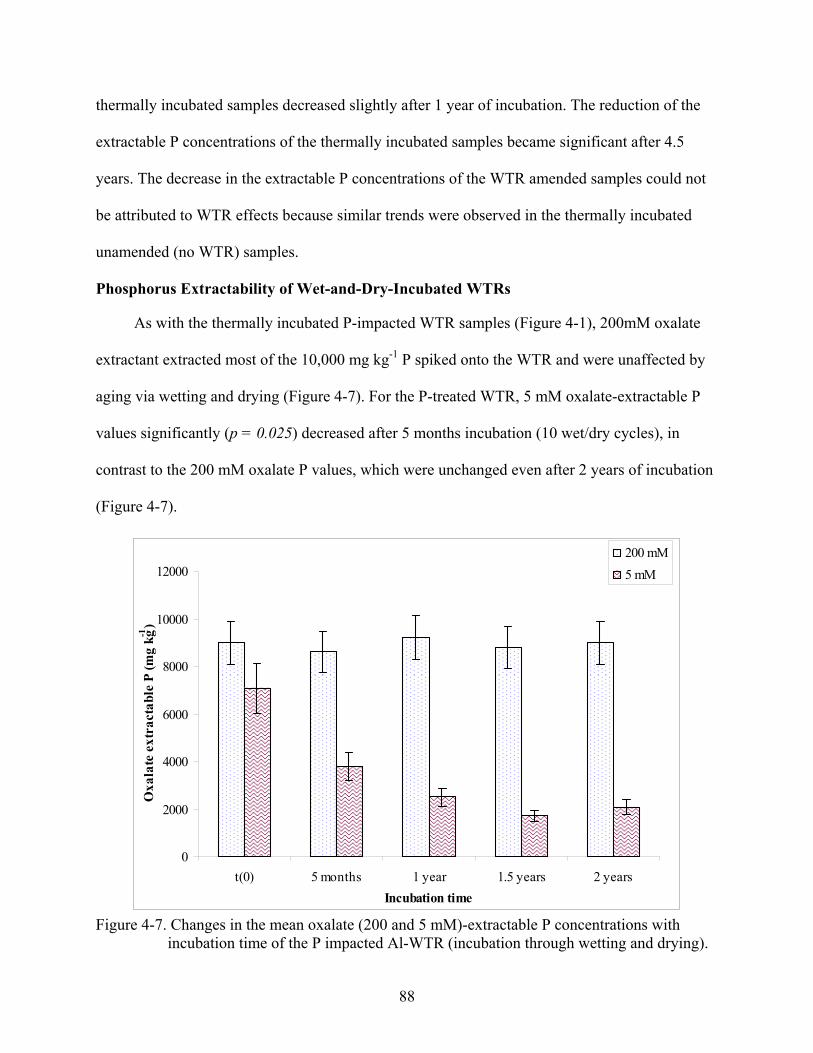
88
thermally incubated samples decreased slightly after 1 year of incubation. The reduction of the
extractable P concentrations of the thermally incubated samples became significant after 4.5
years. The decrease in the extractable P concentrations of the WTR amended samples could not
be attributed to WTR effects because similar trends were observed in the thermally incubated
unamended (no WTR) samples.
Phosphorus Extractability of Wet-and-Dry-Incubated WTRs
As with the thermally incubated P-impacted WTR samples (Figure 4-1), 200mM oxalate
extractant extracted most of the 10,000 mg kg-1 P spiked onto the WTR and were unaffected by
aging via wetting and drying (Figure 4-7). For the P-treated WTR, 5 mM oxalate-extractable P
values significantly (p = 0.025) decreased after 5 months incubation (10 wet/dry cycles), in
contrast to the 200 mM oxalate P values, which were unchanged even after 2 years of incubation
(Figure 4-7).
0
2000
4000
6000
8000
10000
12000
t(0) 5 months 1 year 1.5 years 2 yearsIncubation time
Oxa
late
ext
ract
able
P (m
g kg-1
)
200 mM5 mM
Figure 4-7. Changes in the mean oxalate (200 and 5 mM)-extractable P concentrations with
incubation time of the P impacted Al-WTR (incubation through wetting and drying).

89
The oxalate 5 mM extractable P values continued to decline significantly for another 1
year. No differences were observed in the extractable P values of the samples taken after 1.5 and
2 years of wetting and drying, suggesting that the system apparently became stable after 1.5
years of aging.
Similarly to the thermally incubated samples, the untreated WTR had oxalate (5 mM)-
extractable P values close to the instrument detection limit (0.03 mg P L-1), and the values were
independent of incubation time (data not presented).
Labile Phosphorus Pools of WTR amended Soil Aged via Wetting and Drying
Amendment with WTR, aging, as well as their interaction, significantly decreased P
lability at all P loads. In the ‘high’ (100 mg P kg-1) P-impacted soil, WTR application decreased
labile P concentrations at all pH values except pH 3 (Figure 4-8).
0
20
40
60
80
100
120
2 3 4 5 6 7
pH
Lab
ile P
con
c. (m
g kg
-1)
No WTRwith WTR
no WTR
+ WTR
Figure 4-8. Changes in labile P concentrations as a function of pH for the Immokalee soil
samples spiked with 100 mg P kg-1 and incubated via wet-and dry cycles for 2 years.
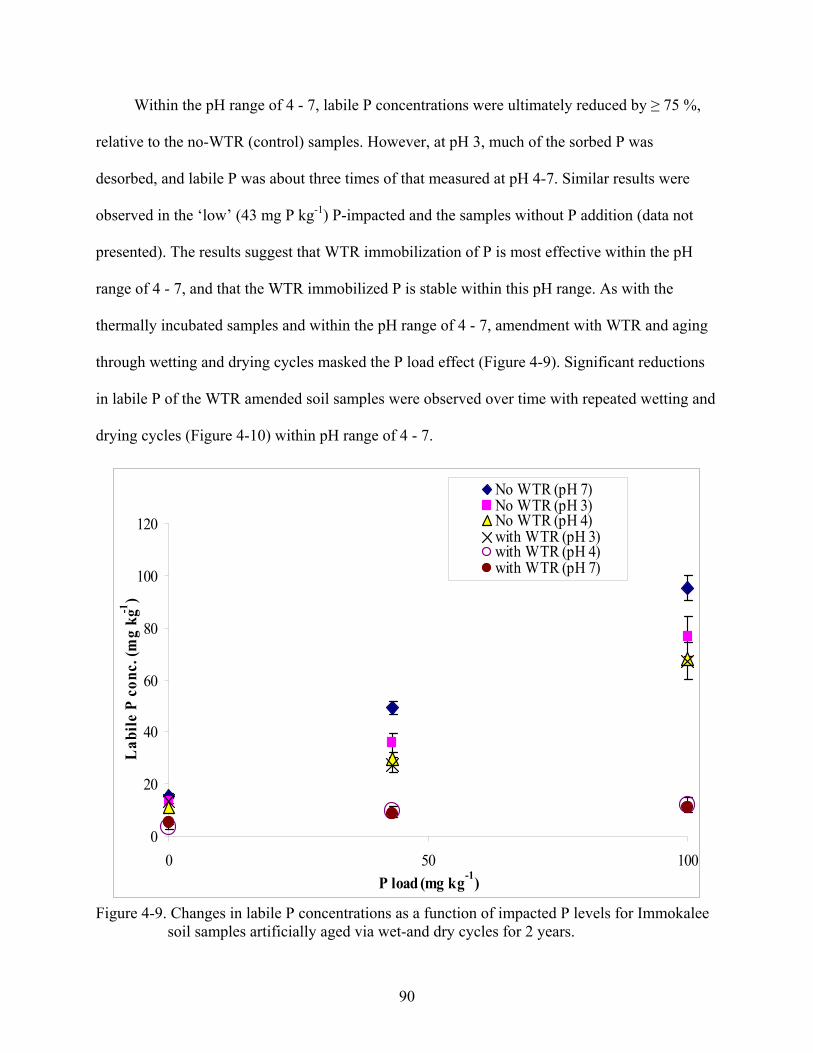
90
Within the pH range of 4 - 7, labile P concentrations were ultimately reduced by ≥ 75 %,
relative to the no-WTR (control) samples. However, at pH 3, much of the sorbed P was
desorbed, and labile P was about three times of that measured at pH 4-7. Similar results were
observed in the ‘low’ (43 mg P kg-1) P-impacted and the samples without P addition (data not
presented). The results suggest that WTR immobilization of P is most effective within the pH
range of 4 - 7, and that the WTR immobilized P is stable within this pH range. As with the
thermally incubated samples and within the pH range of 4 - 7, amendment with WTR and aging
through wetting and drying cycles masked the P load effect (Figure 4-9). Significant reductions
in labile P of the WTR amended soil samples were observed over time with repeated wetting and
drying cycles (Figure 4-10) within pH range of 4 - 7.
0
20
40
60
80
100
120
0 50 100P load (mg kg-1)
Lab
ile P
con
c. (m
g kg
-1)
No WTR (pH 7)No WTR (pH 3)No WTR (pH 4)with WTR (pH 3)with WTR (pH 4)with WTR (pH 7)
Figure 4-9. Changes in labile P concentrations as a function of impacted P levels for Immokalee
soil samples artificially aged via wet-and dry cycles for 2 years.
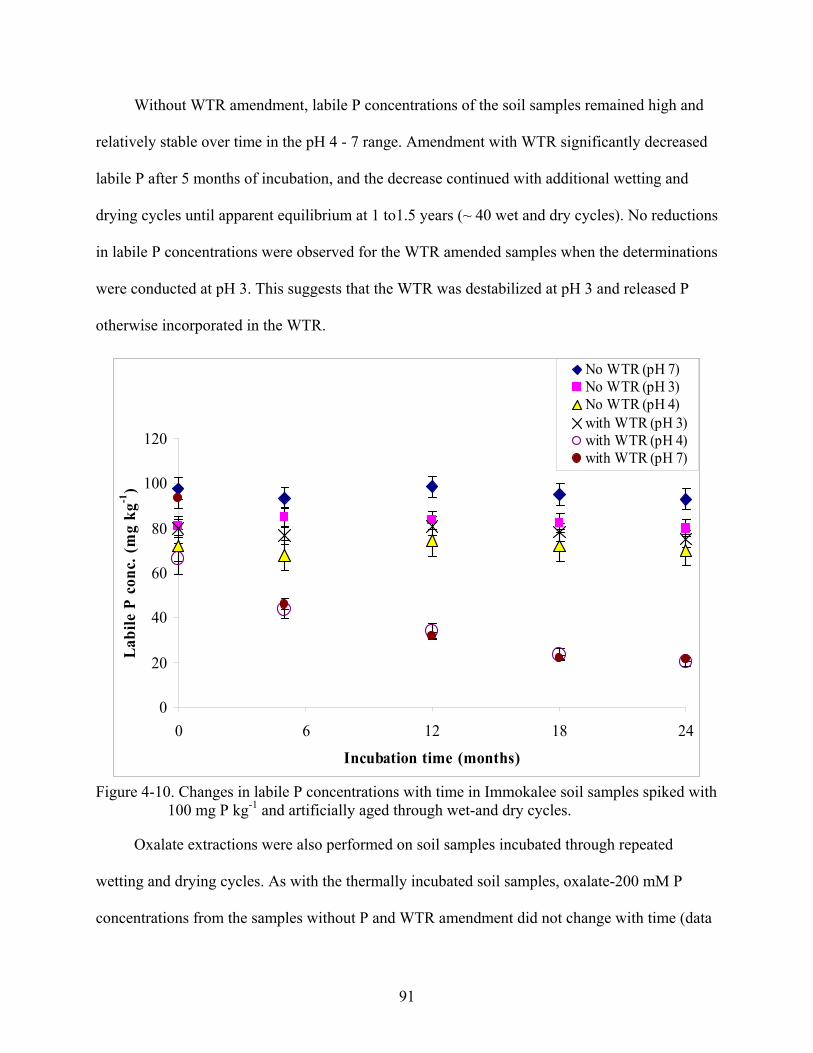
91
Without WTR amendment, labile P concentrations of the soil samples remained high and
relatively stable over time in the pH 4 - 7 range. Amendment with WTR significantly decreased
labile P after 5 months of incubation, and the decrease continued with additional wetting and
drying cycles until apparent equilibrium at 1 to1.5 years (~ 40 wet and dry cycles). No reductions
in labile P concentrations were observed for the WTR amended samples when the determinations
were conducted at pH 3. This suggests that the WTR was destabilized at pH 3 and released P
otherwise incorporated in the WTR.
0
20
40
60
80
100
120
0 6 12 18 24
Incubation time (months)
Labi
le P
con
c. (m
g kg
-1)
No WTR (pH 7)No WTR (pH 3)No WTR (pH 4)with WTR (pH 3)with WTR (pH 4)with WTR (pH 7)
Figure 4-10. Changes in labile P concentrations with time in Immokalee soil samples spiked with
100 mg P kg-1 and artificially aged through wet-and dry cycles.
Oxalate extractions were also performed on soil samples incubated through repeated
wetting and drying cycles. As with the thermally incubated soil samples, oxalate-200 mM P
concentrations from the samples without P and WTR amendment did not change with time (data

92
not presented). Similarly to the data of the Kissimmee field study (chapter 3), the WTR amended
soil samples had significantly greater oxalate (200mM)-extractable P concentrations than the soil
without WTR amendments. This suggests that the extractant was rigorous enough to extract P
otherwise immobilized and/or contained in the WTR. Using the weaker oxalate (5 mM)
extractant, a significant WTR effect became obvious. Amendment with WTR, coupled with the
wetting and drying, decreased the extractable P concentration from ~ 90 mg kg-1 to 55 mg kg-1, 5
months after incubation and then to ~ 35 mg kg-1 after 1 year (Figure 4-11). Thereafter, the
decrease in extractable P concentrations was no longer significant and appeared to have
stabilized. Thus, the 5 mM oxalate extractant showed the beneficial effect of aging and WTR
amendment in reducing P solubility in P-impacted soils.
0
2000
4000
6000
8000
10000
12000
t(0) 5 months 1 year 1.5 years 2 yearsIncubation time
Oxa
late
ext
ract
able
P (m
g kg
-1)
200 mM5 mM
Figure 4-11. Changes in oxalate (5 mM)-extractable P with incubation time of WTR amended
and unamended (no WTR) Immokalee soil samples that received ‘high’ (100 mg kg-1) P load.

93
The incubation data for both WTR alone, and WTR amended soils show that WTR
effectively reduces soluble P levels, and suggest that P would remain immobilized in the long-
term. There was no release of P from WTRs or WTR amended soils, upon aging via thermal or
wet-and-dry incubation. The data suggest that sorbed P will remain indefinitely immobilized
unless particle dissolution occurs at extreme pH values ≤ 3. Happily such extreme pH conditions
are rarely encountered in agricultural soils.
Evaluation of the Aging Techniques
Artificial aging of metal oxides through repeated wet-and-dry cycles represents a cost
effective means of obtaining aged samples that mimics aging under natural environments (Frau,
2000; Kennedy et al., 2004). Results obtained from the samples aged through wet-and-dry cycles
closely mirrored those obtained from the thermally incubated soil samples. Within the pH range
of 4-7, the thermally incubated WTR amended samples appeared to stabilize at 6 months,
whereas the samples incubated via wetting and drying apparently reached equilibrium about 1.5
years after incubation. When the data generated from time zero until the apparent ‘stabilized’
times of the two aging techniques were analyzed, a very strong (r ~0.96) and highly significant
(p < 0.001) correlation was observed between the two aging techniques (Figure 4-12). Similarly
when all the data generated (between pH 4 - 7) from the two aging techniques over the
incubation period were analyzed together there was a significant (p = 0.01) correlation (r2 = 0.74)
between the two techniques (data not presented). No significant correlation (r2 = 0.24, p > 0.05)
was observed between the data of the samples equilibrated at pH 3 over the incubation period by
the two aging techniques (data not presented).
Time series analysis suggests that equilibrium labile P levels (~ 20 mg kg-1) of the high P-
impacted (100 mg kg-1) WTR amended soil samples were achieved after~ 6 months of thermal
incubation, and after ~1.5 years of wet-and-dry incubation. The data suggest that the aging
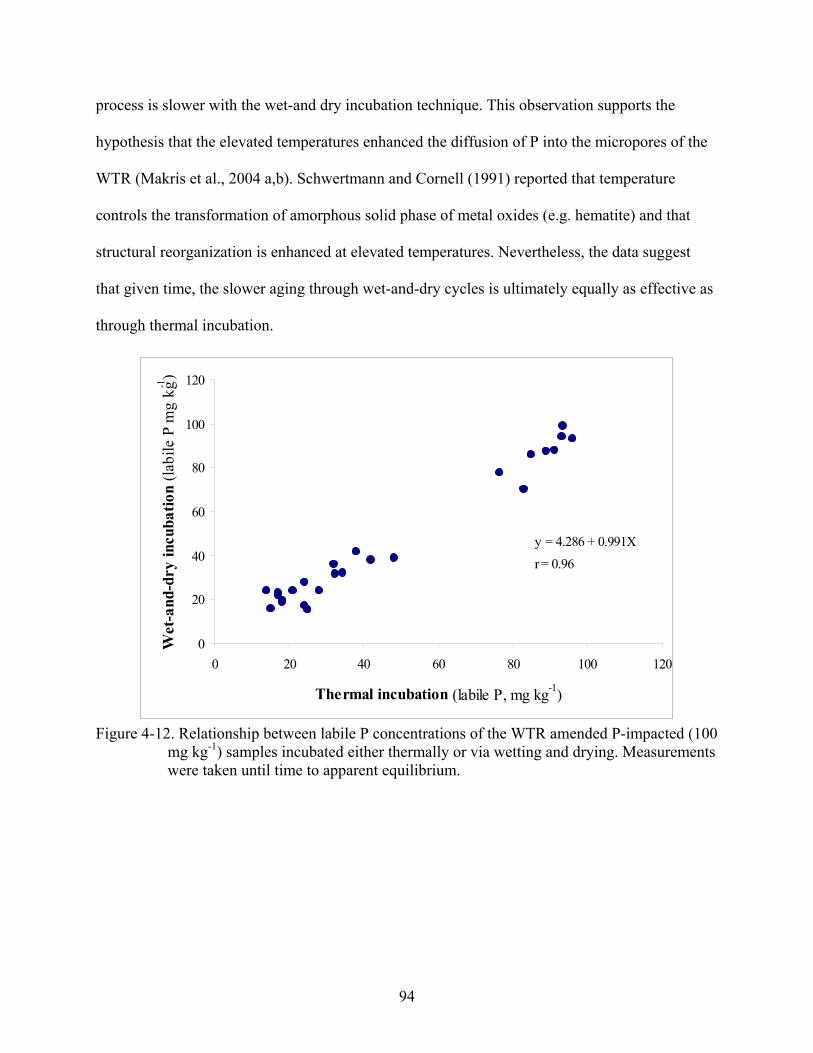
94
process is slower with the wet-and dry incubation technique. This observation supports the
hypothesis that the elevated temperatures enhanced the diffusion of P into the micropores of the
WTR (Makris et al., 2004 a,b). Schwertmann and Cornell (1991) reported that temperature
controls the transformation of amorphous solid phase of metal oxides (e.g. hematite) and that
structural reorganization is enhanced at elevated temperatures. Nevertheless, the data suggest
that given time, the slower aging through wet-and-dry cycles is ultimately equally as effective as
through thermal incubation.
0
20
40
60
80
100
120
0 20 40 60 80 100 120
Thermal incubation (labile P, mg kg-1)
Wet
-and
-dry
incu
batio
n (la
bile
P m
g kg-1
)
y = 4.286 + 0.991Xr = 0.96
Figure 4-12. Relationship between labile P concentrations of the WTR amended P-impacted (100
mg kg-1) samples incubated either thermally or via wetting and drying. Measurements were taken until time to apparent equilibrium.

95
CHAPTER 5 LONG-TERM PHOSPHORUS IMMOBILIZATION BY A DRINKING-WATER
TREATMENT RESIDUAL: MICHIGAN FIELD STUDY
Introduction
Excessive soluble P concentrations in poorly P-sorbing soils can be controlled through the
additions of P-sorbing amendments, such as alum (Moore et al., 1998) or drinking-water
treatment residuals (WTRs) (Elliott et al., 2002b; Makris et al, 2004a,b; Novak and Watts, 2004;
O’Connor et al., 2004; Novak and Watts, 2005 Silveira et al., 2006). Drinking-water treatment
residuals are by-products of the drinking-water treatment process and are physical mixtures of Al
or Fe hydr(oxides) that originate from flocculant (Al or Fe salts) additions made during the
processing of drinking-water (O’Connor et al., 2002). Drinking- water treatment residuals are
usually disposed of in landfills and can be obtained at minimal or no cost from drinking-water
treatment facilities.
Short-term lab, greenhouse, and rainfall simulation studies have demonstrated WTR
efficacy in reducing soluble P concentrations in runoff (Dayton et al., 2003; Dayton and Basta,
2005; Elliott et al., 2005), and leaching (Elliott et al., 2002a) from areas amended with animal
manure. The long-term stability of the P sorbed by WTRs has been qualitatively addressed in
laboratory experiments (Makris et al., 2004 a,b). The authors suggested that intraparticle P
diffusion into the WTRs, coupled with the minimal P desorption (80 days), represented
irreversible P sorption by the WTRs. Makris (2004) observed that adsorption of P by WTRs was
strongly hysteretic and essentially independent of pH. Once sorbed in the internal micropores of
WTR, P release is unlikely because of very high bonding energy of P to surfaces and steric
limitations to P movement through “bottle-necks” consisting of complex metal-organic C
assemblages. The combined Makris (2004) data suggest that WTRs can be effective sorbents for
P and that the immobilized P would be stable in the long-term. However, long-term field
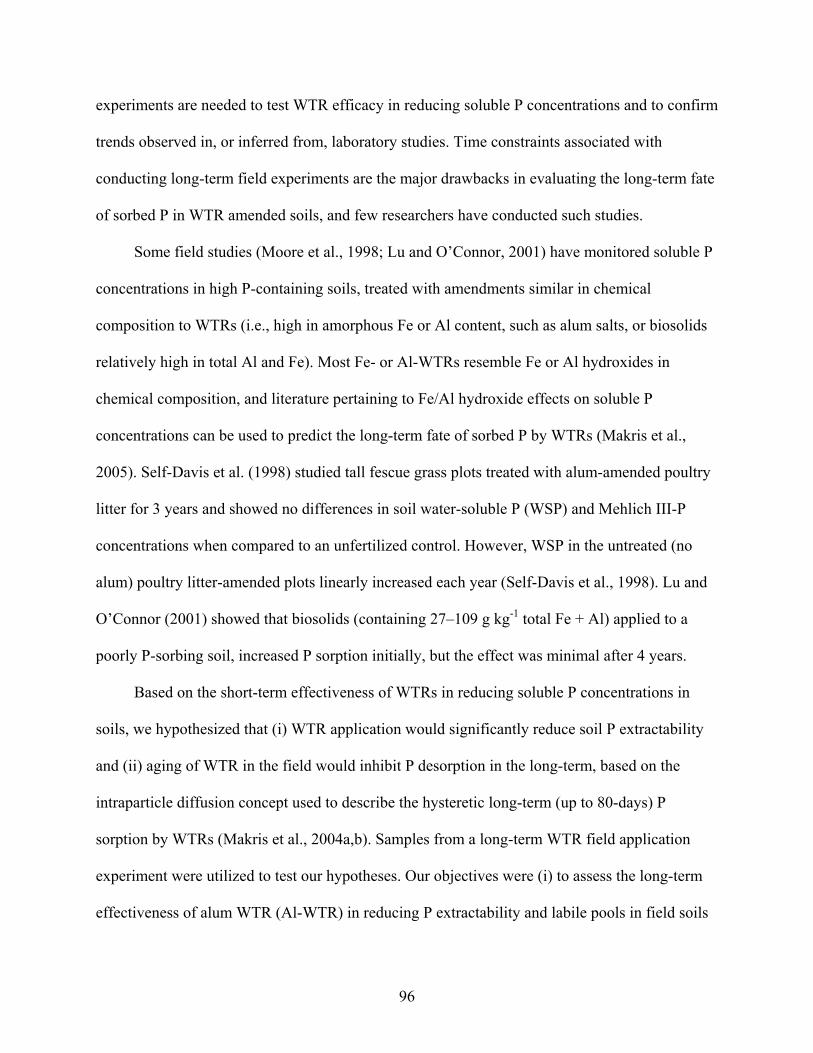
96
experiments are needed to test WTR efficacy in reducing soluble P concentrations and to confirm
trends observed in, or inferred from, laboratory studies. Time constraints associated with
conducting long-term field experiments are the major drawbacks in evaluating the long-term fate
of sorbed P in WTR amended soils, and few researchers have conducted such studies.
Some field studies (Moore et al., 1998; Lu and O’Connor, 2001) have monitored soluble P
concentrations in high P-containing soils, treated with amendments similar in chemical
composition to WTRs (i.e., high in amorphous Fe or Al content, such as alum salts, or biosolids
relatively high in total Al and Fe). Most Fe- or Al-WTRs resemble Fe or Al hydroxides in
chemical composition, and literature pertaining to Fe/Al hydroxide effects on soluble P
concentrations can be used to predict the long-term fate of sorbed P by WTRs (Makris et al.,
2005). Self-Davis et al. (1998) studied tall fescue grass plots treated with alum-amended poultry
litter for 3 years and showed no differences in soil water-soluble P (WSP) and Mehlich III-P
concentrations when compared to an unfertilized control. However, WSP in the untreated (no
alum) poultry litter-amended plots linearly increased each year (Self-Davis et al., 1998). Lu and
O’Connor (2001) showed that biosolids (containing 27–109 g kg-1 total Fe + Al) applied to a
poorly P-sorbing soil, increased P sorption initially, but the effect was minimal after 4 years.
Based on the short-term effectiveness of WTRs in reducing soluble P concentrations in
soils, we hypothesized that (i) WTR application would significantly reduce soil P extractability
and (ii) aging of WTR in the field would inhibit P desorption in the long-term, based on the
intraparticle diffusion concept used to describe the hysteretic long-term (up to 80-days) P
sorption by WTRs (Makris et al., 2004a,b). Samples from a long-term WTR field application
experiment were utilized to test our hypotheses. Our objectives were (i) to assess the long-term
effectiveness of alum WTR (Al-WTR) in reducing P extractability and labile pools in field soils
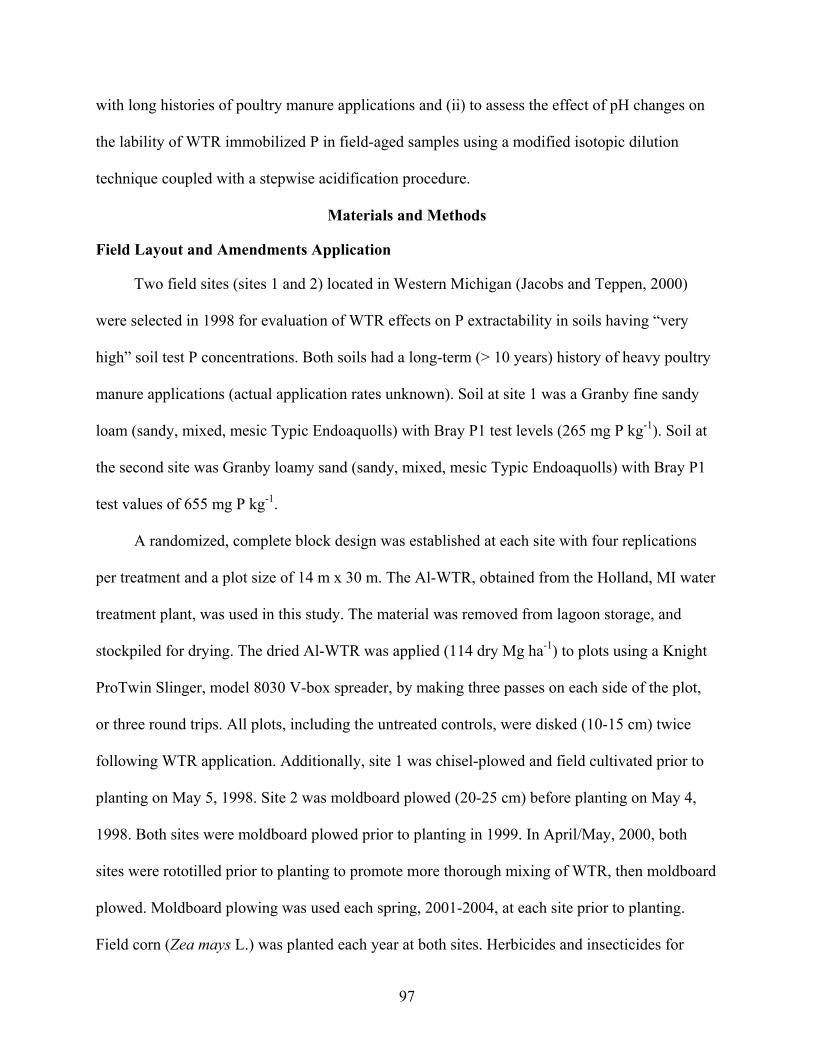
97
with long histories of poultry manure applications and (ii) to assess the effect of pH changes on
the lability of WTR immobilized P in field-aged samples using a modified isotopic dilution
technique coupled with a stepwise acidification procedure.
Materials and Methods
Field Layout and Amendments Application
Two field sites (sites 1 and 2) located in Western Michigan (Jacobs and Teppen, 2000)
were selected in 1998 for evaluation of WTR effects on P extractability in soils having “very
high” soil test P concentrations. Both soils had a long-term (> 10 years) history of heavy poultry
manure applications (actual application rates unknown). Soil at site 1 was a Granby fine sandy
loam (sandy, mixed, mesic Typic Endoaquolls) with Bray P1 test levels (265 mg P kg-1). Soil at
the second site was Granby loamy sand (sandy, mixed, mesic Typic Endoaquolls) with Bray P1
test values of 655 mg P kg-1.
A randomized, complete block design was established at each site with four replications
per treatment and a plot size of 14 m x 30 m. The Al-WTR, obtained from the Holland, MI water
treatment plant, was used in this study. The material was removed from lagoon storage, and
stockpiled for drying. The dried Al-WTR was applied (114 dry Mg ha-1) to plots using a Knight
ProTwin Slinger, model 8030 V-box spreader, by making three passes on each side of the plot,
or three round trips. All plots, including the untreated controls, were disked (10-15 cm) twice
following WTR application. Additionally, site 1 was chisel-plowed and field cultivated prior to
planting on May 5, 1998. Site 2 was moldboard plowed (20-25 cm) before planting on May 4,
1998. Both sites were moldboard plowed prior to planting in 1999. In April/May, 2000, both
sites were rototilled prior to planting to promote more thorough mixing of WTR, then moldboard
plowed. Moldboard plowing was used each spring, 2001-2004, at each site prior to planting.
Field corn (Zea mays L.) was planted each year at both sites. Herbicides and insecticides for
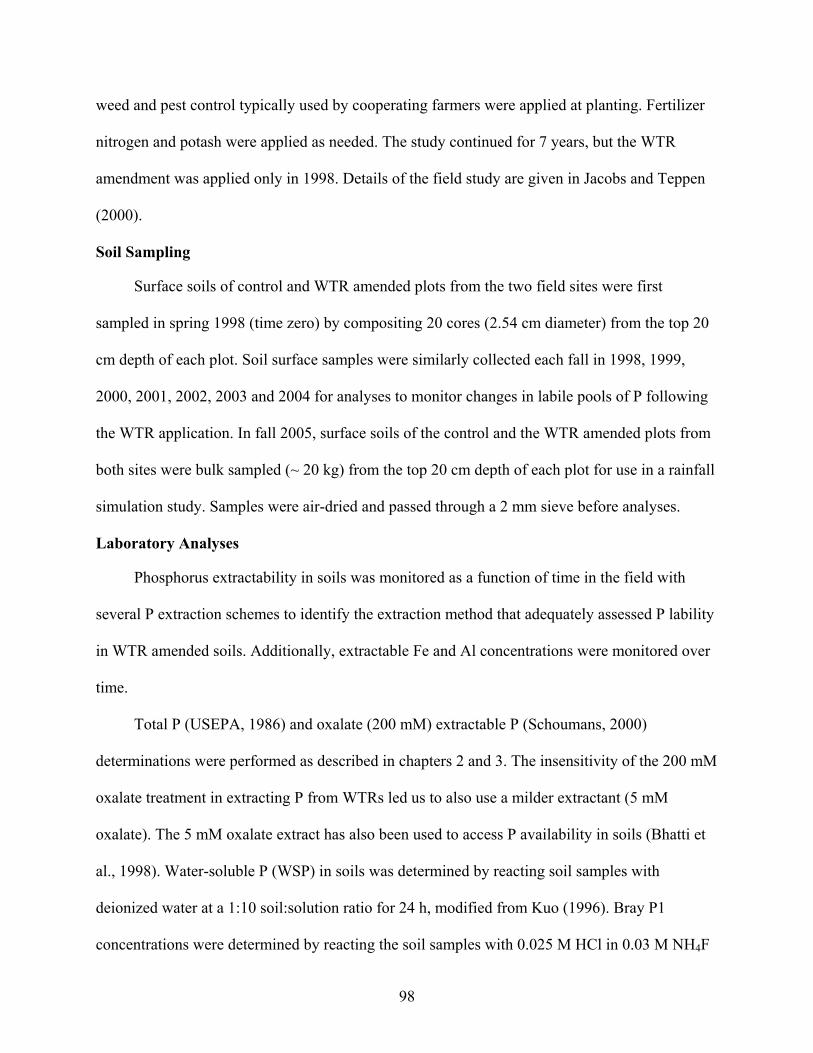
98
weed and pest control typically used by cooperating farmers were applied at planting. Fertilizer
nitrogen and potash were applied as needed. The study continued for 7 years, but the WTR
amendment was applied only in 1998. Details of the field study are given in Jacobs and Teppen
(2000).
Soil Sampling
Surface soils of control and WTR amended plots from the two field sites were first
sampled in spring 1998 (time zero) by compositing 20 cores (2.54 cm diameter) from the top 20
cm depth of each plot. Soil surface samples were similarly collected each fall in 1998, 1999,
2000, 2001, 2002, 2003 and 2004 for analyses to monitor changes in labile pools of P following
the WTR application. In fall 2005, surface soils of the control and the WTR amended plots from
both sites were bulk sampled (~ 20 kg) from the top 20 cm depth of each plot for use in a rainfall
simulation study. Samples were air-dried and passed through a 2 mm sieve before analyses.
Laboratory Analyses
Phosphorus extractability in soils was monitored as a function of time in the field with
several P extraction schemes to identify the extraction method that adequately assessed P lability
in WTR amended soils. Additionally, extractable Fe and Al concentrations were monitored over
time.
Total P (USEPA, 1986) and oxalate (200 mM) extractable P (Schoumans, 2000)
determinations were performed as described in chapters 2 and 3. The insensitivity of the 200 mM
oxalate treatment in extracting P from WTRs led us to also use a milder extractant (5 mM
oxalate). The 5 mM oxalate extract has also been used to access P availability in soils (Bhatti et
al., 1998). Water-soluble P (WSP) in soils was determined by reacting soil samples with
deionized water at a 1:10 soil:solution ratio for 24 h, modified from Kuo (1996). Bray P1
concentrations were determined by reacting the soil samples with 0.025 M HCl in 0.03 M NH4F

99
solution at a ratio of 1:10 soil:solution ratio and shaken for 5 min (Brown, 1998). Extractions
were filtered (Whatman No 42) and analyzed colorimetrically for P concentration with the
Murphy and Riley (1962) method. Phosphorus saturation ratio (Maguire et al., 2001) was
calculated for the soils. This index is similar to the degree of P saturation (DPS) index, but omits
the saturation factor, α (α = 0.3-0.5) in the ratio (Schoumans, 2000). The labile pools of P, as a
function of time and pH, were determined using the modified isotopic dilution technique coupled
with stepwise acidification procedure described in the previous chapter. Standard QA / QC
protocols of matrix spike (5 % of the set) recoveries were used in all the experiments, including
sample collection/handling/chemical analysis. Method reagent blanks, certified check standard
analyses, and new standard curves for each set of samples were used. (Detailed description of
this procedure is presented in chapter 3.
Statistical Analyses
Differences among treatments were statistically analyzed as a factorial experiment with a
randomized complete block design (RCBD), using the general linear model (GLM) of the SAS
software (SAS Inst., 1999). The means of the various treatments were separated using a single
degree of freedom orthogonal contrast procedure.
Results and Discussion
The field study was conducted primarily to assess the long-term phosphorus
immobilization by WTR under natural conditions to confirm conclusions made from laboratory
sorption and incubation studies. We utilized several commonly used soil P extractants to assess
the effect of WTR on P extractability over time. We utilized the modified isotopic dilution
technique, coupled with stepwise acidification procedure to evaluate lability of WTR
immobilized P as a function of pH in field-aged WTR amended samples, as a confirmation of
observations garnered from the artificially aged sample studies.

100
Extractable Phosphorus, iron and Aluminum over Time
We hypothesized that application of WTRs to soils with excessive P concentrations will
reduce extractable P concentrations and decrease the amount of P available for surface
movement to surface water. Determining the most appropriate P extraction method for WTR
amended soils is of paramount importance for determining or predicting P losses. In this regard,
we utilized five soil P extraction procedures [total P extractant, oxalate (200 and 5 mM), Bray-1,
and water] to evaluate WTR effectiveness in reducing P extractability.
The absolute values of the total-P concentrations from the WTR amended plots were
consistently greater than the control plots from both sites (especially, site # 2), over the sampling
period (Figure 5-1), consistent with those observed in the Kissimmee field study in (chapter 3).
This trend was mirrored by the oxalate (200 mM) extractable P concentrations (Figure 5-2). Both
the extractants were rigorous enough to extract P contained in the WTR and the immobilized P
by the WTR. The total- and oxalate extractable P decreased over time, although the decreases
were not statistically significant. The decrease in total- and oxalate (200 mM)-extractable P
concentrations over time could not be directly attributed to P sorption by the Al-WTR, since
similar changes were also observed in the control plots. The decrease may, however, be
attributed to P loss either through plant uptake of runoff. This observation suggests that the
expected P immobilization by WTR cannot be assessed with these two extractants to directly
measure extractable P concentration.
However, the oxalate (200 mM) extractant could be used indirectly to evaluate WTR effect
on the P sorption capacity of poorly P sorbing soils by evaluating the oxalate extractable Fe and
Al. Dayton and Basta (2005) reported that oxalate (200 mM) extractable Al content is strongly
and positively correlated with the maximum P sorption capacity (Pmax) of soils and soil
amendments.

101
0
200
400
600
800
1000
1200
1400
1600
t (0) 0.5 1.5 2.5 3.5 4.5 5.5 6.5 7.5
Time after WTR application (years)
Tota
l P (m
g kg
-1)
Control WTR-amended
ASite 1
0
200
400
600
800
1000
1200
1400
1600
t (0) 0.5 1.5 2.5 3.5 4.5 5.5 6.5 7.5
Time after WTR application (years)
Tota
l P (m
g kg
-1)
Control WTR-amended
BSite 2
Figure 5-1. Changes in total-P concentrations with time for A) site 1 and B) site 2, of the Michigan field study. Error bars denote one standard deviation.
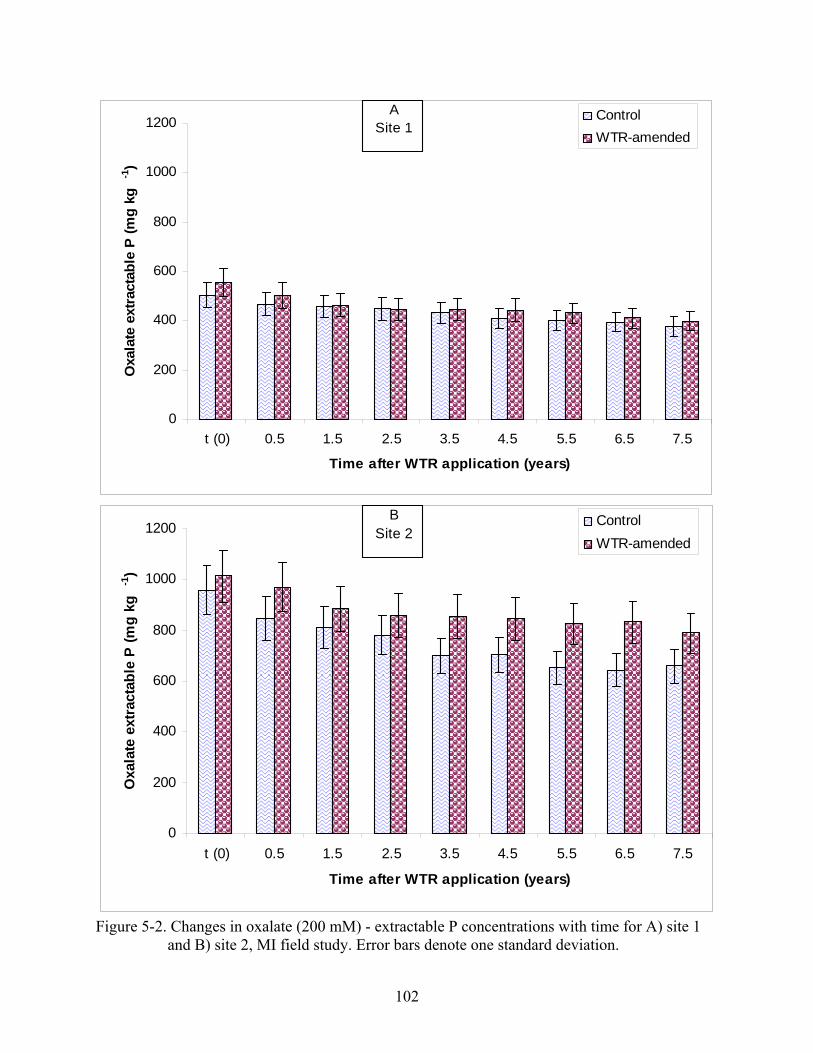
102
0
200
400
600
800
1000
1200
t (0) 0.5 1.5 2.5 3.5 4.5 5.5 6.5 7.5
Time after WTR application (years)
Oxa
late
ext
ract
able
P (m
g kg
-1)
Control WTR-amended
ASite 1
0
200
400
600
800
1000
1200
t (0) 0.5 1.5 2.5 3.5 4.5 5.5 6.5 7.5
Time after WTR application (years)
Oxa
late
ext
ract
able
P (m
g kg
-1)
Control WTR-amended
BSite 2
Figure 5-2. Changes in oxalate (200 mM) - extractable P concentrations with time for A) site 1 and B) site 2, MI field study. Error bars denote one standard deviation.

103
Elliott et al. (2005) showed that as Fe and Al content of biosolids increased, soluble P
levels of the materials decreased. For both sites, the concentrations of total- and oxalate (200
mM)-extractable soil Al and Fe concentrations in the WTR amended plots increased (p<0.03)
over time, although the data exhibited some variability. The WTR amended plots of site 2
exhibited a greater increase in total- and oxalate (200 mM)-extractable Al and Fe concentrations
than at site 1, possibly due to lower native Al and Fe concentrations of the site 2 soil (Table 2-2).
The variability in total- (data not presented) and oxalate extractable Al and Fe, and P
concentrations over time (Figure 5-3) is attributed to sampling variability. Iron and Al
hydroxides, especially Al forms in Al-WTR, can be major sorbents for oxyanions in soils, such
as P (Dayton and Basta, 2005; Elliott et al., 2005; Makris et al 2005a). Therefore changes in the
magnitude of the sorbent pool with time are expected to influence the P sorption capacity of the
amended soil.
The variability in the oxalate-extractable Fe and Al concentrations observed with time
from both sites (Figure 5-3) prompted normalizing the data by dividing the oxalate-extractable P
by the corresponding oxalate Fe and Al concentrations (in moles). This normalization yields a
term, the P saturation ratio (PSR) (Maguire et al., 2001), similar to the degree of P saturation
(DPS) index, but omits the saturation factor, α (α = 0.3-0.5) in the ratio (Schoumans, 2000).
Small PSR values (< 0.1) suggest excess P sorption capacity and limited P lability. The PSR
values for both sites were calculated and statistically analyzed to evaluate subtle differences
between treatments over time.
For site 1, PSR values of the WTR amended plots did not significantly differ at the 95 %
confidence level from the control (no WTR) plots (Figure 5-4A). Similarly, aging in the field had
no significant effect on the PSR values for WTR amended plots even 7.5 years after WTR

104
application; the PSR values remained low and relatively constant (~ 0.3) throughout the
monitoring period.
0
10
20
30
40
50
60
70
80
t (0) 0.5 1.5 2.5 3.5 4.5 5.5 6.5 7.5
Time after WTR application (years)
Oxa
late
ext
ract
able
Fe+
Al (
mm
ol k
g-1
)
Control WTR-amended
ASite 1
0
10
20
30
40
50
60
70
80
t (0) 0.5 1.5 2.5 3.5 4.5 5.5 6.5 7.5
Time after WTR application (years)
Oxa
late
ext
ract
able
Fe+
Al
(mm
ol k
g-1
)
Control WTR-amended
BSite 2
Figure 5-3. Changes in oxalate-extractable Fe and Al concentrations with time for A) sites 1 and
B) site 2 of the Michigan field study. Error bars denote one standard deviation.

105
0.0
0.2
0.4
0.6
0.8
1.0
1.2
1.4
1.6
t (0) 0.5 1.5 2.5 3.5 4.5 5.5 6.5 7.5
Time after WTR application (years)
PS
RControl WTR-amended
ASite 1
0.0
0.2
0.4
0.6
0.8
1.0
1.2
1.4
1.6
t (0) 0.5 1.5 2.5 3.5 4.5 5.5 6.5 7.5
Time after WTR application (years)
PSR
Control WTR-amended
BSite 2
Figure 5-4. Phosphorus saturation ratio (PSR) changes with time for A) site 1 and B) site 2 of the Michigan field study. Error bars denote one standard deviation.
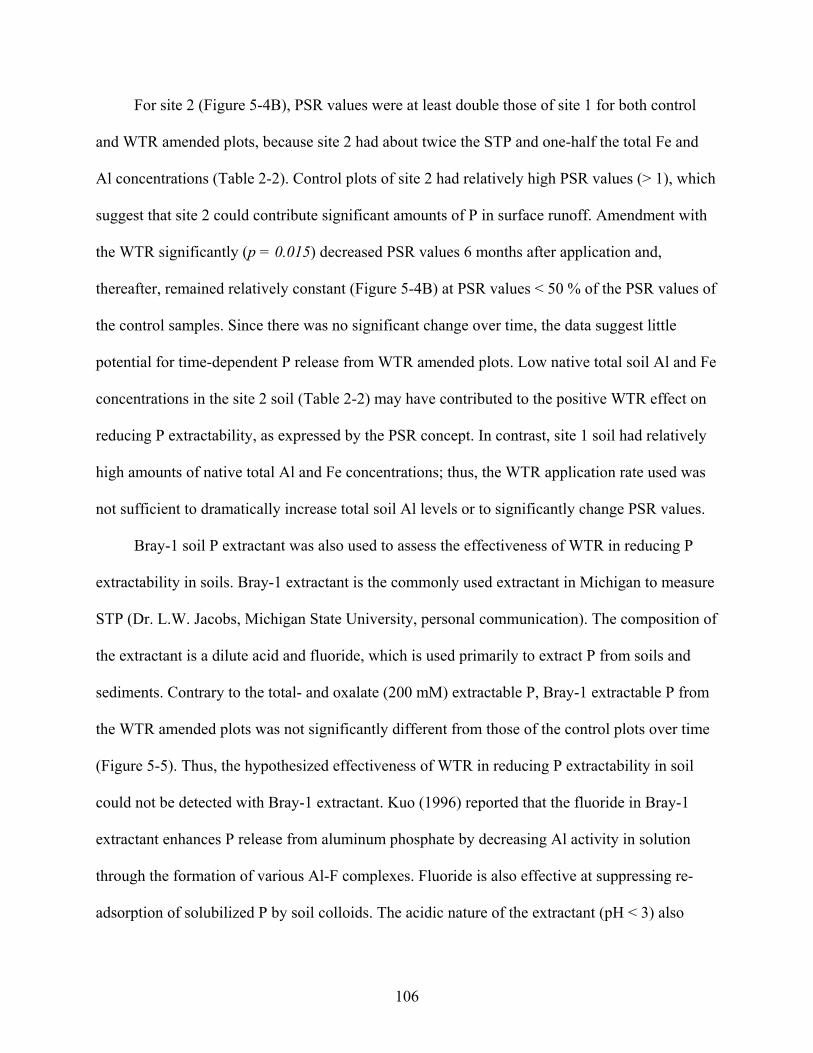
106
For site 2 (Figure 5-4B), PSR values were at least double those of site 1 for both control
and WTR amended plots, because site 2 had about twice the STP and one-half the total Fe and
Al concentrations (Table 2-2). Control plots of site 2 had relatively high PSR values (> 1), which
suggest that site 2 could contribute significant amounts of P in surface runoff. Amendment with
the WTR significantly (p = 0.015) decreased PSR values 6 months after application and,
thereafter, remained relatively constant (Figure 5-4B) at PSR values < 50 % of the PSR values of
the control samples. Since there was no significant change over time, the data suggest little
potential for time-dependent P release from WTR amended plots. Low native total soil Al and Fe
concentrations in the site 2 soil (Table 2-2) may have contributed to the positive WTR effect on
reducing P extractability, as expressed by the PSR concept. In contrast, site 1 soil had relatively
high amounts of native total Al and Fe concentrations; thus, the WTR application rate used was
not sufficient to dramatically increase total soil Al levels or to significantly change PSR values.
Bray-1 soil P extractant was also used to assess the effectiveness of WTR in reducing P
extractability in soils. Bray-1 extractant is the commonly used extractant in Michigan to measure
STP (Dr. L.W. Jacobs, Michigan State University, personal communication). The composition of
the extractant is a dilute acid and fluoride, which is used primarily to extract P from soils and
sediments. Contrary to the total- and oxalate (200 mM) extractable P, Bray-1 extractable P from
the WTR amended plots was not significantly different from those of the control plots over time
(Figure 5-5). Thus, the hypothesized effectiveness of WTR in reducing P extractability in soil
could not be detected with Bray-1 extractant. Kuo (1996) reported that the fluoride in Bray-1
extractant enhances P release from aluminum phosphate by decreasing Al activity in solution
through the formation of various Al-F complexes. Fluoride is also effective at suppressing re-
adsorption of solubilized P by soil colloids. The acidic nature of the extractant (pH < 3) also

107
contributes to dissolution of P from Al, Ca, and Fe-bound forms in most soils. Consequently,
Bray-1 extractant, like the total and oxalate extracts, will not be effective in assessing P
extractability in soils amended with Al-WTR.
Unlike the other three soil P extractants discussed above, the oxalate (5 mM) extractant
extracted significantly (p < 0.01) less P from the WTR amended plots than from the control plots
at both sites (Figure 5-6). Makris (2004) used oxalate (5 mM) extractant to desorb P from WTR,
based on the assumption that this oxalate concentration mimics natural conditions where land-
applied WTRs could release sorbed P via organic ligand mineral dissolution. Similarly Bhatti et
al. (1998) found oxalate (5 mM) as an effective extractant to desorb P from some spodic horizon
soils.
At site 1, oxalate (5 mM) extractable P was reduced from ~ 200 to ~ 100 mg kg-1 6 months
after WTR amendment, but thereafter, no significant reduction was observed. Although the
reduction in extractable P values did not decrease significantly over time after the initial 6 month
period, the overall reduction in extractable P over the experimental period was > 50%, relative to
the control plots. For site 2, oxalate (5 mM) extractable P decreased from ~ 400 to ~ 280 mg kg-1
relative to the control plots, 6 months after WTR amendment and the reduction continued
significantly for another year. Thereafter, the extractable P levels remained almost constant, with
no significant reduction. Interestingly, no P was released back into solution after 7.5 years of
field aging from both sites. Thus, the effectiveness and longevity of WTR in P immobilization
was observed with this extractant and suggests that the oxalate (5 mM) could be used to assess
the effectiveness of WTR in reducing extractable P levels in soils. Oxalate (5 mM) extractable Fe
and Al concentrations from the WTR amended plots were also significantly than the control plots
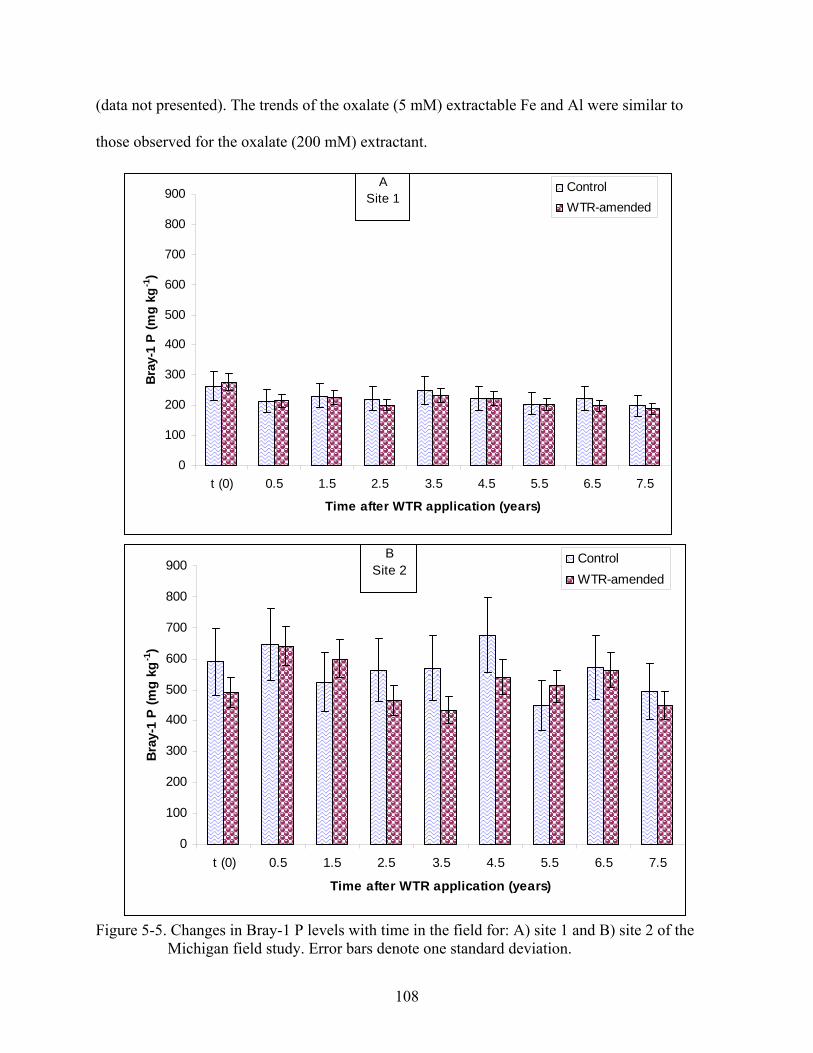
108
(data not presented). The trends of the oxalate (5 mM) extractable Fe and Al were similar to
those observed for the oxalate (200 mM) extractant.
0
100
200
300
400
500
600
700
800
900
t (0) 0.5 1.5 2.5 3.5 4.5 5.5 6.5 7.5
Time after WTR application (years)
Bray
-1 P
(mg
kg-1
)
Control WTR-amended
ASite 1
0
100
200
300
400
500
600
700
800
900
t (0) 0.5 1.5 2.5 3.5 4.5 5.5 6.5 7.5
Time after WTR application (years)
Bray
-1 P
(mg
kg-1
)
Control WTR-amended
BSite 2
Figure 5-5. Changes in Bray-1 P levels with time in the field for: A) site 1 and B) site 2 of the
Michigan field study. Error bars denote one standard deviation.
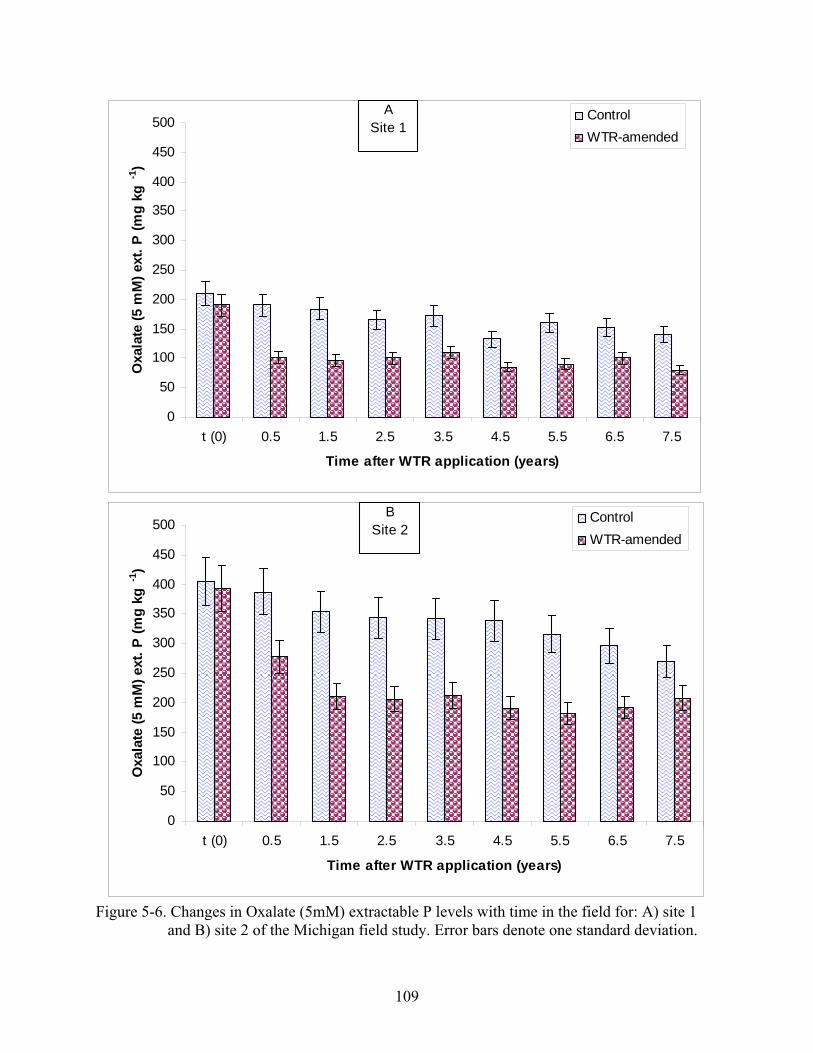
109
0
50
100
150
200
250
300
350
400
450
500
t (0) 0.5 1.5 2.5 3.5 4.5 5.5 6.5 7.5
Time after WTR application (years)
Oxa
late
(5 m
M) e
xt. P
(mg
kg-1
)Control WTR-amended
ASite 1
0
50
100
150
200
250
300
350
400
450
500
t (0) 0.5 1.5 2.5 3.5 4.5 5.5 6.5 7.5
Time after WTR application (years)
Oxa
late
(5 m
M) e
xt. P
(mg
kg-1
)
Control WTR-amended
BSite 2
Figure 5-6. Changes in Oxalate (5mM) extractable P levels with time in the field for: A) site 1 and B) site 2 of the Michigan field study. Error bars denote one standard deviation.
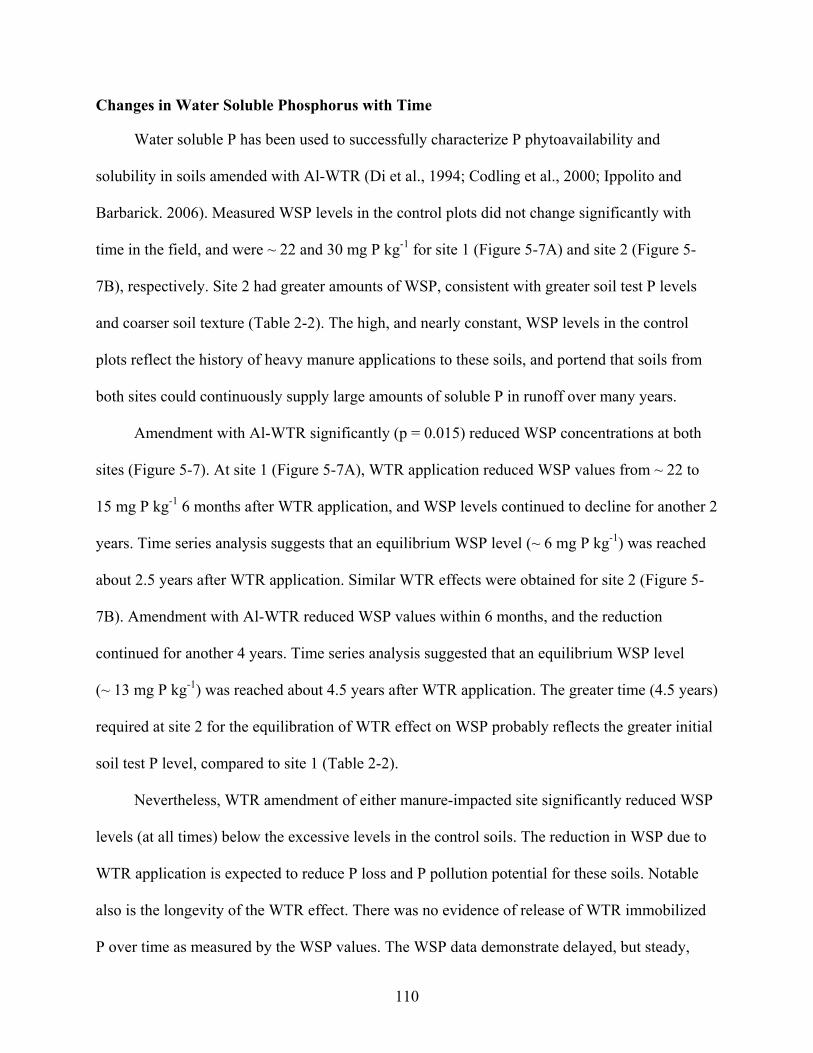
110
Changes in Water Soluble Phosphorus with Time
Water soluble P has been used to successfully characterize P phytoavailability and
solubility in soils amended with Al-WTR (Di et al., 1994; Codling et al., 2000; Ippolito and
Barbarick. 2006). Measured WSP levels in the control plots did not change significantly with
time in the field, and were ~ 22 and 30 mg P kg-1 for site 1 (Figure 5-7A) and site 2 (Figure 5-
7B), respectively. Site 2 had greater amounts of WSP, consistent with greater soil test P levels
and coarser soil texture (Table 2-2). The high, and nearly constant, WSP levels in the control
plots reflect the history of heavy manure applications to these soils, and portend that soils from
both sites could continuously supply large amounts of soluble P in runoff over many years.
Amendment with Al-WTR significantly (p = 0.015) reduced WSP concentrations at both
sites (Figure 5-7). At site 1 (Figure 5-7A), WTR application reduced WSP values from ~ 22 to
15 mg P kg-1 6 months after WTR application, and WSP levels continued to decline for another 2
years. Time series analysis suggests that an equilibrium WSP level (~ 6 mg P kg-1) was reached
about 2.5 years after WTR application. Similar WTR effects were obtained for site 2 (Figure 5-
7B). Amendment with Al-WTR reduced WSP values within 6 months, and the reduction
continued for another 4 years. Time series analysis suggested that an equilibrium WSP level
(~ 13 mg P kg-1) was reached about 4.5 years after WTR application. The greater time (4.5 years)
required at site 2 for the equilibration of WTR effect on WSP probably reflects the greater initial
soil test P level, compared to site 1 (Table 2-2).
Nevertheless, WTR amendment of either manure-impacted site significantly reduced WSP
levels (at all times) below the excessive levels in the control soils. The reduction in WSP due to
WTR application is expected to reduce P loss and P pollution potential for these soils. Notable
also is the longevity of the WTR effect. There was no evidence of release of WTR immobilized
P over time as measured by the WSP values. The WSP data demonstrate delayed, but steady,
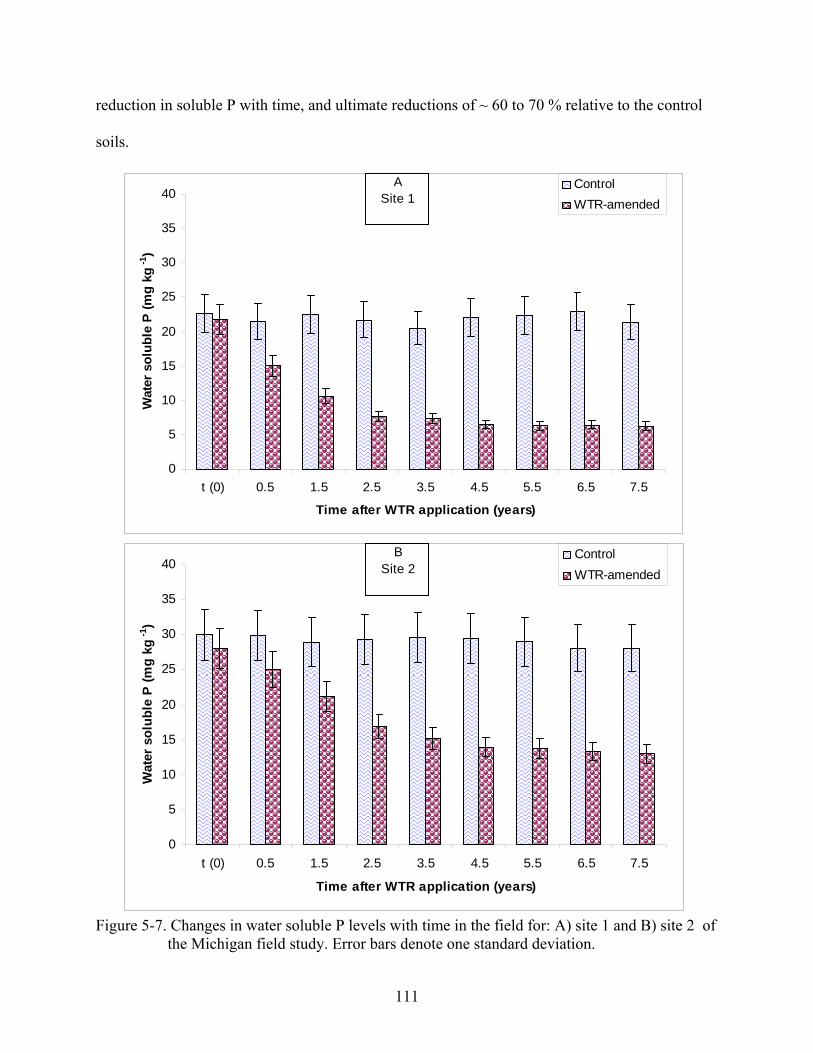
111
reduction in soluble P with time, and ultimate reductions of ~ 60 to 70 % relative to the control
soils.
0
5
10
15
20
25
30
35
40
t (0) 0.5 1.5 2.5 3.5 4.5 5.5 6.5 7.5
Time after WTR application (years)
Wat
er s
olub
le P
(mg
kg-1
)
Control WTR-amended
ASite 1
0
5
10
15
20
25
30
35
40
t (0) 0.5 1.5 2.5 3.5 4.5 5.5 6.5 7.5
Time after WTR application (years)
Wat
er s
olub
le P
(mg
kg-1
)
Control WTR-amended
BSite 2
Figure 5-7. Changes in water soluble P levels with time in the field for: A) site 1 and B) site 2 of
the Michigan field study. Error bars denote one standard deviation.
112
Labile Pools of Phosphorus as a Function of pH
The labile P concentrations were determined for all the samples collected from both sites
from 1998 to 2005, at 5 pH levels (3 – 7). However for explanatory purposes, only the labile P
pools measured at pH 3 and 6 are discussed in terms of the longevity of WTR effect. Similar
trends in P lability behavior were observed over the pH range of 4 – 7, whereas lability behavior
at pH 3 was different from the others. Similarly, for explanatory purposes for pH effect on P
lability, data of the samples taken in 2005 are presented in this dissertation. Similar trends of pH
effects were observed in samples taken over the entire sampling period.
Labile Phosphorus in Control Plots
Site 2 had greater amounts of labile P than site 1 at all pH values (Figure 5-8), consistent
with greater soil test P values (more than double those of site 1, Table 2-2). The high labile P
concentrations in the control plots reflect the long history of heavy manure applications to these
soils, and suggest that soils from both sites could continuously supply large amounts of P for
plant and microbial uptake and to runoff over many years. Apparently, sufficient manure-P
remains to support high P lability in the surface soils despite termination of manure additions. As
with the data of the artificially-aged samples in the previous chapter, the lowest labile P
concentrations in the control plots were observed at pH 4 at both sites (Figure 5-9), ranging from
an average of ~ 45 mg P kg-1 to ~ 85 mg P kg-1 for sites 1 and 2, respectively. The greatest labile
P concentrations were measured at pH 7 at both sites (~ 110 mg P kg-1 and ~ 200 mg P kg-1 at
sites 1 and 2, respectively). This is consistent with the observation of several researchers (Nwoke
et al., 2004; Olsson and Tyler, 2004; Wang et al., 2004) that P availability increases at near-
neutral to neutral pH. Labile P measured at both sites followed the order: pH 7 ≥ pH 6 = pH 5 >
pH 3 > pH 4 across the study period (1998-2005) (Figure 5-9). The data suggest that more P was
fixed at pH 4 than at pH 3. Lindsay (1979) reported that at pH values ≤ 4, Al-P minerals
113
dissolution can be considerable and some sorbed P may be released via particle dissolution.
Typical oxalate (200 mM) extractions are commonly performed at pH 3 (Schoumans 2000),
which dissolves noncrystalline Fe and Al components of the WTRs. Although a pH of 3 is rarely
encountered in natural systems, measurements at pH 3 represent a worst-case scenario for release
of immobilized P to solution.
Effects of WTR Amendments of Labile Phosphorus
Significant effects of WTR application, time, and pH, as well as their interactions on P
lability were observed at both field sites. The labile P concentrations of the WTR amended plots
decreased with time, when the labile P concentrations were determined within pH range of 4–7.
However, at pH 3, no significant difference (p = 0.672) in labile P was observed between the
control plots and the WTR amended plots at both sites.
Amendment with Al-WTR significantly (p < 0.001) reduced labile P concentrations at
both sites for pH 4-7 (Figure 5-9). Within this pH range, no increases in labile P concentrations
from the WTR amended plots from both sites were observed with time suggesting that the WTR
immobilized P remained intact. At site 1, labile P concentrations measured 6 months after WTR
application were reduced at all pH levels (except pH 3). The labile P concentrations continued to
decline for another 2 years, consistent with the trend observed with WSP measurements. Time
series analysis suggests that an equilibrium labile P concentration (~ 25 mg P kg-1) was reached
~ 2.5 years at pH 6 (1.5 years at pH 5) after WTR application (Figure 5-8).
As expected, the labile P concentrations of the samples from both sites, under different
treatments were greater than the WSP concentrations. The isotopic dilution technique measures
all WSP (easily available) in addition to other loosely bound P that is not extracted with water
(exchangeable), which would eventually become ‘available’ in the soil solution (Hamon et al.,
2002). Despite the significant differences in the concentrations of labile P and WSP, the trend of

114
labile P measurements (at pH 4-7) were consistent with trends of WSP values for the same
treatments over time. Correlation analysis using the SAS software PROC CORR (SAS, 1999)
suggests a very strong (r2 > 0.9) and significant (p < 0.001) correlation between the two P
measurement procedures.
At pH 3, however, there was no significant difference between the labile P concentration of
the WTR amended plots and the control plots, suggesting that the immobilized P was desorbed at
this pH level (Figure 5-10). Most probably, the WTR structure was destabilized at pH 3 and the
immobilized P as well as some P contained in the WTR was released.
0
50
100
150
200
250
300
t(0) 1998 1999 2000 2001 2002 2003 2004 2005
Year of sampling
Lab
ile P
con
c. (
mg
kg-1
)
Site 2 controlSite1 controlSite 2 WTRSite 1 WTR
Figure 5-8. Changes in labile P concentrations with time for the Michigan field samples
equilibrated at pH 6 for both the control and WTR amended plots taken from both sites.
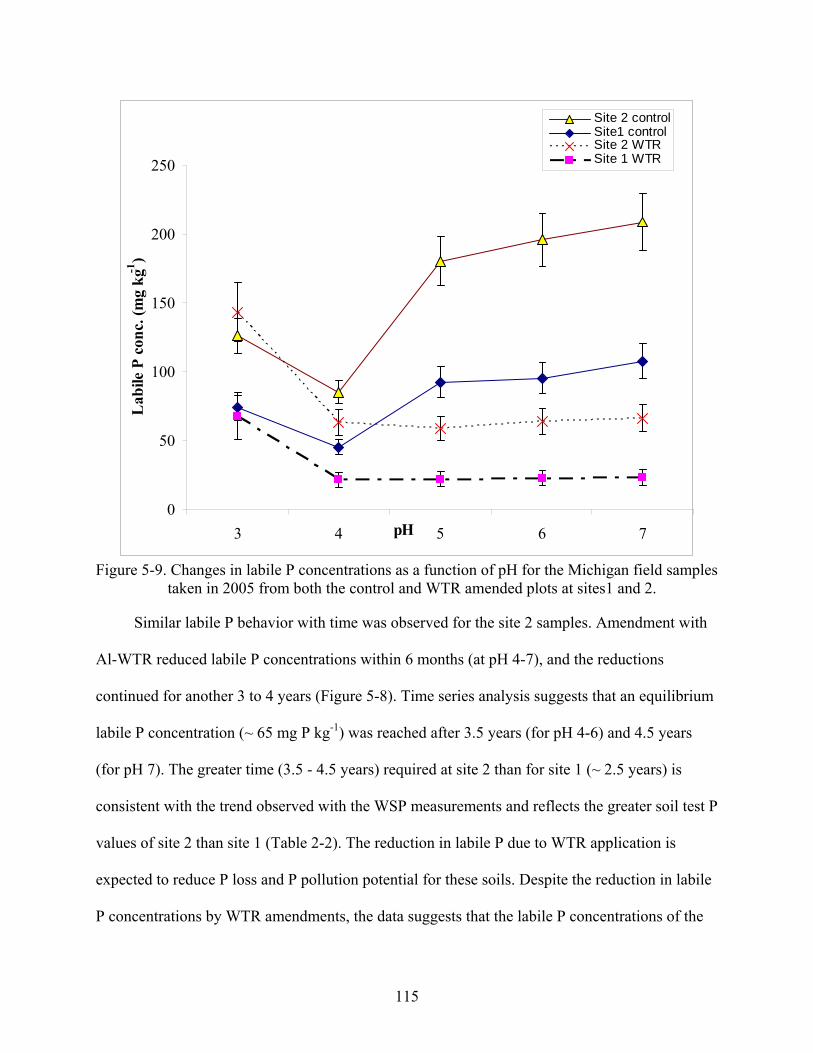
115
0
50
100
150
200
250
3 4 5 6 7pH
Lab
ile P
con
c. (m
g kg
-1)
Site 2 controlSite1 controlSite 2 WTRSite 1 WTR
Figure 5-9. Changes in labile P concentrations as a function of pH for the Michigan field samples
taken in 2005 from both the control and WTR amended plots at sites1 and 2.
Similar labile P behavior with time was observed for the site 2 samples. Amendment with
Al-WTR reduced labile P concentrations within 6 months (at pH 4-7), and the reductions
continued for another 3 to 4 years (Figure 5-8). Time series analysis suggests that an equilibrium
labile P concentration (~ 65 mg P kg-1) was reached after 3.5 years (for pH 4-6) and 4.5 years
(for pH 7). The greater time (3.5 - 4.5 years) required at site 2 than for site 1 (~ 2.5 years) is
consistent with the trend observed with the WSP measurements and reflects the greater soil test P
values of site 2 than site 1 (Table 2-2). The reduction in labile P due to WTR application is
expected to reduce P loss and P pollution potential for these soils. Despite the reduction in labile
P concentrations by WTR amendments, the data suggests that the labile P concentrations of the

116
WTR amended plots are still high enough to constitute P mobility problems at both sites.
Perhaps, a greater amount (> 114 Mg ha-1) of WTR is needed to reduce labile P concentrations to
levels that are not potentially harmful to the environment.
0
20
40
60
80
100
120
140
160
180
200
1998 1999 2000 2001 2002 2003 2004 2005
Year of sampling
Lab
ile P
con
c. (m
g kg
-1)
Site 2 controlSite 2 WTRSite1 controlSite 1 WTR
Figure 5-10. Changes in labile P concentrations with time measured at pH 3 in both the control
and WTR amended plots at site1 and 2.
Consistent with the WSP data, again, is the longevity of the WTR effect. There was no
evidence of release (increased lability) of WTR immobilized P over time at pH range of 4-7. The
data demonstrate a steady reduction in labile P with time, and ultimate reductions of ~ 65 to 75
% relative to the control soils at pH 5-7 and ~ 35 to 50 % at pH 4. The lower percentage of
reduction in labile P concentration observed at pH 4 is a reflection of the low labile P
concentration measured for the control plots at pH 4 (Figure 5-9).

117
Data trends from this study were consistent with data from the artificially-aged soil
samples (chapter 4). Within pH range of 4-7, WTR immobilized P was stable. However, at pH 3,
WTR was destabilized and the immobilized P was released back into soil solution. Fortunately,
such pH levels are rarely encountered in soils. Thus, WTR is an effective amendment to reduce
labile P in P-impacted soils and WTR immobilized P will remain fixed for a long time,
independent of common soil pH values.

118
CHAPTER 6 LONG-TERM EFFECTS OF A DRINKING-WATER TREATMENT RESIDUAL ON
RUNOFF AND LEACHATE QUALITY
Introduction
Surface runoff of nutrients nitrogen (N) and phosphorus (P) from manured agricultural
land can be an important source of water quality impairments in surface waters in the United
States (Parry, 1998). The USEPA (1986b) reported that accelerated eutrophication, the biological
enrichment of surface waters stemming from anthropogenic inputs of nutrients, is the most
common surface water impairment in the United States. Applications of animal manure in
amounts that exceed agronomic P rates (typically, based on the N requirement for crop
production) result in increased loss of P from agricultural land in surface runoff and potential
eutrophication of surface waters (Sharpley et al., 1994). The role of P in runoff water (Sharpley
et al., 1994; Correll, 1998; Daniel et al., 1998; Pote et al., 1999) and leaching (Ward and
Summers, 1993; Sims et al., 1998) from agricultural land in the eutrophication of surface water is
well documented. Excessive concentration of soluble P is the most common source of
eutrophication in fresh surface waters (Correll, 1998).
As a result of increased concern, many states are developing manure application limits to
protect surface water quality (Sims et al., 1999). Common strategies used to reduce P transport to
surface water include conservation tillage, crop residue management, cover crops, buffer strips,
contour tillage, runoff water impoundment, and terracing. These strategies are effective in
controlling particulate P but not dissolved P in runoff (Sharpley et al., 1994; Daniel et al., 1998).
Drinking-water treatment residuals (WTR) that contain Al or Fe oxides can be beneficially used
as a best management practice (BMP) to protect surface water quality by removing dissolved P
from agricultural runoff water.
119
Incorporating WTRs into soil reduces excessive soluble P resulting from manure
application (Cox et al., 1997; Dayton et al., 2003; Elliott et al., 2005; Silveira et al., 2006).
Similar studies showed that phosphorus solubility in biosolids was reduced by co-application
with WTRs (Ippolito et al., 1999; Elliott et al., 2002). O'Connor et al. (2002) showed that P
movement from P-enriched soils to freshwater supplies was reduced when the soils were treated
with WTRs. The primary purpose of their study was to investigate the ability of three locally
produced WTRs to reduce soluble P levels in sandy Florida soils amended with fertilizer,
manure, and biosolids-P sources. Phosphorus was hypothesized to be immobilized by adsorption
and /or precipitation. Gallimore et al. (1999) utilized WTRs as a buffer strip (44.8 Mg WTR ha-1)
applied to a portion of a pasture treated with poultry litter. Surface runoff P was reduced by
WTR from an average of 15 to 8.1 mg L-1. Large differences (16 and 47%) in soluble P reduction
were found between the WTRs from two treatment plants that were used in the study. The
authors concluded that the most effective surface application of WTR was as a buffer strip
(Gallimore et al., 1999).
The results of the various studies presented in this dissertation (chapters 2 to 5) suggest
that WTRs could be effective amendments to reduce labile P levels in P-impacted soils and that
WTR immobilized P is stable. The combined data of the Michigan field study, in particular,
(chapter 5) suggest that a one-time Al-WTR application is capable of reducing labile P for as
long as 7.5 years after the soil is amended with Al-WTR. The long-term effects of WTR on
labile P need to be confirmed with a runoff and/or leaching study to assess expected
improvement in water quality. The objective of this study was therefore to evaluate the long-term
effectiveness of Al-WTR in reducing dissolved P in runoff and leachate from field soils with
long histories of poultry manure applications using rainfall simulation techniques.

120
Several studies have used simulated rainfall onto packed soil boxes and field plots to
evaluate P transport in surface runoff (Kleinman and Sharpley, 2003; Kleinman et al., 2004;
Elliott et al., 2005). Runoff dissolved P concentrations from simulated rainfall have been found
to be correlated to the water extractable Phosphorus (WEP) content of soil and organic P source
(Kleinman et al., 2002; Brandt and Elliott, 2003). Kleinman et al. (2004) reported that runoff
boxes, typically packed with soil and subjected to simulated rainfall, allow greater control of
confounding variables than do field runoff plots, as soils can be homogenized to minimize
significant variability in physical and chemical characteristics. Recently, a series of findings,
primarily from packed box studies, provided the quantitative basis for developing P availability
coefficients in some P site assessment indices (Sharpley et al., 2003).
Materials and Methods
Soils and Sampling
The soils used for the study were collected from one-time WTR amended fields (2 sites) in
Western Michigan (Jacobs and Teppen, 2000). (Detailed description of soils and field layout are
presented in chapter 5). In fall 2005 (7.5 years after WTR amendment), surface soils of the
control and the WTR amended plots from both sites were bulk sampled from the top 20 cm depth
of each plot for use in this study.
Rainfall Simulation Experiment
The rainfall simulation was carried out as prescribed in the U.S. National Phosphorus
Research Project indoor runoff box protocol (National Phosphorus Research Project, 2001).
However, the design of wooden runoff boxes (100 cm long, 20 cm wide, and 7.5 cm deep) was
modified to quantify leaching of P in addition to runoff P by adding a second (empty, water-
tight) box under the first in a double-decker design. This design allows collection of runoff and
leachate simultaneously. The upper boxes were packed with 5 cm of soils to a bulk density of 1.4

121
g cm-3. Soils collected from the study sites were pre-wetted to near saturation to control for
antecedent moisture and to promote runoff in the subsequent rainfall simulation. Rainfall
simulations were conducted three times, at one-day intervals between rainfall events. Boxes were
sloped at 3 % and rainfall was delivered at 7.1 cm hr-1 from a height of 3 m above the boxes. For
each rainfall event, 30 minutes of runoff, and leachate generated continuously during the entire
rainfall, was collected from each box and the volumes recorded. Subsamples of the runoff were
immediately filtered (0.45 µm) for analysis. A representative well-mixed sample of the unfiltered
runoff and leachate (~ 250 mL) was also taken from each replicate for further analysis.
Leachate and Runoff Analyses
Leachate and runoff pH and EC was determined on each sample. The soluble reactive P
(SRP) was determined on the filtered runoff and the leachate samples colorimetrically (Murphy
and Riley, 1962). Total dissolved phosphorus (TDP) was measured on the filtered runoff and the
leachate samples after digesting 10 mL of the samples with 0.5 mL 11 N H2SO4 and 0.15g of
potassium persulfate in an autoclave for 1 hour (Pote and Daniel, 2000a,b). Total P in the
unfiltered runoff samples was determined by digesting 5 mL of the samples with 1 mL of 11 N
H2SO4 and 0.3g of potassium persulfate on a digestion block and then diluting with 10 mL of
water (Pote and Daniel, 2000b). All digested samples were analyzed for P colorimetrically
(Murphy and Riley, 1962). The iron-oxide impregnated paper strip method (Myers and
Pierzynski, 2000) was used to estimate bioavailable P (BAP) in unfiltered runoff waters.
Particulate phosphorus (PP) was calculated by subtracting TDP from the TP of each
sample. Dissolved organic P (DOP) was assumed to be the difference between SRP and TDP.
Flow-weighted P concentrations were determined for the runoff and the leachate by summing the
product of the P concentrations and volumes for the three runs (P load) and dividing the P load
by the total volume of the runs. The masses of runoff and leachate P losses (mg) were calculated

122
as the product of flow-weighted concentrations (mg L-1) and the runoff and leachate volumes
(L), respectively. Total P losses were determined by summing the masses of runoff and the
leachate P loss.
Statistical Analysis
The data showed great variation about the means with coefficient of variation > 50 %. This
prompted testing for normal distribution of the data using the Kolmogorov-Smirnov Procedure
and the normal probability plots of the Statistical Analysis System (SAS Institute, 1999). The P
concentration data were not normally distributed, and a plot of residuals vs. predicted values
showed that the ‘constant variance’ assumption of analysis of variance was violated; therefore
typical analysis of variance could not be used. Instead, the NPAR1WAY procedure of the SAS
software with the Kruskal-Wallis test was used. The NPARIWAY procedure is a nonparametric
procedure that tests whether the distribution of a variable has the same location parameter across
different groups. The Kruskal-Wallis procedure tests the null hypothesis that the groups are not
different from each other by testing whether the rank sums are different based on a Chi-square
distribution (Hollander and Wolfe, 1999). The nonparametric procedure is a powerful and robust
statistical test that is insensitive to variation among data and the presence of outliers (Hollander
and Wolfe, 1999).
Results and Discussion
The rainfall simulation study was conducted to confirm WTR effects on WSP and labile P
concentrations in the two Michigan soils observed in previous studies. Soils used represented
samples from one-time WTR amended fields in Western Michigan, 7.5 y after WTR amendment.
The masses (mg) of the various forms of P lost in runoff and leachate from soil samples collected
from both sites are given in Table 6-1, and the pH and EC values are presented in Table 6-2.
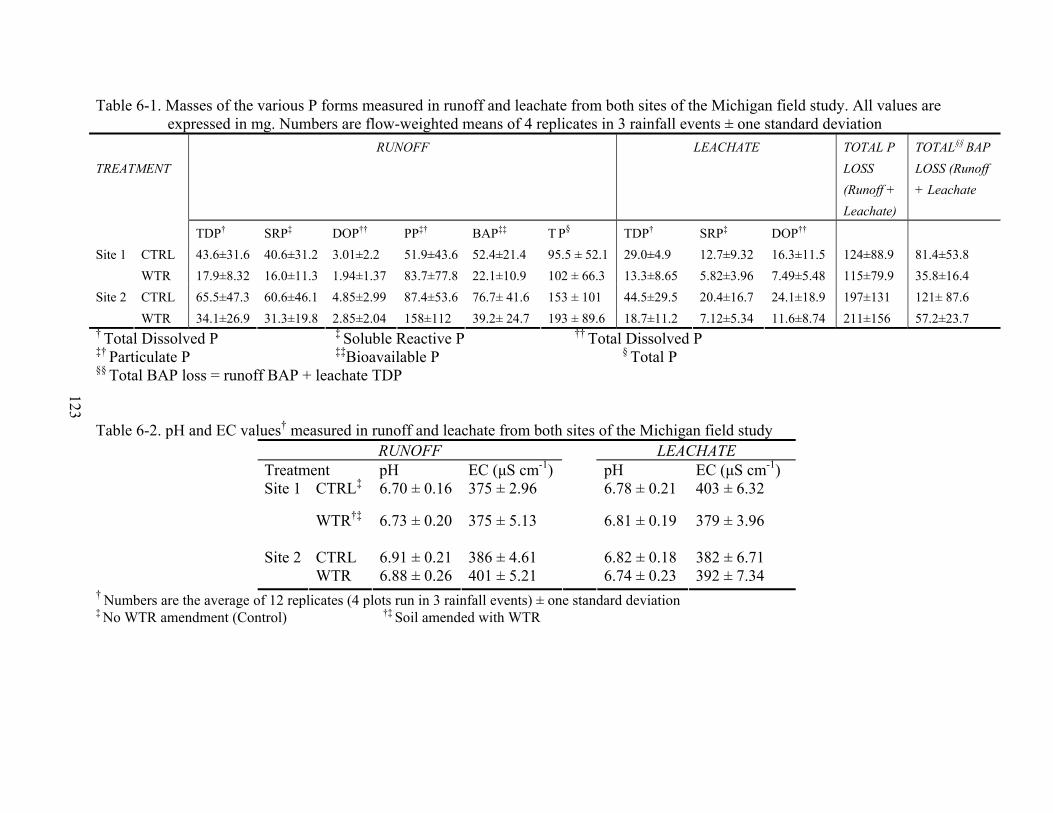
123
Table 6-1. Masses of the various P forms measured in runoff and leachate from both sites of the Michigan field study. All values are expressed in mg. Numbers are flow-weighted means of 4 replicates in 3 rainfall events ± one standard deviation
RUNOFF LEACHATE TOTAL P LOSS (Runoff + Leachate)
TOTAL§§ BAP LOSS (Runoff + Leachate
TREATMENT
TDP† SRP‡ DOP†† PP‡† BAP‡‡ T P§ TDP† SRP‡ DOP†† CTRL 43.6±31.6 40.6±31.2 3.01±2.2 51.9±43.6 52.4±21.4 95.5 ± 52.1 29.0±4.9 12.7±9.32 16.3±11.5 124±88.9 81.4±53.8 Site 1 WTR 17.9±8.32 16.0±11.3 1.94±1.37 83.7±77.8 22.1±10.9 102 ± 66.3 13.3±8.65 5.82±3.96 7.49±5.48 115±79.9 35.8±16.4 CTRL 65.5±47.3 60.6±46.1 4.85±2.99 87.4±53.6 76.7± 41.6 153 ± 101 44.5±29.5 20.4±16.7 24.1±18.9 197±131 121± 87.6 Site 2 WTR 34.1±26.9 31.3±19.8 2.85±2.04 158±112 39.2± 24.7 193 ± 89.6 18.7±11.2 7.12±5.34 11.6±8.74 211±156 57.2±23.7
† Total Dissolved P ‡ Soluble Reactive P †† Total Dissolved P ‡† Particulate P ‡‡Bioavailable P § Total P §§ Total BAP loss = runoff BAP + leachate TDP
Table 6-2. pH and EC values† measured in runoff and leachate from both sites of the Michigan field study RUNOFF LEACHATE
Treatment pH EC (µS cm-1) pH EC (µS cm-1) CTRL‡ 6.70 ± 0.16 375 ± 2.96 6.78 ± 0.21 403 ± 6.32 Site 1
WTR†‡ 6.73 ± 0.20 375 ± 5.13 6.81 ± 0.19 379 ± 3.96
CTRL 6.91 ± 0.21 386 ± 4.61 6.82 ± 0.18 382 ± 6.71 Site 2 WTR 6.88 ± 0.26 401 ± 5.21
6.74 ± 0.23 392 ± 7.34 † Numbers are the average of 12 replicates (4 plots run in 3 rainfall events) ± one standard deviation ‡ No WTR amendment (Control) †‡ Soil amended with WTR

124
Runoff P concentrations decreased with successive rainfall events, consistent the
observation of other researchers (Kleinman et al., 2004; Elliott et al., 2005). Other studies have
documented that total and dissolved P in runoff decreased with successive rainfall events
following surface application of livestock manures (Sharpley, 1997) and biosolids (Rostagno and
Sosebee, 2001; Penn and Sims, 2002). For biosolids amended field plots, Sims et al. (2003)
found the initial event accounted for 52 to 73% of the total runoff P collected over four rainfall
events. Conversely, the rate of decrease with successive rainfall events in our study was not as
great as reported in the various studies mentioned above. This could be attributed to the fact that
we utilized amended soils that were equilibrated for ~ 7.5 years, whereas others (Brandt and
Elliott, 2003; Kleinman and Sharpley, 2003; Kleinman et al., 2004; Elliott et al., 2005) used
samples equilibrated with added P for days to few weeks.
Runoff and Leachate Concentrations
Generally, there were significantly greater P losses from the soil samples collected from
site 2 (both the control and the WTR amended soils) than from site 1 (Table 6-1). Results are
consistent with the greater soil test P values and greater WSP values for soil at site 2 than at site
1 (Table 2-2). Many researchers have found that the P content of the surface soil directly
influences the loss of P in runoff (Daniel et al., 1994; Kleinman et al., 2002; Tarkalson and
Mikkelsen, 2004; Davis et al., 2005). Other researchers have shown significant relationships
between STP and runoff P concentration (Sharpley, 1995; Pote et al., 1999; Cox and Hendricks,
2000). Pote et al. (1996) reported a highly significant relationship between runoff dissolved
reactive phosphorus (DRP) and WSP for a Captina silt loam soil in Arkansas that received P
inputs as swine and poultry manure. Edwards and Daniel (1993) reported DRP levels in runoff of
0.8, 11.9, and 29.4 mg L-1 from grassed plots broadcast with swine manure at rates of 0, 19, and
38 kg TP ha-l, respectively. Rostagno and Sosebee (2001) and Elliott et al. (2005) found that SRP
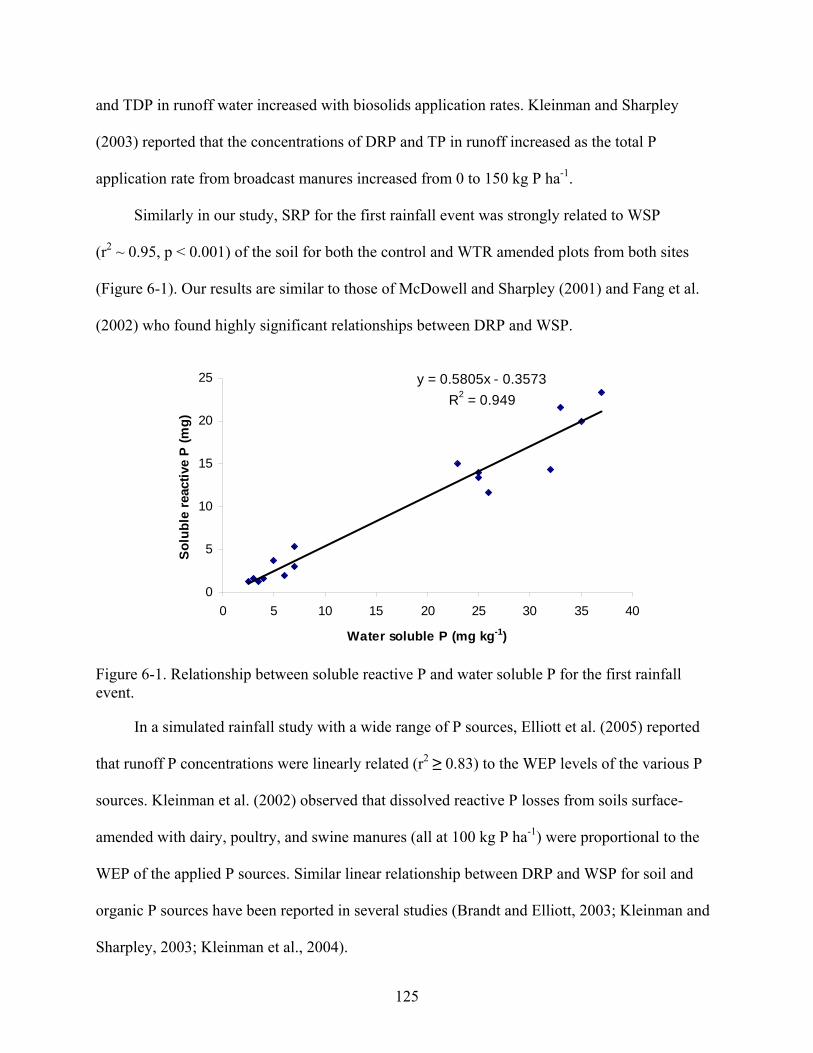
125
and TDP in runoff water increased with biosolids application rates. Kleinman and Sharpley
(2003) reported that the concentrations of DRP and TP in runoff increased as the total P
application rate from broadcast manures increased from 0 to 150 kg P ha-1.
Similarly in our study, SRP for the first rainfall event was strongly related to WSP
(r2 ~ 0.95, p < 0.001) of the soil for both the control and WTR amended plots from both sites
(Figure 6-1). Our results are similar to those of McDowell and Sharpley (2001) and Fang et al.
(2002) who found highly significant relationships between DRP and WSP.
y = 0.5805x - 0.3573R2 = 0.949
0
5
10
15
20
25
0 5 10 15 20 25 30 35 40
Water soluble P (mg kg-1)
Solu
ble
reac
tive
P (m
g)
Figure 6-1. Relationship between soluble reactive P and water soluble P for the first rainfall event.
In a simulated rainfall study with a wide range of P sources, Elliott et al. (2005) reported
that runoff P concentrations were linearly related (r2 ≥ 0.83) to the WEP levels of the various P
sources. Kleinman et al. (2002) observed that dissolved reactive P losses from soils surface-
amended with dairy, poultry, and swine manures (all at 100 kg P ha-1) were proportional to the
WEP of the applied P sources. Similar linear relationship between DRP and WSP for soil and
organic P sources have been reported in several studies (Brandt and Elliott, 2003; Kleinman and
Sharpley, 2003; Kleinman et al., 2004).
126
Most of the P loss from both sites occurred through surface runoff, rather than through
leaching (Table 6-1). The total runoff P losses of the samples taken from both sites were
dominated by particulate P (PP). Sieving and packing soils into boxes destroys larger soil
aggregates, increasing the availability of fine particles to runoff, and possibly decreasing the
stability of remaining aggregates. Kleinman et al. (2004) reported that runoff TP concentrations
were strongly related to suspended solids concentrations in runoff from field plots and soil in
runoff boxes, reflecting the importance of particulate P to TP concentrations in runoff. Even
though the authors did not directly measure PP in their study, they hypothesized that particulate
P accounted for most of the difference between TP and DRP in runoff. Tarkalson and Mikkelsen
(2004b) estimated that 75–80% of the P transported in runoff from agricultural land is adsorbed
to soil particles, termed particulate P (PP).
The runoff TDP at both sites was dominated by SRP, with DOP occurring in small
proportions (< 10 % of TDP). Contrary to TDP in runoff, TDP in the leachate had greater
absolute values of DOP than the SRP. An independent determination of the TDP was carried out
on the undigested leachate samples using ICP-AES (Perkin-Elmer Plasma 3200). The values
obtained from this independent determination were similar to those obtained from the digested
leachate samples determined colorimetrically. We, therefore, concluded that PP loads in the
leachate samples were negligible and were consequently not determined.
The high PP concentrations observed in the runoff from the soil samples, prompted
estimation of BAP levels in the runoff water, using the iron-oxide impregnated paper strip
method (Myers and Pierzynski, 2000). Sharpley (1993) reported that the transport of BAP in
agricultural runoff can stimulate freshwater eutrophication. Total BAP loss was calculated by
summing the BAP loads from the runoff and the TDP loads from the leachate. The TDP loads in
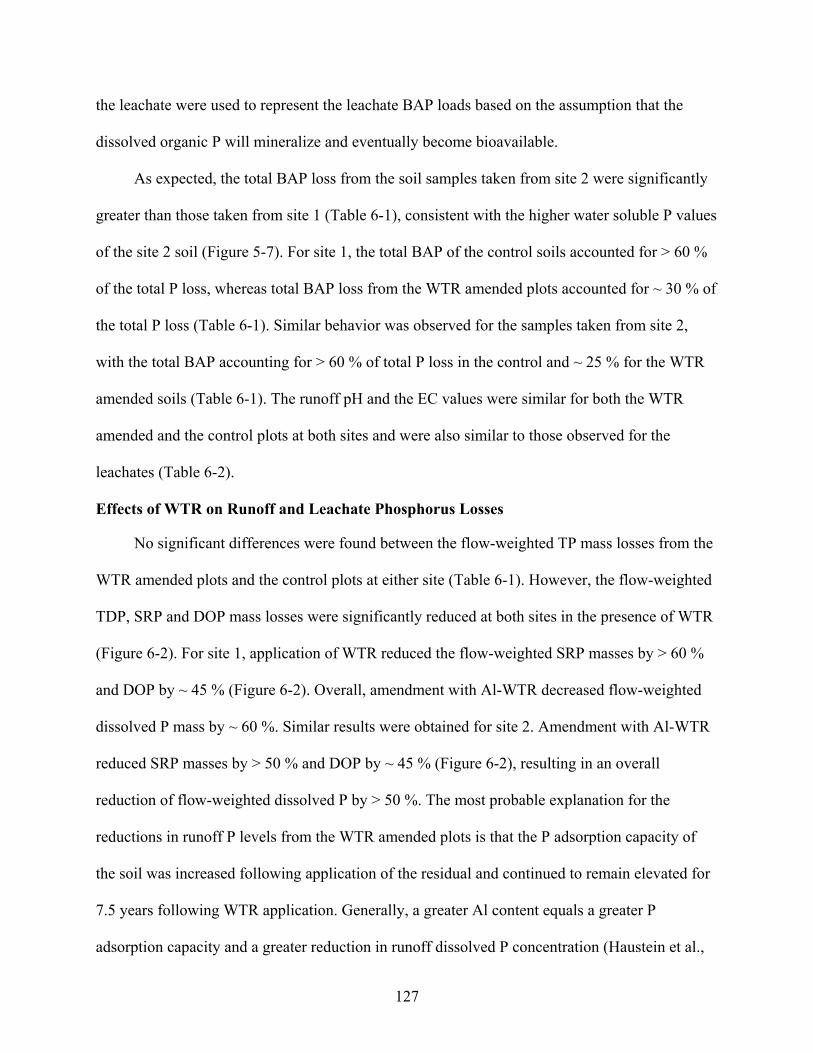
127
the leachate were used to represent the leachate BAP loads based on the assumption that the
dissolved organic P will mineralize and eventually become bioavailable.
As expected, the total BAP loss from the soil samples taken from site 2 were significantly
greater than those taken from site 1 (Table 6-1), consistent with the higher water soluble P values
of the site 2 soil (Figure 5-7). For site 1, the total BAP of the control soils accounted for > 60 %
of the total P loss, whereas total BAP loss from the WTR amended plots accounted for ~ 30 % of
the total P loss (Table 6-1). Similar behavior was observed for the samples taken from site 2,
with the total BAP accounting for > 60 % of total P loss in the control and ~ 25 % for the WTR
amended soils (Table 6-1). The runoff pH and the EC values were similar for both the WTR
amended and the control plots at both sites and were also similar to those observed for the
leachates (Table 6-2).
Effects of WTR on Runoff and Leachate Phosphorus Losses
No significant differences were found between the flow-weighted TP mass losses from the
WTR amended plots and the control plots at either site (Table 6-1). However, the flow-weighted
TDP, SRP and DOP mass losses were significantly reduced at both sites in the presence of WTR
(Figure 6-2). For site 1, application of WTR reduced the flow-weighted SRP masses by > 60 %
and DOP by ~ 45 % (Figure 6-2). Overall, amendment with Al-WTR decreased flow-weighted
dissolved P mass by ~ 60 %. Similar results were obtained for site 2. Amendment with Al-WTR
reduced SRP masses by > 50 % and DOP by ~ 45 % (Figure 6-2), resulting in an overall
reduction of flow-weighted dissolved P by > 50 %. The most probable explanation for the
reductions in runoff P levels from the WTR amended plots is that the P adsorption capacity of
the soil was increased following application of the residual and continued to remain elevated for
7.5 years following WTR application. Generally, a greater Al content equals a greater P
adsorption capacity and a greater reduction in runoff dissolved P concentration (Haustein et al.,
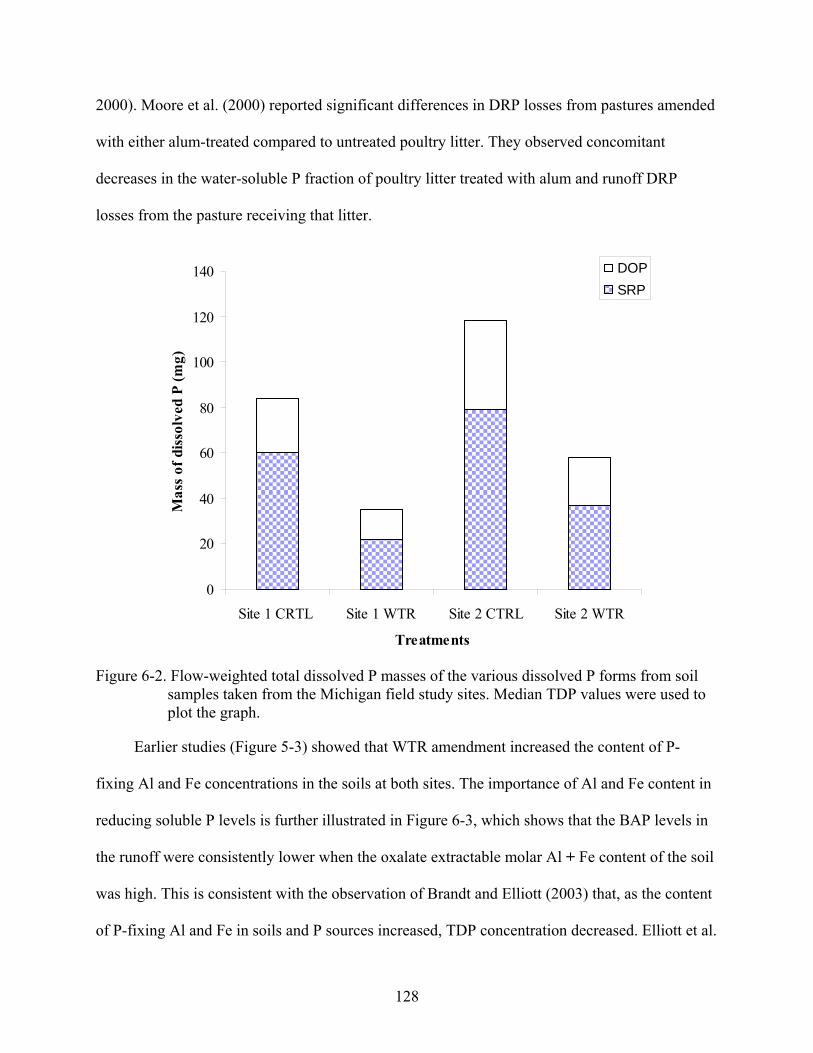
128
2000). Moore et al. (2000) reported significant differences in DRP losses from pastures amended
with either alum-treated compared to untreated poultry litter. They observed concomitant
decreases in the water-soluble P fraction of poultry litter treated with alum and runoff DRP
losses from the pasture receiving that litter.
0
20
40
60
80
100
120
140
Site 1 CRTL Site 1 WTR Site 2 CTRL Site 2 WTR
Treatments
Mas
s of
dis
solv
ed P
(mg)
DOPSRP
Figure 6-2. Flow-weighted total dissolved P masses of the various dissolved P forms from soil
samples taken from the Michigan field study sites. Median TDP values were used to plot the graph.
Earlier studies (Figure 5-3) showed that WTR amendment increased the content of P-
fixing Al and Fe concentrations in the soils at both sites. The importance of Al and Fe content in
reducing soluble P levels is further illustrated in Figure 6-3, which shows that the BAP levels in
the runoff were consistently lower when the oxalate extractable molar Al + Fe content of the soil
was high. This is consistent with the observation of Brandt and Elliott (2003) that, as the content
of P-fixing Al and Fe in soils and P sources increased, TDP concentration decreased. Elliott et al.

129
(2005) determined P levels in runoff from soils amended with biosolids and dairy manure under
simulated rainfall, and concluded that TDP concentrations in runoff can be reduced by adding Al
and Fe salts to P sources that have high concentrations of water soluble P. Dayton and Basta
(2005) reported that addition of WTR as an enhanced buffer strip in a poultry litter-impacted soil
greatly reduced dissolved reactive P (DRP) and the reduction was related to the P sorption
capacity of the WTR.
0
10
20
30
40
50
60
70
80
0 20 40 60 80
Molar Al + Fe (mmol kg-1)
BA
P (m
g)
Figure 6-3. Relationship between runoff bioavailable phosphorus (BAP) and molar oxalate
extractable Al + Fe content of the soil samples taken from both sites in fall 2005.
Amendment with WTR decreased the total (runoff + leachate) flow-weighted TDP
concentrations from ~ 2.5 mg L-1 to ~ 0.86 mg L-1 at site 1, and from ~ 3.2 mg L-1 to ~ 0.94 mg
L-1 at site 2 (Figure 6-4). The reduced values exceeded values (0.01-0.05 mg L-1) usually
associated with eutrophication of surface waters (USEPA, 1986b), but were below a solution
concentration of 1.0 mg L-1 (3.2 * 10-5 M) occasionally used as a benchmark. The 1.0 mg L-1
concentration is a common goal for wastewater discharges to rivers and streams and has been
applied to soils on the premise that the discharge of P from soils to water should be held to the

130
same standard (Sims and Pierzynski, 2005). Greater single amendment rates (> 114 Mg ha-1), or
multiple (yearly) WTR applications are likely necessary to reduce TDP concentration to the
0.01-0.05 mg L-1 target concentration range. The single application of 114 Mg ha-1, however,
significantly reduced runoff and leachate P impacts on water quality.
0
1
2
3
4
Site 1 CRTL Site 1 WTR Site 2 CTRL Site 2 WTR
Treatments
Flow
-wei
ghte
d T
DP
conc
. (m
g L-1
)
Figure 6-4. Flow-weighted TDP concentrations in runoff from soil samples from the Michigan
field study. Median values were used to plot the graph.
Regressions between transformed runoff and leachate SRP values [log (SRP+1)] and soil
test P (Bray-1 P) concentrations were used to derive P extraction coefficients (slope of the
regression) (Sharpley, 1995). The extraction coefficient, which is an input to process-based P
transport models and P site assessment indices, is the fraction of STP that can be released to
overland flow for a given flow event volume (Shapley et al., 2002). A larger soil extraction
coefficient represents a greater P release as dissolved P in overland flow per unit of STP
increase.
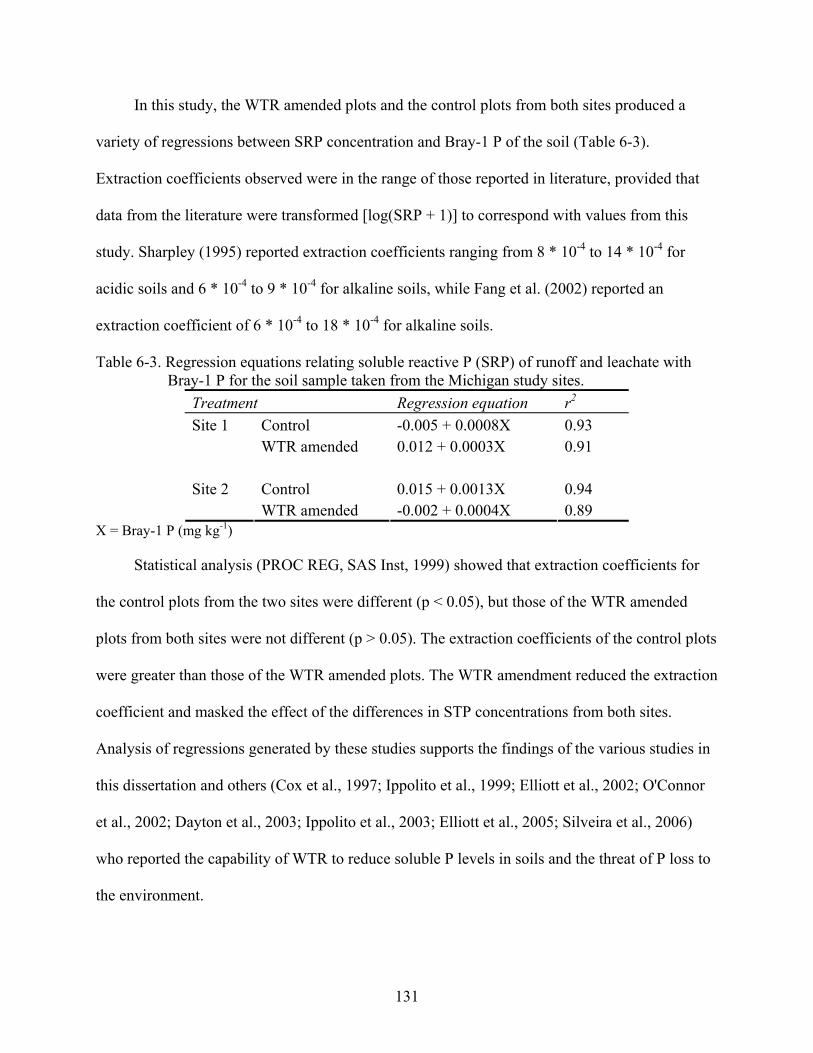
131
In this study, the WTR amended plots and the control plots from both sites produced a
variety of regressions between SRP concentration and Bray-1 P of the soil (Table 6-3).
Extraction coefficients observed were in the range of those reported in literature, provided that
data from the literature were transformed [log(SRP + 1)] to correspond with values from this
study. Sharpley (1995) reported extraction coefficients ranging from 8 * 10-4 to 14 * 10-4 for
acidic soils and 6 * 10-4 to 9 * 10-4 for alkaline soils, while Fang et al. (2002) reported an
extraction coefficient of 6 * 10-4 to 18 * 10-4 for alkaline soils.
Table 6-3. Regression equations relating soluble reactive P (SRP) of runoff and leachate with Bray-1 P for the soil sample taken from the Michigan study sites.
Treatment Regression equation r2 Control -0.005 + 0.0008X 0.93 Site 1 WTR amended 0.012 + 0.0003X 0.91
Control 0.015 + 0.0013X 0.94 Site 2 WTR amended -0.002 + 0.0004X 0.89
X = Bray-1 P (mg kg-1)
Statistical analysis (PROC REG, SAS Inst, 1999) showed that extraction coefficients for
the control plots from the two sites were different (p < 0.05), but those of the WTR amended
plots from both sites were not different (p > 0.05). The extraction coefficients of the control plots
were greater than those of the WTR amended plots. The WTR amendment reduced the extraction
coefficient and masked the effect of the differences in STP concentrations from both sites.
Analysis of regressions generated by these studies supports the findings of the various studies in
this dissertation and others (Cox et al., 1997; Ippolito et al., 1999; Elliott et al., 2002; O'Connor
et al., 2002; Dayton et al., 2003; Ippolito et al., 2003; Elliott et al., 2005; Silveira et al., 2006)
who reported the capability of WTR to reduce soluble P levels in soils and the threat of P loss to
the environment.

132
A large proportion (42-75 %) of the total P load loss in runoff was PP (Figure 6-5). The
flow-weighted PP masses were significantly greater in the WTR amended plots at both sites than
the control plots (Figure 6-5). Possibly, the particles detached by the rain drops from the WTR
amended plots had greater P enrichment due to the WTR immobilization than the soil particles
detached from the control plots. Furthermore, the greater PP masses may be due to the presence
of WTR contained in the eroded particles, which also contains some P.
0
20
40
60
80
100
120
Site 1 CRTL Site 1 WTR Site 2 CTRL Site 2 WTR
Treatments
Perc
enta
ge o
f tot
al P
loss
PPDOPSRP
Figure 6-5. Percentages of total P mass loss represented by the various P forms from the
Michigan field study. Median values of the various fractions of total P loss were used to plot the graph.
Tarkalson and Mikkelsen (2004b) reported that 11–70% of PP can become bioavailable to
aquatic organisms and thus lead to eutrophication. This prompted the determination of
bioavailable P (BAP) using FeO-impregnated paper strips. Unlike other extractions, which react
with soil and dissolve specific P fractions, FeO paper acts as an infinite sink that adsorbs and

133
retains P that is mobile in the soil solution (Menon et al., 1997). Sharpley (1993) found a strong
correlation between algal growth and the amount of P extracted from runoff sediment by the
BAP.
Despite the greater particulate P loads in runoff from the WTR amended plots, flow-
weighted BAP masses in runoff were significantly smaller than those of the control plots (Figure
6-6), suggesting that much of the particulate P was not bioavailable. Thus, even if WTR-P erodes
to surface waters, there should be minimal adverse effects on water quality. The data suggest that
even 7.5 years after WTR amendment of the sites, the WTR immobilized P remained non-labile.
Thus, there is little justifiable fear that WTR immobilized P will dissolve into runoff and
leachates to contaminate surface water and groundwater.
0
10
20
30
40
50
60
70
80
90
Site 1 CRTL Site 1 WTR Site 2 CTRL Site 2 WTR
Treatments
Mas
s of b
ioav
aila
ble
P (m
g)
Figure 6-6. Flow-weighted bioavailable P loads in runoff from the Michigan field study. Median
values of the various fractions of total P loss were used to plot the graph.
134
Drinking-water treatment residauls can be relied upon to control P losses in runoff and leachate.
Even if WTR-P erodes to surface waters, our data suggest the bioavailability of the immobilized
P is minimal. Makris et al (2004a,b) reported that P sorption by WTRs was essentially
irreversible. The authors hypothesized that bottleneck-shaped micropores limited P diffusion
rates; the hypothesis was consistent with time-dependent sorption and hysteretic desorption.
Thus micropore-bound P likely resists desorption, which favors long-term stability of sorbed P
by WTRs.

135
CHAPTER 7 MODELING SOLID PHASES CONTROLING SOLUBILITY OF WTR IMMOBILIZED
PHOSPHORUS
Introduction
Environmental concerns have caused many states to implement laws regarding land
application of P to minimize the potential for P transport in agricultural runoff. Significant
amounts of P added to the soil in the form of fertilizers, biosolids and manures can pollute water
supplies via surface runoff and leaching. The problem is exacerbated for poorly-P sorbing soils,
such as coastal plain soils of the southeastern U.S. where P leaching occurs and polluted water is
intercepted by drains (or shallow water tables) that join surface waters. However, in strongly P
sorbing soils, reactions with soil constituents result in a reduction of P concentration in solution
over time, following application of soluble P fertilizer to soil (Sample et al., 1980; Wolt, 1994;
Folle et al., 1995). In strongly P-sorbing soils, soluble Al, Fe, Ca and Mg (depending on soil pH)
quickly react with soluble P to form complexes that may precipitate from solution or be adsorbed
on the surface of Fe and Al oxides or on clay particles (Lindsay et al., 1962; Martin et al., 1988).
The reactions governing the P forms and availability in soils can be described by the
solubility of sparingly soluble metal-hydroxyphosphate minerals that extend pH-dependent
control over soil solution phosphate activity (Lindsay, 1979; Schwab, 1989; Karathanasis, 1991;
Wolt, 1994). In acid soils, Al, Fe, and other metals react with P to form new solid phases, or P is
sorbed in surface complexes on Fe and Al oxides and clay particles (Wang et al., 1991; Sloan et
al, 1995; Zhang and Karathanasis, 1997). If the soil pH shifts from the acid to the alkaline range,
the reaction products of phosphorus fertilization will shift to calcium phosphates (Fixen et al,
1983; Hanson and Westfall, 1985). Thus, phosphate solubility is influenced by the activities of
Fe and Al (in acid soils) or Ca and Mg (in alkaline soils) species in soil solutions that are largely
controlled by the solid-phase solubility of Fe and Al or Ca and Mg minerals in soils (Lindsay,
136
1979; Sample et al., 1980). Therefore, the distribution of various forms of phosphate is related to
the distribution and chemical reactions of Fe, Al, Ca and Mg fractions in soils.
In soils characterized by coarse textures and low Fe/Al or Ca hydroxide contents, P is
sorbed poorly and significant amounts of applied P can be lost through runoff or leachates to
contaminate fresh surface waters and/or groundwater. One suggested way to mitigate P losses is
to increase the P sorption capacity of poorly P-sorbing soils with soil amendments. For example,
Summers et al. (1993), Peters and Basta (1996), and Snars et al. (2003), used activated red mud
(neutralized bauxite refinery residue) to improve the P sorption capacity of sandy soils. Other
researchers have reported the efficacy of alum (Al2(SO4)3•14H2O) in reducing P mobility in
poorly P-sorbing soils (Moore et al., 1998; Haustein, 2000; Staats et al., 2004). The use of
drinking-water treatment residuals (WTR) to control P mobility in poorly P sorbing soils has
received increased attention recently. However, the long-term stability of the P sorbed by WTRs
has only been qualitatively inferred from lab experiments (Makris et al., 2004a). Improved
understanding of the P dynamics in WTR amended P-impacted soils is essential to predict the
long-term stability of WTR immobilized P in the environment. We hypothesized that long-term
chemical phase changes of P will be associated with WTR-Al or -Fe, as Al or Fe phosphate solid
phases due to the nature of the WTR. Secondly, stable Al and Fe minerals will control P
solubility of WTR immobilized P from P-impacted soils, thus ensuring that WTR immobilized P
remains stable in the long-term and that the stability would vary in predictable ways.
A variety of methods have been used to distinguish between adsorption and precipitation
reactions of soluble P in P sorbing soils. Pierzynski et al. (1990) used electron optical techniques
to describe P-rich particles in excessively fertilized soils and found that Al and Si were the
dominant elements associated with P. These amorphous, mixed Al-Si-P substances occurred as

137
discrete particles as well as coatings on other particles. Martin et al. (1988) used spectroscopic
techniques to observe Fe-phosphate crystallites on the surface of goethite. They concluded that in
an iron oxide system, phosphate retention may be due primarily to precipitation rather than
adsorption. Van Riemsdijk and Lyklema (1980) found that adsorption contributed very little to
total sorption at P concentrations > 1 mmol L-1. Josan et al. (2005) and Silveira et al. (2006) used
VISUAL MINTEQ to predict the solid phases controlling P solubility in manure-impacted soils.
Alva et al. (1991) Sloan et al. (1995) used MINTEQA2-derived saturation indices to identify
possible solid phases in soil amended with five P fertilizer rates and in soil amended with
phosphogypsum solution, respectively. Sloan et al. (1995) used MINTEQA2 to determine Al
speciation in acid soils amended with alkaline biosolids.
In this experiment MINTEQA2 (Allison et al., 1999) model was used to calculate the
concentration of species present at equilibrium. MINTEQA2 is a program developed by USEPA
and includes a geochemical equilibrium speciation model capable of computing equilibria among
the dissolved, adsorbed, solid and gas phases in an environmental setting. MINTEQA2 includes
an extensive database with thermodynamic data that is accessible to PRODEFA2, an interactive
program designed to create the required input data file.
The objectives of this study were to investigate the influence of various species of Fe and
Al on phosphate solubility and reactions, and to speculate about solid phases controlling the
solubility of WTR immobilized P. The stability of the solid phases will enable the prediction of
the long-term stability of WTR immobilized P.
Materials and Methods
Soil Samples Used
Field- and artificially-aged soils samples were utilized for this study. The field-aged
samples were obtained from one-time WTR amended fields in Western Michigan (Jacobs and
138
Teppen, 2000). Two test sites in Michigan were selected in 1998 for evaluation of WTR effects
on P extractability in soils having “very high” Bray-1 soil test P concentrations. Soils from both
sites have a long-term (> 10 yr) history of heavy poultry manure applications. Details of the sites
description and soil characterization are presented in chapters 2 and 5.
The artificially aged soil samples were prepared by amending unimpacted Immokalee A
horizon soil sample with 25 g kg-1 of four air-dried WTRs (Bradenton, Holland, Lowell and
Cocoa WTRs). Phosphorus was added to the WTR amended soils as TSP solutions at 0, low
(43), or high (100) mg P kg-1 to roughly mimic field P-fertilization rates. The soil samples were
thoroughly mixed, and aged via thermal incubation or wetting and drying to mimic long-term
field effects: (see chapter 2 for the physicochemical characteristics of the soil and WTRs, and
chapter 4 for detailed description of the incubation procedure).
Soil Extraction
Twenty grams (oven-dry equivalent) of each soil sample was placed in centrifuge tubes to
which 20 mL of deionized water was added, giving a solid-to-solution ratio of 1:1. Two drops of
toluene were added to each suspension and appropriate aliquots of diluted HCl and NaOH were
added daily to the samples to provide a series of 3 pH levels (3, 5 and 7) for each treatment. The
soil suspensions were equilibrated for 14 days in a reciprocating shaker at a rate of 100 strikes
min-1 at room temperature (24 ± 2°C). The mild vigor of shaking was intended to avoid soil
aggregate disruption and particle abrasion (Koopmans et al., 2004). After the equilibration
period, the soil suspensions were centrifuged at a relative centrifuge force of 8000 x g for 20
min. The supernatants were collected and filtered through a 0.45-µm pore-size filter membrane
for analyses. Quality assurance and quality control protocols included 5% repeats, spikes,
certified samples and blanks for each procedure.

139
Equilibrium Modeling
The pH values and oxidation-reduction (redox) potentials (Eh) of the soils amended with
Fe-WTR, and electrical conductivities (EC) of the solutions were analyzed immediately after
extraction. Ionic strengths of the extracts were calculated from EC based on the following
conversion (Griffin and Jurinak, 1973):
I = 0.0127 EC [1]
where I = ion strength (mol L-1).
The concentrations of aluminum (Al3+), calcium (Ca2+), magnesium (Mg2+), potassium
(K+), sodium (Na+), and iron (Fe3+) were measured using ICP-AES (Perkin-Elmer Plasma 3200).
The concentrations of sulfate (SO42-), nitrate (NO3
-), phosphate (PO43-), carbonate (CO3
2-),
chloride (Cl-) and fluoride (F-) were analyzed using ion chromatography (Dionex Separator
AS-14).
The geochemical assessment model MINTEQA2 (Allison et al., 1999) was used to
calculate activities of dissolved chemical species. Total dissolved concentrations of ions mea-
sured by laboratory methods and soil solution pH were input data for MINTEQA2. Equilibrium
constants were adjusted using the ionic strength calculated by MINTEQA2. Saturation indices
were calculated by MINTEQA2 for all possible solids with respect to the soil solution. The
saturation index (SI) is defined as:
SI = log (IAP / Ksp) [2]
where IAP is the ion activity product of the appropriate chemical species and Ksp is the
solubility product of the possible solid phase. Ion activity products are based solely on the
speciation of the soil solution and can be used to determine whether the dissolution-precipitation
reaction is actually at equilibrium (Sposito, 1989). For any specific mineral, SI > 0 indicates that

140
the soil solution is oversaturated and SI < 0 indicates that it is undersaturated. As the dissolution-
precipitation reaction nears equilibrium, the SI value approaches zero.
Constant Capacitance Modeling
The ability of the constant capacitance model to describe phosphate adsorption on WTR
(external + internal) surfaces was investigated. The constant capacitance model is based on the
following assumptions (Goldberg and Sposito, 1984):
• adsorption proceeds via a ligand exchange mechanism,
• all surface complexes formed are inner-sphere complexes;
• the constant ionic medium reference state determines the activity coefficients of the aqueous species in the conditional equilibrium constants and therefore no complexes are formed with ions in the background electrolyte; and
• a linear relationship exists between surface charge (σ), [mmol L-1], and the surface potential (ψ):
σ = (Csα/F)ψ [3]
where C is the capacitance density (Fm-2), s is the specific surface area (m2 g-1), α is the
suspension density (g L-1), F is the Faraday constant (C mol-1), and σ has units of mol L-1.
The following equations are surface complexation reactions (Dimirkou et al., 1996;
Ioannou et al., 1996) of phosphate ion on aluminum and iron hydr(oxides):
SOH + H+ = SOH2+, [4]
SOH ↔ SO- + H+, [5]
SOH + H3PO4 ↔ SH2PO4 + H2O [6]
SOH + H3PO4 ↔ SHPO- + H2O + H+ [7]
SOH + H3PO4 ↔ SPO4-2 + H2O + 2H+ [8]
where SOH in this study represents the surface functional group of Alum-and Fe-based WTRs.
141
The intrinsic conditional equilibrium constants (Dimirkou et al., 1996; Ioannou et al., 1996)
describing these reactions are:
K+ (int) = ([SOH2+] / [SOH][H+]) exp(Fψ/RT) [9]
K- (int) = ([SO-] [H+] / [SOH]) exp(-Fψ/RT) [10]
K1 (int) = [SH2PO4] / [SOH][H3PO4] [11]
K2 (int) = ([SHPO-][H+] / [SOH][H3PO4]) exp(-Fψ/RT) [12]
K3 (int) = ([SPO4-2] [H+]2 / [SOH][H3PO4]) exp(-2Fψ/RT) [13]
where R is the molar gas constant (J mol-1 K-1), T is the absolute temperature, and square
brackets represent concentrations (mol L-1). The intrinsic conditional equilibrium constants are
obtained by extrapolating the conditional equilibrium constants to zero net surface charge
(Stumm et al., 1980; Goldberg and Sposito, 1984). Goldberg (1992) defined the conditional
equilibrium constants for protonation-dissociation as
cK+ (int) = ([SOH2+] / [SOH][H+]) [14]
cK- (int) = ([SO-] [H+] / [SOH]) [15]
The relationship between the intrinsic and conditional protonation constants after
combining Eq. [9] with Eq. [14] and Eq. [10] with Eq. [15] is
K± (int) = cK exp(Fψ/RT) [16]
Unlike the intrinsic constants, the ordinary conditional equilibrium constants depend on
surface charge (Stumm, et al., 1980). The exponential terms in Equations [9], [10], [12], and [13]
represent the contribution of this mean field to the rational activity coefficients of the surface
species. In practical terms, the exponential term can be considered as a solid-phase activity
coefficient that corrects for the charge of a surface species (Goldberg and Sposito, 1984). With
the addition of mass balance and charge balance equations, the chemical equilibrium problem

142
formulated above can be solved (Goldberg and Sposito, 1984). The mass balance equation for
the surface functional group, SOH, is
[SOH]T = [SOH] + [SOH2+] + [SO-] + [SH2PO4] + [SHPO4
-] + [SPO4-2] [17]
where again square brackets indicate concentrations (mol L-1). The corresponding charge
balance equation is
σ = [SOH2+] - [SO-] - [SHPO4
-] - 2[SPO4-2] [18]
In order to solve the set of Equations [3], [9] - [13], [17], and [18] the computer program
Ma-Za 1 (Ioannou and Dimirkou, 1994) was used. Ma-Za 1 is a computer program describing
the adsorption processes for the constant capacitance model. The use of Ma-Za 1 requires values
of intrinsic surface protonation-dissociation constants and intrinsic surface complexation
constants. The computer program Ma-Za 2 (Ioannou and Dimirkou, 1995) was used to obtain
these parameters. Ma-Za 2 employs a nonlinear, least squares method to fit equilibrium constants
to experimental data. Ma-Za 2 also contains the constant capacitance model to describe surface
complexation.
In this study Ma-Za 2 was used to fit the constant capacitance model to phosphate
adsorption isotherm data on WTRs and to obtain optimal values of the phosphate surface
complexation constants. The equilibrium constants thus obtained were employed in Ma-Za 1 to
check the goodness of fit of the model at each point on the adsorption isotherms. The Ma-Za 2
program optimizes the values of adjustable parameters by changing their values until the sum of
the squares (S) [S = ∑(yi - xi)2] of the residuals between the measured adsorption data (yi) and
Ma-Za 2 calculated values (xi) is minimized (Ioannou and Dimirkou, 1995). In general Ma-Za 2
convergence is most likely to occur when data are fitted using only two adjustable parameters.
Numerical values used in this study for the intrinsic protonation-dissociation constants K+ (int) and
143
K- (int) were obtained from the average values of a literature compilation of experimental data for
aluminum and iron oxides (Goldberg and Sposito, 1984). The capacitance density, C, cannot be
determined experimentally and is treated as an empirical adjustable parameter. A working value
was chosen on the basis of previous applications of the constant capacitance model (Westall and
Hohl, 1980; Goldberg and Sposito, 1984; Dimirkou et al., 2002). In this study, C was fixed at
1.06 F m-2, a value which is optimal for aluminum and iron oxides (Westall and Hohl, 1980).
Additional model parameters, such as specific surface area (Makris, 2004), phosphate adsorption
isotherm data for WTRs, and suspension density (α), were determined experimentally. The value
of the surface site density [SOH]T was determined by potentiometric titration (Kummert and
Stumm, 1980; Lutzenkirchen, 1999; Goldberg, 2002; Jara et al., 2005) and was optimized to fit
experimental adsorption data (Lutzenkirchen, 1999; Goldberg, 2002; Jara et al., 2005).
Independent model validation was carried out using the MINTEQA2 (Allison et al., 1999)
geochemical model.
Phosphorus adsorption experiments were carried out in batch systems to determine
adsorption envelopes (amount of P adsorbed as a function of solution pH per fixed total P
concentration) (Ioannou and Dimirkou, 1996; Dimirkou et al., 2002). Samples of adsorbent
(0.1 g for the WTR samples in three repetitions) were added to 100 mL polypropylene centrifuge
tubes and equilibrated with 20 ml of 0.1 M KC1 solution and 1 drop of toluene by shaking for 14
days on a reciprocating shaker at constant temperature (24 ± 2°C). These solutions contained 250
to 1250 mg P L-1 as KH2PO4, which had been adjusted to the desired pH values (3-7) using 1 M
HC1 or 1 M KOH additions that changed the total volume by ≤ 2%. The samples were
centrifuged at a relative centrifuge force of 8000 x g for 20 min at constant temperature
(24 ± 2°C). The decantates were filtered through a 0.45 µm Whatman filter paper, and analyzed

144
for P using the Murphy and Riley (1962) method. The P sorbed was calculated from the
difference between initial and final concentrations of P in solution. Following the P sorption
experiments, the supernatants were removed and WTR samples were washed twice with
anhydrous ethanol to remove residual P. The WTR-containing tubes were filled with 20 ml of
0.1 M KC1 solution and 1 drop of toluene and adjusted to the desired pH values as described
above. The WTR suspension was then shaken for 14 days to assess P released from the P loaded
WTRs. Released P was determined as described above.
Results and Discussion
Modeling results for only the soil samples taken at time zero and the final sampling of both
the artificially incubated samples and the field-aged samples are presented because other
sampling time data showed similar trends. We recognize that there are assumptions and
uncertainties (e.g., approximation of organic speciation, non-equilibrium, kinetic effects, etc.)
inherent in modeling complex solutions. We, therefore, restrict our interpretations to major
trends indicated by the modeling results.
Chemical Speciation of Soil Solutions
Field-aged Samples
The samples from both the control and WTR amended MI field plots taken from both sites
1 and 2, and equilibrated at pH 5 and 7 had similar chemical P species in solution, but the
relative abundance of the species was related to pH. On the other hand, the samples equilibrated
at pH 3 had different chemical P species in solution.
For the samples equilibrated at pH 7 (both control and WTR amended plot at both sites),
the major chemical P species in solution were HPO42- (~ 35 % of total soluble P), H2PO4
-
(~ 30 %) and Mg-P [MgHPO4 (aq) and MgPO4-] and Ca-P (CaPO4) complexes (~ 20 and 12 %
of total soluble P, respectively) (Tables 7-1 and 7-2). Wang et al. (1995) and Silveira et al.

145
(2006) predicted similar P species in solution from manure-impacted FL soils. Aluminum- and
Fe-P species were not predicted to occur in the soil solutions, because of the neutral pH
conditions (pH 7) and undetectable (< 0.03 mg L-1) Al and Fe concentrations. Even samples from
the WTR amended plots collected from both sites had soluble Al concentration < 0.03 mg L-1.
Samples taken at the end of the experimental period (7.5 years) had similar P chemical speciation
as the samples taken at time zero from both sites in both the control and WTR amended plots.
The absence of Al-P among the predicted P species was due to the fact that Al concentration was
below the detection limit (< 0.03 mg L-1) of the instrument. This is an indirect indication that
after 7.5 years of field aging, the WTR was still stable. Silveira et al. (2006) reported that even at
WTR application of 100 g kg-1 in a column study leached for 36 weeks, soluble Al was
undetectable in the leachate and, consequently, Al-P were not predicted in chemical equilibrium
modeling. Makris (2004) conducted long-term (80 days) equilibrations of Al-WTRs in
unbuffered 0.01 M KCl solutions and observed that soluble Al concentrations of untreated (no P
added) Al-WTRs were below the instrument’s (ICP-AES) detection limit (0.03 mg Al L-1). Most
P-treated (10,000 mg kg-1 initial P load) Al-WTR suspensions released small (< 10 mg kg-1)
quantities of soluble Al, but one released 46 mg Al kg-1. Overall, the amount of KCl-extractable
Al concentrations released from Al-WTRs within 80 d was minimal (< 0.1 % of oxalate-
extractable Al) (Makris, 2004).
When the samples were equilibrated at pH 5, the major chemical P species in solution were
dominated by H2PO4- (~50 % of total soluble P) and HPO4
2- accounted for only ~ 25 %. The Mg-
P complex predicted was MgHPO4 (~ 15 %), and Ca-P (CaPO4-) accounted for only 5 %.
Similarly to the samples equilibrated at pH 7, no Fe- and/or Al-P complexes were predicted by

146
the model, not even from the samples taken from the WTR amended plots at the final sampling
time (7.5 years after the initial WTR application).
Similarly to the samples equilibrated at pH 5, when the samples taken from both sites from
the control and WTR amended plots were equilibrated at pH 3, the major solution P species in
soil solutions, as indicated by solution speciation modeling, was H2PO4- (> 60 % of the soluble
P). However, unlike the samples equilibrated at pH 7 and 5, HPO4-, Mg-P complexes and Ca-P
complexes were not predicted in the soil solution. Instead, H3PO4 (~ 15 %), AlHPO4+ (~ 20 %)
and FeHPO4+ (~ 5 %) were predicted (Tables 7-1 and 7-2).
Phosphorus speciation predicted by MINTEQA2 showed that soluble P species predicted
from samples of both the control and the WTR amended plots equilibrated at pH 3 was
distributed as FeHPO4+, AlHPO4
+, H2PO4-, and H3PO4.
Artificially-aged Samples
Chemical P species predicted by the model for the thermally incubated samples were
similar to those predicted for the samples incubated via wetting and drying at the same P loads
and pH values. Similar P species were predicted for the samples amended with the different
WTR types except when the samples were equilibrated at pH 3. Thus at pH 5 and 7, the P
chemical species were independent of the WTR type. In view of the similarities of the P species
predicted by the model for both artificially-aged samples, the data of the thermally incubated
samples are presented here to represent the artificially-aged samples.
When the control and WTR amended samples for the artificially-aged samples were
equilibrated at either pH 5 or 7, the only P chemical species predicted by the model for the native
Immokalee sand, without P addition, were H2PO4- and HPO4
2- (Tables 7-3 and 7-4).

147
Table 7-1. Distribution of major P chemical species predicted from both the control and WTR amended plots from site 1 of the Michigan field study. Samples were equilibrated at pH 3, 5, and 7. All values are in percentages.
pH Time Trt HPO42- H2PO4
- H3PO4 MgPO4- MgHPO4 CaPO4
- AlHPO4+ FeHPO4
+ SUM
Control - 61 16 - - - 12 5 94
3
Time
zero WTR
amended - 59 14 - - -
19 6 98
Control - 61 15 - - - 15 5 96
7.5
years
WTR
amended - 60 13 - - -
21 5 99
Control 26 50 - - 12 5 - - 93
5
Time
zero
WTR
amended 27 48 - - 14 7
- - 96
Control 22 53 - - 16 5 - - 96
7.5
years
WTR
amended 25 51 - - 12 6
- - 94
Control 36 30 - 12 8 12 - - 98
7
Time
zero
WTR
amended 34 29 - 14 6 14
- - 97
Control 33 34 - 12 8 11 - - 98
7.5
years
WTR
amended 37 29 - 13 7 13
- - 99

148
Table 7-2. Distribution of major P chemical species predicted from both the control and WTR amended plots from site 2 of the Michigan field study. Samples were equilibrated at pH 3, 5, and 7. All values are in percentages.
pH Time Trt HPO42- H2PO4
- H3PO4 MgPO4- MgHPO4 CaPO4
- AlHPO4+ FeHPO4
+ SUM
Control - 62 15 - - - 11 6 94
3
Time
zero
WTR
amended - 61 15 - - -
17 5 98
Control - 59 16 - - - 13 4 92
7.5
years
WTR
amended - 61 13 - - -
18 5 97
Control 24 51 - - 10 6 - - 91
5
Time
zero
WTR
amended 25 53 - - 9 7
- - 94
Control 26 51 - - 9 9 - - 95
7.5
years
WTR
amended 25 50 - - 12 5
- - 92
Control 35 32 - 11 9 12 - - 99
7
Time
zero
WTR
amended 34 30 - 12 7 14
- - 97
Control 36 31 - 10 8 11 - - 96
7.5
years
WTR
amended 33 31 - 14 7 13
- - 98
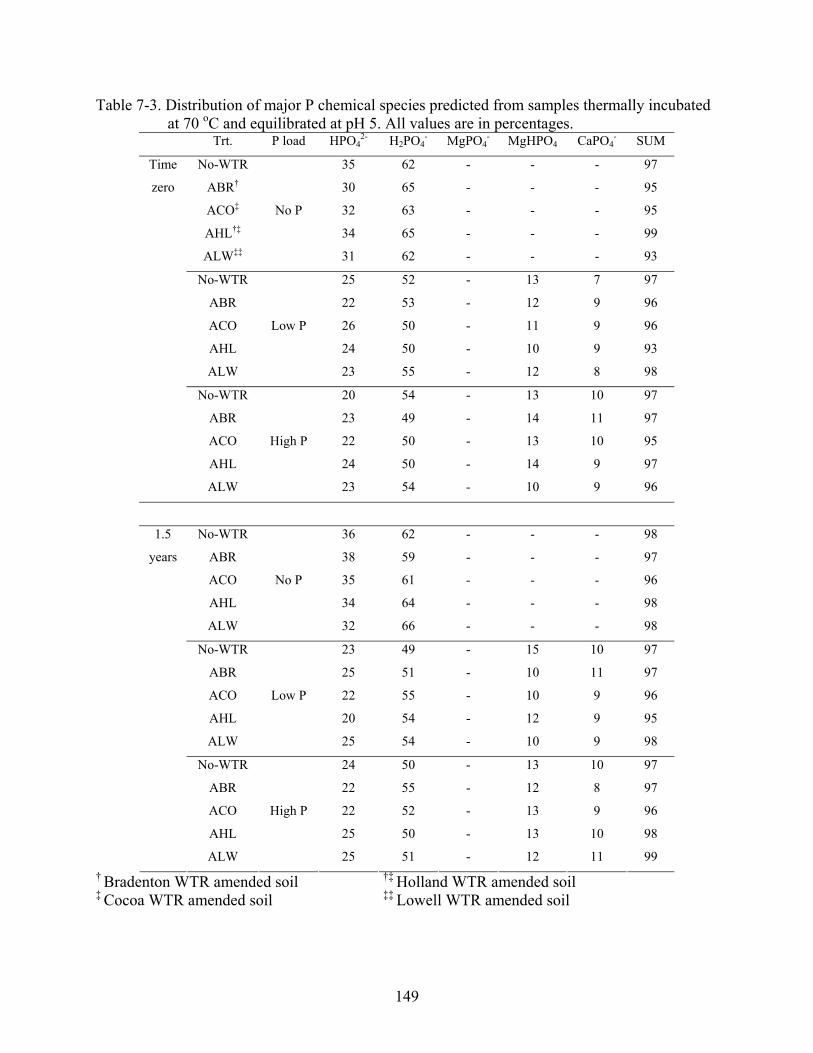
149
Table 7-3. Distribution of major P chemical species predicted from samples thermally incubated at 70 oC and equilibrated at pH 5. All values are in percentages.
Trt. P load HPO42- H2PO4
- MgPO4- MgHPO4 CaPO4
- SUM
No-WTR 35 62 - - - 97
ABR† 30 65 - - - 95
ACO‡ No P 32 63 - - - 95
AHL†‡ 34 65 - - - 99
ALW‡‡ 31 62 - - - 93
No-WTR 25 52 - 13 7 97
ABR 22 53 - 12 9 96
ACO Low P 26 50 - 11 9 96
AHL 24 50 - 10 9 93
ALW 23 55 - 12 8 98
No-WTR 20 54 - 13 10 97
ABR 23 49 - 14 11 97
ACO High P 22 50 - 13 10 95
AHL 24 50 - 14 9 97
Time
zero
ALW 23 54 - 10 9 96
No-WTR 36 62 - - - 98
ABR 38 59 - - - 97
ACO No P 35 61 - - - 96
AHL 34 64 - - - 98
ALW 32 66 - - - 98
No-WTR 23 49 - 15 10 97
ABR 25 51 - 10 11 97
ACO Low P 22 55 - 10 9 96
AHL 20 54 - 12 9 95
ALW 25 54 - 10 9 98
No-WTR 24 50 - 13 10 97
ABR 22 55 - 12 8 97
ACO High P 22 52 - 13 9 96
AHL 25 50 - 13 10 98
1.5
years
ALW 25 51 - 12 11 99 † Bradenton WTR amended soil †‡ Holland WTR amended soil ‡ Cocoa WTR amended soil ‡‡ Lowell WTR amended soil
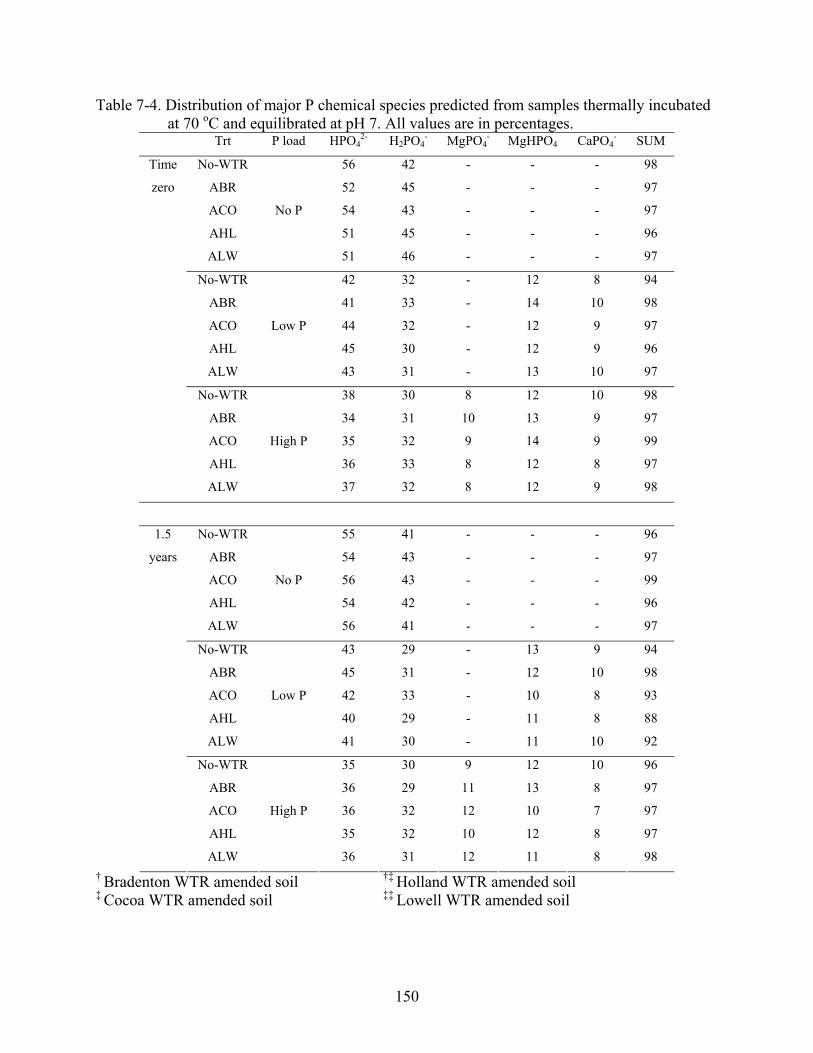
150
Table 7-4. Distribution of major P chemical species predicted from samples thermally incubated at 70 oC and equilibrated at pH 7. All values are in percentages.
Trt P load HPO42- H2PO4
- MgPO4- MgHPO4 CaPO4
- SUM
No-WTR 56 42 - - - 98
ABR 52 45 - - - 97
ACO No P 54 43 - - - 97
AHL 51 45 - - - 96
ALW 51 46 - - - 97
No-WTR 42 32 - 12 8 94
ABR 41 33 - 14 10 98
ACO Low P 44 32 - 12 9 97
AHL 45 30 - 12 9 96
ALW 43 31 - 13 10 97
No-WTR 38 30 8 12 10 98
ABR 34 31 10 13 9 97
ACO High P 35 32 9 14 9 99
AHL 36 33 8 12 8 97
Time
zero
ALW 37 32 8 12 9 98
No-WTR 55 41 - - - 96
ABR 54 43 - - - 97
ACO No P 56 43 - - - 99
AHL 54 42 - - - 96
ALW 56 41 - - - 97
No-WTR 43 29 - 13 9 94
ABR 45 31 - 12 10 98
ACO Low P 42 33 - 10 8 93
AHL 40 29 - 11 8 88
ALW 41 30 - 11 10 92
No-WTR 35 30 9 12 10 96
ABR 36 29 11 13 8 97
ACO High P 36 32 12 10 7 97
AHL 35 32 10 12 8 97
1.5
years
ALW 36 31 12 11 8 98 † Bradenton WTR amended soil †‡ Holland WTR amended soil ‡ Cocoa WTR amended soil ‡‡ Lowell WTR amended soil
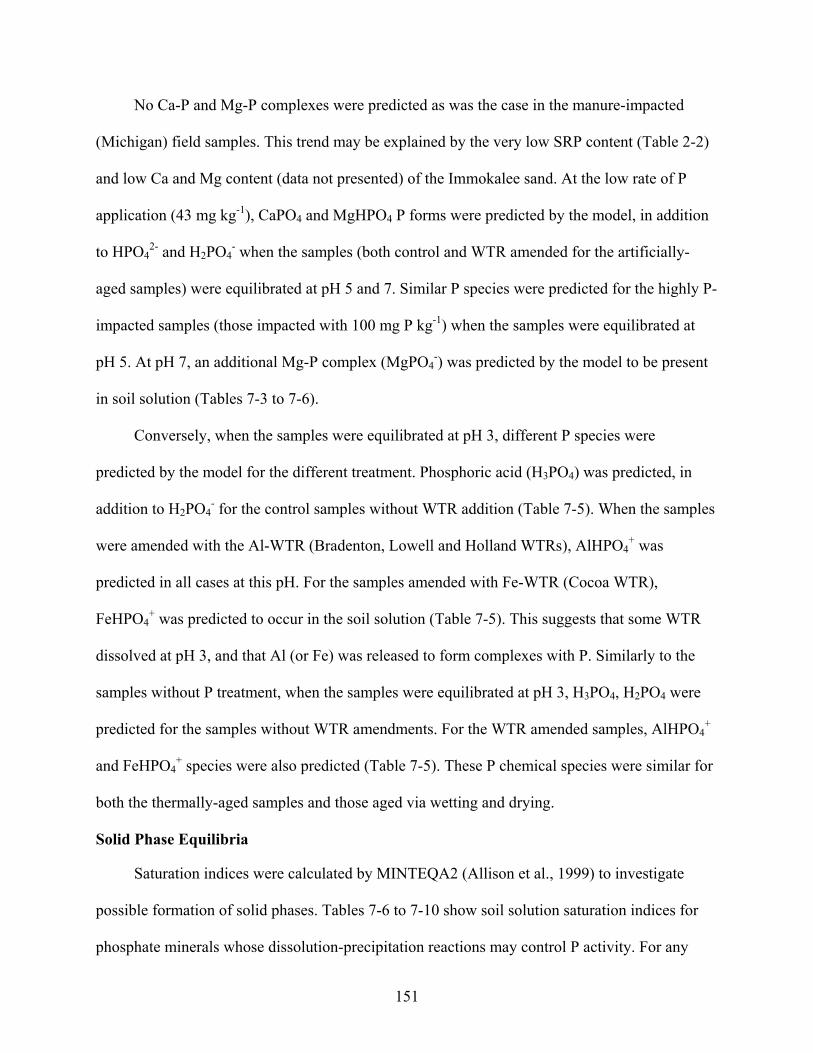
151
No Ca-P and Mg-P complexes were predicted as was the case in the manure-impacted
(Michigan) field samples. This trend may be explained by the very low SRP content (Table 2-2)
and low Ca and Mg content (data not presented) of the Immokalee sand. At the low rate of P
application (43 mg kg-1), CaPO4 and MgHPO4 P forms were predicted by the model, in addition
to HPO42- and H2PO4
- when the samples (both control and WTR amended for the artificially-
aged samples) were equilibrated at pH 5 and 7. Similar P species were predicted for the highly P-
impacted samples (those impacted with 100 mg P kg-1) when the samples were equilibrated at
pH 5. At pH 7, an additional Mg-P complex (MgPO4-) was predicted by the model to be present
in soil solution (Tables 7-3 to 7-6).
Conversely, when the samples were equilibrated at pH 3, different P species were
predicted by the model for the different treatment. Phosphoric acid (H3PO4) was predicted, in
addition to H2PO4- for the control samples without WTR addition (Table 7-5). When the samples
were amended with the Al-WTR (Bradenton, Lowell and Holland WTRs), AlHPO4+ was
predicted in all cases at this pH. For the samples amended with Fe-WTR (Cocoa WTR),
FeHPO4+ was predicted to occur in the soil solution (Table 7-5). This suggests that some WTR
dissolved at pH 3, and that Al (or Fe) was released to form complexes with P. Similarly to the
samples without P treatment, when the samples were equilibrated at pH 3, H3PO4, H2PO4 were
predicted for the samples without WTR amendments. For the WTR amended samples, AlHPO4+
and FeHPO4+ species were also predicted (Table 7-5). These P chemical species were similar for
both the thermally-aged samples and those aged via wetting and drying.
Solid Phase Equilibria
Saturation indices were calculated by MINTEQA2 (Allison et al., 1999) to investigate
possible formation of solid phases. Tables 7-6 to 7-10 show soil solution saturation indices for
phosphate minerals whose dissolution-precipitation reactions may control P activity. For any
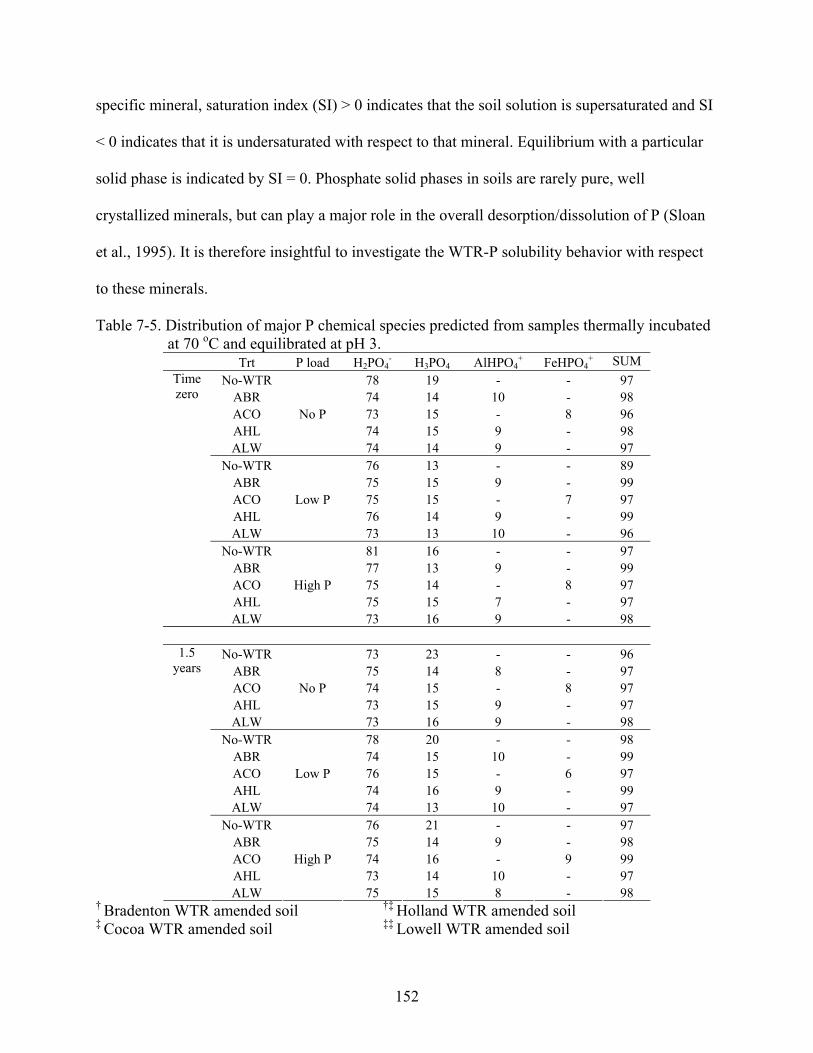
152
specific mineral, saturation index (SI) > 0 indicates that the soil solution is supersaturated and SI
< 0 indicates that it is undersaturated with respect to that mineral. Equilibrium with a particular
solid phase is indicated by SI = 0. Phosphate solid phases in soils are rarely pure, well
crystallized minerals, but can play a major role in the overall desorption/dissolution of P (Sloan
et al., 1995). It is therefore insightful to investigate the WTR-P solubility behavior with respect
to these minerals.
Table 7-5. Distribution of major P chemical species predicted from samples thermally incubated at 70 oC and equilibrated at pH 3.
Trt P load H2PO4- H3PO4 AlHPO4
+ FeHPO4+ SUM
No-WTR 78 19 - - 97 ABR 74 14 10 - 98 ACO No P 73 15 - 8 96 AHL 74 15 9 - 98 ALW 74 14 9 - 97
No-WTR 76 13 - - 89 ABR 75 15 9 - 99 ACO Low P 75 15 - 7 97 AHL 76 14 9 - 99 ALW 73 13 10 - 96
No-WTR 81 16 - - 97 ABR 77 13 9 - 99 ACO High P 75 14 - 8 97 AHL 75 15 7 - 97
Time zero
ALW 73 16 9 - 98
No-WTR 73 23 - - 96 ABR 75 14 8 - 97 ACO No P 74 15 - 8 97 AHL 73 15 9 - 97 ALW 73 16 9 - 98
No-WTR 78 20 - - 98 ABR 74 15 10 - 99 ACO Low P 76 15 - 6 97 AHL 74 16 9 - 99 ALW 74 13 10 - 97
No-WTR 76 21 - - 97 ABR 75 14 9 - 98 ACO High P 74 16 - 9 99 AHL 73 14 10 - 97
1.5 years
ALW 75 15 8 - 98 † Bradenton WTR amended soil †‡ Holland WTR amended soil ‡ Cocoa WTR amended soil ‡‡ Lowell WTR amended soil
153
Field-aged Samples
Identical solid phases with similar SI values were predicted for the samples taken from the
control (no WTR amendment) plots from both sites and equilibrated at pH 5 and 7 (Tables 7-6
and 7-7). Solutions were undersaturated with respect to the Mg-P minerals Farringtonite
[Mg3(PO4)2] and Newberyite (MgHPO4•3H2O) (Tables 7-6 and 7-7). The soil solutions were
supersaturated with respect to all Ca-P phases modeled, Hydroxyapatite [Ca5(PO4)3OH], β-
tricalcium phosphate [Ca3(PO4)2 (β)] and Octacalcium phosphate [Ca4H(PO4)3•3H2O], except
Brushite (CaHPO4•2H2O) and Monetite (CaHPO4).
The chemical activity of solid phases can be rigorously defined if the solid solution is
homogenous, but in soil systems, solid phases dissolve non-stoichiometrically, thereby creating
inhomogeneity and disequilibrium between the solid’s surface and interior (Bohn and Bohn,
1987). Thus, true equilibrium in soil suspensions is unlikely, and consequently, strict
thermodynamics may be relaxed for element solubility calculations in soil systems. In this
regard, Bohn and Bohn (1987) suggested that in soil solutions, an IAP/Ksp ratio between 0.1 and
1.0 (-1 ≤ SI ≤ 0) should be considered confirmation that the Ksp of a mineral governs the soil
solution concentration of a particular ion. Based on this criterion of saturation, and using data for
all soil solutions from the control plots for both sites, Mg-P (i.e., Farringtonite, and Newberryite)
and Ca-P (i.e., Brushite and Monetite) minerals were within the saturation range (near
equilibrium) for the soil solutions. Hence, these soluble minerals could be prospects for
controlling P activity in the manure-impacted control plots (Tables 7-6 and 7-7). The most
thermodynamically stable mineral modeled, Hydroxyapatite, would be stable in the control plots
from both sites (if present), but would not likely be a factor in P solubility from the soils.

154
Table 7-6. Soil solution saturation indices for P solid phases predicted from both the control and WTR amended plots from site 1 of the Michigan field study. Samples were equilibrated at pH 3, 5, and 7
pH Time Trt Predicted minerals
β-TCP† OCP‡ MNT†† BST†‡ HA‡‡ FNT††† NBT‡‡† SGT‡††
VCT
(am)‡‡‡
VCT
(cr)‡‡‡†
WLT‡‡‡‡
Control -14.2 -15.0 -20.7 -25.2 -21.3 -15.9 -25.9 -16.7 -15.4 1.38 -13.1
3
Time
zero WTR
amended -15.9 -13.2 -22.9 -21.6 -23.4 -16.3
-26.2 -14.6
-13.2 2.13 -12.2
Control -14.7 -15.5 -25.8 -15.5 -13.2 -18.2 -22.2 -17.2 -14.7 1.12 -14.7
7.5
years
WTR
amended -15.2 -12.7 -26.1 -16.0 -14.1 -13.5
-21.3 -16.9
-16.4 1.94 -10.3
Control 4.06 2.56 -0.98 -0.17 13.58 -2.95 -0.48 - - - -
5
Time
zero
WTR
amended 2.96 2.08 -2.42 -1.42 11.66 -3.54
-1.65 - - - -
Control 3.64 2.16 -0.58 -0.23 10.26 -3.65 -0.87 - - - -
7.5
years
WTR
amended 2.77 1.96 -3.05 -1.72 6.23 -3.82
-2.04 - - - -
Control 3.48 2.07 -0.87 -0.18 11.66 -3.78 -0.71 - - - -
7
Time
zero
WTR
amended 3.18 1.62 -2.58 -2.02 10.91 -3.94
-2.13 - - - -
Control 3.06 1.98 -0.89 -0.23 9.65 -4.03 -0.98 - - - -
7.5
years
WTR
amended 2.59 1.47 -2.21 -2.13 7.28 -4.15
-1.99 - - - - † β-tricalcium phosphate [Ca3(PO4)2 (β)] ‡ Octacalcium phosphate [Ca4H(PO4)3•3H2O] †† Monetite (CaHPO4) †‡ Brushite [CaHPO4•2H2O] ‡‡ Hydroxyapatite [Ca5(PO4)3OH] ††† Farringtonite [Mg3(PO4)2] ‡‡† Newberyite (MgHPO4•3H2O) ‡†† Strengite (FePO4•2H2O) ‡‡‡ Amorphous Variscite (AlPO4•2H2O) ‡‡‡† crystalline Variscite (AlPO4•2H2O) ‡‡‡‡ Wavellite [Al3(PO4)2(OH,F)3·5(H2O)]

155
Table 7-7. Soil solution saturation indices for P solid phases predicted from both the control and WTR amended plots from site 2 of the Michigan field study. Samples were equilibrated at pH 3, 5, and 7
pH Time Trt Predicted minerals
β-TCP† OCP‡ MNT†† BST†‡ HA‡‡ FNT††† NBT‡‡† SGT‡††
VCT
(am)‡‡‡
VCT
(cr)‡‡‡†
WLT‡‡‡‡
Control -13.8 -12.7 -25.1 -23.8 -16.7 -14.3 -22.3 -13.8 -23.9 2.38 -12.5
3
Time
zero WTR
amended -12.5 -14.0 -19.2 -24.1 -20.4 -14.6 -21.5 -19.8 -22.3 2.13 -11.7
Control -15.77 -13.4 -20.2 -15.9 -12.3 -11.5 -14.5 -15.2 -14.1 1.94 -11.3
7.5
years
WTR
amended -14.46 -11.1 -21.42 -24.34 -13.0 -14.7 -24.6 -15.6 -13.2 2.22 -13.16
Control 5.88 3.50 -0.74 -0.28 19.61 -2.20 -0.61 - - - -
5
Time
zero
WTR
amended 4.22 2.97 -1.21 -1.69 16.24 -2.64 -1.42 - - - -
Control 5.19 3.08 -0.36 -0.73 14.28 -2.47 -0.55 - - - -
7.5
years
WTR
amended 3.49 2.94 -2.30 -1.94 8.82 -2.74 -1.35 - - - -
Control 4.61 2.51 -0.47 -0.35 16.24 -2.44 -0.34 - - - -
7
Time
zero
WTR
amended 4.53 2.31 -1.91 -1.20 15.54 -2.65 -1.03 - - - -
Control 4.36 2.82 -0.70 -0.73 13.78 -3.33 -0.37 - - - -
7.5
years
WTR
amended 3.93 2.96 -1.63 -1.03 10.79 -3.23 -1.97 - - - - † β-tricalcium phosphate [Ca3(PO4)2 (β)] ‡ Octacalcium phosphate [Ca4H(PO4)3•3H2O] †† Monetite (CaHPO4) †‡ Brushite [CaHPO4•2H2O] ‡‡ Hydroxyapatite [Ca5(PO4)3OH] ††† Farringtonite [Mg3(PO4)2] ‡‡† Newberyite (MgHPO4•3H2O) ‡†† Strengite (FePO4•2H2O) ‡‡‡ Amorphous Variscite (AlPO4•2H2O) ‡‡‡† crystalline Variscite (AlPO4•2H2O) ‡‡‡‡ Wavellite [Al3(PO4)2(OH,F)3·5(H2O)]

156
Despite the relatively high total extractable Fe and Al contents of the soils (Table 2-2), Fe-
and Al-P minerals were not predicted to occur. The circumneutral pH conditions at which the
samples were equilibrated made it impossible to measure soluble Fe and Al in the soil solution
(< 0.03 mg L-1). However, when these two elements were assumed to be present in the soil
solution even at low concentrations (0.03 mg L-1), the soil solutions were predicted to be
supersaturated (positive saturation indices) with respect to Strengite (FePO4•2H2O) and Varscite
(AlPO4•2H2O) (data not presented), indicating that these minerals (if present) will not play a
major role in P solubility.
Soluble Ca- and Mg-P minerals appear to control P solubility from the control samples,
which is consistent with the conclusions of other studies involving manure-impacted soils (Wang
et al., 1995; Hansen and Strawn, 2003; Josan et al., 2005; Silveira et al., 2006). The results
indicated that phosphate solubility and activity in soil solution from the manure-impacted plots
without WTR amendment were dominated mainly by the dissolution-precipitation reactions of
these Ca- and Mg phosphate minerals (Brushite, Monetite, Farringtonite, and Newberryite).
Similar phosphate minerals were predicted by the model for the WTR amended soil
samples from both sites equilibrated at pH 5 and 7. For this treatment, soil solutions were
supersaturated (positive saturation indices) with respect to Hydroxyapatite, β-tricalcium
phosphate and Octacalcium phosphate (Tables 7-6 and 7-7), indicating that those minerals are
not playing a major role in P solubility. On the other hand, soil solutions were undersaturated
(negative saturation indices) with respect to Brushite, Monetite, Farringtonite and Newberryite
(Tables 7-6 and 7-7), and the saturation indices became more negative with time. The data are
consistent with those predicted by VISUAL MINTEQ for manure-impacted soils amended with
an Al-WTR (Silveira et al., 2006). No phosphate mineral appears to control P solubility from the
157
WTR amended samples, suggesting that mineral solubility reactions do not determine P
retention/release from WTR amended soils. Makris et al. (2004a) suggested that sorption-
desorption reactions determine P retention/release in WTR-treated samples, rather than
precipitation-dissolution reactions. Using spectroscopic techniques, he showed that P diffuses
into the micropores of the WTR and becomes irreversibly bound, which prevented P release
(Makris et al., 2004a).
When the samples were equilibrated at pH 3, other Al-P and Fe-P minerals were predicted
by the model for both the control and WTR amended samples from both sites of the field study
(Tables 7-6 and 7-7). Together with the Ca- and Mg-P minerals mentioned above, the soil
solutions were undersaturated with respect to amorphous Strengite (FePO4•2H2O), Wavellite
[Al3(PO4)2(F)3•5(H2O)] and amorphous Variscite (AlPO4•2H2O). The soil solutions were
strongly undersaturated with respect to all Mg-P minerals (Farringtonite and Newberryite) and
Ca-P minerals (Brushite, Monetite, Hydroxyapatite, β-tricalcium phosphate and Octacalcium
phosphate). Even Hydroxyapatite, which appeared to be the most stable P-mineral in the samples
equilibrated at higher pH levels, was not stable at pH 3. The soil solutions were, however,
predicted to be supersaturated with respect to crystalline Variscite. The data suggest that no P
solid phase controls the solubility of P at pH 3.
Artificially-aged Samples
The solid phases predicted by the model for the thermally incubated samples were identical
to those predicted for the samples incubated via wetting and drying. The values for the saturation
indices were also similar for the samples incubated by the two aging methods and therefore only
the data for the thermally incubated samples are presented as a representative of artificially-aged
samples.

158
Within pH range of 5 and 7, the values of the saturation indices of the predicted minerals
decreased with time, suggesting that some amount of weathering had occurred in course of the
incubation. On the other hand, the values of the saturation indices for the predicted minerals for
samples taken at a particular time increased with increasing rate of P application. This suggests
that as the P concentration of the soil increased, some Ca-P minerals became more stable (Tables
7-8 and 7-9).
Similarly to the field-aged samples equilibrated at pH 5 and 7, the soil solution of the
unamended (no WTR) samples at all P-impacted levels were supersaturated with respect to β-
tricalcium phosphate, Octacalcium phosphate and Hydroxyapatite (Tables 7-8 to 7-9). The
stability of these minerals appears to increase with pH (increased positive SI values). Based on
the criteria of Bohn and Bohn (1987), the soil solutions of the samples with no WTR amendment
appear to be at equilibrium with Ca-P minerals, Monetite and Brushite. The soil systems were,
however, undersaturated with respect to Mg-P (Farringonite and Newberryite) at all P treatment
levels. Thus unlike the manure-impacted (Michigan) field samples, Monetite and Brushite are the
only minerals that appear to control P solubility in untreated Immokalee sand. No Mg-P solid
phases seem to control P solubility in untreated Immokalee sand.
For the WTR amended samples incubated through the two methods and equilibrated at pH
5 and 7, identical P minerals with similar saturation indices were predicted for the soil systems
amended with the different WTR sources (Tables 7-8 and 7-9). Soil solutions at all impacted P
levels were supersaturated with respect β-tricalcium phosphate, Octacalcium phosphate and
Hydroxyapatite; and undersaturated with respect to Monetite, Brushite Farringonite and
Newberryite. Similarly to the field-aged WTR amended samples, the results of the model
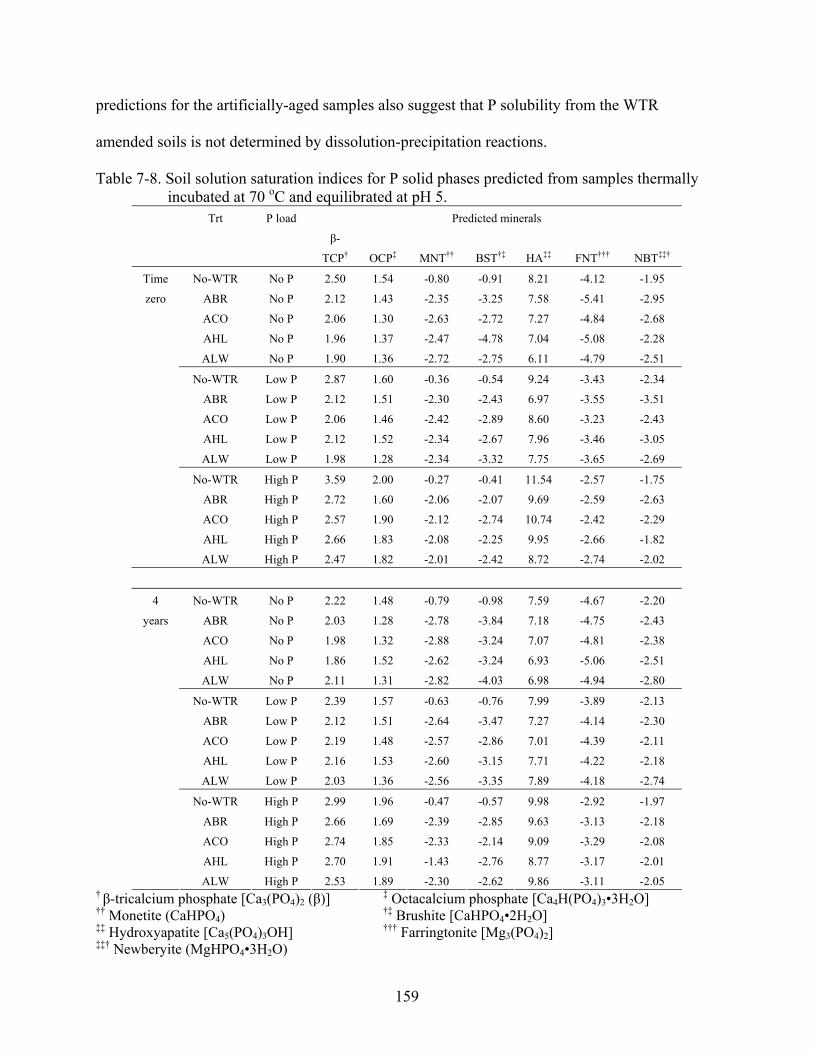
159
predictions for the artificially-aged samples also suggest that P solubility from the WTR
amended soils is not determined by dissolution-precipitation reactions.
Table 7-8. Soil solution saturation indices for P solid phases predicted from samples thermally incubated at 70 oC and equilibrated at pH 5.
Trt P load Predicted minerals
β-
TCP† OCP‡ MNT†† BST†‡ HA‡‡ FNT††† NBT‡‡†
No-WTR No P 2.50 1.54 -0.80 -0.91 8.21 -4.12 -1.95
ABR No P 2.12 1.43 -2.35 -3.25 7.58 -5.41 -2.95
ACO No P 2.06 1.30 -2.63 -2.72 7.27 -4.84 -2.68
AHL No P 1.96 1.37 -2.47 -4.78 7.04 -5.08 -2.28
ALW No P 1.90 1.36 -2.72 -2.75 6.11 -4.79 -2.51
No-WTR Low P 2.87 1.60 -0.36 -0.54 9.24 -3.43 -2.34
ABR Low P 2.12 1.51 -2.30 -2.43 6.97 -3.55 -3.51
ACO Low P 2.06 1.46 -2.42 -2.89 8.60 -3.23 -2.43
AHL Low P 2.12 1.52 -2.34 -2.67 7.96 -3.46 -3.05
ALW Low P 1.98 1.28 -2.34 -3.32 7.75 -3.65 -2.69
No-WTR High P 3.59 2.00 -0.27 -0.41 11.54 -2.57 -1.75
ABR High P 2.72 1.60 -2.06 -2.07 9.69 -2.59 -2.63
ACO High P 2.57 1.90 -2.12 -2.74 10.74 -2.42 -2.29
AHL High P 2.66 1.83 -2.08 -2.25 9.95 -2.66 -1.82
Time
zero
ALW High P 2.47 1.82 -2.01 -2.42 8.72 -2.74 -2.02
No-WTR No P 2.22 1.48 -0.79 -0.98 7.59 -4.67 -2.20
ABR No P 2.03 1.28 -2.78 -3.84 7.18 -4.75 -2.43
ACO No P 1.98 1.32 -2.88 -3.24 7.07 -4.81 -2.38
AHL No P 1.86 1.52 -2.62 -3.24 6.93 -5.06 -2.51
ALW No P 2.11 1.31 -2.82 -4.03 6.98 -4.94 -2.80
No-WTR Low P 2.39 1.57 -0.63 -0.76 7.99 -3.89 -2.13
ABR Low P 2.12 1.51 -2.64 -3.47 7.27 -4.14 -2.30
ACO Low P 2.19 1.48 -2.57 -2.86 7.01 -4.39 -2.11
AHL Low P 2.16 1.53 -2.60 -3.15 7.71 -4.22 -2.18
ALW Low P 2.03 1.36 -2.56 -3.35 7.89 -4.18 -2.74
No-WTR High P 2.99 1.96 -0.47 -0.57 9.98 -2.92 -1.97
ABR High P 2.66 1.69 -2.39 -2.85 9.63 -3.13 -2.18
ACO High P 2.74 1.85 -2.33 -2.14 9.09 -3.29 -2.08
AHL High P 2.70 1.91 -1.43 -2.76 8.77 -3.17 -2.01
4
years
ALW High P 2.53 1.89 -2.30 -2.62 9.86 -3.11 -2.05 † β-tricalcium phosphate [Ca3(PO4)2 (β)] ‡ Octacalcium phosphate [Ca4H(PO4)3•3H2O] †† Monetite (CaHPO4) †‡ Brushite [CaHPO4•2H2O] ‡‡ Hydroxyapatite [Ca5(PO4)3OH] ††† Farringtonite [Mg3(PO4)2] ‡‡† Newberyite (MgHPO4•3H2O)

160
Table 7-9. Soil solution saturation indices for P solid phases predicted from samples thermally incubated at 70 oC and equilibrated at pH 7.
Trt P load Predicted minerals
β-
TCP† OCP‡ MNT†† BST†‡ HA‡‡ FNT††† NBT‡‡† No-WTR No P 3.01 1.75 -0.73 - 0.83 10.53 -3.43 -1.56
ABR No P 2.56 1.62 -2.23 -2.45 9.72 -4.51 -2.36 ACO No P 2.48 1.48 -2.34 -2.42 7.83 -4.23 -2.14 AHL No P 2.36 1.56 -2.48 -3.13 9.02 -4.03 -2.01 ALW No P 2.29 1.55 -2.56 -2.86 9.32 -3.99 -1.82
No-WTR Low P 3.46 1.82 -0.33 -0.45 11.84 -2.86 -1.87 ABR Low P 2.62 1.72 -2.06 -2.38 10.21 -2.96 -1.94 ACO Low P 2.84 1.66 -2.29 -2.56 11.02 -3.04 -2.81 AHL Low P 2.65 1.73 -2.22 -2.86 8.94 -2.88 -2.44 ALW Low P 2.38 1.45 -2.31 -2.92 9.94 -2.69 -2.15
No-WTR High P 4.33 2.28 -0.25 -0.34 14.80 -2.15 -1.40 ABR High P 3.10 2.15 -2.02 -2.04 11.18 -2.16 -1.61 ACO High P 3.20 1.81 -1.92 -2.17 13.78 -2.28 -2.11 AHL High P 3.20 2.16 -1.97 -2.44 12.76 -2.22 -1.83
Time zero
ALW High P 2.98 2.08 -1.98 -1.89 12.43 -2.02 -1.46
No-WTR No P 2.68 1.68 -0.72 -0.94 9.73 -3.89 -1.76 ABR No P 2.44 1.45 -2.62 -3.35 9.21 -3.96 -1.94 ACO No P 2.38 1.50 -2.47 -2.85 8.95 -4.01 -2.01 AHL No P 2.24 1.73 -2.71 -3.50 8.88 -4.12 -1.90 ALW No P 2.54 1.49 -2.65 -2.85 9.07 -4.22 -2.22
No-WTR Low P 2.88 1.78 -0.57 -0.63 10.24 -3.24 - 2.10 ABR Low P 2.56 172 -2.19 -3.04 9.32 -3.45 -2.24 ACO Low P 2.64 1.68 -2.11 -2.78 8.99 -3.52 -2.19 AHL Low P 2.60. 1.74 -2.33 -3.36 10.11 -3.66 - 2.54 ALW Low P 2.44 1.54 -2.58 -2.94 9.88 -3.48 - 2.33
No-WTR High P 3.60 2.23 -0.43 -0.47 12.80 -2.43 -1.58 ABR High P 3.30 2.15 -2.27 -2.53 12.64 -2.75 -1.75 ACO High P 3.20 1.93 -2.30 -2.34 11.24 -2.64 -1.64 AHL High P 3.25 2.18 -2.21 -2.46 11.65 -2.59 -1.91
4 years
ALW High P 3.05 2.10 -2.19 -2.77 12.35 -2.61 -1.68 † β-tricalcium phosphate [Ca3(PO4)2 (β)] ‡ Octacalcium phosphate [Ca4H(PO4)3•3H2O] †† Monetite (CaHPO4) †‡ Brushite [CaHPO4•2H2O] ‡‡ Hydroxyapatite [Ca5(PO4)3OH] ††† Farringtonite [Mg3(PO4)2] ‡‡† Newberyite (MgHPO4•3H2O)
The artificially-aged control and WTR amended samples equilibrated at pH 3 were
strongly undersaturated with respect to all Ca- and Mg-P minerals predicted by the model,
similar to the field-aged samples (Tables 7-10). In addition to the Ca- and Mg-P minerals, the

161
system appear to be undersaturated with respect to amorphous Variscite for the samples amended
with Al-WTRs (Bradenton, Holland and Lowell WTRs) and amorphous Strengite for the
samples amended with Fe-WTR (Cocoa WTR).
We hypothesized that P solubility in WTR amended soils is controlled by
thermodynamically stable solid phases of Al- and Fe-P. The results of the various modeling
efforts compel us to reject this hypothesis and to conclude that P reactions with WTR are not
through precipitation reaction. This observation is contrary to the suggestion by Butkus et al.
(1998) that P is bound to WTRs through external precipitation reactions. Makris et al. (2004a)
identified intraparticle diffusion into micropores as the prominent mechanism in the retention of
P by WTRs, and suggested that P immobilized by WTRs should be essentially irreversibly
bound. Makris et al. (2004b) reacted Fe- and Al-WTR particles with P for 80 days and then
subjected the particles to an energy-dispersive X-ray spectrometer (SEM-EDS) and to electron
microprobe analyses. No discrete surficial metal-P phases were detected with SEM-EDS
spectroscopy, which led to the hypothesis that P diffuses into particles to reach meso- and micro-
pore domains rather than precipitating on external surfaces of the WTRs. Electron microprobe
analysis using wavelength-dispersive spectroscopy (EPMA-WDS) on thin-sections of P-treated
WTR particles supported intraparticle P diffusion more quantitatively than SEM-EDS. Cross-
sectional P distribution analysis of the P-treated WTRs showed significant (p<0.001) increases in
the relative P concentrations in the interior of the particles (approximately 60 µm inside) with
time (from 1 to 80 days) (Makris et al., 2004b). Ippolito et al. (2003) used EPMA-WDS dot
maps to assess P distribution in a P-treated Al-WTR equilibrated for 211 days. Dot maps showed
no evidence for P surface precipitation, but a uniform amorphous Al-P association throughout
the particles (Ippolito et al., 2003). EPMA-WDS data support the notion that P moves towards

162
the interior of the WTR particles rather than accumulating significantly at the particle surface
through precipitation.
Table 7-10. Soil solution saturation indices for P solid phases predicted from samples thermally incubated at 70 oC and equilibrated at pH 3.
Trt P
load Predicted minerals β-TCP† OCP‡ MNT†† BST†‡ HA‡‡ FNT††† NBT‡‡† SGT‡†† VCT‡‡‡
No-WTR No P -23.5 -22.6 -19.2 -22.9 -11.4 -18.4 -17.5 - -6.48
ABR No P -24.2 -25.7 -21.3 -25.7 -10.6 -20.2 -18.9 - -3.65
ACO No P -22.5 -23.0 -25.1 -17.5 -12.6 -19.4 -19.7 -3.56 -
AHL No P -23.6 -24.6 -24.4 -22.6 -13.8 -21.0 -21.4 - -4.85
ALW No P -21.3 -21.8 -25.5 -24.9 -10.6 -19.8 -19.3 - -4.37
No-WTR Low P -22.3 -20.5 -19.1 -26.3 -9.51 -19.4 -20.6 - -4.83
ABR Low P -24.5 -23.0 -22.7 -21.0 -11.8 -21.6 -19.8 - -2.87
ACO Low P -20.6 -20.9 -20.3 -19.3 -12.7 -20.7 -21.5 -2.37 -
AHL Low P -24.9 -24.1 -25.6 -17.8 -9.90 -21.4 -14.2 - -3.79
ALW Low P -21.6 -21.8 -21.8 -22.4 -8.79 -22.4 -21.6 - -3.30
No-WTR High P -24.2 -23.1 -20.1 -16.1 -10.8 -21.7 -19.2 - -3.32
ABR High P -21.5 -24.7 -18.4 -21.0 -12.1 -24.5 -23.2 - -2.58
ACO High P -16.1 -25.6 -23.3 -23.7 -15.0 -23.4 -20.7 -2.15 -
AHL High P -21.6 -22.5 -21.3 -24.6 -9.25 -21.0 -21.9 - -2.68
Time
zero
ALW High P -24.4 -19.9 -17.8 -24.1 -12.3 -25.5 -22.3 - -2.84
No-WTR No P -21.0 -20.9 -21.2 -25.0 -10.7 -19.5 -18.4 - -8.04
ABR No P -19.1 -19.4 -16.4 -26.7 -12.0 -20.9 -20.1 - -4.48
ACO No P -24.5 -23.0 -19.2 -23.8 -14.8 -21.3 -19.7 -4.57 -
AHL No P -25.2 -22.0 -25.4 -26.7 -10.8 -21.7 -20.5 - -6.43
ALW No P -19.3 -19.1 -21.7 -20.9 -11.9 -22.7 -22.8 - -5.96
No-WTR Low P -20.1 -21.8 -23.1 -17.4 -12.7 -19.8 -19.6 - -6.21
ABR Low P -24.5 -22.4 -18.1 -22.6 -9.05 -24.3 -21.0 - -3.44
ACO Low P -21.3 -20.2 -19.6 -21.1 -11.9 -23.3 -20.7 -3.52 -
AHL Low P -19.5 -24.5 -21.8 -19.3 -12.0 -22.3 -16.0 - -4.94
ALW Low P -20.0 -19.3 -23.0 -24.2 -14.1 -21.0 -21.9 - -4.59
No-WTR High P -21.2 -21.5 -18.5 -19.3 -12.1 -23.5 -21.3 - -4.77
ABR High P -19.4 -24.4 -20.5 -22.4 -14.6 -22.9 -24.9 - -2.65
ACO High P -21.7 -20.0 -18.8 -19.5 -9.32 -20.7 -23.8 -2.70 -
AHL High P -19.6 -21.0 -21.7 -20.3 -10.5 -21.4 -22.1 - -3.80
1.5
years
ALW High P -21.6 -19.2 -20.2 -21.9 -13.4 -19.0 -23.4 - -3.53 † β-tricalcium phosphate [Ca3(PO4)2 (β)] ‡ Octacalcium phosphate [Ca4H(PO4)3•3H2O] †† Monetite (CaHPO4) †‡ Brushite [CaHPO4•2H2O] ‡‡ Hydroxyapatite [Ca5(PO4)3OH] ††† Farringtonite [Mg3(PO4)2] ‡‡† Newberyite (MgHPO4•3H2O) ‡†† Strengite (FePO4•2H2O)

163
Predicting P adsorption and desorption by WTRs
The inability of the chemical equilibrium modeling to predict solid phase control of WTR
immobilized P solubility prompted further investigation of the phosphate adsorption mechanism
on and within the WTR particles using the constant capacitance model. The model assumes a
ligand exchange mechanism and considers the charge on both adsorbate and adsorbent (Goldberg
and Sposito, 1984; Goldberg, 1992; Ioannou and Dimirkou, 1994; Lutzenkirchen, 1999;
Dimirkou et al., 2002). The model provides a quantitative description of phosphate adsorption,
including the effect of varying pH values. Unlike the empirical models, surface complexation
models, such as constant capacitance model, are chemical models that attempt to give a general
molecular description of the adsorption process. The driving force for the adsorption reaction is
the electrostatic interaction (Goldberg and Sposito, 1984; Ioannou and Dimirkou, 1994;
Lutzenkirchen, 1999). Because the models take into account the charge on both the adsorbent
and the adsorbate, they have wide applicability as well as predictive power over changing
conditions of soil pH, ionic strength, and phosphate ion concentration (Goldberg, 1992; Ioannou
and Dimirkou, 1996; Dimirkou et al., 2002).
The computer program Ma-Za 2, a program that fits equilibrium constants to experimental
data using an optimization technique, was used to obtain optimal values for the anion surface
complexation constants in the WTR system, while the PC program Ma-Za 1 was used for the
application of the constant capacitance model. The model could be fit to adsorption of phosphate
anions well over the entire pH range studied (3-7). The main advantage of the model is its ability
to represent changes in anion adsorption occurring with changes in pH.
The pH dependent sorption of P by Al-WTRs over a period of 14 days was plotted as
maximum amount of P adsorbed as a function of pH (Figure. 7-1). Figure 7-1 also illustrates the
model fit of data obtained for P adsorption by Al-WTRs. Similarly, the experimental data
164
obtained for P adsorption by Fe-WTR, and model fit of P adsorption data for the Fe-WTR are
shown in Figure 7-2. Both the Al- and Fe-WTR showed similar trends in P adsorption behavior
for all the initial P concentrations added to the WTRs (Figures 7-1 and 7-2). However, similar to
earlier observations (chapter 2), the Al-WTRs adsorbed significantly greater (p ≤ 0.05) P
amounts than the Fe-WTR at all pH levels, for all initial P loads. Similar to previous
observations (chapters 4 and 5), no significant differences (p ≥ 0.05) were observed in the
amount of P adsorbed within pH range of 4-7. P adsorbed at pH 3 was, however, significantly
smaller (p < 0.01) than P adsorbed at the higher pH (4-7) values, for all initial P loads. With the
exception of pH 3, where predicted values of adsorbed P concentration far exceeded the
observed data, the model produced a close fit to experimental data obtained for the Al- and Fe-
WTRs evaluated within pH 4-7 (Figures 7-1 and 7-2).
The ability of the constant capacitance model to fit adsorption isotherm data is illustrated
in Figure 7-3. The model points for pH 4-7 were calculated using the corresponding set of
phosphate surface complexation constants. The experimental data in these figures were obtained
for P adsorption by WTRs at four pH (4-7) values. The actual data points and the corresponding
model fits to these points are plotted in the form of a standard adsorption isotherm. The model is
able to represent the experimental data well at all four pH values.
The degree of reversibility of the adsorption-desorption reaction determines the amount of
immobilized P released by the WTRs. The relationships between P adsorption and desorption for
the WTR samples equilibrated at pH 6 are presented in Figure 7-4. Figure 7-4 also illustrates the
model fit of the adsorption-desorption relationship of the WTRs. Only a small fraction (≤ 2 %) of
the sorbed P by the WTRs was released. The WTRs that adsorbed high proportions of applied P
during adsorption reaction tended to release lower proportions during desorption reaction, and
165
vice versa. The data suggest a very strong hysteresis in the adsorption-desorption behavior,
indicating a partial irreversibility of the adsorption-desorption reaction. Within pH values of 4-7,
the model predictions mirrored experimental data reasonably well for all the WTRs (Figure 7-4).
Correlation analysis, using the PROC CORR model of the SAS software (SAS Inst., 1999)
showed a significant correlation (p < 0.001) between the predicted and the experimental data,
with a coefficient of determination (r2) value of ≥ 0.7. Similar trends were obtained for the
WTRs equilibrated within the pH range of 4, 5, and 7 (data not presented).
The combined data suggest that phosphate adsorption by the WTRs can be described with
the constant capacitance model. This model assumes a ligand exchange adsorption mechanism
and is therefore an appropriate representation of the surface complexation behavior of
specifically adsorbed phosphate ions (Ioannou and Dimirkou, 1994; Lutzenkirchen, 1999;
Dimirkou et al., 2002). The good fit of the model to phosphate adsorption and desorption by the
WTRs suggests that inner-sphere surface complexation could be the appropriate P retention
mechanism for these materials. The charge of both the adsorptive ion and the adsorbent surface
were considered by the model.
Makris (2004) showed that there is a strong hysteretic P desorption by WTRs and
attributed this desorption behavior to steric limitations to P movement through “bottle-necks”
consisting of complex metal-organic C assemblages (Makris, 2004). The constant capacitance
modeling of P adsorption by WTRs suggests that, in addition to the bottleneck-shaped
micropores of the WTRs, inner-sphere surface complexation could be the mechanism that largely
limits P desorption from the WTR microsites. Thus, once immobilized by the WTR particles, the
P is essentially irreversibly bound, barring destruction of the WTR particles which favors long-
term stability of sorbed P by WTRs.

166
A
0
100
200
300
400
3 4 5 6 7pH
Ads
orbe
d P
(mm
ol k
g-1)
BR DataBR ModelHL DataHL ModelLW DataLW model
B
0
100
200
300
400
3 4 5 6 7pH
Ads
orbe
d P
(mm
ol k
g-1)
BR DataBR ModelHL DataHL ModelLW DataLW model
C
0
100
200
300
400
3 4 5 6 7pH
Ads
orbe
d P
(mm
ol k
g-1)
BR DataBR ModelHL DataHL ModelLW DataLW model
0
100
200
300
400
3 4 5 6 7pH
Ads
orbe
d P
(mm
ol k
g-1)
BR DataBR ModelHL DataHL ModelLW DataLW model
DFigure 7-1 Phosphorus “adsorption envelope” on Al-WTR system at initial P concentrations (C0) of A=0.82 mmol L-1, B=1.30 mmol
L-1, C=1.61 mmol L-1, and D=1.94 mmol L-1). BR= Bradenton WTR, HL= Holland WTR, LW= Lowell WTR.

167
A
0
20
40
60
80
100
3 4 5 6 7pH
Ads
orbe
d P
(mm
ol k
g-1) Data
Model
B
0
20
40
60
80
100
3 4 5 6 7pH
Ads
orbe
d P
(mm
ol k
g-1)
Data
Model
C
0
20
40
60
80
100
3 4 5 6 7pH
Ads
orbe
d P
(mm
ol k
g-1)
Data
Model
0
20
40
60
80
100
3 4 5 6 7pH
Ads
orbe
d P
(mm
ol k
g-1)
Data
Model
DFigure 7-2. Phosphorus “adsorption envelope” on Fe-WTR (Cocoa WTR) system at initial P concentrations (C0) of A=0.16 mmol L-1,
B=0.32 mmol L-1, C=0.48 mmol L-1, and D=0.82 mmol L-1).

168
A
0
100
200
300
400
0 2 4 6 8Solution P (mmol L-1)
Ads
orbe
d P
(mm
ol k
g-1)
BR DataBR ModelHL dataHL ModelLW dataLW Model
B
0
100
200
300
400
0 2 4 6 8Solution P (mmol L-1)
Ads
orbe
d P
(mm
ol k
g-1)
BR DataBR ModelHL dataHL ModelLW dataLW Model
C
0
100
200
300
400
0 2 4 6 8Solution P (mmol L-1)
Ads
orbe
d P
(mm
ol k
g-1)
BR DataBR ModelHL dataHL ModelLW dataLW Model
0
100
200
300
400
0 2 4 6 8Solution P (mmol L-1)
Ads
orbe
d P
(mm
ol k
g-1)
BR DataBR ModelHL dataLW dataHL ModelLW Model
DFigure 7-3. Phosphorus adsorption isotherms on Al-WTR system for the experimental data and the model prediction, at different pH
values (A=4, B=5, C=6, D=7). BR= Bradenton WTR, HL= Holland WTR, LW= Lowell WTR

169
0
0.4
0.8
1.2
1.6
2
0 50 100 150 200 250 300 350 400Adsorbed P (mmol kg-1)
Des
orbe
d P
(mm
ol k
g-1)
CO ModelCO DataLW ModelLW dataHL ModelBR ModelHL dataBR Data
Figure 7-4. Relationship between adsorbed and desorbed phosphorus by Al- and Fe-WTRs
equilibrated at pH 6. CO = Cocoa WTR (Fe-based WTR), BR= Bradenton WTR, HL= Holland WTR, LW= Lowell WTR

170
CHAPTER 8 LONG-TERM STABILITY OF DRINKING-WATER TREATMENT RESIDUALS (WTR)
IMMOBILIZED PHOSPHORUS
Phosphorus loss from poorly P-sorbing soils is one of the major factors responsible for
accelerated eutrophication of surface waters in many locations in Florida and other eastern states
of USA. Excessive soluble phosphorus (P) concentrations in these soils can be controlled
through the additions of drinking-water treatment residuals. Drinking-water treatment residuals
are by-products of the drinking-water treatment process and are physical mixtures of Al or Fe
hydr(oxides) that originate from flocculant (Al or Fe salts) additions made during the processing
of drinking-water.
Short-term laboratory, greenhouse, and rainfall simulation studies have demonstrated WTR
efficacy in reducing soluble P concentrations in runoff and leaching. However, the long-term
stability of P sorbed by WTRs has only been qualitatively addressed in laboratory experiments.
Studies have shown that adsorption of P by WTRs is strongly hysteretic and essentially
independent of pH; once sorbed in the internal micropores of WTR, P release is unlikely.
However, field experiments and other approaches to accurately quantify P lability are needed to
test WTR efficacy in reducing soluble P concentrations and to confirm trends observed in, or
inferred from, laboratory studies.
The overall objective of the study was to assess the long-term stability of WTR
immobilized P. Specific objectives addressed in this dissertation were:
• to evaluate changes in lability of WTR immobilized P with time
• to determine pH effect on lability of WTR immobilized P
• to assess the stability and longevity of WTR immobilized P under field conditions
• to evaluate long-term effectiveness of WTR in improving leachate and runoff quality and
171
• predict solid phases controlling solubility of WTR immobilized P, and evaluate the stability of the predicted solid phases.
Appropriate hypotheses were formulated as follows:
• H1. Soil amendment with WTR will reduce P solubility in P impacted soils under natural (field) conditions.
• H2. Aging will induce changes in the nature of WTR-P binding that will prevent desorption of WTR immobilized P.
• H3. Sorbed P will remain unaffected by reasonably anticipated changes in important soil parameters (e.g. pH).
• H4. WTR application will reduce labile P concentrations in runoff and leachate, thus improving runoff and leachate quality.
• H5. Stable Al- and Fe-phosphate minerals will control solubility of WTR immobilized P, thus ensuring that WTR immobilized P remains stable in the long-term.
Several approaches were utilized to test these hypotheses, including artificial aging of
“fresh” WTR and WTR amended soils through repeated wetting and drying, and thermal
incubations at elevated temperatures (46 and 70 oC) in an attempt to hasten reactions that could
take decades to occur in the field. Another approach dealt with field monitoring of the longevity
of WTR immobilized P in two field sties in Western Michigan for 7.5 years after a one-time
WTR application. We also evaluated WTR effectiveness in P immobilization in a field study in
Kissimmee watershed, FL, where plots were amended with different P sources and at different
rates of application. The next approach utilized rainfall simulation techniques to evaluate WTR
effects on runoff P many years after WTR application. Lastly, we used chemical equilibrium
modeling to assess the solid phases likely controlling P solubility of WTR amended soils.
The first two objectives were to evaluate aging and pH effects on the lability of WTR
immobilized P using artificially-aged WTR amended soils. Artificial aging of the WTR amended
samples was expected to simulate natural long-term weathering processes that could influence
the stability of sorbed P. Artificial aging was achieved through incubation at elevated

172
temperatures and through repeated wetting and drying. The samples were either incubated via
wetting and drying for 2 years or thermally incubated at elevated temperatures for up to 4.5
years. Using a modified isotopic (32P) dilution technique, coupled with a stepwise acidification
procedure, we monitored changes in labile P concentrations over time. This technique enabled us
to evaluate the effect of pH on the lability of WTR immobilized P.
Significant reductions in labile P values of the WTR amended soil samples occurred over
time with repeated wetting and drying cycles within pH range of 4 - 7. A significant decrease in
labile P was observed after 5 months of incubation and the reduction of labile P continued with
additional wetting and drying cycles until the system apparently reach equilibrium at 1.5 years (~
40 wet and dry cycles). Within the pH range of 4 - 7, labile P concentrations were ultimately
reduced by ≥ 75 %, relative to the no-WTR (control) samples. No reduction in labile P
concentrations was observed for the WTR amended samples equilibrated at pH 3. After 4.5 years
of thermal incubation, a significant decrease in labile P pools (~ 80 % relative to the samples
without WTR amendment) was observed at all pH values, including pH 3. Thus, if thermal
incubation truly predicts long-term aging under field conditions, not only will the WTR
immobilized P remain fixed for a long time within typical soil pH values, but the destabilization
of the WTR immobilized P at pH 3 will also be eliminated over time. From this experiment, we
concluded that WTR application is capable of reducing labile P concentration in P impacted soils
and to do so for a long time and that within the commonly encountered pH range in soils, WTR
immobilized P is stable.
The next objective was to assess the stability of WTR immobilized P under field
conditions. This study was conducted on a poorly P-sorbing Florida soil amended with different
P sources (biosolids, manure and inorganic fertilizer) applied at P-based (56 kg ha-1) and N-

173
based (224 kg ha-1) rates. This field study was initially designed to determine WTR effects on P
losses to surface and groundwater from land amended with different P sources and applied at
different rates. However, the fall of 2004 was an especially busy hurricane season in south FL,
and the experimental plots were heavily flooded. The flooding appeared to have compromised
our treatments (moved soil and associated treatments across plots), which compelled us to
terminate the experiment. Measurements taken after the flooding, however, provided a unique
opportunity to assess the stability of WTR immobilized P following severe flooding of WTR
amended plots. Soil samples taken from the field after the hurricanes showed that despite the
flooding of the field and the resultant movement of soil and amendments across individual plots,
WTR effects were still obvious. The soluble P values measured from the A (0-5 cm) horizon
plots amended with WTR were significantly lower than in the plots without WTR amendments.
The total- and oxalate extractable Fe+Al concentrations of the surface (0-5 cm) horizon of WTR
amended plots also remained significantly greater than in plots without WTR amendment. The
consistently high Al and Fe contents of the WTR amended plots suggests that those plots still
possess the capacity to sorb P. The degree of P saturation (DPS) values of the WTR amended
plots remained below the environmental threshold value of 25 % suggested for Florida soils.
This suggests that, despite the flooding of the field, the WTR amended plots retained the
capacity to retard P movement.
Measurements in the Bh horizon suggest excessive P leaching from the field during the
flooding of the field. The greatest P leaching apparently occurred in the plots without WTR
amendments and the control plots; very little or no P leaching occurred in the WTR amended
plots. Thus, despite the extensive flooding of the fields, the WTR was able to retain the
174
immobilized P and prevent excessive P leaching. From this study, we concluded that WTR
immobilized P is stable even under severe flooding conditions
Another objective was to assess the long-term stability of sorbed P under field conditions.
Two one-time WTR amended P-impacted soils with long histories of poultry manure application
in Western Michigan were utilized for the study. The WTR effects were monitored for 7.5 years
(spring 1998 to fall 2005). For both sites, there was a significant increase in the concentration of
total- and oxalate (200 mM)-extractable Al and Fe concentrations in the WTR amended plots
over time, leading to a reduction in the P saturation ratio (PSR) values by values < 50 % of the
PSR values of the control plots. The reduction in PSR suggests that the WTR amended plots
have been enhanced to sorb P. Consistent with the PSR values, water soluble P (WSP) and labile
P concentrations were reduced significantly in the WTR amended plots at both sites. There was
no evidence of release of WTR immobilized P over time as measured by the WSP labile P values
from both sites. The WSP and labile P data demonstrate delayed, but steady, reduction in soluble
P with time, and ultimate reductions of ~ 60 to 70 % relative to the control soils. The results of
this study led to the conclusion that WTR is not only an effective amendment to control soluble
P in P-impacted soils, but WTR immobilized P is stable and will remain fixed for a long time.
Again, we evaluated long-term effectiveness of WTR in improving leachate and runoff
quality using the rainfall simulation technique. We utilized P-impacted soils from the Michigan
field study sites collected in fall 2005 (7.5 years after WTR amendment) for this study.
Amendment with WTR reduced dissolved P (TDP) and bioavailable P (BAP) by > 50 % from
both sites, and decreased the total (runoff + leachate) flow-weighted TDP concentrations from ~
2.5 mg L-1 to ~ 0.86 mg L-1 at site 1, and from ~ 3.2 mg L-1 to ~ 0.94 mg L-1 at site 2. The
reduced values exceed values (0.01-0.05 mg L-1) usually associated with eutrophication of

175
surface waters, but are below a solution concentration of 1.0 mg L-1 (3.2 * 10-5 M) occasionally
used as a benchmark for wastewater discharges to rivers and streams. From this result, we
concluded that, WTR is capable of reducing labile P in runoff and leachate for a long time, and
eroded WTR-P should have negligible effects on water quality.
The final objective was to investigate the influence of various species of Fe and Al on
phosphate solubility and reactions, and to speculate about solid phases controlling the solubility
of WTR immobilized P. We utilized both artificially- and naturally (field)-aged WTR amended
samples for the study, using MINTEQA2 geochemical model to do the calculations.
Similar solid phases were predicted for both artificially and field-aged samples. For both
types of samples, soil solutions were supersaturated (positive saturation indices) with respect to
Hydroxyapatite [Ca5(PO4)3OH], β-tricalcium phosphate [Ca3(PO4)2 (β)] and Octacalcium
phosphate [Ca4H(PO4)3•3H2O], indicating that those minerals (if present) were not playing a
major role in P solubility. On the other hand, soil solutions were undersaturated (negative
saturation indices) with respect to Brushite (CaHPO4•2H2O), Monetite (CaHPO4), Farringtonite
[Mg3(PO4)2] and Newberyite (MgHPO4•3H2O), suggesting that these minerals will be dissolving
in the soil solution and will not control P solubility. Thus no solid phase was predicted by the
model to control the solubility of WTR immobilized P.
The inability of the chemical equilibrium model to predict solid phase control of P
solubility in WTR immobilization prompted further investigation of phosphate adsorption
mechanism on and within the WTR particles using the constant capacitance model. The model
produced a close fit to experimental data obtained for the Al- and Fe-WTRs evaluated within pH
4-7, suggesting that inner-sphere surface complexation could be the P retention mechanism for
the WTRs. The constant capacitance modeling of P adsorption by WTRs suggests that, in
176
addition to the bottleneck-shaped micropores of the WTRs, inner-sphere surface complexation
limits P desorption from WTR microsites. Thus, once immobilized by the WTR particles, the P
is likely irreversibly bound, barring destruction of the WTR particles.
From the various studies, we conclude that WTR is an effective amendment to control
labile P in P-impacted soils and that WTR immobilized P is stable and will remain fixed for a
long time, independent of common soil pH values. Co-applying WTRs with other residuals
(manures, biosolids) could effectively counter P risks associated with the residuals and allow
land application of the organic P sources even in sensitive watersheds. For example, WTR could
be blended with manures or biosolids (up to 25 g kg-1) before application and applied at N-based
rate (224 kg ha-1) in the Kissimmee watershed. On the other hand, WTRs could be mixed (~ top
30 cm of the soil) with high P soils (hot spots) in the Kissimmee watershed at a rate of up to 50
Mg ha-1 (~25 tons acre-1) to counter P risks associated with P-impacted soils. Future studies
should focus on developing dynamic models that accurately predict the long-term fate of WTR
immobilized P.

177
LIST OF REFERENCES
Adjei, M.B., and P. Mislevy. 2001. Five basic steps to successful perennial pasture grass establishment from vegetative cuttings on south Florida Flatwoods. Florida Cooperative Extension Service, Institute of Food and Agricultural Sciences, University of Florida. SS AGR 24.
Ainsworth, C.C., J.L. Pilon, P.L. Gassman, and W.G. Van Der Sluys. 1994. Cobalt, cadmium and lead sorption to hydrous iron oxide: Residence time effect. Soil Sci. Soc. Am. J. 58:1615-1623.
Allison, J.D., D.S. Brown, and K.J. Novo-Gradac. 1999. MINTEQA2/PRODEFA2, A geochemical assessment model for environmental systems. EPA/600/3-91/021. USEPA Natl. Exposure Res. Lab., Athens, GA.
Alva, A.K., M.E. Sumner, and W.P. Miller. 1991. Chemical effects of repeated equilibrations of variable-charge soils with phosphogypsum solution. Soil Sci. Soc. Am. J. 55:357-361.
American Society of Civil Engineers, American Water Works Association and the USEPA. 1996. Technology transfer handbook: Management of water treatment plant residuals. ASCE and AWWA, New York.
Axe, L., and P. Trivedi. 2002. Intraparticle surface diffusion of metal contaminants and their attenuation in microporous amorphous Al, Fe, and Mn oxides. J. Colloid Interface Sci. 247:259-265.
Azizian, S. 2004. Kinetic models of sorption: a theoretical analysis. J. Colloid Interface Sci. 276:47-52.
Basta, N.T., and D.E. Storm. 1997. Use of alum residuals to reduce nutrient runoff from agricultural land treated with animal manures to protect surface water quality. p. 19-28. In Proc. 1997 Water Residuals and Biosolids Management: Approaching the Year 2000. Water Environment Federation/American Water Works Association Joint Specialty Conference, Philadelphia. 3-4 Aug. 1997. WEF, Alexandria, VA.
Basta, N.T., E.A. Dayton, and D.E. Storm. 2003. Advances in WTR research to mange P in soil, runoff, manure, and biosolids. WEF/AWWA/CWEA Joint Residuals and Biosolids Management Conference, 19-22 Feb, 2003. “Partnering for a Safe, Sustainable Environment.” Baltimore, MD.
Basta, N.T., R.J. Zupancic, and E.A. Dayton. 2000. Evaluating soil tests to predict bermudagrass growth in drinking water treatment residuals with P fertilizer. J. Environ. Qual. 29:2007-2012.
Bhatti, J.S., N.B. Comerford, and C.T. Johnston. 1998. Influence of oxalate and soil organic matter on sorption and desorption of phosphate onto a spodic horizon. Soil Sci. Soc. Am. J. 62:1089-1095.
178
Bohn, H.L., and R.K. Bohn. 1987. Solid activities of trace elements in soils. Soil Sci. 143:398-403.
Bohn, H.L., B.L. McNeal, and G.A. O'Connor. 1985. Soil Chemistry (2nd ed.). John Wiley and Sons, New York.
Bowman, R.A., J.B. Rodriguez, and J.R. Self. 1998. Comparison of methods to estimate occluded and resistant soil phosphorus. Soil Sci. Soc. Am. J. 62:338-342.
Brady, N.C., and R.R. Weil. 2002. The Nature and Properties of Soils (13th ed.). Prentice Hall, N.J.
Brandt, R.C., and H.A. Elliott. 2003. Phosphorus runoff losses from surface-applied biosolids and dairy manure. In Proc. 17th Annual Residuals and Biosolids Manage. Conf., Baltimore [CD-ROM]. 19-22 Feb. 2003. Water Environ. Fed., Alexandria, VA.
Brown, E.A., and J.B. Sartain. 2000. Phosphorus retention in USGA greens. Soil Crop Sci. Soc. FL. Proc. 59:112-117.
Butkus, M.A., D. Grasso, C.P. Schulthess, and H. Wijnja. 1998. Surface complexation modeling of phosphate adsorption by water treatment residual. J. Environ. Qual. 27:1055-1063.
Chwirka, J.D., R. Narasimhan, N. Scheuer, and G. Rousseau. 2001. The impact of residuals on the selection of an arsenic treatment process. WEF/AWWA/CWEA Joint Residuals and Biosolids Management Conference, Feb 21–24, 2001. Biosolids 2001: “Building Public Support”. San Diego, CA.
Codling, E.E., R.L. Chaney, and C.L. Mulchi. 2000. Use of aluminum and iron-rich residues to immobilize P in poultry litter and litter-amended soils. J. Environ. Qual. 29:1924-1931.
Correll, D.L. 1998. The role of phosphorus in the eutrophication of receiving waters: A review. J. Environ. Qual. 27:261-266.
Cox, A.E., J.J. Camberato, and B.R. Smith. 1997. Phosphate availability and inorganic transformation in an alum sludge-affected soil. J. Environ. Qual. 26:1393-1398.
Cox, F.R., and S.E. Hendricks. 2000. Soil test phosphorus and clay content effects on runoff water quality. J. Environ. Qual. 29:1582-1586.
Daniel, T. C., A. N. Sharpley, and L. Lemunyon. 1998. Agricultural phosphorus and eutrophication: A symposium overview. J. Environ. Qual. 27:251-257.
Daniel, T.C., A.N. Sharpley, D.R. Edwards, R. Wedepohl, and J.L. Lemunyon. 1994. Minimizing surface-water eutrophication from agriculture by phosphorus management. J. Soil Wat. Conserv. 49:30-38.

179
Davis, R.L., H. Zhang, J. L. Schroder, J. J. Wang, M. E. Payton, and A. Zazulak. 2005. Soil characteristics and phosphorus level effect on phosphorus loss in runoff. J. Environ. Qual. 34:1640-1650.
Day, P.R. 1965, Particle fractionation and particle-size analysis. p 545-567. In Black, C.A. (ed.). Methods of soil analysis, Part 1. Am. Soc. Agron., Inc., Madison, WI.
Dayton, E.A., and N.T. Basta. 2005. A method for determining the phosphorus sorption capacity and amorphous aluminum of aluminum-based drinking water treatment residuals. J. Environ. Qual. 34:1112-1118.
Dayton, E.A., N.T. Basta, C.A. Jakober, and J.A. Hattey. 2003. Using treatment residuals to reduce phosphorus in agricultural runoff. J. Am. Wat. Works Assoc. 95:151-158.
Di, H.J., R. Harrison, and A.S. Campbell. 1994. Assessment of methods for studying the dissolution of phosphate fertilizers of differing solubility in soils: The relationship between rate of dissolution and plant-response. Fert. Res. 38:19-27.
Dimirkou, A., A. Ioannou, and M. Doula. 2002. Preparation, characterization and sorption properties for phosphates of hematite, bentonite and bentonite-hematite systems. Adv. Coll. Interf. Sci. 97:37-61.
Dimirkou, A., A. Ioannou, and P. Papadopoulos. 1996. Kinetics of phosphorus sorption by hematite and kaolinite-hematite (k-h) system. Commun. Soil Sci. Plant Anal. 27:1071-1090.
Edwards, D.R., and T.C. Daniel. 1993. Runoff quality impacts of swine manure applied to fescue plots. Trans. ASAE. 36:81-86.
Eghball, B., and J.L. Power. 1999. Composted and noncomposted manure application to conventional and no-tillage systems: Corn yield and nitrogen uptake. Agron. J. 91:819-825.
Elliott, H.A., and L.M. Singer. 1988. Effect of water treatment sludge on growth and elemental composition of tomato (Lycopersicon esculentum) shoots. Commun. Soil Sci. Plant Anal. 19:345-354.
Elliott, H.A., B.A. Dempsey, D.W. Hamilton, and J.R. DeWolfe. 1990. Land application of water treatment sludges: Impacts and management. AWWA Res. Foundation and Am. Wat. Works Association, Denver, CO.
Elliott, H.A., G.A. O’Connor, and S. Brinton. 2002a. Phosphorus leaching from biosolids amended sandy soils. J. Environ. Qual. 31:1362-1369.
Elliott, H.A., G.A. O’Connor, P. Lu, and S. Brinton. 2002b. Influence of water treatment residuals on phosphorus solubility and leaching. J. Environ. Qual. 31:681-689.

180
Elliott, H.A., R.C. Brandt, and G.A O'Connor. 2005. Runoff phosphorus losses from surface-applied biosolids. J. Environ. Qual. 34:1632-1639.
Fang, F., P.L. Brezonik, D.J. Mulla, and L.K. Hatch. 2002. Estimating runoff phosphorus losses from calcareous soils in the Minnesota River basin. J. Environ. Qual. 31:1918-1929.
Fixen, P. E., A. E. Ludwick, and S. R. Olsen. 1983. Phosphorus and potassium fertilization of irrigated alfalfa on calcareous soils: II. Soil phosphorus solubility relationships. Soil Sci. Soc. Am. 47:112-117.
Folle, F., J. W. Shuford, R. W. Taylor, A. A. Mehad, and W. Tadesse. 1995. Effect of sludge treatment, heavy metal, phosphate rate, and pH on soil phosphorus. Commun. Soil Sci. Plant Anal. 26:1369-1381.
Ford, R.G., P.M. Bertch, and K.J. Farley. 1997. Changes in transition and heavy metal partitioning during hydrous iron oxide aging. Environ. Sci. Technol. 31:2028-2033.
Frau, F. 2000. The formation-dissolution-precipitation cycle of meleanterite at the abandoned pyrite mine of Genna Luas in Sardinia, Italy: environmental implications. Mineral. Mag. 64:995-1006.
Frossard, E., S. Sinaj, and P. Dufour. 1996. Phosphorus in urban sewage sludge as assessed by isotopic exchange. Soil Sci. Soc. Am. J. 60:179-182.
Fujii, R., and R.B. Corey. 1986. Estimation of isotopically exchangeable cadmium and zinc in soils. Soil Sci. Soc Am J. 50:306-308.
Gallimore, L.E., N.T. Basta, D.E. Storm, M.E. Payton, R.H. Huhnke, and M.D. Smolen. 1999. Water treatment residual to reduce nutrients in surface runoff from agricultural land. J. Environ. Qual. 28:1474-1478.
Gao, S. R., A.T Fujii, and K.K. Chalmers. 2004. Evaluation of adsorbed arsenic and potential contribution to shallow groundwater in Tulare Lake bed area, Tulare Basin, California. Soil Sci. Soc. Am. J. 68:89-95.
Goldberg, S. 1992. Use of surface complexation models in soil chemical equations. Adv. Agron. 47:233-329.
Goldberg, S. 2002. Competitive adsorption of arsenate and arsenite on oxides and clay minerals. Soil Sci. Soc. Am. J.66:413-421.
Goldberg, S., and G. Sposito. 1984. A chemical-model of phosphate adsorption by soils: Reference oxide minerals. Soil Sci. Soc. Am. J. 48:772-778.
Griffin, R.A., and J.J. Jurinak. 1973. Estimation of activity coefficients from the electrical conductivity of natural aquatic systems and soil extracts. Soil Sci. 116:26-30.
181
Hamon, R.E., E. Lombi, P. Fortunati, A.L. Nolan, and M.J. McLaughlin. 2004. Coupling speciation and isotope techniques to study arsenic mobilization in the environment. Environ. Sci. Technol. 38:1794-1798.
Hamon, R.E., I. Bertrand, and M.J. McLaughlin. 2002. Use and abuse of isotopic exchange data in soil chemistry. Austr. J. Soil Res. 40:1371-1381.
Hanlon, E.A. 1995. Current UF/IFAS recommendations regarding pasture fertilization. p.57-64 In W. Kunkle (ed.) 1995 Beef Cattle Shortcourse, Gainesville, FL.
Hanlon, E.A., J.S. Gonzalez, and J.M. Bartos. 1997. Mehlich 1 extractable P. Ca, Mg, Mn, Cu, and Zn. IFAS Extension Soil Testing Laboratory (ESTL) and Analytical Research Laboratory (ARL) Chemical Procedures and Training Manual.
Hansen, J.C., and D.G. Strawn. 2003. Kinetics of phosphorus release from manure amended alkaline soil. Soil Sci. 168:869-879.
Hanson, R. L., and D. C. Westfall. 1985. Orthophosphate solubility transformations and availability from dual applied nitrogen and phosphorus. Soil Sci. Soc. Am. J. 49:1283- 1289.
Harris-Pierce, R., K.A. Barbarick, and E.F. Redente. 1993. The effect of sewage sludge application on native rangeland soils and vegetation. Annual Report Meadow Springs Ranch, Fort Collins, CO.
Haustein, G.K., T.C. Daniel, D.M. Miller, P.A. Moore, Jr., and R.W. McNew. 2000. Aluminum-containing residuals influence high-P soils and runoff water quality. J. Environ. Qual. 29:1954-1959.
He, Z.L., A.K. Alva, Y.C. Li, D.V. Calvert, and D.J. Banks. 1999. Sorption-desorption and solution concentration of P in a fertilized sandy soil. J. Environ. Qual. 28:1804-1810.
Heil, D.M., and K.A. Barbarick. 1989. Water treatment sludge influence on the growth of sorghum-sudangrass. J. Environ. Qual. 18:292-298.
Hendricks, S.B., and L.A. Dean. 1947. Basic concepts of soil and fertilizer studies with radioactive phosphorus. Soil Sci. Soc. Am. Proc. 12:98-100.
Hingston, F.J., A.M. Posner, and J.P. Quirk. 1972. Anion adsorption by goethite and gibbsite. I. The role of the proton in determining adsorption envelopes. J. Soil Sci. 23:177-192.
Hollander, M., and D.A. Wolfe. 1999. Nonparametric Statistical Methods (2nd ed.). Wiley-Interscience Publications. New York.
Hooda, P.S., A.R. Rendell, A.C. Edwards, P.J. Withers, M.N. Aitken, and V.W. Truesdale. 2000. Relating soil phosphorus indices to potential phosphorus release to water. J. Environ. Qual. 29:1166-1171.
182
Ioannou, A., A. Dimirkou, and E. Theodoropoulou. 1996. Phosphate sorption by hematite and kaolinite-hematite (k-h) system as described by isotherms. Commun. Soil Sci. Plant Anal. 27:1925-1947.
Ioannou, A., and A. Dimirkou. 1994. Ma-Za 1, A PC program in Q-BASIC computation of adsorption equilibria. Department of Chemistry, Athens University, and Athens Soil Science Institute.
Ioannou, A., and A. Dimirkou. 1995. Ma-Za 2. A non-linear least squares PC program in Q-BASIC for determination of chemical equilibrium constants from experimental data. Department of Chemistry, Athens University, and Athens Soil Science Institute.
Ippolito, J.A., and K.A. Barbarick. 2006. Phosphorus extraction methods from water treatment residual-amended soil. Commun. Soil Sci. Plant Anal. 37:859-870.
Ippolito, J.A., K.A. Barbarick, and E.F. Rendente. 1999. Co-application of water treatment residuals and biosolids on two range grasses. J. Environ. Qual. 28:1644-1650.
Ippolito, J.A., K.A. Barbarick, D.M. Heil, J.P. Chandler, and E.F. Redente. 2003. Phosphorus retention mechanisms of a water treatment residual. J. Environ. Qual. 32:1857-1864.
Jacobs, L.W., and B.J. Teppen. 2000. WTR as a soil amendment to reduce nonpoint source pollution from phosphorus-enriched soils. 9 p. In Proc. 14th Annual Residuals and Biosolids Management Conference, Feb. 27-29, 2000, MA. CD-ROM, Water Environment Federation, Alexandria, VA.
Jara, A.A., S. Goldberg, and M.L. Mora. 2005. Studies of the surface charge of amorphous aluminosilicates using surface complexation models. J. Coll. Interf. Sci. 292:160-170.
Josan, M.S., V.D. Nair, W.G. Harris, and D. Herrera. 2005. Associated release of magnesium and phosphorus from active and abandoned dairy soils. J. Environ. Qual. 34:184-191.
Karathanasis, A. D. 1991. Phosphate mineralogy and equilibria in two Kentucky Alfisols derived from Ordovician limestones. Soil Sci. Soc. Am. J. 55:1174-1782.
Kawczyinski, E., and V. Achtermann. 1991. A water industry database report on residuals handling. p. 6b-1 to 6b-5. In Proc. of the AWWA/WEF Joint Residuals Conf. Durham, NC. 11-14 Aug. American Water Works Association, Denver, CO.
Kennedy, C., D. S. Smith, and L. A. Warren. 2004. Surface chemistry and relative Ni sorptive capacities of synthetic hydrous Mn oxyhydroxides under variable wetting and drying regimes. Geochimica et Cosmochimica Acta. 68:443-454.
Kleinman, P.J.A., A.N. Sharpley, T.L. Veith, R.O. Maguire, and P.A. Vadas. 2004. Evaluations of phosphorus transport in surface runoff from packed soil boxes. J. Environ. Qual. 33:1413-1423.

183
Kleinman, P.J.A., and A.N. Sharpley. 2003. Effect of broadcast manure on runoff phosphorus concentrations over successive rainfall events. J. Environ. Qual. 32:1072-1081.
Kleinman, P.J.A., A.N. Sharpley, A.M. Wolf, D.B. Beegle, and P.A. Moore. 2002. Measuring water extractable Phosphorus in manure as an indicator of phosphorus in runoff. Soil Sci. Soc. Am. J. 66:2009-2015.
Koopmans, G.R., W.J. Chardon, P. de Willigen, and W.H. van Riemsdijk. 2004. Phosphorus desorption dynamics in soil and the link to a dynamic concept of bioavailability. J. Environ. Qual. 33:1393-1402.
Kratch, K. 1997. Pfiesteria piscicida: Mysterious microbe blamed for fish kills. Water Environ. Tech. 9:18-26.
Kummert, R., and W. Stumm. 1980. The surface complexation of organic-acids on hydrous gamma-Al2O3. J. Coll. Interf. Sci. 75:373-385.
Kuo, S. 1996. Phosphorus. p. 869-919. In Sparks et al. (ed) Methods of Soil Analysis: Chemical Methods. Part 3, Soil Sci. Soc. Am, Inc., Madison, WI.
Lindsay, W.L. 1979. Chemical Equilibria in Soils. John Wiley and Sons. New York.
Lindsay, W.L., A.W. Prazier, and H.P. Stephenson. 1962. Identification of reaction products from phosphate fertilizers in soils. Soil Sci. Soc. Am. Proc. 26:446-452.
Lombi, E, R.E. Hamon, S.P. McGrath, and M.J. McLaughlin. 2003. Lability of Cd, Cu, and Zn in polluted soils treated with lime, beringite, and red mud and identification of a non-labile colloidal fraction of metals using isotopic techniques. Environ. Sci. Technol. 37:979-984.
Lookman, R., D. Freese, R. Merckx, K. Vlassek, and W.H. Van Riemsdijk. 1995. Long term kinetics of phosphate release from soil. Environ. Sci. Technol. 29:1569–1575.
Lu, P., and G.A. O’Connor. 2001. Biosolids effects on P retention and release in some sandy Florida soils. J. Environ. Qual. 30:1059-1063.
Lutzenkirchen, J. 1999. The constant capacitance model and variable ionic strength: An evaluation of possible applications and applicability. J. Coll. Interf. Sci. 217:8-18.
Ma, Y.B., and N.C. Uren. 1997. The effects of temperature, time and cycles of drying and rewetting on the extractability of zinc added to a calcareous soil. Geoderma 75:89.
Maguire, R.O., J.T. Sims, S.K. Dentel, F.J. Coale, and J.T. Mah. 2001. Relationships between biosolids treatment processes and soil phosphorus availability. J. Environ. Qual. 37:979-984.
Makris, K.C. 2004. Long-term stability of sorbed phosphorus by drinking water treatment residuals: mechanisms and implications. PhD diss. Univ. Florida. Gainesville, FL.
184
Makris, K.C., and G.A. O’Connor. 2006. Land application of drinking water treatment residuals as contaminant-mitigating agents. In Sarkar, D., Datta, R., and Hannigan, R. (Ed) Current Perspectives in Environmental Geochemistry. Geological Society of America Press, Denver, CO, (in press).
Makris, K.C., and W.G. Harris. 2006. Time dependency and irreversibility of water desorption by drinking-water treatment residuals: Implications for sorption mechanisms. J. Colloid Interf. Sci. 294:151-154.
Makris, K.C., G.A. O'Connor, W.G. Harris, T.A. Obreza. 2005c. Relative efficacy of a drinking-water treatment residual and alum in reducing phosphorus release from poultry litter. Commun. Soil Sci. Plant Anal. 36:2657-2675.
Makris, K.C., H. El-Shall, W.G. Harris, G.A. O’Connor, and T.A. Obreza. 2004a. Intraparticle phosphorus diffusion in a drinking-water treatment residual at room temperature. J. Colloid Interface Sci. 277:417-423.
Makris, K.C., W.G. Harris, G.A. O’Connor, and T.A. Obreza. 2004b. Three-dimensional phosphorus sorption by drinking-water treatment residuals: Implications for long-term stability. Environ. Sci. Technol. 38:6590-6596.
Makris, K.C., W.G. Harris, G.A. O'Connor, and T.A. Obreza. 2005a. Long-term phosphorus effects on evolving physicochemical properties of iron and aluminum hydroxides. J. Colloid Interface Sci. 287:552-560.
Makris, K.C., W. G. Harris, G. A. O’Connor, T. A. Obreza, and H.A. Elliott. 2005b. Physicochemical properties related to long-term phosphorus retention by drinking-water treatment residuals. Environ. Sci. Technol. 39:4280-4289.
Marshall, T.J., J.W. Holmes, and C.W. Rose.1996. Soil Physics (3rd ed.). Cambridge University Press, Melbourne, Vic.
Martin, R.R., R.St.C. Smart, and K. Tazaki. 1988. Direct observation of phosphate precipitation in the goethite/phosphate system. Soil Sci. Soc. Am. J. 52:1492-1500.
Martinez, C.E., and M.B. McBride. 1998. Solubility of Cd, Cu, Pb, and Zn in aged coprecipitates with amorphous iron hydroxides. Environ. Sci. Technol. 32:743-748.
Martínez, C.E., A. Jakobson, and M.B. McBride. 2001. Thermally induced changes in metal solubility of contaminated soils is linked to mineral recrystallization and organic matter transformations. Environ. Sci. Technol. 35:908-916.
Martínez, C.E., S. Sauvé, A. Jacobson, and Murray B. McBride. 1999. Thermally induced release of adsorbed Pb upon aging of Ferrihydrite and soil oxides. Environ. Sci. Technol. 33:2016-2020.
McDowell, R.W., and A.N. Sharpley. 2001. Approximating phosphorus release from soils to surface runoff and subsurface drainage. J. Environ. Qual. 30:508-520.

185
McKeague, J.A., J.E. Brydon, and N.M. Miles. 1971. Differentiation of forms of extractable iron and aluminum in soils. Soil Sci. Soc. Am. Proc. 35:33-38.
McLean, E.O. 1982. Soil pH and Lime Requirement. In Methods of Soil Analysis. 2nd Ed., A.L. Page et al. (Eds.). Soil Sci. Soc. Am., Inc., Madison, WI.
Meng, X., G.P. Korfiatis, C. Jing, and C. Christodoulatos. 2001. Redox transformations of arsenic and iron in water treatment sludge during aging and TCLP extraction. Environ. Sci. Technol. 35:3476-3481.
Menon, R.G., S.H. Chien, and W.J. Chardon. 1997. Iron oxide impregnated filter paper (Pi test). II. A review of its application. Nutr. Cycl. Agros. 47:7-18.
Misra, R. K., and P. C. Teixeira. 2001. The sensitivity of erosion and erodibility of forest soils to structure and strength. Soil & Tillage Res. 59:81-93.
Moore, P.A. Jr. 1998. Reducing ammonia volatilization and decreasing phosphorus runoff from poultry litter with alum. In Proc. National Poultry Waste Management Symposium, Oct. 24-26, 1998, Auburn University, AL.
Moore, P.A. Jr., T.C. Daniel, and D.R. Edwards. 2000. Reducing phosphorus runoff and inhibiting ammonia loss from poultry manure with aluminum sulfate. J. Environ. Qual. 29:37-49.
Moore, P.A., Jr., T.C. Daniel, D.R. Edwards, and J.T. Gilmour. 1998. Effect of alum treated poultry litter, normal litter and ammonium nitrate on aluminum availability and uptake by plants. Proceedings of the 1998 National Poultry Waste Management Symposium, Springdale, AR.
Morel C., and J. Torrent. 1997. Sensitivity of isotopically exchangeable phosphate in soil suspensions to the supporting solution. Soil Sci. Soc. Am. J. 61:1044-1052.
Morel, C., and C. Plenchette. 1994. Is the isotopically exchangeable phosphate of a loamy soil the plant-available P? Plant and Soil. 158:287-297.
Murphy, J., and J.P. Riley. 1962. A modified single solution method for the determination of phosphate in natural waters. Anal. Chim. Acta. 27:31-36.
Myers, R.G., and G.M. Pierzynski. 2000. Using the iron oxide method to estimate biovailable phosphorus in runoff. p. 98-102. In G.M. Pierzynski (ed.). Methods of phosphorus analysis for soils, sediments residuals and waters. Southern Corp. Series Bull. 396. Coop. Ext. Ser., North Carolina State Univ., Raleigh, NC.
Nair, V.D., K.M. Portier, D.A, Graetz, and M.L. Walker. 2004. An environmental threshold for degree of phosphorus saturation in sandy soils. J. Environ. Qual. 33:107-113.
Nair, V.D., D.A. Graetz, and K.M. Portier. 1995. Forms of phosphorus in soil profiles from dairies of South Florida. Soil Sci. Soc. Am. J. 59:1244-1249.
186
National Phosphorus Research Project. 2001. National research project for simulated rainfall surface runoff studies [Online]. Available at http://www.sera17.ext.vt.edu/Documents/National_P_protocol.pdf (verified Aug. 12 2006). North Carolina State Univ., Raleigh.
Nooney, M.G., A. Campbell, T.S. Murrell, X.-F. Lin, L.R. Hossner, C.C. Chusuei, and D.W. Goodman. 1998. Nucleation and growth of phosphate on metal oxide thin films. Langmuir 14:2750-2755.
Novak, J.M., and D.W. Watts. 2004. Increasing the phosphorus sorption capacity of southeastern Coastal Plain soils using water treatment residuals. Soil Sci. 169:206-214.
Novak, J.M., and D.W. Watts. 2005. Water treatment residuals aggregate size influences phosphorus sorption kinetics and Pmax values. Soil Sci. 170:425-432.
Nwoke O.C., B. Vanlauwe, J. Diels, N. Sanginga, and O. Osonubi. 2004. The distribution of phosphorus fractions and desorption characteristics of some soils in the moist savanna zone of West Africa. Nutr. Cycl. Agros. 69:127-141.
O’Connor, G.A., H.A. Elliott, and P. Lu. 2002. Characterizing water treatment residuals phosphorus retention. Soil Crop Sci. Soc. FL. Proc. 61: 67-73.
O’Connor, G.A., and S.L. Chinault. 2006. Environmental impacts of land applying biosolids. Fl. Wat. Res. J. (May): 50-52, 54.
O'Connor, G.A., D. Sarkar, S.R. Brinton, H.A. Elliott, and F.G. Martin. 2004. Phytoavailability of biosolids phosphorus. J. Environ. Qual. 33:703-712.
O'Connor, G.A., S. Brinton, and M.L. Silveira. 2005. Evaluation and selection of soil amendments for field testing to reduce P losses. Soil Crop Sci. Soc. FL. Proc. 64:22-34.
Olsen, S. R., and F. S. Watanabe. 1957. A method to determine phosphorus adsorption maximum in soils as measured by the Langmuir isotherm. Soil Sci. Soc. Am. Proc. 21:144-149.
Olsson P. A., and G. Tyler. 2004. Occurrence of non-mycorrhizal plant species in south Swedish rocky habitats is related to exchangeable soil phosphate. J. Ecol. 92:808-815.
Parry, R. 1998. Agricultural phosphorus and water quality: A US Environmental Protection Agency perspective. J. Environ. Qual. 27:258-261.
Pautler, M.C., and J.T. Sims. 2000. Relationships between soil test phosphorus, soluble phosphorus, and phosphorus saturation in Delaware soils. Soil Sci. Soc. Am. J. 64:765-773.
Peak D, J.T. Sims, and D.L. Sparks. 2002. Solid-state speciation of natural and alum-amended poultry litter using XANES spectroscopy Environ. Sci. Technol. 36:4253-4261.
187
Penn, C.J., and T. Sims. 2002. Phosphorus forms in biosolids-amended soils and losses in runoff: Effects of wastewater treatment process. J. Environ. Qual. 31:1349-1361.
Peters, J.M., and N.T. Basta. 1996. Reduction of excessive bioavailable phosphorus in soils by using municipal and industrial wastes. J. Environ. Qual. 25:1236-1241.
Pierzynski, G.M., T.J. Logan, and S.J. Traina. 1990. Phosphorus chemistry and mineralogy in excessively fertilized soils: Solubility equilibria. Soil Sci. Soc. Am. J. 54:1589-1595.
Postma, D., and R. Jakobsen. 1996. Redox zonation: Equilibrium constraints on the Fe(III) / SO4 reduction interface. Geochim. Cosmochim. Acta. 60:3169-3175.
Pote, D.H., and T.C. Daniel. 2000a. Analyzing for dissolved reactive phosphorus in water samples. p. 91-93. In G.M. Pierzynski (ed.). Methods of phosphorus analysis for soils, sediments residuals and waters. Southern Corp. Series Bull. 396. Coop. Ext. Ser., North Carolina State Univ., Raleigh, NC.
Pote, D.H., and T.C. Daniel. 2000b. Analyzing for total phosphorus and total dissolved phosphorus in water samples. p. 94-97. In G.M. Pierzynski (ed.). Methods of phosphorus analysis for soils, sediments residuals and waters. Southern Corp. Series Bull. 396. Coop. Ext. Ser., North Carolina State Univ., Raleigh, NC.
Pote, D.H., T.C. Daniel, A.N. Sharpley, P.A. Moore, Jr., D.R. Edwards, and D.J. Nichols. 1996. Relating extractable soil phosphorus to phosphorus losses in runoff. Soil Sci. Soc. Am. J. 60:855-859.
Pote, D.H., T.C. Daniel, D.J. Nichols, P.A. Moore, Jr., D.M. Miller, and D.R. Edwards. 1999. Seasonal and soil-drying effects on runoff phosphorus relationships to soil. Soil Sci. Soc. Am. J. 63:1006-1012.
Prakash, P., and A. K. Sengupta. 2003. Selective coagulant recovery from water treatment plant residuals using Donnan membrane process. Environ. Sci. Technol. 37:4468-4474.
Rhoades, J.D. 1996. Electrical Conductivity and Total Dissolved Solids. In Methods of soil Analysis. 2nd Ed., A.L. Page et al. (Eds.). Soil Sci. Soc. Am., Inc., Madison, WI.
Rhoton, F.E., and J.M. Bigham. 2005. Phosphate adsorption by ferrihydrite-amended soils. J. Environ. Qual. 34:890-896.
Rostagno, C.M., and R.E. Sosebee. 2001. Biosolids application in the Chihuahuan Desert: Effects on runoff water quality. J. Environ. Qual. 30:160-170.
Sample, E. C., R.J. Soper, and G.J. Raez. 1980. Reactions of phosphate fertilizers in soils. In The Role of Phosphorus in Agriculture. F.E. Khasawneh, E.C. Sample, and E.T. Kamprath (eds.). ASA, CSSA. SSSA, Madison, WI.
SAS Institute. 1999. SAS online doc. Version 8. SAS Inst. Inc., Cary. NC.

188
Schoumans, O.F. 2000. Determining the degree of phosphate saturation in non-calcareous soils. P. 31-34 In Methods of phosphorus analysis for soils, sediments residuals and waters. Southern Corp. Series Bull. 396. Coop. Ext. Ser., North Carolina State Univ., Raleigh, NC.
Schwab, A. P. 1989. Manganese-phosphate solubility relationships in an acid soil. Soil Sci. Soc. Am. J. 53:1654-1660.
Schwertmann, U., and R.M. Cornell. 1991. Iron Oxides in the Laboratory, Wiley-VCH, Wienheim.
Self-Davis, M.L., P.A. Moore, Jr., T.C. Daniel, and D.R. Edwards. 1998. Use of aluminum sulfate to reduce soil test P levels in soils fertilized with poultry litter. Proceedings of the 1998 National Poultry Waste Management Symposium, Springdale, AR.
Sharpley, A.N. 1991. Soil phosphorus extracted by iron-aluminum-oxide-impregnated filter paper. Soil Sci. Soc. Am. J. 55:1038–1041.
Sharpley, A.N. 1993. Estimating phosphorus in agricultural runoff available to several algae using iron-oxide paper strips. J. Environ. Qual. 22:678-680.
Sharpley, A.N. 1995. Dependence of runoff phosphorus on extractable soil phosphorus. J. Environ. Qual. 24:920-926.
Sharpley, A.N. 1997. Rainfall frequency and nitrogen and phosphorus in runoff from soil amended with poultry litter. J. Environ. Qual. 26:1127-1132.
Sharpley, A.N., P.J.A. Kleinman, R.W. McDowell, M. Gitau, and R.B. Bryant. 2002. Modeling phosphorus transport in agricultural watersheds: Processes and possibilities. J. Soil Water Conserv. 57:425-439.
Sharpley, A.N., S.C. Chapra, R. Wedepohl, J.T. Sims, T.C. Daniel, and K.R. Reddy. 1994. Managing agricultural phosphorus for protection of surface waters: Issues and options. J. Environ. Qual. 23:437-451.
Sharpley, A.N., T.C. Daniel, J.T. Sims, and D.H. Pote. 1996. Determining environmentally sound soil phosphorus levels. J. Soil Water Conserv. 51:160-166.
Silveira, M.L., M. Miyattah-Kporgbe, and G.A. O’Connor. 2005. Phosphorus release from a manure-impacted Spodosol: Effects of a water treatment residual. J. Environ. Qual. 35:529-541.
Sims J.T, and G.M. Pierzynski. 2005. Chemistry of phosphorus in soils. In M.A. Tabatabai, and D.L. Sparks (eds.). Chemical processes in soils. SSSA Book Series 8, Soil Sci. Soc. Am, Inc., Madison, WI.
Sims, J.T., A.C. Edwards, O.E Schoumans, and R.R. Simard. 2000. Integrating soil phosphorus testing into environmentally based agricultural management practices. J. Environ. Qual. 29:60-71.

189
Sims, J.T., F. Coale, G. Evanylo, J. White, and A. Leytem. 2003. Field and on-farm evaluation of the effects of biosolids on phosphorus in soils and runoff. Final Project Report. Metropolitan Washington Council of Governments, Washington, DC.
Sims, J.T., N. Goggin, and J. McDermott. 1999. Nutrient management for water quality protection: Integrating research into environmental policy. Wat. Sci. Technol. 39:291-298.
Sims, J.T., R.R. Simard, and B.C. Joern. 1998. Phosphorus loss in agricultural drainage: Historical perspective and current research. J. Environ. Qual. 27:277-293.
Sloan, J.J., N. T. Basta, and R. L. Westerman. 1995. Aluminum transformations and solution equilibria induced by banded phosphorus fertilizer in acid soil. Soil Sci. Soc. Am. J. 59:357-364.
Snars, K., R. Gilkes, and J. Hughes. 2003. Effect of soil amendment with bauxite Bayer process residue (red mud) on the availability of phosphorus in very sandy soils. Austr. J. Soil Res. 41:1229-1241.
Spadini, L., A. Manceau., P.W. Schindler, and L. Charlet. 1994. Structure and stability of Cd surface complexes on ferric oxides I. Results from EXAF spectroscopy. J. Colloid Interf. Sci. 168:73-86.
Sparks, D.L. 1996. Method of Soil Analysis: Chemical Methods. SSSA Book Series (part 3). Soil Sci. Soc. Am., Inc., Madison, WI.
Sposito, G. 1989. The Chemistry of Soils (1st ed). Oxford University Press, New York.
Staats, K.E, Y. Arai, and D.L. Sparks. 2004. Alum amendment effects on phosphorus release and distribution in poultry litter-amended sandy soils. J. Environ. Qual. 33:1904-1911.
Stumm, W., R. Kummert, and L. Sigg. 1980. A ligand-exchange model for the adsorption of inorganic and organic-ligands at hydrous oxide interfaces. Croat. Chemica Acta 53:291-312.
Summers, R.N, N.R. Guise, and D.D. Smirk. 1993. Bauxite residue (red mud) increases phosphorus retention in sandy soil catchments in western-Australia. Fert. Res. 34:85-94.
Talibudeen, O. 1957. Isotopically exchangeable phosphorus in soils II: Factors influencing the estimation of ‘labile’ phosphorus. J. Soil Sci. 8:86-96.
Tarkalson, D.D., and R.L. Mikkelsen. 2004a. Runoff phosphorus losses as related to phosphorus source, application method and application rate on a Piedmont soil. J. Environ. Qual. 33:1424-1430.
Tarkalson, D.D., and R.L. Mikkelsen. 2004b. Runoff phosphorus losses as related to soil test phosphorus and degree of phosphorus saturation on Piedmont soils under conventional and no-tillage. Commun. Soil Sci. Plant Anal. 35:2987-3007.
190
Townsend, T.G., Jang, Yong-Chul, Pradeep Jain, and Thabet Tolaymat. 2001. Characterization of drinking water sludges for beneficial reuse and disposal. Report submitted to Florida Center for Solid and Hazardous Waste Management, Gainesivlle, FL.
Tran, T.S., J.C. Fardeau, and M. Giroux. 1988. Effects of soil properties on plant-available phosphorus determined by the isotopic dilution phosphorus-32 method. Soil Sci. Soc. Am. J. 52:1383-1390.
USEPA. 1986b. Quality criteria for water. USEPA 440/5-86-001. U.S. Dep. of Commerce, Springfield, VA.
USEPA.1986. Acid digestion of sediments, sludges, and soils. Section A, Part I, Chapter Three – Metallic analytes. Method 3050. SW-846, test methods for evaluating solid waste. USEPA, Washington, DC.
Van der Zee, S.E.A.T.M., L.G.J. Fokkink, and W.H. Van Riemsdijk. 1984. A new technique for assessment of reversibly adsorbed phosphate. Soil Sci. Soc. Am J. 51:599-604.
Van Riemsdijk, W.H., and J. Lyklema. 1980. Reaction of phosphate with gibbsite beyond the adsorption maximum. J. Colloid Interf. Sci. 76:55-66.
Wang Z.Y., J. M Kelly, and J.L Kovar. 2004. In situ dynamics of phosphorus in the rhizosphere solution of five species. J Environ. Qual. 33:1387-1392.
Wang, H.D., W.G. Harris, K.R. Reddy, and E.G. Flaig. 1995. Stability of phosphorus forms in dairy-impacted soils under simulated leaching. Ecol. Eng. 5:209-227.
Ward, S.C., and R.N. Summers. 1993. Modifying sandy soils with fine residue from bauxite refining to retain phosphorus and increase plant yield. Fert. Res. 36:151-162.
Westall, J., and H. Hohl. 1980. Comparison of electrostatic models for the oxide-solution interface. Adv. Coll. Interf. Sci. 12:265-294.
Wilson G.V., F.E. Rhoton, and H. M. SeIim. 2004. Modeling the impact of ferrihydrite on adsorption-desorption of soil phosphorus. Soil Sci. 169:271-281.
Wolt, J.D. 1994. Soil Solution Chemistry: Applications to Environmental Science and Agriculture. John Wiley and Sons, New York.
Zhang, M., and A.D. Karathanasis. 1997. Characterization of iron-manganese concretions in Kentucky Alfisols with perched water tables. Clays Clay Miner. 45:428-439.
191
BIOGRAPHICAL SKETCH
Sampson Agyin-Birikorang was born on May 28, 1967 at Koforidua, Ghana. He received
his bachelors degree in agriculture, with specialization in soil science from University of Ghana,
Legon-Accra, Ghana in 1998. After his two-year national service as a teaching/research assistant
at the soil science department of the University of Ghana, he was awarded a two-year scholarship
to pursue a masters degree program at the University of Gent, Belgium. He received his master
of science degree in physical land resources from the University of Gent in summer 2003.
Sampson is currently finishing his PhD dissertation at the University of Florida, USA.