Embed Size (px)
Citation preview

lable at ScienceDirect
Soil Biology & Biochemistry 68 (2014) 208e218
Contents lists avai
Soil Biology & Biochemistry
journal homepage: www.elsevier .com/locate/soi lbio
Labile organic nitrogen transformations in clay and sandy-loam soilsamended with 15N-labelled faba bean and wheat residues
Mervin St. Luce a,b, Joann K. Whalen a, Noura Ziadi b,*, Bernie J. Zebarth c,Martin H. Chantigny b
aDepartment of Natural Resource Sciences, Macdonald Campus, McGill University, 21, 111 Lakeshore Road, Ste-Anne-de-Bellevue, QC, Canada H9X 3V9b Soils and Crops Research and Development Centre, Agriculture and Agri-Food Canada, 2560 Hochelaga Blvd., Quebec City, QC, Canada G1V 2J3c Potato Research Centre, Agriculture and Agri-Food Canada, 850 Lincoln Road, PO Box 20280, Fredericton, NB, Canada E3B 4Z7
a r t i c l e i n f o
Article history:Received 29 May 2013Received in revised form26 September 2013Accepted 30 September 2013Available online 15 October 2013
Keywords:Organic nitrogenNitrogen mineralizationSoil nitrogen supplyParticulate organic matter
* Corresponding author. Tel.: þ1 418 210 5052; faxE-mail address: [email protected] (N. Ziadi).
0038-0717/$ e see front matter Crown Copyright � 2http://dx.doi.org/10.1016/j.soilbio.2013.09.033
a b s t r a c t
Labile organic nitrogen (N) fractions are actively involved in short-term N mineralization, but the extentto which each fraction contributes to N mineralization is not fully understood. The objective of this studywas to examine the flow of 15N-labelled faba bean (Vicia faba L.) and wheat (Triticum aestivum L.) residuesthrough the soil microbial biomass N (MBN), water-extractable organic N (WEON), light fraction organicmatter N (LFOMN), particulate organic matter N (POMN) and mineral N pools in sandy-loam and claysoils under controlled conditions. After 3 d, 17e30% of the residue 15N was recovered in the POMNfraction, with a greater proportion of the wheat than faba bean residue recovered as POM15N. ThisPOM15N probably included undecomposed residues and LFOM15N. Net N mineralization was greater infaba bean- than wheat-amended soils and greater in the sandy-loam than the clay soil. The LFOM15Nconcentrations decreased throughout the study, while POM15N concentrations increased or remainedconstant for 28 d in the sandy-loam and until 56 d in the clay soil. This suggests possible encrustation ofLFOMN with soil mineral particles causing increased densification and recovery in the POMN fraction.The subsequent decrease in POM15N concentrations corresponded with mineral 15N accumulation in thesoils. Mineral 15N concentration after 112 d was positively related to the initial POM15N concentration(r ¼ 0.78, P < 0.001) but not to the initial LFOM15N concentration (r ¼ �0.48, P > 0.05). The WEON andMBN appeared as transient, intermediary pools. The results of this study suggest that mineralization ofPOMN is a major pathway through which mineral N is supplied in agricultural soils, with C/N ratio ofcrop residues and to a lesser extent soil properties, influencing the mineralization rate.
Crown Copyright � 2013 Published by Elsevier Ltd. All rights reserved.
1. Introduction
Nitrogen mineralized from soil organic N (SON) makes animportant contribution to N needed by agricultural crops and mayaccount for more than 50% of total crop N uptake (Stevens et al.,2005; Nyiraneza et al., 2010). Most of the N mineralized in agri-cultural soils is expected to come from the labile fractions of SON(Wander, 2004). Nonetheless, increasing the size of a given labileSON fraction may not always increase the soil N supply (Sharifiet al., 2008) if biotic and abiotic factors limit the mineralizationprocess. While it is clear that the labile organic N fractions areactively involved in short-term N mineralization, their roles andimportance are not fully understood. Investigating N flows through
: þ1 418 648 2402.
013 Published by Elsevier Ltd. All
several labile SON fractions, namely LFOMN, POMN, MBN andwater-extractable organic N (WEON), should help to elucidate po-tential soil N availability.
Due to the rapid generation time of soil microbial biomass, MBNis thought to be the most labile SON fraction. It represents both asource (substrate) and sink (assimilation) of mineral N (Brookes,2001; Nicolardot et al., 2001). The WEON is widely used as a sur-rogate for dissolved organic N in soil solutions and includes thedissolved organic N present in macropores and some smaller pores(Chantigny et al., 2008). It is derived from microbial degradation offresh and partially decomposed organic residues, includingautochthonous SON (Murphy et al., 2000; Zsolnay, 2003). TheLFOMN and POMN fractions include partially decomposed plantresidues together with microbial by-products and are major sour-ces of N for microbes (Gregorich et al., 2006), but these fractions arenot structurally and chemically identical. The LFOM containsgreater amounts of carbohydrates and aliphatic compounds and
rights reserved.
M. St. Luce et al. / Soil Biology & Biochemistry 68 (2014) 208e218 209
has a larger particle size, indicative of residues in the initial stagesof decomposition, compared with POM (Gregorich et al., 1996).Consequently, LFOMN is frequently linked to N immobilization andnot net N mineralization (Boone, 1994; Compton and Boone, 2002),whereas POMN is often related to net N mineralization(Yakovchenko et al., 1998; Whalen et al., 2000), in part due to thelower C/N ratio of POM relative to LFOM. Cambardella and Elliott(1992) found that POM was depleted as a result of cultivation ingrassland soils and concluded that POM decomposition had animportant role in supplying mineral N. Assessment of N flowsthrough POM and other labile SON fractions is expected to providea more comprehensive understanding of N transformations and itsrelease in available mineral N forms.
Given that crop residue is the primary substrate for SONreplenishment in many agricultural soils (Campbell et al., 1991;Kumar and Goh, 1999), the response of MBN, WEON, LFOMN andPOMN fractions (size and physico-chemical stability of the pool) asa function of crop residue quality needs to be studied. The quality ofcrop residues, e.g., C/N ratio, can influence decomposition and Nprocesses in soils (Chivenge et al., 2011b). Crop residues with low C/N ratios tend to decompose faster (Pansu and Thuriès, 2003; Yanniet al., 2011), increase soil microbial biomass (Chotte et al., 1998;Hoyle and Murphy, 2011) and stimulate net N mineralization(Puttaso et al., 2011; Yanni et al., 2011) in comparison with cropresidues with higher C/N ratios. Most models on N transformationsin soils are based on or incorporate the influence of C/N ratio ofadded organic residues (Pansu et al., 1998, 2003; Nicolardot et al.,2001). However, the extent to which crop residue quality affectsthe formation and turnover of labile SON fractions depends on soilproperties such as soil texture and mineral N concentration. Forexample, clayey soils contain greater amounts of SON andmicrobialbiomass (Six et al., 2006), but tend to have lower N transformationrates than sandy soils due to greater physical protection of cropresidues and organo-mineral complexation (Kölbl et al., 2006;Chivenge et al., 2011a). Furthermore, studies show that highinitial soil mineral N availability and N additions can stimulatedecomposition, particularly of N-poor crop residues (Recous et al.,1995; Liu et al., 2006; Chivenge et al., 2011b).
Crop residue N
POMNLFOMN
MBN
WEON
Soil mineral N
Fig. 1. Conceptual model illustrating the transfer of crop residue N through labile SONfractions. Darker lines indicate a greater level of transfer. The magnitude of N transferis due to residue C/N ratio and soil controls but the actual fate of residue N showssimilar patterns irrespective of residue quality or soil condition.
A conceptual model describing the pattern and magnitude of Nflow from crop residues through the labile SON fractions and sub-sequent release as soil mineral N is illustrated in Fig. 1. Crop resi-dues are generally incorporated into agricultural soils as coarsefragments. The breakdown of the crop residues is mediated by soilmicrobes, which derive their energy and other nutrients (includingN) from the residues. The incorporation of crop residues stimulatesmicrobial activity and may result in an initial increase in the size ofthe MBN pool; however, the MBN pool is expected to remainrelatively constant thereafter since soil microorganisms maintain astable C/N ratio (Puri and Ashman, 1998; Fierer and Schimel, 2002).Decomposition of crop residues results in the formation of LFOMand POM, which are subsequently further degraded by microor-ganisms and generate WEON as a by-product (Murphy et al., 2000;Chantigny, 2003). However, the LFOM and POM are not entirelydistinct pools in that POM may contain LFOM (Carter, 2002; Sixet al., 2002). Under N limiting conditions, WEON may be used asan N source by soil microorganisms (Chantigny et al., 1999b;Marschner and Kalbitz, 2003), part of which may be mineralizedto soil mineral N. The rate of crop residue decomposition, the for-mation of LFOMN and POMN, followed by microbially-mediatedmineralization to produce mineral N, is controlled by crop residuequality (e.g., the initial C/N ratio of the residue, Nicolardot et al.,2001; Chivenge et al., 2011b) and the soil texture (Chivenge et al.,2011a), but the actual fate of N is similar between the residues.
To test the interactive effects of residue quality and soil textureon N transfer from crop residues to various N pools, 15N-labelledfaba bean (C/N ratio¼ 29) andwheat (C/N ratio¼ 91) residues wereincubated in clay and sandy-loam soils for 112 d. Our hypotheseswere that (i) recovery of crop residue 15N in LFOMN, POMN, WEON,MBN and mineral N will be greater for faba bean than wheat resi-dues because of the lower C/N ratio of the former; and (ii) Nmineralization from recently added 15N-labelled crop residues willbe slower in the clay soil than the sandy-loam soil due to morephysical protection in the clay soil. Another objective of this studywas to determine if the LFOMN, POMN and MBN pool sizes wererelated to soil N mineral concentration. This was done by relatinginitial 15N concentration in the labile SON fractions to the final 15Nconcentration in the soil mineral N pool at the end of theincubation.
2. Materials and methods
2.1. Soil sampling
Soils were collected in spring 2011 from the 0e15 cm depth ofa field that was previously under corn (Zea mays L.) at Agricultureand Agri-Food Canada’s Harlaka Research Farm (46� 470N,71�080W) and from a timothy (Phleum pratense L.) field in St-Nicolas near Quebec City, Canada (46� 410N, 71�280W). The soilfrom Harlaka was a Kamouraska clay (fine, mixed, frigid, TypicHumaquept; Soil Survey Staff, 2006) and contained 295, 295 and410 g kg�1 of sand, silt and clay, respectively. The soil from St-Nicolas was a St-Antoine sandy-loam (loamy, mixed, frigid,Typic Dystrochrept; Soil Survey Staff, 2006) with 678, 165 and157 g kg�1 of sand, silt and clay, respectively. Large plant mate-rials were removed manually from the field-moist soils beforepassing through a 6-mm sieve. The soils were air-dried andground to pass through a 2-mm sieve. Soil chemical character-istics are provided in Table 1.
2.2. 15N labelling of plants
Wheat and faba bean were grown in 2 L pots under controlledenvironment conditions (16 h day length; maximum day

Table 1Selected chemical characteristics of soils and crop residues used in the incubation study. Values are mean � SE (n ¼ 3).
Soils and residues pHa Total Nb Organic Cb C/N Mineral Nc
mg N kg�1
15N abundanced
atom %g kg�1
Clay 5.53 � 0.01 2.9 � 0.02 32 � 0.1 11.0 12 � 0.6 NDe
Sandy-Loam 6.11 � 0.01 1.7 � 0.03 19 � 0.2 10.9 21 � 1.2 NDFaba bean ND 14.7 � 0.01 420 � 0.1 29 ND 2.53Wheat ND 4.8 � 0.01 438 � 0.5 91 ND 2.84
a 1:2 (soil:water).b Dry combustion (Elementar Analysensysteme GmbH, Hanua, Germany).c 2 M KCl extracts.d Mass spectrometer.e ND, not determined.
M. St. Luce et al. / Soil Biology & Biochemistry 68 (2014) 208e218210
temperature 21 �C; minimum night temperature 17 �C) and fertil-ized with 15N (10 atom% 15NH4
15NO3) at a rate of 130 mg N pot�1
(equivalent to 100 kg N ha�1). Phosphorus and potassium wereapplied two weeks after germination at rates equivalent to 90 kgP2O5 ha�1 (120 mg P2O5 pot�1) and 110 kg K2O ha�1 (150 mgK2O pot�1). The plants were irrigated when necessary for optimalgrowth. Due to differences in growth rate andmaturation date, fababean was harvested after 6 wk, while wheat was harvested after10 wk. Above-ground tissues were dried at 60 �C for 48 h andground in a Wiley mill to pass through a 2 mm screen. A sub-sample was further ground to pass through a 1 mm screen for to-tal C and N analyses by dry combustion using an Elementar CNAnalyzer (Elementar Analysensysteme GmbH, Hanua, Germany)and 15N enrichment using an isotope ratio mass spectrometer(Delta V Plus, Thermo Fisher Scientific) at Agriculture and Agri-Food Canada’s Lethbridge Research Centre in Alberta, Canada. The15N enrichment and chemical characteristics of the residues aregiven in Table 1.
2.3. Incubation
Approximately 1.5 g of crop residue (0.1e2 mm) was thoroughlymixed with 200 g of air-dried soil, packed to a bulk density of1.1 Mg m�3 in a 500-mL glass jar and moistened to 60% water-filledpore space with deionized water. Total N added by the faba beanand wheat residue was 110 and 36 mg kg�1, respectively. Fourreplicates of each treatment were prepared for each sampling date(3, 7, 14, 28, 56 and 112 d after incorporation) to allow fordestructive sampling. The jars were coveredwith parafilm punchedwith pin holes to maintain aerobic conditions, arranged in a ran-domized complete block design by sampling date and incubated inthe dark at 25 �C. Water content was adjusted every 2e3 d byweighing and adding deionized water as needed. On designatedsampling dates, jars were removed from the experiment andthoroughly mixed before they were destructively sampled.
2.4. Analysis of labile SON fractions and mineral N
A 5 g sub-sample was taken for determination of gravimetricwater content by oven drying at 105 �C for 24 h. Mineral N (NH4e
N þ NO3eN) was immediately extracted with 2 mol KCl L�1 from12 g moist soil (1:10 soil: solution ratio) followed by filtrationthrough Whatman #42 filter paper (Maynard et al., 2008). MineralN forms were determined on an automated colorimeter (Quick-Chem 8000 Lachat autoanalyzer, Lachat Instruments, Loveland,CO); NO3eN was determined by cadmium reduction and NH4eNwas determined using salicylateenitroprusside reaction.
Chloroform fumigation-direct extraction (Brookes et al., 1985;Voroney et al., 2008) followed by potassium persulfate digestion(Cabrera and Beare, 1993) was used to determine the MBN con-centrations of moist soil. Briefly, 25 g (oven-dry weight) of soil was
either directly extracted or fumigated for 24 h followed by extrac-tion with 0.5 mol K2SO4 L�1 (1:4, soil: extractant ratio). The po-tassium persulfate reagent (50 g K2S2O8 þ 30 g H3BO4 þ 15 g NaOHin 1 L deionized water) was added to the 0.5 mol K2SO4 L�1 extracts(ratio 1:1) in a Kimax glass tube, capped and autoclaved at 120 �Cfor 1 h. The MBN concentration was subsequently calculated as[(total N in digests of fumigated soil extracts e total N in non-fumigated soil extracts)/kEN] where kEN is the extraction coeffi-cient 0.54 (Brookes et al., 1985).
Water-extractable organic N of moist soil was determined bygently stirring 60 g (oven-dry basis) of soil with 120 mL of 5 mmolCaCl2 L�1 for 1 min (Chantigny et al., 2008). The slurry was thencentrifuged at 9000 rpm (11 720 g) for 10 min, followed byfiltration through a 0.45 mm nylon membrane filter (Pall Corp., AnnArbor, MI). A portion of the filtrate was subjected to potassiumpersulfate digestion (Cabrera and Beare, 1993) as previouslydescribed and WEON was calculated as the difference betweentotal dissolved N concentration in potassium persulfate digest andmineral N (NH4eN þ NO3eN) in fresh filtrate. Total N and mineralN forms were determined on an automated colorimeter as previ-ously described.
The LFOM was separated from 25 g air-dried soil by shaking insodium iodide solution (NaI; specific gravity of 1.8 g cm�3) for 1 hand allowing the soil mineral particles to settle for 48 h beforerecovering the floating LFOM (Gregorich and Beare, 2008). Therecovered LFOM was washed with 0.01 mol CaCl2 L�1 and thenrinsed with deionized water to remove the residual NaI. A modi-fication of the procedure described by Gregorich and Beare (2008)was used to isolate soil POM. Briefly, 25 g of air-dried soil wasdispersed by shaking in 100 mL of deionized water, instead of so-dium hexametaphosphate, and 10 glass beads (6 mm) for 16 h. Thedispersed soil was passed through a 53-mm sieve. The retained sandand macroorganic matter were dried at 50 �C, weighed and groundusing a mortar and pestle to pass a 250-mm sieve. Whole soil wasalso sampled at 112 days after residue incorporation and ground topass through a 250-mm sieve. Total N in LFOM, POM and whole soilwere determined by dry combustion using an Elementar CNAnalyzer (Elementar Analysensysteme GmbH, Hanua, Germany)while their 15N enrichment was determined using an isotope ratiomass spectrometer (Delta V Plus, Thermo Fisher Scientific) atAgriculture and Agri-Food Canada’s Lethbridge Research Centre inAlberta, Canada. All measurements were expressed as concentra-tion per kg of soil (oven-dry basis).
2.5. Isotope analysis
The 15N abundance in the soil extracts (mineral N, MBN andWEON) were measured following a modified micro-diffusion pro-cedure outlined by Stark and Hart (1996). Filter disks (6 mmdiameter) were cut from glass microfiber filter circles (Whatman#934-AH), acidified with 10 mL of 2.5 mol KHSO4 L�1 and sealed in

M. St. Luce et al. / Soil Biology & Biochemistry 68 (2014) 208e218 211
Teflon tape (50 mm length, 20 mmwidth). Since NH4eN extractedby 2 mol KCl L�1 was low throughout the experiment (<3mg NH4e
N kg�1), NO3eN and NH4eN were diffused together to determinemineral 15N. Briefly, 15e20 mL of the 2 mol KCl L�1 extracts (con-taining 45e160 mg N) were pipetted into 250 mL acid- and KOH-washed glass jars, followed by additional 2 mol KCl L�1 to obtaina final volume of 30 mL. Samples with <2 mg N mL�1 were spikedwith 10mL of a 2mol KCl L�1 solution containing 4 mg NmL�1 at 1.0atom % 15N. One drop of 30% (w/v) Brij-35 was added to reducespattering and entrapment of NH4 in H2 bubbles during NO3diffusion (Herman et al., 1995). For comparable headspace in alljars, the volume was brought to 30 mL by adding 2 mol KCl L�1.Then, 0.4 g of MgO, 0.2 g Devarda’s alloy and one sealed filter diskwere added to each jar. The jar was sealed quickly, incubated atroom temperature and swirled once per day for 7 d. Thereafter, thesealed filter disk was removed, rinsed with deionized water, anddried in a desiccator over concentrated H2SO4. Dried filter diskswere packed in tin capsules for 15N analysis by mass spectrometry.
For MB15N, 5e10 mL of K2SO4 extracts digested with potassiumpersulfate (MBN fumigated and non-fumigated extracts) contain-ing 80e160 mg N were pipetted into the jars, followed by 2 mol KClL�1 to obtain a volume of 30 mL. The 2 mol KCl L�1 served to in-crease the molarity of the solution at a level similar to that of theacidified filter disk, thereby reducing the potential for swelling andbreaking of the Teflon tape. The pH was raised to >12 by adding2 mL of 6 mol NaOH L�1. All other procedures were the same asdescribed above for mineral 15N.
Two to 15 mL of 5 mmol CaCl2 L�1 extracts digested with po-tassium persulfate (containing 1e160 mg N) were diffused todetermine WEO15N. Samples with <3 mg N mL�1 were spiked with10 or 15mL of a 2mol KCl L�1 solution containing 4 mg NmL�1 at 1.0atom % 15N. All other procedures were the same as described abovefor mineral 15N.
2.6. Calculations
The atom% 15N in the spiked soil extracts (At.15Nextract) wasdetermined using the equation of Whalen et al. (2001):
At:15Nextract ¼At:15Ndiffused �
�ANextract þ ANspike
���ANspike � At:15Nspike
�
ANextract(1)
where At.15Ndiffused is the atom% 15N measured from the disk in thespiked soil extract; ANextract is the mg of N in the soil extract, ANspikeis the mg of N added with the spike; At.15Nspike is the atom% 15Nmeasured from the disk in the spike solution.
The atom% 15N excess (EN) was subsequently determined as thedifference between At.15Nextract and the natural abundance value ofthe system (atom% 15N measured from the disk in a blank solutionthat was treated in the same manner as the soil extracts). The 15Nabundance of soil mineral N could not be determined in KCl ex-tracts for the first 3 sampling dates because mineral N concentra-tionswere too low relative to the amount of N addedwith the spike.Due to incomplete diffusion of the CaCl2 extracts digested withpotassium persulfate, determination of the 15N abundance inWEON was not possible.
The EN in the microbial biomass was calculated as the differencein 15N enrichment between the fumigated and non-fumigatedextracts:
E in MBN ¼EN in Nf � Nf � EN in Nnf � Nnf
(2)
N� � � �
Nf � Nnf
where Nf and Nnf are the total N concentration (mg kg�1) of thefumigated and non-fumigated extracts, respectively. Recovery ofresidue 15N in the different N forms was calculated using theequation of Clark et al. (2009):
15N recovered ¼ QN � ENQ15N
(3)
where QN is the amount of N (mg kg�1) measured either in thewhole soil, NH4eN þ NO3eN, MBN, LFOMN or POMN fractions; ENis the 15N excess of the analysed sample; Q15N is the amount of 15Nadded with the faba bean (2.35 mg 15N kg�1) or wheat (0.88 mg 15Nkg�1) residue.
2.7. Statistical analyses
Data was checked for normality with the ShapiroeWilk test andlog transformed when necessary. The data presented in the tablesand figures are untransformed means � standard error (SE). Theeffect of crop residue quality and soil texture (between subject ef-fects) on soil mineral N, MBN, WEON, LFOMN, POMN concentra-tions and 15N recovered in these pools were assessed usingrepeated measures analysis of variance (ANOVA). The total N and15N recovered in the labile SON fractions and soil mineral N overtime were regarded as repeated measurements (within subjecteffects). We used the PROC MIXED procedure Repeated MeasuresANOVA of SAS statistical software, version 9.2. The choice ofcovariance structure, as outlined in PROC MIXED of SAS, was basedon goodness-of-fit (Littell et al., 1998). Differences were consideredstatistically significant at P < 0.05. When significant effects wereobserved, means were compared with a post-hoc least squaremeans test at 95% confidence level. Pearson correlation coefficientswere used to examine the relationships between mineral 15Nrecovered at the end of the incubation (112 d) and initial 15Nrecovered in MBN, LFOMN and POMN (3 d).
3. Results
3.1. Soil and crop residue characteristics
Prior to crop residue addition, total N and organic C concen-trations were more than 60% greater in the clay than the sandy-loam soil, while initial mineral N concentration was nearly 2-foldhigher in the sandy-loam soil than the clay soil (Table 1). The claysoil was slightly (0.6 pH units) more acidic than the sandy-loamsoil. Finally, the C/N ratio of the wheat residue was 3 timesgreater than the faba bean residue.
3.2. Soil mineral N dynamics
Soil mineral N concentrations increased over time (P < 0.001)and were influenced by soil type, residue type and their interaction(P< 0.001). Net Nmineralization (i.e., the increase in soil mineral Nconcentration above the concentration before incubation) was

Clay
0 20 40 60 80 100 120
Min
eral
N (m
g N
kg-
1 )
0
20
40
60
80
100
120
140
160
180
Sandy Loam
0 20 40 60 80 100 120
0 20 40 60 80 100 120
MB
N (m
g N
kg-1
)
0
20
40
60
80
100
120
Time (days)
0 20 40 60 80 100 120
WE
ON
(mg
N k
g-1)
0
5
10
15
20
25
30
35
0 20 40 60 80 100 120
Non-amendedFaba beanWheat
(a) (b)
(c)
(e) (f)
(d)
0 20 40 60 80 100 120
*
*
* *
*
*
*
*
*
**
*
*
* *
**
*
* *
*
**
**
**
Fig. 2. Mineral N, MBN and WEON dynamics in clay and sandy-loam soils amended with faba bean and wheat residues and a non-amended control. Dotted line represents theinitial soil mineral N concentration before the start of the incubation. Bars represent SE (n ¼ 4). (*) Indicates significantly (P < 0.05) greater than the non-amended for each date.
M. St. Luce et al. / Soil Biology & Biochemistry 68 (2014) 208e218212
greater in the sandy-loam than the clay soil, highest in faba bean-amended sandy-loam and lowest in wheat-amended clay soil(Fig. 2a and b). At 56 and 112 d, mineral N concentrations in sandy-loam soil were greater (P < 0.001) for the faba bean-amended thanthe non-amended soil. In the clay soil, mineral N concentrationswere always lower with than without crop residues. Net N miner-alization took place after 14 d in the faba bean-amended soils.However, the initial mineral N concentration was not exceededuntil day 28 and 56 in the wheat-amended sandy-loam and claysoils, respectively (Fig. 2a and b).
3.3. Labile SON fractions
The MBN concentrations were significantly (P < 0.001) influ-enced by residue type but not by soil type or their interaction(P > 0.05). The MBN concentrations in the non-amended clay soilsignificantly (P < 0.001) decreased from 3 to 7 d but remainedrelatively constant after 14 d (Fig. 2c). In the non-amended sandy-loam soil, MBN concentrations were relatively stable during thefirst 14 d, then significantly (P < 0.001) decreased and remained
stable thereafter (Fig. 2d). The MBN accounted for 0.9e2% of totalsoil N in the clay soils and from 1.5 to 3% in the sandy-loam soils.Residue incorporation increased MBN in both soils compared withthe non-amended soils during the first 60 d (P < 0.001), butthereafter, MBN in the residue-amended clay soil and the wheat-amended sandy-loam soil (Fig. 2c and d) were similar to the cor-responding non-amended soils. After 112 d, MBN was still greaterin the faba bean-amended sandy-loam soil than in the non-amended sandy-loam soil. The initial (3e7 d) increase in MBN inresidue-amended soils tended to be greater with faba bean thanwheat, particularly in the sandy-loam soil (Fig. 2d). There were nosignificant (P > 0.05) interactions between soil and residue typeson soil MBN concentrations.
Total WEON concentrations were significantly (P < 0.001)influenced by soil type, residue type and their interaction (Fig. 2eand f). The WEON was greater in the sandy-loam than the clay soiland accounted for 0.1e0.3% of total N in the clay soil, and 0.4e0.7% inthe sandy-loam soil. The WEON concentrations followed the orderof faba bean-amended > non-amended > wheat-amended soils(P< 0.001). TheWEON concentrations were greater with faba bean
Clay
0 20 40 60 80 100 120
LFO
MN
(mg
N k
g-1)
0
10
20
30
40
50
60
Non-amendedFaba bean Wheat
Sandy Loam
0 20 40 60 80 100 120
0 20 40 60 80 100 120
POM
N (m
g N
kg-1
)
0
100
200
300
400
Time (days)
0 20 40 60 80 100 120
*
**
* *
*
*
**
*
** *
*
*
**
* *
*
(a) (b)
(c) (d)
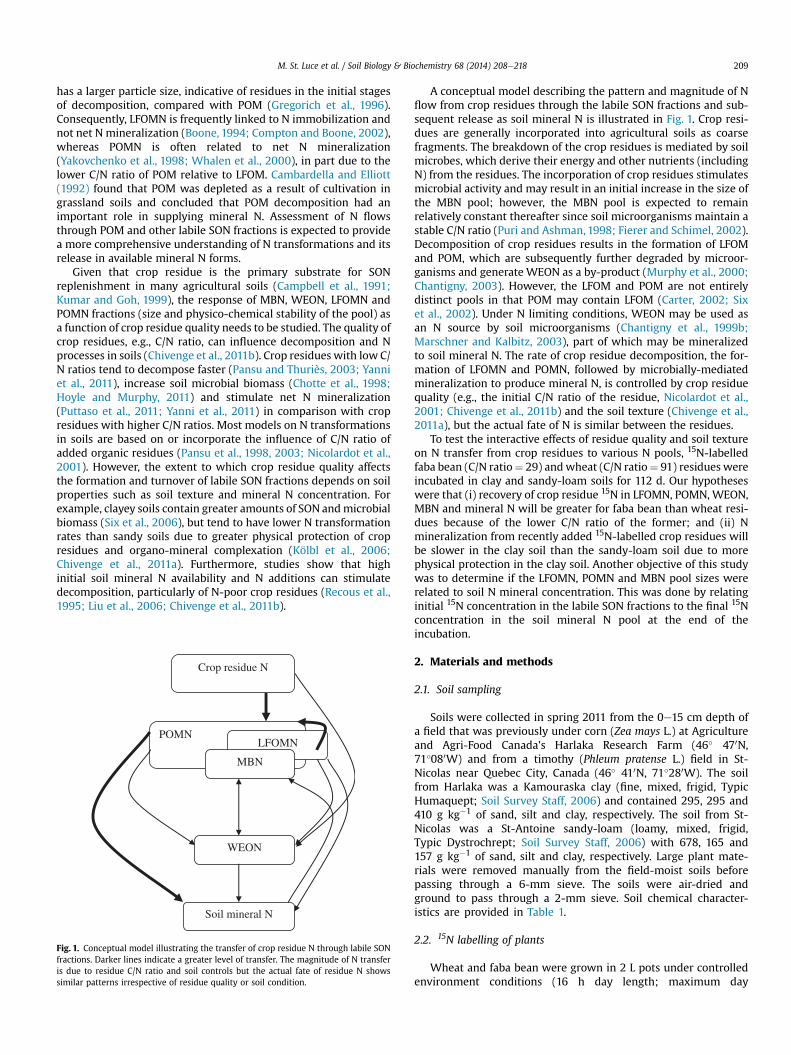
Fig. 3. LFOMN and POMN dynamics in clay and sandy-loam soil amended with faba bean and wheat residues and a non-amended control. Bars represent SE (n ¼ 4). (*) Indicatessignificantly (P < 0.05) greater than the non-amended for each date.
M. St. Luce et al. / Soil Biology & Biochemistry 68 (2014) 208e218 213
than non-amended after 56 (P < 0.01) and 112 (P < 0.001) d in theclay soil, and after 28 (P < 0.001) and 56 d (P< 0.001) in the sandy-loam soil. However, WEON was greater with wheat than in non-amended soils only at 112 d (P< 0.001) after residue incorporation.
The LFOMN was influenced by soil type, residue type and theirinteraction (P < 0.001), and was greater in the sandy-loam than inthe clay soil (Fig. 3a and b). The proportion of total soil N recoveredas LFOMN at the end of the incubation was 0.3e0.6% in the clay soiland 1.3e2% in the sandy-loam soil. Compared to the non-amendedclay soil, adding faba bean increased LFOMN (P < 0.05) from 28 dafter incorporation until the end of the incubation, whereas, addingwheat significantly increased it at 28 and 56 d only (P< 0.01). In thesandy-loam soil, adding faba bean increased LFOMN (P < 0.01) at 7and 14 d after residue incorporation, while incorporation of wheatresidues did not increase LFOMN (P > 0.05).
The POMN was significantly (P < 0.001) influenced by soil typeand residue type (Fig. 3c and d). The sandy-loam soil had greatertotal POMN than the clay soil. The proportion of total soil Nrecovered as POMN at the end of the incubation ranged from 6 to7% in the clay soil and from 14 to 16% in the sandy-loam soil. ThePOMNwas greater with thanwithout crop residues during the first60 d in the clay soil, compared with the first 28 d in the sandy-loamsoil. Over the 112 d, POMN remained fairly constant in the non-amended soils, whereas LFOMN declined (P < 0.05) (Fig. 3). After112 d, LFOMNwas higher (P < 0.05) in the faba bean-amended claythan in the non-amended clay. In the sandy-loam soil, LFOMNfollowed the pattern faba bean¼ non-amended>wheat (P< 0.05).
3.4. 15N in mineral N and labile SON fractions
Based on 15N added from the crop residues (2.35 and 0.88 mg15N kg�1 for faba bean and wheat, respectively) and subsequently
released as mineral N after 112 d, 22% and 36% of the faba beanresidue N was mineralized in the clay and sandy-loam soil,respectively, compared with 13% and 20% of the wheat residue N,respectively. Soil type, residue type and their interaction affected(P < 0.001) residue 15N in the mineral N pool (Fig. 4). The mineral15N accumulation followed the order of faba bean-amended sandy-loam > faba bean-amended clay ¼ wheat-amended sandy-loam > wheat-amended clay (P < 0.05). The mineralization ofresidue 15N progressed over time in all treatments, but at a fasterrate in the residue-amended sandy-loam than the residue-amended clay soils.
The MB15N concentrations were influenced (P < 0.001) by soiland residue type but not by their interaction (Fig. 4). On the thirdday of the incubation, 5% of faba bean and 4% of wheat residue Nwere recovered as MBN in the clay soil, whereas 11% and 8% wererecovered in the sandy-loam soil. The MB15N remained relativelystable throughout the experiment in the wheat-amended clay soils,whereas it deceased (P < 0.001) from day 3 to day 7 and remainedstable thereafter in the sandy-loam soils. Although not statisticallysignificant (P > 0.05), there was a slight temporal variation in theMB15N in the faba bean-amended clay soil. After 56 days, about 4%of the wheat and 6% of the faba bean residue 15N remained in theMBN in the clay soil, while about 6% remained in the sandy-loamsoil.
The LFOM15N concentrations were not influenced by soil type,residue type or their interaction (P > 0.05), but decreased(P < 0.001) as the incubation progressed (Fig. 4). The POM15Nconcentrations were significantly influenced by residue type(P < 0.001) and the soil type � residue type interaction (P < 0.01),but the soil type effect was not significant. The POM15N slightlyincreased and remained relatively stable during the first 60 d in thewheat-amended clay soil, whereas it gradually decreased after 14 d

Wheat
0 20 40 60 80 100 120
15
N R
eco
vere
d (
mg
15
N k
g-1
)
0.0
0.1
0.2
0.3
0.4
Col 1 vs Mineral N Col 1 vs POMN Col 1 vs LFOMN
Sandy-Loam
0 20 40 60 80 100 120
Faba bean
Time (days)0 20 40 60 80 100 120
15
N R
eco
vere
d (
mg
15
N k
g-1
)
0.0
0.2
0.4
0.6
0.8
1.0
Mineral N POMN LFOMN
Faba bean
0 20 40 60 80 100 120
Clay
Wheat
0 10 20 30 40 50 600.02
0.03
0.04
0.05
0.06MBN
0 10 20 30 40 50 60
0.100.120.140.160.18
MBN
0 10 20 30 40 50 600.100.150.200.250.300.350.40
MBN
0 10 20 30 40 50 600.04
0.05
0.06
0.07
0.08
MBN
Fig. 4. 15N recovered in mineral N, MBN, POMN and LFOMN in clay and sandy-loam soils amended with faba bean and wheat residues. Bars represent SE (n ¼ 4).
M. St. Luce et al. / Soil Biology & Biochemistry 68 (2014) 208e218214
in the faba bean-amended clay soil. In the wheat-amended sandy-loam soil, POM15N increased slightly during the first 14 d anddecreased slowly thereafter, with a sharper decrease after 60 d.However, after an initial increase, POM15N sharply decreased from7 to 28 d in the faba bean-amended sandy-loam soil, and thenslowly decreased thereafter. The POM15N concentrations weregreater in faba bean- thanwheat-amended soils, however, a greaterproportion of the wheat (average of 24e25%) than faba bean(average of 14e16%) residues were recovered as POMN in both soils(Fig. 4). Generally, POM15N concentrations decreased during theincubation but at a faster rate in faba bean- than wheat-amendedsoils.
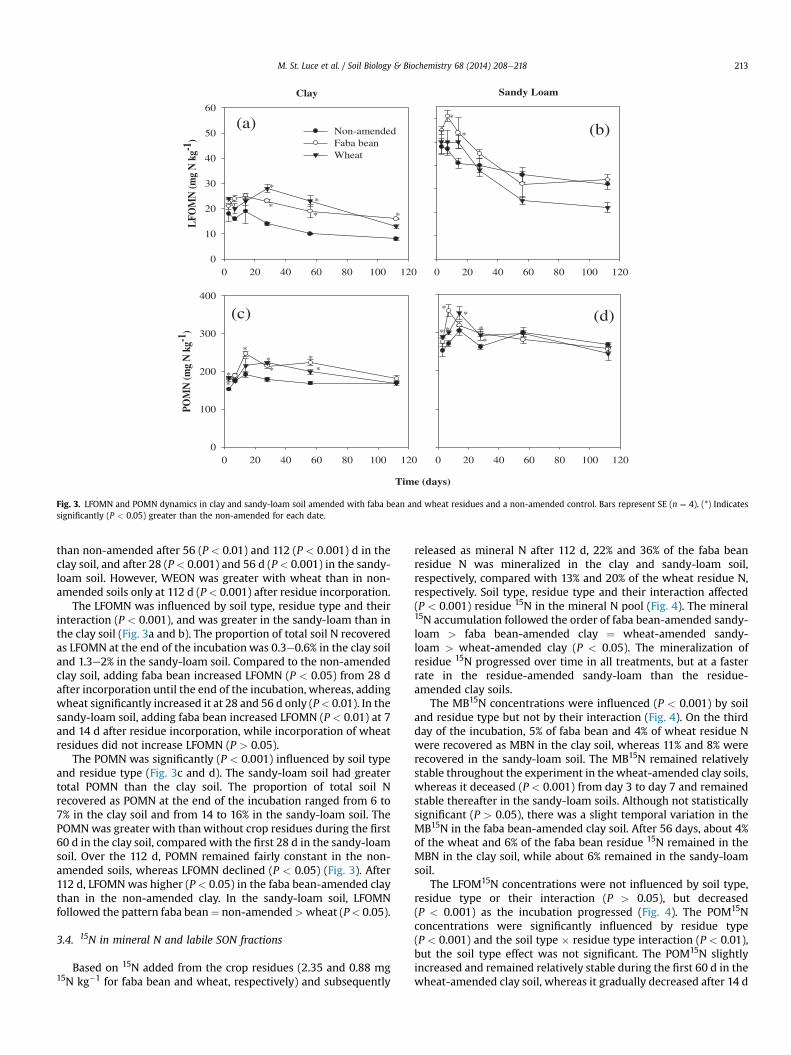
A greater proportion of the 15N from both residues was initiallyrecovered as POMN (17e30%) than LFOMN, MBN or mineral N inboth soils (Fig. 4). By the end of the incubation, 11e12% of theresidue 15N remained as POMN in both soils, compared with only1e2% as LFOMN (Table 2). Average 15N recovered in whole soils atthe end of the incubation was high and accounted for 85% and 92%of initial wheat and faba bean residue 15N applied, respectively(Table 2). The LFOM15N concentrations decreased throughout thestudy, while POM15N concentrations increased or remained con-stant for 14e28 d in the sandy-loam and 28e56 d in the clay soil. Asillustrated in Fig. 4, the decline in POM15N concentrations corre-sponded to an accumulation in mineral 15N. This was particularlyobvious in the wheat-amended soils. The mineral 15N concentra-tion at the end of the incubation was positively correlated to initial(d 3) POM15N (r¼ 0.78, P< 0.001, n¼ 15) andMB15N concentration(r ¼ 0.93, P < 0.001, n ¼ 13), but was not related to LFOM15N
concentration (r ¼ �0.48, P > 0.05, n ¼ 14). In addition, MB15Nconcentration at d 3 was positively related to POM15N concentra-tion at d 3 (r ¼ 0.72, P < 0.01, n ¼ 14) but was not related toLFOM15N concentration at d 3 (r ¼ �0.39, P > 0.05, n ¼ 13). Finally,POM15N and LFOM15N concentrations at d 3 were negativelycorrelated (r ¼ �0.60, P < 0.05, n ¼ 15).
4. Discussion
4.1. Effect of residue quality
More 15N accumulated in the mineral N pool from the faba beanresidue in both soils compared with the wheat residue, whichpresumably resulted from the narrower C/N ratio and higher Ncontent of the faba bean residue (Trinsoutrot et al., 2000;Nicolardot et al., 2001). Conversely, more 15N from the wheat res-idue than from the faba bean residue was recovered in the POMNfraction at the beginning and at the end of the incubation. As thePOMN fraction is composed of partially decomposed plant residuestogether with microbial by-products (Gregorich et al., 2006), ourfinding suggests that a greater portion of the wheat residue Naccumulated and was retained in the pool of undecomposed andpartially decomposed residues, with less N incorporated into themicrobial biomass and transferred to the mineral N pool than fromfaba bean residue because of the wider C/N ratio of wheat residues.Alternatively, less of the faba bean residue N initially accumulatedand remained as POMN since it was mineralized at a much fasterrate than the wheat residue. These results are in agreement with
Table 215N recovered in whole soil, mineral N and labile SON fractions after 112 days in clayand sandy-loam soil amended with faba bean and wheat residues. Values aremean � SE (n ¼ 8).
Soils and residues Whole soil Mineral N MBNa LFOMN POMN
% of applied 15N
Clay 89.7 � 2.0 17.2 � 1.9 4.5 � 0.5 2.1 � 0.1 11.0 � 1.3Sandy-Loam 87.3 � 2.4 28.0 � 2.9 5.7 � 0.4 1.3 � 0.1 12.1 � 1.8Faba bean 91.7 � 1.6 29.9 � 2.7 6.1 � 0.5 1.7 � 0.2 7.8 � 0.3Wheat 85.3 � 2.2 16.9 � 1.5 4.6 � 0.4 1.6 � 0.2 15.3 � 0.9
a Values are after 56 d.
M. St. Luce et al. / Soil Biology & Biochemistry 68 (2014) 208e218 215
previous findings that C/N ratio and N content of crop residuesinfluences N mineralization in soils (Trinsoutrot et al., 2000;Nicolardot et al., 2001; Pansu et al., 2003; Schimel andHättenschwiler, 2007; Yanni et al., 2011; Gul et al., 2012).Nicolardot et al. (2001) showed that most of the N assimilated bythe microbial biomass inwheat straw-amended soil (high C/N ratioresidue) was derived from soil mineral N, with only aminor fractioncoming from the wheat straw residue. Conversely, N from low C/Nratio residueswas rapidly assimilated by the soil microbial biomass.
The greaterWEON concentrations in the faba bean- thanwheat-amended soils were probably also related to the narrower C/N ratioand greater N concentration of the faba bean residues comparedwith the wheat residues. In the residue-amended soils, WEONconcentrations increased gradually over 112 d but the concentra-tions remained relatively low. The increase in WEON concentra-tions can be attributed to the release of soluble organic N followingmicrobial degradation of the crop residues (Murphy et al., 2000;Chantigny, 2003). The relatively constant WEON concentrationsin the non-amended soils suggest that WEON was probably beingutilized by the microbial biomass (Whalen et al., 1999; Cooksonet al., 2005) at a rate similar to its production rate.
4.2. Effect of soil texture and initial soil mineral N concentration
Our second hypothesis was that N transformation from recentlyadded 15N-labelled crop residues would be faster in the sandy-loamsoil than the clay soil. The release of residue 15N to the mineral Npool was consistent with this hypothesis in that mineral 15N wasgreater in the sandy-loam than the clay soil. These results were inagreement with other studies (Hassink, 1994; Griffin et al., 2002;Thomsen et al., 2003; Cookson et al., 2006) and may be due togreater microbial access to the residues in the sandy-loam than theclay soil, which would be consistent with the greater WEON andinitial MB15N concentration in the sandy-loam soil. Microbial ac-cess is usually lower in clay soils, particularly at low residueapplication rates as in our study, due to binding by clay particles.This can significantly reduce microbial respiration (Colman andSchimel, 2013; Roychand and Marschner, 2013), and therebyresult in lower decomposition and N mineralization rates (Colmanand Schimel, 2013). Ammonium fixation by clay particles in a non-extractable form may have also reduced the concentration ofmineral N extracted in the clay soil (Chantigny et al., 2004). Thegreater initial mineral N concentration in the sandy-loam than inthe clay soil may have also led to faster decomposition of the res-idues in the sandy-loam soil. In the non-amended soils, mineral Naccumulation was also greater in the sandy-loam than the clay soildue to less physical protection and organo-mineral complexation(Kölbl et al., 2006; Chivenge et al., 2011a). In comparison with thisstudy, previous studies have reported greater net N mineralizationin clay than sandy soils (Chivenge et al., 2011a; Gul et al., 2012). In amesocosm experiment, Chivenge et al. (2011a) reported fasterdecomposition of organic residues in a clay in comparison to a
sandy soil due to higher soil water content and total soil N con-centration in the clay soil. In our study, soil total N concentrationwas also higher in the clay than the sandy-loam soil, but soilavailable N was greater in the sandy-loam soil. Other studies (Scottet al., 1996; Thomsen et al., 2001) reported no or minor soil textureeffects on Nmineralization in short-term incubations where sievedand homogenized soils were used and optimal conditions such asmoisture and finely ground residues for microorganism growth andactivity were provided. The residue size in our study ranged from0.01 to 2 mm but was �1 mm in the other studies.
The tendency for a longer immobilization period in the wheat-than faba bean-amended soils, particularly in the clay soil whichhad a lower initial soil mineral N concentration, provides support toan already established fact that initial soil N availability has agreater impact on net N mineralization from N-poor than N-richresidues (Recous et al., 1995; Liu et al., 2006).
4.3. N transformation through labile SON fractions
To our knowledge, this was the first study in which 15N-labelledresidues of differing quality (C/N ratio) were incubated in differentsoil types to simultaneously assess N flows through key labile SONfractions (LFOMN, POMN, MBN andWEON) before entering the soilmineral N pool. More than 85% of the added 15N was recovered ineach whole soil after 112 d. As soils and residues were incubated inclosed vessels, the unrecovered 15N was probably lost throughgaseous N emissions. The fact that POM15N concentrations wereinfluenced by residue type and not by soil type suggests that theformation and subsequent mineralization of POMN was governedmore by the biochemical composition of the crop residues and lessby soil properties. This also suggests that residue quality mayexhibit a greater control than soil properties in the initial stages ofresidue decomposition, which supports previous findings(Nicolardot et al., 2001; Zeller and Dambrine, 2011; Gul et al., 2012).Most models, e.g., the Transformation of Added Organics (TAO)model (Pansu and Thuriès, 2003; Pansu et al., 2003) and theMOMOS N model (Pansu et al., 1998), conclude that residuedecomposition and N mineralization depend on organic residuequality.
Consistent with the conceptual model, a greater proportion ofthe 15N from both crop residues was recovered in the POMN frac-tion than the other labile SON fractions. The relatively low recoveryof 15N in POMN and LFOMN after 3 d could be explained by (i) thepresence of readily soluble N and (ii) incomplete recovery of LFOMand POM. It is possible that encrustation of the residues withmineral particles was already initiated by day 3 (Golchin et al.,1994; Chantigny et al., 1999a), causing an increase in residue den-sity and thereby negatively affecting LFOM recovery. Additionally,mechanical breakdown of macroorganic materials with the actionof glass beads may have occurred during POM extraction, wherebysome of the residues were probably broken down into fragmentssmaller than 53 mm. It is also possible that a proportion of the cropresidue was probably tightly bound to clay minerals (Kölbl et al.,2006; Roychand and Marschner, 2013). The greater recovery ofresidue 15N in the POM15N fraction compared to other fractionsmeasured may be due to several reasons. Firstly, the POMN fractionrecovered likely included undecomposed residues in the initialstages, particularly in the wheat-amended soils. Secondly, at thebeginning of the incubation, the fresh crop residues were mostlikely recovered in the LFOM fraction. Since POMN and LFOMNwere not sequentially extracted, the LFOMN fraction was thereforelikely recovered in the POMN fraction (Carter, 2002; Six et al.,2002). In addition, encrustation of the crop residues with micro-bial by-products (e.g., polysaccharides) and soil mineral particlesmay have caused the LFOMN to be recovered in the POMN fraction

M. St. Luce et al. / Soil Biology & Biochemistry 68 (2014) 208e218216
(Golchin et al., 1994; Chantigny et al., 1999a). We used NaI at aspecific gravity of 1.8 g cm�3. It is likely that the density of some ofthe LFOM was >1.8 g cm�3 due to adherence of microbial by-products and soil mineral particles, thereby causing them to sinkduring LFOM extraction (Golchin et al., 1994). We observed that thedecrease in POM15N concentrations started at a later stagecompared with LFOM15N concentrations and, in some cases,POM15N concentrations actually increased while LFOM15N con-centrations decreased. Hence, microbial colonization, encrustationand degradation of LFOM15N probably enhanced the recovery of15N in the POMN fraction, but the decline in LFOM15N was notdirectly associated with an increase in mineral 15N. It is widelyknown that LFOMN contains greater amounts of carbohydrates andaliphatic compounds and more recently decomposed residues thanPOMN (Gregorich et al., 1996). Vanlauwe et al. (1998) and Zeller andDambrine (2011) also reported that most of the 15N in 15N-labelledresidues were recovered in the POMN fraction.
In this study, the progressive decrease of POM15N and LFOM15Nwere associated with an increase in mineral 15N. More specifically,soil mineral 15N accumulation commenced at the stage wherePOM15N and not LFOM15N started to decrease, while at the sametime, MB15N remained relatively constant. The 15N-mineral N at theend of the incubation was correlated to the initial POM15N but notto the LFOM15N. When the crop residues were added to the soils,the soil microorganisms colonized the surfaces of the residues, thusinitiating the start of the decomposition process (Golchin et al.,1994; Ladd et al., 1996; Chotte et al., 1998). The large and activemicrobial community associated with this process released poly-saccharides and most likely resulted in encrustation of the residueswith mineral particles (Golchin et al., 1994, 1998; Chantigny et al.,1999a). This may have caused rapid densification of the residues(Chantigny et al., 1999a), whereby less of the crop residues wererecovered as LFOM and more were recovered as POM. Theencrusted POM likely contained SON at various stages of decom-position and the newly encrusted crop residues. As decompositioncontinued, the encrusted POM was gradually broken down intosmaller pieces by the colonizing microbes and was transferred tothe fine SOM fraction (Golchin et al., 1994; Chantigny et al., 1999a),explaining the later decline in POMN recovery. As this processunfolded, more of the organic N became accessible to decomposersand N mineralization rate increased, thereby explaining the cor-respondence in temporal dynamics of POMN and soil mineral N.
The positive relationship between POM15N and MB15N con-centrations suggests that POMN was the site of localized biologicalactivity (Chotte et al., 1998; Magid and Kjærgaard, 2001) in thesesoils. In forest soils, Zeller and Dambrine (2011) reported that 15Nabundance of soil mineral N produced was closer to that of the POMfraction than that of mineral-bound fractions (<50 mm).Cambardella and Elliott (1992) suggested that POM accounts for themajority of SOM that is initially lost due to cultivation of grasslandsoils. The MB15N remained relatively stable because the total poolsize did not vary significantly during the experiment (Puri andAshman, 1998; Fierer and Schimel, 2002, 2003). Our results are inagreement with previous findings which indicate that while soilMBN accounts for a small portion of total soil N, it plays amajor rolein the N cycle by acting upon most N transformation processes insoils (Pansu et al., 1998; Manzoni and Porporato, 2009). After aninitial increase in the size of the microbial biomass due to cropresidue incorporation, MBN concentrations were similar in residue-amended and non-amended soils after about 60 d, suggesting thatN was being cycled very quickly through the microbial biomass,most likely in a matter of days (Whalen et al., 1999; Gregorich et al.,2000). In addition, the initial increase inMBNwas probably derivedmore from N released from the soil and dead microbial cells thanthe added residues, due in part to soil disturbance and rewetting
(Jackson, 2000; Wu and Brookes, 2005), since only 4e11% of theadded residues were initially recovered as MBN. Overall, our resultssuggest that mineralization of POMNmay increase N availability inagricultural soils and that MBN is a transient, intermediary poolresponsible for N mineralization. The importance of soil microbialbiomass in controlling the transfers between organic and inorganiccompartments was previously shown in the MOMOS N model(Pansu et al., 1998). It should be noted that our results concerningPOMN may be partly due to the method of POM extraction.Nevertheless, studies reported that POMN was the major source ofmineral N while LFOMN may be a sink (Boone, 1994; Whalen et al.,2000; Compton and Boone, 2002). Vanlauwe et al. (1998) also re-ported that 15N present in POMN was highly related (P < 0.001) tocorn (Zea mays L.) N uptake. Results from a field experiment on aclay loam soil in Quebec, Canada indicated that POM is not a strongsink for mineral fertilizer N and that N storage in POM was onlytransient (Nyiraneza et al., 2010). Conversely, Janzen (1987) re-ported that LFOMN was significantly related to N mineralization(r ¼ 0.87) but this fraction may have contained LFOMN and POMNbecause it was collected by a combination of density and sizeseparation. Although the determination of the 15N abundance inWEON was not possible, our results provide support to the con-ceptual model (Fig. 1), which illustrates the possible flow of N fromcrop residues in agricultural soils.
5. Conclusion
Tracing the fate of 15N-labelled faba bean and wheat residuesshowed that after 3 d, most of the 15N was recovered in the POMNfraction. It is likely that the POMN fraction included LFOMN as wellas undecomposed residues. The quantity of crop residue N recov-ered in different pools and the turnover rate were influenced moreby the C/N ratio of the crop residue than by soil properties. The 15Nrecovered in the POMN fraction after 3 d was related to 15Nrecovered in the soil mineral N pool after 112 d. The WEON andMBN appeared to be transient, intermediary pools. Our results areconsistent with the hypothesis that POMN is a key labile SONfraction and its decomposition by soil microorganisms is a majorpathway through which soil mineral N is supplied in agriculturalsoils. Practices that increase POMN concentrations, such as inclu-sion of legumes in crop rotations, should be encouraged to enhanceN availability and soil fertility.
Acknowledgements
Financial support was provided by the Sustainable AgriculturalEnvironment Systems (SAGES) program of Agriculture and Agri-Food Canada. M. St. Luce also received financial support fromCentre SÈVE and its Regroupements stratégiques grant, funded bythe Fonds québécois de la recherche sur la nature et les technolo-gies (FQRNT). We thank Dr. E.G. Gregorich for light fractionextraction, Sylvie Côté, Claude Lévesque and Johanne Tremblay fortechnical assistance and Clarence Gilbertson for isotope analyses.
References
Boone, R.D., 1994. Light-fraction soil organic matter: origin and contribution to netnitrogen mineralization. Soil Biol. Biochem. 26, 1459e1468.
Brookes, P.C., Landman, A., Pruden, G., Jenkinson, D.S., 1985. Chloroform fumigationand the release of soil nitrogen: a rapid direct extraction method to measuremicrobial biomass nitrogen in soil. Soil Biol. Biochem. 17, 837e842.
Brookes, P.C., 2001. The soil microbial biomass: concept, measurement and appli-cations in soil ecosystem research. Microbes Environ. 16, 131e140.
Cabrera, M.L., Beare, M.H., 1993. Alkaline persulfate oxidation for determining totalnitrogen in microbial biomass extracts. Soil Sci. Soc. Am. J. 57, 1007e1012.
Cambardella, C.A., Elliott, E.T., 1992. Particulate soil organic-matter changes across agrassland cultivation sequence. Soil Sci. Soc. Am. J. 56, 777e783.

M. St. Luce et al. / Soil Biology & Biochemistry 68 (2014) 208e218 217
Campbell, C.A., Biederbeck, V.O., Zentner, R.P., Lafond, G.P., 1991. Effect of crop ro-tations and cultural practices on soil organic matter, microbial biomass andrespiration in a thin black Chernozem. Can. J. Soil Sci. 71, 363e376.
Carter, M.R., 2002. Soil quality for sustainable land management: organic matterand aggregation interactions that maintain soil functions. Agron. J. 94, 38e47.
Chantigny, M.H., Angers, D.A., Beauchamp, C.J., 1999a. Aggregation and organicmatter decomposition in soils amended with de-inking paper sludge. Soil Sci.Soc. Am. J. 63, 1214e1221.
Chantigny, M.H., Angers, D.A., Prévost, D., Simard, R.R., Chalifour, F.P., 1999b. Dy-namics of soluble organic C and C mineralization in cultivated soils with varyingN fertilization. Soil Biol. Biochem. 31, 543e550.
Chantigny, M.H., 2003. Dissolved and water-extractable organic matter in soils: areview on the influence of land use and management practices. Geoderma 113,357e380.
Chantigny, M.H., Angers, D.A., Morvan, T., Pomar, C., 2004. Dynamics of pig slurrynitrogen in soil and plant as determined with 15N. Soil Sci. Soc. Am. J. 68, 637e643.
Chantigny, M.H., Angers, D.A., Kaiser, K., Kalbitz, K., 2008. Extraction and charac-terization of dissolved organic matter. In: Carter, M.R., Gregorich, E.G. (Eds.), SoilSampling and Methods of Analysis, second ed. Canadian Society of Soil Sci.ence,CRC Press, Boca Raton, FL, pp. 617e635.
Chivenge, P., Vanlauwe, B., Gentile, R., Six, J., 2011a. Comparison of organic versusmineral resource effects on short-term aggregate carbon and nitrogen dy-namics in a sandy soil versus a fine textured soil. Agric. Ecosyst. Environ. 140,361e371.
Chivenge, P., Vanlauwe, B., Gentile, R., Six, J., 2011b. Organic resource quality in-fluences short-term aggregate dynamics and soil organic carbon and nitrogenaccumulation. Soil Biol. Biochem. 43, 657e666.
Chotte, J.L., Ladd, J.N., Amato, M., 1998. Sites of microbial assimilation, and turnoverof soluble and particulate 14C-labelled substrates decomposing in a clay soil.Soil Biol. Biochem. 30, 205e218.
Clark, K., Chantigny, M.H., Angers, D.A., Rochette, P., Parent, L.E., 2009. Nitrogentransformations in cold and frozen agricultural soils following organicamendments. Soil Biol. Biochem. 41, 348e356.
Colman, B.P., Schimel, J.P., 2013. Drivers of microbial respiration and net N miner-alization at the continental scale. Soil Biol. Biochem. 60, 65e76.
Compton, J.E., Boone, R.D., 2002. Soil nitrogen transformations and the role of lightfraction organic matter in forest soils. Soil Biol. Biochem. 34, 933e943.
Cookson, W.R., Abaye, D.A., Marschner, P., Murphy, D.V., Stockdale, E.A.,Goulding, K.W.T., 2005. The contribution of soil organic matter fractions tocarbon and nitrogen mineralization and microbial community size and struc-ture. Soil Biol. Biochem. 37, 1726e1737.
Cookson, W.R., Marschner, P., Clark, I.M., Milton, N., Smirk, M.N., Murphy, D.V.,Osman, M., Stockdale, E.A., Hirsch, P.R., 2006. The influence of season, agricul-tural management, and soil properties on gross nitrogen transformations andbacterial community structure. Aust. J. Soil Res. 44, 453e465.
Fierer, N., Schimel, J.P., 2002. Effects of drying-rewetting frequency on soil carbonand nitrogen transformations. Soil Biol. Biochem. 34, 777e787.
Fierer, N., Schimel, J.P., 2003. A proposed mechanism for the pulse in carbon dioxideproduction commonly observed following the rapid rewetting of a dry soil. SoilSci. Soc. Am. J. 67, 798e805.
Golchin, A., Oades, J.M., Skjemstad, J.O., Clarke, P., 1994. Soil structure and carboncycling. Aust. J. Soil Res. 32, 1043e1068.
Golchin, A., Baldock, J.A., Oades, J.M., 1998. A model linking organic matterdecomposition, chemistry, and aggregate dynamics. In: Lal, R., Kimble, J.M.,Follett, R.F., Stewart, B.A. (Eds.), Soil Processes and the Carbon Cycle. CRC Press,Boca Raton, Fl, pp. 245e266.
Gregorich, E.G., Monreal, C.M., Schnitzer, M., Schulten, H.R., 1996. Transformation ofplant residues into soil organic matter: chemical characterization of plant tis-sue, isolated soil fractions, and whole soils. Soil Sci. 161, 680e693.
Gregorich, E.G., Liang, B.C., Drury, C.F., Mackenzie, A.F., McGill, W.B., 2000. Eluci-dation of the source and turnover of water soluble and microbial biomasscarbon in agricultural soils. Soil Biol. Biochem. 32, 581e587.
Gregorich, E.G., Beare, M.H., McKim, U.F., Skjemstad, J.O., 2006. Chemical and bio-logical characteristics of physically uncomplexed organic matter. Soil Sci. Soc.Am. J. 70, 975e985.
Gregorich, E.G., Beare, M.H., 2008. Physically uncomplexed organic matter. In:Carter, M.R., Gregorich, E.G. (Eds.), Soil Sampling and Methods of Analysis,second ed. Canadian Society of Soil Sci.ence, CRC Press, Boca Raton, FL, pp. 607e616.
Griffin, T.S., Honeycutt, C.W., He, Z., 2002. Effects of temperature, soil water status,and soil type on swine slurry nitrogen transformations. Biol. Fertil. Soils 36,442e446.
Gul, S., Whalen, J.K., Ellis, B.E., Grayston, S.J., 2012. Plant residue chemistry impactssoil processes and microbial community structure: a study with Arabidopsisthaliana cell wall mutants. Appl. Soil Ecol. 60, 84e91.
Hassink, J., 1994. Effect of soil texture on the size of the microbial biomass and onthe amount of C and N mineralized per unit of microbial biomass in Dutchgrassland soils. Soil Biol. Biochem. 26, 1573e1581.
Herman, D.J., Brooks, P.D., Ashraf, M., Azam, F., Mulvaney, R.L., 1995. Evaluation ofmethods for nitrogen-15 analysis of inorganic nitrogen in soil extracts. II.Diffusion methods. Commun. Soil Sci. Plant Anal. 26, 1675e1685.
Hoyle, F.C., Murphy, D.V., 2011. Influence of organic residues and soil incorporationon temporal measures of microbial biomass and plant available nitrogen. PlantSoil 347, 53e64.
Jackson, L.E., 2000. Fates and losses of nitrogen froma nitrogen-15-labeled cover cropin an intensively managed vegetable system. Soil Sci. Soc. Am. J. 64, 1404e1412.
Janzen, H.H., 1987. Soil organic matter characteristics after long-term cropping tovarious spring wheat rotations. Can. J. Soil Sci. 67, 845e856.
Kölbl, A., von Lützow, M., Kögel-Knabner, I., 2006. Decomposition and distributionof 15N labelled mustard litter (Sinapis alba) in physical soil fractions of a crop-land with high- and low-yield field areas. Soil Biol. Biochem. 38, 3292e3302.
Kumar, K., Goh, K.M., 1999. Crop residues and management practices: effects on soilquality, soil nitrogen dynamics, crop yield, and nitrogen recovery. Adv. Agron.68, 197e319.
Ladd, J.N., Foster, R.C., Nannipieri, P., Oades, J.M., 1996. Soil structure and biologicalactivity. In: Stotzky, G., Bollag, J.M. (Eds.), Soil Biochemistry, vol. 9. MarcelDekker Inc., New York, USA.
Littell, R.C., Henry, P.R., Ammerman, C.B., 1998. Statistical analysis of repeatedmeasures data using SAS procedures. J. Anim. Sci. 76, 1216e1231.
Liu, P., Huang, J., Han, X., Sun, O.J., Zhou, Z., 2006. Differential responses of litterdecomposition to increased soil nutrients and water between two contrastinggrassland plant species of Inner Mongolia, China. Appl. Soil Ecol. 34, 266e275.
Magid, J., Kjærgaard, C., 2001. Recovering decomposing plant residues from theparticulate soil organic matter fraction: size versus density separation. Biol.Fertil. Soils 33, 252e257.
Manzoni, S., Porporato, A., 2009. Soil carbon and nitrogen mineralization: theoryand models across scales. Soil Biol. Biochem. 41, 1355e1379.
Marschner, B., Kalbitz, K., 2003. Controls of bioavailability and biodegradability ofdissolved organic matter in soils. Geoderma 113, 211e235.
Maynard, D.G., Kalra, Y.P., Crumbaugh, J.A., 2008. Nitrate and exchangeableammonium nitrogen. In: Carter, M.R., Gregorich, E.G. (Eds.), Soil Sampling andMethods of Soil Analysis, second ed. Canadian Society of Soil Science, CRC Press,Boca Raton, FL, pp. 71e80.
Murphy, D.V., Macdonald, A.J., Stockdale, E.A., Goulding, K.W.T., Fortune, S.,Gaunt, J.L., Poulton, P.R., Wakefield, J.A., Webster, C.P., Wilmer, W.S., 2000.Soluble organic nitrogen in agricultural soils. Biol. Fertil. Soils 30, 374e387.
Nicolardot, B., Recous, S., Mary, B., 2001. Simulation of C and N mineralisationduring crop residue decomposition: a simple dynamic model based on the C:Nratio of the residues. Plant Soil 228, 83e103.
Nyiraneza, J., Chantigny, M.H., N’Dayegamiye, A., Laverdiere, M.R., 2010. Long-termmanure application and forages reduce nitrogen fertilizer requirements ofsilage corn-cereal cropping systems. Agron. J. 102, 1244e1251.
Pansu, M., Sallih, Z., Bottner, P., 1998. Modelling of soil nitrogen forms after organicamendments under controlled conditions. Soil Biol. Biochem. 30, 19e29.
Pansu, M., Thuriès, L., 2003. Kinetics of C and N mineralization, N immobilizationand N volatilization of organic inputs in soil. Soil Biol. Biochem. 35, 37e48.
Pansu, M., Thuriès, L., Larré-Larrouy, M.C., Bottner, P., 2003. Predicting N trans-formations from organic inputs in soil in relation to incubation time andbiochemical composition. Soil Biol. Biochem. 35, 353e363.
Puri, G., Ashman, M.R., 1998. Relationship between soil microbial biomass and grossN mineralisation. Soil Biol. Biochem. 30, 251e256.
Puttaso, A., Vityakon, P., Saenjan, P., Trelo-ges, V., Cadisch, G., 2011. Relationship be-tween residue quality, decomposition patterns, and soil organic matter accumu-lation in a tropical sandy soil after 13 years. Nutr. Cycl. Agroecosyst. 89, 159e174.
Recous, S., Robin, D., Darwis, D., Mary, B., 1995. Soil inorganic N availability: effecton maize residue decomposition. Soil Biol. Biochem. 27, 1529e1538.
Roychand, P., Marschner, P., 2013. Respiration in a sand amended with clay e effectof residue type and rate. Eur. J. Soil Biol. 58, 19e23.
Schimel, J.P., Hättenschwiler, S., 2007. Nitrogen transfer between decomposingleaves of different N status. Soil Biol. Biochem. 39, 1428e1436.
Scott, N.A., Cole, C.V., Elliott, E.T., Huffman, S.A., 1996. Soil textural control ondecomposition and soil organic matter dynamics. Soil Sci. Soc. Am. J. 60, 1102e1109.
Sharifi, M., Zebarth, B.J., Burton, D.L., Grant, C.A., Porter, G.A., 2008. Organicamendment history and crop rotation effects on soil nitrogen mineralizationpotential and soil nitrogen supply in a potato cropping system. Agron. J. 100,1562e1572.
Six, J., Conant, R.T., Paul, E.A., Paustian, K., 2002. Stabilization mechanisms of soilorganic matter: implications for C-saturation of soils. Plant Soil 241, 155e176.
Six, J., Frey, S.D., Thiet, R.K., Batten, K.M., 2006. Bacterial and fungal contributions tocarbon sequestration in agroecosystems. Soil Sci. Soc. Am. J. 70, 555e569.
Soil Survey Staff, 2006. Keys to Soil Taxonomy, tenth ed. USDA-NRCS,Washington, DC.
Stark, J.M., Hart, S.C., 1996. Diffusion technique for preparing salt solutions, Kjeldahldigests, and persulfate digests for nitrogen-15 analysis. Soil Sci. Soc. Am. J. 60,1846e1855.
Stevens, W.B., Hoeft, R.G., Mulvaney, R.L., 2005. Fate of nitrogen-15 in a long-termnitrogen rate study. Agron. J. 97, 1046e1053.
Thomsen, I.K., Olesen, J.E., Schjønning, P., Jensen, B., Christensen, B.T., 2001. Netmineralization of soil N and 15N-ryegrass residues in differently textured soils ofsimilar mineralogical composition. Soil Biol. Biochem. 33, 277e285.
Thomsen, I.K., Schjønning, P., Olesen, J.E., Christensen, B.T., 2003. C and N turnoverin structurally intact soils of different texture. Soil Biol. Biochem. 35, 765e774.
Trinsoutrot, I., Recous, S., Bentz, B., Linères, M., Chèneby, D., Nicolardot, B., 2000.Biochemical quality of crop residues and carbon and nitrogen mineralizationkinetics under nonlimiting nitrogen conditions. Soil Sci. Soc. Am. J. 64, 918e926.
Vanlauwe, B., Sanginga, N., Merckx, R., 1998. Soil organic matter dynamics afteraddition of nitrogen-15-labeled Leucaena and Dactyladenia residues. Soil Sci.Soc. Am. J. 62, 461e466.

M. St. Luce et al. / Soil Biology & Biochemistry 68 (2014) 208e218218
Voroney, R.P., Brookes, P.C., Beyaert, R.P., 2008. Soil microbial biomass C, N, P, and S.In: Carter, M.R., Gregorich, E.G. (Eds.), Soil Sampling and Methods of SoilAnalysis, second ed. Canadian Society of Soil Sci.ence, CRC Press, Boca Raton, FL,pp. 637e651.
Wander, M., 2004. Soil organic matter fractions and their relevance to soil function.In: Magdoff, F.R., Weil, R.R. (Eds.), Soil Organic Matter in Sustainable Agricul-ture. CRC Press, Boca Raton, FL.
Whalen, J.K., Parmelee, R.W., McCartney, D.A., VanArsdale, J.L., 1999. Movement of Nfrom decomposing earthworm tissue to soil, microbial and plant N pools. SoilBiol. Biochem. 31, 487e492.
Whalen, J.K., Bottomley, P.J., Myrold, D.D., 2000. Carbon and nitrogen mineralizationfrom light- andheavy-fraction additions to soil. Soil Biol. Biochem.32,1345e1352.
Whalen, J.K., Bottomley, P.J., Myrold, D.D., 2001. Short-term nitrogen trans-formations in bulk and root-associated soils under ryegrass. Soil Biol. Biochem.33, 1937e1945.
Wu, J., Brookes, P.C., 2005. The proportional mineralisation of microbial biomassand organic matter caused by air-drying and rewetting of a grassland soil. SoilBiol. Biochem. 37, 507e515.
Yakovchenko, V.P., Sikora, L.J., Millner, P.D., 1998. Carbon and nitrogen mineraliza-tion of added particulate and macroorganic matter. Soil Biol. Biochem. 30,2139e2146.
Yanni, S.F., Whalen, J.K., Simpson, M.J., Janzen, H.H., 2011. Plant lignin and ni-trogen contents control carbon dioxide production and nitrogen minerali-zation in soils incubated with Bt and non-Bt corn residues. Soil Biol.Biochem. 43, 63e69.
Zeller, B., Dambrine, E., 2011. Coarse particulate organic matter is the primarysource of mineral N in the topsoil of three beech forests. Soil Biol. Biochem. 43,542e550.
Zsolnay, Á., 2003. Dissolved organic matter: artefacts, definitions, and functions.Geoderma 113, 187e209.


![Simultaneous and absolute quantification of nucleoside ......9]UTP, 10 μM [15N 5, 13C 10]dATP, 10 μM[15N 5, 13C 10]dGTP, 10 μM [15N 3, 13C 9]dCTP, and 10 μM[15N 2, 13C 10]dTTP)](https://img.pdfslide.us/doc/110x75/6110c5cfc90cfe531510e3b4/simultaneous-and-absolute-quantification-of-nucleoside-9utp-10-m-15n.jpg)