Embed Size (px)
Citation preview

Lab Review
“The Dirty Dozen”

Diffusion & Osmosis

Diffusion & Osmosis
• Description– Dialysis tubing filled with startch-glucose solution
in beaker filled with IKI solution– Potato Cores in Sucrose solutions– Determining solute concentration of different
solutions

Diffusion & Osmosis
• Concepts– Semi-permeable membrane– Diffusion– Osmosis– Solutions• Hypotonic• Hypertonic• Isotonic
– Water Potential

Diffusion & Osmosis
• Conclusions– Water moves from high concentration of water
(hypotonic or high water potential) to low concentration of water (hypertonic or low water potential)
– Solute concentrations, polarity and size of molecule affect movement through semipermeable membrane

Diffusion & OsmosisEssay 1992A lab assistant prepared solution of .8M, .6M, .4M, and .2M sucrose, but
forgot to label them. After realizing the error, the assistant randomly labeled the flasks containing these four unknown solutions as flask A, B, C, and D.
Design an experiment, based on the principles of diffusion and osmosis, that the assistant could use to determine which of the flasks contains each of the four unknown solutions
Include in your answer:a. a description of how you would set up and perform the experimentb. the results you would expect from your experiment; andc. an explanation of those results based on the principles involved.
Be sure to clearly state the principles addressed in your discussion.

Diffusion & OsmosisEssay 2005 B

Try these questions


Enzyme Catalysis• Description of Honors Biology Lab– Measured factors affecting enzyme activity– H2O2 H2O + O2
– Measured rate of O2 production
• Description of AP Biology Lab– Measured factors affecting enzyme activity– Catechol Quinone– Measured rate of light absorbance– Included Hydroquinone and resorsinol (isomers)
Catalase
Clear Polyphenoloxidase Brown

Enzyme Catalysis
• Concepts– Substrate– Enzyme– Denaturation of protein– Competitive inhibition– Allosteric activation (cooperativity) – Experimental design• Reaction rate w/enzyme vs. reaction rate wo/enzyme• Optimum pH or temperature

Enzyme Catalysis
• Conclusions– Enzyme reaction rate is affected by:• pH• Temperature• Substrate concentration• Enzyme concentration• Allosteric reactivity/cooperativity• Competitive inhibition

Enzyme CatalysisEssay question 2000The effects of pH and temperature were studied for an enzyme-catalyzed
reaction. The following results were obtained.
A. How do (1) temperature and (2) pH affect the activity of this enzyme? In your answer, include a discussion of the relationship between the structure and the function of this enzyme, as well as a discussion of how structure and function of enzymes are affected by temperature and pH.
B. Describe a controlled experiment that could have produced the data shown for either temperature or pH. Be sure to state the hypothesis that was tested here.
Enzy
me
Activ
ity
Enzy
me
Activ
ity
Temperature pH

Try these questionsA. Allosteric InhibitionB. Feedback inhibitionC. Competitive inhibitionD. Noncompetitive inhibitionE. Cooperativity
1. Describes inhibition by an enzyme that is capable of either activation or inhibiting a metabolic pathway.
2. A reversible inhibitor that looks similar to the normal substrate and competes for the active site of the enzyme
3. The process by which the binding of the substrate to the enzyme triggers a favorable conformation change which causes similar change in all of the proteins subunits.
4. The process by which a metabolic pathway is shut off by the product it produces
5. Binds to the enzyme at a site other than the active site, causing the enzyme to change shape and be unable to bind substrate.

Try these questions
7. The above graph most accurately depicts the energy changes that take place in which of the following types of reaction?A. hypothermicB. hyperthermicC. endergonicD. exergonicE. free range

Mitosis & Meiosis
• Description– Cell stages of mitosis• Exam slide of onion root tip• Count number of cells in each stage to determine
relative time spent in each stage
– Crossing over in meiosis• Farther gene is from centromere the greater number of
crossovers• Observed crossing over in fungus, Sordaria
– Arrangement of ascospores

Mitosis & Meiosis

Mitosis & Meiosis

Growing on the plates
nTwo Hyphae fuse (plasmogamy)
Sordaria (Ascomycete fungus)
One genetic variability is the color of the ascospores. Wild (dark brown) TanHow the ascospores are arranged in the ascus represents if crossing over has occurred.
Karyogamy
Spores
Meiosis – where crossing over may occur
No crossing over:4:4
Crossing over:2:4:2 or2:2:2:2

You will look at slides of the plates and calculate the percentage of crossover. This can be used to determine map units.

Mitosis & Meiosis
• Conclusions– Mitosis• Cell division
– Growth, repair– Making clones
– Meiosis• Reduction division
– Making gametes– Increasing variation
• Crossing over in Prophase 1

Mitosis & MeiosisEssay 1982 Discuss the process of cell division in animals. Include a description of
mitosis and cytokinesis, and of the other phases of the cell cycle. Do not include meiosis.
Essay 204Meiosis reduces chromosome number and rearranges genetic information.a. explain how the reduction and rearrangement are accomplished in meiosisb. several human disorders occur as a result of defects in the meiotic process. Identify ONE such chromosomal abnormality; what effects does it have on the phenotype of people with the disorder? Describe how this abnormality could result from a defect in meiosis.

Photosynthesis
• Description– Determine rate of photosynthesis under different
conditions• Light vs. dark• Boiled vs. unboiled chloroplasts• Chloroplasts vs. no chloroplasts
– Use DPIP in place of NADP+• DPIPox = blue (NADP+)
• DPIPred= clear (NADPH)
– Measure light transmittance– Paper chromatography to separate plant pigments

Photosynthesis• Concepts– Light reaction– Experimental design• Control vs. Experimental
– Chlorophyll and others• Chlorophyll a• Chlorophyll b• Xanthophylls• Carotenoids

Photosynthesis• Conclusions– Pigments• Pigments move at different rates based on solubility
and mass in the solvent
– Photosynthesis• Light and unboiled
chloroplasts produced highest rate of photosynthesis• Which is the
control?

PhotosynthesisEssay 2004 (part 1) A controlled experiment was conducted to analyze the effects of darkness and boiling
on the photosynthetic rate of incubated chloroplast suspensions. The dye reduction technique was used. Each chloroplast suspension was mixed with DPDP, an electron acceptor that changes from blue to clear when it is reduced. Each sample was placed individually in a spectrophotometer and the percent transmittance was recorded. The three samples used were prepared as follows.
Sample 1 – chloroplast suspension + DPIPSample 2 – chloroplast suspension surrounded by foil wrap to provide a dark
environment + DPIPSample 3 – chloroplast suspension that has been boiled + DPIP
Data are given in the table on the next slidea. construct and label a graph showing the results for the three samplesb. Identify and explain the control or controls for this experimentc. the differences in the curves of the graphed data indicate that there were differences in the number of electrons produced in the three samples during the experiment. Discuss how electrons are generated in photosynthesis and why the three samples gave different transmittance results.

Photosynthesis)Time (min) Light, Unboided
% TransmittanceSample 1
Dark, Unboiled% Transmittance
Sample 2
Light, Boiled%Transmittance
Sample 3
0 28.8 29.2 28.8
5 48.7 30.1 29.2
10 57.8 31.2 29.4
15 62.5 32.4 28.7
20 66.7 31.8 28.5

Cellular Respiration

Cellular Respiration
• Description– Using a CO2 probe to measure the rate of respiration in
crickets at different temperatures• Concepts– Respiration– Endothermic vs. Exothermic– Experimental design
• Conclusions– As temp. decreases, respiration decreases– As germination (of peas) increases, respiration increases

Cellular Respiration
• Germination pea experiment– Set up– Purpose of KOH

Cellular RespirationEssay 1990The results below are measuremnts of culumlative oxygen consumption by germination
and dry seeds. Gas volume measurements were corrected for changes in temperature and pressure
a. Plot the results for the germinating seeds at 22⁰C and 10⁰C.b. Calculate the rate of oxygen consumption for the germinating seeds at 22⁰C, using the
time interval between 10 and 20 minutes.c. Account for the differences in oxygen consumption observed between:
a. Germinating seeds at 22⁰C and at 10⁰Cb. Geminating seeds and dry seeds.
d. Describe the essential features of an experimental apparatus that could be used to measure oxygen consumption by a small organism. Explain why each of these features is necessary.
Cumulative Oxygen Consumed (mL)Time (min) 0 10 20 30 40
Germinating seeds 22⁰C 0.0 8.8 16.0 23.7 32.0
Dry seeds (non germinating) 22⁰C 0.0 0.2 0.1 0.0 0.1
Germinating Seeds 10⁰C 0.0 2.9 6.2 9.4 12.5
Dry seeds (non germinating) 10⁰C 0.0 0.0 0.2 0.1 0.2
Molecular Biology

Molecular Biology
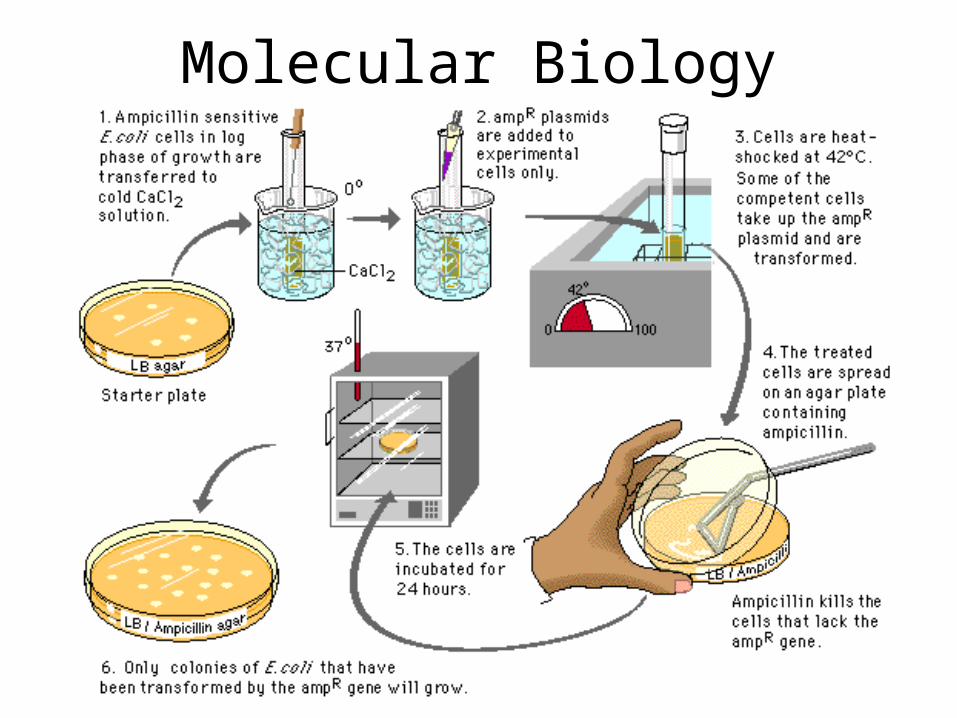
• Description– Transformation• Insert foreign gene in bacteria by
using engineered plasmid• Also insert ampicillin resistant gene on same plasmid as
selectable marker
– Gel Electrophoresis• Cut DNA with restriction enzyme• Fragments separate on gel based
on size

Molecular Biology• Concepts– Transformation– Plasmid– Selectable marker
• Ampicillin resistance
– Restriction Enzyme– Gel Electrophoresis
• DNA is negatively charged• Smaller fragments
travel faster• Correlate distance
traveled with size of fragment

Molecular Biology• Conclusions– Can insert foreign DNA using a vector– Ampicillin becomes selecting agent• No transformation = no growth on amp+ plate

Molecular Biology

Molecular Biology

Try these questions

Try these questions

Try these questions

Try these questions

Try these questions

Try these questions

Try these questions

Genetics Fly Lab
• Description– Given a fly of unknown genotype use crosses to
determine the mode of inheritance of a trait.

Genetics Fly Lab
• Concepts– Phenotype vs. genotype– Dominant vs. recessive– P, F1, F2 generations– Sex-linked– Monohybrid cross– Dihybrid cross– Test cross– Chi-square

Genetics Fly Lab
• Conclusions: Can you solve these?
Case 1
Case 2

Genetics Fly Lab

Genetics Fly Lab

Population Genetics
Size of population & gene pool Random vs. Non-random mating

Population Genetics
• Description– Simulations were used to study effects of different
parameters on frequency of alleles in a population• Selection• Heterozygous advantage• Genetic drift

Population Genetics• Concepts
– Hardy Weinberg equilibrium• P + q = 1• P2 + 2pq + q2 = 1• Required conditions
– Large population– Random mating– No mutations– No natural selection– No migration
– Gene pool– Heterozygous advantage– Genetic drift
• Founder effect• Bottleneck

Population Genetics
• Conclusions– Recessive alleles remain hidden in the pool of
heterozygotes• Even lethal recessive alleles are not completely
removed from population
– Know how to solve H-W problems!• Allele frequencies…solve for p and q• Genotypic frequencies…use p2, 2pq, or q2

Populations Genetics
Essay 1989Do the following with reference to the Hardy-Weinberg model.a. Indicate the conditions under which allele frequencies
remain constant from one generation to the nextb. Calculate, showing all work, the frequencies of the alleles
and frequencies of the genotypes in a population of 100,000 rabbits of which 25,000 are white and 75,000 are agouti. In rabbits the white color is due to a recessive allele, w, and agouti is due to a dominant allele, W.
c. If the homozygous dominant condition were to become lethal, what would happen to the allelic and genotypic frequencies in the rabbit population after two generations?

Transpiration

Transpiration• Description– Test the effects of environmental factors on rate of
transpiration• Temperature• Humidity• Air flow (wind)• Light intensity
OR plants wrapped in plastic wrap, put in the above varying conditions and taking mass over time. Rate at which plant loses mass is equivalent to rate of water loss due to transpiration.
Transpiration
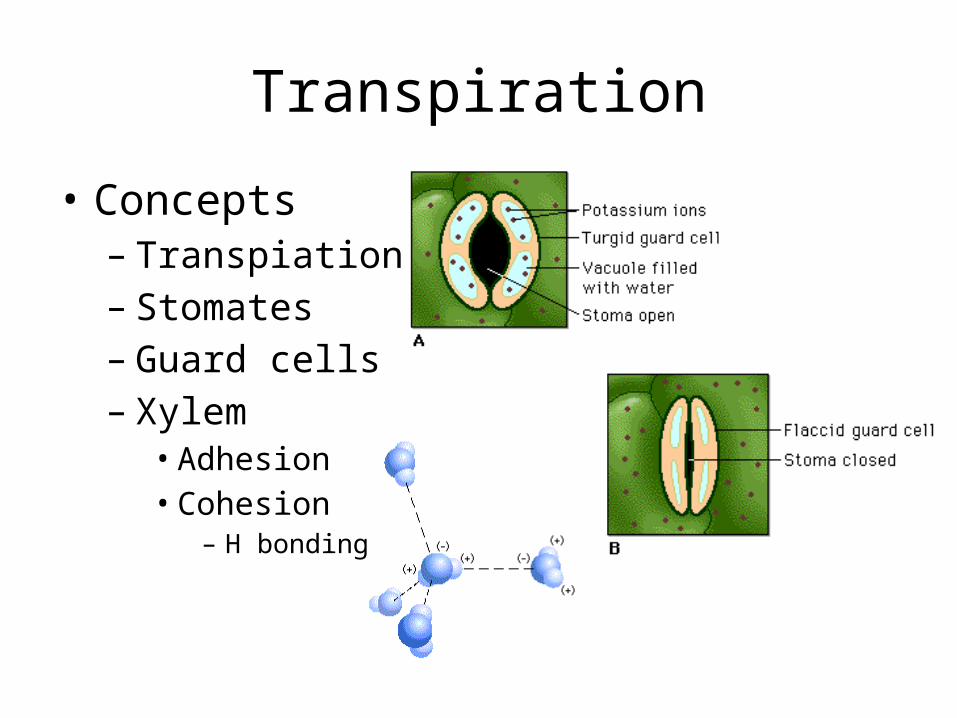
• Concepts– Transpiation– Stomates– Guard cells– Xylem• Adhesion• Cohesion
– H bonding

Transpiration
• Conclusions– Transpiration
– Increase in wind– Increase in light
– Transpiration– Increase in humidity

Transpiration

Circulatory Physiology

Circulatory Physiology
• Description– Study factors that affect heart rate• Body position• Level of activity
– Determine whether an organism in an endotherm or an ectotherm by measuring change in pulse rate as temperature changes• Daphnia• Goldfish

Circulatory Physiology
• Concepts– Themoregulation– Endotherm– Ectotherm– Q10
• Measures increase in metabolic activity resulting from increase in body temperature
• Daphnia can adjust their temperature to the environment, as temperature in environment increases, their body temperature also increases which increases their heart rate

Circulatory Physiology
• Conclusions– Activity increases heart rate• In a fit individual pulse and blood pressure are lower
and will return more quickly to resting condition after exercise than in a less fit individual
– Pulse rate changes in an ectotherm as external temperature changes

Circulatory Physiology

Animal Behavior
Fruit Fly Behavior
Sow bugs

Animal Behavior
• Description– Set up an experiment to study behavior in an
organism• Betta fish agonistic behavior• Drosophila mating behavior• Pillbug/Sowbug kinesis

Animal Behavior
• Concepts– Innate vs. learned behavior– Experimental design
• Control vs. experimental• Hypothesis• Number of trials/subjects
– Choice chamber• Temperature• Humidity• Salinity• Other factors

Animal Behavior
• Hypothesis development– Poor:• I think pillbugs will move toward the wet side of a
choice chamber.
– Better:• If pillbugs prefer a moist environment, then when they
are randomly place on both sides of a wet/dry choice chamber and allowed to move about freely for 10 minutes, then most will be found on the wet side.

Animal Behavior
• Experimental design

Animal Behavior

Animal Behavior

Dissolved Oxygen
• Dissolved O2 availability

Dissolved Oxygen

Dissolved Oxygen
• Description– Measure primary productivity by measuring O2 production
– Factors that affect amount of dissolved O2
• Temperature– As water temp. increases it’s ability to hold O2 decreases
• Photosynthetic activity– In bright light, aquatic plants produce more O2
• Decomposition activity– As organic matter decays, microbial respiration consumes O2
• Mixing and Turbulence– Wave action, waterfalls and rapids aerate water and O2 increases
• Salinity– As water becomes more salty, its ability to hold O2 decreases

Dissolved Oxygen• Concepts– Dissolved Oxygen– Primary productivity• Measured in 3 ways
– Amount of CO2 used– Rate of sugar (biomass) formation– Rate of O2 production
– Net Productivity vs. Gross productivity– Respiration

Dissolved OxygenConclusions

Dissolved Oxygen

Dissolved OxygenEssay 2008

Any Questions?