Embed Size (px)
Citation preview
Lab on a Chip
Publ
ishe
d on
28
Janu
ary
2015
. Dow
nloa
ded
on 1
5/02
/201
5 00
:40:
17.
PAPER View Article OnlineView Journal
This journal is © The Royal Society of Chemistry 2015
Department of Electrical Engineering and Computer Science, Massachusetts
Institute of Technology, 77 Massachusetts Avenue, Room 36-824, Cambridge, USA.
E-mail: [email protected]; Fax: +1 617 258 5846; Tel: +1 617 253 1583
† Electronic supplementary information (ESI) available: Supporting results,materials and methods, ESI Fig. S1–S10. See DOI: 10.1039/c4lc01369g
Cite this: DOI: 10.1039/c4lc01369g
Received 20th November 2014,Accepted 27th January 2015
DOI: 10.1039/c4lc01369g
www.rsc.org/loc
A cell-based sensor of fluid shear stressfor microfluidics†
Sarvesh Varma and Joel Voldman*
Microsystems designed for cell-based studies or applications inherently require fluid handling. Flows within
such systems inevitably generate fluid shear stress (FSS) that may adversely affect cell health. Simple assays
of cell viability, morphology or growth are typically reported to indicate any gross disturbances to cell
physiology. However, no straightforward metric exists to specifically evaluate physiological implications of
FSS within microfluidic devices, or among competing microfluidic technologies. This paper presents the
first genetically encoded cell sensors that fluoresce in a quantitative fashion upon FSS pathway activation.
We picked a widely used cell line (NIH3T3s) and created a transcriptional cell-sensor where fluorescence
turns on when transcription of a relevant FSS-induced protein is initiated. Specifically, we chose Early
Growth Factor-1 (a mechanosensitive protein) upregulation as the node for FSS detection. We verified our
sensor pathway specificity and functionality by noting induced fluorescence in response to chemical induc-
tion of the FSS pathway, seen both through microscopy and flow cytometry. Importantly, we found our cell
sensors to be inducible by a range of FSS intensities and durations, with a limit of detection of 2 dynes
cm−2 when applied for 30 minutes. Additionally, our cell-sensors proved their versatility by showing induc-
tion sensitivity when made to flow through an inertial microfluidic device environment with typical flow
conditions. We anticipate these cell sensors to have wide application in the microsystems community,
allowing the device designer to engineer systems with acceptable FSS, and enabling the end-user to evalu-
ate the impact of FSS upon their assay of interest.
Introduction
Fluid flow is an essential feature of every microsystem involv-ing cell handling, culture or sorting. The particular applica-tion determines the relevant flow rates used in a device.1 Oneway to characterize microfluidic technologies is by virtue oftheir operational flow rate and experimental duration. Thereis a whole gamut of devices which operate at high flow fluidrates for short durations, such as high-throughput cellsorters,2 inertial-force devices3 and droplet-based micro-systems.4 Such devices commonly use non-adherent cells, oradherent cells maintained in suspension, because cells aremeant to have short residence durations within the device. Inanother flow regime, many devices are meant to apply verylow flow rates for long durations. Typical examples of suchmicrofluidic devices are those used for long-term static5 orperfusion cell culture.6,7
Flows inevitably generate fluid shear stress (FSS) that maycause undesirable physiological cell stress. In the ‘short-but-intense’ flow category of devices, cells experience large FSS(~100–1000 s dynes cm−2) for a short duration (milliseconds–seconds). For the other category of ‘prolonged-and-gentle’ flow-based devices, cells experience lower FSS (0.001–10 dynes cm−2)for long durations (~hours–days). Several other microfluidictechnologies fall in between these two extremes, where cellscould experience moderate shear stresses (~10–100 s dynes cm−2)for moderate durations (~minutes–hours). The choice of fluidflow conditions (FSS intensity and duration) may not onlydepend on the device application, but also on the chosen cellphenotype.1 Fluid shear stress may not always be detrimental tocell health because in some cases it is required for beneficialoutcomes such as endothelial cell maintenance.8 Nevertheless,in the context of cell-based microsystems and technologies,shear stress is generally viewed as a stress stimulus.
It is in fact challenging to quantify how intentionallyor unintentionally imparted FSS may affect cell physiology.Cells demonstrate a complex combination of responses towardsexternal stress stimuli. The exact set of cellular decisionsdepends on the bio-chemical and bio-physical cellular environ-ment, the cell type, as well as on the type, intensity, and dura-tion of the applied FSS.9 Often, particle velocity profile or energy
Lab Chip
Lab on a ChipPaper
Publ
ishe
d on
28
Janu
ary
2015
. Dow
nloa
ded
on 1
5/02
/201
5 00
:40:
17.
View Article Online
dissipation rate calculations/measurements are presented tofirst estimate the FSS profile around the cellular micro-environment.10,11 The consequent impact on cell physiologyis typically reported via assessments of calcium uptake,11
protein production,12 gene expression,6,13 morphology,11
proliferation,14 migration,15 cell adhesion16 or viability.17,18
However, there are notable limitations of theseapproaches. Currently reported assays can either be too gen-eral such as in the measurement of calcium signalling,growth rate, adhesion or viability where the results may notdirectly point towards pathology specifically induced byshear. On the other hand, more specific assays of protein orgene expression can be technically difficult and are thereforerarely reported. The underlying challenge is that to achievemolecular specificity, one has to compromise the conve-nience of measurement and also develop sophisticated strate-gies for cell collection, handling and post-processing neededfor standard assays. Furthermore, as there is no current‘standard metric’ for quantifying physiological shear stressin microsystems, the choice of defining and using a relevantassay becomes subjective. Hence, there is currently nostraightforward way to compare platforms to each other forevaluating cell physiology.
To address this challenge, we have developed a methodol-ogy that combines molecular specificity with a simple andconvenient assay. Here we introduce a cell-based sensorintended for use by the microsystems community for evalua-tion of FSS effects on cells. The cell sensor connects appliedstress exposure to shear stress pathway activation, subse-quent gene expression, and finally fluorescence. The sensorallows for a visual and non-destructive assessment of geneexpression through quantitative fluorescence using com-monly available equipment and without requiring additionalreagents, large numbers of cells, or overly sophisticatedmicroscopy. We present the development and characteriza-tion of this cell sensor along with use of the sensor in aninertial microfluidic device.
ResultsChemical induction of the shear-stress pathway
We chose to develop a transcriptional reporter primarilybecause changes in gene expression present a reasonablebalance between molecular specificity and the later down-stream changes in cell physiology that dictate morphology,proliferation and viability. Examining upstream signalling(Ca++, phosphorylation) allows for faster readout but hasless specificity (Ca++) or is more technically challenging(phosphorylation via genetically encoded sensors19). Tominimize assay complexity we chose a visual reporter (assayedvia flow cytometry or microscopy) rather than assaying expres-sion with quantitative RT-PCR (which typically requires off-chipprocessing). This approach also allows for simultaneousmonitoring of other observable parameters under microscopy(such as, cell morphology, proliferation, etc.) that can comple-ment as generic markers of overall cell health.
Lab Chip
Further, rather than develop the reporter in primary endo-thelial cells, which are the common model for studyingFSS,20 we used a common cell line that would be easy formicrosystems engineers to culture and also easy to geneti-cally manipulate. In this work, the shear stress sensor isembedded within NIH3T3 cells, which are mesenchymal cellsthat are known to show a response to FSS.21
Fluid shear causes a complicated mechanotransductionresponse which is highly dependent on its intensity, durationand profile (laminar/turbulent/pulsatile/oscillatory etc.). Tothe best of our knowledge, there is no single pathway or geneknown to be induced exclusively due to fluid shear stress. Wethus first investigated shear pathway activation in NIH3T3sto determine an appropriate node at which to target oursensor. Our goal was to create a sensor that would be sensi-tive to the short-duration shear stresses commonly found inmicrosystems, which could be applicable for high-throughputsorters as well. This motivated the need to specifically focuson genes induced by short-term FSS (min–h duration). Wefurther focused on genes induced by laminar shear stress, aslaminar flows are prevalent in microfluidic environments.With this context, we screened for genes that had animmediate-early response to FSS, as those would capture theFSS induced stress in short term experiments. We thus choseas a gene panel: PDGFA, MCP-1, c-Fos, EGR-1, PDGFB andTF, ICAM-1.22 These genes have known shear stress responseelements within their promoters, suggesting an ability to beupregulated by FSS.23 Representative genes from other stresspathways such as DNA damage and heat shock pathwayswere chosen as p53 and HSF1 in order to assess cross-talkbetween FSS and other cell stress pathways.
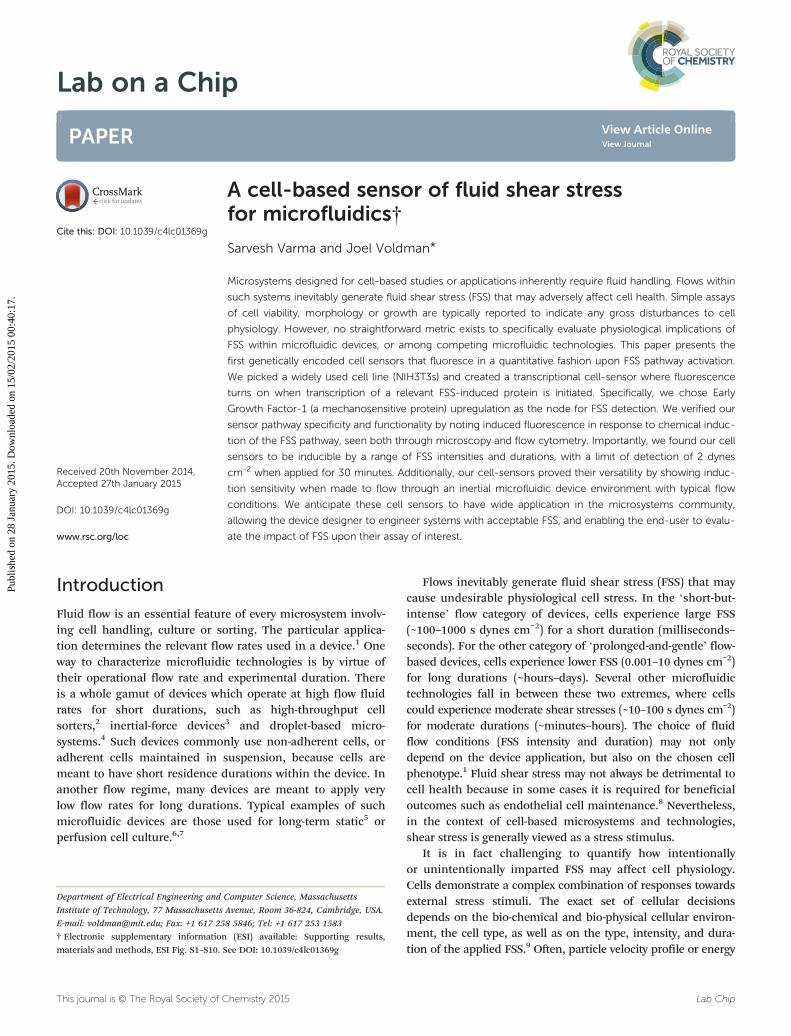
As a convenient chemical surrogate to induce shearstress pathway activation and help determine an appropriatenode to target for our shear sensor, we chose to inducethe PKC-MAPK-ERK pathway, which is part of the shear stressresponse pathway, using the small molecule phorbolmyristate acetate (PMA). It is known that short-term FSSgenerates reactive oxygen species that act upon redox-sensitivesignalling kinase PKC.24 To mimic this mechanism and itsdownstream transcriptional activation, PKC is commonlyactivated through PMA treatment.25–27 Upon PMA treatment,we found that EGR-1 and c-Fos were significantly upregulated(p < 0.05, Fig. 1).
This makes sense because PMA can trigger upregulationof both c-Fos and EGR-1 genes through their commonupstream PKC-ERK pathway.28,29 PMA is also known to triggerEGR-1 replacement of transcription factor SP1 from its bind-ing site in the PDGFA promoter, in a manner similar to themechanism proposed for shear-dependent up-regulation forthat gene.30 We found no significant induction of HSF1 or p53,representative of other cell stress pathways. Complementaryserum-induction experiments, which target immediate-earlypathway induction, also illustrated upregulation of EGR-1 andc-Fos (Fig. S1†).
From these experiments, we chose to target EGR-1 tran-scription for our shear stress sensor. EGR-1 expression can
This journal is © The Royal Society of Chemistry 2015
Fig. 1 Chemical induction of shear pathways in NIH3T3 cells. GAPDH-normalized gene expression of PMA-induced cells after 2 hours ofexposure of PMA at 100 ng ml−1. N = 3 experiments, error bar: standarderror of mean.
Lab on a Chip Paper
Publ
ishe
d on
28
Janu
ary
2015
. Dow
nloa
ded
on 1
5/02
/201
5 00
:40:
17.
View Article Online
occur within minutes,31,32 making it suitable as an immediateinduction sensor. Its sensitivity has been reported in a varietyof cell types experiencing shear stress,33,34 thereby making itspromoter a suitable candidate to report on shear stress, thatalso has applicability to other phenotypes. Also, in contrastto c-Fos, EGR-1 is known to be stimulated with mechanicalinjuries and stresses in endothelial cells.33,34
This journal is © The Royal Society of Chemistry 2015
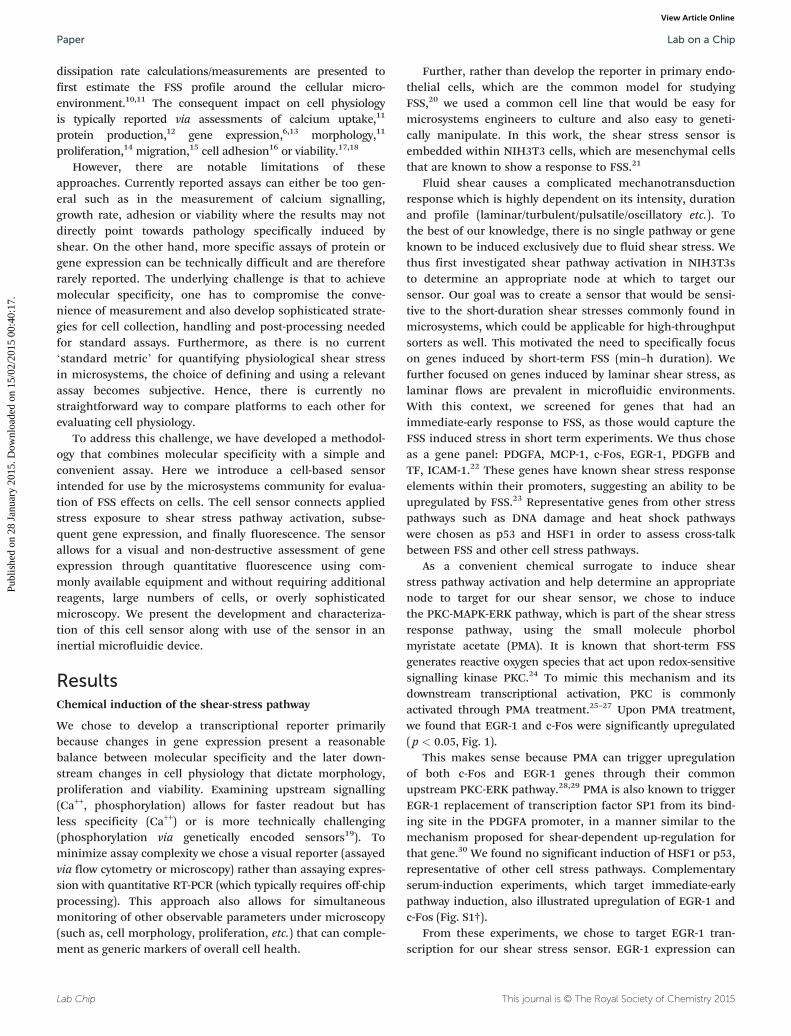
Fig. 2 Validating reporter plasmid functionality in transfected NIH3T3 celshowing the reporter plasmid with TurboRFP under control of the EGR-1introduced into NIH3T3 cells, which will then turn red upon stress. B. ImagPMA exposure. At left are phase + fluorescence overlay images of the cellscence of the population, which increases upon PMA exposure.
Sensor creation
In order to pick the appropriate section of the EGR-1promoter to include in our sensor, we took advantage of priorwork using promoter deletion assays,35 which showed thehighest fold activation (via luciferase reporter assay) with aminimal promoter length of 425 base pairs. Our shear stressreporter plasmid included 527 base pairs of the native murineEGR-1 promoter upstream to its transcription start site. Wechose a red fluorescence protein (RFP) as the inducible fluores-cent protein. Several versions of RFP exist36 and we choseTurboRFP as it had a good combination of being bright andhaving long expression lifetime. The resulting reporter plasmidhad TurboRFP under control of a relevant portion of the induc-ible EGR-1 promoter and a constitutive antibiotic selectionmarker. This reporter plasmid was transfected into NIH3T3cells, which could then be induced to express RFP fluorescenceby an appropriate stressor, such as FSS (Fig. 2A).
As mentioned previously, PMA, a commonly used agonist tomimic short-term FSS, generates reactive oxygen species thatact upon PKC,26 which can then initiate EGR-1 transcription.Therefore, after antibiotic selection we verified plasmid func-tionality by inducing the stably transfected cells with PMA. In
Lab Chip
ls using PMA induction of the FSS pathway. A. Schematic of approach,promoter along with an antibiotic selection marker. The plasmid wases and flow cytometry histograms of transfected cells before and afterand at right are the RFP histograms. The circle shows the mean fluores-
Lab on a ChipPaper
Publ
ishe
d on
28
Janu
ary
2015
. Dow
nloa
ded
on 1
5/02
/201
5 00
:40:
17.
View Article Online
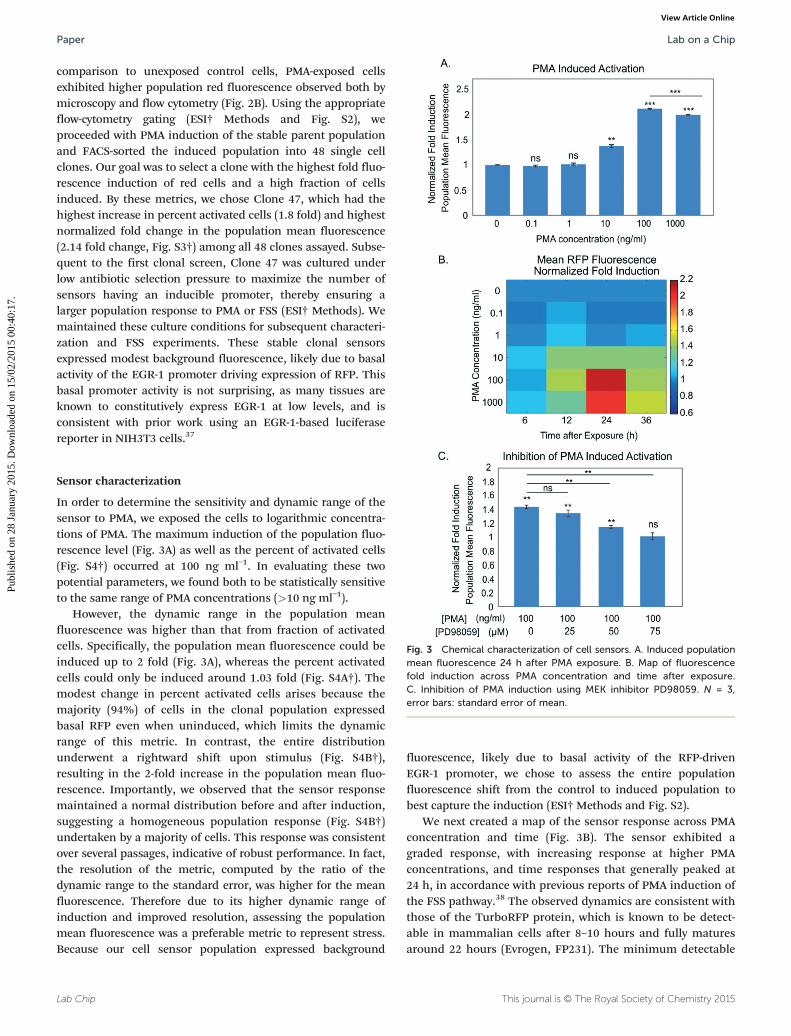
comparison to unexposed control cells, PMA-exposed cellsexhibited higher population red fluorescence observed both bymicroscopy and flow cytometry (Fig. 2B). Using the appropriateflow-cytometry gating (ESI† Methods and Fig. S2), weproceeded with PMA induction of the stable parent populationand FACS-sorted the induced population into 48 single cellclones. Our goal was to select a clone with the highest fold fluo-rescence induction of red cells and a high fraction of cellsinduced. By these metrics, we chose Clone 47, which had thehighest increase in percent activated cells (1.8 fold) and highestnormalized fold change in the population mean fluorescence(2.14 fold change, Fig. S3†) among all 48 clones assayed. Subse-quent to the first clonal screen, Clone 47 was cultured underlow antibiotic selection pressure to maximize the number ofsensors having an inducible promoter, thereby ensuring alarger population response to PMA or FSS (ESI† Methods). Wemaintained these culture conditions for subsequent characteri-zation and FSS experiments. These stable clonal sensorsexpressed modest background fluorescence, likely due to basalactivity of the EGR-1 promoter driving expression of RFP. Thisbasal promoter activity is not surprising, as many tissues areknown to constitutively express EGR-1 at low levels, and isconsistent with prior work using an EGR-1-based luciferasereporter in NIH3T3 cells.37
Fig. 3 Chemical characterization of cell sensors. A. Induced populationmean fluorescence 24 h after PMA exposure. B. Map of fluorescencefold induction across PMA concentration and time after exposure.C. Inhibition of PMA induction using MEK inhibitor PD98059. N = 3,error bars: standard error of mean.
Sensor characterization
In order to determine the sensitivity and dynamic range of thesensor to PMA, we exposed the cells to logarithmic concentra-tions of PMA. The maximum induction of the population fluo-rescence level (Fig. 3A) as well as the percent of activated cells(Fig. S4†) occurred at 100 ng ml−1. In evaluating these twopotential parameters, we found both to be statistically sensitiveto the same range of PMA concentrations (>10 ng ml−1).
However, the dynamic range in the population meanfluorescence was higher than that from fraction of activatedcells. Specifically, the population mean fluorescence could beinduced up to 2 fold (Fig. 3A), whereas the percent activatedcells could only be induced around 1.03 fold (Fig. S4A†). Themodest change in percent activated cells arises because themajority (94%) of cells in the clonal population expressedbasal RFP even when uninduced, which limits the dynamicrange of this metric. In contrast, the entire distributionunderwent a rightward shift upon stimulus (Fig. S4B†),resulting in the 2-fold increase in the population mean fluo-rescence. Importantly, we observed that the sensor responsemaintained a normal distribution before and after induction,suggesting a homogeneous population response (Fig. S4B†)undertaken by a majority of cells. This response was consistentover several passages, indicative of robust performance. In fact,the resolution of the metric, computed by the ratio of thedynamic range to the standard error, was higher for the meanfluorescence. Therefore due to its higher dynamic range ofinduction and improved resolution, assessing the populationmean fluorescence was a preferable metric to represent stress.Because our cell sensor population expressed background
Lab Chip
fluorescence, likely due to basal activity of the RFP-drivenEGR-1 promoter, we chose to assess the entire populationfluorescence shift from the control to induced population tobest capture the induction (ESI† Methods and Fig. S2).
We next created a map of the sensor response across PMAconcentration and time (Fig. 3B). The sensor exhibited agraded response, with increasing response at higher PMAconcentrations, and time responses that generally peaked at24 h, in accordance with previous reports of PMA induction ofthe FSS pathway.38 The observed dynamics are consistent withthose of the TurboRFP protein, which is known to be detect-able in mammalian cells after 8–10 hours and fully maturesaround 22 hours (Evrogen, FP231). The minimum detectable
This journal is © The Royal Society of Chemistry 2015
Lab on a Chip Paper
Publ
ishe
d on
28
Janu
ary
2015
. Dow
nloa
ded
on 1
5/02
/201
5 00
:40:
17.
View Article Online
concentration of PMA was 10 ng ml−1 across all timepoints,with a maximum response to a PMA concentration of100 ng ml−1. Higher concentrations of PMA had lower foldinduction than the 100 ng ml−1 concentration, indicating thatthe maximum effective concentration of PMA is 100 ng ml−1,which we chose for subsequent sensor characterization.
To assess the specificity of our sensor we first verified thatthe sensor is due to the EGR-1 promoter activation. Specifi-cally, we treated untransfected NIH3T3 cells and those trans-fected with a minimal (non-inducible) promoter plasmid withvarying PMA concentrations for 24 h along with the EGR-1sensor. We found no increase in RFP levels due to FSS path-way activation via PMA in either the untransfected cells orcells transfected with the minimal promoter (Fig. S9†). Thus,we concluded that the RFP induction is due to the EGR-1promoter part of the plasmid. To examine sensor specificityto other stress pathways, we intentionally activated the heatshock and DNA damage stress pathways and measured sen-sor response. Specifically, we found that while an FSS agonistinduced RFP expression, small molecule agonists of these otherpathways did not significantly induce the sensor (Fig. S10†).Thus, in the context of stresses commonly encountered inmicrofluidics, the sensor has appropriate specificity.
To assess the specificity of our sensor to PKC-MAPKpathway activation, we used the small-molecule inhibitorPD98059,39,40 which has been shown to abolish shear-dependent induction of EGR-1 by blocking MEK1 activationof ERK1/2 needed for EGR-1 transcription.35 We found thataddition of this inhibitor significantly reduced the inducedfluorescence response in a dose dependent manner, andsignificantly abolished the induction at 75 μM concentration( p < 0.05, Fig. 3C). We also used the small-molecule
This journal is © The Royal Society of Chemistry 2015
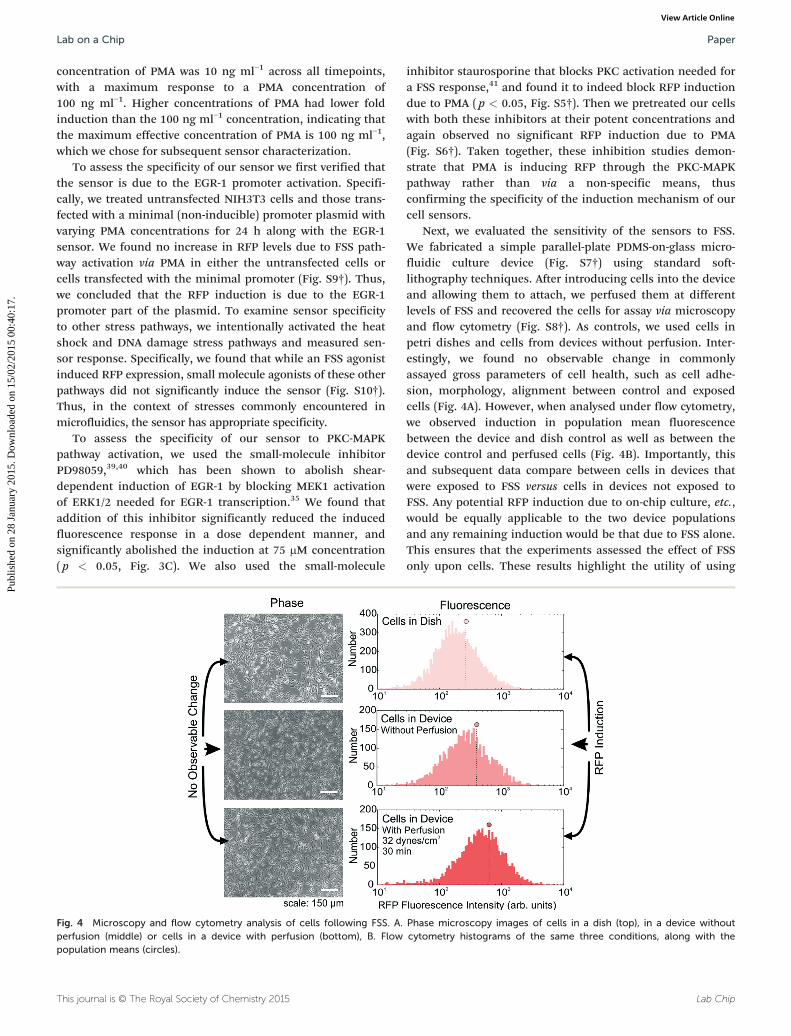
Fig. 4 Microscopy and flow cytometry analysis of cells following FSS. A.perfusion (middle) or cells in a device with perfusion (bottom), B. Flowpopulation means (circles).
inhibitor staurosporine that blocks PKC activation needed fora FSS response,41 and found it to indeed block RFP inductiondue to PMA ( p < 0.05, Fig. S5†). Then we pretreated our cellswith both these inhibitors at their potent concentrations andagain observed no significant RFP induction due to PMA(Fig. S6†). Taken together, these inhibition studies demon-strate that PMA is inducing RFP through the PKC-MAPKpathway rather than via a non-specific means, thusconfirming the specificity of the induction mechanism of ourcell sensors.
Next, we evaluated the sensitivity of the sensors to FSS.We fabricated a simple parallel-plate PDMS-on-glass micro-fluidic culture device (Fig. S7†) using standard soft-lithography techniques. After introducing cells into the deviceand allowing them to attach, we perfused them at differentlevels of FSS and recovered the cells for assay via microscopyand flow cytometry (Fig. S8†). As controls, we used cells inpetri dishes and cells from devices without perfusion. Inter-estingly, we found no observable change in commonlyassayed gross parameters of cell health, such as cell adhe-sion, morphology, alignment between control and exposedcells (Fig. 4A). However, when analysed under flow cytometry,we observed induction in population mean fluorescencebetween the device and dish control as well as between thedevice control and perfused cells (Fig. 4B). Importantly, thisand subsequent data compare between cells in devices thatwere exposed to FSS versus cells in devices not exposed toFSS. Any potential RFP induction due to on-chip culture, etc.,would be equally applicable to the two device populationsand any remaining induction would be that due to FSS alone.This ensures that the experiments assessed the effect of FSSonly upon cells. These results highlight the utility of using
Lab Chip
Phase microscopy images of cells in a dish (top), in a device withoutcytometry histograms of the same three conditions, along with the
Lab on a ChipPaper
Publ
ishe
d on
28
Janu
ary
2015
. Dow
nloa
ded
on 1
5/02
/201
5 00
:40:
17.
View Article Online
cell sensors to assess FSS-induced stress pathway inductionthat may not result in morphological changes.
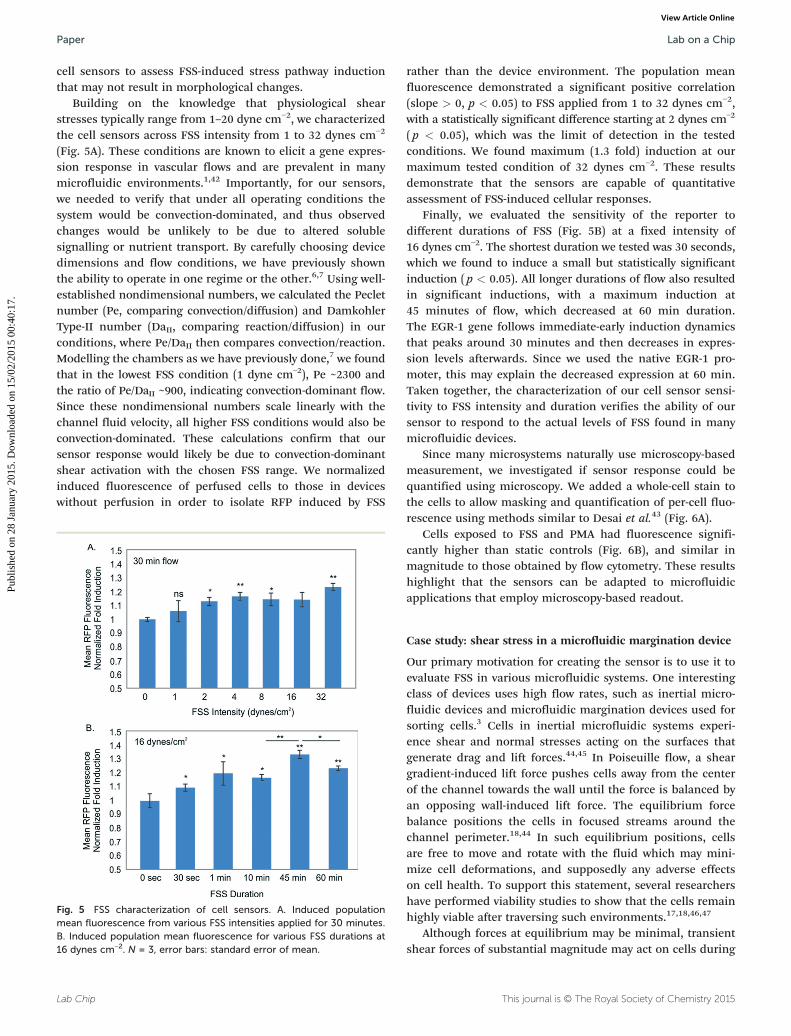
Building on the knowledge that physiological shearstresses typically range from 1–20 dyne cm−2, we characterizedthe cell sensors across FSS intensity from 1 to 32 dynes cm−2
(Fig. 5A). These conditions are known to elicit a gene expres-sion response in vascular flows and are prevalent in manymicrofluidic environments.1,42 Importantly, for our sensors,we needed to verify that under all operating conditions thesystem would be convection-dominated, and thus observedchanges would be unlikely to be due to altered solublesignalling or nutrient transport. By carefully choosing devicedimensions and flow conditions, we have previously shownthe ability to operate in one regime or the other.6,7 Using well-established nondimensional numbers, we calculated the Pecletnumber (Pe, comparing convection/diffusion) and DamkohlerType-II number (DaII, comparing reaction/diffusion) in ourconditions, where Pe/DaII then compares convection/reaction.Modelling the chambers as we have previously done,7 we foundthat in the lowest FSS condition (1 dyne cm−2), Pe ~2300 andthe ratio of Pe/DaII ~900, indicating convection-dominant flow.Since these nondimensional numbers scale linearly with thechannel fluid velocity, all higher FSS conditions would also beconvection-dominated. These calculations confirm that oursensor response would likely be due to convection-dominantshear activation with the chosen FSS range. We normalizedinduced fluorescence of perfused cells to those in deviceswithout perfusion in order to isolate RFP induced by FSS
Lab Chip
Fig. 5 FSS characterization of cell sensors. A. Induced populationmean fluorescence from various FSS intensities applied for 30 minutes.B. Induced population mean fluorescence for various FSS durations at16 dynes cm−2. N = 3, error bars: standard error of mean.
rather than the device environment. The population meanfluorescence demonstrated a significant positive correlation(slope > 0, p < 0.05) to FSS applied from 1 to 32 dynes cm−2,with a statistically significant difference starting at 2 dynes cm−2
( p < 0.05), which was the limit of detection in the testedconditions. We found maximum (1.3 fold) induction at ourmaximum tested condition of 32 dynes cm−2. These resultsdemonstrate that the sensors are capable of quantitativeassessment of FSS-induced cellular responses.
Finally, we evaluated the sensitivity of the reporter todifferent durations of FSS (Fig. 5B) at a fixed intensity of16 dynes cm−2. The shortest duration we tested was 30 seconds,which we found to induce a small but statistically significantinduction (p < 0.05). All longer durations of flow also resultedin significant inductions, with a maximum induction at45 minutes of flow, which decreased at 60 min duration.The EGR-1 gene follows immediate-early induction dynamicsthat peaks around 30 minutes and then decreases in expres-sion levels afterwards. Since we used the native EGR-1 pro-moter, this may explain the decreased expression at 60 min.Taken together, the characterization of our cell sensor sensi-tivity to FSS intensity and duration verifies the ability of oursensor to respond to the actual levels of FSS found in manymicrofluidic devices.
Since many microsystems naturally use microscopy-basedmeasurement, we investigated if sensor response could bequantified using microscopy. We added a whole-cell stain tothe cells to allow masking and quantification of per-cell fluo-rescence using methods similar to Desai et al.43 (Fig. 6A).
Cells exposed to FSS and PMA had fluorescence signifi-cantly higher than static controls (Fig. 6B), and similar inmagnitude to those obtained by flow cytometry. These resultshighlight that the sensors can be adapted to microfluidicapplications that employ microscopy-based readout.
Case study: shear stress in a microfluidic margination device
Our primary motivation for creating the sensor is to use it toevaluate FSS in various microfluidic systems. One interestingclass of devices uses high flow rates, such as inertial micro-fluidic devices and microfluidic margination devices used forsorting cells.3 Cells in inertial microfluidic systems experi-ence shear and normal stresses acting on the surfaces thatgenerate drag and lift forces.44,45 In Poiseuille flow, a sheargradient-induced lift force pushes cells away from the centerof the channel towards the wall until the force is balanced byan opposing wall-induced lift force. The equilibrium forcebalance positions the cells in focused streams around thechannel perimeter.18,44 In such equilibrium positions, cellsare free to move and rotate with the fluid which may mini-mize cell deformations, and supposedly any adverse effectson cell health. To support this statement, several researchershave performed viability studies to show that the cells remainhighly viable after traversing such environments.17,18,46,47
Although forces at equilibrium may be minimal, transientshear forces of substantial magnitude may act on cells during
This journal is © The Royal Society of Chemistry 2015
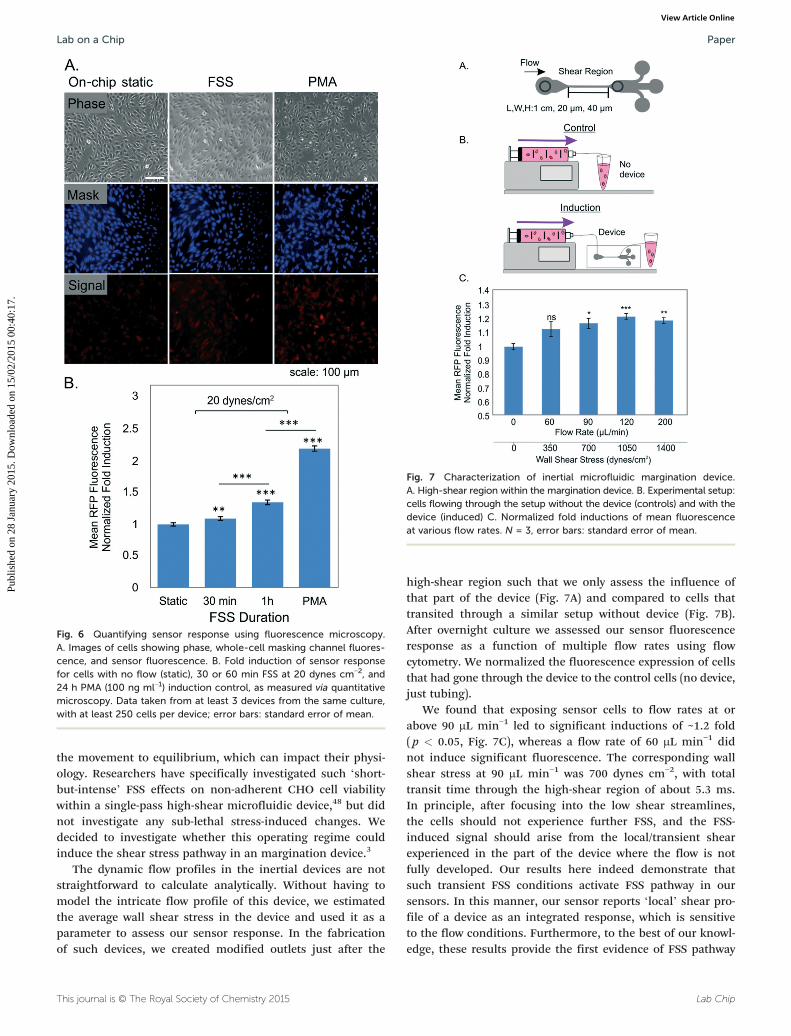
Fig. 6 Quantifying sensor response using fluorescence microscopy.A. Images of cells showing phase, whole-cell masking channel fluores-cence, and sensor fluorescence. B. Fold induction of sensor responsefor cells with no flow (static), 30 or 60 min FSS at 20 dynes cm−2, and24 h PMA (100 ng ml−1) induction control, as measured via quantitativemicroscopy. Data taken from at least 3 devices from the same culture,with at least 250 cells per device; error bars: standard error of mean.
Fig. 7 Characterization of inertial microfluidic margination device.A. High-shear region within the margination device. B. Experimental setup:cells flowing through the setup without the device (controls) and with thedevice (induced) C. Normalized fold inductions of mean fluorescenceat various flow rates. N = 3, error bars: standard error of mean.
Lab on a Chip Paper
Publ
ishe
d on
28
Janu
ary
2015
. Dow
nloa
ded
on 1
5/02
/201
5 00
:40:
17.
View Article Online
the movement to equilibrium, which can impact their physi-ology. Researchers have specifically investigated such ‘short-but-intense’ FSS effects on non-adherent CHO cell viabilitywithin a single-pass high-shear microfluidic device,48 but didnot investigate any sub-lethal stress-induced changes. Wedecided to investigate whether this operating regime couldinduce the shear stress pathway in an margination device.3
The dynamic flow profiles in the inertial devices are notstraightforward to calculate analytically. Without having tomodel the intricate flow profile of this device, we estimatedthe average wall shear stress in the device and used it as aparameter to assess our sensor response. In the fabricationof such devices, we created modified outlets just after the
This journal is © The Royal Society of Chemistry 2015
high-shear region such that we only assess the influence ofthat part of the device (Fig. 7A) and compared to cells thattransited through a similar setup without device (Fig. 7B).After overnight culture we assessed our sensor fluorescenceresponse as a function of multiple flow rates using flowcytometry. We normalized the fluorescence expression of cellsthat had gone through the device to the control cells (no device,just tubing).
We found that exposing sensor cells to flow rates at orabove 90 μL min−1 led to significant inductions of ~1.2 fold( p < 0.05, Fig. 7C), whereas a flow rate of 60 μL min−1 didnot induce significant fluorescence. The corresponding wallshear stress at 90 μL min−1 was 700 dynes cm−2, with totaltransit time through the high-shear region of about 5.3 ms.In principle, after focusing into the low shear streamlines,the cells should not experience further FSS, and the FSS-induced signal should arise from the local/transient shearexperienced in the part of the device where the flow is notfully developed. Our results here indeed demonstrate thatsuch transient FSS conditions activate FSS pathway in oursensors. In this manner, our sensor reports ‘local’ shear pro-file of a device as an integrated response, which is sensitiveto the flow conditions. Furthermore, to the best of our knowl-edge, these results provide the first evidence of FSS pathway
Lab Chip
Lab on a ChipPaper
Publ
ishe
d on
28
Janu
ary
2015
. Dow
nloa
ded
on 1
5/02
/201
5 00
:40:
17.
View Article Online
activation within an inertial microfluidic device. Additionally,these results suggests that the cell sensors, though developedin an adherent cell line, can be used to characterize acute FSSwhile being used in a non-adherent ‘flow-through’ fashion.
Discussion
In this paper we present a genetically encoded live-cell sensorthat provides information on shear-stress pathway activationvia expression of fluorescence. This ability eliminates theneed for disruptive cellular processing and does not requireany additional reagents for fluorescence assessment. Thissensor provides a convenient alternative to techniques requiringto study global gene expression via sequencing or DNA micro-arrays to assess cell physiology,13 and also offers an extra, morespecific, dimension of information about cell heath alongsidecommon live-cell measurements of morphology, growth rateand viability that are typically performed in evaluating micro-technologies for their impact on cell health.
One of the main contributions here is the successfuldevelopment of the first cell-based shear-stress sensor basedon quantitative fluorescence. Our transcriptional sensor isbased on immediate-early gene expression that retains speci-ficity to FSS-pathway activation and also maintains sensitivityto short-term FSS in microsystems. Choosing a transcriptionalsensor presents a balance between specificity and dynamics.For example, a sensor targeting upstream signaling (calciumactivation, phosphorylation, etc.) would allow for almostimmediate readout, but have even lower specificity and, mayrequire more elaborate instrumentation (ratiometric imaging)that is not common in the user community. Alternatively,events further downstream such as cell alignment to flow mayrequire continual exposure to FSS, which limits the use spaceof the sensor. Immediate-early genes activation represents abalance between specificity, experimental complexity, andtemporal response.49
Any transcriptional sensor based on a single node will havelimited specificity. For example, many shear-responsive genesare downstream of MAP kinase activation,50 for example EGR-1is downstream of MEK-ERK1/2, c-fos is downstream of MEKK-JNK and KLF2 is downstream of MEK5/ERK5.51 Therefore ago-nists that activate common upstream pathways (such as mito-gens, inflammatory cytokines and reactive oxygen species)could also induce the shear-responsive genes through commonupstream pathways. We performed experiments examiningcommon cross-reactivity (Fig. S10†) and did not find substan-tial reaction to DNA damage and heat shock. However, it ispossible that other stressors that upregulate EGR-1 transcrip-tion, or its upstream events in a manner similar to FSS, couldinduce our sensor. Thus, proper usage of the sensor in turnrequires a specific context, such as comparison of conditionswhere only FSS is the varying stimulus (e.g., Fig. 4B, 5A, B).
In the context of EGR-1 based shear inductions, prior effortshave been made on constructing transiently transfected HeLacells which increase luciferase activity upon shear. Specifically,Schwachtgen and others reported normalized luciferase
Lab Chip
inductions of 4.5–6 luciferase fold over a comparable rangeand duration of shear stress. However they noted a largevariance in expression levels,35 and only transiently infectedthe plasmid in the cells. Use of a stable cell line can allowfor nearly infinite propagation and therefore, the ability tomaintain shear stress sensitivity. Additionally, embeddingthe sensor into NIH3T3 cells strikes a balance as the cellsare neither cancerous (and thus would have dramaticallyaltered physiology) nor a primary cell line (which cannottypically be propagated in culture and is difficult to geneticallyengineer). Also, successful fluorescence induction and itscorrelation to applied chemical or FSS stimuli, along withinhibition experiments, validated the specificity and sensingability of our cells.
In terms of their performance, our cell sensors were ableto reveal subtle FSS-induced physiological stress throughtheir fluorescence expression. For example, the FSS character-ization in the laminar-flow device (Fig. 4) is an example ofapplying shear stress that does not result in gross morpho-logical changes in the cells, but still activates the shear-stresspathway, resulting in quantitative fluorescence changes. Theability to uncover subtle but significant FSS-induced stresspathway activation with a convenient assay illustrates the util-ity of our cell sensors.
Our sensor response to FSS is in coherence to what hasbeen reported in literature.38 With half-hour flows, our sensorscan detect FSS as low as 2 dynes cm−2, with maximal responseat 32 dynes cm−2, which was the highest tested condition. How-ever, since our sensors integrate the FSS response to a givenintensity over the applied duration, their sensitivity, operatingrange, and limit of detection is contingent upon the overallflow exposure in a particular device environment. Moving for-ward, one possible approach to enhance the sensor sensitivitywould be through optimizing inducible promoter region. It isimportant to note that shear stress pathways are complicatedand the complex interplay of between shear stress responseelements in shear sensitive gene promoters has not been fullyelucidated.52 However we anticipate that careful constructionof the promoter using a concoction of shear inducible elementscould develop the sensitivity for finer resolution sensing ofshear induced pathway activation.
To extend the applicability of our sensor, we were inter-ested in characterizing its response to scenarios where cellsare used in a flow-through fashion, instead of being used inadherent culture. As an example of a use case for the sensor,we examined whether a common inertial microfluidic devicewould cause FSS-induced fluorescence induction (Fig. 7).Although cells in these devices may transiently experiencehigh shear before equilibrating into low-shear streamlines,45
such effects have not been previously explored and may notbe significant enough to affect viability, which is a typicalassay performed to investigate cell health in inertial micro-fluidic devices.18,46,47 Such sub-lethal FSS-induced effects are ofhigh relevance to overall cell health. For instance, sub-lethalFSS is known to induce numerous changes in intracellularmolecular and pathway activation in adherent endothelial
This journal is © The Royal Society of Chemistry 2015
Lab on a Chip Paper
Publ
ishe
d on
28
Janu
ary
2015
. Dow
nloa
ded
on 1
5/02
/201
5 00
:40:
17.
View Article Online
cells,53 and is also reported to affect protein production, signal-ling pathways, glycosylation and cell membrane integrity of avariety of non-adherent cells.54 In spite of its importance,there is minimal knowledge on the sub-lethal high FSS expe-rienced in inertial microfluidics and therefore, its relevanceon cell health. Our finding that ‘short-but-intense’ FSS canindeed induce FSS pathway activation is the first evidence ofsuch FSS-induced stress pathway activation in inertial micro-fluidic devices.
We have distributed the reporter plasmid in Addgene forusers wishing to create the sensor in different backgroundcells, and will provide the cells upon request to interestedusers. We anticipate potential users to culture our cell-sensors in their microenvironments and devices to evaluatethe physiological impact of their operational procedures. Forexample, reference cell population fluorescence levels couldbe established based on cell culture and handling protocolsand would be used as a control for the post-experimentalfluorescence levels. If the cells could be recovered from thedevice in adequate numbers (1000s), they could be culturedand assessed using flow cytometry (as done for Fig. 7). Alter-natively, smaller numbers of cells (100s) could be imaged ina device to attain a quantitative response to the FSS condi-tions (as done for Fig. 6). It should be noted however, thatthe exact number of cells required in establishing signifi-cance of results would depend not only on the statisticalmethodology used, but also on the experimental context,systematic error of the assay, and biological variance (see ESI†note for details). Hence, it would be recommended to estab-lish an understanding of the variance arising from all suchfactors while using our sensors. While a particular fluores-cence level may not necessarily be absolutely good or bad, therelative levels between the control and post-experimental statewould give users an idea about potentially stressful operatingconditions. Mapping our cell sensor response to a varietyof device operating conditions will then allow microfluidicengineers to design and compare platforms for desirable cellphysiological states.
Conclusions
Cell handling, culturing and processing requires fluidic flowswithin microsystems that inevitably generate shear stress andpotentially harm cells. We have created an EGR-1 based cell-sensor that fluoresces in response to shear stress as a way toassess the physiological impact of FSS within microfluidicsusing quantifiable fluorescence in a simple, reagent-freeassay. We assayed the performance of the sensor using chem-ical induction of the shear pathway (verifying functionality),and also by perfusion at various FSS conditions (verifyingshear sensitivity). Additionally, we demonstrated its applica-bility for both long-term (~h) and short-term (~ms) shear-induced activation in a variety of microsystems. In particular,the sensor cells were inducible in the high flows found in amicrofluidic margination device, illustrating the utility of thetechnology.
This journal is © The Royal Society of Chemistry 2015
Materials and methodsCell culture
NIH3T3 cells were expanded from a continuing cell stock in ourlaboratory, with the parental cell line originating from ATCCcell bank (ATCC® CRL-1658™). The culture conditions weremaintained according to the proposed ATCC protocol. The cellculture media ATCC-formulated Dulbecco's Modified Eagle'sMedium, with high glucose content (Life Technologies, no.30-2002) was supplemented with bovine calf serum (10% v/v),L-glutamine (2% v/v) and penicillin-streptomycin (1% v/v).
Cell line construction
The promoter region was chosen as 527 base-pairs upstreamof the transcription start site of the native murine EGR-1 pro-moter (GeneBank ID: NM_007913.5). Using this sequence, anEGR1-pTurboRFP plasmid was synthesized by Genewiz Inc.,and deposited in Addgene (52306). Cells were transfectedwith the recommended protocol of NIH3T3 cells, using theSuperfect transfection reagent (Qiagen, 301305). Constitutivelyexpressing RFP plasmid (Evrogen, FP231) was used as apositive control, and untransfected cells as a selection control.Transfected cells were incubated overnight and then exposedto antibiotic selection (G-418) at 1 mg mL−1 for 7 days. Clonalscreening was performed with the first culture of each singlecell clone which had not been expanded under antibioticselection, in order to assist in clonal growth. This chosenclonal population was subsequently cultured under low anti-biotic selection (G-418 at 200 μg ml−1) to maintain sensorfunctionality.
Chemical inductions
For PKC-MAPK induction of NIH3T3s, cells were seeded in12-well plates to reach 80% confluence over 24 hours. Theywere exposed for 2 h, following by washing with regularculture media. Cells were lysed immediately for qRT-PCR. Forcomparing clones of the parent population, clones wereserum starved using serum free media (0.15% serum) andtreated with regular media with PMA at 100 ng ml−1 for 24 hbefore flow cytometry analysis. Chemical induction and char-acterization of the chosen clone was performed by incubationwith respective concentrations of PMA (diluted with media)for 24 h, with control cells incubated with media alone. Forcross-sensitivity analysis cells were exposed to 4 h of methyl-methanosulfate (for DNA damage) in serum free media forvarious concentrations, with controls treated with serum freemedia for 4 h only. Cells were treated with varying concentra-tions of sodium arsenite in normal cell culture medium for30 minutes to activate heat shock pathway.
MEK and PKC inhibition
Cells were seeded overnight in culture dishes in regular culturemedia. The media was then replaced with the respective con-centrations of PD98059 (Sigma Aldrich, P215), or staurosporine(Sigma Aldrich, 62996-74-1) for 30 min. The supernatant was
Lab Chip
Lab on a ChipPaper
Publ
ishe
d on
28
Janu
ary
2015
. Dow
nloa
ded
on 1
5/02
/201
5 00
:40:
17.
View Article Online
then replaced without washing cells, to media containing PMAat 100 ng ml−1. The cells were in this condition for 1 h beforethe cells were washed with media and then incubated with thesame overnight prior to flow cytometry analysis. Cells treatedwith inhibitors and PMA were compared to populationsinduced with PMA only.
Quantitative RT-PCR
Cellular mRNA was extracted from the collected lysate usingQiagen RNeasy Micro kit (catalog #: 74004) using itsrecommended protocol. 1 μg mRNA was measured for conver-sion to cDNA using random hexamer primers (DyNAmo cDNAsynthesis kit, Thermo Scientific, F-470L). We performed real-time qPCR (Bio Rad CFX96) using the Bio-Rad iQ SYBR GreenSupermix (170-8882) according to the recommended protocol.Gene expression profiles were quantified and normalizedrelative to GAPDH expression using its standard curve. SeeESI Methods† for the PCR primers.
Microfluidic device fabrication and operation
The microfluidic culture devices were cast in PDMS from amold (Fineline Inc.). Each device consisted of 8 chambers(20 mm length × 2.5 mm width × 0.15 mm height, ESI†Fig. S7). Each device was plasma-bonded to a borosilicateglass slide. Subsequently, a 5% APTES solution (Sigma Aldrich,440140) in pure ethanol was introduced for 5 min and rinsed5× with pure ethanol and 10× with DI water. A 6% aqueoussolution of glutaraldehyde (Sigma Aldrich G5882) was intro-duced for 5 min and rinsed 10× with water. A 0.1% aqueousgelatin solution was introduced for 30 min and subsequently,cell culture media was introduced into each chamber to primethe device. The entire disconnected device was stored in a cellculture incubator for 16–24 h to equilibrate the device withmedia constituents and the cell culture environment. Cells insuspension (5 × 10⁶ cells ml−1) in media were introduced intoeach chamber. The device with cells was placed in an incubatorfor 24 h.
For perfusions, chambers experiencing flow wereconnected to media containing syringes mounted on asyringe pump. Reference controls consisted of cells in devicesexperiencing no flow and static controls consisted of cells inculture dishes. For characterizing sensitivity to FSS intensity,30 min perfusions were performed (Fig. 5A). For characteriz-ing sensitivity to FSS durations, 16 dynes cm−2 of FSS wasapplied within devices (Fig. 5B). Following perfusion, TrypleSelect 10× (Life Technologies, A12177-01) was used to removecells. The recovered cells were then transferred to 12-wellculture plate with culture media for overnight culture prior toflow cytometry analysis.
For the inertial microfluidic device, cells in suspension(5 × 10⁴ cells ml−1) were used either for direct collection fromsyringe pump as control, or through the device under variousflow rates. Total volume collected was approximately 1 ml ineach case. Recovered cells were cultured overnight prior toflow cytometry analysis on the following day.
Lab Chip
FSS calculations
We assumed that cells in the culture devices experience thewall shear stress in a parallel plate flow chamber according
to FSS 6 2Qh w
, where η is the DMEM viscosity (0.84 Pa s at
37 °C), Q is the volumetric flowrate, h is the channel height,and w is the channel width.
Quantitative imaging analysis
Cells were seeded and perfused in devices accordingly toFig. 6, with some treated with PMA (100 ng ml−1, 24 h)on-chip. After 24 h, all cells were stained with Cell TrackerBlue (Life Technologies, C2110) according to manufacturer'sprotocols for 15 min. Devices channels were washed twicewith PBS and cells were imaged using blue and red fluores-cence channels. The blue channel was thresholded to createa binary mask and the red intensity was quantified withineach cell area after background subtraction.
Flow cytometry
Cells were analyzed using BD LSR II HTS flow cytometerusing PE-TexasRed-YG-A filter (ex: 561 nm, em: 610 nm,BW: 20 nm) with a FITC reference (ex: 488 nm, em: 530 nm,BW: 30 nm). The mean RFP fluorescence of the positivepopulation was divided by that of the uninduced populationand was termed as the normalized fold RFP induction (ESI†Methods and Fig. S2).
Statistical analysis
Student's unpaired t-test was used to compare three indepen-dent induction conditions to independent controls. For FSSdata, we performed ANOVA tests among the biological anddevice replicates of each condition and found no statisticaldifference among them and found statistical differences ofthe same against static controls. To validate positive correla-tion (increase in signal with increasing FSS) we performedlinear regression analysis and found the slope to be positiveand statistically significant ( p < 0.05). For all analysis:*: p-value <0.05; **: p-value <0.01 ***: p-value <0.001.
Acknowledgements
This work was supported by the NIH (GM090194). We wouldlike to thank staff of The Swanson Biotechnology Center FlowCytometry Facility at MIT for their technical advice regardingflow cytometry. We would also like to acknowledge Dr. Yi-ChinToh, Dr. Catherine T. Lo and Dr. Anna Fendyur for their insight-ful discussions. Lastly, we would like to thank Dr. Han-Wei Houand Prof. Jongyoon Han for providing the mold for the inertialmicrofluidic device case study and for their discussions.
Notes and references
1 L. Kim, Y. C. Toh, J. Voldman and H. Yu, Lab Chip, 2007, 7,
681–694.This journal is © The Royal Society of Chemistry 2015
Lab on a Chip Paper
Publ
ishe
d on
28
Janu
ary
2015
. Dow
nloa
ded
on 1
5/02
/201
5 00
:40:
17.
View Article Online
2 N. Xia, T. P. Hunt, B. T. Mayers, E. Alsberg,
G. M. Whitesides, R. M. Westervelt and D. E. Ingber, Biomed.Microdevices, 2006, 8, 299–308.3 H. Wei Hou, H. Y. Gan, A. A. Bhagat, L. D. Li, C. T. Lim and
J. Han, Biomicrofluidics, 2012, 6, 24115–2411513.4 L. Wu, P. Chen, Y. Dong, X. Feng and B. F. Liu, Biomed.
Microdevices, 2013, 15, 553–560.5 T. Honegger, M. A. Scott, M. F. Yanik and J. Voldman, Lab
Chip, 2013, 13, 589–598.6 Y. C. Toh and J. Voldman, FASEB J., 2011, 25, 1208–1217.
7 L. M. Przybyla and J. Voldman, Proc. Natl. Acad. Sci. U. S. A.,2012, 109, 835–840.8 J. N. Topper and M. A. Gimbrone Jr., Mol. Med. Today,
1999, 5, 40–46.9 P. F. Davies, Physiol. Rev., 1995, 75, 519–560.
10 J. V. Green, T. Kniazeva, M. Abedi, D. S. Sokhey,
M. E. Taslim and S. K. Murthy, Lab Chip, 2009, 9, 677–685.11 J. Wang, J. Heo and S. Z. Hua, Lab Chip, 2010, 10, 235–239.
12 L. Chau, M. Doran and J. Cooper-White, Lab Chip, 2009, 9,1897–1902.13 S. C. Hur, N. K. Henderson-MacLennan, E. R. McCabe and
D. Di Carlo, Lab Chip, 2011, 11, 912–920.14 L. Kim, M. D. Vahey, H. Y. Lee and J. Voldman, Lab Chip,
2006, 6, 394–406.15 E. Gutierrez, B. G. Petrich, S. J. Shattil, M. H. Ginsberg,
A. Groisman and A. Kasirer-Friede, Lab Chip, 2008, 8,1486–1495.
16 J. Y. Park, S. J. Yoo, C. M. Hwang and S. H. Lee, Lab Chip,
2009, 9, 2194–2202.17 J. F. Edd, D. Di Carlo, K. J. Humphry, S. Koster, D. Irimia,
D. A. Weitz and M. Toner, Lab Chip, 2008, 8, 1262–1264.18 S. S. Kuntaegowdanahalli, A. A. Bhagat, G. Kumar and
I. Papautsky, Lab Chip, 2009, 9, 2973–2980.19 C. D. Harvey, A. G. Ehrhardt, C. Cellurale, H. Zhong,
R. Yasuda, R. J. Davis and K. Svoboda, Proc. Natl. Acad. Sci.U. S. A., 2008, 105, 19264–19269.20 T. Minami and W. C. Aird, Trends Cardiovasc. Med.,
2005, 15, 174–184.21 J. Y. Ji, H. Jing and S. L. Diamond, Circ. Res., 2003, 92,
279–285.22 M. Braddock, J. L. Schwachtgen, P. Houston, M. C. Dickson,
M. J. Lee and C. J. Campbell, News Physiol. Sci., 1998, 13,241–246.23 N. Resnick, H. Yahav, L. M. Khachigian, T. Collins,
K. R. Anderson, F. C. Dewey and M. A. Gimbrone Jr., Adv.Exp. Med. Biol., 1997, 430, 155–164.24 H. L. Matlung, E. N. Bakker and E. VanBavel, Antioxid. Redox
Signaling, 2009, 11, 1699–1709.25 J. J. Chiu, B. S. Wung, J. Y. Shyy, H. J. Hsieh and D. L. Wang,
Arterioscler., Thromb., Vasc. Biol., 1997, 17, 3570–3577.26 L. K. Tai, M. Okuda, J. Abe, C. Yan and B. C. Berk,
Arterioscler., Thromb., Vasc. Biol., 2002, 22, 1790–1796.27 T. Matsubara and M. Ziff, J. Cell. Physiol., 1986, 127,
207–210.28 B. K. Dieckgraefe and D. M. Weems, Am. J. Physiol.,
1999, 276, G322–330.This journal is © The Royal Society of Chemistry 2015
29 R. Janknecht, M. A. Cahill and A. Nordheim, Carcinogenesis,
1995, 16, 443–450.30 L. M. Khachigian, A. J. Williams and T. Collins, J. Biol.
Chem., 1995, 270, 27679–27686.31 R. Treisman, Trends Biochem. Sci., 1992, 17, 423–426.
32 V. P. Sukhatme, X. M. Cao, L. C. Chang, C. H. Tsai-Morris,D. Stamenkovich, P. C. Ferreira, D. R. Cohen, S. A. Edwards,T. B. Shows and T. Curran, et al., Cell, 1988, 53, 37–43.
33 S. F. Yan, D. J. Pinsky, N. Mackman and D. M. Stern, J. Clin.
Invest., 2000, 105, 553–554.34 T. A. McCaffrey, C. Fu, B. Du, S. Eksinar, K. C. Kent, H. Bush
Jr., K. Kreiger, T. Rosengart, M. I. Cybulsky, E. S. Silvermanand T. Collins, J. Clin. Invest., 2000, 105, 653–662.35 J. L. Schwachtgen, P. Houston, C. Campbell, V. Sukhatme
and M. Braddock, J. Clin. Invest., 1998, 101, 2540–2549.36 D. Shcherbo, E. M. Merzlyak, T. V. Chepurnykh,
A. F. Fradkov, G. V. Ermakova, E. A. Solovieva,K. A. Lukyanov, E. A. Bogdanova, A. G. Zaraisky, S. Lukyanovand D. M. Chudakov, Nat. Methods, 2007, 4, 741–746.37 S. Bhattacharyya, S. J. Chen, M. Wu, M. Warner-
Blankenship, H. Ning, G. Lakos, Y. Mori, E. Chang,C. Nihijima, K. Takehara, C. Feghali-Bostwick and J. Varga,Am. J. Pathol., 2008, 173, 1085–1099.38 J. J. Chiu, B. S. Wung, H. J. Hsieh, L. W. Lo and D. L. Wang,
Circ. Res., 1999, 85, 238–246.39 C. Hodge, J. Liao, M. Stofega, K. Guan, C. Carter-Su and
J. Schwartz, J. Biol. Chem., 1998, 273, 31327–31336.40 R. Datta, E. Rubin, V. Sukhatme, S. Qureshi, D. Hallahan,
R. R. Weichselbaum and D. W. Kufe, Proc. Natl. Acad. Sci.U. S. A., 1992, 89, 10149–10153.41 T. Morita, H. Kurihara, K. Maemura, M. Yoshizumi, R. Nagai
and Y. Yazaki, Circ. Res., 1994, 75, 630–636.42 W. Zheng, Y. Xie, W. Zhang, D. Wang, W. Ma, Z. Wang and
X. Jiang, Integr. Biol., 2012, 4, 1102–1111.43 S. P. Desai and J. Voldman, Integr. Biol., 2011, 3, 48–56.
44 D. Di Carlo, Lab Chip, 2009, 9, 3038–3046. 45 J. Zhou and I. Papautsky, Lab Chip, 2013, 13, 1121–1132. 46 D. Di Carlo, D. Irimia, R. G. Tompkins and M. Toner, Proc.Natl. Acad. Sci. U. S. A., 2007, 104, 18892–18897.47 D. Di Carlo, J. F. Edd, D. Irimia, R. G. Tompkins and
M. Toner, Anal. Chem., 2008, 80, 2204–2211.48 M. Mollet, R. Godoy-Silva, C. Berdugo and J. J. Chalmers,
Biotechnol. Bioeng., 2007, 98, 772–788.49 A. Barakat and D. Lieu, Cell Biochem. Biophys., 2003, 38,
323–343.50 O. Traub and B. C. Berk, Arterioscler., Thromb., Vasc. Biol.,
1998, 18, 677–685.51 A. Young, W. Wu, W. Sun, H. Benjamin Larman, N. Wang,
Y. S. Li, J. Y. Shyy, S. Chien and G. Garcia-Cardena,Arterioscler., Thromb., Vasc. Biol., 2009, 29, 1902–1908.
52 M. Silberman, Y. D. Barac, H. Yahav, E. Wolfovitz, S. Einav,
N. Resnick and O. Binah, Angiogenesis, 2009, 12, 231–242.53 Y. S. Li, J. H. Haga and S. Chien, J. Biomech., 2005, 38,
1949–1971.54 W. Hu, C. Berdugo and J. J. Chalmers, Cytotechnology,
2011, 63, 445–460.Lab Chip


![Network and Hardware Co-Design - RLE at MIT · Network and Hardware Co-Design MICRO Tutorial ... deep learning inference.” ... [Moons et al., VLSI 2016]](https://img.pdfslide.us/doc/110x75/5ac7918c7f8b9acb688bc18f/network-and-hardware-co-design-rle-at-and-hardware-co-design-micro-tutorial-.jpg)