Embed Size (px)
Citation preview

Lab on a Chip b516274b
PAPER
1
A micro-scale multi-frequency reactance measurementtechnique to detect bacterial growth at low bio-particleconcentrations
Shramik Sengupta, David A. Battigelli and Hsueh-Chia Chang
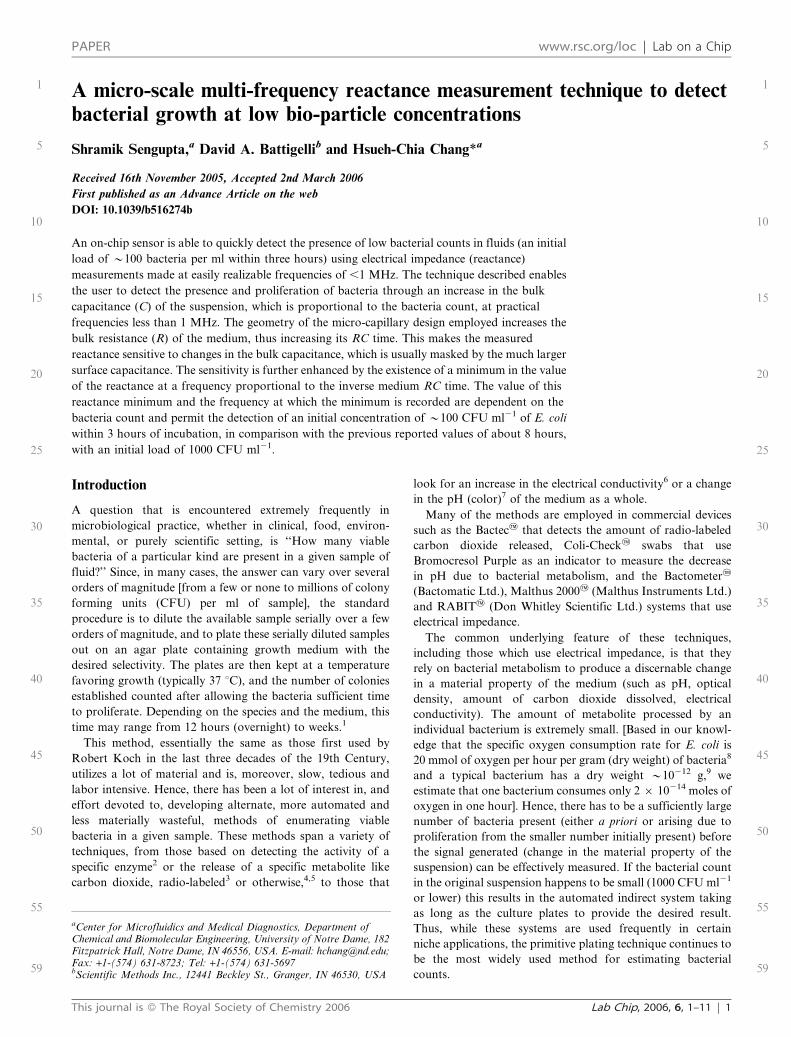
By increasing the medium resistance (and hence medium RCtime) in a capillary appropriate microchannel geometry allowsthe user to detect contributions to the medium capacitance dueto bacteria, and hence detect low bacterial loads.
Please check the proof of your paper carefully. Your proof will not be read in detail by staff after you have returned it to us. It
is your responsibility to ensure that the proof has been read carefully.
Translation errors between word-processor files and typesetting systems can occur so the whole proof needs to be read even
if an electronic file has been supplied. Please pay particular attention to: tabulated material (this may have been rekeyed);
equations; numerical data; figures and graphics; and references. If you have not already indicated the corresponding
author(s) please mark their name(s) with an asterisk. Please fax or e-mail your corrections to us. When returning the proof
by fax please also include a list detailing the corrections to be made. If responding by e-mail please send only a list of
corrections — do not make any changes directly to the pdf file.
This proof reflects the content and general style of the paper without the stylistic complexity of the final printed page; however,
the only differences should be minor layout changes such as different line breaks, tables being double column instead of single
column and improvements in graphic placement.
We will endeavour to publish the article electronically on the RSC web site as soon as possible after we receive your
corrections. NB: No late corrections can be made hence please ensure that only your final corrections are notified to us.
Please return your final corrections, where possible within 48 hours of receipt, to:
Serials Production, The Royal Society of Chemistry,
Tel: +44 (0)1223 432345; Fax: +44 (0)1223 432160; E-mail: [email protected]
Electronic (PDF) reprints will be provided free of charge to the corresponding author. Enquiries about purchasing paper
reprints should be addressed via: http://www.rsc.org/Publishing/ReSourCe/PaperReprints/. Costs for reprints are below:
Reprint costs
No of pages Cost for 50 copies Cost for each additional 50 copies
2–4 £180 £115
5–8 £300 £230
9–20 £600 £480
21–40 £1100 £870
.40 £1700 £1455
Cost for including cover of journal issue:
£50 per 50 copies
A micro-scale multi-frequency reactance measurement technique to detectbacterial growth at low bio-particle concentrations
Shramik Sengupta,a David A. Battigellib and Hsueh-Chia Chang*a
Received 16th November 2005, Accepted 2nd March 2006
First published as an Advance Article on the web
DOI: 10.1039/b516274b
An on-chip sensor is able to quickly detect the presence of low bacterial counts in fluids (an initial
load of y100 bacteria per ml within three hours) using electrical impedance (reactance)
measurements made at easily realizable frequencies of ,1 MHz. The technique described enables
the user to detect the presence and proliferation of bacteria through an increase in the bulk
capacitance (C) of the suspension, which is proportional to the bacteria count, at practical
frequencies less than 1 MHz. The geometry of the micro-capillary design employed increases the
bulk resistance (R) of the medium, thus increasing its RC time. This makes the measured
reactance sensitive to changes in the bulk capacitance, which is usually masked by the much larger
surface capacitance. The sensitivity is further enhanced by the existence of a minimum in the value
of the reactance at a frequency proportional to the inverse medium RC time. The value of this
reactance minimum and the frequency at which the minimum is recorded are dependent on the
bacteria count and permit the detection of an initial concentration of y100 CFU ml21 of E. coli
within 3 hours of incubation, in comparison with the previous reported values of about 8 hours,
with an initial load of 1000 CFU ml21.
Introduction
A question that is encountered extremely frequently in
microbiological practice, whether in clinical, food, environ-
mental, or purely scientific setting, is ‘‘How many viable
bacteria of a particular kind are present in a given sample of
fluid?’’ Since, in many cases, the answer can vary over several
orders of magnitude [from a few or none to millions of colony
forming units (CFU) per ml of sample], the standard
procedure is to dilute the available sample serially over a few
orders of magnitude, and to plate these serially diluted samples
out on an agar plate containing growth medium with the
desired selectivity. The plates are then kept at a temperature
favoring growth (typically 37 uC), and the number of colonies
established counted after allowing the bacteria sufficient time
to proliferate. Depending on the species and the medium, this
time may range from 12 hours (overnight) to weeks.1
This method, essentially the same as those first used by
Robert Koch in the last three decades of the 19th Century,
utilizes a lot of material and is, moreover, slow, tedious and
labor intensive. Hence, there has been a lot of interest in, and
effort devoted to, developing alternate, more automated and
less materially wasteful, methods of enumerating viable
bacteria in a given sample. These methods span a variety of
techniques, from those based on detecting the activity of a
specific enzyme2 or the release of a specific metabolite like
carbon dioxide, radio-labeled3 or otherwise,4,5 to those that
look for an increase in the electrical conductivity6 or a change
in the pH (color)7 of the medium as a whole.
Many of the methods are employed in commercial devices
such as the Bactec2 that detects the amount of radio-labeled
carbon dioxide released, Coli-Check2 swabs that use
Bromocresol Purple as an indicator to measure the decrease
in pH due to bacterial metabolism, and the Bactometer2
(Bactomatic Ltd.), Malthus 20002 (Malthus Instruments Ltd.)
and RABIT2 (Don Whitley Scientific Ltd.) systems that use
electrical impedance.
The common underlying feature of these techniques,
including those which use electrical impedance, is that they
rely on bacterial metabolism to produce a discernable change
in a material property of the medium (such as pH, optical
density, amount of carbon dioxide dissolved, electrical
conductivity). The amount of metabolite processed by an
individual bacterium is extremely small. [Based in our knowl-
edge that the specific oxygen consumption rate for E. coli is
20 mmol of oxygen per hour per gram (dry weight) of bacteria8
and a typical bacterium has a dry weight y10212 g,9 we
estimate that one bacterium consumes only 2 6 10214 moles of
oxygen in one hour]. Hence, there has to be a sufficiently large
number of bacteria present (either a priori or arising due to
proliferation from the smaller number initially present) before
the signal generated (change in the material property of the
suspension) can be effectively measured. If the bacterial count
in the original suspension happens to be small (1000 CFU ml21
or lower) this results in the automated indirect system taking
as long as the culture plates to provide the desired result.
Thus, while these systems are used frequently in certain
niche applications, the primitive plating technique continues to
be the most widely used method for estimating bacterial
counts.
aCenter for Microfluidics and Medical Diagnostics, Department ofChemical and Biomolecular Engineering, University of Notre Dame, 182Fitzpatrick Hall, Notre Dame, IN 46556, USA. E-mail: [email protected];Fax: +1-(574) 631-8723; Tel: +1-(574) 631-5697bScientific Methods Inc., 12441 Beckley St., Granger, IN 46530, USA
PAPER www.rsc.org/loc | Lab on a Chip
This journal is � The Royal Society of Chemistry 2006 Lab Chip, 2006, 6, 1–11 | 1
1
5
10
15
20
25
30
35
40
45
50
55
59
1
5
10
15
20
25
30
35
40
45
50
55
59

Among all these automated or semi-automated methods,
electrical methods are especially attractive because they can
potentially be incorporated into small bench-top units or
hand-held devices, and/or used in instruments designed to
handle a large number of samples simultaneously. However,
electrical data generated by solutions containing metabolizing
and proliferating bacteria are difficult to interpret. Something
regarding the nature of the problems encountered in doing so
can be gauged from the electrical circuit representation of the
net measured impedance between two electrodes in direct
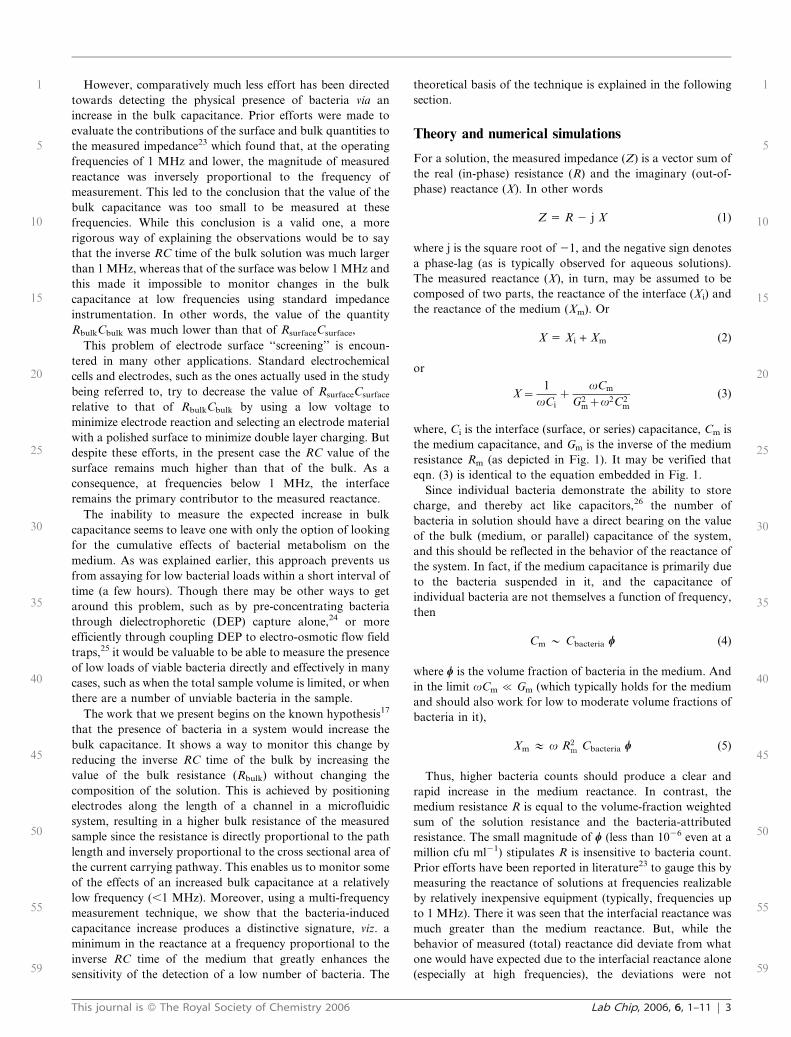
contact with an aqueous solution (as shown in Fig. 1).10 As is
shown by the accompanying equation, the measured impe-
dance is influenced by both the ‘‘bulk’’ and the ‘‘surface’’
quantities (resistance and capacitance). Typically, the bulk
quantities reflect the state of the solution/suspension of
interest, and the surface circuit represents the electrochemical
interface (the ‘‘double layer’’) in equilibrium with the bulk.
While the resulting net reading is thus correlated to events in
the bulk, asynchronous changes occurring in the surface and
the bulk may lead to erroneous conclusions being drawn about
the state of the bulk solution.11
Under different circumstances, this representation may be
modified according to the behavior of individual systems. For
instance, when probing highly conductive solutions that lack
charged macromolecules with low voltages, one may ignore the
bulk capacitance and the surface resistance. This yields the
classical result12 for describing the behavior of metal electrodes
in contact with a conductive solution. However, since several
equivalent circuits produce similar or identical impedance
spectra (especially when the observed range of frequencies is
limited), the model must be true to the known (or, at the very
least, plausible) physics of the system.
That the presence of bacteria and their metabolic activity
changes the electrical properties of the bulk medium in which
they are suspended has been known for a long time. They are
known to do so in two ways. Firstly, by breaking down sugars
commonly present in growth media to more conductive species
like pyruvic, lactic, and carbonic acids they increase the
conductivity (decrease the bulk resistance) of the medium.16
Secondly, by acting as dipoles and possibly even storing
charge, the very presence of individual bacteria (along with
macromolecules present in the growth medium) contributes to
the bulk capacitance of the solutions, thereby affecting the
measured reactance (imaginary, or out-of-phase component of
the impedance).17,18 The effect of metabolism alone on the
dielectric constant (bulk capacitance) of the solution,
decoupled from the contribution due to the physical presence
of bacteria alone, seems not to have been studied and is,
moreover, expected to be negligible given that metabolism
breaks down both molecules that raise the dielectric constant
of the solutions (like proteins and peptides) and molecules that
lower the dielectric constant (like carbohydrates). The various
approaches adopted thus far to developing an impedance
based system for bacterial detection and/or enumeration differ
from each other with respect to (a) which of the two effects
above they seek to monitor, and (b) the electrical circuit
models that they use as a framework to better quantitatively
explain the behavior of their systems.
Virtually all of the work available in literature, and all the
commercially available instruments, depend on monitoring the
effect of bacterial metabolism on the electrical properties of
the growth medium. The simplest technique,17 merely tries to
relate the absolute value of the measured impedance to the
changes in the system. Other methods6,19,20 ignore the interface
(surface) resistance and bulk capacitance (reactance). This
approach implies that all the contributions to the resistance
(real, or in-phase, component of the impedance) are from the
bulk, and that the capacitances that contribute to the
measured reactance reside on the electrode–solution interface.
Some of these approaches6 ignore the bulk or medium
reactance and try to relate the changes in resistance to the
effects of bacterial metabolism. Others19–21 ascribe the change
in the measured reactance to changes in the interfacial
capacitance and try to relate that to the effects of bacterial
metabolism on the solution. This approach probably works
because there is an adsorbed layer of solutes on the electrode
that is in equilibrium with the bulk solution,22 and this affects
the interface capacitance.
Fig. 1 Electrical representation of the material between the two metal electrodes in direct contact with a solution, showing the contributions from
the interface and the bulk (medium) to the measured impedance.
2 | Lab Chip, 2006, 6, 1–11 This journal is � The Royal Society of Chemistry 2006
1
5
10
15
20
25
30
35
40
45
50
55
59
1
5
10
15
20
25
30
35
40
45
50
55
59
However, comparatively much less effort has been directed
towards detecting the physical presence of bacteria via an
increase in the bulk capacitance. Prior efforts were made to
evaluate the contributions of the surface and bulk quantities to
the measured impedance23 which found that, at the operating
frequencies of 1 MHz and lower, the magnitude of measured
reactance was inversely proportional to the frequency of
measurement. This led to the conclusion that the value of the
bulk capacitance was too small to be measured at these
frequencies. While this conclusion is a valid one, a more
rigorous way of explaining the observations would be to say
that the inverse RC time of the bulk solution was much larger
than 1 MHz, whereas that of the surface was below 1 MHz and
this made it impossible to monitor changes in the bulk
capacitance at low frequencies using standard impedance
instrumentation. In other words, the value of the quantity
RbulkCbulk was much lower than that of RsurfaceCsurface,
This problem of electrode surface ‘‘screening’’ is encoun-
tered in many other applications. Standard electrochemical
cells and electrodes, such as the ones actually used in the study
being referred to, try to decrease the value of RsurfaceCsurface
relative to that of RbulkCbulk by using a low voltage to
minimize electrode reaction and selecting an electrode material
with a polished surface to minimize double layer charging. But
despite these efforts, in the present case the RC value of the
surface remains much higher than that of the bulk. As a
consequence, at frequencies below 1 MHz, the interface
remains the primary contributor to the measured reactance.
The inability to measure the expected increase in bulk
capacitance seems to leave one with only the option of looking
for the cumulative effects of bacterial metabolism on the
medium. As was explained earlier, this approach prevents us
from assaying for low bacterial loads within a short interval of
time (a few hours). Though there may be other ways to get
around this problem, such as by pre-concentrating bacteria
through dielectrophoretic (DEP) capture alone,24 or more
efficiently through coupling DEP to electro-osmotic flow field
traps,25 it would be valuable to be able to measure the presence
of low loads of viable bacteria directly and effectively in many
cases, such as when the total sample volume is limited, or when
there are a number of unviable bacteria in the sample.
The work that we present begins on the known hypothesis17
that the presence of bacteria in a system would increase the
bulk capacitance. It shows a way to monitor this change by
reducing the inverse RC time of the bulk by increasing the
value of the bulk resistance (Rbulk) without changing the
composition of the solution. This is achieved by positioning
electrodes along the length of a channel in a microfluidic
system, resulting in a higher bulk resistance of the measured
sample since the resistance is directly proportional to the path
length and inversely proportional to the cross sectional area of
the current carrying pathway. This enables us to monitor some
of the effects of an increased bulk capacitance at a relatively
low frequency (,1 MHz). Moreover, using a multi-frequency
measurement technique, we show that the bacteria-induced
capacitance increase produces a distinctive signature, viz. a
minimum in the reactance at a frequency proportional to the
inverse RC time of the medium that greatly enhances the
sensitivity of the detection of a low number of bacteria. The
theoretical basis of the technique is explained in the following
section.
Theory and numerical simulations
For a solution, the measured impedance (Z) is a vector sum of
the real (in-phase) resistance (R) and the imaginary (out-of-
phase) reactance (X). In other words
Z 5 R 2 j X (1)
where j is the square root of 21, and the negative sign denotes
a phase-lag (as is typically observed for aqueous solutions).
The measured reactance (X), in turn, may be assumed to be
composed of two parts, the reactance of the interface (Xi) and
the reactance of the medium (Xm). Or
X 5 Xi + Xm (2)
or
X~1
vCi
zvCm
G2mzv2C2
m
(3)
where, Ci is the interface (surface, or series) capacitance, Cm is
the medium capacitance, and Gm is the inverse of the medium
resistance Rm (as depicted in Fig. 1). It may be verified that
eqn. (3) is identical to the equation embedded in Fig. 1.
Since individual bacteria demonstrate the ability to store
charge, and thereby act like capacitors,26 the number of
bacteria in solution should have a direct bearing on the value
of the bulk (medium, or parallel) capacitance of the system,
and this should be reflected in the behavior of the reactance of
the system. In fact, if the medium capacitance is primarily due
to the bacteria suspended in it, and the capacitance of
individual bacteria are not themselves a function of frequency,
then
Cm y Cbacteria w (4)
where w is the volume fraction of bacteria in the medium. And
in the limit vCm % Gm (which typically holds for the medium
and should also work for low to moderate volume fractions of
bacteria in it),
Xm # v R2m Cbacteria w (5)
Thus, higher bacteria counts should produce a clear and
rapid increase in the medium reactance. In contrast, the
medium resistance R is equal to the volume-fraction weighted
sum of the solution resistance and the bacteria-attributed
resistance. The small magnitude of w (less than 1026 even at a
million cfu ml21) stipulates R is insensitive to bacteria count.
Prior efforts have been reported in literature23 to gauge this by
measuring the reactance of solutions at frequencies realizable
by relatively inexpensive equipment (typically, frequencies up
to 1 MHz). There it was seen that the interfacial reactance was
much greater than the medium reactance. But, while the
behavior of measured (total) reactance did deviate from what
one would have expected due to the interfacial reactance alone
(especially at high frequencies), the deviations were not
This journal is � The Royal Society of Chemistry 2006 Lab Chip, 2006, 6, 1–11 | 3
1
5
10
15
20
25
30
35
40
45
50
55
59
1
5
10
15
20
25
30
35
40
45
50
55
59

deemed significant enough to lead to any meaningful conclu-
sions about the changes in bulk capacitance (if any) occurring
during the observed time period.
To gauge the effect of a change in medium capacitance on
the frequency response of the measured reactance of the
system, consider, the function
f(v) 5 Cm X(v) (6)
or
f vð Þ~ Cm
vCi
zvC2
m
G2mzv2C2
m
(7)
which can be rewritten as
f vð Þ~ a
vz
v
b2zv2(8)
where a 5 Cm/Ci is the ratio of the medium and interface
capacitances, and b 5 Gm/Cm 5 1/RmCm is the inverse of the
medium (bulk solution) RC time.
For low values of v (v A 0)
f (v) # a/v (9)
and for high values of v (v A ‘)
f(v) # 1/v (10)
So, as depicted in Fig. 2, one can expect the function given
by eqn (8) to either have a single inflexion point, or a pair of
local extrema points (one maximum and one minimum)
depending on the value of a.
To obtain more a more rigorous condition for the existence
of maxima and/or minima for f(v), one set its first derivative
(with respect to v) equal to zero. Rearranging to solve
algebraically for v (or rather, v2), one obtains the condition
v4(1 + a) 2 v2b2(1 2 2a) + ab4 5 0 (11)
For a solution to exist, the discriminant of the above
equation needs to be greater than zero. On applying this
condition, one obtains
a , 1/8 (12)
as the condition that determines whether or not the function
f(v) [and, as a consequence, the frequency response of the
measured reactance, i.e., X(v)] has local minima and maxima.
Note that a 5 Cm/Ci. This means that a minimum or
maximum can be obtained only for values of Cm that are
substantially lower than Ci. The values of Cm have been
estimated to be lower than Ci by a factor of 1000 or larger in
more traditional millilitre-scale systems23,27 (leading to a value
of y0.001 for a) and is not expected to change much given the
geometry of our microfluidic system. We hence examine the
behavior of the system for low values of a [or, mathematically
speaking, in the limit a % 1].
The solution to eqn (11) yields the values of v at which the
maxima and minima are observed. The two roots of eqn (11)
are given by
v2ext~
b2 1{2að Þ+ffiffiffiffiffiffiffiffiffiffiffiffiffiffiffiffi
1{8að Þp
2 1zað Þ (13)
The first extremum, which, from Fig. 2 we expect to be a
minimum, is obtained at the lower value of v. Thus,
vmin
b
� �2
~1{2að Þ{
ffiffiffiffiffiffiffiffiffiffiffiffiffiffi
(1{8ap
2 1zað Þ (14)
which, in the limit a % 1, reduces to
vmin
b
� �2
&a
1za&azO a2
� �
(15)
Hence,
vmin&ffiffiffiffiffiffiffi
ab2
q
(16)
which, if one considers the definitions of a and b, can also be
expressed as
vmin&1
RmCm
ffiffiffiffiffiffiffi
Cm
Ci
s
~1
Rm Cmð Þ0:5 Cið Þ0:5(17)
Further, the value of the function, f(v), obtained at this
frequency vmin, is (in the limit a % 1) given by the expression
f vminð Þ~ 2ffiffiffi
ap
b~2RmCm
ffiffiffiffiffiffiffi
Cm
Ci
s
~2Rm Cmð Þ1:5 Cið Þ{0:5 (18)
Thus, the minimum value of the recorded reactance is given
by
Xmin~f vminð Þ
Cm~2Rm
ffiffiffiffiffiffiffi
Cm
Ci
s
~2Rm Cmð Þ0:5 Cið Þ{0:5(19)
From eqns (4) and (17) we see that the location of the
reactance minimum is proportional to the inverse of the square
root of the volume fraction (w) of bacteria in the medium, and
is hence expected to be quite sensitive. From eqn (19), we see
also the dependence of the minimum amplitude on the bacteria
volume fraction, but in this case it is proportional to the square
root of w. We further note that (a) other factors remaining
equal, one would expect to observe a minimum in the
frequency response of the reactance at a lower frequency
when the bulk (medium) resistance is high, and (b) if the bulk
capacitance of the solution were to rise (other factors
remaining equal), the minimum in the plot of reactance
Fig. 2 Expected behavior of the function f(v) [5 CmX(v)] (a) when
a . 1 (no extrema values), and (b) when a , 1 (one minimum and one
maximum value).
4 | Lab Chip, 2006, 6, 1–11 This journal is � The Royal Society of Chemistry 2006
1
5
10
15
20
25
30
35
40
45
50
55
59
1
5
10
15
20
25
30
35
40
45
50
55
59

against frequency would, again, be observed at lower
frequencies. Similarly, eqn (19) predicts that the recorded
minimum for the measured reactance would decrease if either
the medium resistance or the medium capacitance were to
decrease independently, with all other quantities remaining
unchanged.
If a certain number of bacteria are inoculated into a growth
medium, we would expect from the above arguments that as
time progresses and the bacteria metabolize and reproduce, the
medium resistance (Rm) would drop but not significantly and
the medium capacitance (Cm) would increase proportionally to
the bacteria count, as seen in (4), at the low bacteria count and
high frequency limits. One might then expect the value of the
minimum reactance measured to increase with time and the
critical frequency (at which the minimum is recorded) to
decrease with time. Thus, there may be cases (for really low
initial medium capacitances) for which the critical frequency
initially lies beyond the range of frequencies at which
measurements are taken, but as time progresses the critical
frequency shifts to within the observed range. Then, initially,
one would not be able to observe any minimum in X(v), but
would do so as time progressed. The ‘‘appearance’’ of the
minimum within the window of measured frequencies
would hence be a ‘‘signature’’ of the presence (and prolifera-
tion) of bacteria within the growth medium. Given that,
in general, signal sensitivity improves drastically near an
extremum of a measured quantity, our system, which
examines the location and amplitude of the minimum, should
be very sensitive to changes in the medium (bulk) capacitance,
and consequently, the bacteria count. As seen in eqn (8), the
amplitude and curvature of this minimum is also sensitive to
bacteria count. However, its location eqn (15) shows the
highest sensitivity.
Prior literature23 reports only a monotonic decrease in the
total measured impedance across frequencies ranging from
approximately 10 Hz to 100 KHz when the system had an
initial medium conductance of 0.005 mhos (a bulk resistance of
200 V). If one takes into account that their interfacial
capacitance is of the order of 1026 farads [based on a typical
value of 10 mF cm22 for the electrodes27] and bulk capacitance
is of the order of 10210 farads or lower, it can be seen (using
eqn (17)) that for the minimum to lie within their range of
observed frequencies, the bulk resistance must lie between
103 V and 108 V. The fact that the bulk resistance starts out at
a value lower than 1000 V (and presumably decreases further
as time progresses) prevented the previous investigators from
observing this signature.
Thus, to facilitate the observation of the minimum (at
frequencies lower than 1 MHz), the initial bulk resistance
needs to be increased. The bulk resistance of a particular
volume of sample may be increased by confining the sample
within a long, narrow geometry—thereby decreasing the
effective cross-sectional area of the electrodes and increasing
their separation. Another way to look at the effect of the
increased bulk resistance Rm (decreased bulk conductance Gm)
is through eqn (3) where a higher bulk resistance (lower
medium conductance Gm) raises the relative contribution of
the bulk reactance to the total measured reactance. As is
shown in Fig. 3 (left panel), this minimum is a consequence of
a significant contribution to the measured reactance from the
medium that, unlike the interface reactance, increases rather
than decreases with increasing frequency over the ‘‘observed’’
frequency range of 1 kHz to 1 MHz. The frequencies close to
the one at which the minimum is observed are also the
region where the bulk and interface contributions are
comparable (as illustrated by Fig. 3 (left)), and if one
desires to reliably compute the values of both interface and
bulk parameters by fitting eqn (3) to the observed data, one
has to take measurements in this region of the frequency
spectrum.
Another advantage of using a microcapillary with a small
cross-sectional area is to increase the contribution of the
bacteria capacitance to the medium capacitance. The correla-
tion in eqn (4) is based on a parallel circuit model at
low bacteria volume fraction. It implicitly assumes
uniform distribution of a small number of bacteria in the
capillary. With a small capillary, bacteria may occupy a
significant fraction of the cross sectional area and a serial
model with a higher bacteria sensitivity may be more
appropriate. This is especially true if all the bacteria are
concentrated over one region in the capillary. However, we will
show from our data that the reactance is indeed proportional
to the bacteria count, as suggested by eqn (5), and hence our
capillary dimension has not reached a sufficiently small value
that the reactance shows a sensitivity to w that is more than
linear.
As the bulk (medium) capacitance increases, in a plot of the
measured reactance versus frequency, the minimum reactance
recorded is larger, and the minimum is recorded at a lower
frequency—as is illustrated in Fig. 3 (right panel). In a test
sample, if these features are observed over time (or a minimum
in the reactance is recorded when none existed before), they
may be taken to constitute a signature for an increase in the
number of bacteria in the medium.
Experimental protocol and results
In order to incubate the bacterial cultures and measure the
change in their electrical properties, a microfluidic cassette was
constructed using liquid phase photopolymerization of a
commercially available UV curable polymer blend, a process
that has been described in detail elsewhere.28,29 A schematic of
the cassette and a picture of the final device are shown in Fig. 4.
A batch of 10 such cassettes was fabricated, and each cassette
was re-used as needed for the experiments described subse-
quently. Fluidic connectors and electrical contacts were added
after the fabrication process. After each experiment, the fluidic
and electrical connectors were removed and each cassette was
washed thoroughly with soap, water and alcohol. After
installing new electrodes and fluidic connectors, the cassettes
were sterilized, first by wetting with Clorox solution for 20 min
and then flushing with sterile DI water followed by autoclav-
ing at 120 uC for 20 min. They were then loaded with the
solution to be studied and impedance measurements were
taken using an Agilent 4284A LCR meter. The LCR meter was
used in the ‘‘List Sweep’’ mode, which allowed us to measure
the resistance and reactance at 10 logarithmically spaced
frequencies between 1 kHz and 1 MHz.
This journal is � The Royal Society of Chemistry 2006 Lab Chip, 2006, 6, 1–11 | 5
1
5
10
15
20
25
30
35
40
45
50
55
59
1
5
10
15
20
25
30
35
40
45
50
55
59

The following experiments were performed using these cassettes
Experiment 1 (Overall Control). Filtered and unfiltered samples
of 30 mg ml21 sterile (autoclaved) solution of Criterion2
Typtone Soy Broth (TSB) (Hardy Diagnostics, Santa Maria,
CA) was loaded into the cassettes. All cassettes were subse-
quently placed on a slide warmer (Lab-Line Instruments, Model
26020) maintained at 37 uC and allowed time to equilibrate.
Impedance measurements were then taken at two subsequent
time intervals. Fig. 5 (left) graphically displays one sample data
set from each of the two solutions used.
Experiment 2 (Addition of inert carbon nano-tubes). In
order to increase the bulk capacitance of the solution, multi-
wall carbon nano-tubes (CNTs) [ID 1–3 nm, OD 3–10 nm,
length 0.1–10 mm, purity .90% from Aldrich (Lot #
02710EC)], particles with known capacitive properties,30 were
suspended in TSB. Three solutions were prepared, with
estimated concentrations of 0.5, 5 6 1023, and 5 6 1025 mg
ml21, respectively, of CNTs in TSB. In order to do so, first a
stock solution of 5 mg ml21 CNTs was prepared by adding
20 mg of CNTs to 1 ml of Nafion1 117 solution (Lot # 119257
from Fluka Chemie GmBH) and 3 ml of 0.1X PBS. 300 ml of
this stock solution was added to 2.7 ml of TSB to obtain the
first solution. The second and third solutions were obtained by
serially diluting this solution further in TSB. Fig. 5 (right)
shows how the reactances of the solutions vary as a function of
frequency.
Experiment 3. A scoop from a plate culture of F-amp E.coli
(ampicillin resistant strain of E.coli ATCC No. 700891) was
added to the 10 ml of TSB laced with 20 mg ml21 ampicillin
(GIBCO, Carlsbad, CA) to suppress the growth of other
bacteria and incubated overnight with shaking at 37 uC. 1 ml
of the resulting cloudy solution was centrifuged (10 000 rpm,
5 min, using a Beckman Microfuge 22R), and after removing
the supernatant, the deposited pellet was re-suspended in 0.1X
phosphate buffer saline (PBS). It is estimated that the
concentration of bacteria in this solution is y109 cfu ml21.
A set of serial dilutions were performed by adding 100 ml of the
solutions with bacteria to 900 ml of 0.1X PBS. Thus, solutions
were generated with approximately 108, 107, 106, 105, 104, and
103 bacteria per ml. 300 ml each of the solutions, with an
Fig. 3 Pseudo plots illustrating the effect of the various parameters in eqn (3) in enabling the detection of increased bulk (medium) capacitance at
low frequencies. Left: An increase in medium resistance increases the value of the medium reactance (Xm) relative to the interface reactance (Xi),
thereby causing a minimum in the measured (total) reactance (X). Right: The effect of rising bulk capacitance on the measured impedance, viz., the
appearance, and subsequent rise in the value and shift to a lower frequency, of a minimum in X(v).
6 | Lab Chip, 2006, 6, 1–11 This journal is � The Royal Society of Chemistry 2006
1
5
10
15
20
25
30
35
40
45
50
55
59
1
5
10
15
20
25
30
35
40
45
50
55
59

estimated bacterial count y104 and 103 per ml, were added to
2.7 ml volumes of TSB (laced with 20 mg ml21 ampicillin) to
yield two solutions—one with approximately 1000 and the
other with approximately 100 bacteria per ml. These solutions
were loaded into sterile cassettes, which were then placed on a
slide warmer maintained at 37 uC. The cassettes and their
contents were allowed to sit for about half an hour to
equilibrate before impedance measurements were taken. Three
impedance measurements were taken again at 2 hour intervals
after the first reading. The reactances measured (along with the
resistances) are displayed in Figs. 6 and 7 for the solutions with
initial loads of y100 cfu ml21 and 1000 cfu ml21, respectively.
Four control cassettes were also used corresponding to each
experimental condition (both values of the initial bacterial
load). The contents of one cassette were extracted at roughly
the same time as the impedance measurements were taken and
(after diluting if deemed necessary) spread on agar plates to
obtain plate counts to estimate the concentration of bacteria at
that particular instance in the samples whose impedance is
being measured.
Discussion and analysis of the results
Tryptone Soy Broth (TSB) is a commonly used liquid medium
for culturing bacteria. This broth contains casein digests of soy
protein in addition to glucose and sodium chloride. When its
reactance is recorded at frequencies ranging from 1 kHz to
1 MHz (Fig. 5 left), it is seen that the reactance decreases
monotonically with increasing frequency for both filtered and
unfiltered samples. This indicates that the minimum in X(v)
occurs at a frequency higher than 1 MHz. Further, the
measured reactances do not change with time, in keeping with
the expected lack of metabolic activity within the solution.
However, when carbon nano-tubes (CNTs), particles that
are known to possess significant capacitive properties, are
suspended in the TSB, we see a change in the manner in which
the reactance behaves as a function of frequency (Fig. 5 right).
Although the X(v) for the solution with the lowest concentra-
tion of suspended CNTs looks qualitatively similar to that for
TSB, the two more concentrated solutions display minima
within the observed range of frequencies (with the minimum
value being larger and occurring at a lower frequency for the
most concentrated solution). This is in qualitative agreement
with eqn (17), which predicts that an increase in medium
capacitance (Cm) will cause the minimum in X(v) to occur at
lower frequencies. This observation also suggests that an
increase in the number of capacitive particles suspended in the
medium (brought about by means physical or biological) could
lead to the transformation of the plot of X(v) from one that is
monotonically decreasing over the observed frequency range
to one that displays a minimum.
Figs. 6 and 7 show how the ability to detect the increase in
medium capacitance provided by suspended material with
capacitive properties can be utilized to monitor the growth of
bacteria in solutions. When the first measurement is taken for
the solution inoculated with y100 cfu ml21 of E. coli (Fig. 6),
Fig. 4 Picture of the microfluidic cassettes used (top) and a schematic showing the positioning of the electrodes within the channels (bottom). The
dotted lines within the channel are the electrical lines of force between the electrodes (ovals), some of which encounter bacteria (small black
structures) suspended in the medium.
This journal is � The Royal Society of Chemistry 2006 Lab Chip, 2006, 6, 1–11 | 7
1
5
10
15
20
25
30
35
40
45
50
55
59
1
5
10
15
20
25
30
35
40
45
50
55
59

the medium capacitance is lower than the value needed for the
minimum in the measured reactance to be observed at a
frequency below 1 Mz. Two hours after the first measurement
is taken, a minimum in the measured reactance is recorded at
100 kHz. This noticeably different behavior of the system,
brought about by an increase in the medium capacitance of the
system due to bacterial proliferation, can be taken as a
signature for bacterial presence in applications such as
detecting the presence of bacteria in food products, where
the requirement is merely to detect the presence of bacteria
(typically present at low concentrations). As can be seen, this
signature is recorded less than 3 hours post inoculation giving
us a ‘‘Time to Detection’’ (TTD) of less than three hours for an
organism whose generation time is expected to be about
25 min. This compares extremely favorably to the technique
for detecting bacteria based on monitoring resistance19 which
has a TTD of 6.7 hours for a sample having an initial load of
1000 cfu ml21 of bacteria with a generation time of 30 min.
(The initial load needed is roughly ten times ours and the TTD
is more than twice as long.) The aforementioned technique
forms the basis of a commercial system called the RABIT
(Rapid Automated Bacterial Impedance Technique) developed
by Don Whiltley Scientific, UK. Moreover, while the RABIT
uses a medium whose composition is specially designed to
maximize the sensitivity of the measured resistance change to
the effects of bacterial metabolism, our system uses a generic
growth medium. The relative efficacies of the techniques based
on resistance and reactance can be gauged by looking at the
plots showing the evolution of the measured resistances with
time accompanying the plots for reactances in Figs. 6 and 7. By
the time the unambiguous signature for bacterial growth is
recorded using the reactance (in Fig. 6), the measured
resistances change by less than 2%.
When a minimum in X(v) is recorded at the first reading,
the evolution of this feature over time may be used to monitor
bacterial growth. For instance, the reactance of the sample
with an initial estimated load of y1000 cfu ml21 displays a
minimum when the first measurement is taken (at t 5 45 min).
But then the minimum evolves over time. As can be seen in
Fig. 8, between 4.75 hours and 6.75 hours the minimum value
of the reactance and the frequency at which the minimum is
recorded (functions of the medium capacitance) change
significantly, the former increasing by over 85% and the latter
decreasing by about 100 kHz. Again in contrast, the values of
the measured resistances change by only about 2.5% during
this time.
One can also obtain a value of the medium capacitance of
the solution by using standard curve fitting techniques to fit
the parameters in eqn (3) to the recorded values of the
reactance. A Matlab1 program was used to perform a least-
squares fit to the data recorded. The fits typically resulted in R
values over 0.9 and 95% confidence intervals of y¡10% of the
value of the predicted parameters. The values obtained (as seen
in Fig. 8) seem to change over time like the bacterial load in the
Fig. 5 Plots showing the electrical behavior of sterile suspensions. Left: unfiltered (top) and filtered (bottom) Tryptone Soy Broth (TSB), showing
a stable (over time) monotonic decrease of measured reactance with frequency. Right: TSB solutions with carbon nano-tubes (CNTs) suspended in
them. Higher concentrations of suspended CNTs lead to higher medium capacitance, and the effects are similar to those predicted in Fig. 3.
8 | Lab Chip, 2006, 6, 1–11 This journal is � The Royal Society of Chemistry 2006
1
5
10
15
20
25
30
35
40
45
50
55
59
1
5
10
15
20
25
30
35
40
45
50
55
59

solutions, and hence correlate with the latter. The calculated
values of medium capacitance (with its confidence interval)
could hence be used as a more rigorous method of monitoring
bacterial proliferation. The linear correlation between bacteria
count and the medium capacitance is consistent with eqn (4).
There are many sources of variability in the systems
described by Fig. 8. Firstly, different independent aliquots
from the same solution were introduced into different
cassettes. Separate aliquots from the solution that was
introduced and more concentrated versions of it in the dilution
series were used to establish the bacterial load via a plate
count. The plate count, by itself, is just a good order-of-
magnitude estimate of bacterial load. Besides, given the low
number of bacteria in the solution, it is extremely unlikely that
all samples started off with exactly the same number of
bacteria (although that is the implicit assumption of Fig. 8).
With exponential growth, even small differences in initial load
can be magnified over time. Moreover, the bacteria, like all
living creatures, are subject to small variability among
individuals and differences in their metabolic state may be
reflected in differing contributions to the medium capacitance.
Non-uniform distribution of bacteria within the narrow region
Fig. 6 Plots showing the change with time of measured reactance
(top) and resistance (bottom) for a bacterial culture initially loaded
with y100 cfu ml21; the former is caused by bacterial proliferation
and the latter by metabolic activity. While the change in reactance is
significant within less than 3 hours [plot begins to display a minimum
in X(v)], the change in resistance values is less than 2% by this time.
Even after 6.75 hours, it is still about 3.5%.
Fig. 7 Plots showing the variation of the measured reactance (top)
and the measured resistance (bottom) for a bacterial culture initially
loaded with y1000 cfu ml21 at various points in time. Changes in the
behavior of the reactance [X(v)] are significant—the minimum value of
reactance (Xmin) rising by y85% between 4.75 and 6.75 hours. In
contrast, changes in resistance are less pronounced (by about 2.5% in
the same period).
This journal is � The Royal Society of Chemistry 2006 Lab Chip, 2006, 6, 1–11 | 9
1
5
10
15
20
25
30
35
40
45
50
55
59
1
5
10
15
20
25
30
35
40
45
50
55
59

between the electrodes could also contribute to the observed
variability, although its effect would be mitigated by the
motility of live E. coli. However, the most important source of
variability could be small differences in temperature between
the different cassettes being incubated on the same slide
warmer. Not only does temperature affect the conductivity and
dielectric constant of the solution, but may change the
doubling time of the bacteria by a few minutes. Over 3–
7 hours, this could lead to substantial differences in bacterial
numbers. Given all these sources of variability, the observed
scatter is not unexpected.
Concluding remarks
The effort was motivated by a desire to be able use electrical
methods to directly establish bacterial counts in solution
instead on relying on monitoring the cumulative effects of
bacterial metabolism. It has long been intuitively obvious that
medium capacitance (and consequently medium reactance) is a
strong function of bacterial count. However, the surface
reactance of electrode–solution interface masked the changes
in the bulk reactance at frequencies conducive to inexpensive
instrumentation (1 MHz and below). We were able to utilize
the geometry of microfluidic channels to increase the bulk
resistance of the medium, and thereby decrease the inverse RC
time of the bulk. This enabled us to notice the effect of
increased contribution from the bulk reactance to the total
measured reactance in the form of a minimum in the latter
quantity. The strong sensitivity of the frequency at minimum
to bacteria count allows us to produce a sensitive bacteria
detection method for low bacteria counts.
Utilizing our technique, we are able to pick up signatures of
bacterial proliferation (and hence presence) in about half the
time as an established commercial technique starting with an
initial load ten times smaller. Moreover, the electrode
characteristics and their location within the channels have
not been optimized, and the growth medium used was a
popular generic one, not chemically modified in any way.
Further advances in the design of the cassette, incorporating
modifications in the design of electrodes and their positioning
within the channels to optimize the electrical behavior, in
conjunction with a specially designed medium with low
amounts of macromolecules, would be expected to make the
technique even more sensitive by further reducing times to
detection. Reducing the capillary dimensions and concentrat-
ing the bacteria at one location along the capillary are also
attractive strategies. However, smaller chamber dimensions
may increase the sensitivity to debris corruption of the signal
and an optimum dimension may exist.
References
1 R. Y. Stanier, J. L. Ingraham, M. L. Wheelis and P. R. Painter,The Microbial World, Prentice-Hall: Englewood Cliffs, NJ, 5thedn, 1986.
2 J. D. Berg and L. Fiksdal, Appl. Environ. Microbiol., 1988, 54,2118–2122.
3 F. H. Deland and H. N. Wagner, Radiology, 1969, 92, 154–155.4 T. C. Thorpe, M. L. Wilson, J. E. Turner, J. L. Di Guiseppi,
M. Willert, S. Mirrett and L. B. Reller, J. Clin. Microbiol., 1990,28, 1608–1612.
5 C. D. Campbell, S. J. Chapman, C. M. Cameron, M. S. Davidsonand J. M. Potts, Appl. Environ. Microbiol., 2003, 69, 3593–3599.
6 J. C. S. Richards, A. C. Jason, G. Hobbs, D. M. Gibson andR. H. Christie, J. Phys. E: Sci. Instrum., 1978, 11, 560–568.
7 M. Manafi and B. Kremsmaier, Int. J. Food Microbiol., 2001, 71,257–262.
8 K. B. Andersen and K. von Meyenburg, J. Bacteriol., 1980, 144,114–123.
9 K. Y. Børsheim, G. Bratbak and M. Heldal, Appl. Environ.Microbiol., 1990, 56, 352–356.
10 D. Rosen, in A Laboratory Manual of Analytical Methods ofProtein Chemistry Including Polypeptides, eds., P. Alexander andH. Lundgren, Pergamon Press, 1966.
11 S. Sengupta, G. Mahmud, D. J. Chiou, B. Ziaie and V. H. Barocas,Analyst, 2005, 130, 171–178.
12 E. Warburg, Ann. Phys. Chem., 1899, 67, 493–499.13 J. Collins and A. P. Lee, Lab Chip, 2004, 4, 7–10.14 K. Y. Tam, J. P. Larsen, B. A. Coles and R. G. Compton,
J. Electroanal. Chem., 1996, 407.15 J. Wu, Y. Ben, D. Battigelli and H.-C. Chang, Ind. Eng. Chem.
Res., 2005, 44, 2815–2822.
Fig. 8 Evolution of bacterial count and calculated medium capaci-
tance with time (top), and variation of calculated medium capacitance
with estimated bacterial count (bottom).
10 | Lab Chip, 2006, 6, 1–11 This journal is � The Royal Society of Chemistry 2006
1
5
10
15
20
25
30
35
40
45
50
55
59
1
5
10
15
20
25
30
35
40
45
50
55
59

16 A. Ur and D. F. J. Brown, in New Approaches to the Identificationof Microorganisms, eds. C. G. Heden and T. Illeni, Wiley: London,1975, pp. 61–71.
17 P. Cady in New Approaches to the Identifaction of Microorganisms,eds. C. G. Heden and T. Illeni, Wiley, London, 1975, pp. 74–99.
18 T. C. Chang and A. H. Huang, J. Clin. Microbiol., 2000, 38,3589–3594.
19 G. Eden and R. Eden, IEEE Trans. Biomed. Eng., 1984, BME-31,193–198.
20 R. Firstenberg-Eden and J. Zindulis, J. Microbiol. Methods, 1984,2, 103–115.
21 C. J. Felice, R. E. Madrid, J. M. Olivera, V. I. Rotger andM. E. Valentinuzzi, J. Microbiol. Methods, 1999, 35, 37–42.
22 E. L. Cussler, Diffusion: Mass Transfer in Fluid Systems,Cambridge University Press, 2nd edn, 1998.
23 C. J. Felice and M. E. Valentinuzzi, IEEE Trans. Biomed. Eng.,1999, 46, 1483–1487.
24 R. Gomez-Sjoberg, D. T. Morisette and R. Bashir,J. Microelectromech. Syst., 2005, 14, 829–838.
25 Z. Gagnon and H.-C. Chang, Electrophoresis, 2005, 26, 3725–3737.26 A. T. Poortinga, R. Bos and H. J. Busscher, J. Microbiol. Methods,
1999, 38, 183–189.27 C. J. Slevin, A. Malkia, P. Liljeroth, M. Toiminen and K. Kontturi,
Langmuir, 2003, 19, 1287–1294.28 C. Khoury, G. A. Mensing and D. J. Beebe, Lab Chip, 2002, 2,
50–55.29 S. Sengupta, B. Ziaie and V. H. Barocas, Sens. Actuators, B, 2004,
99, 25–29.30 R. H. Baughman, A. A. Zakhidov and W. A. de Heer, Science,
2002, 297, 787–792.
This journal is � The Royal Society of Chemistry 2006 Lab Chip, 2006, 6, 1–11 | 11
1
5
10
15
20
25
30
35
40
45
50
55
59
1
5
10
15
20
25
30
35
40
45
50
55
59