Embed Size (px)
Citation preview
LAB NOTEBOOKTable of Contents
Investigation 1: What Is Weather?Class Weather Chart ................................................................................................................................................................................1
Investigation 2: Where’s the Air?Air Investigations .....................................................................................................................................................................................3Earth’s-Atmosphere Questions ..............................................................................................................................................................5
Investigation 3: Seasons and SunSunrise/Sunset Times for 2000...............................................................................................................................................................7Seasonal Changes .....................................................................................................................................................................................9Response Sheet—Seasons and Sun ...........................................................................................................................................................11Beam Spreading ......................................................................................................................................................................................13
Investigation 4: Heat TransferEarth-Material Temperatures Chart ....................................................................................................................................................14Earth-Material Temperatures Graph ...................................................................................................................................................15Heat Conduction ....................................................................................................................................................................................17Conduction through Materials .............................................................................................................................................................19
Investigation 5: ConvectionLiquid Layers ..........................................................................................................................................................................................21Calculating Density ...............................................................................................................................................................................23Response Sheet—Convection ....................................................................................................................................................................25Layering Hot and Cold Water ..............................................................................................................................................................27Convection Chamber .............................................................................................................................................................................29
Investigation 6: Water in the AirRelative Humidity ..................................................................................................................................................................................31Response Sheet—Water in the Air ...........................................................................................................................................................33Dew-Point Questions .............................................................................................................................................................................35Pressure/Temperature Demonstration ...............................................................................................................................................37Weather-Balloon Simulation .................................................................................................................................................................39Upper-Air Sounding Graph .................................................................................................................................................................40Temperature Number Line ...................................................................................................................................................................41
Investigation 7: The Water PlanetWater-Cycle Game .................................................................................................................................................................................43
Investigation 8: Air Pressure and Wind Pressure in a Jar ......................................................................................................................................................................................45Response Sheet—Air Pressure and Wind.................................................................................................................................................47Local Winds .............................................................................................................................................................................................48Making an Anemometer .......................................................................................................................................................................50Pressure Map of the U.S. .......................................................................................................................................................................53
Investigation 9: Weather and ClimateSolar-Balloon Observations ..................................................................................................................................................................55Reading Weather Maps .........................................................................................................................................................................57Response Sheet—Weather and Climate ....................................................................................................................................................59Assessment—General Rubric ...............................................................................................................................................................60
120-6523_Weather_LN_pgs_RTP_TOC.2 2120-6523_Weather_LN_pgs_RTP_TOC.2 2 6/6/08 2:11:34 PM6/6/08 2:11:34 PM
1
Name
Period Date
FOSS Weather and Water Course© The Regents of the University of California Student SheetCan be duplicated for classroom or workshop use.
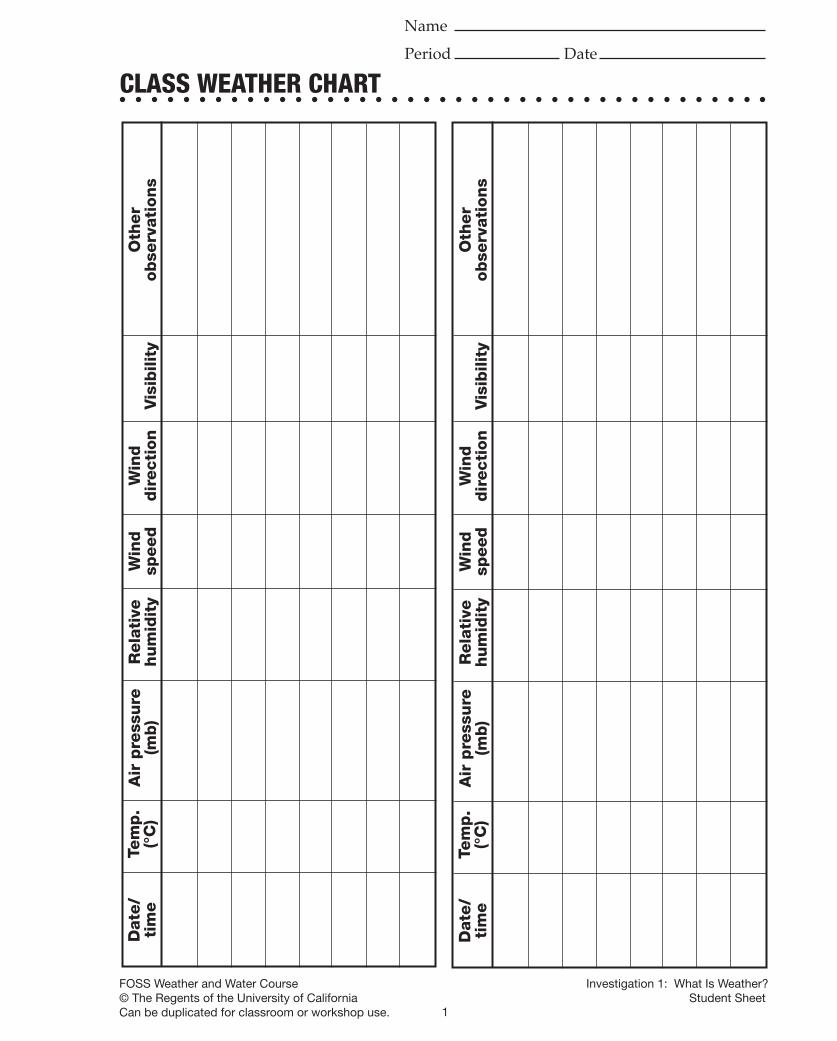
CLASS WEATHER CHART
Date
/ti
me
Tem
p.
(°C
)A
ir p
ress
ure
(m
b)
Rela
tive
hum
idit
yW
ind
speed
Win
d
dir
ecti
on
Vis
ibili
tyO
ther
obse
rvati
ons
Date
/ti
me
Tem
p.
(°C
)A
ir p
ress
ure
(m
b)
Rela
tive
hum
idit
yW
ind
speed
Win
d
dir
ecti
on
Vis
ibili
tyO
ther
obse
rvati
ons
Investigation 1: What Is Weather?
120-6523_Weather_LN_pg-1-60.indd1 1120-6523_Weather_LN_pg-1-60.indd1 1 6/6/08 1:47:00 PM6/6/08 1:47:00 PM

2
120-6523_Weather_LN_pg-1-60.indd2 2120-6523_Weather_LN_pg-1-60.indd2 2 6/6/08 1:47:03 PM6/6/08 1:47:03 PM
3
Name
Period Date
FOSS Weather and Water Course© The Regents of the University of California Student SheetCan be duplicated for classroom or workshop use.
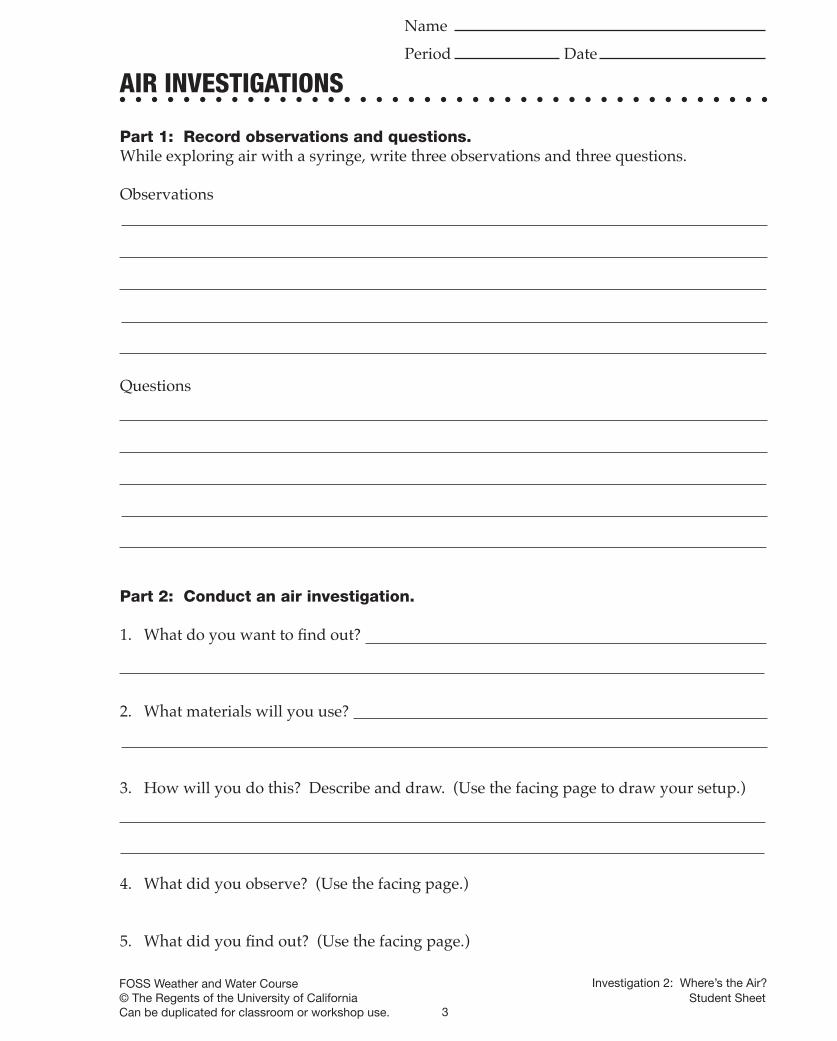
AIR INVESTIGATIONS
Part 1: Record observations and questions.While exploring air with a syringe, write three observations and three questions.
Observations
Questions
Part 2: Conduct an air investigation.
1. What do you want to fi nd out?
2. What materials will you use?
3. How will you do this? Describe and draw. (Use the facing page to draw your setup.)
4. What did you observe? (Use the facing page.)
5. What did you fi nd out? (Use the facing page.)
Investigation 2: Where’s the Air?
120-6523_Weather_LN_pg-1-60.indd3 3120-6523_Weather_LN_pg-1-60.indd3 3 6/6/08 1:47:03 PM6/6/08 1:47:03 PM

4
120-6523_Weather_LN_pg-1-60.indd4 4120-6523_Weather_LN_pg-1-60.indd4 4 6/6/08 1:47:03 PM6/6/08 1:47:03 PM
5
Name
Period Date
FOSS Weather and Water Course© The Regents of the University of California Student SheetCan be duplicated for classroom or workshop use.
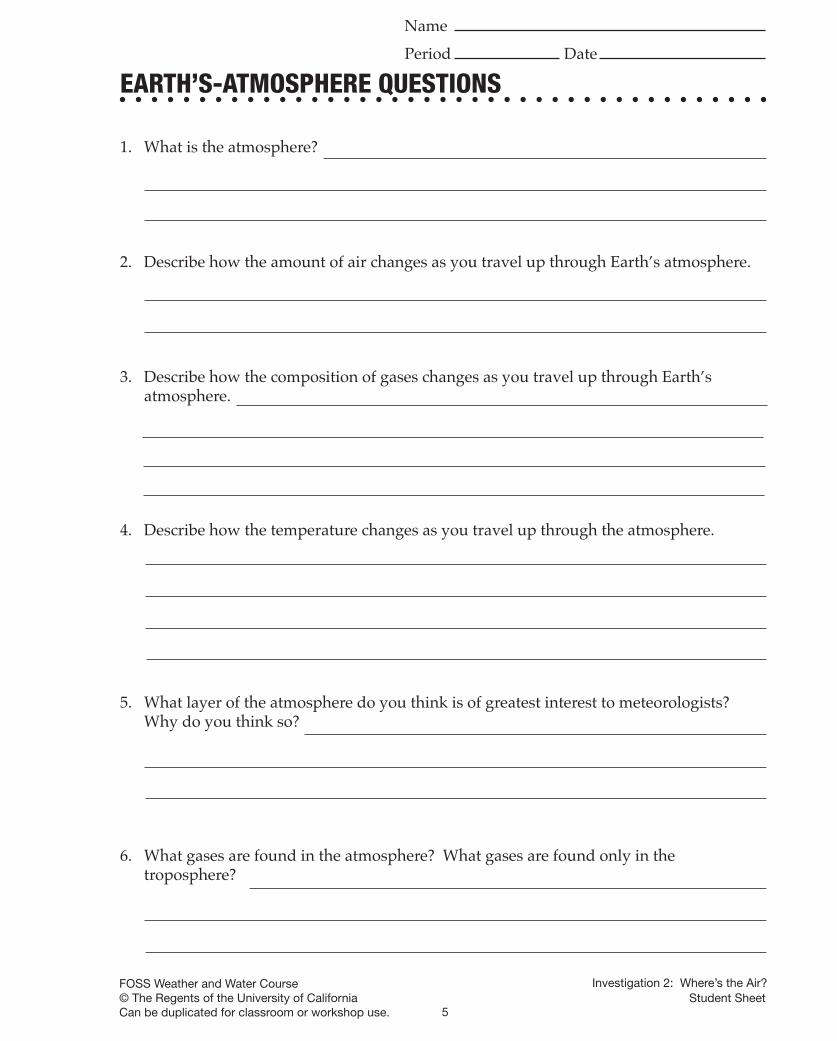
EARTH’S-ATMOSPHERE QUESTIONS
1. What is the atmosphere?
2. Describe how the amount of air changes as you travel up through Earth’s atmosphere.
3. Describe how the composition of gases changes as you travel up through Earth’s atmosphere.
4. Describe how the temperature changes as you travel up through the atmosphere.
5. What layer of the atmosphere do you think is of greatest interest to meteorologists? Why do you think so?
6. What gases are found in the atmosphere? What gases are found only in the troposphere?
Investigation 2: Where’s the Air?
120-6523_Weather_LN_pg-1-60.indd5 5120-6523_Weather_LN_pg-1-60.indd5 5 6/6/08 1:47:03 PM6/6/08 1:47:03 PM

6
120-6523_Weather_LN_pg-1-60.indd6 6120-6523_Weather_LN_pg-1-60.indd6 6 6/6/08 1:47:04 PM6/6/08 1:47:04 PM
7
Name
Period Date
FOSS Weather and Water Course© The Regents of the University of California Student SheetCan be duplicated for classroom or workshop use.
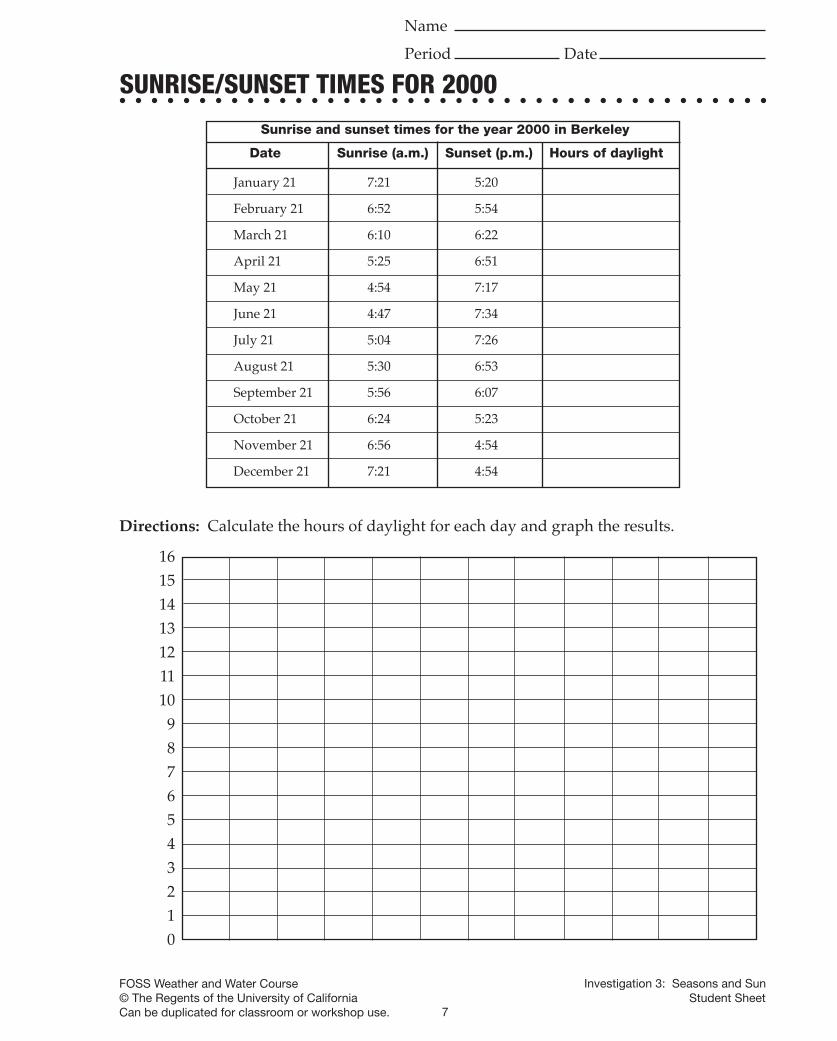
SUNRISE/SUNSET TIMES FOR 2000
January 21 7:21 5:20
February 21 6:52 5:54
March 21 6:10 6:22
April 21 5:25 6:51
May 21 4:54 7:17
June 21 4:47 7:34
July 21 5:04 7:26
August 21 5:30 6:53
September 21 5:56 6:07
October 21 6:24 5:23
November 21 6:56 4:54
December 21 7:21 4:54
Date Sunrise (a.m.) Sunset (p.m.) Hours of daylight
Sunrise and sunset times for the year 2000 in Berkeley
Directions: Calculate the hours of daylight for each day and graph the results.
161514131211109876543210
Investigation 3: Seasons and Sun
120-6523_Weather_LN_pg-1-60.indd7 7120-6523_Weather_LN_pg-1-60.indd7 7 6/6/08 1:47:04 PM6/6/08 1:47:04 PM

8
120-6523_Weather_LN_pg-1-60.indd8 8120-6523_Weather_LN_pg-1-60.indd8 8 6/6/08 1:47:04 PM6/6/08 1:47:04 PM
9
Name
Period Date
FOSS Weather and Water Course© The Regents of the University of California Student SheetCan be duplicated for classroom or workshop use.
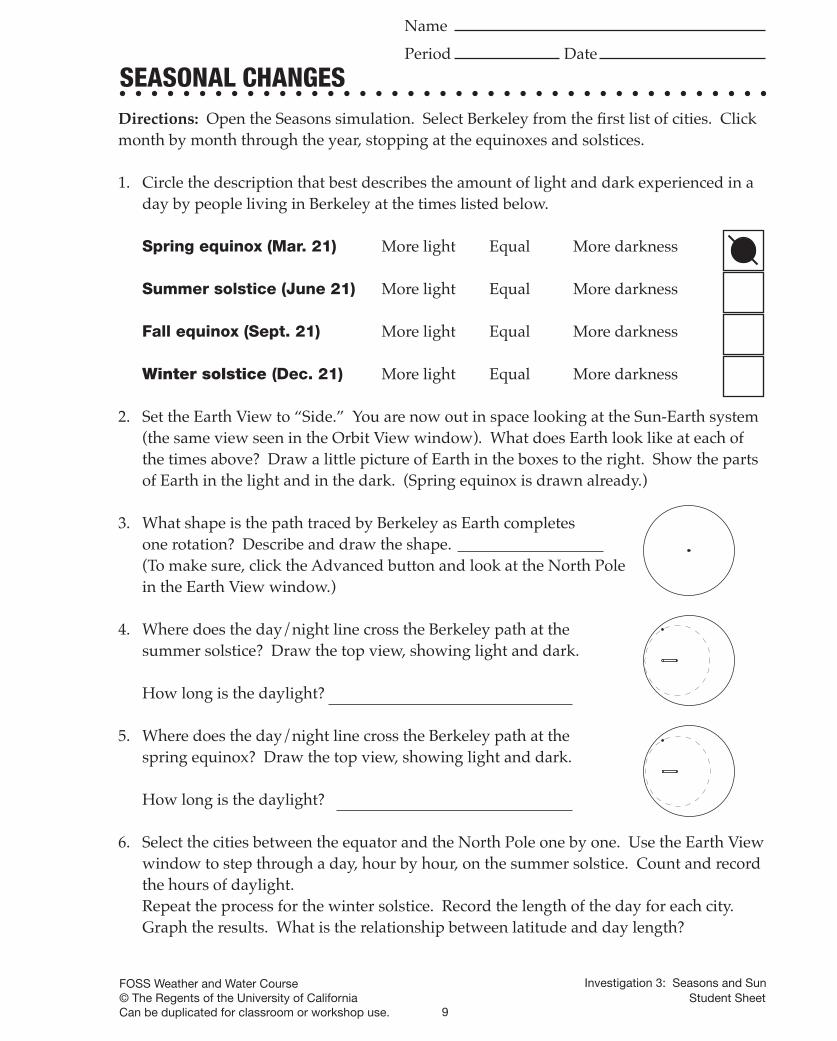
SEASONAL CHANGESDirections: Open the Seasons simulation. Select Berkeley from the fi rst list of cities. Click month by month through the year, stopping at the equinoxes and solstices.
1. Circle the description that best describes the amount of light and dark experienced in a day by people living in Berkeley at the times listed below.
Spring equinox (Mar. 21) More light Equal More darkness
Summer solstice (June 21) More light Equal More darkness
Fall equinox (Sept. 21) More light Equal More darkness
Winter solstice (Dec. 21) More light Equal More darkness
2. Set the Earth View to “Side.” You are now out in space looking at the Sun-Earth system (the same view seen in the Orbit View window). What does Earth look like at each of the times above? Draw a little picture of Earth in the boxes to the right. Show the parts of Earth in the light and in the dark. (Spring equinox is drawn already.)
3. What shape is the path traced by Berkeley as Earth completes one rotation? Describe and draw the shape.
(To make sure, click the Advanced button and look at the North Pole in the Earth View window.)
4. Where does the day/night line cross the Berkeley path at the summer solstice? Draw the top view, showing light and dark.
How long is the daylight?
5. Where does the day/night line cross the Berkeley path at the spring equinox? Draw the top view, showing light and dark.
How long is the daylight?
6. Select the cities between the equator and the North Pole one by one. Use the Earth View window to step through a day, hour by hour, on the summer solstice. Count and record the hours of daylight.Repeat the process for the winter solstice. Record the length of the day for each city. Graph the results. What is the relationship between latitude and day length?
Investigation 3: Seasons and Sun
120-6523_Weather_LN_pg-1-60.indd9 9120-6523_Weather_LN_pg-1-60.indd9 9 6/6/08 1:47:05 PM6/6/08 1:47:05 PM

10
120-6523_Weather_LN_pg-1-60.indd10 10120-6523_Weather_LN_pg-1-60.indd10 10 6/6/08 1:47:05 PM6/6/08 1:47:05 PM
11
Name
Period Date
FOSS Weather and Water Course© The Regents of the University of California Student SheetCan be duplicated for classroom or workshop use.
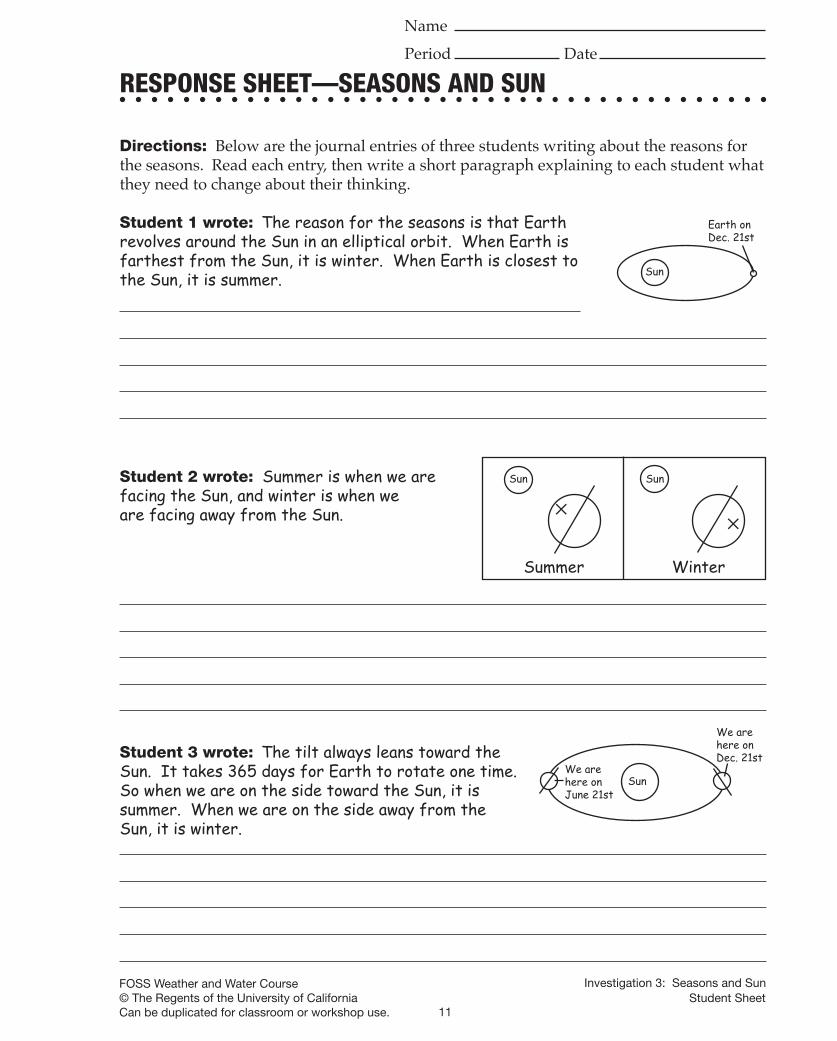
RESPONSE SHEET—SEASONS AND SUN
Directions: Below are the journal entries of three students writing about the reasons for the seasons. Read each entry, then write a short paragraph explaining to each student what they need to change about their thinking.
Student 1 wrote: The reason for the seasons is that Earth revolves around the Sun in an elliptical orbit. When Earth is farthest from the Sun, it is winter. When Earth is closest to the Sun, it is summer.
Student 2 wrote: Summer is when we are facing the Sun, and winter is when weare facing away from the Sun.
✕
Sun Sun
✕
Summer Winter
Sun
Earth on Dec. 21st
Student 3 wrote: The tilt always leans toward theSun. It takes 365 days for Earth to rotate one time. So when we are on the side toward the Sun, it is summer. When we are on the side away from the Sun, it is winter.
Sun
We are here on Dec. 21st
We are here on June 21st
Investigation 3: Seasons and Sun
120-6523_Weather_LN_pg-1-60.indd11 11120-6523_Weather_LN_pg-1-60.indd11 11 6/6/08 1:47:05 PM6/6/08 1:47:05 PM

12
120-6523_Weather_LN_pg-1-60.indd12 12120-6523_Weather_LN_pg-1-60.indd12 12 6/6/08 1:47:06 PM6/6/08 1:47:06 PM
13
Name
Period Date
FOSS Weather and Water Course© The Regents of the University of California Student SheetCan be duplicated for classroom or workshop use.
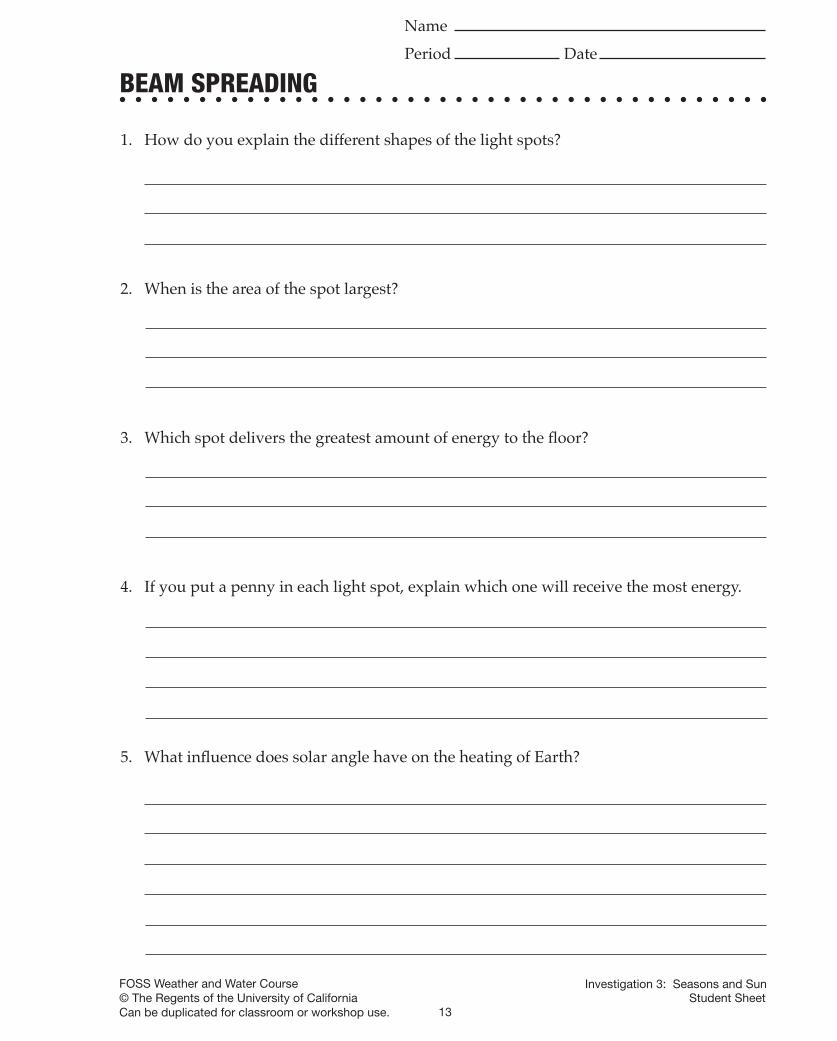
1. How do you explain the different shapes of the light spots?
2. When is the area of the spot largest?
3. Which spot delivers the greatest amount of energy to the fl oor?
4. If you put a penny in each light spot, explain which one will receive the most energy.
5. What infl uence does solar angle have on the heating of Earth?
BEAM SPREADING
Investigation 3: Seasons and Sun
120-6523_Weather_LN_pg-1-60.indd13 13120-6523_Weather_LN_pg-1-60.indd13 13 6/6/08 1:47:06 PM6/6/08 1:47:06 PM
14
Name
Period Date
FOSS Weather and Water Course© The Regents of the University of California Student SheetCan be duplicated for classroom or workshop use.
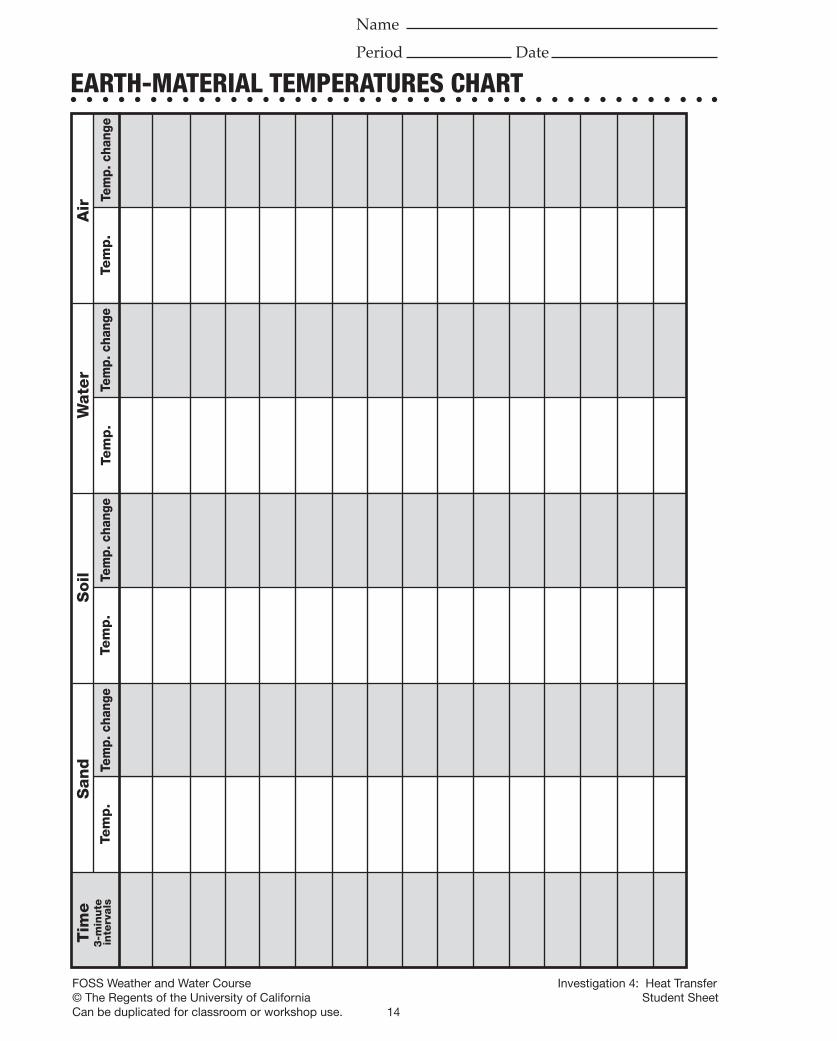
EARTH-MATERIAL TEMPERATURES CHARTTe
mp
.Te
mp.
Tem
p.
Tem
p.
Tem
p. c
hang
eTe
mp.
cha
nge
Tem
p. c
hang
eTe
mp.
cha
nge
Tim
e
S
and
Soil
W
ate
r
Air
3-m
inute
in
terv
als
Investigation 4: Heat Transfer
120-6523_Weather_LN_pg-1-60.indd14 14120-6523_Weather_LN_pg-1-60.indd14 14 6/6/08 1:47:06 PM6/6/08 1:47:06 PM
15
Name
Period Date
FOSS Weather and Water Course© The Regents of the University of California Student SheetCan be duplicated for classroom or workshop use.
EARTH-MATERIAL TEMPERATURES GRAPH
Investigation 4: Heat Transfer
120-6523_Weather_LN_pg-1-60.indd15 15120-6523_Weather_LN_pg-1-60.indd15 15 6/6/08 1:47:06 PM6/6/08 1:47:06 PM

16
120-6523_Weather_LN_pg-1-60.indd16 16120-6523_Weather_LN_pg-1-60.indd16 16 6/6/08 1:47:07 PM6/6/08 1:47:07 PM
17
Name
Period Date
FOSS Weather and Water Course© The Regents of the University of California Student SheetCan be duplicated for classroom or workshop use.
HEAT CONDUCTION
1. Write a defi nition for heat.
2. Describe heat conduction.
3. Explain your understanding of how heat transfers from one material to another.
4. Explain why a soda can feels cold when you take it out of the refrigerator.
Investigation 4: Heat Transfer
120-6523_Weather_LN_pg-1-60.indd17 17120-6523_Weather_LN_pg-1-60.indd17 17 6/6/08 1:47:07 PM6/6/08 1:47:07 PM

18
120-6523_Weather_LN_pg-1-60.indd18 18120-6523_Weather_LN_pg-1-60.indd18 18 6/6/08 1:47:07 PM6/6/08 1:47:07 PM
19
Name
Period Date
FOSS Weather and Water Course© The Regents of the University of California Student SheetCan be duplicated for classroom or workshop use.
Investigation 4: Heat Transfer
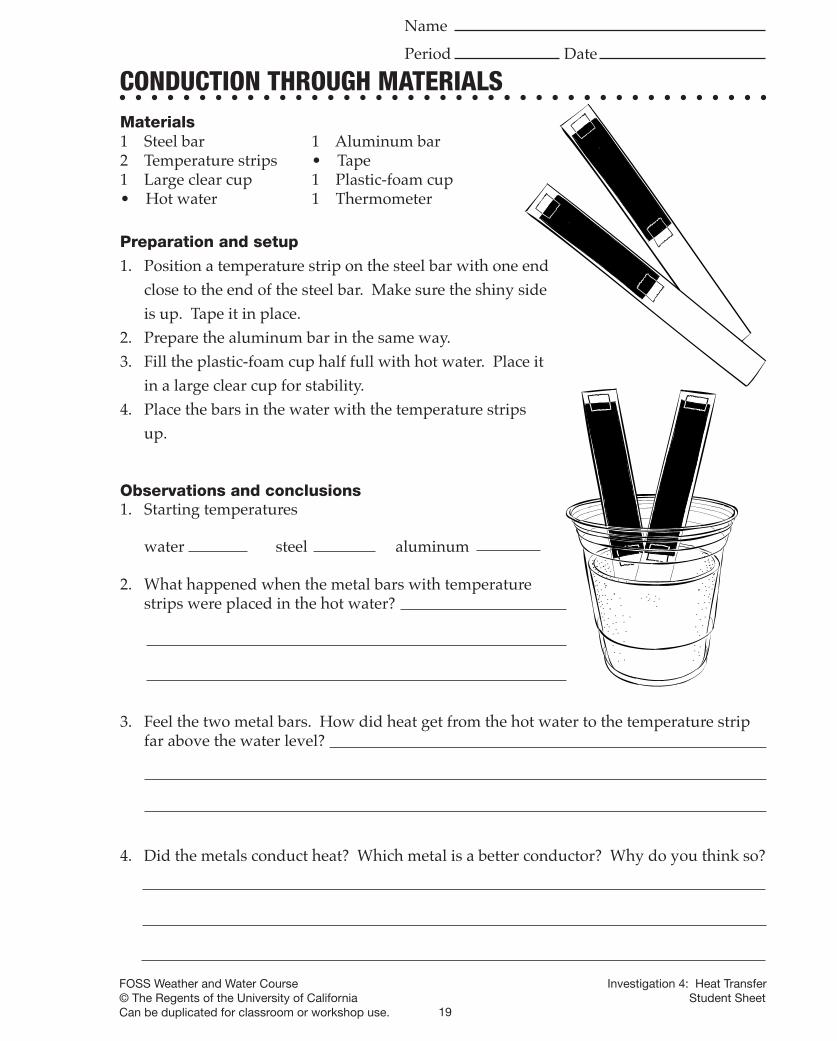
Observations and conclusions1. Starting temperatures
water steel aluminum
2. What happened when the metal bars with temperature strips were placed in the hot water?
CONDUCTION THROUGH MATERIALS
3. Feel the two metal bars. How did heat get from the hot water to the temperature strip far above the water level?
4. Did the metals conduct heat? Which metal is a better conductor? Why do you think so?
Materials1 Steel bar 1 Aluminum bar2 Temperature strips • Tape1 Large clear cup 1 Plastic-foam cup • Hot water 1 Thermometer Preparation and setup
1. Position a temperature strip on the steel bar with one end close to the end of the steel bar. Make sure the shiny side is up. Tape it in place.
2. Prepare the aluminum bar in the same way.3. Fill the plastic-foam cup half full with hot water. Place it
in a large clear cup for stability.4. Place the bars in the water with the temperature strips
up.
120-6523_Weather_LN_pg-1-60.indd19 19120-6523_Weather_LN_pg-1-60.indd19 19 6/6/08 1:47:07 PM6/6/08 1:47:07 PM

20
120-6523_Weather_LN_pg-1-60.indd20 20120-6523_Weather_LN_pg-1-60.indd20 20 6/6/08 1:47:08 PM6/6/08 1:47:08 PM
21
Name
Period Date
FOSS Weather and Water Course© The Regents of the University of California Student SheetCan be duplicated for classroom or workshop use.
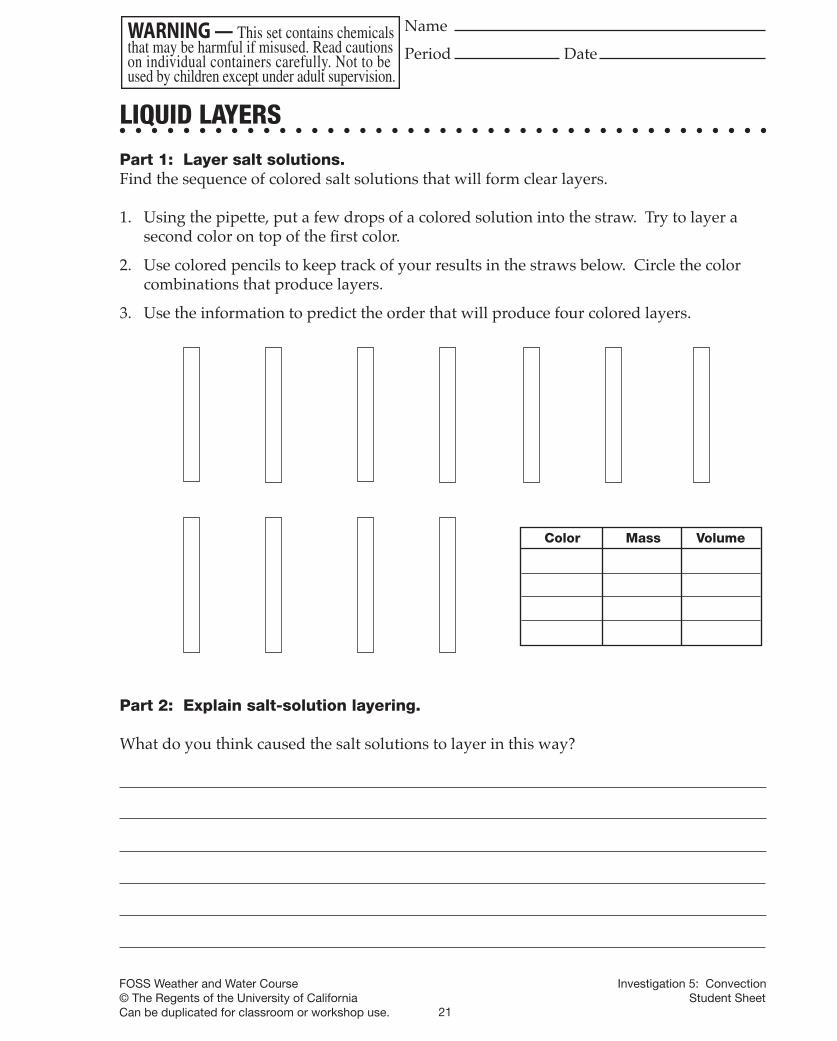
LIQUID LAYERS
Part 1: Layer salt solutions.Find the sequence of colored salt solutions that will form clear layers.
1. Using the pipette, put a few drops of a colored solution into the straw. Try to layer a second color on top of the fi rst color.
2. Use colored pencils to keep track of your results in the straws below. Circle the color combinations that produce layers.
3. Use the information to predict the order that will produce four colored layers.
Part 2: Explain salt-solution layering.
What do you think caused the salt solutions to layer in this way?
Color Mass Volume
Investigation 5: Convection
120-6523_Weather_LN_pg-1-60.indd21 21120-6523_Weather_LN_pg-1-60.indd21 21 6/6/08 1:47:08 PM6/6/08 1:47:08 PM

22
120-6523_Weather_LN_pg-1-60.indd22 22120-6523_Weather_LN_pg-1-60.indd22 22 6/6/08 1:47:08 PM6/6/08 1:47:08 PM
23
Name
Period Date
FOSS Weather and Water Course© The Regents of the University of California Student SheetCan be duplicated for classroom or workshop use.
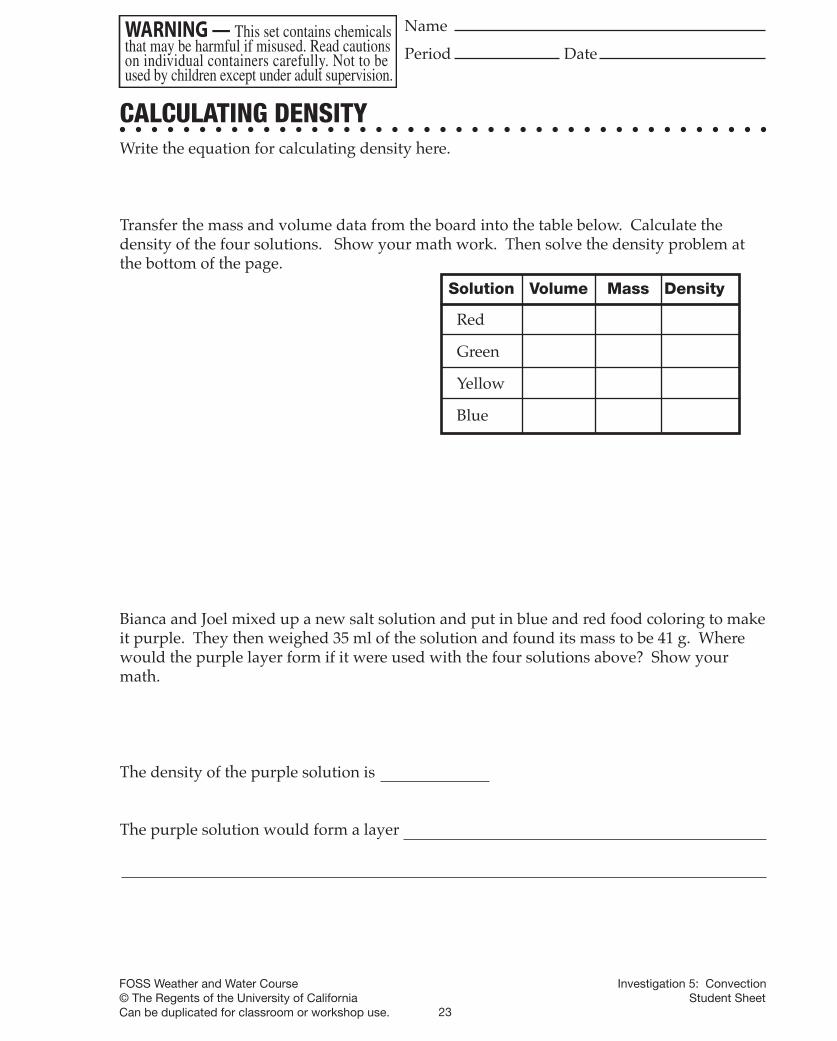
CALCULATING DENSITYWrite the equation for calculating density here.
Transfer the mass and volume data from the board into the table below. Calculate the density of the four solutions. Show your math work. Then solve the density problem at the bottom of the page.
Bianca and Joel mixed up a new salt solution and put in blue and red food coloring to make it purple. They then weighed 35 ml of the solution and found its mass to be 41 g. Where would the purple layer form if it were used with the four solutions above? Show your math.
The density of the purple solution is
The purple solution would form a layer
Solution Volume Mass Density
Red
Green
Yellow
Blue
Investigation 5: Convection
120-6523_Weather_LN_pg-1-60.indd23 23120-6523_Weather_LN_pg-1-60.indd23 23 6/6/08 1:47:09 PM6/6/08 1:47:09 PM

24
120-6523_Weather_LN_pg-1-60.indd24 24120-6523_Weather_LN_pg-1-60.indd24 24 6/6/08 1:47:09 PM6/6/08 1:47:09 PM
25
Name
Period Date
FOSS Weather and Water Course© The Regents of the University of California Student SheetCan be duplicated for classroom or workshop use.
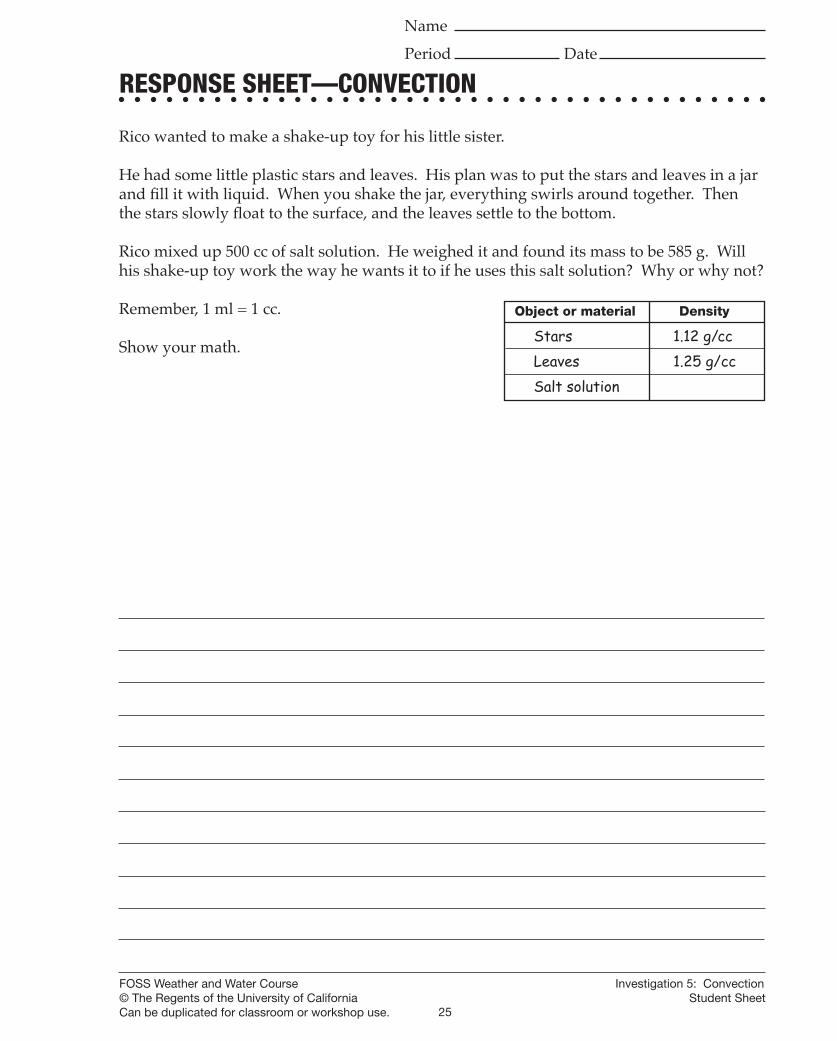
RESPONSE SHEET—CONVECTION
Rico wanted to make a shake-up toy for his little sister. He had some little plastic stars and leaves. His plan was to put the stars and leaves in a jar and fi ll it with liquid. When you shake the jar, everything swirls around together. Then the stars slowly fl oat to the surface, and the leaves settle to the bottom.
Rico mixed up 500 cc of salt solution. He weighed it and found its mass to be 585 g. Will his shake-up toy work the way he wants it to if he uses this salt solution? Why or why not?
Remember, 1 ml = 1 cc.
Show your math.
Stars 1.12 g/ccLeaves 1.25 g/ccSalt solution
Object or material Density
Investigation 5: Convection
120-6523_Weather_LN_pg-1-60.indd25 25120-6523_Weather_LN_pg-1-60.indd25 25 6/6/08 1:47:09 PM6/6/08 1:47:09 PM

26
120-6523_Weather_LN_pg-1-60.indd26 26120-6523_Weather_LN_pg-1-60.indd26 26 6/6/08 1:47:09 PM6/6/08 1:47:09 PM
27
Name
Period Date
FOSS Weather and Water Course© The Regents of the University of California Student SheetCan be duplicated for classroom or workshop use.
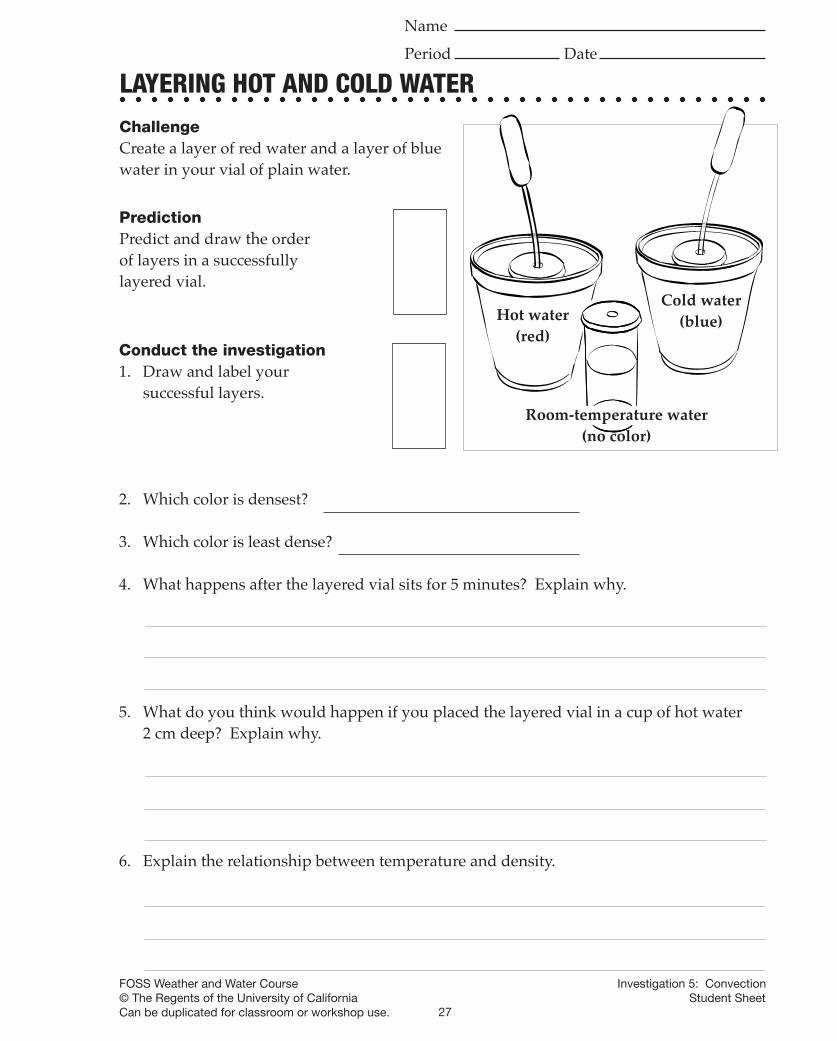
Conduct the investigation1. Draw and label your
successful layers.
2. Which color is densest?
3. Which color is least dense?
4. What happens after the layered vial sits for 5 minutes? Explain why.
5. What do you think would happen if you placed the layered vial in a cup of hot water 2 cm deep? Explain why.
6. Explain the relationship between temperature and density.
LAYERING HOT AND COLD WATERChallengeCreate a layer of red water and a layer of blue water in your vial of plain water.
PredictionPredict and draw the order of layers in a successfully layered vial.
Investigation 5: Convection
Cold water(blue)Hot water
(red)
Room-temperature water(no color)
120-6523_Weather_LN_pg-1-60.indd27 27120-6523_Weather_LN_pg-1-60.indd27 27 6/6/08 1:47:10 PM6/6/08 1:47:10 PM

28
120-6523_Weather_LN_pg-1-60.indd28 28120-6523_Weather_LN_pg-1-60.indd28 28 6/6/08 1:47:10 PM6/6/08 1:47:10 PM
29
Name
Period Date
FOSS Weather and Water Course© The Regents of the University of California Student SheetCan be duplicated for classroom or workshop use.
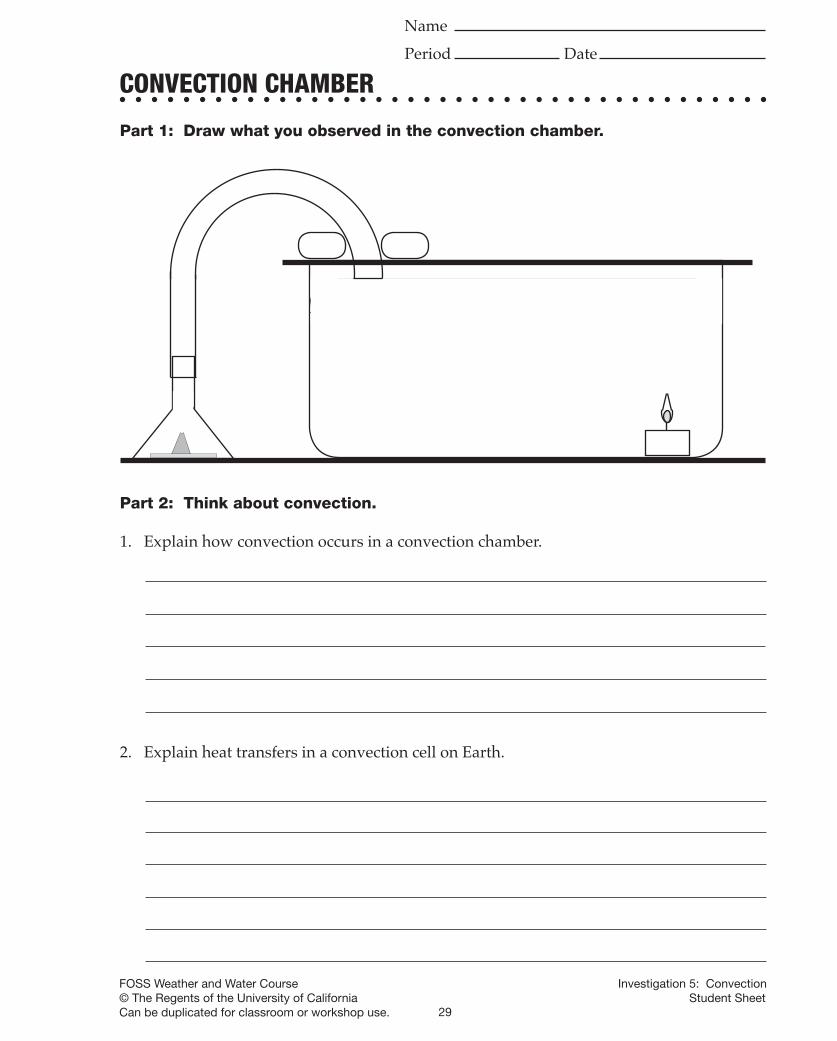
CONVECTION CHAMBER
Part 1: Draw what you observed in the convection chamber.
Part 2: Think about convection.
1. Explain how convection occurs in a convection chamber.
2. Explain heat transfers in a convection cell on Earth.
Investigation 5: Convection
120-6523_Weather_LN_pg-1-60.indd29 29120-6523_Weather_LN_pg-1-60.indd29 29 6/6/08 1:47:10 PM6/6/08 1:47:10 PM

30
120-6523_Weather_LN_pg-1-60.indd30 30120-6523_Weather_LN_pg-1-60.indd30 30 6/6/08 1:47:10 PM6/6/08 1:47:10 PM
31
Name
Period Date
FOSS Weather and Water Course© The Regents of the University of California Student SheetCan be duplicated for classroom or workshop use.
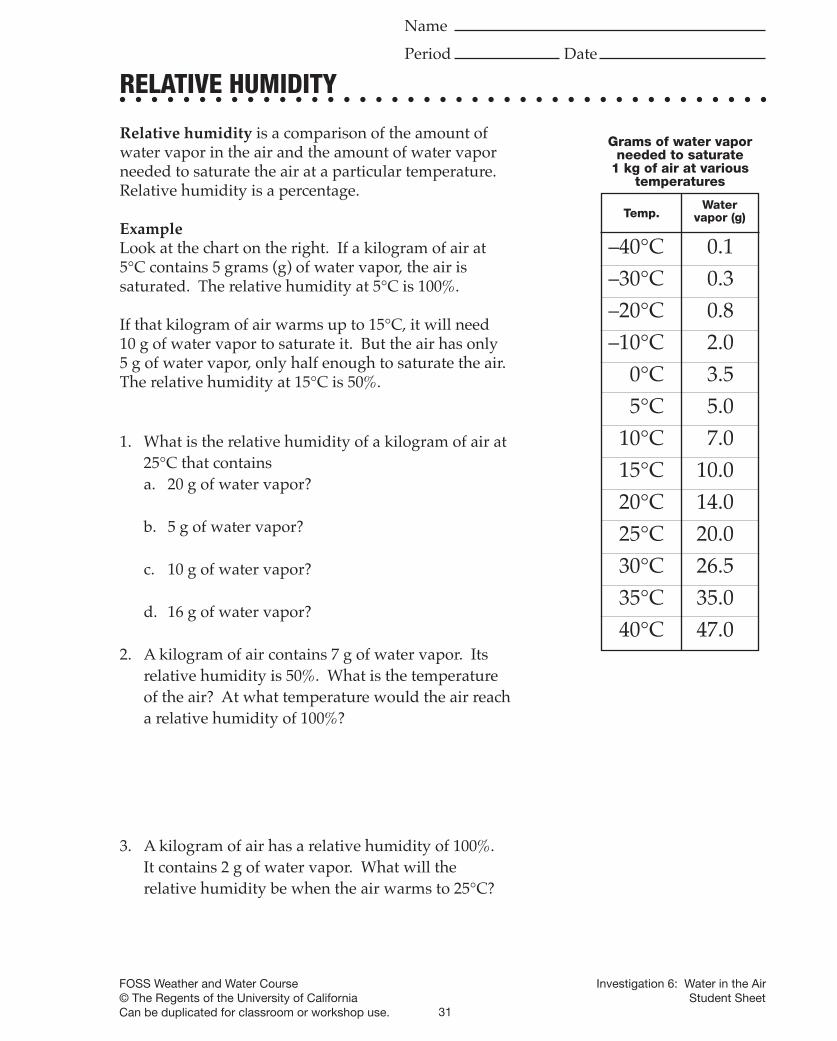
Grams of water vapor needed to saturate
1 kg of air at various temperatures
–40°C 0.1 –30°C 0.3 –20°C 0.8 –10°C 2.0 0°C 3.5 5°C 5.0 10°C 7.0 15°C 10.0 20°C 14.0 25°C 20.0 30°C 26.5 35°C 35.0 40°C 47.0
Watervapor (g)Temp.
Relative humidity is a comparison of the amount of water vapor in the air and the amount of water vapor needed to saturate the air at a particular temperature. Relative humidity is a percentage.
ExampleLook at the chart on the right. If a kilogram of air at 5°C contains 5 grams (g) of water vapor, the air is saturated. The relative humidity at 5°C is 100%.
If that kilogram of air warms up to 15°C, it will need 10 g of water vapor to saturate it. But the air has only 5 g of water vapor, only half enough to saturate the air. The relative humidity at 15°C is 50%.
1. What is the relative humidity of a kilogram of air at 25°C that contains
a. 20 g of water vapor?
b. 5 g of water vapor?
c. 10 g of water vapor?
d. 16 g of water vapor?
2. A kilogram of air contains 7 g of water vapor. Its relative humidity is 50%. What is the temperature of the air? At what temperature would the air reach a relative humidity of 100%?
3. A kilogram of air has a relative humidity of 100%. It contains 2 g of water vapor. What will the relative humidity be when the air warms to 25°C?
RELATIVE HUMIDITY
Investigation 6: Water in the Air
120-6523_Weather_LN_pg-1-60.indd31 31120-6523_Weather_LN_pg-1-60.indd31 31 6/6/08 1:47:11 PM6/6/08 1:47:11 PM

32
120-6523_Weather_LN_pg-1-60.indd32 32120-6523_Weather_LN_pg-1-60.indd32 32 6/6/08 1:47:11 PM6/6/08 1:47:11 PM
33
Name
Period Date
FOSS Weather and Water Course© The Regents of the University of California Student SheetCan be duplicated for classroom or workshop use.
RESPONSE SHEET—WATER IN THE AIR
Christine and Ingrid trotted to the sideline after a tough soccer workout. Both were dripping with sweat. Christine said to Ingrid,
I have heard that sweating helps keep you cool when you are working hard. Could that be right?
Ingrid responded,
I think it has something to do with condensation, but I’m not sure how it works.
What would you tell the girls to help them better understand sweating and cooling?
Investigation 6: Water in the Air
120-6523_Weather_LN_pg-1-60.indd33 33120-6523_Weather_LN_pg-1-60.indd33 33 6/6/08 1:47:11 PM6/6/08 1:47:11 PM

34
120-6523_Weather_LN_pg-1-60.indd34 34120-6523_Weather_LN_pg-1-60.indd34 34 6/6/08 1:47:11 PM6/6/08 1:47:11 PM
35
Name
Period Date
FOSS Weather and Water Course© The Regents of the University of California Student SheetCan be duplicated for classroom or workshop use.
DEW-POINT QUESTIONS1. Dew point is monitored by meteorologists. Why do you think meteorologists are
interested in dew point?
2. Under what conditions would dew not form?
3. What do you think would happen to water vapor that condenses on a surface that has a temperature below 0°C? What is it called?
4. People who wear glasses often see condensation on their lenses when they walk from a cold, outdoor environment into a warm house. Why does that happen? How could they prevent it?
5. Do you think dew point is always the same? How could you fi nd out? (Write your answer on the back of this sheet.)
Investigation 6: Water in the Air
120-6523_Weather_LN_pg-1-60.indd35 35120-6523_Weather_LN_pg-1-60.indd35 35 6/6/08 1:47:12 PM6/6/08 1:47:12 PM

36
120-6523_Weather_LN_pg-1-60.indd36 36120-6523_Weather_LN_pg-1-60.indd36 36 6/6/08 1:47:12 PM6/6/08 1:47:12 PM
37
Name
Period Date
FOSS Weather and Water Course© The Regents of the University of California Student SheetCan be duplicated for classroom or workshop use.
PRESSURE/TEMPERATURE DEMONSTRATIONQuestion
What happens to the temperature of a gas if you squeeze it into a smaller volume?
Materials
• Soda bottles • Liquid-crystal thermometers
• Soda-bottle pump • Masking tape
Observations and conclusion
1. Record your observations and conclusion.
2. Knowing what you do about the movement of molecules in a gas, explain the change in temperature as you changed the gas volume by squeezing the bottle or when additional air was forced into the volume of the bottle.
3. How is the bottle demonstration similar to what happened inside a syringe when you pushed in the plunger?
4. How do you think the temperature changes inside of the syringe when the air is compressed with the plunger?
Investigation 6: Water in the Air
120-6523_Weather_LN_pg-1-60.indd37 37120-6523_Weather_LN_pg-1-60.indd37 37 6/6/08 1:47:12 PM6/6/08 1:47:12 PM

38
120-6523_Weather_LN_pg-1-60.indd38 38120-6523_Weather_LN_pg-1-60.indd38 38 6/6/08 1:47:13 PM6/6/08 1:47:13 PM
39
Name
Period Date
FOSS Weather and Water Course© The Regents of the University of California Student SheetCan be duplicated for classroom or workshop use.
View and compare the weather-balloon launches for Chicago and Phoenix. Answer these questions.
1. What was the trend in air pressure as altitude increased in Chicago? In Phoenix?
2. Describe the temperature trends in both Chicago and Phoenix. Was the trend the same in both cities?
3. Which weather factors varied the most between Chicago and Phoenix?
4. Do you think it might be a cloudy day in Chicago? What evidence do you have? At what altitude would you see clouds?
5. Do you think it might be a cloudy day in Phoenix? What evidence do you have? At what altitude would you see clouds?
WEATHER-BALLOON SIMULATION
Investigation 6: Water in the Air
120-6523_Weather_LN_pg-1-60.indd39 39120-6523_Weather_LN_pg-1-60.indd39 39 6/6/08 1:47:13 PM6/6/08 1:47:13 PM
40
Name
Period Date
FOSS Weather and Water Course© The Regents of the University of California Student SheetCan be duplicated for classroom or workshop use.
UPPER-AIR SOUNDING GRAPH
0° 10° 20° 30° 40°-10°-20°-30°-40°-50°-60°-70°-80°-90° 50°
Investigation 6: Water in the Air
120-6523_Weather_LN_pg-1-60.indd40 40120-6523_Weather_LN_pg-1-60.indd40 40 6/6/08 1:47:13 PM6/6/08 1:47:13 PM
41
Name
Period Date
FOSS Weather and Water Course© The Regents of the University of California Student SheetCan be duplicated for classroom or workshop use.
TEMPERATURE NUMBER LINE
–10
–8–6
–4–2
02
46
810
12
14
16
18
20
22
24
26
28
30
32
34
36
38
Investigation 6: Water in the Air
120-6523_Weather_LN_pg-1-60.indd41 41120-6523_Weather_LN_pg-1-60.indd41 41 6/6/08 1:47:13 PM6/6/08 1:47:13 PM

42
120-6523_Weather_LN_pg-1-60.indd42 42120-6523_Weather_LN_pg-1-60.indd42 42 6/6/08 1:47:14 PM6/6/08 1:47:14 PM
43
Name
Period Date
FOSS Weather and Water Course© The Regents of the University of California Student SheetCan be duplicated for classroom or workshop use.
WATER-CYCLE GAME
Directions: As you move through the water cycle, keep track of where you go.
Stop 1
Stop 2
Stop 3
Stop 4
Stop 5
Stop 6
Stop 7
Stop 8
Stop 9
Stop 10
Questions
1. Which location did you visit most often?
2. Which location did you visit the least?
3. Were there any locations you never visited? Which ones?
4. Write down one question you have about the water cycle after you fi nish the game.
Round 1 locations Round 2 locations Round 3 (global warming)
Investigation 7: The Water Planet
120-6523_Weather_LN_pg-1-60.indd43 43120-6523_Weather_LN_pg-1-60.indd43 43 6/6/08 1:47:14 PM6/6/08 1:47:14 PM

44
120-6523_Weather_LN_pg-1-60.indd44 44120-6523_Weather_LN_pg-1-60.indd44 44 6/6/08 1:47:14 PM6/6/08 1:47:14 PM
45
Name
Period Date
FOSS Weather and Water Course© The Regents of the University of California Student SheetCan be duplicated for classroom or workshop use.
Part 1: PredictionPredict what will happen to the water in the clear tube when the jar is squeezed.
Part 2: Explore the jar1. Construct a bottle-in-a-jar pressure indicator. Give it a squeeze. What happens?
2. Why do you think it behaves that way?
3. If you reduced the air pressure in the jar, what would happen to the level of water in the clear tube? Why?
PRESSURE IN A JAR
Investigation 8: Air Pressure and Wind
120-6523_Weather_LN_pg-1-60.indd45 45120-6523_Weather_LN_pg-1-60.indd45 45 6/6/08 1:47:14 PM6/6/08 1:47:14 PM

46
120-6523_Weather_LN_pg-1-60.indd46 46120-6523_Weather_LN_pg-1-60.indd46 46 6/6/08 1:47:15 PM6/6/08 1:47:15 PM
47
Name
Period Date
FOSS Weather and Water Course© The Regents of the University of California Student SheetCan be duplicated for classroom or workshop use.
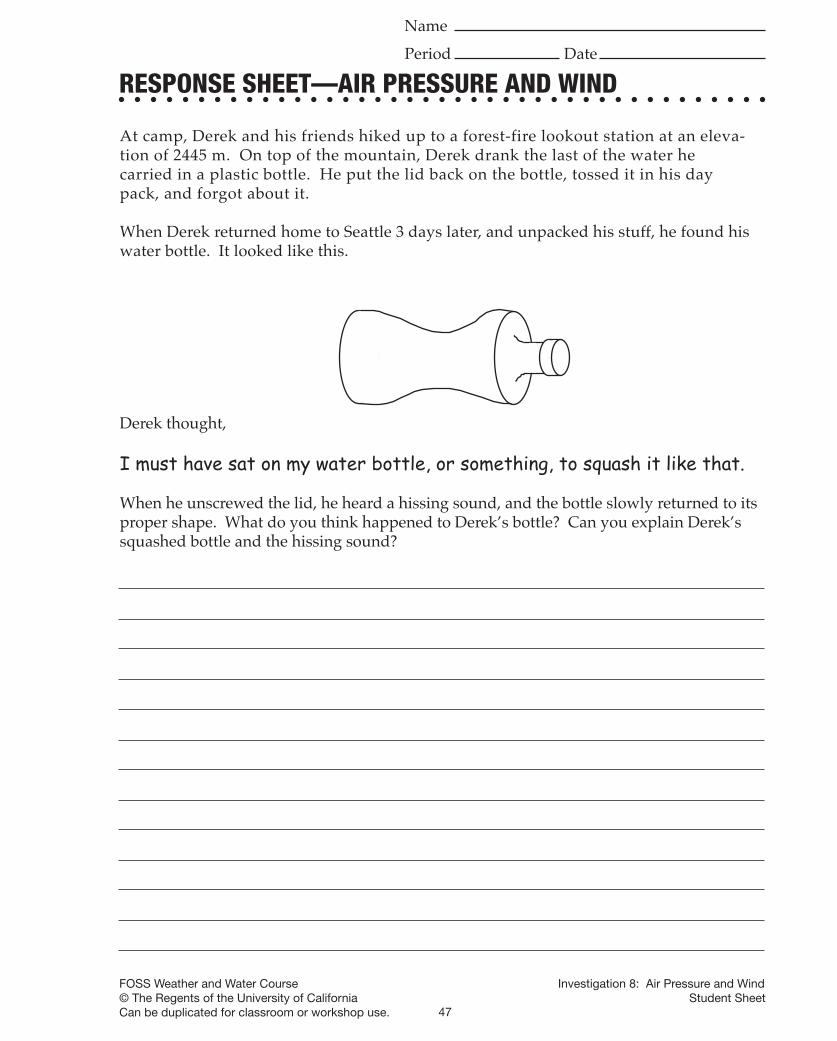
RESPONSE SHEET—AIR PRESSURE AND WIND
At camp, Derek and his friends hiked up to a forest-fire lookout station at an eleva-tion of 2445 m. On top of the mountain, Derek drank the last of the water he carried in a plastic bottle. He put the lid back on the bottle, tossed it in his day pack, and forgot about it.
When Derek returned home to Seattle 3 days later, and unpacked his stuff, he found his water bottle. It looked like this.
Derek thought,
I must have sat on my water bottle, or something, to squash it like that.
When he unscrewed the lid, he heard a hissing sound, and the bottle slowly returned to its proper shape. What do you think happened to Derek’s bottle? Can you explain Derek’s squashed bottle and the hissing sound?
Investigation 8: Air Pressure and Wind
120-6523_Weather_LN_pg-1-60.indd47 47120-6523_Weather_LN_pg-1-60.indd47 47 6/6/08 1:47:15 PM6/6/08 1:47:15 PM
48
Name
Period Date
FOSS Weather and Water Course© The Regents of the University of California Student SheetCan be duplicated for classroom or workshop use.
View the local-winds animations on the computer and follow the directions below.
LOCAL WINDS
Sea Breeze
Draw the land, water, and Sun. Show circulation by convection.Label the low- and high-pressure areas.Draw an arrow showing the wind direction.
Land Breeze
Draw the land, water, and Sun. Show circulation by convection.Label the low- and high-pressure areas.Draw an arrow showing the wind direction.
Investigation 8: Air Pressure and Wind
120-6523_Weather_LN_pg-1-60.indd48 48120-6523_Weather_LN_pg-1-60.indd48 48 6/6/08 1:47:15 PM6/6/08 1:47:15 PM
49
Name
Period Date
FOSS Weather and Water Course© The Regents of the University of California Student SheetCan be duplicated for classroom or workshop use.
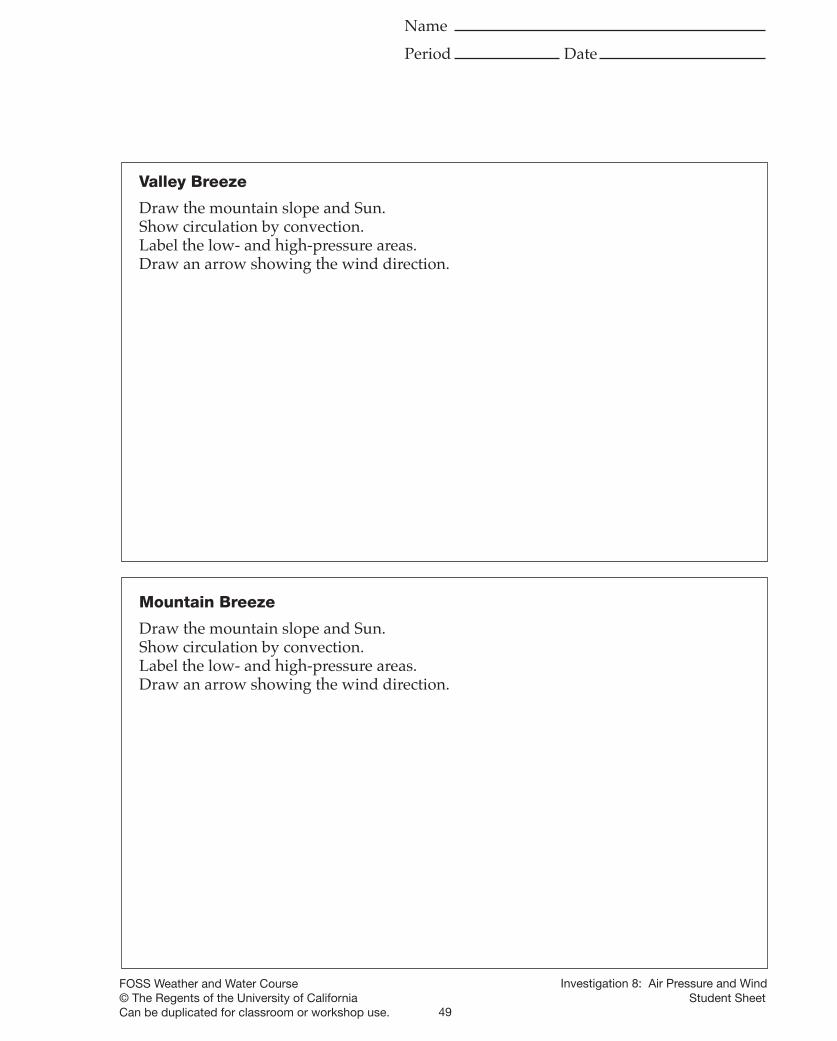
Mountain Breeze
Draw the mountain slope and Sun.Show circulation by convection.Label the low- and high-pressure areas.Draw an arrow showing the wind direction.
Valley Breeze
Draw the mountain slope and Sun.Show circulation by convection.Label the low- and high-pressure areas.Draw an arrow showing the wind direction.
Investigation 8: Air Pressure and Wind
120-6523_Weather_LN_pg-1-60.indd49 49120-6523_Weather_LN_pg-1-60.indd49 49 6/6/08 1:47:16 PM6/6/08 1:47:16 PM
50
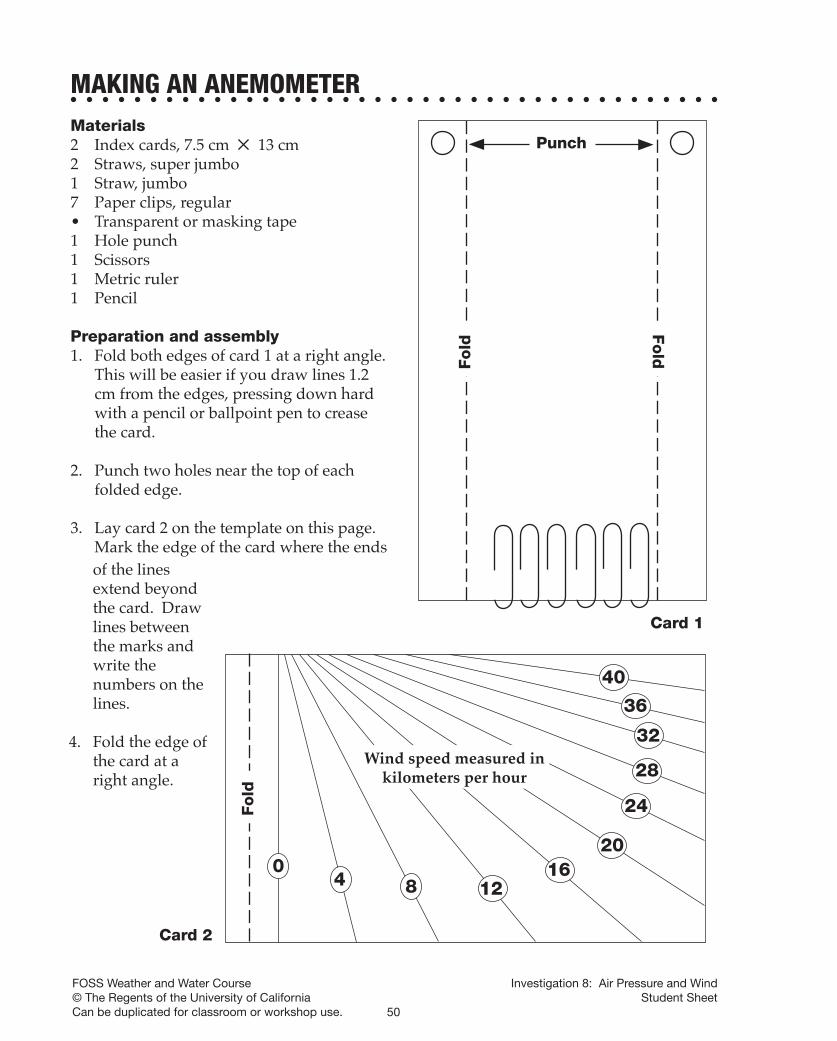
MAKING AN ANEMOMETERMaterials2 Index cards, 7.5 cm ✕ 13 cm2 Straws, super jumbo1 Straw, jumbo7 Paper clips, regular• Transparent or masking tape1 Hole punch1 Scissors1 Metric ruler1 Pencil
Preparation and assembly1. Fold both edges of card 1 at a right angle.
This will be easier if you draw lines 1.2 cm from the edges, pressing down hard with a pencil or ballpoint pen to crease the card.
2. Punch two holes near the top of each folded edge.
3. Lay card 2 on the template on this page. Mark the edge of the card where the ends
Card 1
of the lines extend beyond the card. Draw lines between the marks and write the numbers on the lines.
4. Fold the edge of the card at a right angle.
Fold
Fold
Punch
04 12
1620
24
28
36
40
8
Card 2
Fold
Wind speed measured in kilometers per hour
32
Investigation 8: Air Pressure and WindStudent Sheet
FOSS Weather and Water Course© The Regents of the University of California Can be duplicated for classroom or workshop use.
120-6523_Weather_LN_pg-1-60.indd50 50120-6523_Weather_LN_pg-1-60.indd50 50 6/6/08 1:47:16 PM6/6/08 1:47:16 PM
51
FOSS Weather and Water Course© The Regents of the University of California Student SheetCan be duplicated for classroom or workshop use.
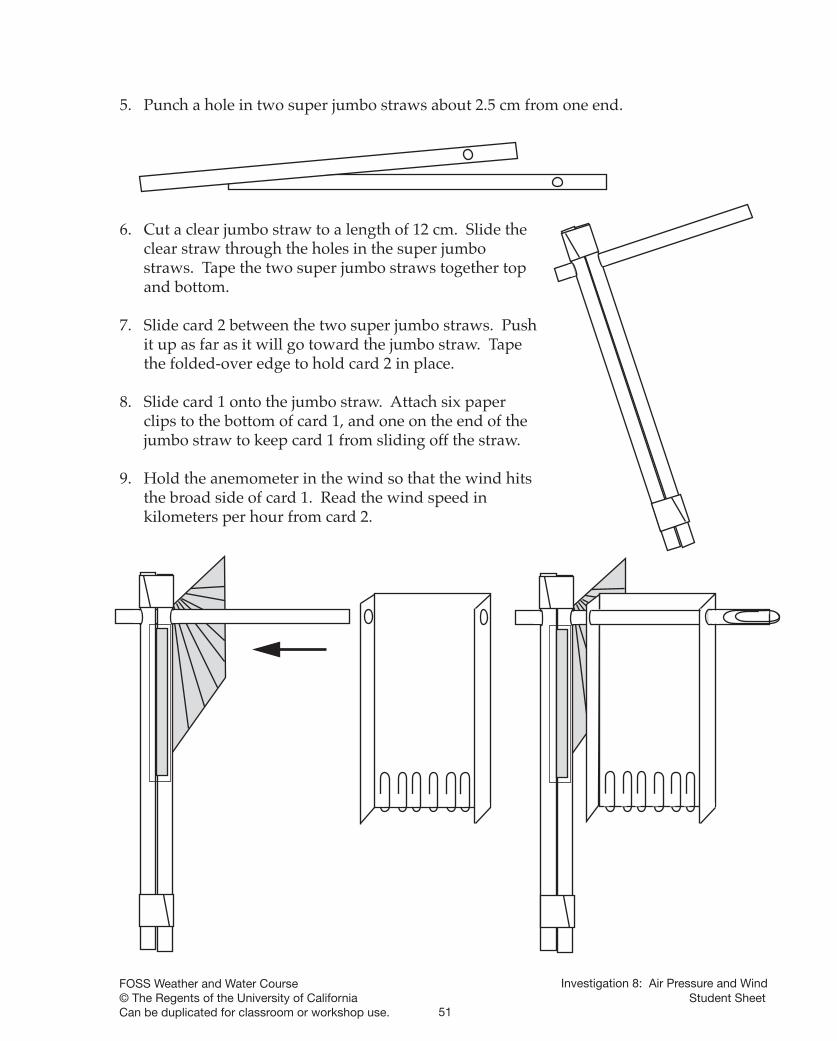
5. Punch a hole in two super jumbo straws about 2.5 cm from one end.
6. Cut a clear jumbo straw to a length of 12 cm. Slide the clear straw through the holes in the super jumbo straws. Tape the two super jumbo straws together top and bottom.
7. Slide card 2 between the two super jumbo straws. Push it up as far as it will go toward the jumbo straw. Tape the folded-over edge to hold card 2 in place.
8. Slide card 1 onto the jumbo straw. Attach six paper clips to the bottom of card 1, and one on the end of the jumbo straw to keep card 1 from sliding off the straw.
9. Hold the anemometer in the wind so that the wind hits the broad side of card 1. Read the wind speed in kilometers per hour from card 2.
Investigation 8: Air Pressure and Wind
120-6523_Weather_LN_pg-1-60.indd51 51120-6523_Weather_LN_pg-1-60.indd51 51 6/6/08 1:47:16 PM6/6/08 1:47:16 PM

52
120-6523_Weather_LN_pg-1-60.indd52 52120-6523_Weather_LN_pg-1-60.indd52 52 6/6/08 1:47:17 PM6/6/08 1:47:17 PM
53
Name
Period Date
FOSS Weather and Water Course© The Regents of the University of California Student SheetCan be duplicated for classroom or workshop use.
Investigation 8: Air Pressure and Wind
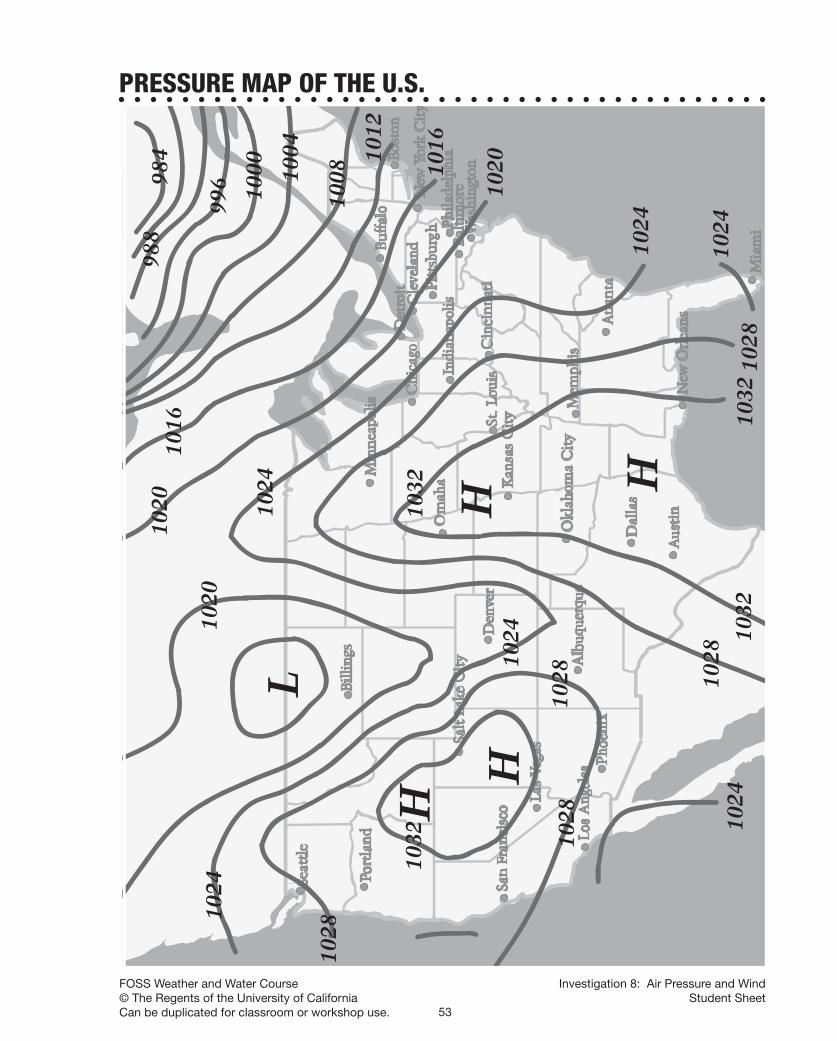
PRESSURE MAP OF THE U.S.
120-6523_Weather_LN_pg-1-60.indd53 53120-6523_Weather_LN_pg-1-60.indd53 53 6/6/08 1:47:17 PM6/6/08 1:47:17 PM

54
120-6523_Weather_LN_pg-1-60.indd54 54120-6523_Weather_LN_pg-1-60.indd54 54 6/6/08 1:47:17 PM6/6/08 1:47:17 PM
55
Name
Period Date
FOSS Weather and Water Course© The Regents of the University of California Student SheetCan be duplicated for classroom or workshop use.
1. Describe the bag’s properties before it is used to model an air mass.
2. Describe what happened to the bag while it was outside.
3. How is the black-bag model like a real air mass and how is it different?
4. What questions do you have about the formation of air masses after observing this model?
SOLAR-BALLOON OBSERVATIONS
Investigation 9: Weather and Climate
120-6523_Weather_LN_pg-1-60.indd55 55120-6523_Weather_LN_pg-1-60.indd55 55 6/6/08 1:47:17 PM6/6/08 1:47:17 PM

56
120-6523_Weather_LN_pg-1-60.indd56 56120-6523_Weather_LN_pg-1-60.indd56 56 6/6/08 1:47:18 PM6/6/08 1:47:18 PM
57
Name
Period Date
FOSS Weather and Water Course© The Regents of the University of California Student SheetCan be duplicated for classroom or workshop use.
READING WEATHER MAPS
Use the Sample Weather-Map Symbol sheet and the Surface Observations map in the resources book to complete this sheet.
1. Find the weather-station data for San Francisco, California. Use the weather-map symbol to fi gure out the following:
Temperature (°F) Air pressure (mb)
Wind direction Cloud cover
Wind speed (knots)
2. Which cities are experiencing haze?
3. Which cities are experiencing rain?
4. Which cities are experiencing fog?
5. Which city has the highest air pressure? How high is it? The lowest? How low is it?
6. Which areas of the United States are experiencing the warmest temperatures?
7. List two other observations about the weather across the United States for this date.
Investigation 9: Weather and Climate
120-6523_Weather_LN_pg-1-60.indd57 57120-6523_Weather_LN_pg-1-60.indd57 57 6/6/08 1:47:18 PM6/6/08 1:47:18 PM

58
120-6523_Weather_LN_pg-1-60.indd58 58120-6523_Weather_LN_pg-1-60.indd58 58 6/6/08 1:47:18 PM6/6/08 1:47:18 PM
59
Name
Period Date
FOSS Weather and Water Course© The Regents of the University of California Student SheetCan be duplicated for classroom or workshop use.
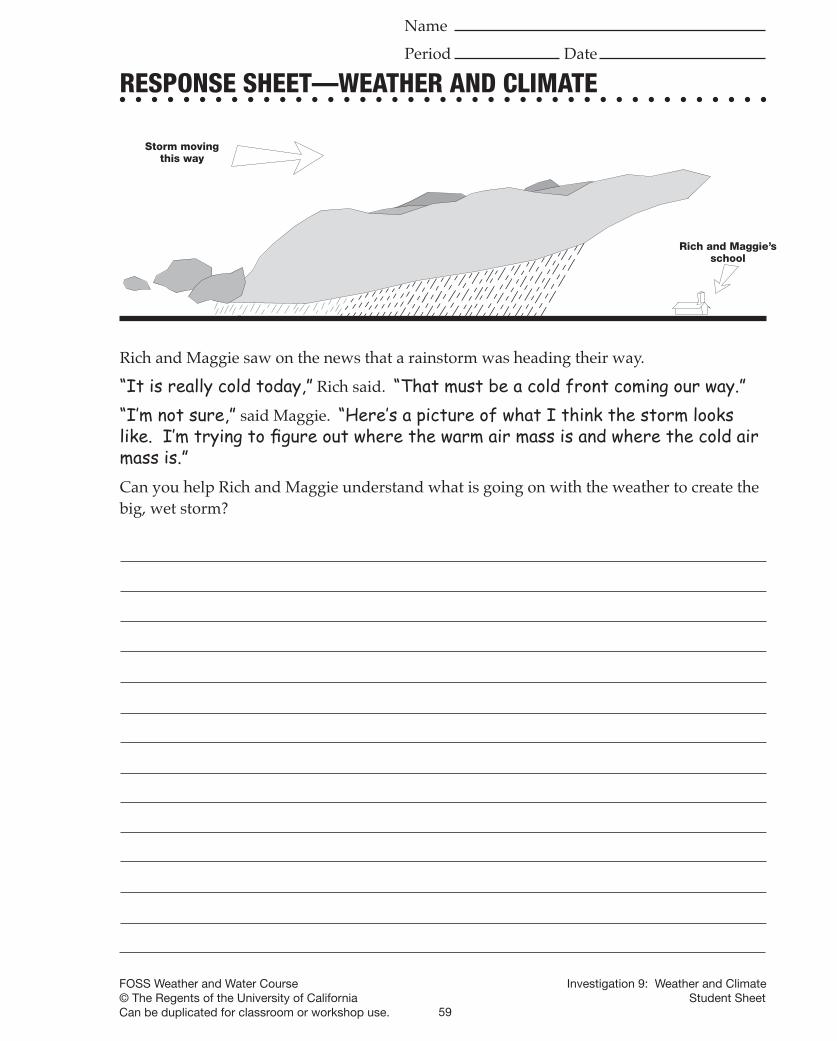
RESPONSE SHEET—WEATHER AND CLIMATE
Rich and Maggie saw on the news that a rainstorm was heading their way.
“It is really cold today,” Rich said. “That must be a cold front coming our way.”“I’m not sure,” said Maggie. “Here’s a picture of what I think the storm looks like. I’m trying to fi gure out where the warm air mass is and where the cold air mass is.”Can you help Rich and Maggie understand what is going on with the weather to create the big, wet storm?
Rich and Maggie’s school
Storm moving this way
Investigation 9: Weather and Climate
120-6523_Weather_LN_pg-1-60.indd59 59120-6523_Weather_LN_pg-1-60.indd59 59 6/6/08 1:47:18 PM6/6/08 1:47:18 PM
60
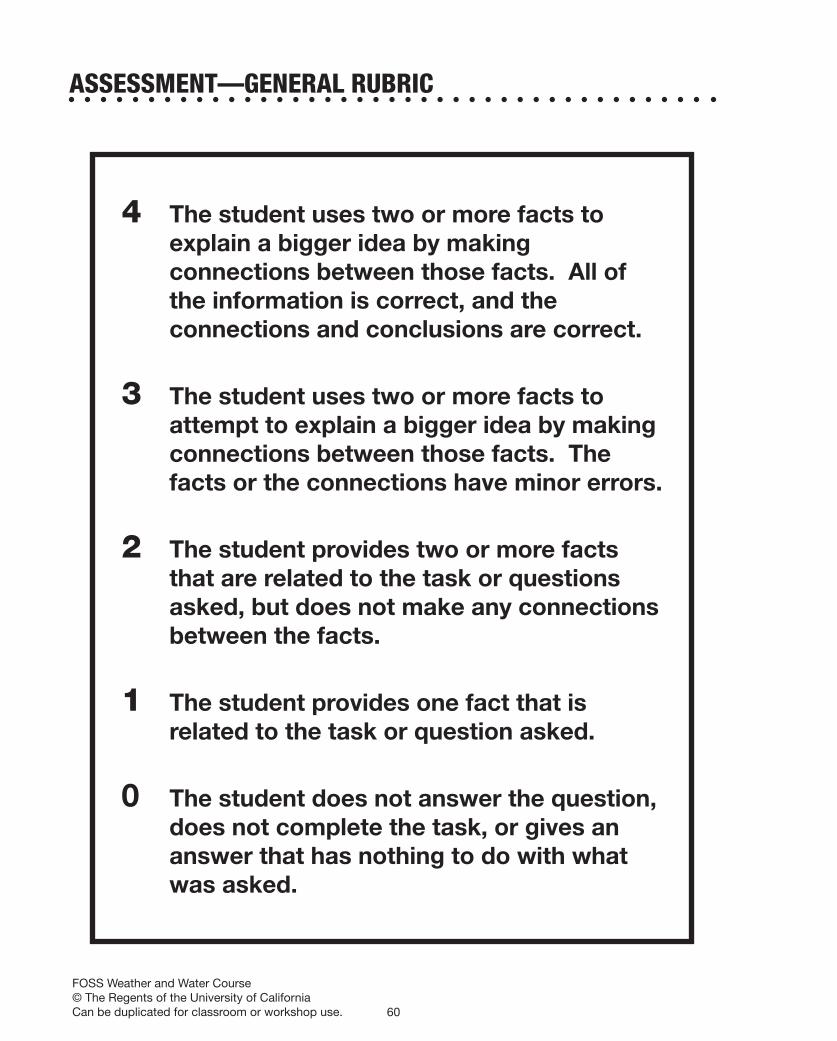
ASSESSMENT—GENERAL RUBRIC
4 The student uses two or more facts to explain a bigger idea by making connections between those facts. All of the information is correct, and the connections and conclusions are correct.
3 The student uses two or more facts to attempt to explain a bigger idea by making connections between those facts. The facts or the connections have minor errors.
2 The student provides two or more facts that are related to the task or questions asked, but does not make any connections between the facts.
1 The student provides one fact that is related to the task or question asked.
0 The student does not answer the question, does not complete the task, or gives an answer that has nothing to do with what was asked.
FOSS Weather and Water Course© The Regents of the University of California Can be duplicated for classroom or workshop use.
120-6523_Weather_LN_pg-1-60.indd60 60120-6523_Weather_LN_pg-1-60.indd60 60 6/6/08 1:47:19 PM6/6/08 1:47:19 PM