Embed Size (px)
Citation preview
Lab ManualPHYS 104L
Astronomy LabGJ Rm# 229
Section:Times:
1
TA Name:
TA email:
Lab Coordinator: Jacob Turneremail: [email protected]: GJ 224Phone: (208) 885-2730
Contact Lab Coordinator only for questions about registration of class management.Questions about Lab Reports and Attendance should be directed to your TA.
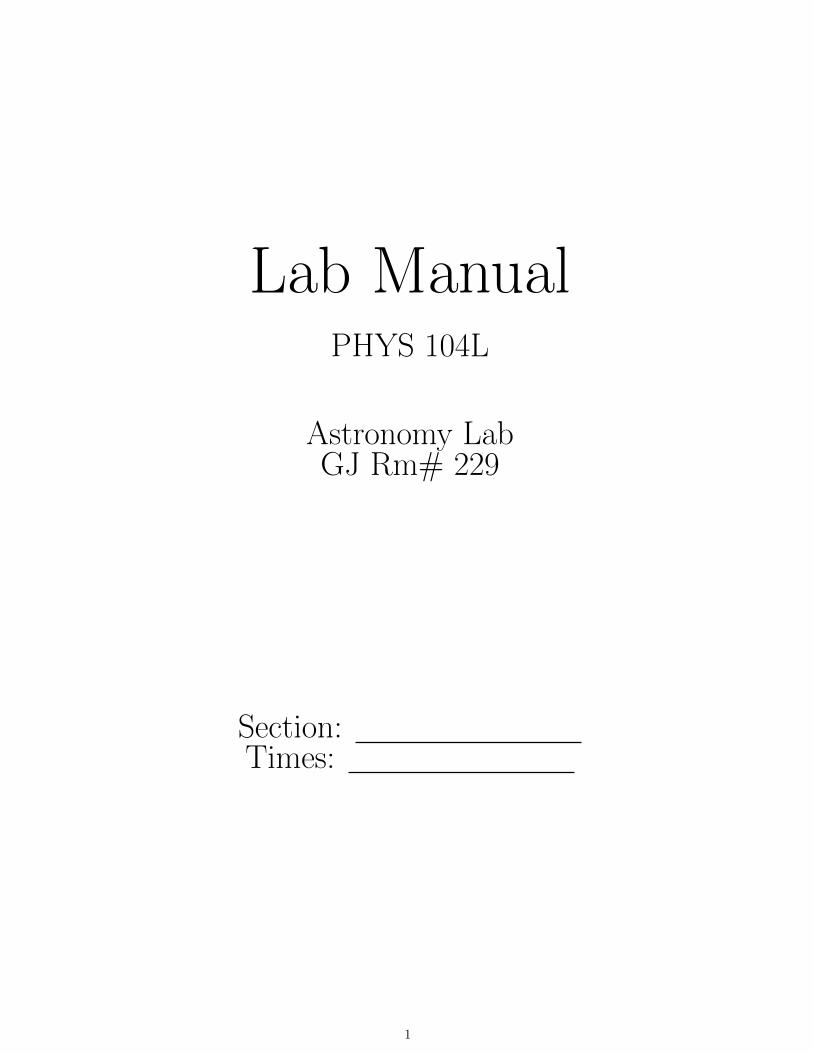
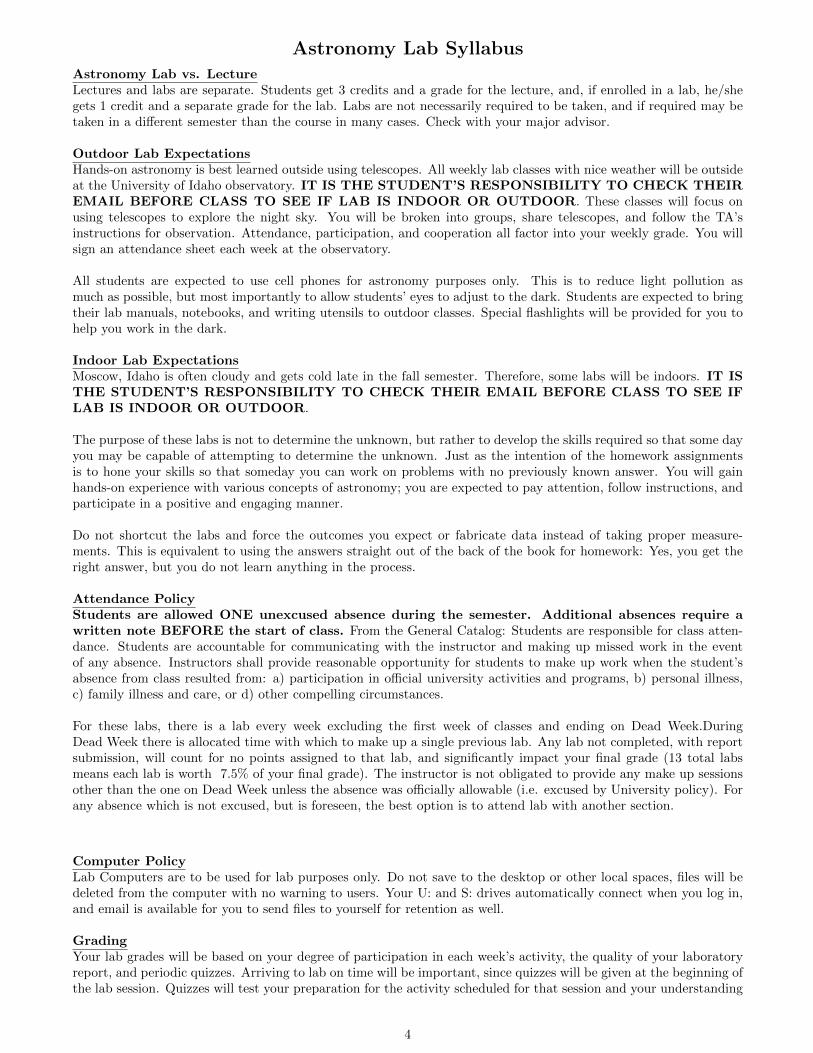
Indoor labs are located in Room 229 of the Gauss-Johnson Engineering Lab.
2
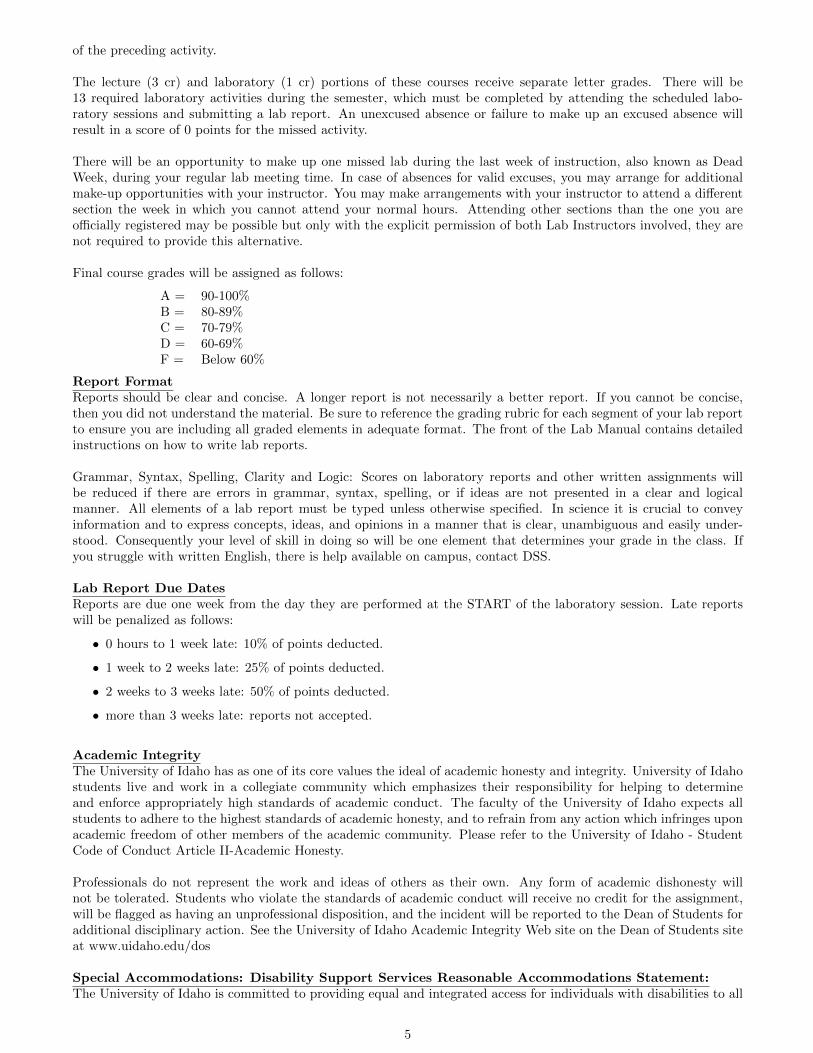
Old Pullman Road
Kibbie
Dome
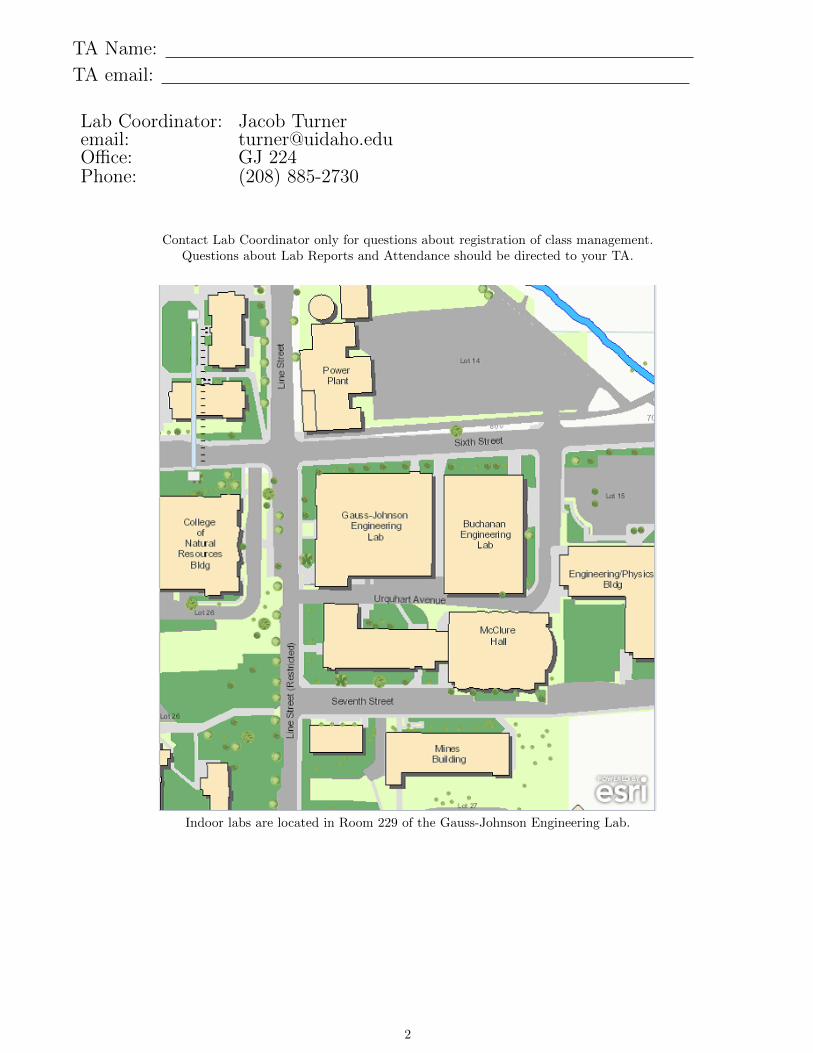
Park and
enter here
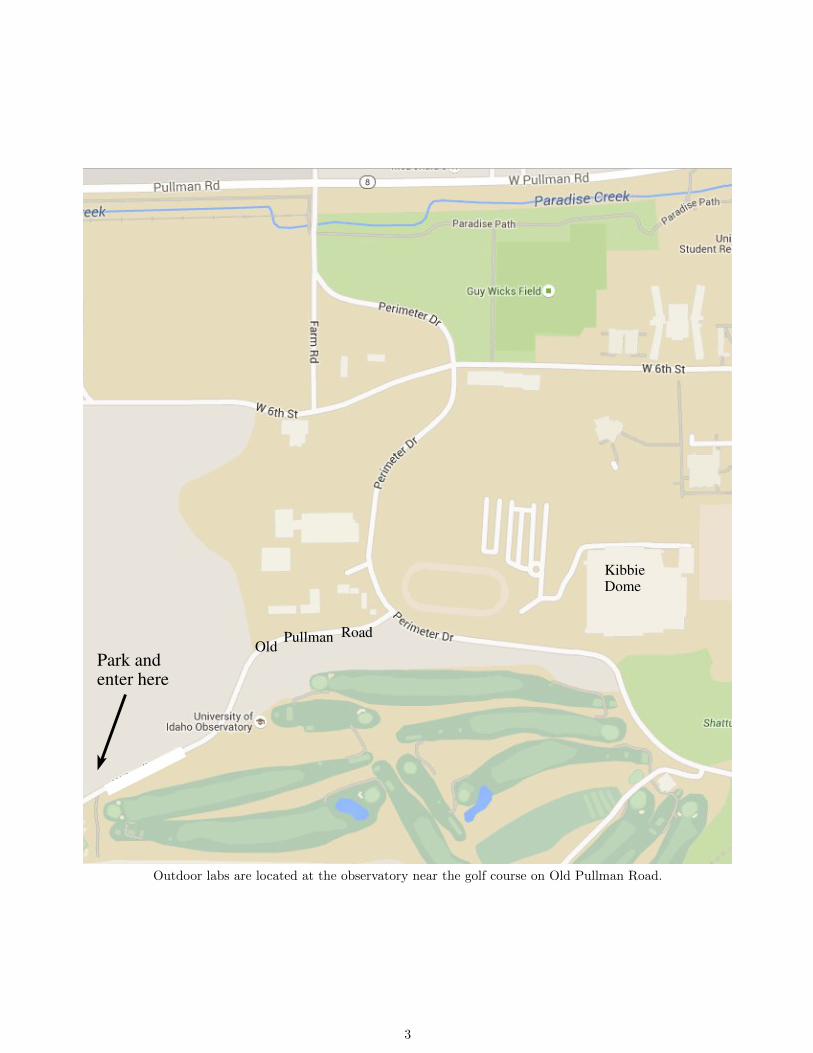
Outdoor labs are located at the observatory near the golf course on Old Pullman Road.
3
Astronomy Lab SyllabusAstronomy Lab vs. LectureLectures and labs are separate. Students get 3 credits and a grade for the lecture, and, if enrolled in a lab, he/shegets 1 credit and a separate grade for the lab. Labs are not necessarily required to be taken, and if required may betaken in a different semester than the course in many cases. Check with your major advisor.
Outdoor Lab ExpectationsHands-on astronomy is best learned outside using telescopes. All weekly lab classes with nice weather will be outsideat the University of Idaho observatory. IT IS THE STUDENT’S RESPONSIBILITY TO CHECK THEIREMAIL BEFORE CLASS TO SEE IF LAB IS INDOOR OR OUTDOOR. These classes will focus onusing telescopes to explore the night sky. You will be broken into groups, share telescopes, and follow the TA’sinstructions for observation. Attendance, participation, and cooperation all factor into your weekly grade. You willsign an attendance sheet each week at the observatory.
All students are expected to use cell phones for astronomy purposes only. This is to reduce light pollution asmuch as possible, but most importantly to allow students’ eyes to adjust to the dark. Students are expected to bringtheir lab manuals, notebooks, and writing utensils to outdoor classes. Special flashlights will be provided for you tohelp you work in the dark.
Indoor Lab ExpectationsMoscow, Idaho is often cloudy and gets cold late in the fall semester. Therefore, some labs will be indoors. IT ISTHE STUDENT’S RESPONSIBILITY TO CHECK THEIR EMAIL BEFORE CLASS TO SEE IFLAB IS INDOOR OR OUTDOOR.
The purpose of these labs is not to determine the unknown, but rather to develop the skills required so that some dayyou may be capable of attempting to determine the unknown. Just as the intention of the homework assignmentsis to hone your skills so that someday you can work on problems with no previously known answer. You will gainhands-on experience with various concepts of astronomy; you are expected to pay attention, follow instructions, andparticipate in a positive and engaging manner.
Do not shortcut the labs and force the outcomes you expect or fabricate data instead of taking proper measure-ments. This is equivalent to using the answers straight out of the back of the book for homework: Yes, you get theright answer, but you do not learn anything in the process.
Attendance PolicyStudents are allowed ONE unexcused absence during the semester. Additional absences require awritten note BEFORE the start of class. From the General Catalog: Students are responsible for class atten-dance. Students are accountable for communicating with the instructor and making up missed work in the eventof any absence. Instructors shall provide reasonable opportunity for students to make up work when the student’sabsence from class resulted from: a) participation in official university activities and programs, b) personal illness,c) family illness and care, or d) other compelling circumstances.
For these labs, there is a lab every week excluding the first week of classes and ending on Dead Week.DuringDead Week there is allocated time with which to make up a single previous lab. Any lab not completed, with reportsubmission, will count for no points assigned to that lab, and significantly impact your final grade (13 total labsmeans each lab is worth 7.5% of your final grade). The instructor is not obligated to provide any make up sessionsother than the one on Dead Week unless the absence was officially allowable (i.e. excused by University policy). Forany absence which is not excused, but is foreseen, the best option is to attend lab with another section.
Computer PolicyLab Computers are to be used for lab purposes only. Do not save to the desktop or other local spaces, files will bedeleted from the computer with no warning to users. Your U: and S: drives automatically connect when you log in,and email is available for you to send files to yourself for retention as well.
GradingYour lab grades will be based on your degree of participation in each week’s activity, the quality of your laboratoryreport, and periodic quizzes. Arriving to lab on time will be important, since quizzes will be given at the beginning ofthe lab session. Quizzes will test your preparation for the activity scheduled for that session and your understanding
4
of the preceding activity.
The lecture (3 cr) and laboratory (1 cr) portions of these courses receive separate letter grades. There will be13 required laboratory activities during the semester, which must be completed by attending the scheduled labo-ratory sessions and submitting a lab report. An unexcused absence or failure to make up an excused absence willresult in a score of 0 points for the missed activity.
There will be an opportunity to make up one missed lab during the last week of instruction, also known as DeadWeek, during your regular lab meeting time. In case of absences for valid excuses, you may arrange for additionalmake-up opportunities with your instructor. You may make arrangements with your instructor to attend a differentsection the week in which you cannot attend your normal hours. Attending other sections than the one you areofficially registered may be possible but only with the explicit permission of both Lab Instructors involved, they arenot required to provide this alternative.
Final course grades will be assigned as follows:
A = 90-100%B = 80-89%C = 70-79%D = 60-69%F = Below 60%
Report FormatReports should be clear and concise. A longer report is not necessarily a better report. If you cannot be concise,then you did not understand the material. Be sure to reference the grading rubric for each segment of your lab reportto ensure you are including all graded elements in adequate format. The front of the Lab Manual contains detailedinstructions on how to write lab reports.
Grammar, Syntax, Spelling, Clarity and Logic: Scores on laboratory reports and other written assignments willbe reduced if there are errors in grammar, syntax, spelling, or if ideas are not presented in a clear and logicalmanner. All elements of a lab report must be typed unless otherwise specified. In science it is crucial to conveyinformation and to express concepts, ideas, and opinions in a manner that is clear, unambiguous and easily under-stood. Consequently your level of skill in doing so will be one element that determines your grade in the class. Ifyou struggle with written English, there is help available on campus, contact DSS.
Lab Report Due DatesReports are due one week from the day they are performed at the START of the laboratory session. Late reportswill be penalized as follows:
• 0 hours to 1 week late: 10% of points deducted.
• 1 week to 2 weeks late: 25% of points deducted.
• 2 weeks to 3 weeks late: 50% of points deducted.
• more than 3 weeks late: reports not accepted.
Academic IntegrityThe University of Idaho has as one of its core values the ideal of academic honesty and integrity. University of Idahostudents live and work in a collegiate community which emphasizes their responsibility for helping to determineand enforce appropriately high standards of academic conduct. The faculty of the University of Idaho expects allstudents to adhere to the highest standards of academic honesty, and to refrain from any action which infringes uponacademic freedom of other members of the academic community. Please refer to the University of Idaho - StudentCode of Conduct Article II-Academic Honesty.
Professionals do not represent the work and ideas of others as their own. Any form of academic dishonesty willnot be tolerated. Students who violate the standards of academic conduct will receive no credit for the assignment,will be flagged as having an unprofessional disposition, and the incident will be reported to the Dean of Students foradditional disciplinary action. See the University of Idaho Academic Integrity Web site on the Dean of Students siteat www.uidaho.edu/dos
Special Accommodations: Disability Support Services Reasonable Accommodations Statement:The University of Idaho is committed to providing equal and integrated access for individuals with disabilities to all
5
the academic, social, cultural, and recreational programs it offers. This commitment is consistent with legal require-ments, including Section 504 of the Rehabilitation Act of 1973 and the Americans with Disabilities Act (ADA) of1990, and embodies the university’s historic determination to ensure the inclusion of all members of its communities.If you are a student requesting accommodations for this course, please contact your professor at the beginning of thesemester and Disability Support Services, Idaho Commons, Room 306, phone: (208) 885-6307.
The University of Idaho has a policy of nondiscrimination on the basis of race, color, religion, national origin,sex, age, disability or status as a Vietnam era veteran. This policy applies to all programs, services, and facilities,and includes, but is not limited to, applications, admissions, access to programs and services, and employment. Suchdiscrimination is prohibited by titles VI and VII of the Civil Rights Act of 1964, title IX of the Education Amendmentsof 1972, sections 503 and 504 of the Rehabilitation Act of 1973, the Vietnam Era Veterans’ Readjustment AssistanceAct of 1974, the Age Discrimination Act of 1975, the Age Discrimination in Employment Act Amendments of 1978,the Americans With Disabilities Act of 1990, the Civil Rights Act of 1991, the Rehabilitation Act Reauthorization of1992 and other state and federal laws and regulations. Sexual harassment violates state and federal law and policiesof the Board of Regents, and is expressly prohibited, as stated in Faculty Staff Handbook (FSH) 3220. The Universityof Idaho also prohibits discrimination on the basis of sexual orientation, as stated in FSH 3215. The entire FSH canbe accessed online at http://www.webs.uidaho.edu/fsh. Questions or concerns about the content and application ofthese laws, regulations or University policy may be directed to: April Preston, Human Rights Compliance Officer(885-4213); Gloria Jensen, Coordinator of Disability Support Services (885-7200); Regional Office for Civil Rights,U.S. Department of Education in Seattle (206-220-7900); Equal Employment Opportunity Commission, Seattle Dis-trict Office (206-220-6883); or Pacific Regional Office of Federal Contract Compliance Programs, U.S. Departmentof Labor in San Francisco (415-848-6969). Complaints about discrimination or harassment should be brought to theattention of the UI Human Rights Compliance Office (885-4212 or [email protected]). Retaliation for bringingforward a complaint is prohibited by FSH 3810.
Labs may not be made up unless the instructor is notified BEFORE the start of normal lab timethat your absence falls under the excused category. This means it is imperative that you contact your in-structor as soon as you become aware you will miss a lab session. In the case of labs missed due to illness, do notwait until you have the doctor’s note, inform the instructor that you are going to the doctor with the expectationthat you shall be granted such a note.
Classroom BehaviorAny behavior that is disruptive to the class or deemed by the teaching assistant to be disrespectful to fellow studentsor the instructor will not be tolerated. This includes off-topic conversations with fellow students, sleeping in class,texting, social media, reading newspapers or using cell phones during class time. Students that violate this rule maybe summarily dismissed from class. Repeated violation may result in expulsion from the course and a failing gradefor the student.
UNIVERSITY OF IDAHO CLASSROOM LEARNING CIVILITY CLAUSE:In any environment in which people gather to learn, it is essential that all members feel as free and safe as possiblein their participation. To this end, it is expected that everyone in this course will be treated with mutual respectand civility, with an understanding that all of us (students, instructors, professors, guests, and teaching assistants)will be respectful and civil to one another in discussion, in action, in teaching, and in learning. Should you feel ourclassroom interactions do not reflect an environment of civility and respect, you are encouraged to meet with yourinstructor during office hours to discuss your concern. Additional resources for expression of concern or requestingsupport include the Dean of Students office and staff (5-6757), the UI Counseling & Testing Center’s confidentialservices (5-6716), or the UI Office of Human Rights, Access, & Inclusion (5-4285).
6
How to Write Outdoor Lab ReportsLab reports make up the majority of your grade for Phys 104L. They are due 1 week after the lab is performed atthe start of class. All components of a lab report must be typed unless otherwise specified.
Outdoor lab reports are summaries of what you learned during your outdoor experience that week. The lab reportis broken up into sections, with each section focusing on a different astronomical topic. Each section should includea description of what you observed, how you observed it, and what you learned about it. It must also include theactivity questions your TA assigns for each topic. An outdoor lab report should include the following:
1 Cover Page
Every lab report must begin with a cover page. This is to maintain privacy so no one can see grades or marks unlessopening the report.
(Your Name)Phys 104L
(Date)Outdoor Lab # 2
2 Astronomy Topics
Besides a cover page, your outdoor labs only need summaries of the objects you observed and answers to the activityquestions. You do not need introductions, results, or conclusions like an indoor lab. A hypothetical example of atopic summary is given below (exoplanets are not actually visible). Note that it includes the following:
• An explanation of what it is you are looking at
• Context of why this topic matters
• A summary of what you actually saw
• Insight into what your observations mean and imply
• Answer to the activity question “Do you think it is possible life exists on other planets?”
(NOTE: This is an example lab write up. It IS NOT possible to directly observe exoplanets from the Earth.)ExoplanetsExoplanets are planets in other solar systems, meaning they orbit other stars other than our Sun. There are manytypes of exoplanets, with terrestrial planets, ice-giant planets, and gas-giant planets being the primary categories.There are also many types of exosystems (that is, “solar systems” for these other stars), with different numbers ofplanets located in the inner and outer parts of the exosystem. Our own solar system, with eight planets, is neitherunique nor special. It is entirely possible that another solar system just like our own exists. Our solar system is alsonot a blueprint for exosystems – with so much variety, it is entirely possible that an exosystem forms and lives outits existence in a fashion completely different than ours.
My group observed two exosystems with our 8” Celestron telescopes. One system had two planets; one planetwas a red-tan color similar to Jupiter, and the other planet was a pale blue like Neptune. We could not determinethe orbit periods or semimajor axes of these planets – that would require much more than twenty minutes of obser-vation! However, based on their color, the first planet is likely a gas-giant much larger than Earth, and the secondplanet is likely a smaller ice-giant (but still much larger than Earth). The second planet is therefore likely far awayfrom its host star, or else it would evaporate and fall apart.
The second exosystem had only one planet. However, this planet was primarily blue with what appeared to bepartial cloud coverage, suggesting that it might have liquid water on its surface and an atmosphere! This is veryexciting because it means it might be similar to Earth. However, we could only know this for sure with many moreobservations.
1. Hundreds of billions of planets exist in our galaxy, and hundreds of billions of galaxies exist in our observableuniverse. Even though only a small fraction of them meet the requirements of habitability, that fraction stillyields a huge number of planets with potential life on them. I therefore think it is reasonable that life existson other planets.
7
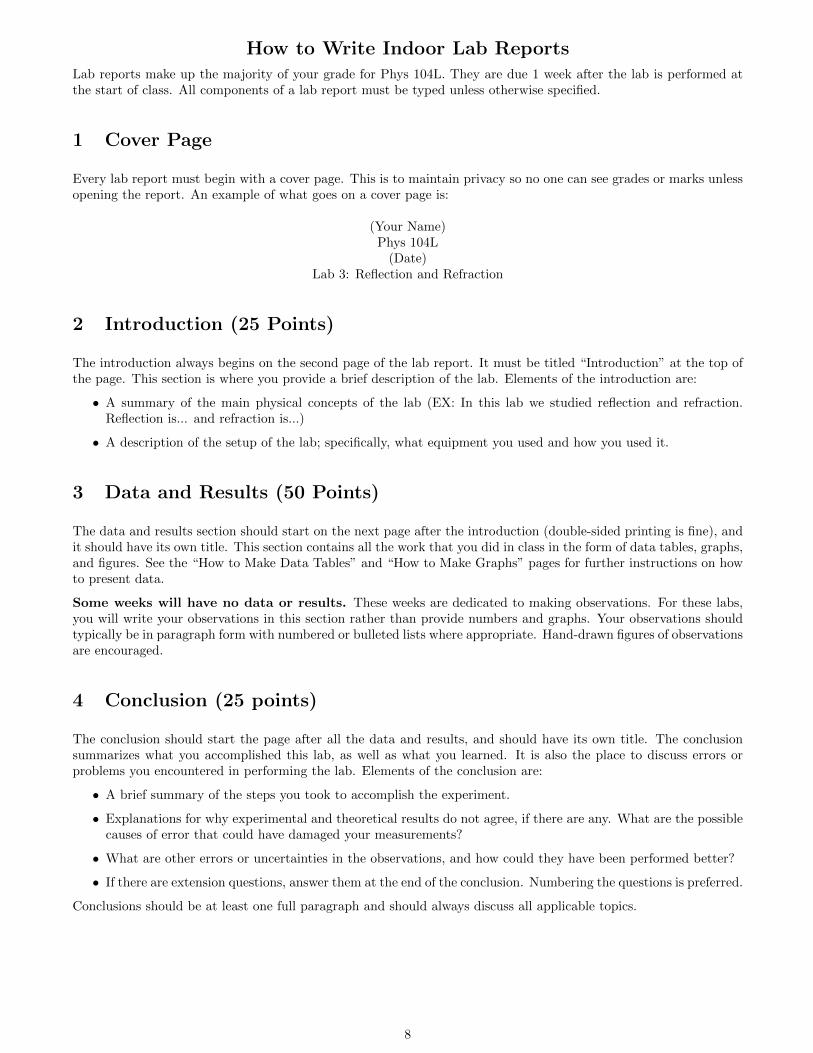
How to Write Indoor Lab ReportsLab reports make up the majority of your grade for Phys 104L. They are due 1 week after the lab is performed atthe start of class. All components of a lab report must be typed unless otherwise specified.
1 Cover Page
Every lab report must begin with a cover page. This is to maintain privacy so no one can see grades or marks unlessopening the report. An example of what goes on a cover page is:
(Your Name)Phys 104L
(Date)Lab 3: Reflection and Refraction
2 Introduction (25 Points)
The introduction always begins on the second page of the lab report. It must be titled “Introduction” at the top ofthe page. This section is where you provide a brief description of the lab. Elements of the introduction are:
• A summary of the main physical concepts of the lab (EX: In this lab we studied reflection and refraction.Reflection is... and refraction is...)
• A description of the setup of the lab; specifically, what equipment you used and how you used it.
3 Data and Results (50 Points)
The data and results section should start on the next page after the introduction (double-sided printing is fine), andit should have its own title. This section contains all the work that you did in class in the form of data tables, graphs,and figures. See the “How to Make Data Tables” and “How to Make Graphs” pages for further instructions on howto present data.
Some weeks will have no data or results. These weeks are dedicated to making observations. For these labs,you will write your observations in this section rather than provide numbers and graphs. Your observations shouldtypically be in paragraph form with numbered or bulleted lists where appropriate. Hand-drawn figures of observationsare encouraged.
4 Conclusion (25 points)
The conclusion should start the page after all the data and results, and should have its own title. The conclusionsummarizes what you accomplished this lab, as well as what you learned. It is also the place to discuss errors orproblems you encountered in performing the lab. Elements of the conclusion are:
• A brief summary of the steps you took to accomplish the experiment.
• Explanations for why experimental and theoretical results do not agree, if there are any. What are the possiblecauses of error that could have damaged your measurements?
• What are other errors or uncertainties in the observations, and how could they have been performed better?
• If there are extension questions, answer them at the end of the conclusion. Numbering the questions is preferred.
Conclusions should be at least one full paragraph and should always discuss all applicable topics.
8
How to Make Data TablesData tables are very common in science, as they are the best way to concisely present numbers. We will be makingdata tables for various labs throughout the semester, and it is important to become familiar with them. I recommendmaking data tables in Excel 2010 (which is what our lab computers have), and then copying them into Word to beincluded with the rest of your lab report.
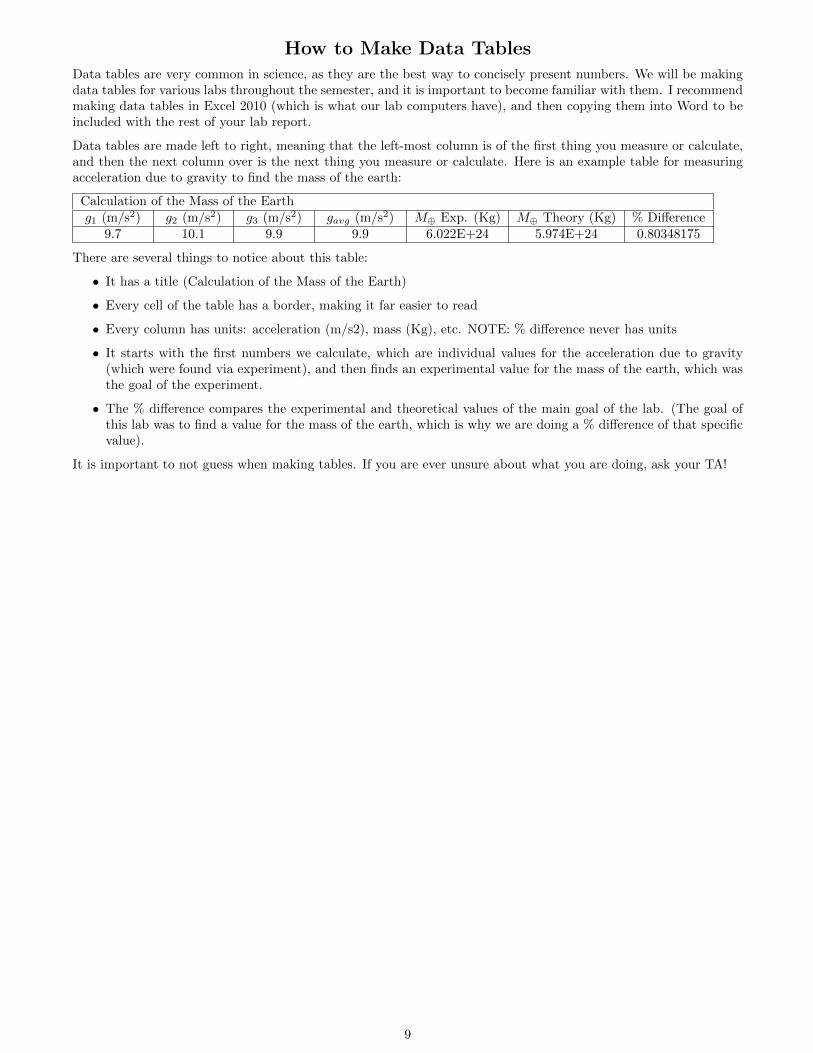
Data tables are made left to right, meaning that the left-most column is of the first thing you measure or calculate,and then the next column over is the next thing you measure or calculate. Here is an example table for measuringacceleration due to gravity to find the mass of the earth:
Calculation of the Mass of the Earthg1 (m/s2) g2 (m/s2) g3 (m/s2) gavg (m/s2) M⊕ Exp. (Kg) M⊕ Theory (Kg) % Difference
9.7 10.1 9.9 9.9 6.022E+24 5.974E+24 0.80348175
There are several things to notice about this table:
• It has a title (Calculation of the Mass of the Earth)
• Every cell of the table has a border, making it far easier to read
• Every column has units: acceleration (m/s2), mass (Kg), etc. NOTE: % difference never has units
• It starts with the first numbers we calculate, which are individual values for the acceleration due to gravity(which were found via experiment), and then finds an experimental value for the mass of the earth, which wasthe goal of the experiment.
• The % difference compares the experimental and theoretical values of the main goal of the lab. (The goal ofthis lab was to find a value for the mass of the earth, which is why we are doing a % difference of that specificvalue).
It is important to not guess when making tables. If you are ever unsure about what you are doing, ask your TA!
9
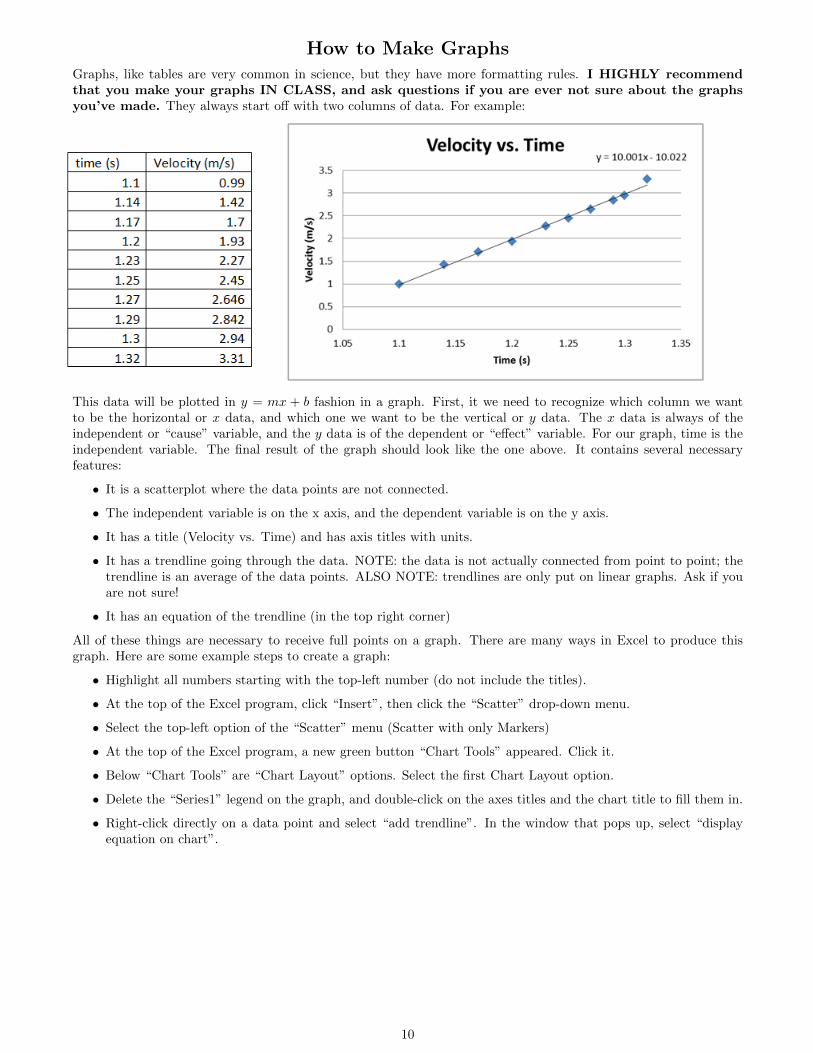
How to Make GraphsGraphs, like tables are very common in science, but they have more formatting rules. I HIGHLY recommendthat you make your graphs IN CLASS, and ask questions if you are ever not sure about the graphsyou’ve made. They always start off with two columns of data. For example:
This data will be plotted in y = mx + b fashion in a graph. First, it we need to recognize which column we wantto be the horizontal or x data, and which one we want to be the vertical or y data. The x data is always of theindependent or “cause” variable, and the y data is of the dependent or “effect” variable. For our graph, time is theindependent variable. The final result of the graph should look like the one above. It contains several necessaryfeatures:
• It is a scatterplot where the data points are not connected.
• The independent variable is on the x axis, and the dependent variable is on the y axis.
• It has a title (Velocity vs. Time) and has axis titles with units.
• It has a trendline going through the data. NOTE: the data is not actually connected from point to point; thetrendline is an average of the data points. ALSO NOTE: trendlines are only put on linear graphs. Ask if youare not sure!
• It has an equation of the trendline (in the top right corner)
All of these things are necessary to receive full points on a graph. There are many ways in Excel to produce thisgraph. Here are some example steps to create a graph:
• Highlight all numbers starting with the top-left number (do not include the titles).
• At the top of the Excel program, click “Insert”, then click the “Scatter” drop-down menu.
• Select the top-left option of the “Scatter” menu (Scatter with only Markers)
• At the top of the Excel program, a new green button “Chart Tools” appeared. Click it.
• Below “Chart Tools” are “Chart Layout” options. Select the first Chart Layout option.
• Delete the “Series1” legend on the graph, and double-click on the axes titles and the chart title to fill them in.
• Right-click directly on a data point and select “add trendline”. In the window that pops up, select “displayequation on chart”.
10
Encyclopedia of Observable ObjectsThis part of the lab manual provides basic information the types of objects in the night sky, focusing on those thatwill be visible to us at night and those that every astronomy enthusiast should know about. The information providedis written to help you better understand what you are observing, to help answer your activity questions, and to helpyou become knowledgeable of current happenings in astronomy.
1 Clusters
Clusters are groups of stars that formed roughly at the same time. Clusters are thus an incredibly important toolfor astronomers, because any differences in the stars’ properties (color, brightness, etc) are based solely one eachstars’ mass (rather than relative distance). There are generally two kinds of clusters: open and globular. A list ofobservable objects is provided at the back of the lab manual.
1.1 Open vs. Globular
An open cluster is a group of usually a hundred stars or fewer that are loosely bound (by gravity, less mass = lessgravitational force). Open clusters can be up to 30 light years across and are usually found in the spiral arms of thegalaxy. Younger stars, up to a few tens of millions of years (a fraction of the Sun’s life so far!), tend to populate openclusters. It is common to observe early-type stars in an open cluster, because the cluster will have drifted apart bythe time those stars die.
A globular cluster is a group of more than a hundred stars, usually on the order of tens of thousands (but up to evenmillions). These stars are packed closely together; globular clusters are much more strongly gravitationally boundthan open clusters. These groups of stars are mostly spherically distributed in an area 10-30 light years across.Globular clusters are populated by older stars. Because they are so old, only yellow and red stars are left (all theblue, white stars have already died).
2 Constellations
Humans have been gazing up at the night sky and creating figures from the stars for centuries. These pictures madeof stars are called constellations and many ancient cultures have their own set, often steeped in myth and oralhistories. The constellations served a purpose, though. As Earth orbits the Sun, we see different stars in the nightsky; the Sun is so bright that it blocks whatever stars are “behind it” as seen from Earth. You can imagine howthis kind of information would be somewhat useful as a time-keeping tool: during certain times of year, the Sun isin front of some constellations (thus blocking them from our view with its brightness). If we can’t see Aries in thenight sky, for example, then we know the date is sometime between April 19-May 13. (These exact dates changewith changes in Earth’s motion.) The most commonly used constellations are those that originated from the Greeks.
2.1 Star Charts
In lab, you will be using a star chart to help you identify the constellations and the stars within them. Here’s howto use the ones we have in lab:
1. Along the edge of the circle, find the current time.
2. Using the turning wheel, align the day of the year to the current time.
3. The window of your star chart now reveals which stars and constellations are currently visible. Notice how thisis time dependent because the Earth is rotating. You will have to move the wheel as time progresses to get anaccurate map of what’s up in the sky.
4. Notice the orientation of our star charts. Remember to check the direction (north, south, east, west) whengoing from your star chart to the sky.
11
2.2 The Zodiac
Despite its abuse by astrologers, the zodiac is an astronomical tool. It is the group of twelve constellations that thepath of the Sun through the sky passes through. Using the common Greek constellations, there are traditionallytwelve constellations in the zodiac. However, because Earth’s axis of rotation changes over a cycle of 26,000 years,there are now thirteen constellations through which the Sun “passes”: Sagittarius, Capricornus, Aquarius, Pisces,Aries, Taurus, Gemini, Cancer, Leo, Virgo, Libra, Scorpius and Ophiuchus.
Note that though both astronomy and astrology both talk about the constellations, only astronomy is a science. Ifyou have more questions about this difference, check out the particularly good discussions athttp://www.badastronomy.com/bad/misc/astrology.html and http://astrosociety.org/astrology.pdf
3 Dwarf Planets
3.1 Definition
In 2006, the International Astronomical Union created a new class of object, the dwarf planet, to respond to thegrowing number of Pluto-like objects found within our solar system. Since Pluto was considered a planet, then shouldall these other objects? Were they all similar enough to Mercury, Earth, Venus, Mars, Jupiter, Saturn, Uranus, andNeptune to be considered “planets”? Astronomers were tasked with categorizing the different bodies of the solarsystem into groupings that enabled science. Biologists have been doing this for centuries: cats are all consideredmembers of the cat family because of their anatomical similarities, for example. By making such groupings, scientistsare able to come to a better understanding of how things work for members of that group. Cat scientists can studywhy all cats have retractable claws by studying different species in this family.
Astronomers decided that when studying the solar system and how it formed, it was difficult to lump Pluto, Ceres,Eris, and other objects together with the planets because they were so different. For one thing, dwarf planets aremuch smaller than the planets, even though some of them have moons of their own! Dwarf planets also have weirdorbits that lie in the two belts of our solar system, the Kuiper Belt and the asteroid belt. Both these regions aremuch more densely populated than, say, the space that Earth orbits through. Thus, the three defining characteristicsfor a body to be a planet are that it must:
1. be in orbit around the Sun
2. have enough mass to be nearly round in shape
3. have cleared the neighborhood around its orbit of debris
3.2 Pluto
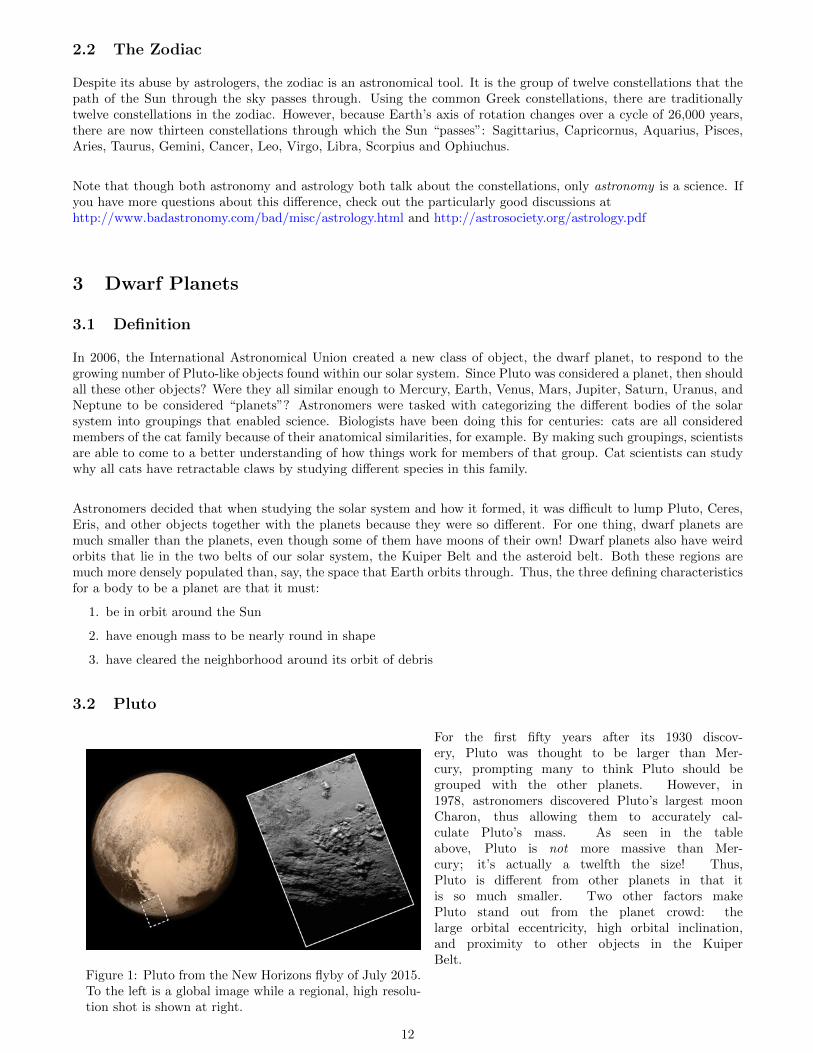
Figure 1: Pluto from the New Horizons flyby of July 2015.To the left is a global image while a regional, high resolu-tion shot is shown at right.
For the first fifty years after its 1930 discov-ery, Pluto was thought to be larger than Mer-cury, prompting many to think Pluto should begrouped with the other planets. However, in1978, astronomers discovered Pluto’s largest moonCharon, thus allowing them to accurately cal-culate Pluto’s mass. As seen in the tableabove, Pluto is not more massive than Mer-cury; it’s actually a twelfth the size! Thus,Pluto is different from other planets in that itis so much smaller. Two other factors makePluto stand out from the planet crowd: thelarge orbital eccentricity, high orbital inclination,and proximity to other objects in the KuiperBelt.
12
For all its oddity, Pluto may not be as bizarre as we’ve thought. Initial findings from the New Horizons mission hintthat Pluto has an atmosphere and that its surface is reddish in color. At the time of writing this manual, the firstdata was just coming down, including this stunning picture, featuring the unexpected water-ice mountains in theblack and white inset!
3.3 Ceres
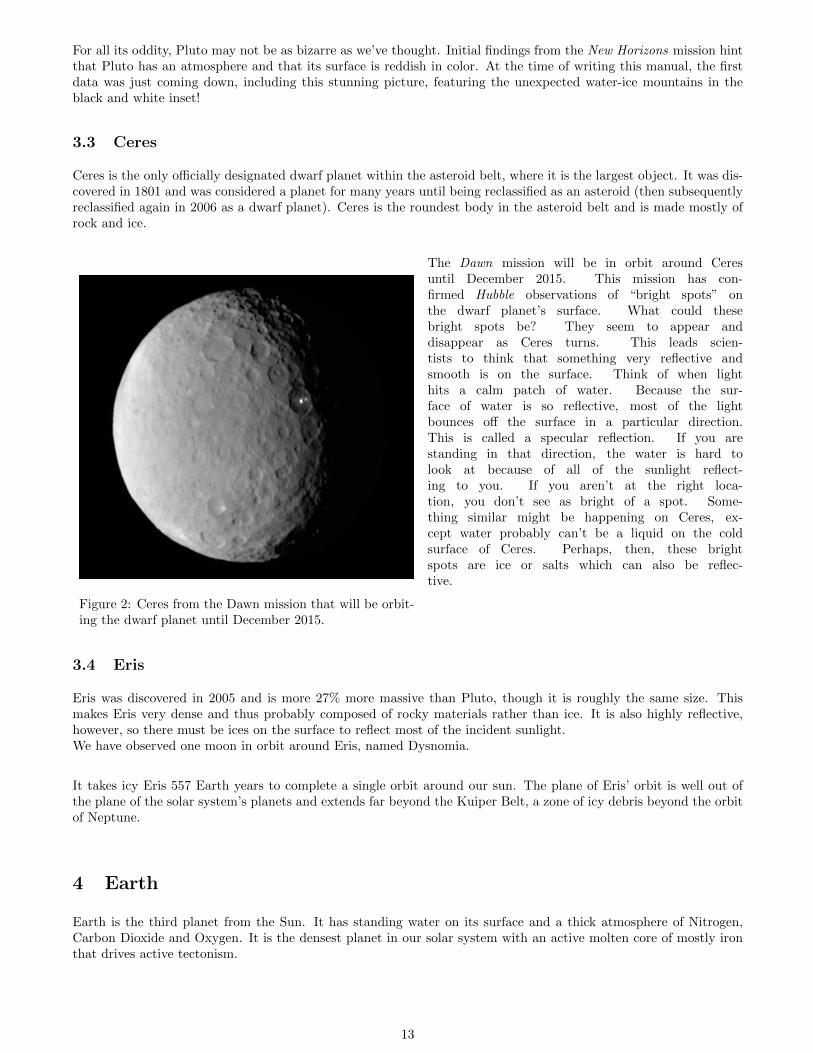
Ceres is the only officially designated dwarf planet within the asteroid belt, where it is the largest object. It was dis-covered in 1801 and was considered a planet for many years until being reclassified as an asteroid (then subsequentlyreclassified again in 2006 as a dwarf planet). Ceres is the roundest body in the asteroid belt and is made mostly ofrock and ice.
Figure 2: Ceres from the Dawn mission that will be orbit-ing the dwarf planet until December 2015.
The Dawn mission will be in orbit around Ceresuntil December 2015. This mission has con-firmed Hubble observations of “bright spots” onthe dwarf planet’s surface. What could thesebright spots be? They seem to appear anddisappear as Ceres turns. This leads scien-tists to think that something very reflective andsmooth is on the surface. Think of when lighthits a calm patch of water. Because the sur-face of water is so reflective, most of the lightbounces off the surface in a particular direction.This is called a specular reflection. If you arestanding in that direction, the water is hard tolook at because of all of the sunlight reflect-ing to you. If you aren’t at the right loca-tion, you don’t see as bright of a spot. Some-thing similar might be happening on Ceres, ex-cept water probably can’t be a liquid on the coldsurface of Ceres. Perhaps, then, these brightspots are ice or salts which can also be reflec-tive.
3.4 Eris
Eris was discovered in 2005 and is more 27% more massive than Pluto, though it is roughly the same size. Thismakes Eris very dense and thus probably composed of rocky materials rather than ice. It is also highly reflective,however, so there must be ices on the surface to reflect most of the incident sunlight.We have observed one moon in orbit around Eris, named Dysnomia.
It takes icy Eris 557 Earth years to complete a single orbit around our sun. The plane of Eris’ orbit is well out ofthe plane of the solar system’s planets and extends far beyond the Kuiper Belt, a zone of icy debris beyond the orbitof Neptune.
4 Earth
Earth is the third planet from the Sun. It has standing water on its surface and a thick atmosphere of Nitrogen,Carbon Dioxide and Oxygen. It is the densest planet in our solar system with an active molten core of mostly ironthat drives active tectonism.
13
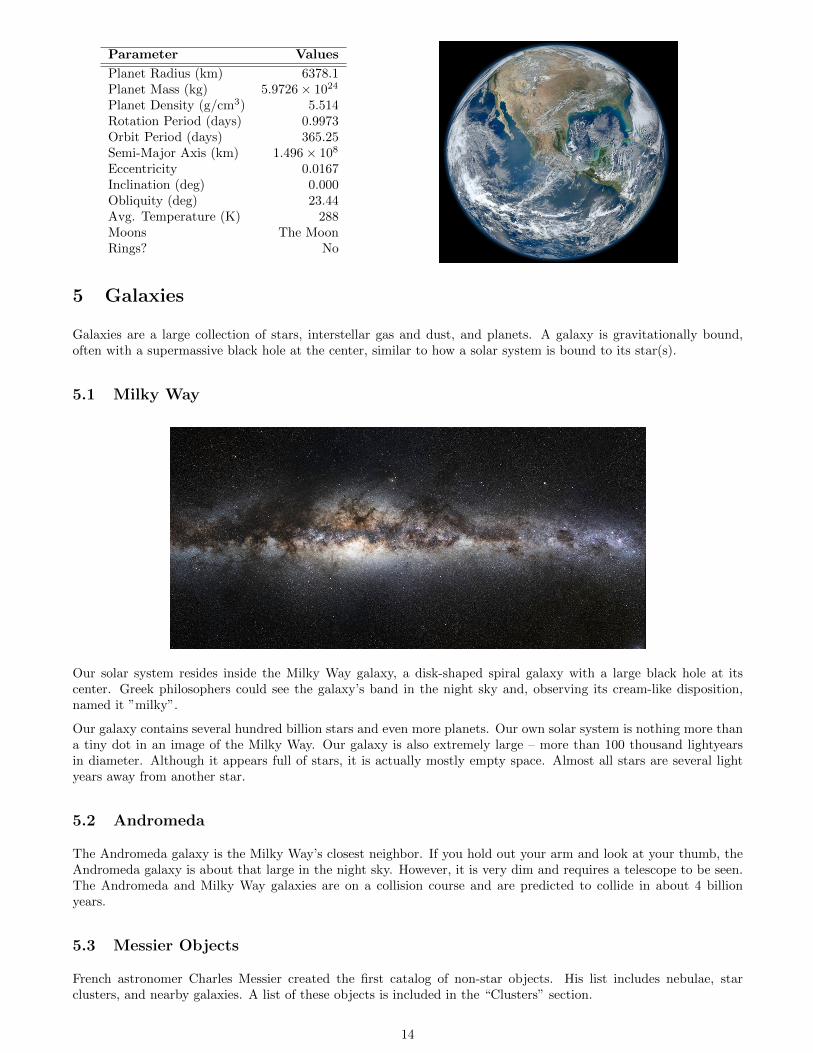
Parameter Values
Planet Radius (km) 6378.1Planet Mass (kg) 5.9726× 1024
Planet Density (g/cm3) 5.514Rotation Period (days) 0.9973Orbit Period (days) 365.25Semi-Major Axis (km) 1.496× 10⁸
Eccentricity 0.0167Inclination (deg) 0.000Obliquity (deg) 23.44Avg. Temperature (K) 288Moons The MoonRings? No
5 Galaxies
Galaxies are a large collection of stars, interstellar gas and dust, and planets. A galaxy is gravitationally bound,often with a supermassive black hole at the center, similar to how a solar system is bound to its star(s).
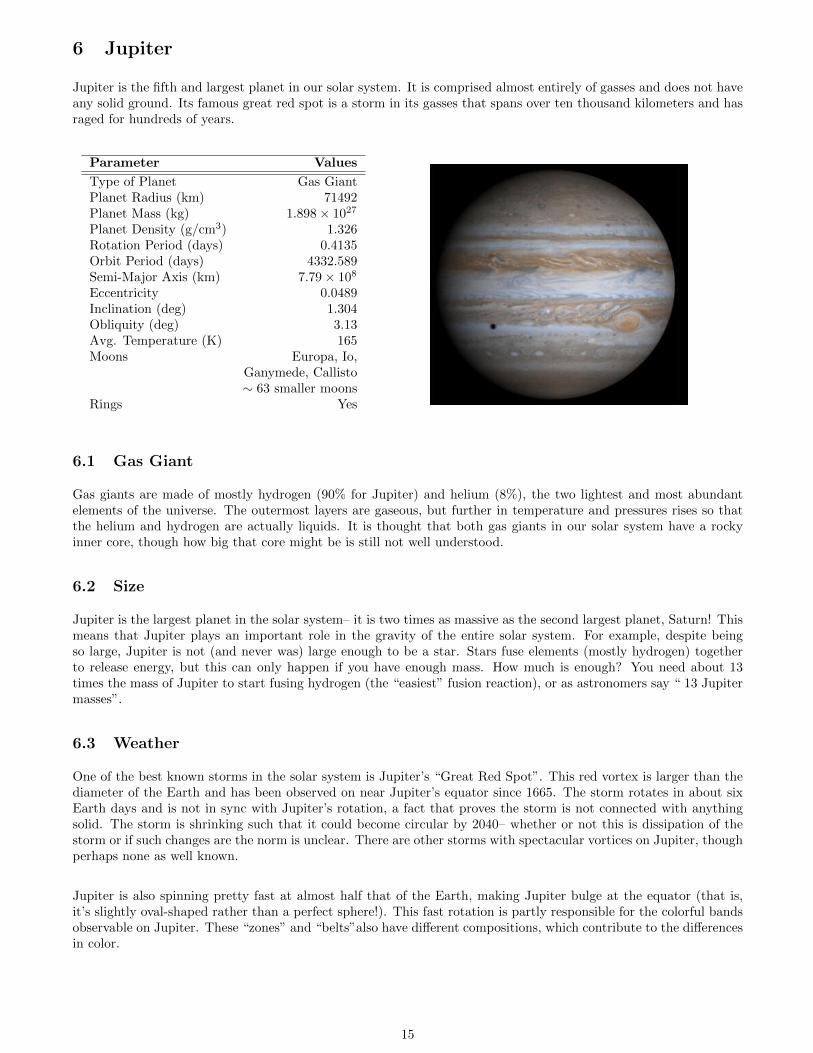
5.1 Milky Way
Our solar system resides inside the Milky Way galaxy, a disk-shaped spiral galaxy with a large black hole at itscenter. Greek philosophers could see the galaxy’s band in the night sky and, observing its cream-like disposition,named it ”milky”.
Our galaxy contains several hundred billion stars and even more planets. Our own solar system is nothing more thana tiny dot in an image of the Milky Way. Our galaxy is also extremely large – more than 100 thousand lightyearsin diameter. Although it appears full of stars, it is actually mostly empty space. Almost all stars are several lightyears away from another star.
5.2 Andromeda
The Andromeda galaxy is the Milky Way’s closest neighbor. If you hold out your arm and look at your thumb, theAndromeda galaxy is about that large in the night sky. However, it is very dim and requires a telescope to be seen.The Andromeda and Milky Way galaxies are on a collision course and are predicted to collide in about 4 billionyears.
5.3 Messier Objects
French astronomer Charles Messier created the first catalog of non-star objects. His list includes nebulae, starclusters, and nearby galaxies. A list of these objects is included in the “Clusters” section.
14
6 Jupiter
Jupiter is the fifth and largest planet in our solar system. It is comprised almost entirely of gasses and does not haveany solid ground. Its famous great red spot is a storm in its gasses that spans over ten thousand kilometers and hasraged for hundreds of years.
Parameter Values
Type of Planet Gas GiantPlanet Radius (km) 71492Planet Mass (kg) 1.898× 1027
Planet Density (g/cm3) 1.326Rotation Period (days) 0.4135Orbit Period (days) 4332.589Semi-Major Axis (km) 7.79× 10⁸
Eccentricity 0.0489Inclination (deg) 1.304Obliquity (deg) 3.13Avg. Temperature (K) 165Moons Europa, Io,
Ganymede, Callisto∼ 63 smaller moons
Rings Yes
6.1 Gas Giant
Gas giants are made of mostly hydrogen (90% for Jupiter) and helium (8%), the two lightest and most abundantelements of the universe. The outermost layers are gaseous, but further in temperature and pressures rises so thatthe helium and hydrogen are actually liquids. It is thought that both gas giants in our solar system have a rockyinner core, though how big that core might be is still not well understood.
6.2 Size
Jupiter is the largest planet in the solar system– it is two times as massive as the second largest planet, Saturn! Thismeans that Jupiter plays an important role in the gravity of the entire solar system. For example, despite beingso large, Jupiter is not (and never was) large enough to be a star. Stars fuse elements (mostly hydrogen) togetherto release energy, but this can only happen if you have enough mass. How much is enough? You need about 13times the mass of Jupiter to start fusing hydrogen (the “easiest” fusion reaction), or as astronomers say “ 13 Jupitermasses”.
6.3 Weather
One of the best known storms in the solar system is Jupiter’s “Great Red Spot”. This red vortex is larger than thediameter of the Earth and has been observed on near Jupiter’s equator since 1665. The storm rotates in about sixEarth days and is not in sync with Jupiter’s rotation, a fact that proves the storm is not connected with anythingsolid. The storm is shrinking such that it could become circular by 2040– whether or not this is dissipation of thestorm or if such changes are the norm is unclear. There are other storms with spectacular vortices on Jupiter, thoughperhaps none as well known.
Jupiter is also spinning pretty fast at almost half that of the Earth, making Jupiter bulge at the equator (that is,it’s slightly oval-shaped rather than a perfect sphere!). This fast rotation is partly responsible for the colorful bandsobservable on Jupiter. These “zones” and “belts”also have different compositions, which contribute to the differencesin color.
15
6.4 Missions
• Juno (Aug 2011-present): orbiter to arrive in 2016
• Galileo (Oct 1989 - Sept 2003): orbited for eight years, atmospheric probe
• Voyager 2 (9 Jul 1979): single flyby event
• Voyager 1 (5 Mar 1979): single flyby event
• Pioneer 11 (3 Dec 1974): single flyby event
• Pioner 10 (4 Dec 1973): single flyby event
7 Mars
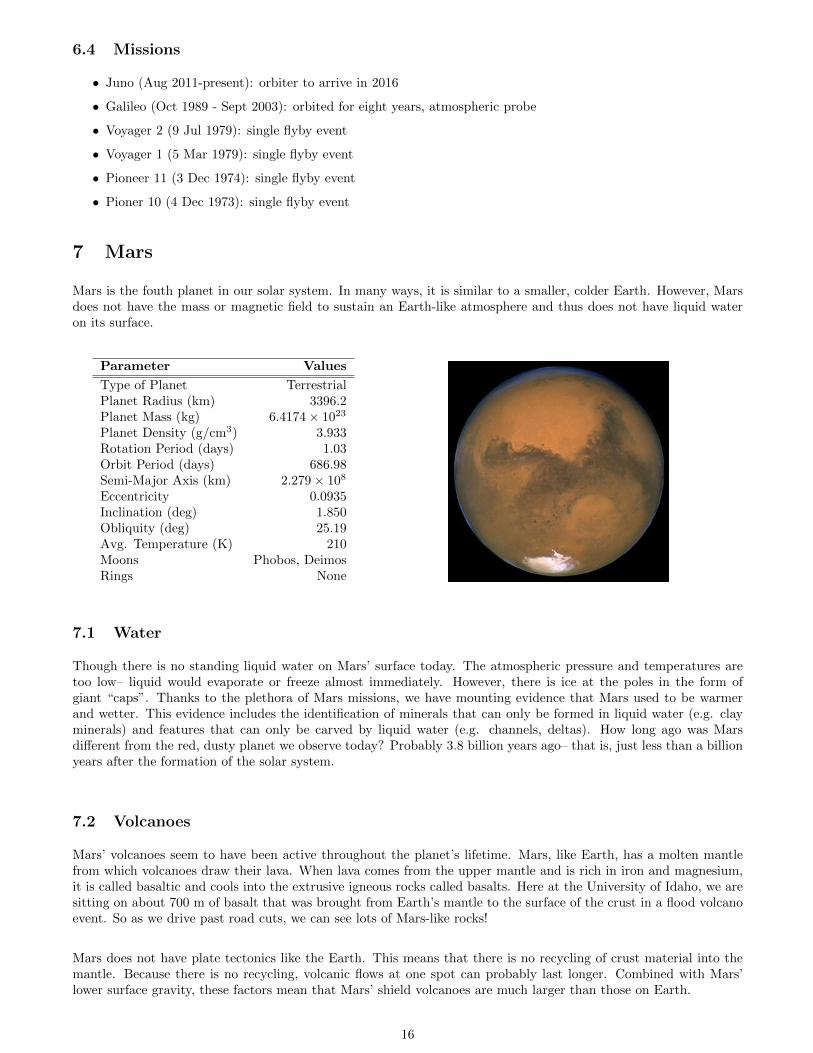
Mars is the fouth planet in our solar system. In many ways, it is similar to a smaller, colder Earth. However, Marsdoes not have the mass or magnetic field to sustain an Earth-like atmosphere and thus does not have liquid wateron its surface.
Parameter Values
Type of Planet TerrestrialPlanet Radius (km) 3396.2Planet Mass (kg) 6.4174× 10²³
Planet Density (g/cm3) 3.933Rotation Period (days) 1.03Orbit Period (days) 686.98Semi-Major Axis (km) 2.279× 10⁸
Eccentricity 0.0935Inclination (deg) 1.850Obliquity (deg) 25.19Avg. Temperature (K) 210Moons Phobos, DeimosRings None
7.1 Water
Though there is no standing liquid water on Mars’ surface today. The atmospheric pressure and temperatures aretoo low– liquid would evaporate or freeze almost immediately. However, there is ice at the poles in the form ofgiant “caps”. Thanks to the plethora of Mars missions, we have mounting evidence that Mars used to be warmerand wetter. This evidence includes the identification of minerals that can only be formed in liquid water (e.g. clayminerals) and features that can only be carved by liquid water (e.g. channels, deltas). How long ago was Marsdifferent from the red, dusty planet we observe today? Probably 3.8 billion years ago– that is, just less than a billionyears after the formation of the solar system.
7.2 Volcanoes
Mars’ volcanoes seem to have been active throughout the planet’s lifetime. Mars, like Earth, has a molten mantlefrom which volcanoes draw their lava. When lava comes from the upper mantle and is rich in iron and magnesium,it is called basaltic and cools into the extrusive igneous rocks called basalts. Here at the University of Idaho, we aresitting on about 700 m of basalt that was brought from Earth’s mantle to the surface of the crust in a flood volcanoevent. So as we drive past road cuts, we can see lots of Mars-like rocks!
Mars does not have plate tectonics like the Earth. This means that there is no recycling of crust material into themantle. Because there is no recycling, volcanic flows at one spot can probably last longer. Combined with Mars’lower surface gravity, these factors mean that Mars’ shield volcanoes are much larger than those on Earth.
16
7.3 Missions
Note that these lists are not exhaustive! We only list a few of the latest, successful, NASA-led missions. There havebeen many, many more missions to Mars!
On the surface
• Curiosity (MSL): Nov 2011-present; rover mission to Gale Crater
• Phoenix: Aug 2004-Nov 2008; lander to the north pole
• Spirit (MER-A): June 2003- March 2010; rover mission to characterize geology near the equator in easternhemisphere
• Opportunity (MER-B): July 2003- present; rover mission to characterize geology in western hemisphere
Orbiters
• MAVEN: Nov 2013-present; Mars Atmosphere and Volatile Evolution Mission, measures/monitors Mars’ thinatmosphere
• MRO: Aug 2005- present; Mars Reconnaissance Orbiter, remote sensing with variety of cameras/surface-lookinginstruments
8 Mercury
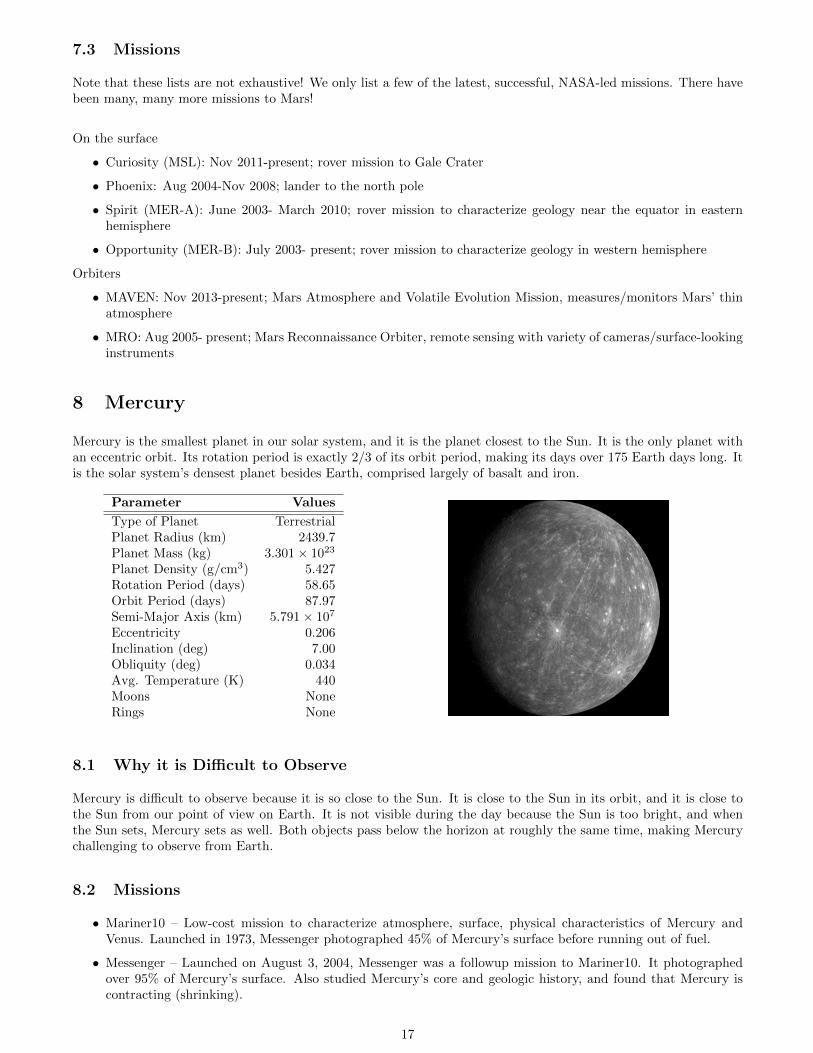
Mercury is the smallest planet in our solar system, and it is the planet closest to the Sun. It is the only planet withan eccentric orbit. Its rotation period is exactly 2/3 of its orbit period, making its days over 175 Earth days long. Itis the solar system’s densest planet besides Earth, comprised largely of basalt and iron.
Parameter Values
Type of Planet TerrestrialPlanet Radius (km) 2439.7Planet Mass (kg) 3.301× 10²³
Planet Density (g/cm3) 5.427Rotation Period (days) 58.65Orbit Period (days) 87.97Semi-Major Axis (km) 5.791× 10⁷
Eccentricity 0.206Inclination (deg) 7.00Obliquity (deg) 0.034Avg. Temperature (K) 440Moons NoneRings None
8.1 Why it is Difficult to Observe
Mercury is difficult to observe because it is so close to the Sun. It is close to the Sun in its orbit, and it is close tothe Sun from our point of view on Earth. It is not visible during the day because the Sun is too bright, and whenthe Sun sets, Mercury sets as well. Both objects pass below the horizon at roughly the same time, making Mercurychallenging to observe from Earth.
8.2 Missions
• Mariner10 – Low-cost mission to characterize atmosphere, surface, physical characteristics of Mercury andVenus. Launched in 1973, Messenger photographed 45% of Mercury’s surface before running out of fuel.
• Messenger – Launched on August 3, 2004, Messenger was a followup mission to Mariner10. It photographedover 95% of Mercury’s surface. Also studied Mercury’s core and geologic history, and found that Mercury iscontracting (shrinking).
17
• BepiColombo – Future mission set for launch in January 2017. Includes two orbiters, one to take images ofplanet, one to study planet’s magnetic field. Hopes to answer geologic questions that will help astronomersbetter understand the formation of our solar system, including why Mercury is so dense, whether it undergoestectonic activity, and what elements it is made out of.
9 Our Moon
Parameter Values
Moon Radius (km) 1737Moon Mass (kg) 7.34× 10²²
Moon Density (g/cm3) 3.344Rotation Period (days) 27.3217Orbit Period (days) 27.3217Semi-Major Axis (km) 3.844× 10⁵
Eccentricity 0.0549Inclination (deg) 5.145Obliquity (deg) 6.68Avg. Temperature (K) 270.7
9.1 Tides
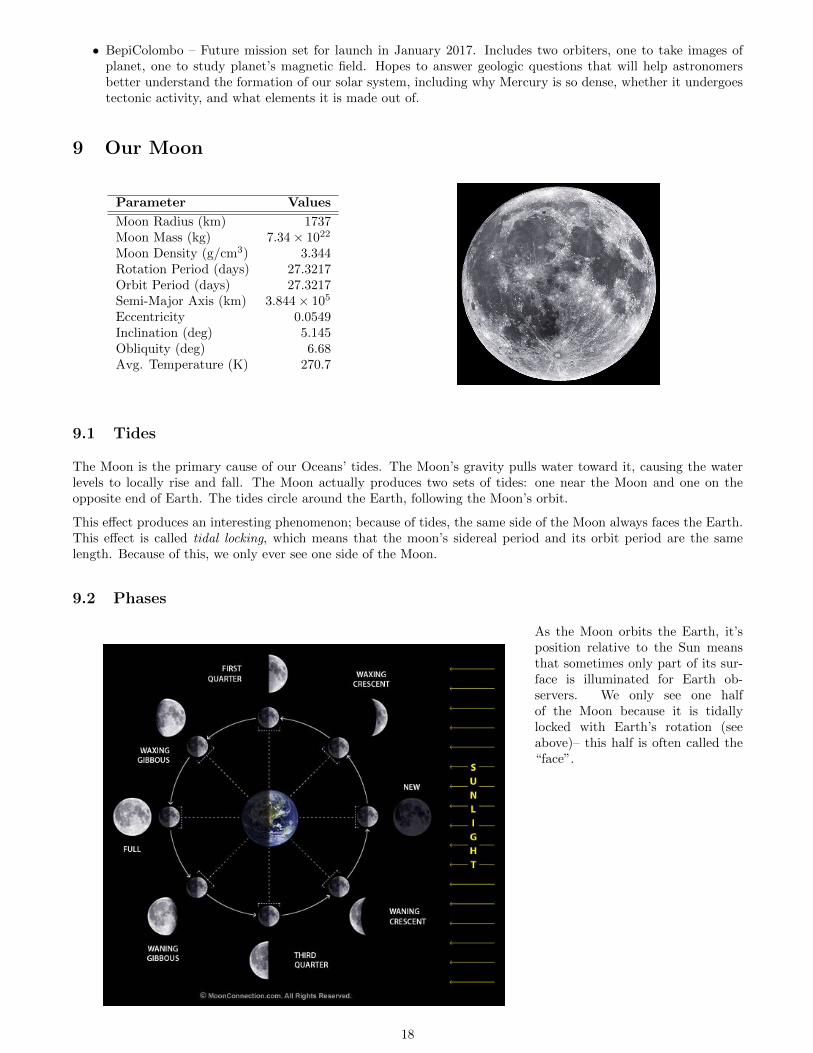
The Moon is the primary cause of our Oceans’ tides. The Moon’s gravity pulls water toward it, causing the waterlevels to locally rise and fall. The Moon actually produces two sets of tides: one near the Moon and one on theopposite end of Earth. The tides circle around the Earth, following the Moon’s orbit.
This effect produces an interesting phenomenon; because of tides, the same side of the Moon always faces the Earth.This effect is called tidal locking, which means that the moon’s sidereal period and its orbit period are the samelength. Because of this, we only ever see one side of the Moon.
9.2 Phases
As the Moon orbits the Earth, it’sposition relative to the Sun meansthat sometimes only part of its sur-face is illuminated for Earth ob-servers. We only see one halfof the Moon because it is tidallylocked with Earth’s rotation (seeabove)– this half is often called the“face”.
18
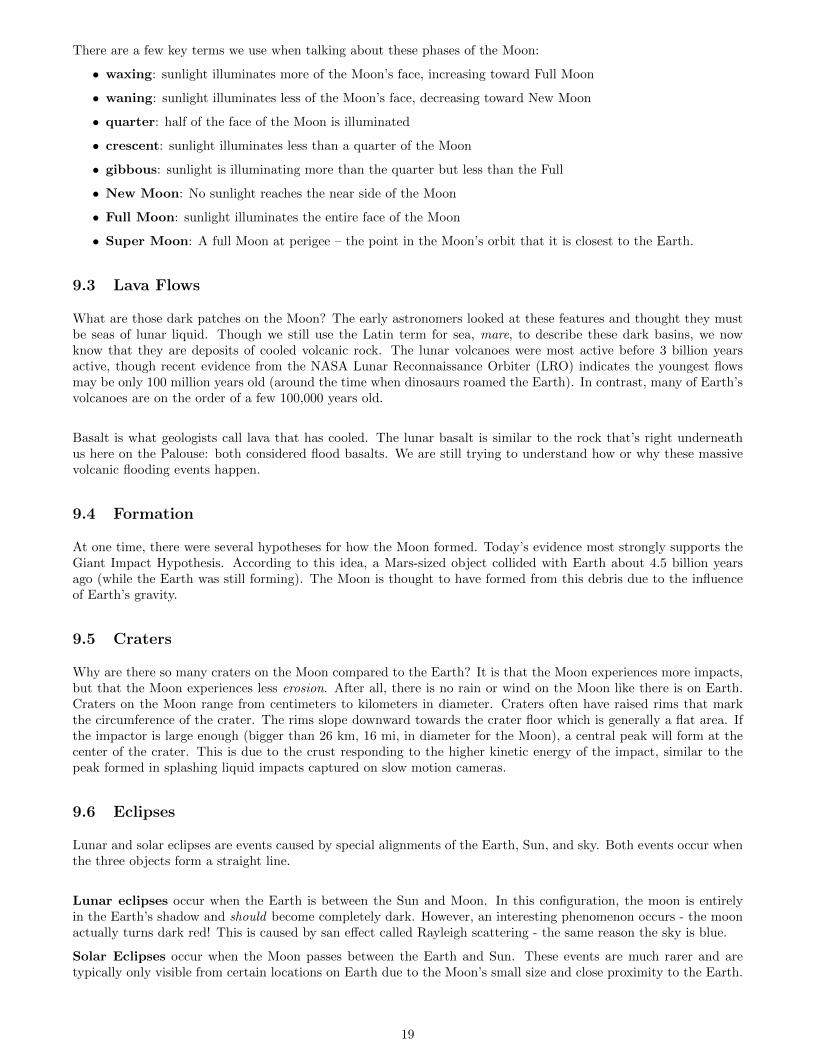
There are a few key terms we use when talking about these phases of the Moon:
• waxing: sunlight illuminates more of the Moon’s face, increasing toward Full Moon
• waning: sunlight illuminates less of the Moon’s face, decreasing toward New Moon
• quarter: half of the face of the Moon is illuminated
• crescent: sunlight illuminates less than a quarter of the Moon
• gibbous: sunlight is illuminating more than the quarter but less than the Full
• New Moon: No sunlight reaches the near side of the Moon
• Full Moon: sunlight illuminates the entire face of the Moon
• Super Moon: A full Moon at perigee – the point in the Moon’s orbit that it is closest to the Earth.
9.3 Lava Flows
What are those dark patches on the Moon? The early astronomers looked at these features and thought they mustbe seas of lunar liquid. Though we still use the Latin term for sea, mare, to describe these dark basins, we nowknow that they are deposits of cooled volcanic rock. The lunar volcanoes were most active before 3 billion yearsactive, though recent evidence from the NASA Lunar Reconnaissance Orbiter (LRO) indicates the youngest flowsmay be only 100 million years old (around the time when dinosaurs roamed the Earth). In contrast, many of Earth’svolcanoes are on the order of a few 100,000 years old.
Basalt is what geologists call lava that has cooled. The lunar basalt is similar to the rock that’s right underneathus here on the Palouse: both considered flood basalts. We are still trying to understand how or why these massivevolcanic flooding events happen.
9.4 Formation
At one time, there were several hypotheses for how the Moon formed. Today’s evidence most strongly supports theGiant Impact Hypothesis. According to this idea, a Mars-sized object collided with Earth about 4.5 billion yearsago (while the Earth was still forming). The Moon is thought to have formed from this debris due to the influenceof Earth’s gravity.
9.5 Craters
Why are there so many craters on the Moon compared to the Earth? It is that the Moon experiences more impacts,but that the Moon experiences less erosion. After all, there is no rain or wind on the Moon like there is on Earth.Craters on the Moon range from centimeters to kilometers in diameter. Craters often have raised rims that markthe circumference of the crater. The rims slope downward towards the crater floor which is generally a flat area. Ifthe impactor is large enough (bigger than 26 km, 16 mi, in diameter for the Moon), a central peak will form at thecenter of the crater. This is due to the crust responding to the higher kinetic energy of the impact, similar to thepeak formed in splashing liquid impacts captured on slow motion cameras.
9.6 Eclipses
Lunar and solar eclipses are events caused by special alignments of the Earth, Sun, and sky. Both events occur whenthe three objects form a straight line.
Lunar eclipses occur when the Earth is between the Sun and Moon. In this configuration, the moon is entirelyin the Earth’s shadow and should become completely dark. However, an interesting phenomenon occurs - the moonactually turns dark red! This is caused by san effect called Rayleigh scattering - the same reason the sky is blue.
Solar Eclipses occur when the Moon passes between the Earth and Sun. These events are much rarer and aretypically only visible from certain locations on Earth due to the Moon’s small size and close proximity to the Earth.
19
10 Moons of Other Planets
10.1 Callisto
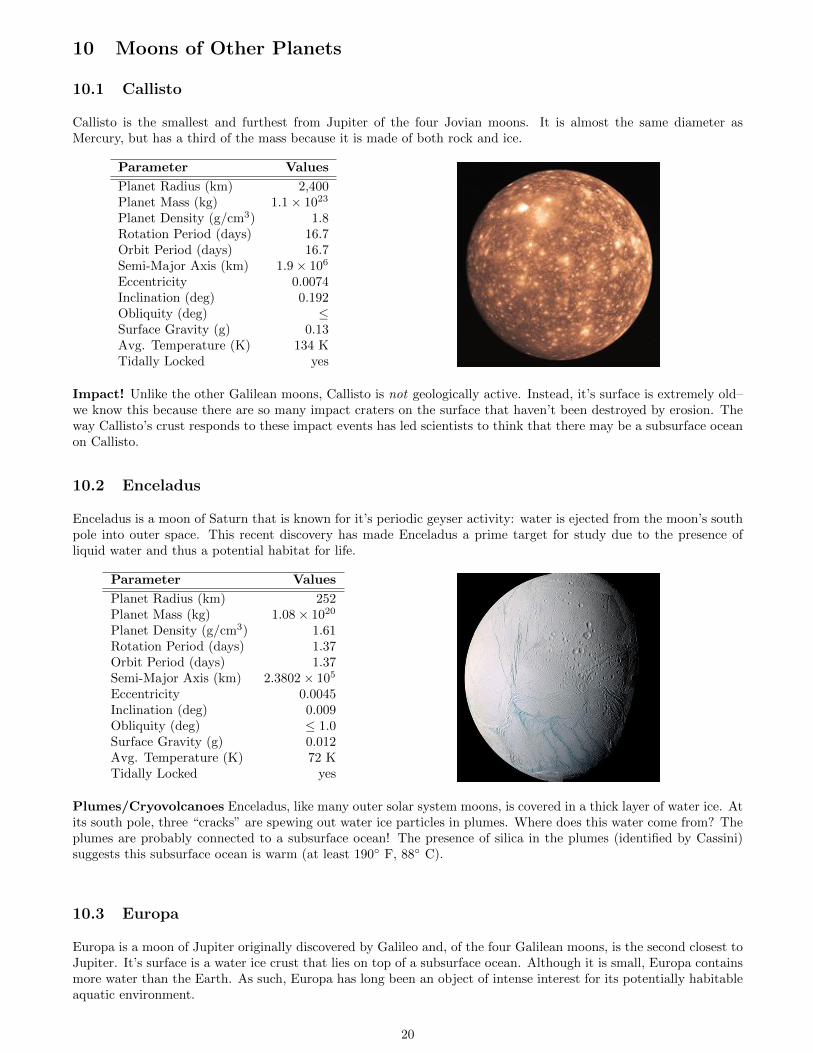
Callisto is the smallest and furthest from Jupiter of the four Jovian moons. It is almost the same diameter asMercury, but has a third of the mass because it is made of both rock and ice.
Parameter Values
Planet Radius (km) 2,400Planet Mass (kg) 1.1× 10²³
Planet Density (g/cm3) 1.8Rotation Period (days) 16.7Orbit Period (days) 16.7Semi-Major Axis (km) 1.9× 10⁶
Eccentricity 0.0074Inclination (deg) 0.192Obliquity (deg) ≤Surface Gravity (g) 0.13Avg. Temperature (K) 134 KTidally Locked yes
Impact! Unlike the other Galilean moons, Callisto is not geologically active. Instead, it’s surface is extremely old–we know this because there are so many impact craters on the surface that haven’t been destroyed by erosion. Theway Callisto’s crust responds to these impact events has led scientists to think that there may be a subsurface oceanon Callisto.
10.2 Enceladus
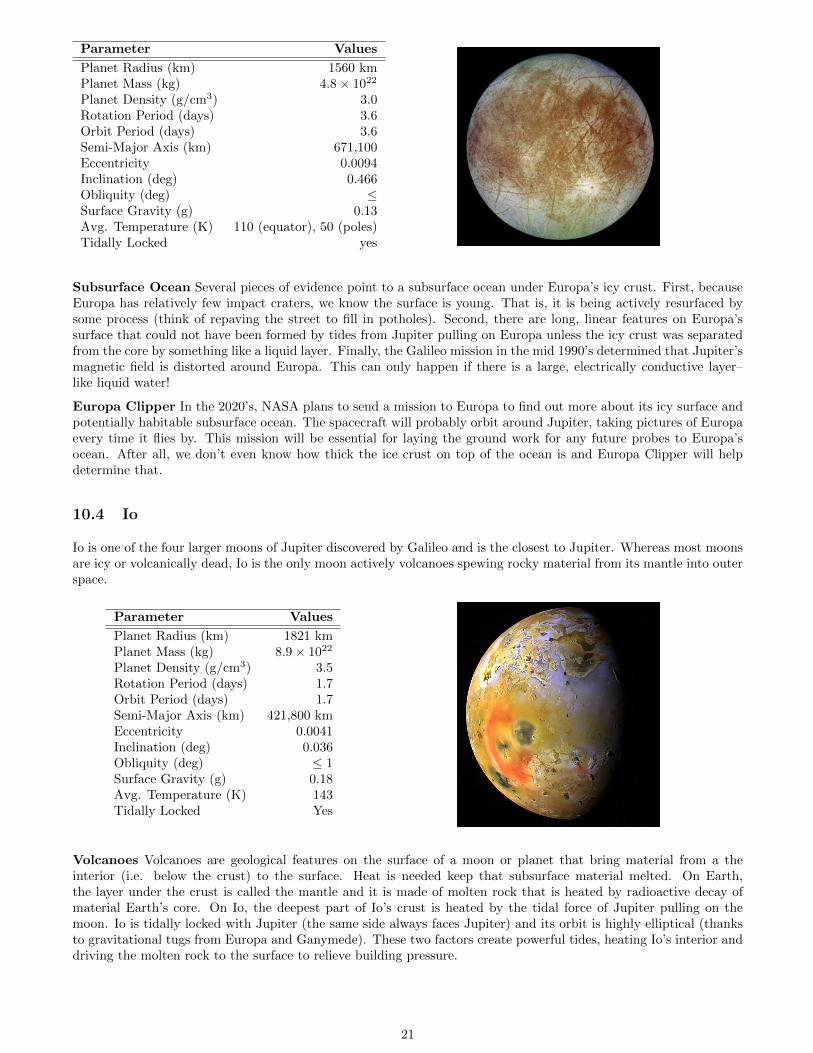
Enceladus is a moon of Saturn that is known for it’s periodic geyser activity: water is ejected from the moon’s southpole into outer space. This recent discovery has made Enceladus a prime target for study due to the presence ofliquid water and thus a potential habitat for life.
Parameter Values
Planet Radius (km) 252Planet Mass (kg) 1.08× 10²⁰
Planet Density (g/cm3) 1.61Rotation Period (days) 1.37Orbit Period (days) 1.37Semi-Major Axis (km) 2.3802× 10⁵
Eccentricity 0.0045Inclination (deg) 0.009Obliquity (deg) ≤ 1.0Surface Gravity (g) 0.012Avg. Temperature (K) 72 KTidally Locked yes
Plumes/Cryovolcanoes Enceladus, like many outer solar system moons, is covered in a thick layer of water ice. Atits south pole, three “cracks” are spewing out water ice particles in plumes. Where does this water come from? Theplumes are probably connected to a subsurface ocean! The presence of silica in the plumes (identified by Cassini)suggests this subsurface ocean is warm (at least 190◦ F, 88◦ C).
10.3 Europa
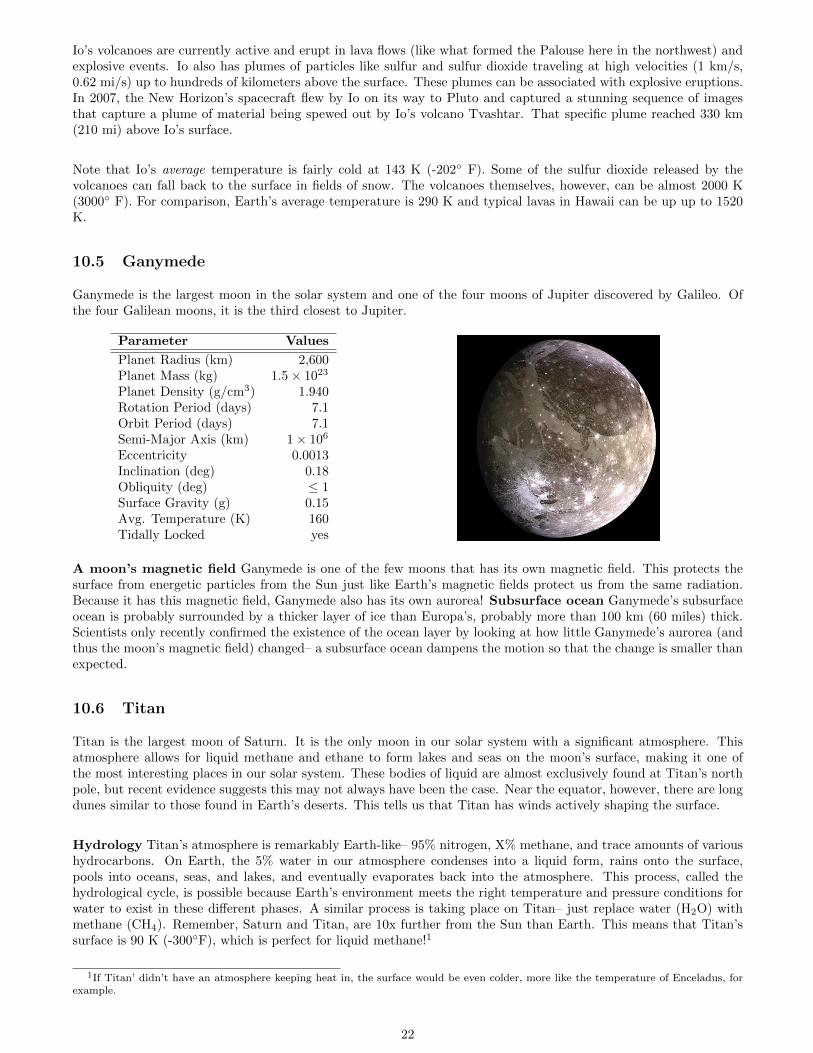
Europa is a moon of Jupiter originally discovered by Galileo and, of the four Galilean moons, is the second closest toJupiter. It’s surface is a water ice crust that lies on top of a subsurface ocean. Although it is small, Europa containsmore water than the Earth. As such, Europa has long been an object of intense interest for its potentially habitableaquatic environment.
20
Parameter Values
Planet Radius (km) 1560 kmPlanet Mass (kg) 4.8× 10²²
Planet Density (g/cm3) 3.0Rotation Period (days) 3.6Orbit Period (days) 3.6Semi-Major Axis (km) 671,100Eccentricity 0.0094Inclination (deg) 0.466Obliquity (deg) ≤Surface Gravity (g) 0.13Avg. Temperature (K) 110 (equator), 50 (poles)Tidally Locked yes
Subsurface Ocean Several pieces of evidence point to a subsurface ocean under Europa’s icy crust. First, becauseEuropa has relatively few impact craters, we know the surface is young. That is, it is being actively resurfaced bysome process (think of repaving the street to fill in potholes). Second, there are long, linear features on Europa’ssurface that could not have been formed by tides from Jupiter pulling on Europa unless the icy crust was separatedfrom the core by something like a liquid layer. Finally, the Galileo mission in the mid 1990’s determined that Jupiter’smagnetic field is distorted around Europa. This can only happen if there is a large, electrically conductive layer–like liquid water!
Europa Clipper In the 2020’s, NASA plans to send a mission to Europa to find out more about its icy surface andpotentially habitable subsurface ocean. The spacecraft will probably orbit around Jupiter, taking pictures of Europaevery time it flies by. This mission will be essential for laying the ground work for any future probes to Europa’socean. After all, we don’t even know how thick the ice crust on top of the ocean is and Europa Clipper will helpdetermine that.
10.4 Io
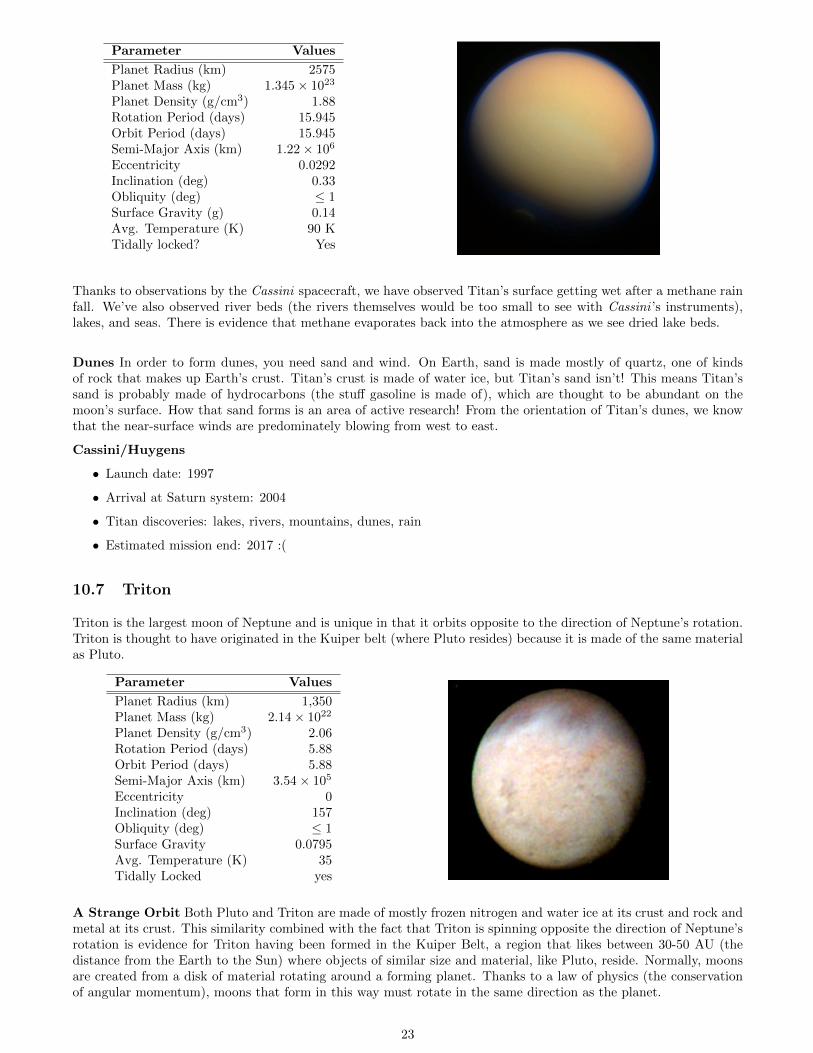
Io is one of the four larger moons of Jupiter discovered by Galileo and is the closest to Jupiter. Whereas most moonsare icy or volcanically dead, Io is the only moon actively volcanoes spewing rocky material from its mantle into outerspace.
Parameter Values
Planet Radius (km) 1821 kmPlanet Mass (kg) 8.9× 10²²
Planet Density (g/cm3) 3.5Rotation Period (days) 1.7Orbit Period (days) 1.7Semi-Major Axis (km) 421,800 kmEccentricity 0.0041Inclination (deg) 0.036Obliquity (deg) ≤ 1Surface Gravity (g) 0.18Avg. Temperature (K) 143Tidally Locked Yes
Volcanoes Volcanoes are geological features on the surface of a moon or planet that bring material from a theinterior (i.e. below the crust) to the surface. Heat is needed keep that subsurface material melted. On Earth,the layer under the crust is called the mantle and it is made of molten rock that is heated by radioactive decay ofmaterial Earth’s core. On Io, the deepest part of Io’s crust is heated by the tidal force of Jupiter pulling on themoon. Io is tidally locked with Jupiter (the same side always faces Jupiter) and its orbit is highly elliptical (thanksto gravitational tugs from Europa and Ganymede). These two factors create powerful tides, heating Io’s interior anddriving the molten rock to the surface to relieve building pressure.
21
Io’s volcanoes are currently active and erupt in lava flows (like what formed the Palouse here in the northwest) andexplosive events. Io also has plumes of particles like sulfur and sulfur dioxide traveling at high velocities (1 km/s,0.62 mi/s) up to hundreds of kilometers above the surface. These plumes can be associated with explosive eruptions.In 2007, the New Horizon’s spacecraft flew by Io on its way to Pluto and captured a stunning sequence of imagesthat capture a plume of material being spewed out by Io’s volcano Tvashtar. That specific plume reached 330 km(210 mi) above Io’s surface.
Note that Io’s average temperature is fairly cold at 143 K (-202◦ F). Some of the sulfur dioxide released by thevolcanoes can fall back to the surface in fields of snow. The volcanoes themselves, however, can be almost 2000 K(3000◦ F). For comparison, Earth’s average temperature is 290 K and typical lavas in Hawaii can be up up to 1520K.
10.5 Ganymede
Ganymede is the largest moon in the solar system and one of the four moons of Jupiter discovered by Galileo. Ofthe four Galilean moons, it is the third closest to Jupiter.
Parameter Values
Planet Radius (km) 2,600Planet Mass (kg) 1.5× 10²³
Planet Density (g/cm3) 1.940Rotation Period (days) 7.1Orbit Period (days) 7.1Semi-Major Axis (km) 1× 10⁶
Eccentricity 0.0013Inclination (deg) 0.18Obliquity (deg) ≤ 1Surface Gravity (g) 0.15Avg. Temperature (K) 160Tidally Locked yes
A moon’s magnetic field Ganymede is one of the few moons that has its own magnetic field. This protects thesurface from energetic particles from the Sun just like Earth’s magnetic fields protect us from the same radiation.Because it has this magnetic field, Ganymede also has its own aurorea! Subsurface ocean Ganymede’s subsurfaceocean is probably surrounded by a thicker layer of ice than Europa’s, probably more than 100 km (60 miles) thick.Scientists only recently confirmed the existence of the ocean layer by looking at how little Ganymede’s aurorea (andthus the moon’s magnetic field) changed– a subsurface ocean dampens the motion so that the change is smaller thanexpected.
10.6 Titan
Titan is the largest moon of Saturn. It is the only moon in our solar system with a significant atmosphere. Thisatmosphere allows for liquid methane and ethane to form lakes and seas on the moon’s surface, making it one ofthe most interesting places in our solar system. These bodies of liquid are almost exclusively found at Titan’s northpole, but recent evidence suggests this may not always have been the case. Near the equator, however, there are longdunes similar to those found in Earth’s deserts. This tells us that Titan has winds actively shaping the surface.
Hydrology Titan’s atmosphere is remarkably Earth-like– 95% nitrogen, X% methane, and trace amounts of varioushydrocarbons. On Earth, the 5% water in our atmosphere condenses into a liquid form, rains onto the surface,pools into oceans, seas, and lakes, and eventually evaporates back into the atmosphere. This process, called thehydrological cycle, is possible because Earth’s environment meets the right temperature and pressure conditions forwater to exist in these different phases. A similar process is taking place on Titan– just replace water (H2O) withmethane (CH4). Remember, Saturn and Titan, are 10x further from the Sun than Earth. This means that Titan’ssurface is 90 K (-300◦F), which is perfect for liquid methane!1
1If Titan’ didn’t have an atmosphere keeping heat in, the surface would be even colder, more like the temperature of Enceladus, forexample.
22
Parameter Values
Planet Radius (km) 2575Planet Mass (kg) 1.345× 10²³
Planet Density (g/cm3) 1.88Rotation Period (days) 15.945Orbit Period (days) 15.945Semi-Major Axis (km) 1.22× 10⁶
Eccentricity 0.0292Inclination (deg) 0.33Obliquity (deg) ≤ 1Surface Gravity (g) 0.14Avg. Temperature (K) 90 KTidally locked? Yes
Thanks to observations by the Cassini spacecraft, we have observed Titan’s surface getting wet after a methane rainfall. We’ve also observed river beds (the rivers themselves would be too small to see with Cassini ’s instruments),lakes, and seas. There is evidence that methane evaporates back into the atmosphere as we see dried lake beds.
Dunes In order to form dunes, you need sand and wind. On Earth, sand is made mostly of quartz, one of kindsof rock that makes up Earth’s crust. Titan’s crust is made of water ice, but Titan’s sand isn’t! This means Titan’ssand is probably made of hydrocarbons (the stuff gasoline is made of), which are thought to be abundant on themoon’s surface. How that sand forms is an area of active research! From the orientation of Titan’s dunes, we knowthat the near-surface winds are predominately blowing from west to east.
Cassini/Huygens
• Launch date: 1997
• Arrival at Saturn system: 2004
• Titan discoveries: lakes, rivers, mountains, dunes, rain
• Estimated mission end: 2017 :(
10.7 Triton
Triton is the largest moon of Neptune and is unique in that it orbits opposite to the direction of Neptune’s rotation.Triton is thought to have originated in the Kuiper belt (where Pluto resides) because it is made of the same materialas Pluto.
Parameter Values
Planet Radius (km) 1,350Planet Mass (kg) 2.14× 10²²
Planet Density (g/cm3) 2.06Rotation Period (days) 5.88Orbit Period (days) 5.88Semi-Major Axis (km) 3.54× 10⁵
Eccentricity 0Inclination (deg) 157Obliquity (deg) ≤ 1Surface Gravity 0.0795Avg. Temperature (K) 35Tidally Locked yes
A Strange Orbit Both Pluto and Triton are made of mostly frozen nitrogen and water ice at its crust and rock andmetal at its crust. This similarity combined with the fact that Triton is spinning opposite the direction of Neptune’srotation is evidence for Triton having been formed in the Kuiper Belt, a region that likes between 30-50 AU (thedistance from the Earth to the Sun) where objects of similar size and material, like Pluto, reside. Normally, moonsare created from a disk of material rotating around a forming planet. Thanks to a law of physics (the conservationof angular momentum), moons that form in this way must rotate in the same direction as the planet.
23
How then did Triton get into orbit around Neptune? This is an active area of research, but two of the leadinghypotheses are:
• Triton could have collided with a smaller moon forming around Neptune.
• Triton could have been traveling with a more massive partner. When the two bodies experienced Neptune’sgravity, Triton was pulled into orbit while the partner was flung off into space. It is not uncommon for objectsfrom the Kuiper Belt to travel in pairs (”binaries”).
Cryo-Volcanoes Triton’s surface is relatively young, meaning that the surface has been/is being reworked. Weknow this because there are relatively few impact craters on the moon’s icy surface. There are, however, the tell-talesigns of tectonics and active volcanism in the icy crust. On Earth, volcanoes spew out the material from underneaththe crust, called the mantle, and are driven by internal heating. Thus, since Triton’s crust is made of water ice, avolcano on Triton would spew water.
Missions All of our information about Triton’s surface comes from when the Voyager 2 probe flew by in 1989.
11 Neptune
11.1 Basic Information
Parameter Values
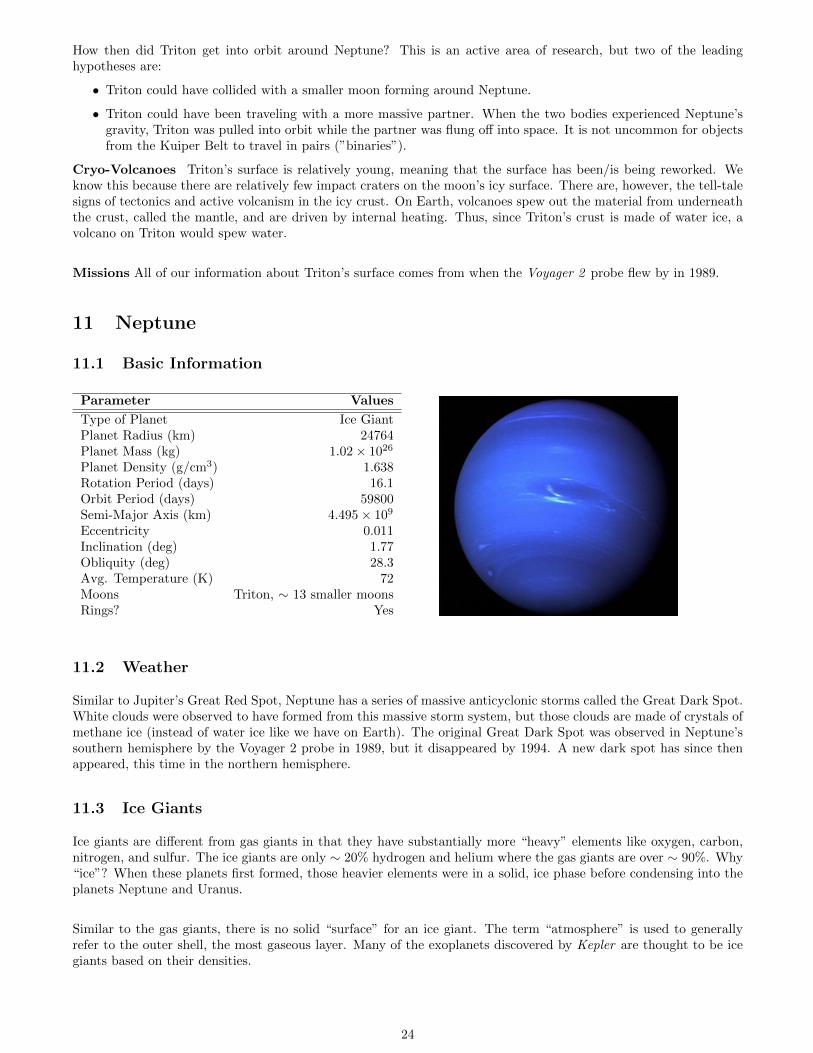
Type of Planet Ice GiantPlanet Radius (km) 24764Planet Mass (kg) 1.02× 1026
Planet Density (g/cm3) 1.638Rotation Period (days) 16.1Orbit Period (days) 59800Semi-Major Axis (km) 4.495× 10⁹
Eccentricity 0.011Inclination (deg) 1.77Obliquity (deg) 28.3Avg. Temperature (K) 72Moons Triton, ∼ 13 smaller moonsRings? Yes
11.2 Weather
Similar to Jupiter’s Great Red Spot, Neptune has a series of massive anticyclonic storms called the Great Dark Spot.White clouds were observed to have formed from this massive storm system, but those clouds are made of crystals ofmethane ice (instead of water ice like we have on Earth). The original Great Dark Spot was observed in Neptune’ssouthern hemisphere by the Voyager 2 probe in 1989, but it disappeared by 1994. A new dark spot has since thenappeared, this time in the northern hemisphere.
11.3 Ice Giants
Ice giants are different from gas giants in that they have substantially more “heavy” elements like oxygen, carbon,nitrogen, and sulfur. The ice giants are only ∼ 20% hydrogen and helium where the gas giants are over ∼ 90%. Why“ice”? When these planets first formed, those heavier elements were in a solid, ice phase before condensing into theplanets Neptune and Uranus.
Similar to the gas giants, there is no solid “surface” for an ice giant. The term “atmosphere” is used to generallyrefer to the outer shell, the most gaseous layer. Many of the exoplanets discovered by Kepler are thought to be icegiants based on their densities.
24
11.4 Missions
• Voyager II (25 August 1989): single flyby event
Voyager 2 is the only human-made object to have flown by Neptune. In the closest approach of its entiretour, the spacecraft passed less than 5,000 km above the planet’s cloud tops. It discovered five moons, fourrings, and a ”Great Dark Spot” that vanished by the time the Hubble Space Telescope imaged Neptune fiveyears later. Neptune’s largest moon, Triton, was found to be the coldest known planetary body in the solarsystem, with a nitrogen ice ”volcano” on its surface. A gravity assist at Neptune shot Voyager 2 below theplane in which the planets orbit the sun, on a course which will ultimately take the spacecraft out of our solarsystem.
12 Saturn
12.1 Basic Information
Parameter Values
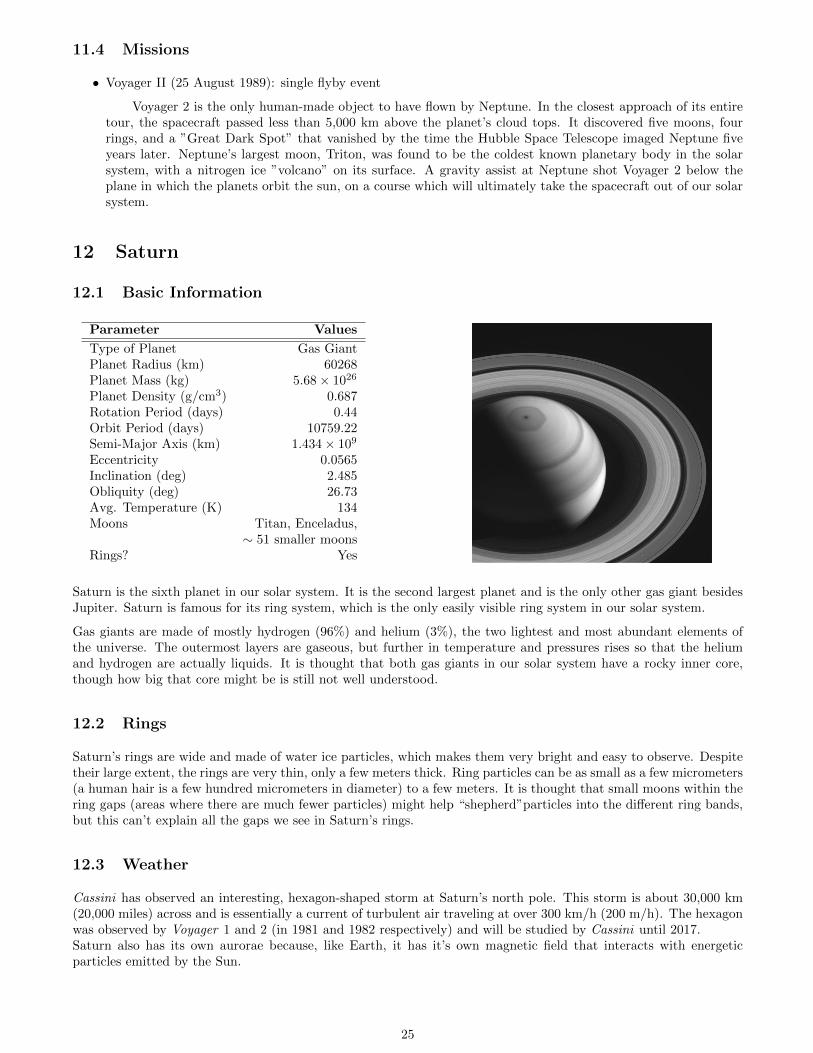
Type of Planet Gas GiantPlanet Radius (km) 60268Planet Mass (kg) 5.68× 1026
Planet Density (g/cm3) 0.687Rotation Period (days) 0.44Orbit Period (days) 10759.22Semi-Major Axis (km) 1.434× 10⁹
Eccentricity 0.0565Inclination (deg) 2.485Obliquity (deg) 26.73Avg. Temperature (K) 134Moons Titan, Enceladus,
∼ 51 smaller moonsRings? Yes
Saturn is the sixth planet in our solar system. It is the second largest planet and is the only other gas giant besidesJupiter. Saturn is famous for its ring system, which is the only easily visible ring system in our solar system.
Gas giants are made of mostly hydrogen (96%) and helium (3%), the two lightest and most abundant elements ofthe universe. The outermost layers are gaseous, but further in temperature and pressures rises so that the heliumand hydrogen are actually liquids. It is thought that both gas giants in our solar system have a rocky inner core,though how big that core might be is still not well understood.
12.2 Rings
Saturn’s rings are wide and made of water ice particles, which makes them very bright and easy to observe. Despitetheir large extent, the rings are very thin, only a few meters thick. Ring particles can be as small as a few micrometers(a human hair is a few hundred micrometers in diameter) to a few meters. It is thought that small moons within thering gaps (areas where there are much fewer particles) might help “shepherd”particles into the different ring bands,but this can’t explain all the gaps we see in Saturn’s rings.
12.3 Weather
Cassini has observed an interesting, hexagon-shaped storm at Saturn’s north pole. This storm is about 30,000 km(20,000 miles) across and is essentially a current of turbulent air traveling at over 300 km/h (200 m/h). The hexagonwas observed by Voyager 1 and 2 (in 1981 and 1982 respectively) and will be studied by Cassini until 2017.Saturn also has its own aurorae because, like Earth, it has it’s own magnetic field that interacts with energeticparticles emitted by the Sun.
25
12.4 Missions
• Cassini (October 1997 - April 2017): first dedicated Saturn-system mission; studying moons, planet, rings
• Voyager I (flyby on 12 November 1980)
• Voyager II (flyby on 26 August 1981)
• Pioneer 11 (flyby on 1 September 1979)
13 Stars
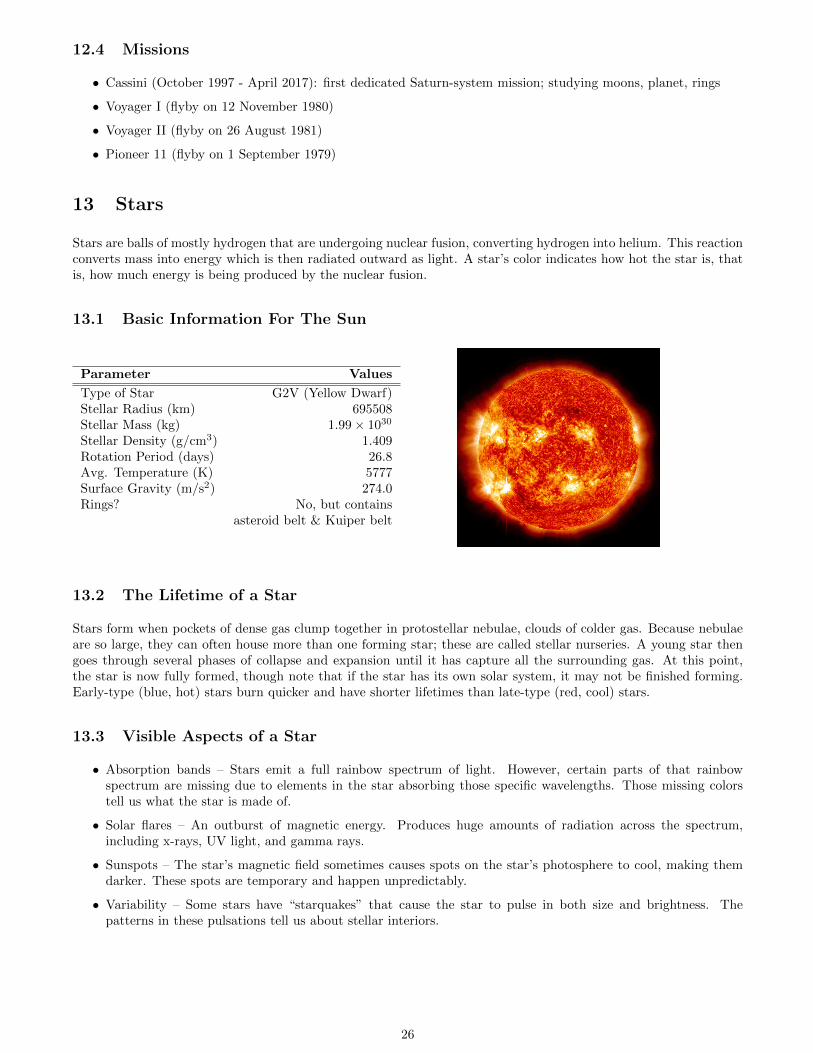
Stars are balls of mostly hydrogen that are undergoing nuclear fusion, converting hydrogen into helium. This reactionconverts mass into energy which is then radiated outward as light. A star’s color indicates how hot the star is, thatis, how much energy is being produced by the nuclear fusion.
13.1 Basic Information For The Sun
Parameter Values
Type of Star G2V (Yellow Dwarf)Stellar Radius (km) 695508Stellar Mass (kg) 1.99× 1030
Stellar Density (g/cm3) 1.409Rotation Period (days) 26.8Avg. Temperature (K) 5777Surface Gravity (m/s2) 274.0Rings? No, but contains
asteroid belt & Kuiper belt
13.2 The Lifetime of a Star
Stars form when pockets of dense gas clump together in protostellar nebulae, clouds of colder gas. Because nebulaeare so large, they can often house more than one forming star; these are called stellar nurseries. A young star thengoes through several phases of collapse and expansion until it has capture all the surrounding gas. At this point,the star is now fully formed, though note that if the star has its own solar system, it may not be finished forming.Early-type (blue, hot) stars burn quicker and have shorter lifetimes than late-type (red, cool) stars.
13.3 Visible Aspects of a Star
• Absorption bands – Stars emit a full rainbow spectrum of light. However, certain parts of that rainbowspectrum are missing due to elements in the star absorbing those specific wavelengths. Those missing colorstell us what the star is made of.
• Solar flares – An outburst of magnetic energy. Produces huge amounts of radiation across the spectrum,including x-rays, UV light, and gamma rays.
• Sunspots – The star’s magnetic field sometimes causes spots on the star’s photosphere to cool, making themdarker. These spots are temporary and happen unpredictably.
• Variability – Some stars have “starquakes” that cause the star to pulse in both size and brightness. Thepatterns in these pulsations tell us about stellar interiors.
26
13.4 Famous Stars
• Alpha Centauri – Third brightest star in night sky, is trinary system
• Antares – Bright red supergiant, close to the ecliptic
• Arcturus – One of the brightest stars, easily spottable next to the Big Dipper
• Betelgeuse – the first star to be directly imaged
• Polaris – The North star, the tail of the Little Dipper
• Rigel – Brightest star in the Orion constellation
• Sirius – brightest star in the sky, is actually a binary system
• Vega – historically important in many civilizations, used to calibrate magnitudes
14 Uranus
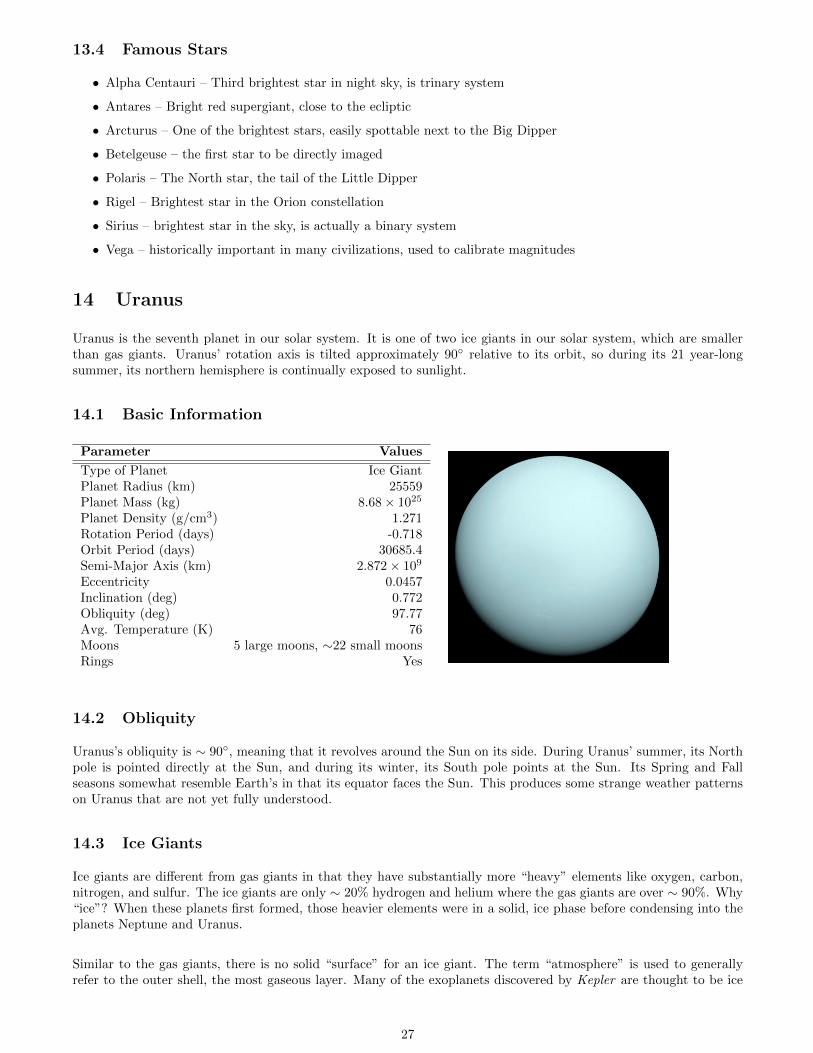
Uranus is the seventh planet in our solar system. It is one of two ice giants in our solar system, which are smallerthan gas giants. Uranus’ rotation axis is tilted approximately 90◦ relative to its orbit, so during its 21 year-longsummer, its northern hemisphere is continually exposed to sunlight.
14.1 Basic Information
Parameter Values
Type of Planet Ice GiantPlanet Radius (km) 25559Planet Mass (kg) 8.68× 1025
Planet Density (g/cm3) 1.271Rotation Period (days) -0.718Orbit Period (days) 30685.4Semi-Major Axis (km) 2.872× 10⁹
Eccentricity 0.0457Inclination (deg) 0.772Obliquity (deg) 97.77Avg. Temperature (K) 76Moons 5 large moons, ∼22 small moonsRings Yes
14.2 Obliquity
Uranus’s obliquity is ∼ 90◦, meaning that it revolves around the Sun on its side. During Uranus’ summer, its Northpole is pointed directly at the Sun, and during its winter, its South pole points at the Sun. Its Spring and Fallseasons somewhat resemble Earth’s in that its equator faces the Sun. This produces some strange weather patternson Uranus that are not yet fully understood.
14.3 Ice Giants
Ice giants are different from gas giants in that they have substantially more “heavy” elements like oxygen, carbon,nitrogen, and sulfur. The ice giants are only ∼ 20% hydrogen and helium where the gas giants are over ∼ 90%. Why“ice”? When these planets first formed, those heavier elements were in a solid, ice phase before condensing into theplanets Neptune and Uranus.
Similar to the gas giants, there is no solid “surface” for an ice giant. The term “atmosphere” is used to generallyrefer to the outer shell, the most gaseous layer. Many of the exoplanets discovered by Kepler are thought to be ice
27
giants based on their densities.
14.4 Missions
• Voyager II (24 Jan 1986): single flyby event
The only spacecraft to have flown by Uranus. The planet displayed little detail, but gave evidence of anocean of boiling water about 800 km below the cloud tops. Curiously, the average temperature of its sun-facingpole was found to be the same as that of the equator. The spacecraft discovered 10 new moons, two new rings,and a strangely tilted magnetic field stronger than that of Saturn. A gravity assist at Uranus propelled thespacecraft toward its next destination, Neptune.
15 Venus
15.1 Basic Information
Parameter Values
Type of planet rockyPlanet Radius (km) 6051.8Planet Mass (kg) 4.8676× 1024
Planet Density (g/cm3) 5.243Rotation Period (days) 224.701Orbit Period (days) -243.025Semi-Major Axis (km) 1.0821× 10⁸
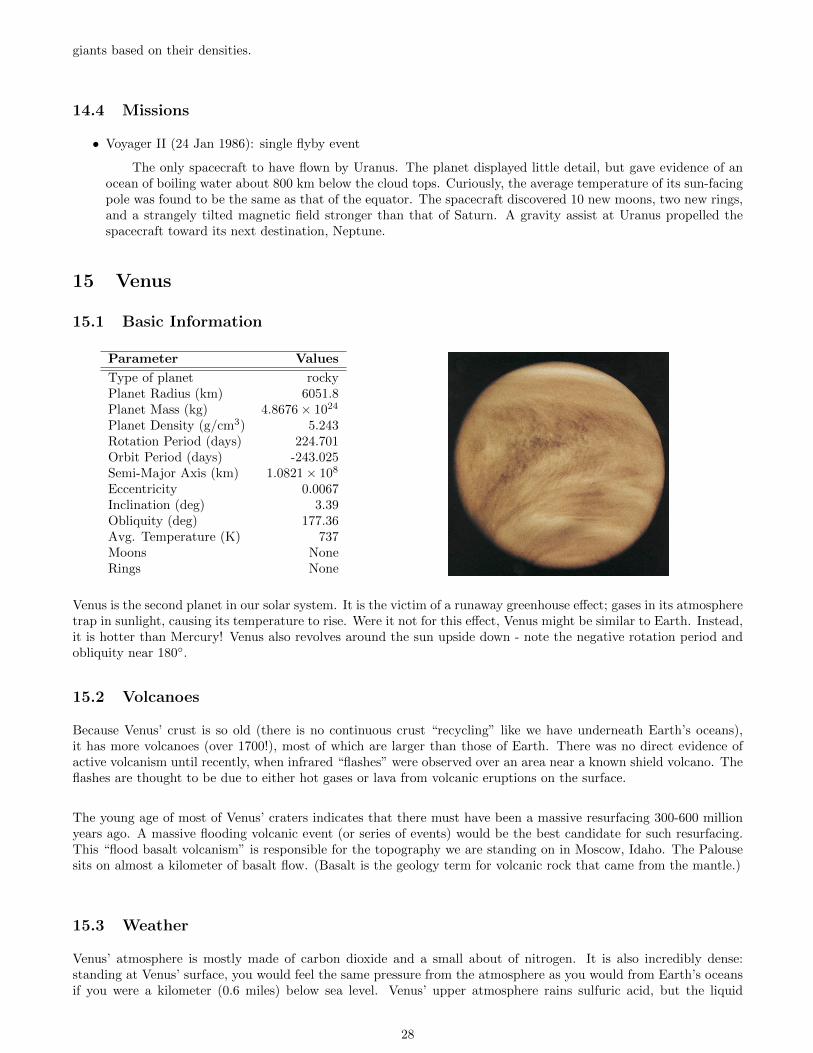
Eccentricity 0.0067Inclination (deg) 3.39Obliquity (deg) 177.36Avg. Temperature (K) 737Moons NoneRings None
Venus is the second planet in our solar system. It is the victim of a runaway greenhouse effect; gases in its atmospheretrap in sunlight, causing its temperature to rise. Were it not for this effect, Venus might be similar to Earth. Instead,it is hotter than Mercury! Venus also revolves around the sun upside down - note the negative rotation period andobliquity near 180◦.
15.2 Volcanoes
Because Venus’ crust is so old (there is no continuous crust “recycling” like we have underneath Earth’s oceans),it has more volcanoes (over 1700!), most of which are larger than those of Earth. There was no direct evidence ofactive volcanism until recently, when infrared “flashes” were observed over an area near a known shield volcano. Theflashes are thought to be due to either hot gases or lava from volcanic eruptions on the surface.
The young age of most of Venus’ craters indicates that there must have been a massive resurfacing 300-600 millionyears ago. A massive flooding volcanic event (or series of events) would be the best candidate for such resurfacing.This “flood basalt volcanism” is responsible for the topography we are standing on in Moscow, Idaho. The Palousesits on almost a kilometer of basalt flow. (Basalt is the geology term for volcanic rock that came from the mantle.)
15.3 Weather
Venus’ atmosphere is mostly made of carbon dioxide and a small about of nitrogen. It is also incredibly dense:standing at Venus’ surface, you would feel the same pressure from the atmosphere as you would from Earth’s oceansif you were a kilometer (0.6 miles) below sea level. Venus’ upper atmosphere rains sulfuric acid, but the liquid
28
evaporates long before the droplets would hit the ground. A Soviet Venus lander (Venera12) observed a thunderclapshortly after it landed.
15.4 Transits and Phases
Venus is closer to the Sun than Earth is. This occasionally results in Venus being directly between the Earth andthe Sun; this is known as a transit, where an object passes in front of the sun from our point of view. Unfortunately,the next Venus transit isn’t until 2117. Venus also has phases (just like the moon) as its position around the Sunchanges relative to Earth.
15.5 Missions
Venus Express Orbiter is a mission by the European Space Agency that launched in and arrived at Venus in . Itsscheduled mission end is . Venus Express was designed to study Venus’ atmosphere by tracking clouds, determiningcomposition, and observing the magnetic field.
The Venera series of probes were sent to Venus by the Soviet Union between 1967-1983. Because Venus is such atoxic environment, the longest a probe ever survived on the surface was 2 hours. Check out the composite of imagesttaken from the surface images at: http://planetimages.blogspot.com/2014/07/standing-on-venus-in-1975.html
29
Lab 1: Apparent Motion of the Sun and Moon LabThis lab requires at least 12 observations within the same month. It is to be completed by the lastlab day of the semester. Please plan accordingly: with this much advance warning, no late labs will
be accepted, nor will there will be any make-up opportunity for this lab.
Perhaps the most important fact to remember when looking up at the night sky is that the Earth is moving, not thesky. Okay, in reality, all the objects in the sky are actually moving, but Earth’s rotation dominates all motion wecan observe from the surface of the Earth. Everything in the night sky appears to be moving westward because theEarth is rotating towards the east. This phenomenon is called apparent motion.
1 The Moon
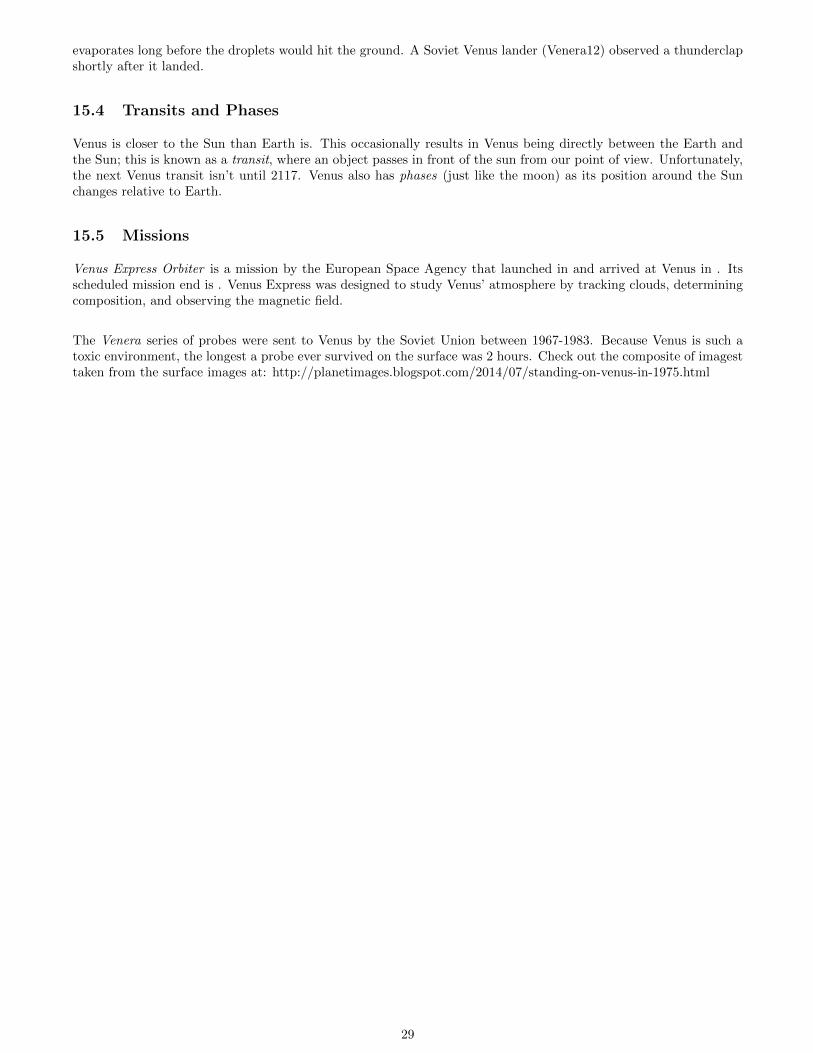
The Moon is orbiting around the Earth in an eastward direction. But when we look at the Moon in the night sky,it appears to be moving west. What’s going on here?
Moon’s apparent motion
apparent motion of the sky
Moon’s orbit
Earth’s Rotation
The Moon orbits around the Earth every 27.3 days.The Earth completes a rotation on its axis ev-ery 23 hours 56 minutes. Thus, because theMoon’s orbit is slower than our rotational motionhere on Earth, the Moon appears to be movingin the direction that the “sky is moving”, thatis, opposite Earth’s rotation. Think about walk-ing up a down escalator. If you walk fasterthan the speed of the escalator, you’ll eventu-ally reach the top. If you walk upwards slowerthan the escalator is moving downwards, then youtoo will move down and eventually reach the bot-tom.
The stars appear to move faster than the Moon becausethey are “moving across the sky” at the rate of Earth’srotation (remember– this is the reason why the stars are
“moving”). While the stars make a complete circle in the sky every 23 hours 56 minutes, the Moon lags behind,making a complete circle in the sky every 24 hours and 49 minutes. We can observe this difference by noting thetimes when the Moon rises and sets. The Moon rises/sets later and later until the Moon has made its complete orbitaround the Earth and rises/sets at the original time.
30
2 The Sun
Because the Earth orbits the Sun (in addition to rotating on its axis), the Sun also has apparent motion. This iseasiest to see by tracking the time and location of sunrise or sunset. The time of sunrise gets earlier and earlier aswe approach summer solstice, then gets later and later. (Sunsets, on the other hand, get later and later, then earlierand earlier.) The Sun also doesn’t rise exactly due east each day.
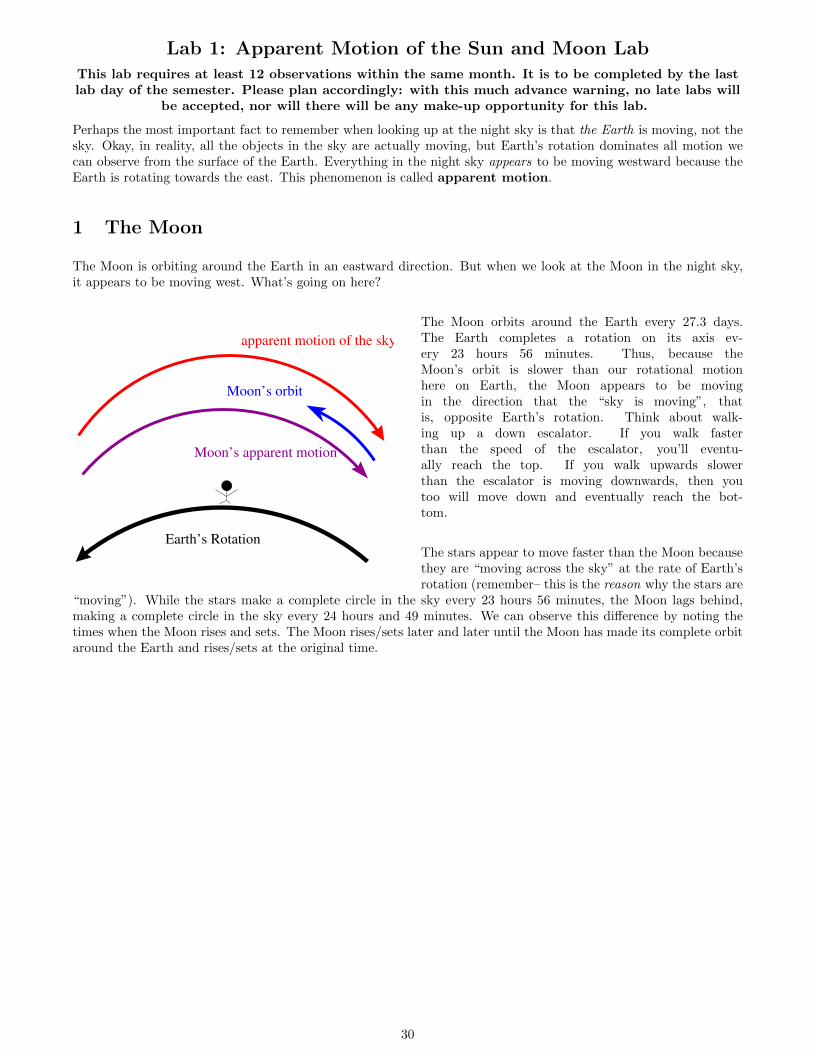
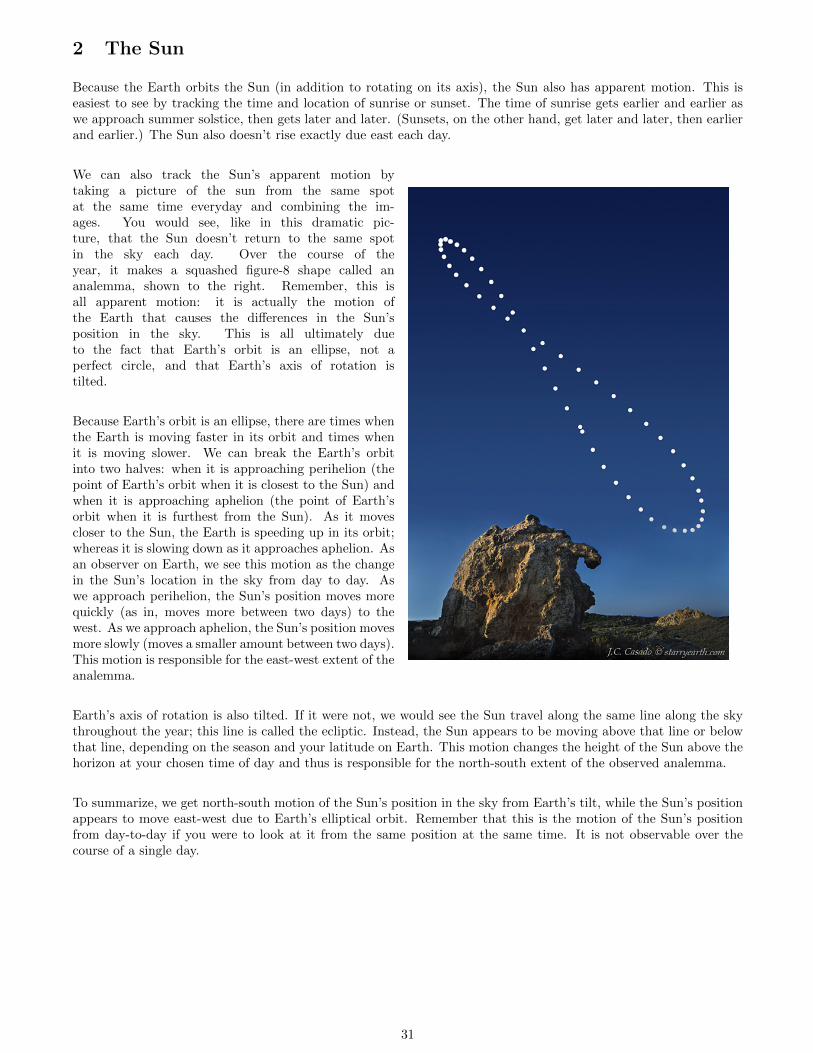
We can also track the Sun’s apparent motion bytaking a picture of the sun from the same spotat the same time everyday and combining the im-ages. You would see, like in this dramatic pic-ture, that the Sun doesn’t return to the same spotin the sky each day. Over the course of theyear, it makes a squashed figure-8 shape called ananalemma, shown to the right. Remember, this isall apparent motion: it is actually the motion ofthe Earth that causes the differences in the Sun’sposition in the sky. This is all ultimately dueto the fact that Earth’s orbit is an ellipse, not aperfect circle, and that Earth’s axis of rotation istilted.
Because Earth’s orbit is an ellipse, there are times whenthe Earth is moving faster in its orbit and times whenit is moving slower. We can break the Earth’s orbitinto two halves: when it is approaching perihelion (thepoint of Earth’s orbit when it is closest to the Sun) andwhen it is approaching aphelion (the point of Earth’sorbit when it is furthest from the Sun). As it movescloser to the Sun, the Earth is speeding up in its orbit;whereas it is slowing down as it approaches aphelion. Asan observer on Earth, we see this motion as the changein the Sun’s location in the sky from day to day. Aswe approach perihelion, the Sun’s position moves morequickly (as in, moves more between two days) to thewest. As we approach aphelion, the Sun’s position movesmore slowly (moves a smaller amount between two days).This motion is responsible for the east-west extent of theanalemma.
Earth’s axis of rotation is also tilted. If it were not, we would see the Sun travel along the same line along the skythroughout the year; this line is called the ecliptic. Instead, the Sun appears to be moving above that line or belowthat line, depending on the season and your latitude on Earth. This motion changes the height of the Sun above thehorizon at your chosen time of day and thus is responsible for the north-south extent of the observed analemma.
To summarize, we get north-south motion of the Sun’s position in the sky from Earth’s tilt, while the Sun’s positionappears to move east-west due to Earth’s elliptical orbit. Remember that this is the motion of the Sun’s positionfrom day-to-day if you were to look at it from the same position at the same time. It is not observable over thecourse of a single day.
31
3 Observations
There are three neat options for tracking apparent motion with either the Sun or Moon. You must completeEITHER the sunrise/sunset or moonrise/moonset. You will be responsible for repeatedly photographing therising or setting of the Sun or Moon for an entire month. You will need to make your observations three times aweek, leaving you with a total of twelve observations. Try to space out your observations to best see the differencesin timings of rise/set due to the apparent motion of the Sun or Moon.
To observe the Sun via sunrise/sunset:
1. Find a location that you can return to easily and have a view of the horizon. It doesn’t have to be absolutelyclear– there can be some obstacles in the way– but avoid a heavily obstructed view.
2. Note the time of sunrise or sunset (in hours:minutes) during each observation.
3. Take a picture with consistent orientation. That is, try to take the picture in the same place, from the sameheight, and facing the same direction.
4. Make any notes of observing conditions that you think are worthy of mention. (E.g. if it is particularly hazy,how does that change what the Sun looks like in your observations?)
To observe the Moon via moonrise/moonset:
1. Find a location that you can return to easily and have a view of the horizon. It doesn’t have to be absolutelyclear– there can be some obstacles in the way– but avoid a heavily obstructed view.
2. Note the time of moonrise or moonset (in hours:minutes) during each observation. Also note the Moon’s phase.
3. Take a picture with consistent orientation. That is, try to take the picture in the same place, from the sameheight, and facing the same direction.
4. Make any notes of observing conditions that you think are worthy of mention. (E.g. cloudy, apparent Mooncolor?)
3.1 Activity Questions
In your lab report, you must also include answers to the following questions:
1. Explain why the stars, Moon, and Sun appear to move to the west when we look up at the sky. Consideringonly the effects of rotation, what direction would the Sun and stars appear to move if we were observing fromthe surface of Venus?
2. Imagine you have crash-landed on a habitable alien planet. Before crashing, you were observing this planetand determined that it has an orbital tilt of 17◦, rotates towards the east, and orbits in the same direction asit rotates. To help you decide what kind of shelter to build and whether or not to start gathering food supplieswhile you wait for rescue, you want to know what season it is. Luckily, your indestructible watch survived thecrash with you! How could you determine this?
32
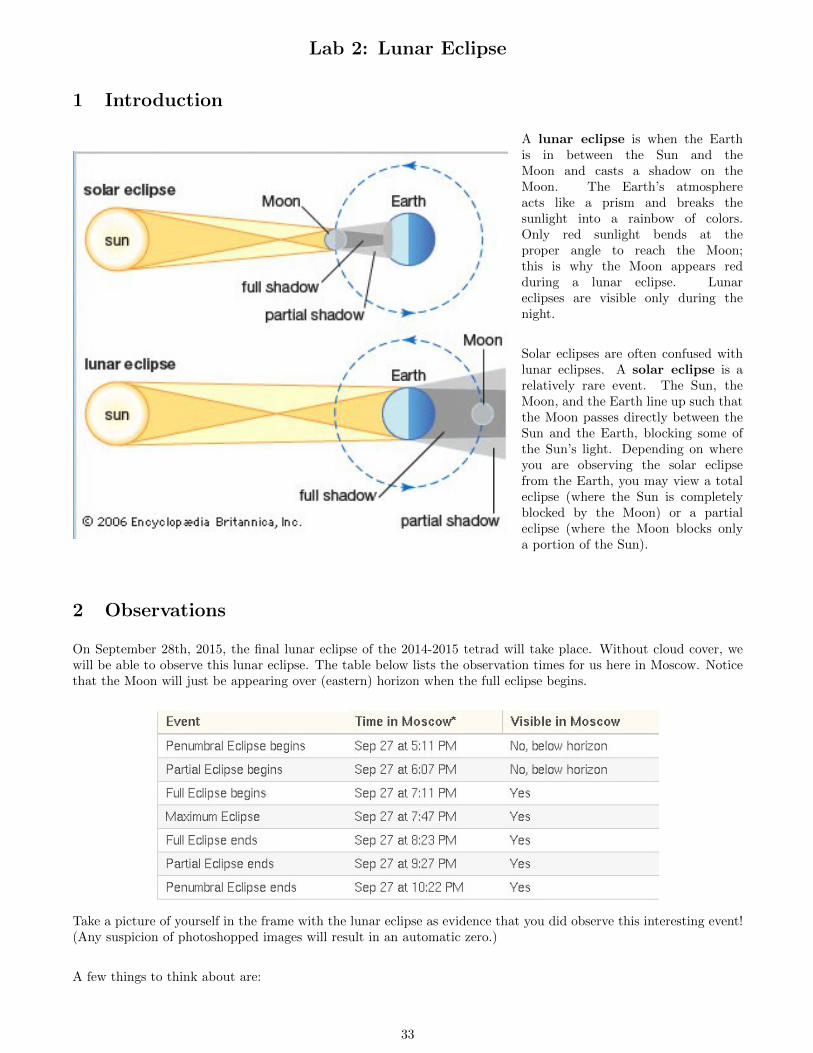
Lab 2: Lunar Eclipse
1 Introduction
A lunar eclipse is when the Earthis in between the Sun and theMoon and casts a shadow on theMoon. The Earth’s atmosphereacts like a prism and breaks thesunlight into a rainbow of colors.Only red sunlight bends at theproper angle to reach the Moon;this is why the Moon appears redduring a lunar eclipse. Lunareclipses are visible only during thenight.
Solar eclipses are often confused withlunar eclipses. A solar eclipse is arelatively rare event. The Sun, theMoon, and the Earth line up such thatthe Moon passes directly between theSun and the Earth, blocking some ofthe Sun’s light. Depending on whereyou are observing the solar eclipsefrom the Earth, you may view a totaleclipse (where the Sun is completelyblocked by the Moon) or a partialeclipse (where the Moon blocks onlya portion of the Sun).
2 Observations
On September 28th, 2015, the final lunar eclipse of the 2014-2015 tetrad will take place. Without cloud cover, wewill be able to observe this lunar eclipse. The table below lists the observation times for us here in Moscow. Noticethat the Moon will just be appearing over (eastern) horizon when the full eclipse begins.
Take a picture of yourself in the frame with the lunar eclipse as evidence that you did observe this interesting event!(Any suspicion of photoshopped images will result in an automatic zero.)
A few things to think about are:
33
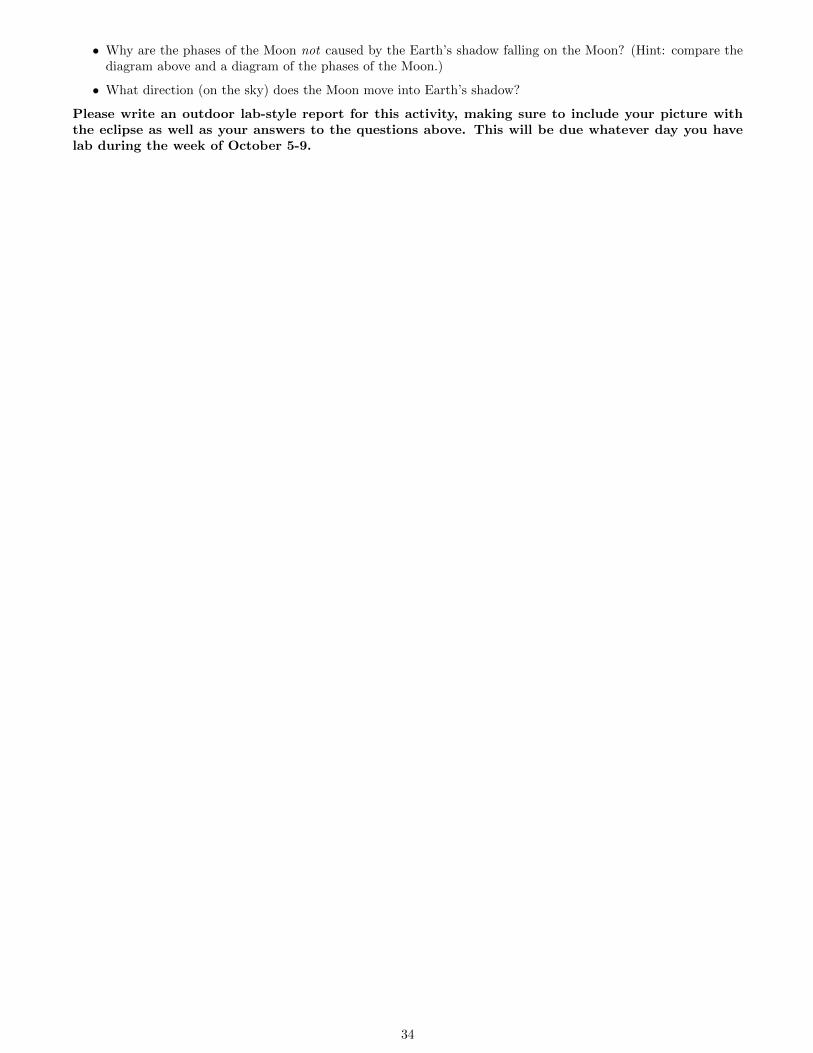
• Why are the phases of the Moon not caused by the Earth’s shadow falling on the Moon? (Hint: compare thediagram above and a diagram of the phases of the Moon.)
• What direction (on the sky) does the Moon move into Earth’s shadow?
Please write an outdoor lab-style report for this activity, making sure to include your picture withthe eclipse as well as your answers to the questions above. This will be due whatever day you havelab during the week of October 5-9.
34
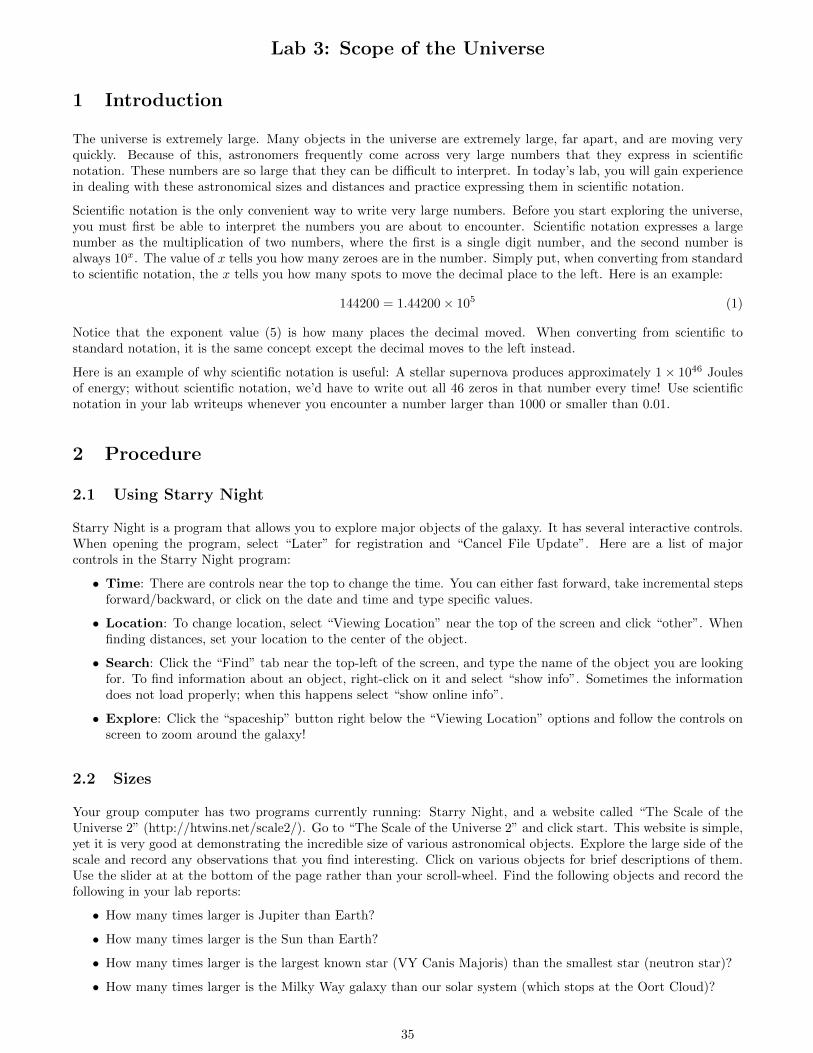
Lab 3: Scope of the Universe
1 Introduction
The universe is extremely large. Many objects in the universe are extremely large, far apart, and are moving veryquickly. Because of this, astronomers frequently come across very large numbers that they express in scientificnotation. These numbers are so large that they can be difficult to interpret. In today’s lab, you will gain experiencein dealing with these astronomical sizes and distances and practice expressing them in scientific notation.
Scientific notation is the only convenient way to write very large numbers. Before you start exploring the universe,you must first be able to interpret the numbers you are about to encounter. Scientific notation expresses a largenumber as the multiplication of two numbers, where the first is a single digit number, and the second number isalways 10x. The value of x tells you how many zeroes are in the number. Simply put, when converting from standardto scientific notation, the x tells you how many spots to move the decimal place to the left. Here is an example:
144200 = 1.44200× 10⁵ (1)
Notice that the exponent value (5) is how many places the decimal moved. When converting from scientific tostandard notation, it is the same concept except the decimal moves to the left instead.
Here is an example of why scientific notation is useful: A stellar supernova produces approximately 1× 1046 Joulesof energy; without scientific notation, we’d have to write out all 46 zeros in that number every time! Use scientificnotation in your lab writeups whenever you encounter a number larger than 1000 or smaller than 0.01.
2 Procedure
2.1 Using Starry Night
Starry Night is a program that allows you to explore major objects of the galaxy. It has several interactive controls.When opening the program, select “Later” for registration and “Cancel File Update”. Here are a list of majorcontrols in the Starry Night program:
• Time: There are controls near the top to change the time. You can either fast forward, take incremental stepsforward/backward, or click on the date and time and type specific values.
• Location: To change location, select “Viewing Location” near the top of the screen and click “other”. Whenfinding distances, set your location to the center of the object.
• Search: Click the “Find” tab near the top-left of the screen, and type the name of the object you are lookingfor. To find information about an object, right-click on it and select “show info”. Sometimes the informationdoes not load properly; when this happens select “show online info”.
• Explore: Click the “spaceship” button right below the “Viewing Location” options and follow the controls onscreen to zoom around the galaxy!
2.2 Sizes
Your group computer has two programs currently running: Starry Night, and a website called “The Scale of theUniverse 2” (http://htwins.net/scale2/). Go to “The Scale of the Universe 2” and click start. This website is simple,yet it is very good at demonstrating the incredible size of various astronomical objects. Explore the large side of thescale and record any observations that you find interesting. Click on various objects for brief descriptions of them.Use the slider at at the bottom of the page rather than your scroll-wheel. Find the following objects and record thefollowing in your lab reports:
• How many times larger is Jupiter than Earth?
• How many times larger is the Sun than Earth?
• How many times larger is the largest known star (VY Canis Majoris) than the smallest star (neutron star)?
• How many times larger is the Milky Way galaxy than our solar system (which stops at the Oort Cloud)?
35
• If the Sun were replaced by the star Deneb, what would happen to Earth?
2.3 Distances
You have just seen how large objects in the night sky can be. However, they still look like tiny points to us becausethey are so incredibly far away. Use the Starry Night and Scale of the Universe programs to explore astronomicaldistances. Make observations as you explore, and look up the following:
• How many kilometers away is the nearest star, Proxima Centauri? (1 light-year (ly) = 9.46× 10¹² km)
• How far away is the brightest star in the sky, Sirius, in ly?
• How far away is the nearest spiral galaxy, Andromeda?
• How many times farther away is Mars than the Moon? (1 AU = 1.5× 10⁸ km)
• How many times further is it from the sun to Proxima Centauri than it is to the edge of our solar system (OortCloud)?
2.4 Speeds
Objects in space often move extremely quickly relative to Earth. For example, “shooting stars” are meteors zoomingby the Earth at super high speeds. Explore how quickly objects in space move, and also explore the speeds neededto travel great distances in space.
• Find Saturn and record its distance from Earth. Skip three days ahead, and record the new distance betweenSaturn and Earth. How fast is Saturn moving toward/away from the Earth right now? Record your answer inm/s. (Hint: speed = distance/time)
• Click the “spaceship” button right below the “Viewing Location” options. You should now be in space directlyabove Earth. Accelerate your spaceship until you can notice it moving significantly relative to Earth. How fastare you going? For reference, 1 m/s = 2.2 mph.
• Fly around the galaxy at various speeds and make observations of things you notice. Include in your observationshow fast you are going. What happens when you fly for very long at several thousand light-years per second?
2.5 Perception
For this last part, you will explore how the galaxy changes with time, and how our view of it changes with distance.Go to “view” and turn on the outlines of astronomical constellations. Make observations on how the constellationschange from the various locations and times:
• The surface of Jupiter.
• 1 light-year away in any direction.
• 100 light-years away in any direction.
• 104 light-years away in any direction.
• From the surface of Earth in the year 3× 10³ (3000).
• From the surface of Earth in the year 5× 10⁴ (50000).
36
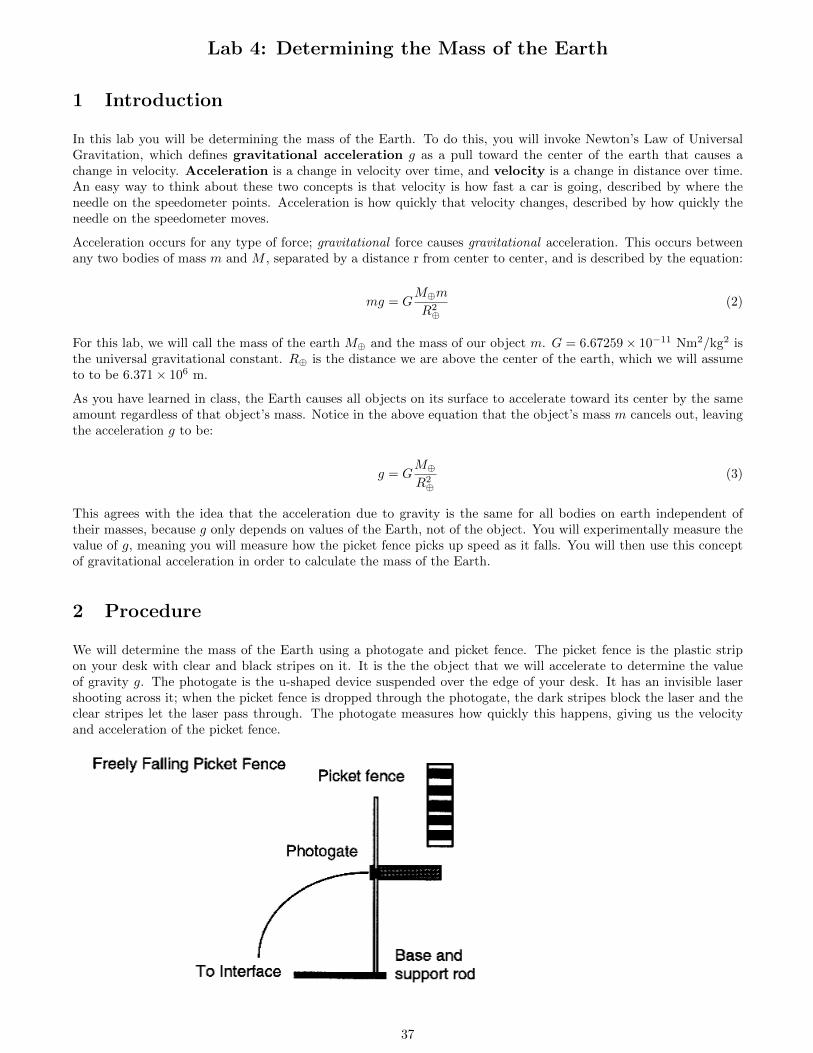
Lab 4: Determining the Mass of the Earth
1 Introduction
In this lab you will be determining the mass of the Earth. To do this, you will invoke Newton’s Law of UniversalGravitation, which defines gravitational acceleration g as a pull toward the center of the earth that causes achange in velocity. Acceleration is a change in velocity over time, and velocity is a change in distance over time.An easy way to think about these two concepts is that velocity is how fast a car is going, described by where theneedle on the speedometer points. Acceleration is how quickly that velocity changes, described by how quickly theneedle on the speedometer moves.
Acceleration occurs for any type of force; gravitational force causes gravitational acceleration. This occurs betweenany two bodies of mass m and M , separated by a distance r from center to center, and is described by the equation:
mg = GM⊕m
R2⊕
(2)
For this lab, we will call the mass of the earth M⊕ and the mass of our object m. G = 6.67259× 10⁻¹¹ Nm2/kg2 isthe universal gravitational constant. R⊕ is the distance we are above the center of the earth, which we will assumeto to be 6.371× 10⁶ m.
As you have learned in class, the Earth causes all objects on its surface to accelerate toward its center by the sameamount regardless of that object’s mass. Notice in the above equation that the object’s mass m cancels out, leavingthe acceleration g to be:
g = GM⊕
R2⊕
(3)
This agrees with the idea that the acceleration due to gravity is the same for all bodies on earth independent oftheir masses, because g only depends on values of the Earth, not of the object. You will experimentally measure thevalue of g, meaning you will measure how the picket fence picks up speed as it falls. You will then use this conceptof gravitational acceleration in order to calculate the mass of the Earth.
2 Procedure
We will determine the mass of the Earth using a photogate and picket fence. The picket fence is the plastic stripon your desk with clear and black stripes on it. It is the the object that we will accelerate to determine the valueof gravity g. The photogate is the u-shaped device suspended over the edge of your desk. It has an invisible lasershooting across it; when the picket fence is dropped through the photogate, the dark stripes block the laser and theclear stripes let the laser pass through. The photogate measures how quickly this happens, giving us the velocityand acceleration of the picket fence.
37
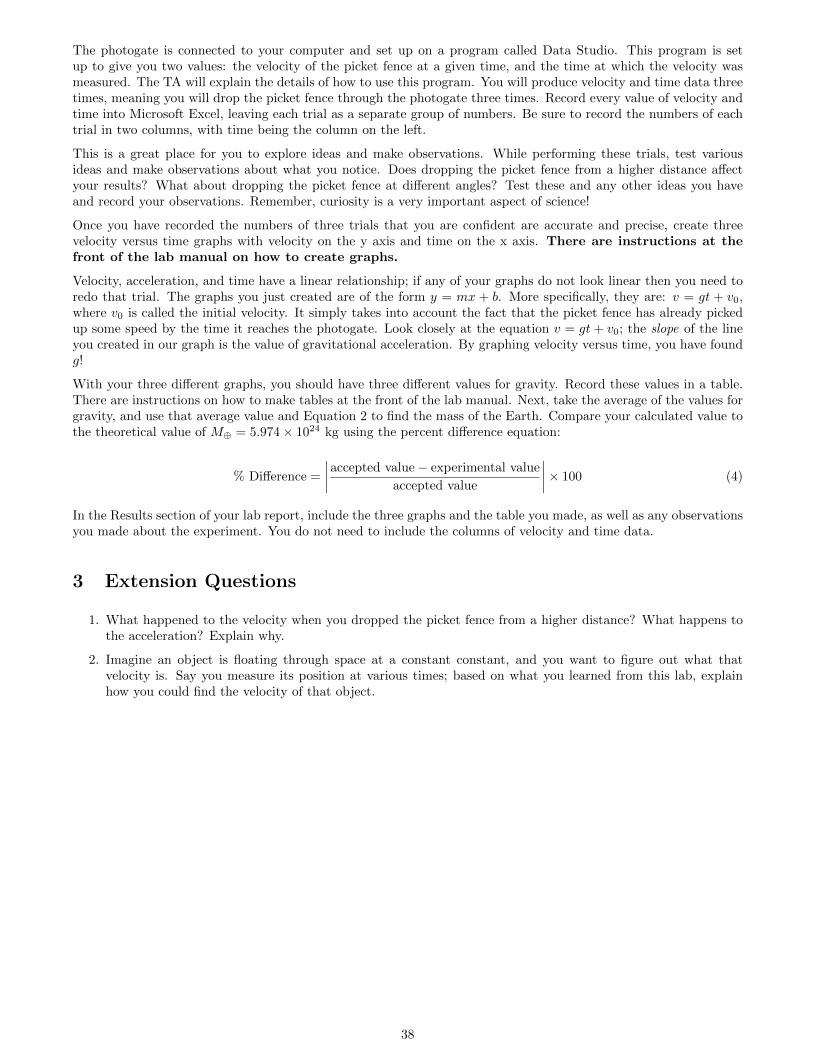
The photogate is connected to your computer and set up on a program called Data Studio. This program is setup to give you two values: the velocity of the picket fence at a given time, and the time at which the velocity wasmeasured. The TA will explain the details of how to use this program. You will produce velocity and time data threetimes, meaning you will drop the picket fence through the photogate three times. Record every value of velocity andtime into Microsoft Excel, leaving each trial as a separate group of numbers. Be sure to record the numbers of eachtrial in two columns, with time being the column on the left.
This is a great place for you to explore ideas and make observations. While performing these trials, test variousideas and make observations about what you notice. Does dropping the picket fence from a higher distance affectyour results? What about dropping the picket fence at different angles? Test these and any other ideas you haveand record your observations. Remember, curiosity is a very important aspect of science!
Once you have recorded the numbers of three trials that you are confident are accurate and precise, create threevelocity versus time graphs with velocity on the y axis and time on the x axis. There are instructions at thefront of the lab manual on how to create graphs.
Velocity, acceleration, and time have a linear relationship; if any of your graphs do not look linear then you need toredo that trial. The graphs you just created are of the form y = mx + b. More specifically, they are: v = gt + v0,where v0 is called the initial velocity. It simply takes into account the fact that the picket fence has already pickedup some speed by the time it reaches the photogate. Look closely at the equation v = gt+ v0; the slope of the lineyou created in our graph is the value of gravitational acceleration. By graphing velocity versus time, you have foundg!
With your three different graphs, you should have three different values for gravity. Record these values in a table.There are instructions on how to make tables at the front of the lab manual. Next, take the average of the values forgravity, and use that average value and Equation 2 to find the mass of the Earth. Compare your calculated value tothe theoretical value of M⊕ = 5.974× 1024 kg using the percent difference equation:
% Difference =
∣∣∣∣accepted value− experimental value
accepted value
∣∣∣∣× 100 (4)
In the Results section of your lab report, include the three graphs and the table you made, as well as any observationsyou made about the experiment. You do not need to include the columns of velocity and time data.
3 Extension Questions
1. What happened to the velocity when you dropped the picket fence from a higher distance? What happens tothe acceleration? Explain why.
2. Imagine an object is floating through space at a constant constant, and you want to figure out what thatvelocity is. Say you measure its position at various times; based on what you learned from this lab, explainhow you could find the velocity of that object.
38
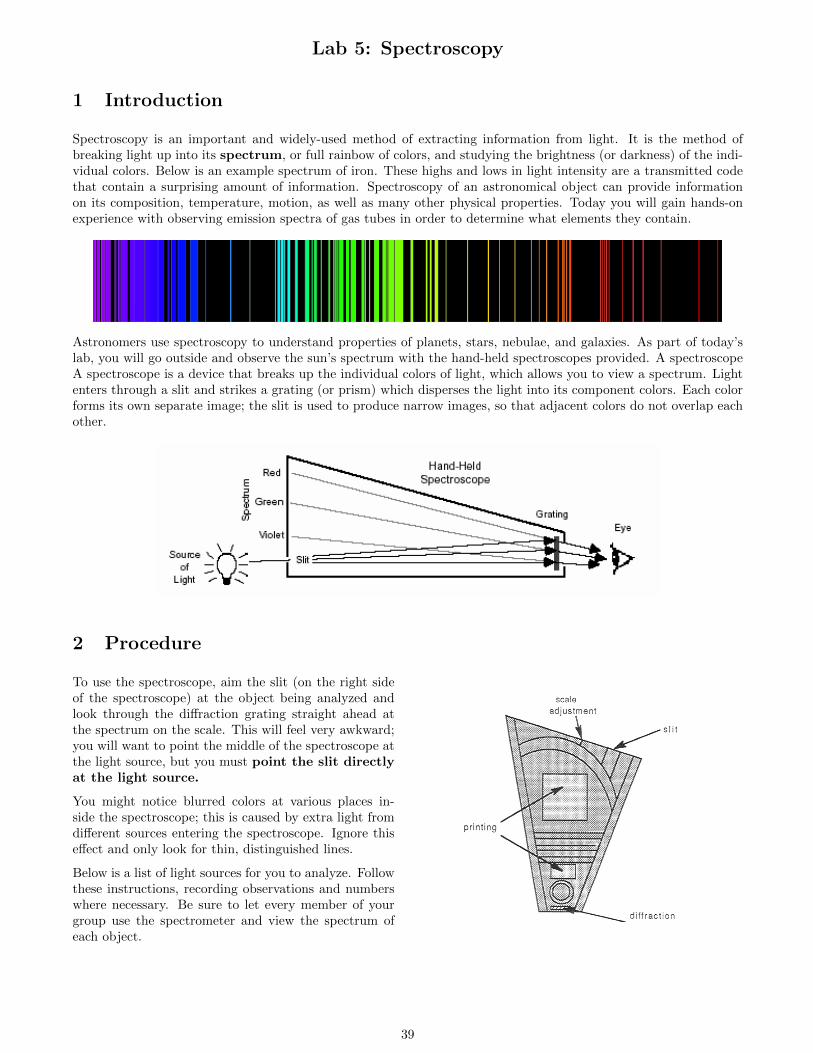
Lab 5: Spectroscopy
1 Introduction
Spectroscopy is an important and widely-used method of extracting information from light. It is the method ofbreaking light up into its spectrum, or full rainbow of colors, and studying the brightness (or darkness) of the indi-vidual colors. Below is an example spectrum of iron. These highs and lows in light intensity are a transmitted codethat contain a surprising amount of information. Spectroscopy of an astronomical object can provide informationon its composition, temperature, motion, as well as many other physical properties. Today you will gain hands-onexperience with observing emission spectra of gas tubes in order to determine what elements they contain.
Astronomers use spectroscopy to understand properties of planets, stars, nebulae, and galaxies. As part of today’slab, you will go outside and observe the sun’s spectrum with the hand-held spectroscopes provided. A spectroscopeA spectroscope is a device that breaks up the individual colors of light, which allows you to view a spectrum. Lightenters through a slit and strikes a grating (or prism) which disperses the light into its component colors. Each colorforms its own separate image; the slit is used to produce narrow images, so that adjacent colors do not overlap eachother.
2 Procedure
To use the spectroscope, aim the slit (on the right sideof the spectroscope) at the object being analyzed andlook through the diffraction grating straight ahead atthe spectrum on the scale. This will feel very awkward;you will want to point the middle of the spectroscope atthe light source, but you must point the slit directlyat the light source.
You might notice blurred colors at various places in-side the spectroscope; this is caused by extra light fromdifferent sources entering the spectroscope. Ignore thiseffect and only look for thin, distinguished lines.
Below is a list of light sources for you to analyze. Followthese instructions, recording observations and numberswhere necessary. Be sure to let every member of yourgroup use the spectrometer and view the spectrum ofeach object.
39
2.1 Calibration
1. First look at a white light source to calibrate your spectroscope. Point the slit directly at the incandescentlight bulb; you should see a full spectrum of color from violet to red. Adjust the diffraction grating so that thespectrum displays across the wavelength numbers when you look into to the spectroscope. Adjust the scale sothat the spectrum spans the wavelength values of about 370 nm− 720 nm.
2. Now look at a fluorescent light through the spectrometer. Read the positions of the bright lines on the scaleand record them in a table. Fluorescent lights contain mercury vapor, which produce a bright green line at546 nm. Identify this line, and adjust the spectrometer’s scale so that the green line is on exactly 546 nm, Ifthe scale moves during an experiment, recalibrate it by repeating this step.
2.2 Emission Lines of Different Gases
1. You will now observe the spectra of different gases by looking at the spectrum tubes at your desk. CAUTION:These spectrum tubes get extremely hot and are very fragile; when you want to change spectrumtubes, let them cool for 30 seconds and then call your TA over to have him/her change it foryou. Only have the spectrum tubes turned on when you are observing them.
2. Observe the three different known gases given to you; record the spectral lines you can see into a separate tablefor each gas. There is a spectral line chart at the front of the classroom you can use as a reference, or you canuse one of many online resources to check your work.
3. Now observe the spectrum of the unknown gas and record the spectral lines. Based on the lines you can see,determine what is inside the unknown gas tube. HINT: It is far more reasonable for your observed spectrumto be missing lines rather than for it to have lines that should not be there.
2.3 Absorption Lines of the Sun
The sun works similarly to an incandescent light bulb; it emit light in all colors of the visible spectrum, and shouldappear as a full rainbow of color. However, unlike the light bulb, the sun’s spectrum has thin dark lines in it. Theseare called absorption lines. These are the exact opposite concept of emission lines; rather than an element emittingvarious colors, the sun emits all colors except for various wavelengths that different elements prevent. By measuringthese absorption lines, we can determine what elements are in the sun’s atmosphere.
Measure and record the sun’s absorption lines. WARNING: Do not look directly at the sun. It can damageyour eyes. Instead point your spectroscope at a cloud or the moon, which are reflecting the sun’s light. Once youhave the absorption lines recorded, use the numbers listed on top of the spectrometer to determine the elements inthe sun’s atmosphere. There is also a helpful chart near the classroom door that you can reference.
3 Extension Questions
1. Spectroscopy is very good at determining the composition of an object; what are three situations in Astronomywhere knowing something’s composition would be useful?
40
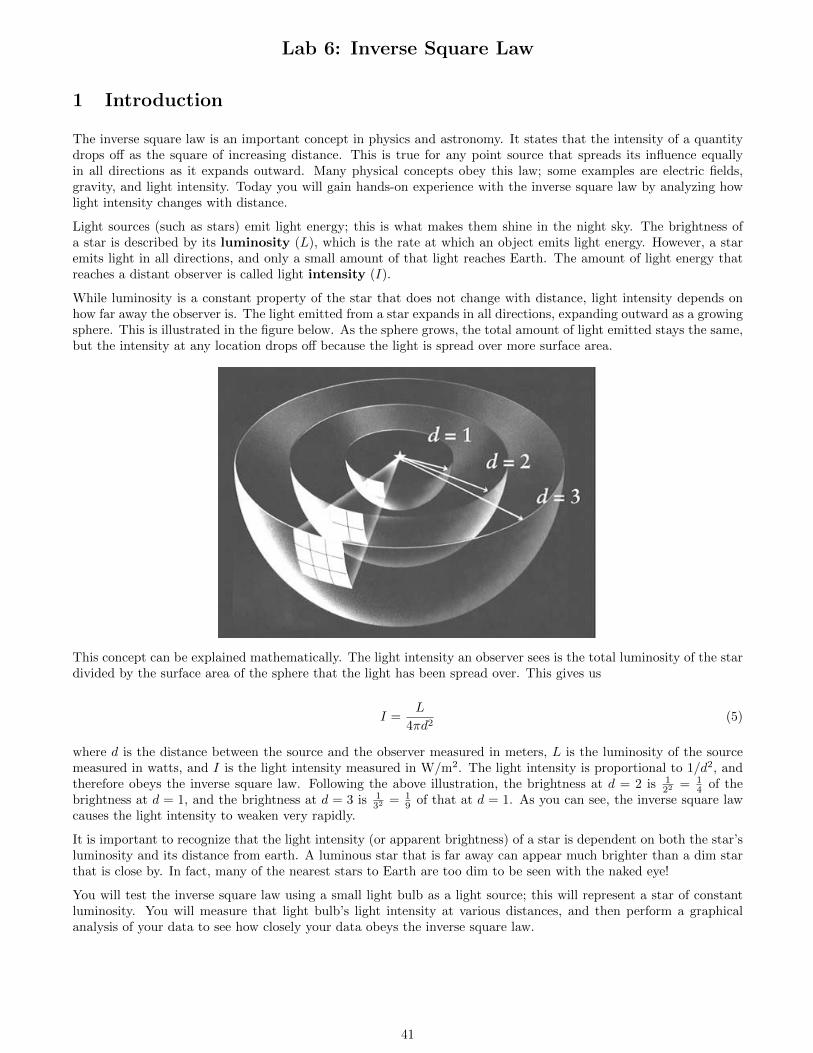
Lab 6: Inverse Square Law
1 Introduction
The inverse square law is an important concept in physics and astronomy. It states that the intensity of a quantitydrops off as the square of increasing distance. This is true for any point source that spreads its influence equallyin all directions as it expands outward. Many physical concepts obey this law; some examples are electric fields,gravity, and light intensity. Today you will gain hands-on experience with the inverse square law by analyzing howlight intensity changes with distance.
Light sources (such as stars) emit light energy; this is what makes them shine in the night sky. The brightness ofa star is described by its luminosity (L), which is the rate at which an object emits light energy. However, a staremits light in all directions, and only a small amount of that light reaches Earth. The amount of light energy thatreaches a distant observer is called light intensity (I).
While luminosity is a constant property of the star that does not change with distance, light intensity depends onhow far away the observer is. The light emitted from a star expands in all directions, expanding outward as a growingsphere. This is illustrated in the figure below. As the sphere grows, the total amount of light emitted stays the same,but the intensity at any location drops off because the light is spread over more surface area.
This concept can be explained mathematically. The light intensity an observer sees is the total luminosity of the stardivided by the surface area of the sphere that the light has been spread over. This gives us
I =L
4πd2(5)
where d is the distance between the source and the observer measured in meters, L is the luminosity of the sourcemeasured in watts, and I is the light intensity measured in W/m2. The light intensity is proportional to 1/d2, andtherefore obeys the inverse square law. Following the above illustration, the brightness at d = 2 is 1
22 = 14 of the
brightness at d = 1, and the brightness at d = 3 is 132 = 1
9 of that at d = 1. As you can see, the inverse square lawcauses the light intensity to weaken very rapidly.
It is important to recognize that the light intensity (or apparent brightness) of a star is dependent on both the star’sluminosity and its distance from earth. A luminous star that is far away can appear much brighter than a dim starthat is close by. In fact, many of the nearest stars to Earth are too dim to be seen with the naked eye!
You will test the inverse square law using a small light bulb as a light source; this will represent a star of constantluminosity. You will measure that light bulb’s light intensity at various distances, and then perform a graphicalanalysis of your data to see how closely your data obeys the inverse square law.
41
2 For TA’s: Setup
1. Plug the light sensor into analog channel A of the computer interface.
2. Open the DataStudio program.
3. Click “Create Experiment”.
4. Click on the yellow circle for Analog Channel A and select “Light Sensor”.
5. Make sure that the “Voltage” checkbox is selected.
6. At the bottom right of the DataStudio program, double-click “Table 1” and select “voltage” to open the Timevs. Voltage table. NOTE: It is important to explain to the students that the units are in volts rather thanWatts because those are the units of a computer signal. They will ultimately be making a loglog graph ofvoltage vs. time.
7. In the voltage vs. time table options, set up the table so that the average voltage displays at the bottom.
8. You can adjust the sample rate of the sensor in the Experiment Setup window; an appropriate sample rate istypically around 25 Hz.
9. In class, have the students calibrate the sensor by clicking the “Calibrate Sensor” button at the top of theexperiment setup window. Tell the students to make sure that 2-point calibration type is selected, and thenhave them click the two “read from sensor buttons”. This compensates for background light. NOTE: be sureto explain to students to not cast any shadows over the sensor at any time because this will ruin their data.
3 Procedure
On your desk is a track with a light sensor, and a light source. The light sensor is connected to your computer,which has your experiment on it. When the light sensor is collecting data, it will produce Voltage and Time data;the average voltage values represent the light intensity, and it is the data you will record into Microsoft Excel (alongwith distance, which is explained below). You do not need to save the time values.
Before you can begin your experiment, you must first calibrate your light sensor. This accounts for background lightin the room, and allows you to get better data on your light source. Your TA will explain in class how to do this.
With your light sensor calibrated, you can now begin taking data. Click “Start” to activate the light sensor, andclick “stop” when you have collected some data. Do this now as a trial run to make sure that the equipment isworking properly. Important: when you want to want to reset your data table to collect new data, clickthe menu option “data” and select “delete all data runs”. DO NOT CLICK THE RED X ON THEDATA TABLE.
The data that you need to collect today are the voltage of the sensor and the distance it is away from the lightsource. Place the light sensor and light source somewhere between 10 cm and 1 m apart, record this distance, andclick “start”. Let the light sensor take data for a few seconds, and then click “stop”. At the bottom of the table, theaverage voltage value is displayed; record the distance and voltage into Microsoft Excel.
This is the part of the experiment where you can test ideas and make observations. Aside from moving the sensorfarther and closer away, test other ideas that you think might affect the light intensity and make observations ofwhat you notice. When testing other ideas, collect data but do not record it as a trial. Use the data to makeobservation-based theories.
Record average voltage and distance measurements for a minimum of 8 different distances. To help make sure thata trial is successful, always point the sensor directly at the light source. Also, check individual voltage values andmake sure that none of them vary too much from the average. If any individual value varies significantly, you needto redo that trial. Ask your TA if you are not sure.
4 Analysis
When you are done collecting data, you should have a two column table in Excel with distance in the left columnand voltage in the right column. Follow the instructions near the front of your lab manual on how to make a graph
42
of voltage vs. distance. Make observations on trends you notice about your graph. NOTE: this is not a linear graph,so you do not need to add a best-fit line or best-fit equation.
You can further analyze your data by using the natural log, which is explained below. This is a difficult concept,but it is very powerful and useful. We are testing the idea of the inverse square law, where the exponent is −2. Youcan find the value of the exponent for your data by using the natural log and then compare it to the theoretical valueof −2 to see how accurate your experiment was.
Natural logs have a very useful property: they turn exponents into multiplication. Here’s an example of what thatmeans: say you start off with an expression x2. We can turn the exponent (2) into multiplication by taking thenatural log:
ln(x2) = 2 ln(x) (6)
The exponent inside of the natural log can be moved outside of the natural log as a multiplied factor! Now, let’s trythis with a simplified version of the equation we are dealing with: I ∝ d−2. Our exponent for this equation is −2 (itis negative because it is in the denominator). Let’s take the natural log of both sides:
ln(I) = −2 ln(d) + Constant (7)
Notice that this equation is in the form of y = mx + b. That means if you take the natural log of the averagevoltages and the natural log of the distances and create a graph of ln(V) vs. ln(d), then the slope of this line is theexponential value of your experiment!
Take the natural log of all your recorded voltage and distance values; you can either do individually by hand or youcan have Excel do it for you very quickly and easily (hint: doing it on Excel is much better). Record these values intotwo new columns on your Excel sheet, with ln(d) as the left column. Create a graph of these two new data columns.NOTE: natural logs do not have units, so your axis titles do not need any units. Create a best-fit line and best-fitequation for this graph; the slope value of your best fit equation is your exponent! Make observations of trends younotice in this graph.
Aside from observations and explanations you provide, your results section needs to include the original two columnsof data, the natural log data, and both graphs. Also, include one final table whose three columns are: experimentalslope value, theoretical slope value, and the percent difference between the two. None of these columns have units.
5 Extension Questions
1. Explain the slope value of your graph. Is it above or below −2, and what does this mean in terms of howquickly your light intensity dropped off?
2. If the exponent value in the inverse square law were a larger negative number, say, −3 instead of −2, whatwould this mean about the light intensity of an object?
3. The intensity of sunlight at the Earth is 1370 W/m2. Saturn’s average distance from the Sun is 10 Au - tentimes Earth’s distance. What is the light intensity at Saturn, both in W/m2 and as a percentage of the intensityof Earth? What implications does your answer have for sending a solar-panel-powered spacecraft to Saturn?
43
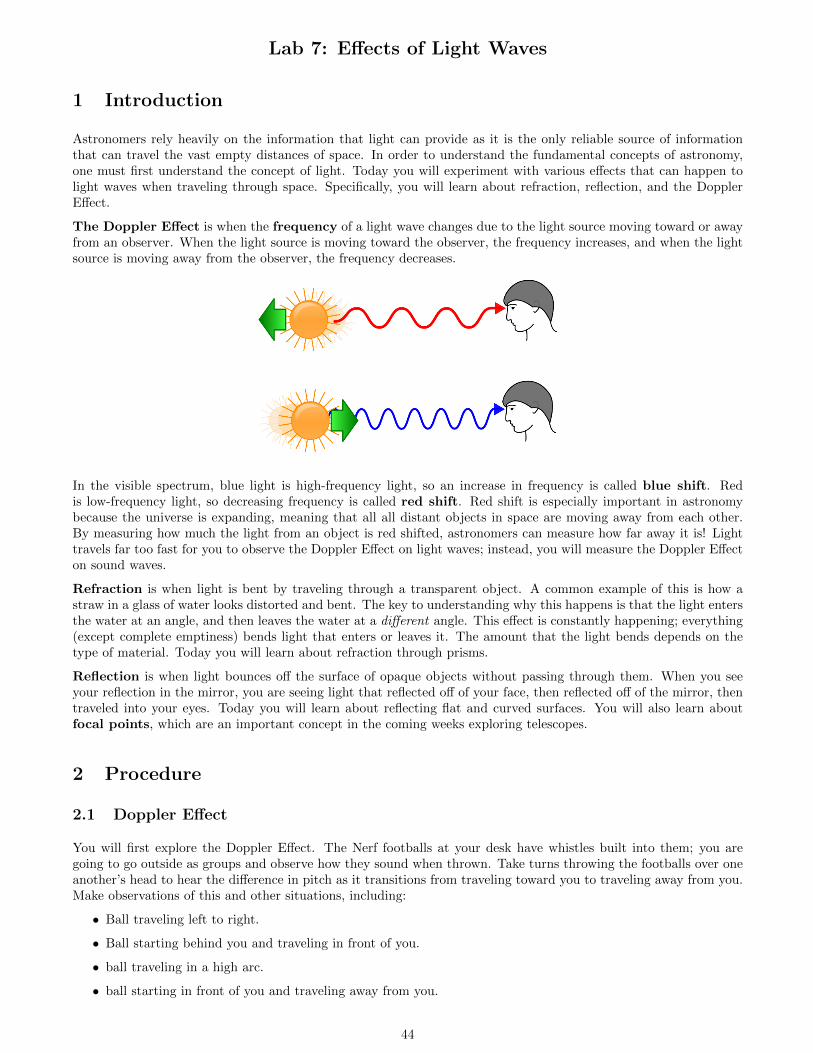
Lab 7: Effects of Light Waves
1 Introduction
Astronomers rely heavily on the information that light can provide as it is the only reliable source of informationthat can travel the vast empty distances of space. In order to understand the fundamental concepts of astronomy,one must first understand the concept of light. Today you will experiment with various effects that can happen tolight waves when traveling through space. Specifically, you will learn about refraction, reflection, and the DopplerEffect.
The Doppler Effect is when the frequency of a light wave changes due to the light source moving toward or awayfrom an observer. When the light source is moving toward the observer, the frequency increases, and when the lightsource is moving away from the observer, the frequency decreases.
In the visible spectrum, blue light is high-frequency light, so an increase in frequency is called blue shift. Redis low-frequency light, so decreasing frequency is called red shift. Red shift is especially important in astronomybecause the universe is expanding, meaning that all all distant objects in space are moving away from each other.By measuring how much the light from an object is red shifted, astronomers can measure how far away it is! Lighttravels far too fast for you to observe the Doppler Effect on light waves; instead, you will measure the Doppler Effecton sound waves.
Refraction is when light is bent by traveling through a transparent object. A common example of this is how astraw in a glass of water looks distorted and bent. The key to understanding why this happens is that the light entersthe water at an angle, and then leaves the water at a different angle. This effect is constantly happening; everything(except complete emptiness) bends light that enters or leaves it. The amount that the light bends depends on thetype of material. Today you will learn about refraction through prisms.
Reflection is when light bounces off the surface of opaque objects without passing through them. When you seeyour reflection in the mirror, you are seeing light that reflected off of your face, then reflected off of the mirror, thentraveled into your eyes. Today you will learn about reflecting flat and curved surfaces. You will also learn aboutfocal points, which are an important concept in the coming weeks exploring telescopes.
2 Procedure
2.1 Doppler Effect
You will first explore the Doppler Effect. The Nerf footballs at your desk have whistles built into them; you aregoing to go outside as groups and observe how they sound when thrown. Take turns throwing the footballs over oneanother’s head to hear the difference in pitch as it transitions from traveling toward you to traveling away from you.Make observations of this and other situations, including:
• Ball traveling left to right.
• Ball starting behind you and traveling in front of you.
• ball traveling in a high arc.
• ball starting in front of you and traveling away from you.
44
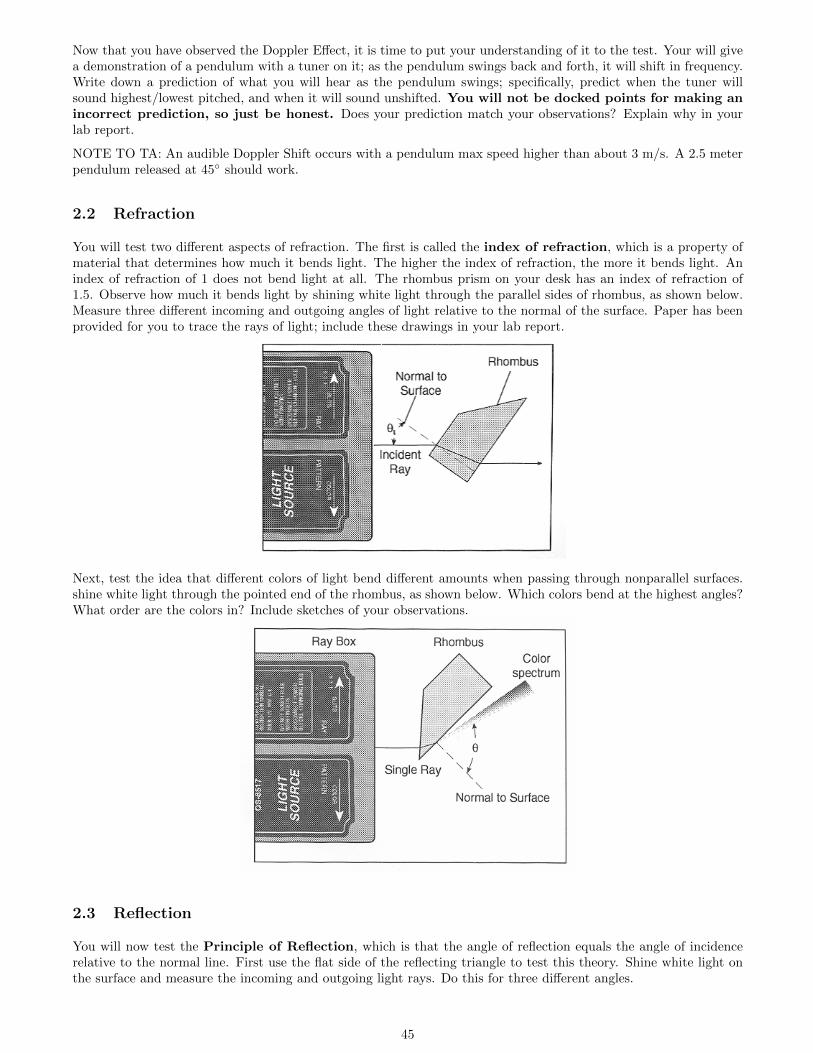
Now that you have observed the Doppler Effect, it is time to put your understanding of it to the test. Your will givea demonstration of a pendulum with a tuner on it; as the pendulum swings back and forth, it will shift in frequency.Write down a prediction of what you will hear as the pendulum swings; specifically, predict when the tuner willsound highest/lowest pitched, and when it will sound unshifted. You will not be docked points for making anincorrect prediction, so just be honest. Does your prediction match your observations? Explain why in yourlab report.
NOTE TO TA: An audible Doppler Shift occurs with a pendulum max speed higher than about 3 m/s. A 2.5 meterpendulum released at 45◦ should work.
2.2 Refraction
You will test two different aspects of refraction. The first is called the index of refraction, which is a property ofmaterial that determines how much it bends light. The higher the index of refraction, the more it bends light. Anindex of refraction of 1 does not bend light at all. The rhombus prism on your desk has an index of refraction of1.5. Observe how much it bends light by shining white light through the parallel sides of rhombus, as shown below.Measure three different incoming and outgoing angles of light relative to the normal of the surface. Paper has beenprovided for you to trace the rays of light; include these drawings in your lab report.
Next, test the idea that different colors of light bend different amounts when passing through nonparallel surfaces.shine white light through the pointed end of the rhombus, as shown below. Which colors bend at the highest angles?What order are the colors in? Include sketches of your observations.
2.3 Reflection
You will now test the Principle of Reflection, which is that the angle of reflection equals the angle of incidencerelative to the normal line. First use the flat side of the reflecting triangle to test this theory. Shine white light onthe surface and measure the incoming and outgoing light rays. Do this for three different angles.
45
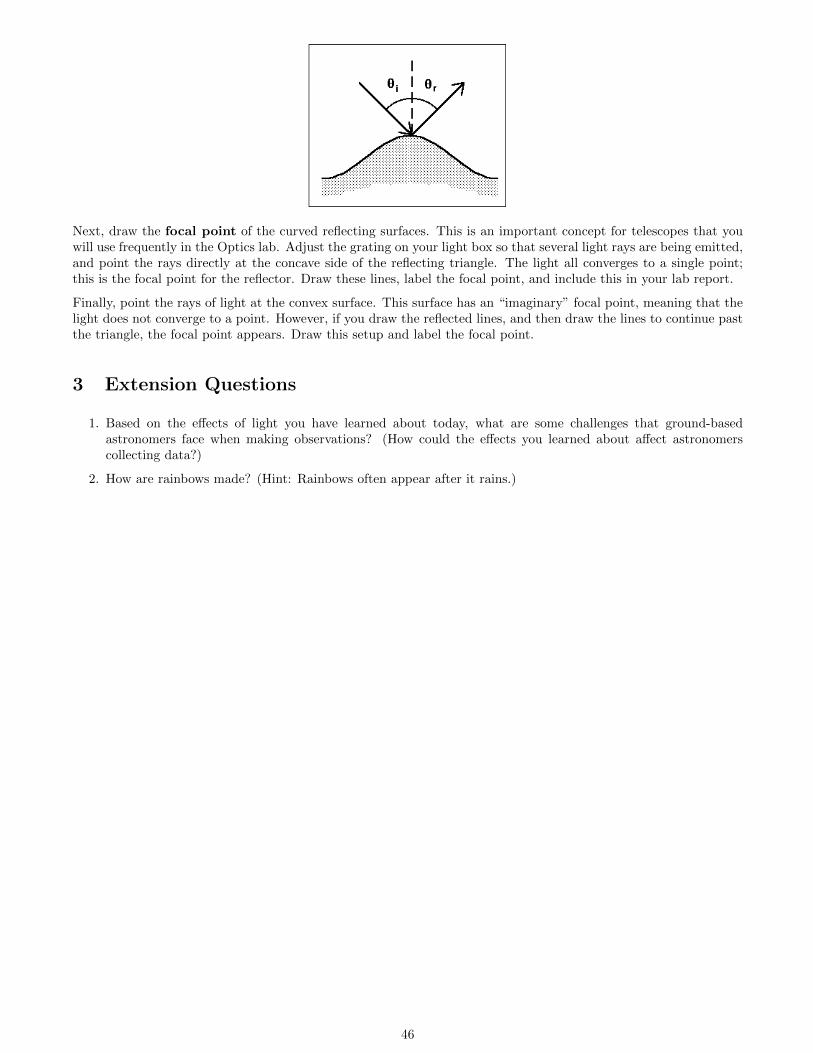
Next, draw the focal point of the curved reflecting surfaces. This is an important concept for telescopes that youwill use frequently in the Optics lab. Adjust the grating on your light box so that several light rays are being emitted,and point the rays directly at the concave side of the reflecting triangle. The light all converges to a single point;this is the focal point for the reflector. Draw these lines, label the focal point, and include this in your lab report.
Finally, point the rays of light at the convex surface. This surface has an “imaginary” focal point, meaning that thelight does not converge to a point. However, if you draw the reflected lines, and then draw the lines to continue pastthe triangle, the focal point appears. Draw this setup and label the focal point.
3 Extension Questions
1. Based on the effects of light you have learned about today, what are some challenges that ground-basedastronomers face when making observations? (How could the effects you learned about affect astronomerscollecting data?)
2. How are rainbows made? (Hint: Rainbows often appear after it rains.)
46
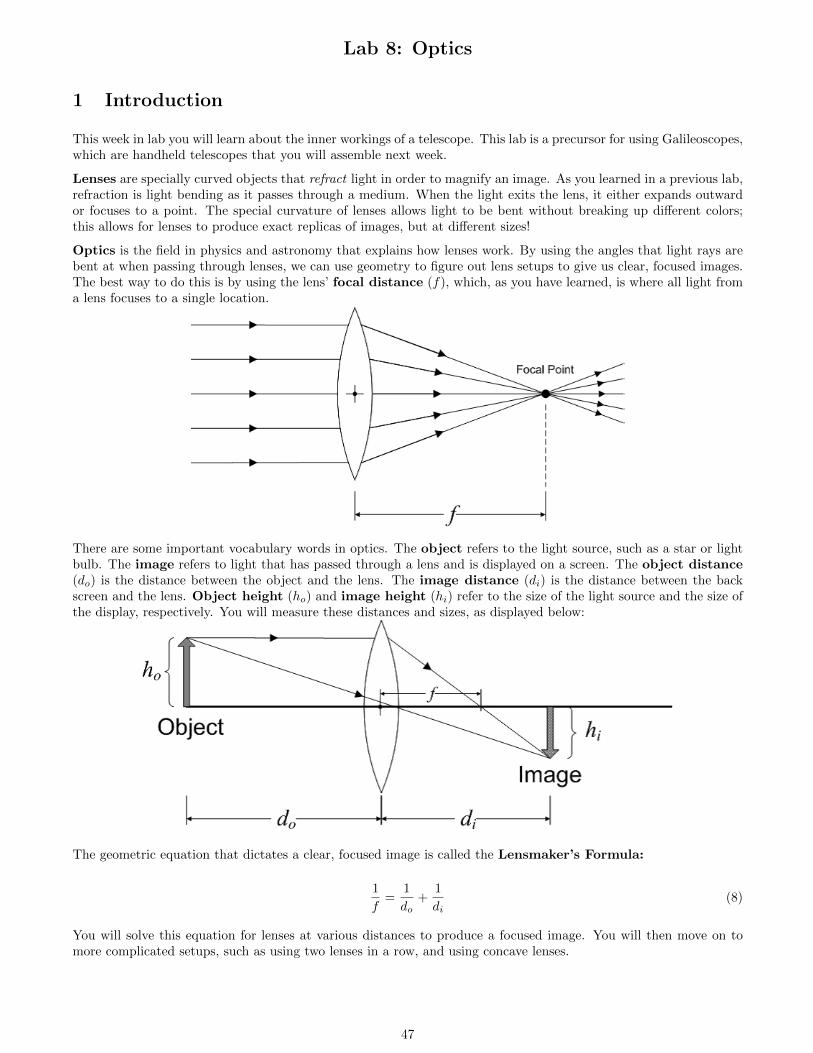
Lab 8: Optics
1 Introduction
This week in lab you will learn about the inner workings of a telescope. This lab is a precursor for using Galileoscopes,which are handheld telescopes that you will assemble next week.
Lenses are specially curved objects that refract light in order to magnify an image. As you learned in a previous lab,refraction is light bending as it passes through a medium. When the light exits the lens, it either expands outwardor focuses to a point. The special curvature of lenses allows light to be bent without breaking up different colors;this allows for lenses to produce exact replicas of images, but at different sizes!
Optics is the field in physics and astronomy that explains how lenses work. By using the angles that light rays arebent at when passing through lenses, we can use geometry to figure out lens setups to give us clear, focused images.The best way to do this is by using the lens’ focal distance (f), which, as you have learned, is where all light froma lens focuses to a single location.
There are some important vocabulary words in optics. The object refers to the light source, such as a star or lightbulb. The image refers to light that has passed through a lens and is displayed on a screen. The object distance(do) is the distance between the object and the lens. The image distance (di) is the distance between the backscreen and the lens. Object height (ho) and image height (hi) refer to the size of the light source and the size ofthe display, respectively. You will measure these distances and sizes, as displayed below:
The geometric equation that dictates a clear, focused image is called the Lensmaker’s Formula:
1
f=
1
do+
1
di(8)
You will solve this equation for lenses at various distances to produce a focused image. You will then move on tomore complicated setups, such as using two lenses in a row, and using concave lenses.
47
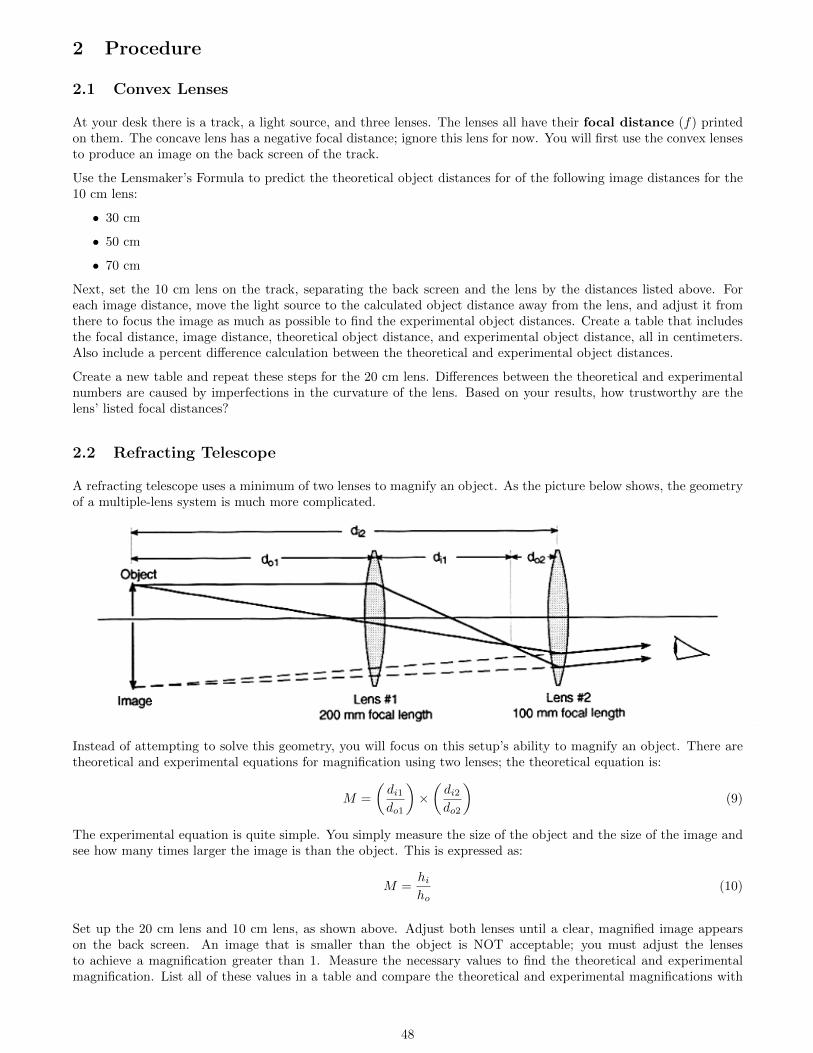
2 Procedure
2.1 Convex Lenses
At your desk there is a track, a light source, and three lenses. The lenses all have their focal distance (f) printedon them. The concave lens has a negative focal distance; ignore this lens for now. You will first use the convex lensesto produce an image on the back screen of the track.
Use the Lensmaker’s Formula to predict the theoretical object distances for of the following image distances for the10 cm lens:
• 30 cm
• 50 cm
• 70 cm
Next, set the 10 cm lens on the track, separating the back screen and the lens by the distances listed above. Foreach image distance, move the light source to the calculated object distance away from the lens, and adjust it fromthere to focus the image as much as possible to find the experimental object distances. Create a table that includesthe focal distance, image distance, theoretical object distance, and experimental object distance, all in centimeters.Also include a percent difference calculation between the theoretical and experimental object distances.
Create a new table and repeat these steps for the 20 cm lens. Differences between the theoretical and experimentalnumbers are caused by imperfections in the curvature of the lens. Based on your results, how trustworthy are thelens’ listed focal distances?
2.2 Refracting Telescope
A refracting telescope uses a minimum of two lenses to magnify an object. As the picture below shows, the geometryof a multiple-lens system is much more complicated.
Instead of attempting to solve this geometry, you will focus on this setup’s ability to magnify an object. There aretheoretical and experimental equations for magnification using two lenses; the theoretical equation is:
M =
(di1do1
)×
(di2do2
)(9)
The experimental equation is quite simple. You simply measure the size of the object and the size of the image andsee how many times larger the image is than the object. This is expressed as:
M =hiho
(10)
Set up the 20 cm lens and 10 cm lens, as shown above. Adjust both lenses until a clear, magnified image appearson the back screen. An image that is smaller than the object is NOT acceptable; you must adjust the lensesto achieve a magnification greater than 1. Measure the necessary values to find the theoretical and experimentalmagnification. List all of these values in a table and compare the theoretical and experimental magnifications with
48
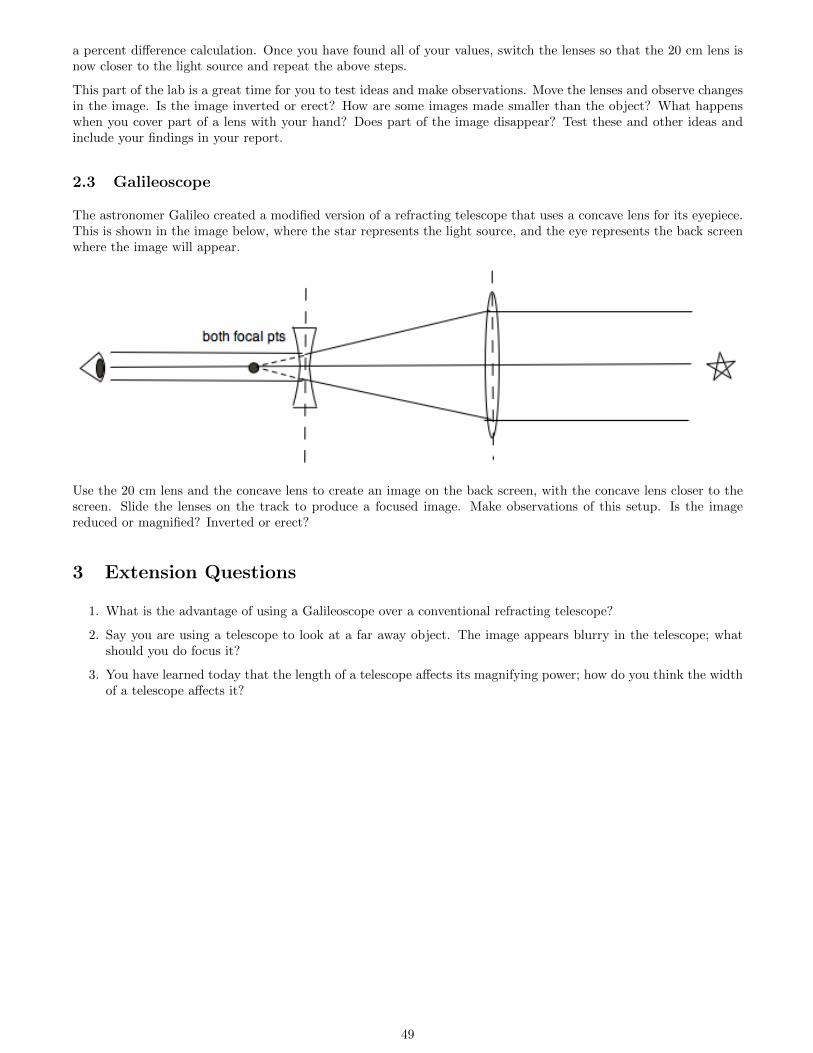
a percent difference calculation. Once you have found all of your values, switch the lenses so that the 20 cm lens isnow closer to the light source and repeat the above steps.
This part of the lab is a great time for you to test ideas and make observations. Move the lenses and observe changesin the image. Is the image inverted or erect? How are some images made smaller than the object? What happenswhen you cover part of a lens with your hand? Does part of the image disappear? Test these and other ideas andinclude your findings in your report.
2.3 Galileoscope
The astronomer Galileo created a modified version of a refracting telescope that uses a concave lens for its eyepiece.This is shown in the image below, where the star represents the light source, and the eye represents the back screenwhere the image will appear.
Use the 20 cm lens and the concave lens to create an image on the back screen, with the concave lens closer to thescreen. Slide the lenses on the track to produce a focused image. Make observations of this setup. Is the imagereduced or magnified? Inverted or erect?
3 Extension Questions
1. What is the advantage of using a Galileoscope over a conventional refracting telescope?
2. Say you are using a telescope to look at a far away object. The image appears blurry in the telescope; whatshould you do focus it?
3. You have learned today that the length of a telescope affects its magnifying power; how do you think the widthof a telescope affects it?
49
Lab 9: Refracting Telescopes
1 Introduction
Today you will learn to handle and use refracting telescopes. These are basic telescopes meant for amateur andbeginner astronomers. Professional astronomers exclusively use reflecting telescopes, which use combinations ofconcave and convex mirrors to produce magnified images. These telescopes are more complicated and more expensive,but they scale better in size - nobody wants to make a 3-meter lens! However, they are outside the scope of thisclass. You will instead use the straightforward refracting telescopes at your desk.
You have learned over the past two weeks that lenses can refract light to create focused images. These telescopesuse the same principle, and are specifically designed to collect and focus large amounts of light. You will use thesetelescopes today in class and during your mandatory night lab to amplify dim objects and gain experience withobservational astronomy.
2 Procedure
Today’s lab consists of three parts. The first part will be performed by your TA, who will give you a walkthrough ofthe basic components of the telescope, as well as proper usage of it. For the second part, you will examine the opticsof the telescope to learn how it produces images. For the third part of the lab, you will go outside and practice usingthe telescope.
2.1 Telescope Optics
The telescope at your desk is slightly disassembled. The back end of it has been removed. Remove the front cap ofthe telescope. Examine the inside of the optical tube and the other pieces on your desk. Do not touch the lenses.They will smudge and not work as well. Practice adjusting the optical tube by loosing the altitude lock knob. Besure to have every member of the group gain experience with the telescope.
When your TA shuts off the lights, point the front end of the optical tube at at bright surface (such as a cell phoneor computer screen). Hold a piece of paper behind the back end and get an image to appear on it. Record yourobservations of this and other things you notice about the telescope.
You will now learn how to assemble the back end of the telescope and change eyepieces. First place the back endin the optics tube and insert the three screws with the screwdriver on your desk. Make sure that the back end issecure. Test the focus knobs (the black knobs on the bottom of the back end); observe but do not touch the guidingteeth at the bottom of the chrome tube. These teeth are coated with oil, so be sure to not place your hand on themwhen using the telescope.
Ask your TA if you have any remaining questions about operating the telescope.
2.2 Viewing With the Telescope
Remove the accessory tray by removing the three wing screws attaching it to the the accessory tray bracket. Whenyour TA says it is time, collapse the legs of your telescope and follow him/her outside with the telescope, accessories,accessory tray, and the three wing screws.
Once outside, set your telescope back up and reattach the accessory tray. Adjust the tripod legs to an appropriateheight by turning the leg lock knobs at the middle of each leg. Make sure that the telescope is on stable ground andis well balanced.
Remove the plastic cap from the back end of the telescope and turn the two small thumbscrews counterclockwise toloosen them. insert the chrome end of the 25 mm eyepiece into the back end and tighten the two thumbscrews tohold it in place. Pick an object to view, and get a clear image of it by adjusting the focus knobs. Make observationsof what you see, and be sure to have every person in your group look through the telescope.
Remove the 25 mm eyepiece and replace it with the 90◦ Diagonal Mirror. Tighten the thumbscrews on the back endof the telescope to secure the mirror. The back end of the mirror should be pointing vertically upward. Remove theplastic cap from the mirror and insert the chrome end of the 25 mm eyepiece. Turn the thumbscrews on the mirror
50
to secure the eyepiece. Refocus the telescope get an image of the same object as before. Make observations of whatyou see. Now that your telescope is easier to use, practice focusing on several other objects as well. Do not lookat the sun.
Exchange the 25 mm eyepiece for the 10 mm eyepiece. What do you notice is different? Practice finding imagesusing this eyepiece. Try to get a focused image of the farthest thing you can see. What is the advantage of using the25 mm eyepiece? What is the advantage of using the 10 mm eyepiece? View the same object with both lenses andestimate the size difference using the two lenses.
51
Lab 10: Observing the Sun or MoonNow that you have some practice making observations, it’s time to continue making them on your own! Ratherthan answering questions for this lab, you will perform observations at home over the next four weeks. Your job isto stand in the same exact spot during sunset at least twice a week for the next four weeks and draw the sunset.Draw where in the horizon the sun is setting, as it will slowly change over the course of four weeks. Be sure toinclude reference objects in each drawing (such as a tree or building) to show where the sunset occurs in relation toit. Also draw where the moon is in the sky, if it is visible. Include dates and times on your drawings. It is ok totake pictures if you are willing to print them out. You can look up sunset times for Moscow each night online atmoonconnection.com/moon phases calendar.phtml.
Four weeks from now, you will turn in these pictures, as well as a typed summary of your observations. Include anexplanation as to why the time of sunset is changing and why the sun sets in in a different location each night. Thiswill be graded as an independent lab report.
52
Lab 11: Kerbal Space Program
1 Introduction
Today you will learn some basics about how NASA plans missions to other planets. You will learn about basic orbitalmechanics involved in space missions, as well as some basic rocket science. You will do this by playing the KerbalSpace Program video game on your group’s computer.
Kerbal Space Program may seem like a simple game, but it’s physics are remarkably sound. It simulates severalaspects of a space mission, including designing and building spacecraft, navigating space, and landing on otherplanets. Just like in real life, executing a successful mission in Kerbal Space Program can be very difficult andrequires careful planning. For the sake of time, many of these steps are already completed for you; you will focus onlaunching spacecraft, entering an orbit around a planet, and navigating space.
There are many vocabulary words one must be familiar with in order to understand orbital mechanics. Here is a listof the terms that are used in this lab manual:
• Apoapsis - The point at which an orbiting object is farthest away from the body it is orbiting.
• Periapsis - The point at which an orbiting object is closest to the body it is orbiting.
• Radial Velocity - The velocity that an object has that is directly toward or away from the object it is orbiting.
• Tangential Velocity - The velocity that an orbiting object has that is parallel to the object it is orbiting. Itis perpendicular to radial velocity.
• Semi-Major Axis - The longest radius of an ellipse.
• Eccentricity - A value between 0 and 1 that describes how elongated an ellipse is.
• Prograde - In the direction of motion (forward).
• Retrograde - Against the direction of motion (backwards).
• Sphere of Influence - The spherical space around a celestial body in which it has sole gravitational influenceon an object.
• Node - A spot in an orbit where a specific burn is executed.
Kerbal Space Program allows you to control your spaceship similarly to how astronauts control real spacecraft. Hereis a list of useful controls:
• Spacebar - Launches the spacecraft, begins next stage
• Right-Click, Scroll Wheel - Adjusts view of spacecraft
• W/S - Pitch adjustment
• A/D - Yaw adjustment
• Q/E - Roll adjustment
• Left Shift - Increase throttle
• Left Control - Decrease throttle
• X - Immediately shut off throttle
• R, T - Toggle flight stability
You will be given simple tasks to perform in Kerbal Space Program that demonstrate various ideas in orbitalmechanics. Perform these tasks, and include oberservations and hand-drawn diagrams into your lab reports.
53
2 Procedure
2.1 Launching a Spacecraft
Load the saved spacecraft “Astro1”. This should take you to a launchpad with a small rocket on it. With this youwill learn about various aspects of launching a spacecraft, including: stabilizing a flight, turning, landing back onKerbin, and entering orbit around Kerbin. While playing KSP, be sure to let everyone in your group get a chanceto pilot the spacecraft.
First, increase the throttle of your spacecraft to maximum by holding down the left shift button. The throttle gaugeis at the bottom of your screen. Try launching the spacecraft with the flight stability (R & T buttons) toggled off,and observe what happens. Reload the Astro1 and try launching again, but this time with the flight stability toggledon (hit “R” and “T” once before launch). Do you notice much of a difference? Do you think you would be able tosuccessfully pilot the craft on your own, or do you need the flight stability? From now on, always leave the flightstability on.
Next, try launching the spacecraft and going through its various stages of burning. Keep an eye on your fuel level atthe bottom left of your screen; as soon as your tank is empty, begin the next stage. Use the fast-forward button atthe top-left of your screen to save time once you run out of fuel. Once you reenter Kerbin’s atmosphere, execute thefinal stage of opening your parachute (again by pressing spacebar). How high did you get? (NOTE: if at any timeyour flight becomes disastrous, reload the Astro1 and try again).
Now you are going to try piloting your spacecraft into an orbit around Kerbin. This can be very difficult to do, soit may take several tries. The trick to entering a stable orbit is not to fly straight up, but sideways! Inother words, you need high tangential velocity rather than high radial velocity. Launch the spacecraft straight upinto the air, then at about 10,000 meters, gently adjust your yaw to turn your craft tangential to Kerbin’s surface.Continue burning through all of the stages. You should end up in a stable orbit around Kerbin! In the bottom-leftof the screen, there options such as staging, docking, and orbit map. Staging shows your spacecraft, and the orbitmap shows your path around Kerbin. Be sure to check the orbit map occasionally to see how you are doing!
2.2 Increasing/Decreasing Radius of Orbit
Load the “Astro2”. This is a presaved spacecraft in a low orbit around Kerbin. With this craft you will learn howto navigate space. Specifically, you will learn how to increase/decrease the semimajor axis and eccentricity of yourorbit.
Adjusting a spacecraft’s orbit is highly nonintuitive. You might THINK that in order to increase your semimajoraxis, you should burn your rocket in the radial direction, pushing it outward. However, this is not the case! As youwill see, adjusting your tangential velocity is far more effective than adjusting your radial velocity for moving yourspacecraft outward.
You will use four basic techniques for piloting your spacecraft. All of them occur at either apoapsis or periapsis.They are:
• Prograde burn at apoapsis - Increases your semimajor axis, decreases eccentricity.
• Retrograde burn at apoapsis - Decreases your semimajor axis, increases eccentricity.
• Prograde burn at periapsis - Increases your eccentricity.
• Retrograde burn at periapsis - Decreases your eccentricity.
These techniques may seem confusing when reading them. The best way to understand them is by trying them out!Here is a general plan of attack for moving farther away from orbit: start with a prograde periapsis burn. This willmake your orbit highly elliptical. Next, perform a prograde apoapsis burn. This will turn your ellispe back into acircle, but a much larger one than it was before. You are now in a larger orbit! Use the orbit map to watch yourorbit change. Apoapsis and periapsis are also displayed there.
To decrease your orbit, perform retrograde burns instead. First burn at apoapsis to elongate your orbit, then burnat periapsis to circularize it. Do this until your spacecraft falls back to Kerbin. If/when things go horribly wrong,reload the Astro2 and try again.
54
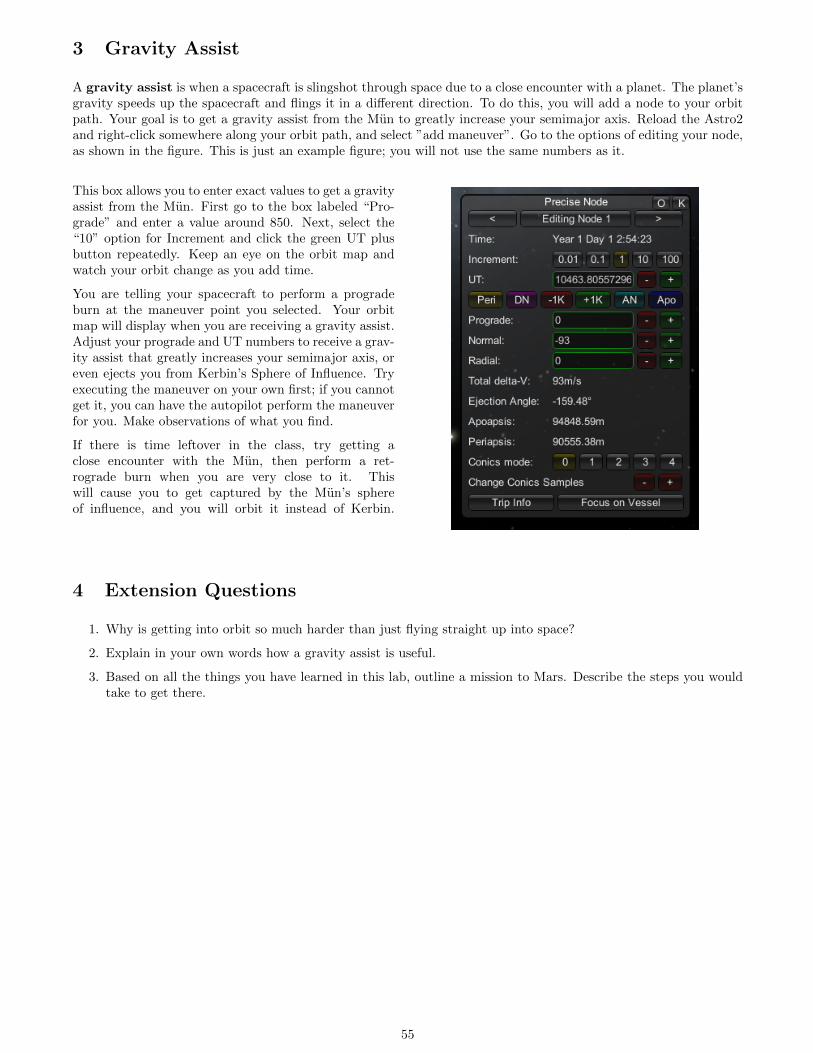
3 Gravity Assist
A gravity assist is when a spacecraft is slingshot through space due to a close encounter with a planet. The planet’sgravity speeds up the spacecraft and flings it in a different direction. To do this, you will add a node to your orbitpath. Your goal is to get a gravity assist from the Mun to greatly increase your semimajor axis. Reload the Astro2and right-click somewhere along your orbit path, and select ”add maneuver”. Go to the options of editing your node,as shown in the figure. This is just an example figure; you will not use the same numbers as it.
This box allows you to enter exact values to get a gravityassist from the Mun. First go to the box labeled “Pro-grade” and enter a value around 850. Next, select the“10” option for Increment and click the green UT plusbutton repeatedly. Keep an eye on the orbit map andwatch your orbit change as you add time.
You are telling your spacecraft to perform a progradeburn at the maneuver point you selected. Your orbitmap will display when you are receiving a gravity assist.Adjust your prograde and UT numbers to receive a grav-ity assist that greatly increases your semimajor axis, oreven ejects you from Kerbin’s Sphere of Influence. Tryexecuting the maneuver on your own first; if you cannotget it, you can have the autopilot perform the maneuverfor you. Make observations of what you find.
If there is time leftover in the class, try getting aclose encounter with the Mun, then perform a ret-rograde burn when you are very close to it. Thiswill cause you to get captured by the Mun’s sphereof influence, and you will orbit it instead of Kerbin.
4 Extension Questions
1. Why is getting into orbit so much harder than just flying straight up into space?
2. Explain in your own words how a gravity assist is useful.
3. Based on all the things you have learned in this lab, outline a mission to Mars. Describe the steps you wouldtake to get there.
55
Outdoor Activity Questions
1 Clusters
1. How can you tell the age of a cluster?
2. What is the difference between a globular cluster and an open cluster? Did your observations support thesedistinctions?
3. Why are clusters good tools for astronomers who want to study how stars evolve?
2 Constellations
4. Which constellation or asterism do you think is easiest to find in the night sky? Come up with a memory aidfor finding other objects near that one.
5. If we were visiting Pluto and looked up at the night sky, could we find the Big Dipper? What if we were visitinga planet in another solary system? Another galaxy? (Hint: think about the distances between us and the stars,then the distance between us and Pluto/exoplanet/exoplanet in another galaxy. How do those compare?)
3 Dwarf Planets
6. Make a case for why you think Pluto and the other dwarf planets should or should not be considered a “planet”.
7. How can Pluto and Eris “sometimes” have an atmosphere?
8. If you wanted to be a Dwarf Planet Hunter and find all the dwarf planets in the solar system, where would youlook? Could you do it with the telescopes we have here at UI?
4 Earth
9. Name some reasons why Earth is unique in our solar system.
10. Describe as many ways as you can think of how the night sky will be different thousands of years from now(think in terms of how everything changes, including the Earth itself).
11. High exposure to ultraviolet radiation can cause cancer. Why are we not dead?
12. Why are nights longer in the Northern hemisphere in the winter versus the summer?
13. Why does the Earth have so many fewer craters than the Moon?
14. Why do the planets and stars in the night sky constantly move while we watch them during the night?
15. When you look at stars with your naked eye, they seem to twinkle. Explain why this happens.
5 Exoplanets
16. Why can’t we observe an exoplanet in this class?
17. There are hundreds of billions of stars in our galaxy, and hundreds of billions of galaxies in the observableuniverse. Scientists currently expect more planets to exist in the universe than stars since each star with itsown solar system probably has more than one planet. What are the chances of life existing on another planet?(Hint: From the information given, calculate how many stars are in the universe. Then consider how manyplanets that means there must be more than.)
18. Why is outer space a better location than the ground for an exoplanet-detecting telescope? Provide multiplereasons.
56
6 Galaxies
19. How would you describe the Milky Way Galaxy to someone who has never heard of it before? Include details.
20. If we were to travel 4.5 billion years into the past (when the Earth first formed), would we be able to see moreor fewer galaxies with our telescopes? Would the galaxies be brighter or dimmer? Explain why.
21. How can you tell what galaxy each of the stars in our sky are in?
7 Jupiter
22. List some ways that Jupiter is different from Earth.
23. What are those colorful bands we see when observing Jupiter?
24. Compare the Great Red Spot, Jupiter’s famous storm, to one of Earth’s largest cyclones, Super Typhoon Tip(1979).
25. If you were to plan a science mission to this planet, what type of mission would it be? What would you wantto learn?
26. Why can’t we see the surface of Jupiter?
8 Mars
27. List some ways that Mars is different from Earth.
28. What are the white areas that we observe at the Martian poles? Would Galileo have observed them?
29. In the best of viewing conditions, we can sometimes make out that the region near Mars’ equator seems tobe dark. Early astronomers interpreted these to be areas covered by liquid or vegetation. Why are theseexplantions wrong? What are these dark areas in reality?
30. List two pieces of evidence that water once flowed on Mars.
31. If you were to plan a science mission to this planet, what type of mission would it be? What would you wantto learn?
32. Why is Mars red?
9 Mercury
33. List some ways that Mercury is different from Earth.
34. Explain how Mercury can simultaneously be thought of as really hot and really cold.
35. If you were to plan a science mission to this planet, what type of mission would it be? What would you wantto learn?
36. List some reasons why Mercury is difficult to observe.
10 Moon
37. Why does the Moon show phases in the course of a month?
38. Why can we sometimes observe the Moon in the daytime?
39. The ”dark side of the Moon” refers to the side of the Moon that we never see. Explain why this phrase ismisleading.
40. What phase must the Moon have for a solar eclipse to occur? What about a lunar eclipse? Draw Sun-Earth-Moon diagams for each scenario.
57
41. What can craters tell us about the age of the Moon?
42. Does the Moon have gravity?
11 Moons of Other Planets
43. Why are Titan and the Galilean moons so much easier to observe than other moons?
44. Which moons are bigger than Mercury (mean radius ∼ 2,440 km)? Why are they not planets themselves? Inother words, what distinguishes a moon from a planet?
45. Which of the four Galilean moons is brightest and why?
46. In your opinion, which moon would be best to visit if we want to search for life? Give at least two reasonswhy. (There is no “right” answer to this question, but your response can be “wrong” if you can’t defend youropinion!)
47. Why is Triton so bright?
12 Neptune
48. List some ways that Neptune is different from Earth.
49. If you were to plan a science mission to this planet, what type of mission would it be? What would you wantto learn?
50. It takes about 85 days for Neptune to travel across the sky the width of the Moon in the sky. Why does it takesuch a long time?
51. Why are the ice giants differnt colors from the gas giants?
13 Saturn
52. List some ways that Saturn is different from Earth.
53. All the other giant planets have rings. Give some reasons why it is so much easier to can we only see Saturn’srings with our telescopes?
54. If you were to plan a science mission to this planet, what type of mission would it be? What would you wantto learn?
55. On the best of viewing days we can make out bands on Saturn. What are these colorful bands?
56. Upon successfully completing this course, you take your friends out to view Saturn through a telescope onenight to show off your mad astronomy skills. Your friends are shocked to see this:
58
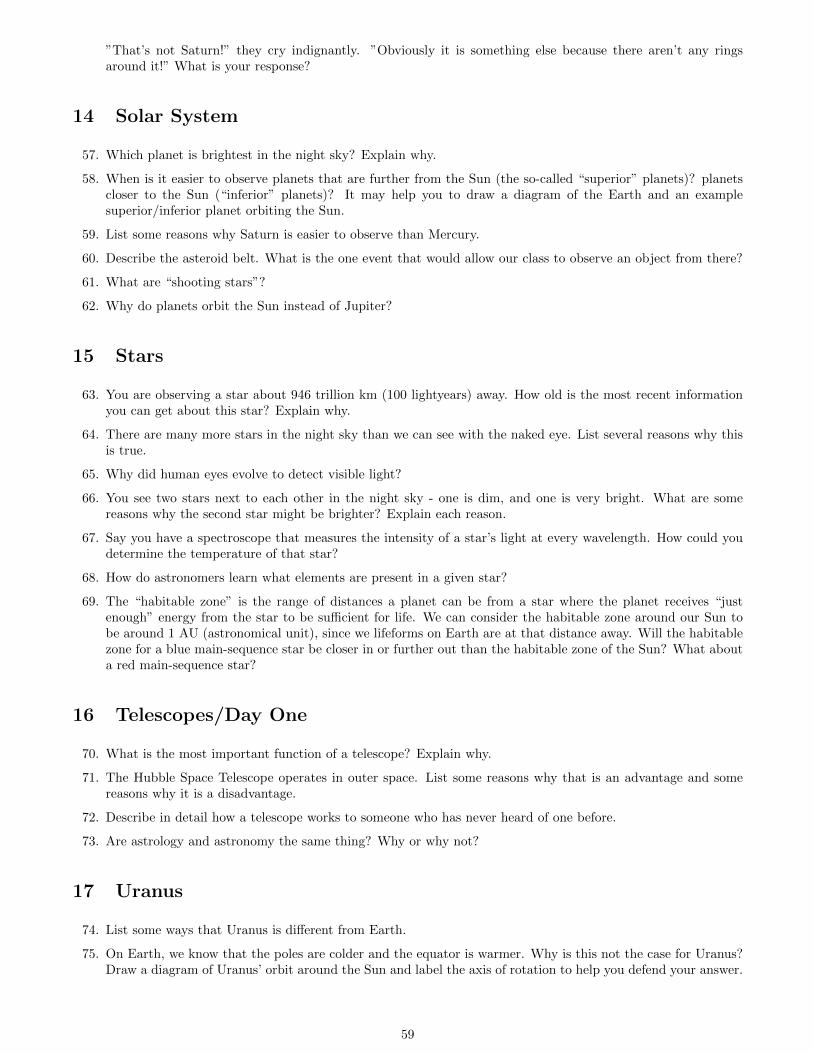
”That’s not Saturn!” they cry indignantly. ”Obviously it is something else because there aren’t any ringsaround it!” What is your response?
14 Solar System
57. Which planet is brightest in the night sky? Explain why.
58. When is it easier to observe planets that are further from the Sun (the so-called “superior” planets)? planetscloser to the Sun (“inferior” planets)? It may help you to draw a diagram of the Earth and an examplesuperior/inferior planet orbiting the Sun.
59. List some reasons why Saturn is easier to observe than Mercury.
60. Describe the asteroid belt. What is the one event that would allow our class to observe an object from there?
61. What are “shooting stars”?
62. Why do planets orbit the Sun instead of Jupiter?
15 Stars
63. You are observing a star about 946 trillion km (100 lightyears) away. How old is the most recent informationyou can get about this star? Explain why.
64. There are many more stars in the night sky than we can see with the naked eye. List several reasons why thisis true.
65. Why did human eyes evolve to detect visible light?
66. You see two stars next to each other in the night sky - one is dim, and one is very bright. What are somereasons why the second star might be brighter? Explain each reason.
67. Say you have a spectroscope that measures the intensity of a star’s light at every wavelength. How could youdetermine the temperature of that star?
68. How do astronomers learn what elements are present in a given star?
69. The “habitable zone” is the range of distances a planet can be from a star where the planet receives “justenough” energy from the star to be sufficient for life. We can consider the habitable zone around our Sun tobe around 1 AU (astronomical unit), since we lifeforms on Earth are at that distance away. Will the habitablezone for a blue main-sequence star be closer in or further out than the habitable zone of the Sun? What abouta red main-sequence star?
16 Telescopes/Day One
70. What is the most important function of a telescope? Explain why.
71. The Hubble Space Telescope operates in outer space. List some reasons why that is an advantage and somereasons why it is a disadvantage.
72. Describe in detail how a telescope works to someone who has never heard of one before.
73. Are astrology and astronomy the same thing? Why or why not?
17 Uranus
74. List some ways that Uranus is different from Earth.
75. On Earth, we know that the poles are colder and the equator is warmer. Why is this not the case for Uranus?Draw a diagram of Uranus’ orbit around the Sun and label the axis of rotation to help you defend your answer.
59
76. If you were to plan a science mission to this planet, what type of mission would it be? What would you wantto learn?
18 Venus
77. List some ways that Venus is different from Earth.
78. Venus is within the habitable zone of our solar system. List some reasons why humans couldn’t live on Venus(without technological aid, that is).
79. Venus is consistently bright when we observe it. Why is it so bright?
80. Why can’t we observe Venus’ surface with our telescopes?
81. Why do we observe Venus to have “phases” similar to what we see with the Moon? Why don’t Mars, Jupiter,or Saturn have phases?
82. If you were to plan a science mission to this planet, what type of mission would it be? What would you wantto learn?
60
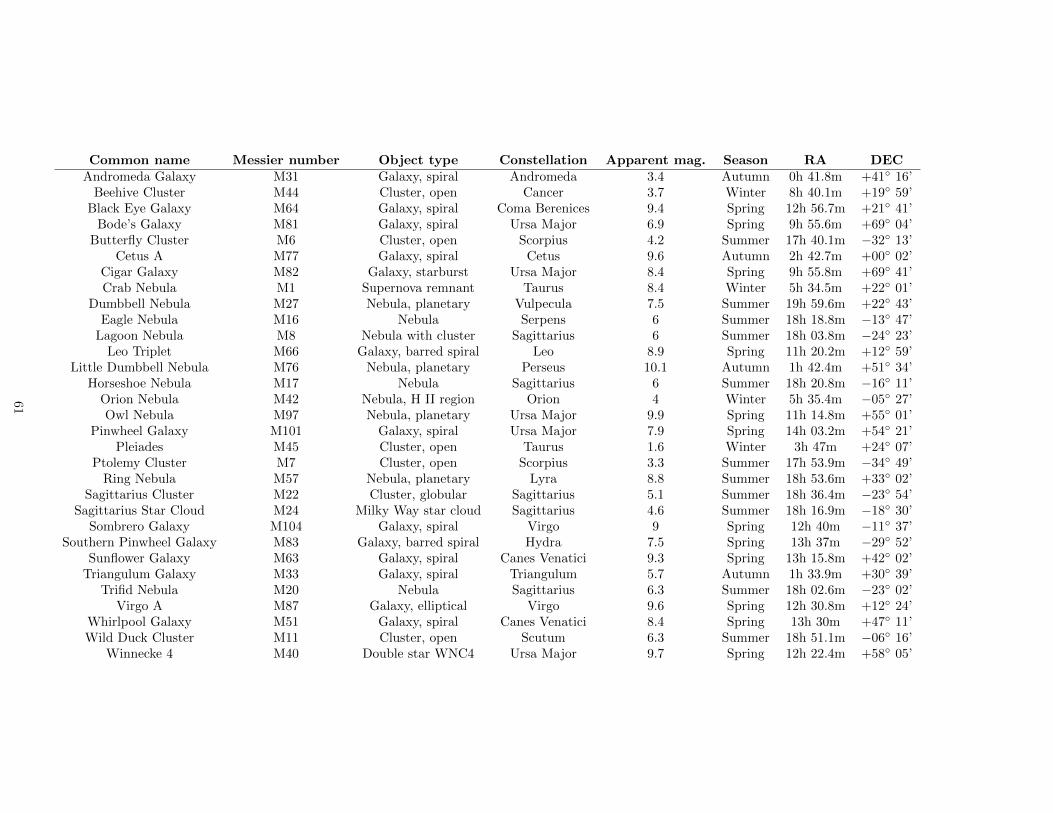
Common name Messier number Object type Constellation Apparent mag. Season RA DECAndromeda Galaxy M31 Galaxy, spiral Andromeda 3.4 Autumn 0h 41.8m +41◦ 16’
Beehive Cluster M44 Cluster, open Cancer 3.7 Winter 8h 40.1m +19◦ 59’Black Eye Galaxy M64 Galaxy, spiral Coma Berenices 9.4 Spring 12h 56.7m +21◦ 41’
Bode’s Galaxy M81 Galaxy, spiral Ursa Major 6.9 Spring 9h 55.6m +69◦ 04’Butterfly Cluster M6 Cluster, open Scorpius 4.2 Summer 17h 40.1m −32◦ 13’
Cetus A M77 Galaxy, spiral Cetus 9.6 Autumn 2h 42.7m +00◦ 02’Cigar Galaxy M82 Galaxy, starburst Ursa Major 8.4 Spring 9h 55.8m +69◦ 41’Crab Nebula M1 Supernova remnant Taurus 8.4 Winter 5h 34.5m +22◦ 01’
Dumbbell Nebula M27 Nebula, planetary Vulpecula 7.5 Summer 19h 59.6m +22◦ 43’Eagle Nebula M16 Nebula Serpens 6 Summer 18h 18.8m −13◦ 47’
Lagoon Nebula M8 Nebula with cluster Sagittarius 6 Summer 18h 03.8m −24◦ 23’Leo Triplet M66 Galaxy, barred spiral Leo 8.9 Spring 11h 20.2m +12◦ 59’
Little Dumbbell Nebula M76 Nebula, planetary Perseus 10.1 Autumn 1h 42.4m +51◦ 34’Horseshoe Nebula M17 Nebula Sagittarius 6 Summer 18h 20.8m −16◦ 11’
Orion Nebula M42 Nebula, H II region Orion 4 Winter 5h 35.4m −05◦ 27’Owl Nebula M97 Nebula, planetary Ursa Major 9.9 Spring 11h 14.8m +55◦ 01’
Pinwheel Galaxy M101 Galaxy, spiral Ursa Major 7.9 Spring 14h 03.2m +54◦ 21’Pleiades M45 Cluster, open Taurus 1.6 Winter 3h 47m +24◦ 07’
Ptolemy Cluster M7 Cluster, open Scorpius 3.3 Summer 17h 53.9m −34◦ 49’Ring Nebula M57 Nebula, planetary Lyra 8.8 Summer 18h 53.6m +33◦ 02’
Sagittarius Cluster M22 Cluster, globular Sagittarius 5.1 Summer 18h 36.4m −23◦ 54’Sagittarius Star Cloud M24 Milky Way star cloud Sagittarius 4.6 Summer 18h 16.9m −18◦ 30’
Sombrero Galaxy M104 Galaxy, spiral Virgo 9 Spring 12h 40m −11◦ 37’Southern Pinwheel Galaxy M83 Galaxy, barred spiral Hydra 7.5 Spring 13h 37m −29◦ 52’
Sunflower Galaxy M63 Galaxy, spiral Canes Venatici 9.3 Spring 13h 15.8m +42◦ 02’Triangulum Galaxy M33 Galaxy, spiral Triangulum 5.7 Autumn 1h 33.9m +30◦ 39’
Trifid Nebula M20 Nebula Sagittarius 6.3 Summer 18h 02.6m −23◦ 02’Virgo A M87 Galaxy, elliptical Virgo 9.6 Spring 12h 30.8m +12◦ 24’
Whirlpool Galaxy M51 Galaxy, spiral Canes Venatici 8.4 Spring 13h 30m +47◦ 11’Wild Duck Cluster M11 Cluster, open Scutum 6.3 Summer 18h 51.1m −06◦ 16’
Winnecke 4 M40 Double star WNC4 Ursa Major 9.7 Spring 12h 22.4m +58◦ 05’
61


![= N/#11N GJ= J77 ]](https://img.pdfslide.us/doc/110x75/5e8e5fc7b12190665911d57c/-n11n-gj-j77-.jpg)