Embed Size (px)
Citation preview
2007 JavaOneSM Conference – Lab 9520 DTrace for Web 2.0 Technologies | Angelo Rajadurai |
Angelo RajaduraiISV Engineering - AmericasSun Microsystems
Lab 9520:Solaris Dynamic Tracing for Java and other Web 2.0 Technologies
2007 JavaOneSM Conference – Lab 9520 DTrace for Web 2.0 Technologies | Angelo Rajadurai | 2
Goal of the Lab
Gain an overview of DTrace and see how the DTrace technology can be applied to Java, Javascript, PHP, MySQL and the entire AMP stack on Solaris.
2007 JavaOneSM Conference – Lab 9520 DTrace for Web 2.0 Technologies | Angelo Rajadurai | 3
Agenda● DTrace Introduction in 3 slides● Lab Overview and Paths● Q&A● Introduction to reference material

2007 JavaOneSM Conference – Lab 9520 DTrace for Web 2.0 Technologies | Angelo Rajadurai | 4
Why DTrace?
● Transient problems are hard to debug.● Example.
● Who sent a kill signal to my process.● Thread gets preempted when it should not.● In live production system my application does not scale above
30,000 user. ● Why are there so many threads in run queue when the CPU is
idle
2007 JavaOneSM Conference – Lab 9520 DTrace for Web 2.0 Technologies | Angelo Rajadurai | 5
Solution
● A Dynamically Instrumentable System ● have enough instrumentation to permit
collecting any arbitrary data● permit dynamically turning on/off
instrumentation● performance good enough to run in
production● ensures safety
2007 JavaOneSM Conference – Lab 9520 DTrace for Web 2.0 Technologies | Angelo Rajadurai | 6
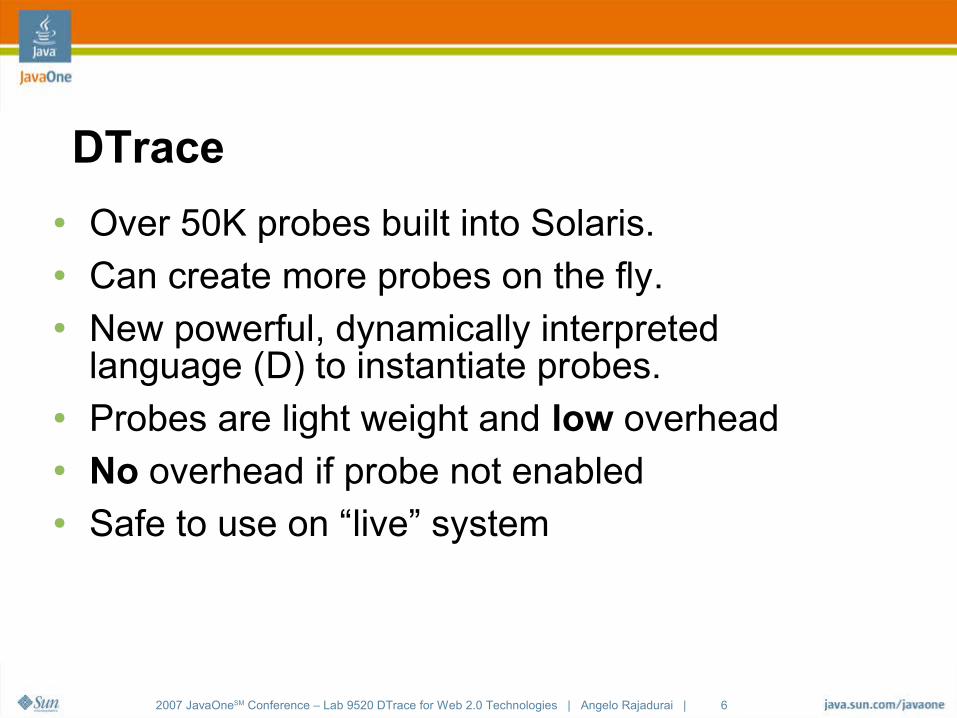
DTrace
● Over 50K probes built into Solaris.● Can create more probes on the fly.● New powerful, dynamically interpreted
language (D) to instantiate probes.● Probes are light weight and low overhead● No overhead if probe not enabled● Safe to use on “live” system

2007 JavaOneSM Conference – Lab 9520 DTrace for Web 2.0 Technologies | Angelo Rajadurai | 7
Lab path explanation
Lab Introduction
2007 JavaOneSM Conference – Lab 9520 DTrace for Web 2.0 Technologies | Angelo Rajadurai | 8
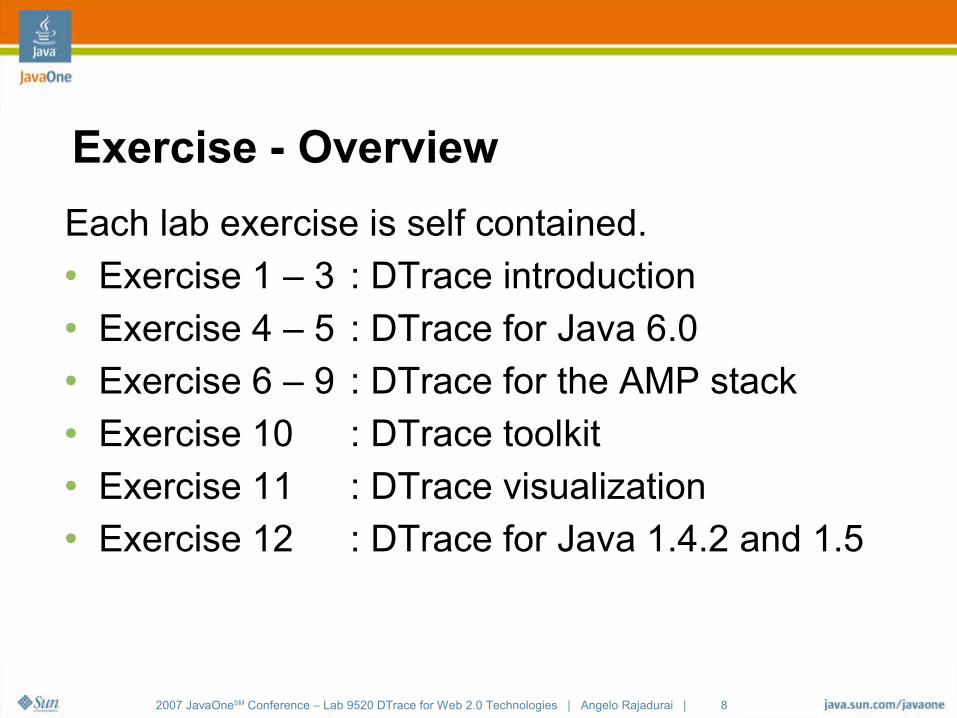
Exercise - Overview
Each lab exercise is self contained.● Exercise 1 – 3 : DTrace introduction● Exercise 4 – 5 : DTrace for Java 6.0● Exercise 6 – 9 : DTrace for the AMP stack● Exercise 10 : DTrace toolkit● Exercise 11 : DTrace visualization● Exercise 12 : DTrace for Java 1.4.2 and 1.5

2007 JavaOneSM Conference – Lab 9520 DTrace for Web 2.0 Technologies | Angelo Rajadurai | 9
Exercise – Suggested lab path
● Participants new to DTrace● Please do exercises 1 - 3.
● Interested only in DTrace for 1.4.2 & 1.5 ● Skip exercises 4, 5 and do exercise 12 instead
● Want to learn how to use DTrace for AMP● Do exercises 6 – 9.
● All participant● Complete exercise 10 & 11.
2007 JavaOneSM Conference – Lab 9520 DTrace for Web 2.0 Technologies | Angelo Rajadurai | 10
What you need to know to use the next 200 slides?
Introduction to reference slides
2007 JavaOneSM Conference – Lab 9520 DTrace for Web 2.0 Technologies | Angelo Rajadurai | 11
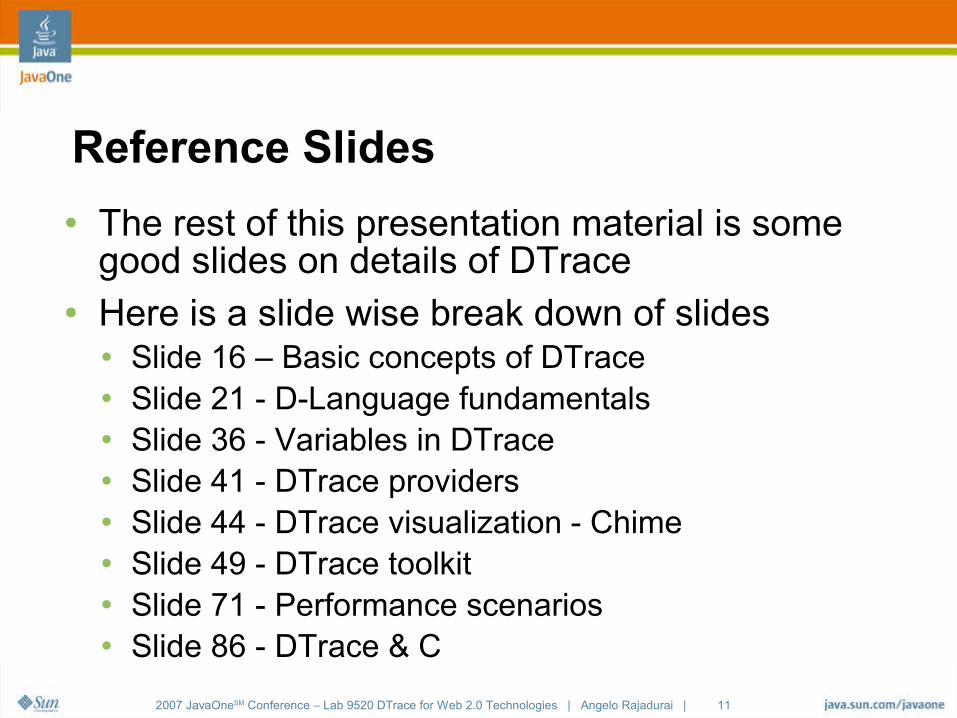
Reference Slides
● The rest of this presentation material is some good slides on details of DTrace
● Here is a slide wise break down of slides ● Slide 16 – Basic concepts of DTrace● Slide 21 - D-Language fundamentals● Slide 36 - Variables in DTrace● Slide 41 - DTrace providers● Slide 44 - DTrace visualization - Chime● Slide 49 - DTrace toolkit● Slide 71 - Performance scenarios● Slide 86 - DTrace & C
2007 JavaOneSM Conference – Lab 9520 DTrace for Web 2.0 Technologies | Angelo Rajadurai | 12
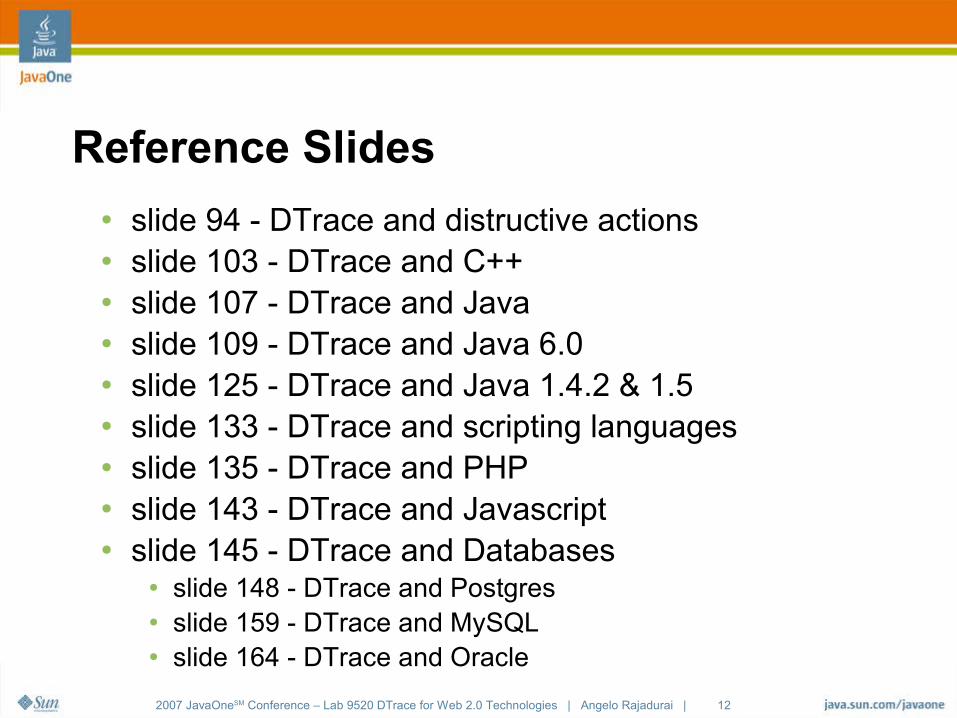
Reference Slides● slide 94 - DTrace and distructive actions● slide 103 - DTrace and C++● slide 107 - DTrace and Java● slide 109 - DTrace and Java 6.0● slide 125 - DTrace and Java 1.4.2 & 1.5● slide 133 - DTrace and scripting languages● slide 135 - DTrace and PHP● slide 143 - DTrace and Javascript● slide 145 - DTrace and Databases
● slide 148 - DTrace and Postgres● slide 159 - DTrace and MySQL● slide 164 - DTrace and Oracle

2007 JavaOneSM Conference – Lab 9520 DTrace for Web 2.0 Technologies | Angelo Rajadurai | 13
Reference Slides
● slide 169 - Make your own DTrace provider● slide 175 - DTrace Providers examples● slide 194 - DTrace Advanced topics● slide 197 - Postmortem tracing● slide 200 - Speculative tracing● slide 203 - DTrace configuration● slide 207 - DTrace more resources.●
2007 JavaOneSM Conference – Lab 9520 DTrace for Web 2.0 Technologies | Angelo Rajadurai | 14
Q & A
2007 JavaOneSM Conference – Lab 9520 DTrace for Web 2.0 Technologies | Angelo Rajadurai | 15
Reference slides
2007 JavaOneSM Conference – Lab 9520 DTrace for Web 2.0 Technologies | Angelo Rajadurai | 16
Overview of basic example and concepts
DTrace - Introduction
2007 JavaOneSM Conference – Lab 9520 DTrace for Web 2.0 Technologies | Angelo Rajadurai | 17
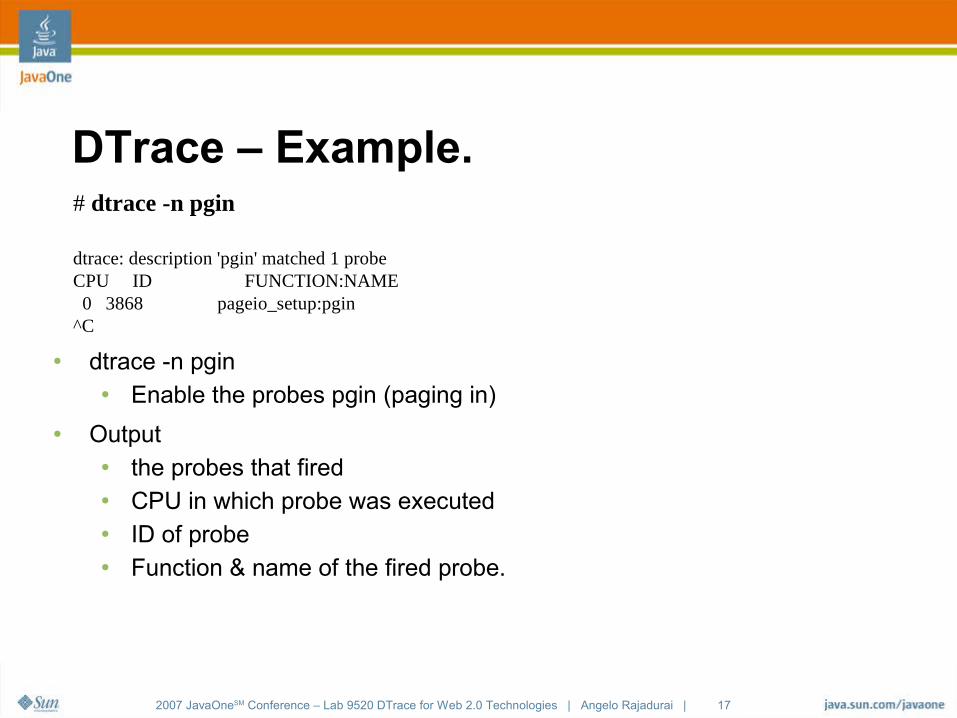
DTrace – Example.# dtrace -n pgin
dtrace: description 'pgin' matched 1 probeCPU ID FUNCTION:NAME 0 3868 pageio_setup:pgin ^C
● dtrace -n pgin● Enable the probes pgin (paging in)
● Output● the probes that fired● CPU in which probe was executed● ID of probe● Function & name of the fired probe.
2007 JavaOneSM Conference – Lab 9520 DTrace for Web 2.0 Technologies | Angelo Rajadurai | 18
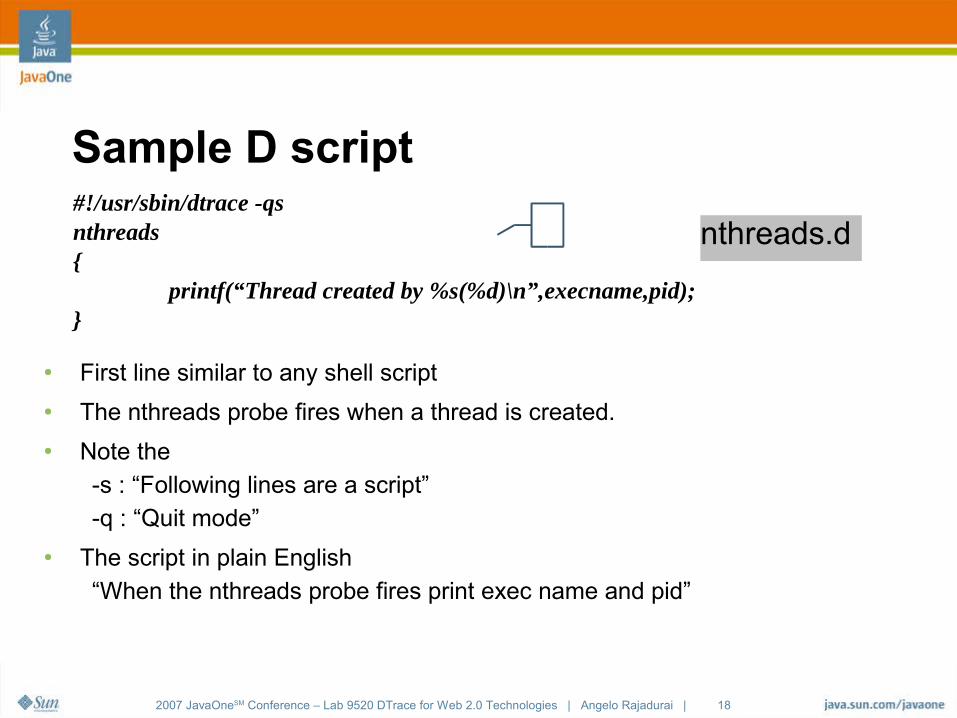
Sample D script#!/usr/sbin/dtrace -qsnthreads{
printf(“Thread created by %s(%d)\n”,execname,pid);}
● First line similar to any shell script
● The nthreads probe fires when a thread is created.
● Note the -s : “Following lines are a script”-q : “Quit mode”
● The script in plain English“When the nthreads probe fires print exec name and pid”
nthreads.d

2007 JavaOneSM Conference – Lab 9520 DTrace for Web 2.0 Technologies | Angelo Rajadurai | 19
DTrace – How it works
2007 JavaOneSM Conference – Lab 9520 DTrace for Web 2.0 Technologies | Angelo Rajadurai | 20
How it works ● dtrace command compiles the D language Script.● Intermediate code checked for safety (like java).● The compiled code is executed in the kernel by DTrace.● DTrace instructs the provider to enable the probes● As soon as the D program exits all instrumentation removed● No limit (except system resources) on number of D scripts
that can be run simultaneously● Different users can debug the system simultaneously
without causing data corruption or collision issues.
2007 JavaOneSM Conference – Lab 9520 DTrace for Web 2.0 Technologies | Angelo Rajadurai | 21
D- LanguageD-Language - Quick overview
2007 JavaOneSM Conference – Lab 9520 DTrace for Web 2.0 Technologies | Angelo Rajadurai | 22
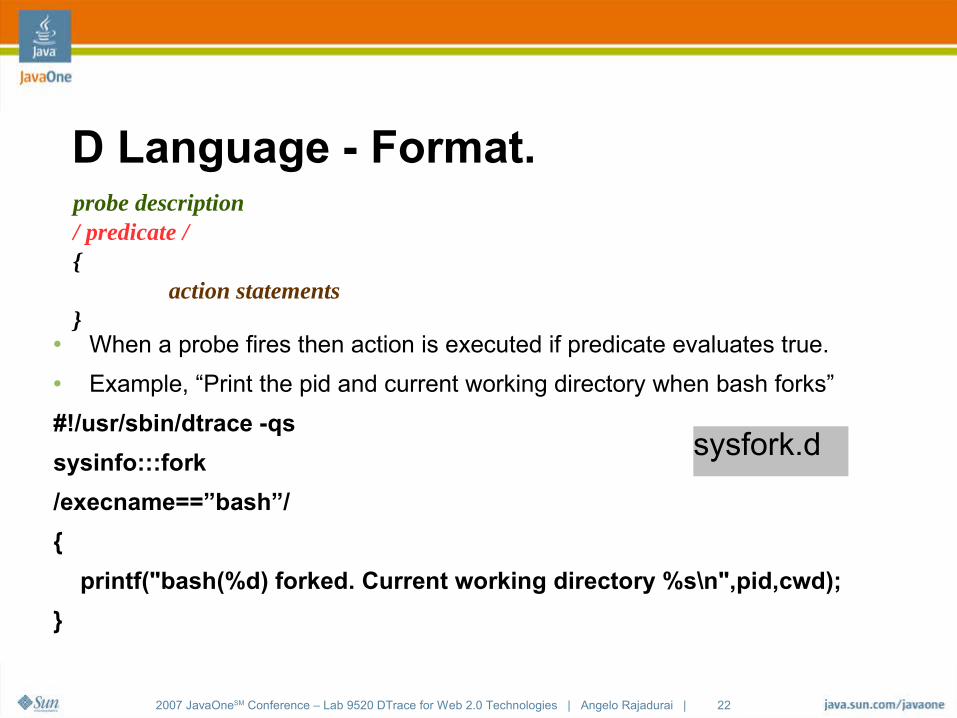
D Language - Format.probe description/ predicate /{
action statements}
● When a probe fires then action is executed if predicate evaluates true.
● Example, “Print the pid and current working directory when bash forks”
#!/usr/sbin/dtrace -qs
sysinfo:::fork
/execname==”bash”/
{
printf("bash(%d) forked. Current working directory %s\n",pid,cwd);
}
sysfork.d
2007 JavaOneSM Conference – Lab 9520 DTrace for Web 2.0 Technologies | Angelo Rajadurai | 23
Probe● Probes are points of instrumentation● Probes are made available by providers● Probes identify the module and function that they
instruments● Each probe has a name● These four attributes define a tuple that uniquely
identifies each probeprovider:module:function:name
● Examplefbt:unix:mutex_init:entryvminfo:genunix:swapin:pgswapin
2007 JavaOneSM Conference – Lab 9520 DTrace for Web 2.0 Technologies | Angelo Rajadurai | 24
Listing Probes.● Probes can be listed with the “-l” option to dtrace(1M)
● in a specific function with “-f function”● in a specific module with “-m module”● with a specific name with “-n name”● from a specific provider with “-P provider”
● Empty components match all possible probes. ● Wild card can be used in naming probe.
2007 JavaOneSM Conference – Lab 9520 DTrace for Web 2.0 Technologies | Angelo Rajadurai | 25
Providers● Providers represent a methodology for instrumenting
the system● Providers make probes available to the DTrace
framework● DTrace informs providers when a probe is to be
enabled ● Providers transfer control to DTrace when an enabled
probe is fired● Examples
syscall provider provides probes in every system callfbt provider provides probe into every function in the kernel
2007 JavaOneSM Conference – Lab 9520 DTrace for Web 2.0 Technologies | Angelo Rajadurai | 26
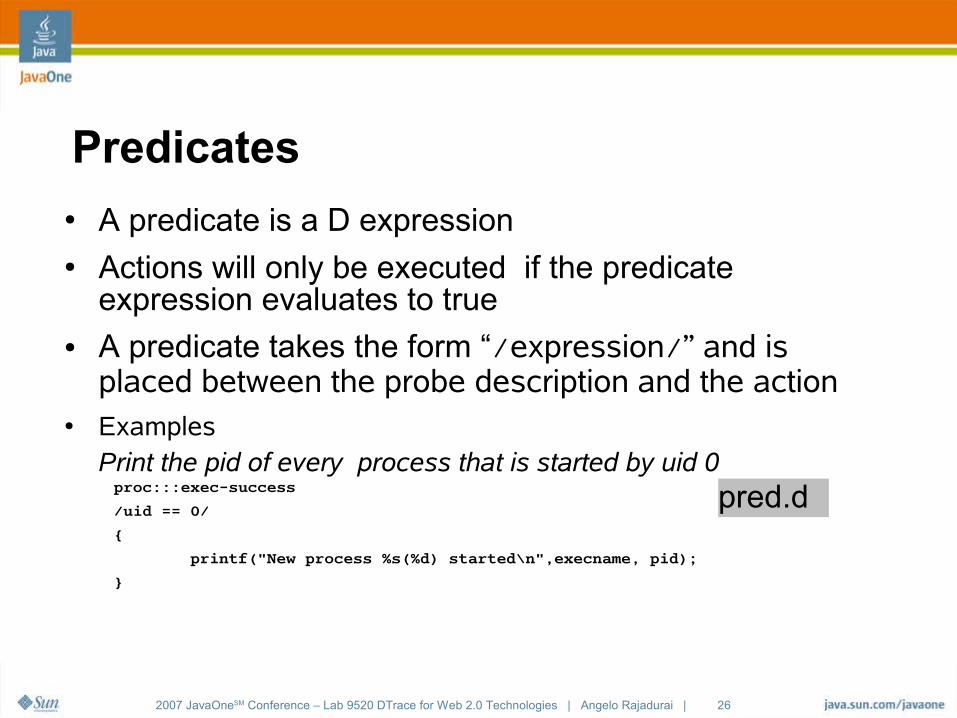
Predicates● A predicate is a D expression ● Actions will only be executed if the predicate
expression evaluates to true ● A predicate takes the form “/expression/” and is
placed between the probe description and the action● Examples
Print the pid of every process that is started by uid 0proc:::exec-success
/uid == 0/
{
printf("New process %s(%d) started\n",execname, pid);
}
pred.d
2007 JavaOneSM Conference – Lab 9520 DTrace for Web 2.0 Technologies | Angelo Rajadurai | 27
Actions● Actions are executed when a probe fires● Actions are completely programmable● Most actions record some specified state in the
system● Some actions change the state of the system system
in a well-defined manner● These are called destructive actions and are
disabled by default.● Probes may provide parameters than can be used in
the actions.

2007 JavaOneSM Conference – Lab 9520 DTrace for Web 2.0 Technologies | Angelo Rajadurai | 28
Data types & Operators● D Language provides standard data types.
● Integer types(32 bit size, 64-bit size)● char(1,1), short(2,2),int(4,4), long(4,8),long long(8,8)
● Float types(32-bit size, 64-bit size)● float(4,4), double(8,8),long double(16,16)
● Integer float and string constants are present in D.● add(+), sub(-), mul(*), div(/), mod(%) math operators ● less than (<), less than or equal(<=) etc. defined● logical AND(&&), OR(||) & XOR(^^) ● bitwise operations and standard assignment ops present.

2007 JavaOneSM Conference – Lab 9520 DTrace for Web 2.0 Technologies | Angelo Rajadurai | 29
AggregationPerformance enhancer – huge time saver!
2007 JavaOneSM Conference – Lab 9520 DTrace for Web 2.0 Technologies | Angelo Rajadurai | 30
Aggregation
● Think of a case when you are want to know the “total” time the system spends in a function.● We can save the amount of time spent by the function every time
it is called and then add the total. ● If the function was called 1000 times that is 1000 bits of info
stored in the buffer just for us to finally add to get the total.● Instead if we just keep a running total then it is just one piece of
info that is stored in the buffer.● We can use the same concept when we want averages, count,
min or max.● Aggregation is a D construct for this purpose.
2007 JavaOneSM Conference – Lab 9520 DTrace for Web 2.0 Technologies | Angelo Rajadurai | 31
Aggregation - Format
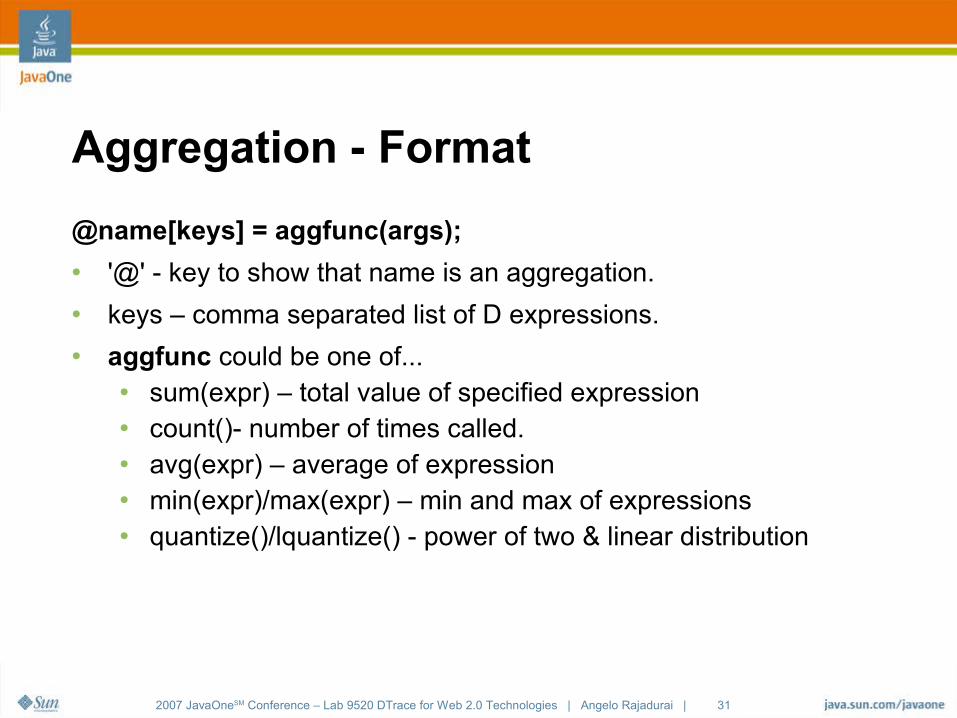
@name[keys] = aggfunc(args);● '@' - key to show that name is an aggregation.● keys – comma separated list of D expressions.● aggfunc could be one of...
● sum(expr) – total value of specified expression ● count()- number of times called.● avg(expr) – average of expression● min(expr)/max(expr) – min and max of expressions● quantize()/lquantize() - power of two & linear distribution
2007 JavaOneSM Conference – Lab 9520 DTrace for Web 2.0 Technologies | Angelo Rajadurai | 32
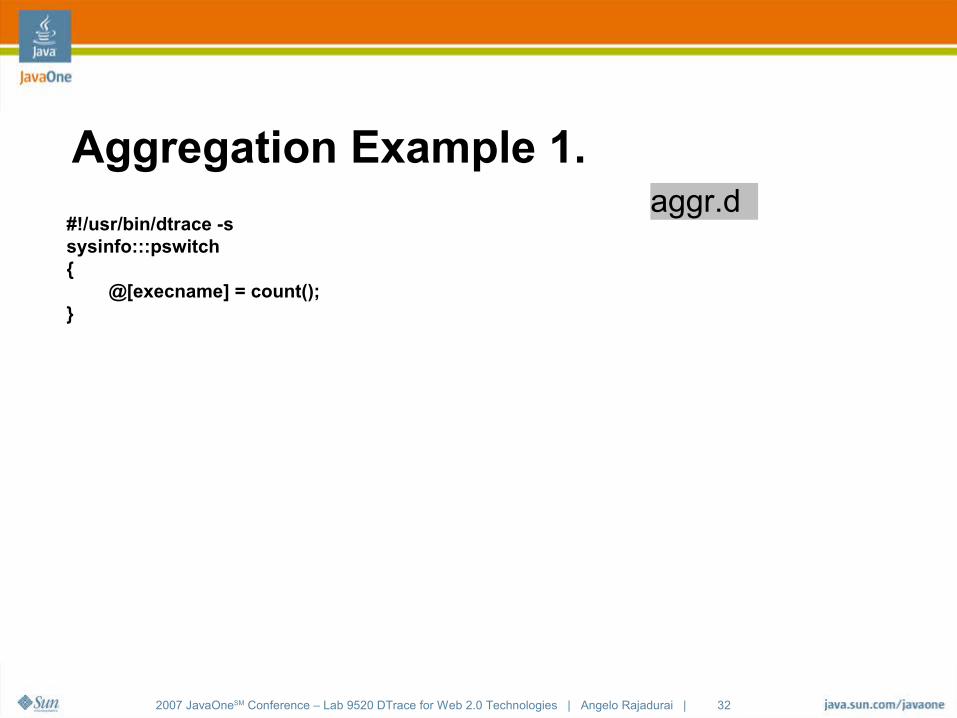
Aggregation Example 1.
#!/usr/bin/dtrace -ssysinfo:::pswitch{ @[execname] = count();}
aggr.d
2007 JavaOneSM Conference – Lab 9520 DTrace for Web 2.0 Technologies | Angelo Rajadurai | 33
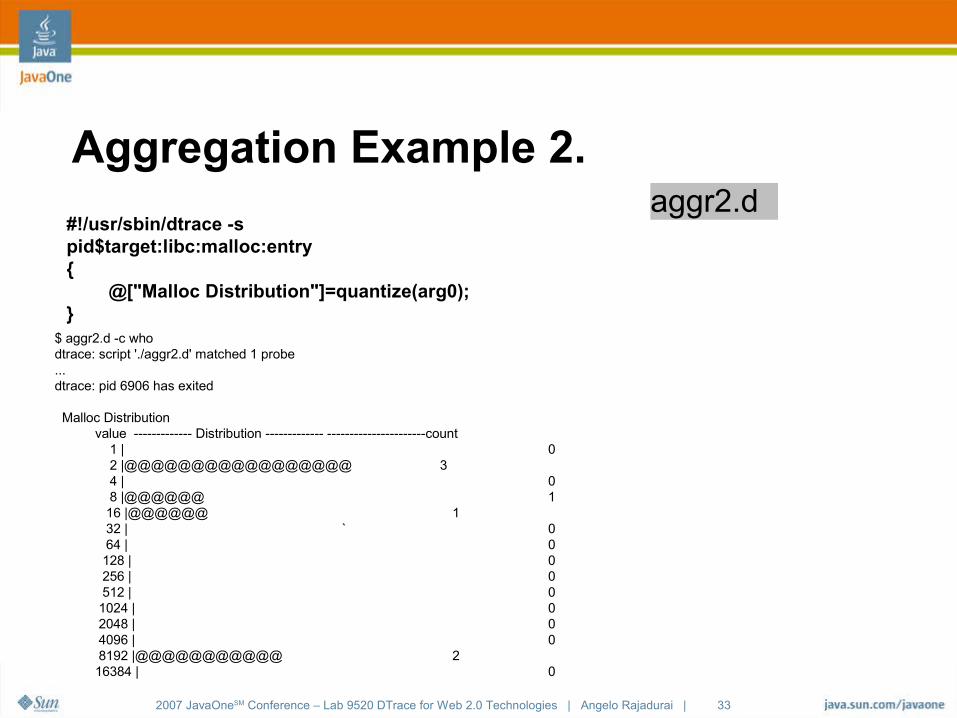
Aggregation Example 2.
#!/usr/sbin/dtrace -spid$target:libc:malloc:entry{ @["Malloc Distribution"]=quantize(arg0);}
$ aggr2.d -c whodtrace: script './aggr2.d' matched 1 probe...dtrace: pid 6906 has exited
Malloc Distribution value ------------- Distribution ------------- ----------------------count 1 | 0 2 |@@@@@@@@@@@@@@@@@ 3 4 | 0 8 |@@@@@@ 1 16 |@@@@@@ 1 32 | ` 0 64 | 0 128 | 0 256 | 0 512 | 0 1024 | 0 2048 | 0 4096 | 0 8192 |@@@@@@@@@@@ 2 16384 | 0
aggr2.d
2007 JavaOneSM Conference – Lab 9520 DTrace for Web 2.0 Technologies | Angelo Rajadurai | 34
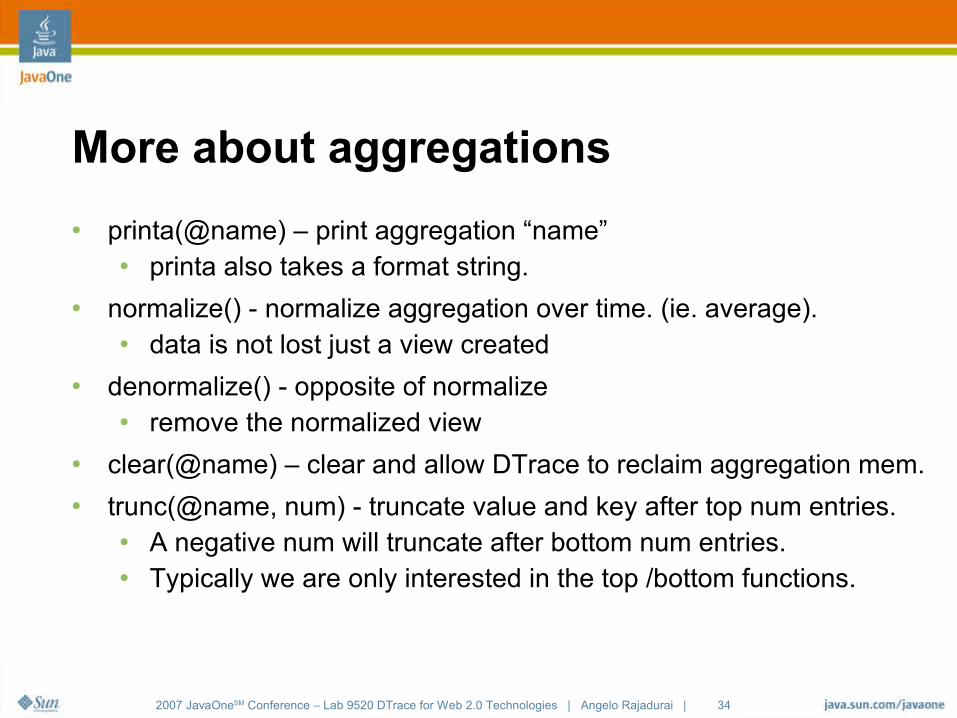
More about aggregations
● printa(@name) – print aggregation “name”● printa also takes a format string.
● normalize() - normalize aggregation over time. (ie. average).● data is not lost just a view created
● denormalize() - opposite of normalize● remove the normalized view
● clear(@name) – clear and allow DTrace to reclaim aggregation mem.● trunc(@name, num) - truncate value and key after top num entries.
● A negative num will truncate after bottom num entries. ● Typically we are only interested in the top /bottom functions.
2007 JavaOneSM Conference – Lab 9520 DTrace for Web 2.0 Technologies | Angelo Rajadurai | 35
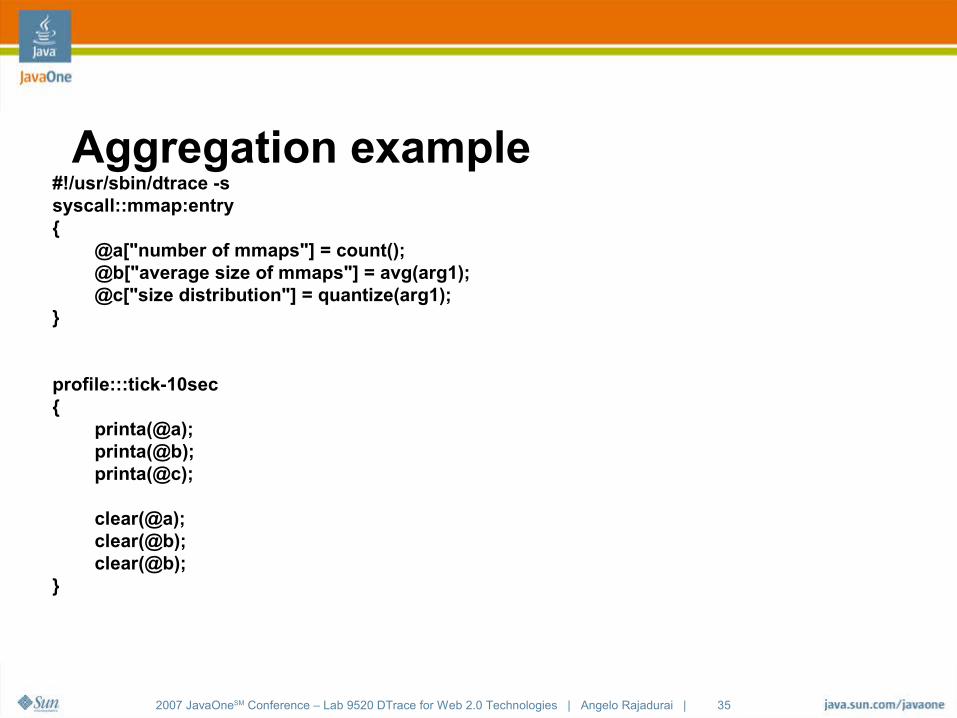
Aggregation example#!/usr/sbin/dtrace -ssyscall::mmap:entry{ @a["number of mmaps"] = count(); @b["average size of mmaps"] = avg(arg1); @c["size distribution"] = quantize(arg1);}
profile:::tick-10sec{ printa(@a); printa(@b); printa(@c);
clear(@a); clear(@b); clear(@b);}

2007 JavaOneSM Conference – Lab 9520 DTrace for Web 2.0 Technologies | Angelo Rajadurai | 36
VariablesCalling all MT programmers!
2007 JavaOneSM Conference – Lab 9520 DTrace for Web 2.0 Technologies | Angelo Rajadurai | 37
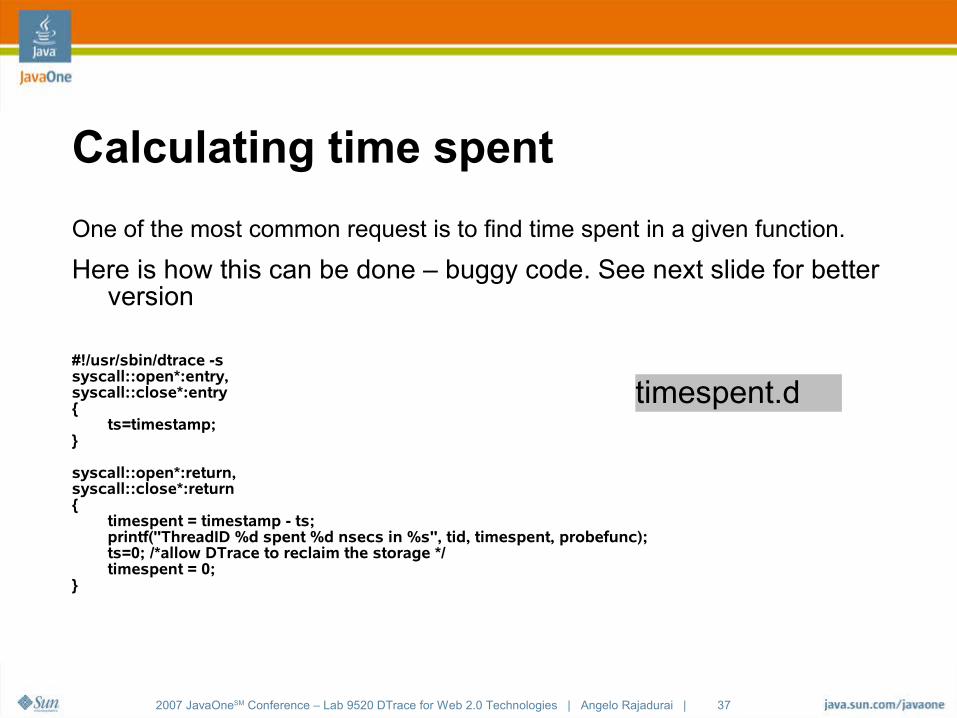
Calculating time spent
One of the most common request is to find time spent in a given function.
Here is how this can be done – buggy code. See next slide for better version
#!/usr/sbin/dtrace -ssyscall::open*:entry,syscall::close*:entry{ ts=timestamp;}
syscall::open*:return,syscall::close*:return{ timespent = timestamp - ts; printf("ThreadID %d spent %d nsecs in %s", tid, timespent, probefunc); ts=0; /*allow DTrace to reclaim the storage */ timespent = 0;}
timespent.d

2007 JavaOneSM Conference – Lab 9520 DTrace for Web 2.0 Technologies | Angelo Rajadurai | 38
Thread Local Variable
self->variable = expression;● self – keyword to indicate that the variable is thread local
● A boon for observers of multi-threaded apps..
● As name indicates this is specific to the thread. See code re-written#!/usr/sbin/dtrace -ssyscall::open*:entry,syscall::close*:entry{ self->ts=timestamp;}
syscall::open*:return,syscall::close*:return{ timespent = timestamp - self->ts; printf("ThreadID %d spent %d nsecs in %s", tid, timespent, probefunc); self->ts=0; /*allow DTrace to reclaim the storage */ timespent = 0;}
self.d
2007 JavaOneSM Conference – Lab 9520 DTrace for Web 2.0 Technologies | Angelo Rajadurai | 39
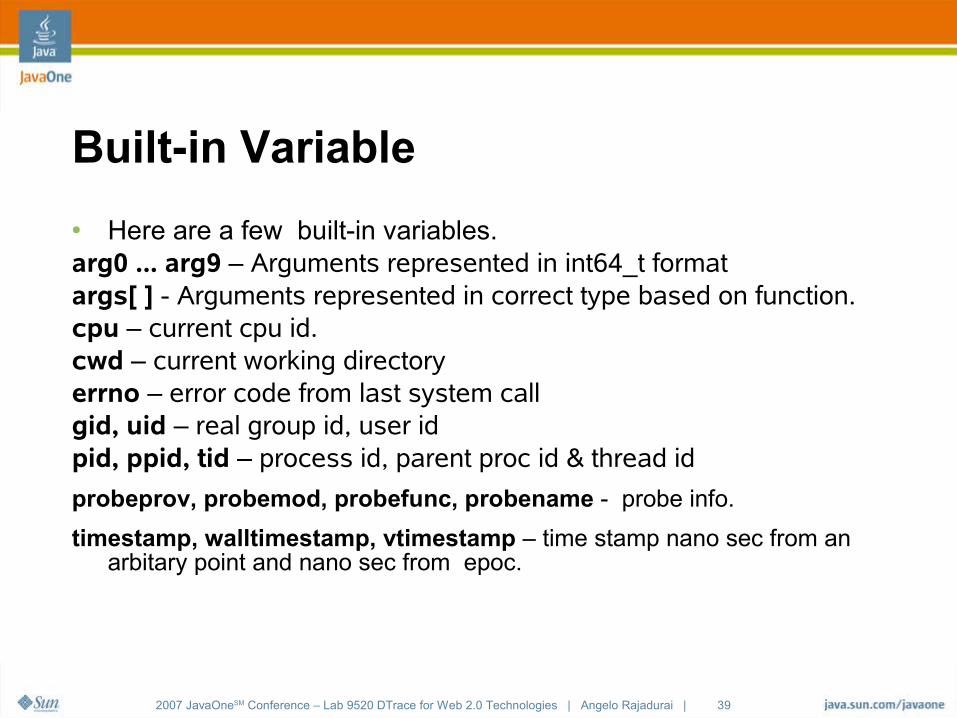
Built-in Variable
● Here are a few built-in variables.arg0 ... arg9 – Arguments represented in int64_t formatargs[ ] - Arguments represented in correct type based on function.cpu – current cpu id.cwd – current working directoryerrno – error code from last system callgid, uid – real group id, user idpid, ppid, tid – process id, parent proc id & thread id
probeprov, probemod, probefunc, probename - probe info.
timestamp, walltimestamp, vtimestamp – time stamp nano sec from an arbitary point and nano sec from epoc.
2007 JavaOneSM Conference – Lab 9520 DTrace for Web 2.0 Technologies | Angelo Rajadurai | 40
External Variable
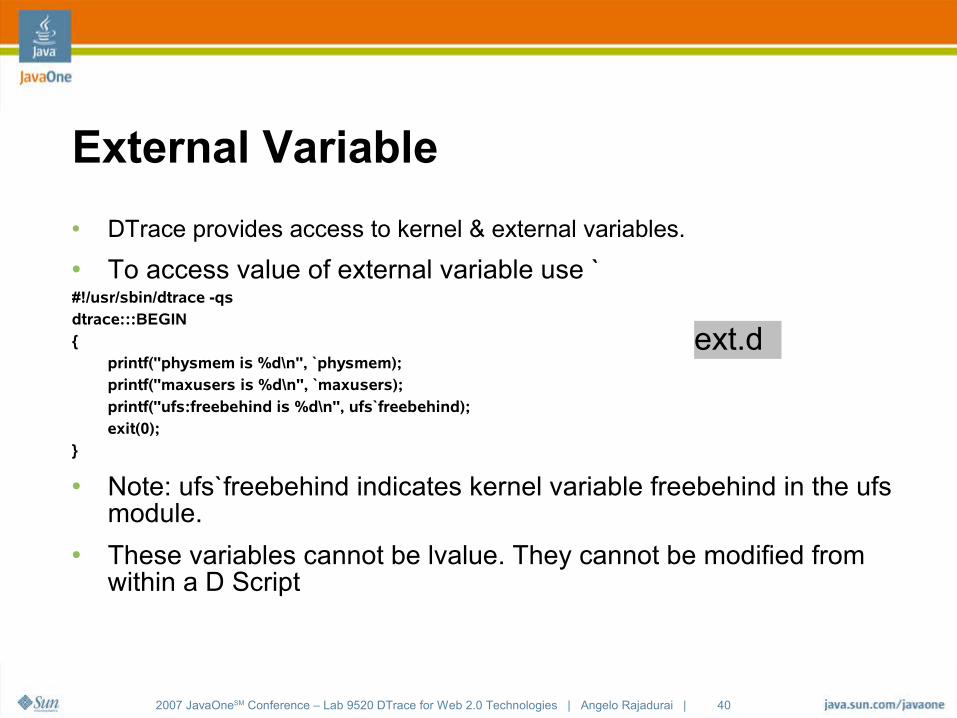
● DTrace provides access to kernel & external variables.
● To access value of external variable use `#!/usr/sbin/dtrace -qsdtrace:::BEGIN{ printf("physmem is %d\n", `physmem); printf("maxusers is %d\n", `maxusers); printf("ufs:freebehind is %d\n", ufs`freebehind); exit(0);}
● Note: ufs`freebehind indicates kernel variable freebehind in the ufs module.
● These variables cannot be lvalue. They cannot be modified from within a D Script
ext.d
2007 JavaOneSM Conference – Lab 9520 DTrace for Web 2.0 Technologies | Angelo Rajadurai | 41
DTrace providersWhat does Solaris provide for you!
2007 JavaOneSM Conference – Lab 9520 DTrace for Web 2.0 Technologies | Angelo Rajadurai | 42
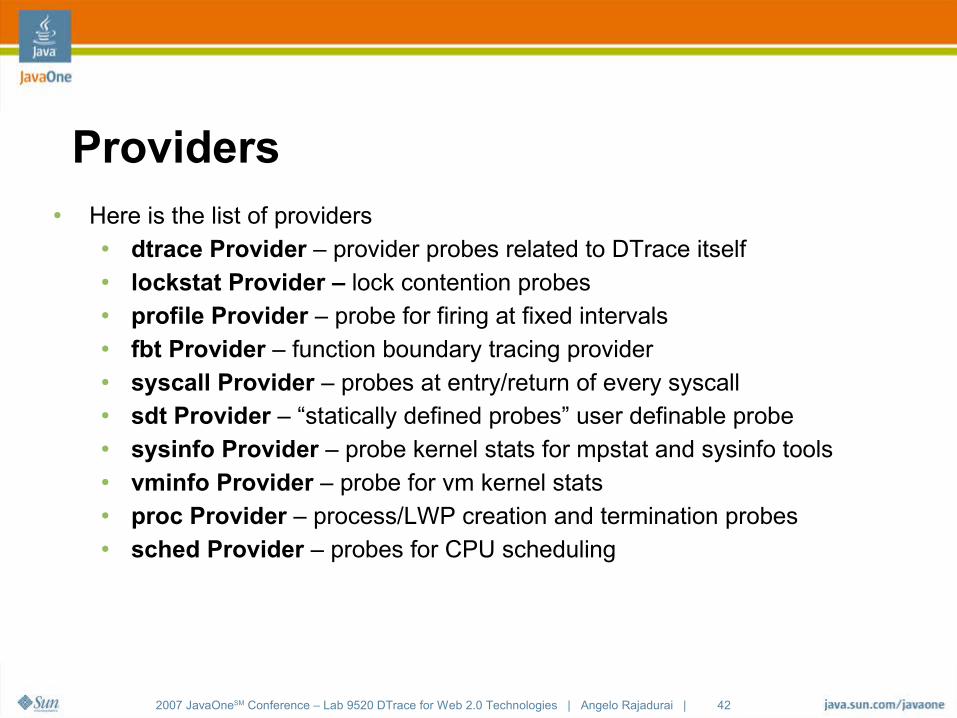
Providers● Here is the list of providers
● dtrace Provider – provider probes related to DTrace itself● lockstat Provider – lock contention probes● profile Provider – probe for firing at fixed intervals● fbt Provider – function boundary tracing provider● syscall Provider – probes at entry/return of every syscall● sdt Provider – “statically defined probes” user definable probe● sysinfo Provider – probe kernel stats for mpstat and sysinfo tools● vminfo Provider – probe for vm kernel stats● proc Provider – process/LWP creation and termination probes● sched Provider – probes for CPU scheduling

2007 JavaOneSM Conference – Lab 9520 DTrace for Web 2.0 Technologies | Angelo Rajadurai | 43
Providers - cont.
● We will now see some more details on a few Solaris Providers● io Provider – provider probes related to disk IO● mib Provider – insight into network layer.● fpuinfo Provider – probe into kernel software FP processing● pid Provider – probe into any function or instruction in user code.● plockstat Provider – probes user level sync and lock code● fasttrap Provider – non-exposed probe. Fires when DTrace
probes are called.
2007 JavaOneSM Conference – Lab 9520 DTrace for Web 2.0 Technologies | Angelo Rajadurai | 44
DTrace VisualizationA sweet “chime”
2007 JavaOneSM Conference – Lab 9520 DTrace for Web 2.0 Technologies | Angelo Rajadurai | 45
Java API for DTrace
● As you may have seen the output from DTace is always text.● If you are into GUI and graphs there is Java DTrace API and Chime.● Chime – is a graphical tool to visualize DTrace output.
● The tool currently works only in Nevada Bld 35+● Will be available in Update 4.● You can visualize output from any D-script.
● Java DTrace API is java binding for DTrace ● Available in Nevada and Solaris 10 Update 4
2007 JavaOneSM Conference – Lab 9520 DTrace for Web 2.0 Technologies | Angelo Rajadurai | 46
Chime
● Get it fromhttp://opensolaris.org/os/project/dtrace-chime/install/
● Chime visualization is controlled by “display”● Displays are xml files that contains the D-scripts and the configuration
for the display.● A wizard is also provided for creating new “Displays”● This is a great tool for demo. ● Speaking of demo's here is one.
2007 JavaOneSM Conference – Lab 9520 DTrace for Web 2.0 Technologies | Angelo Rajadurai | 47
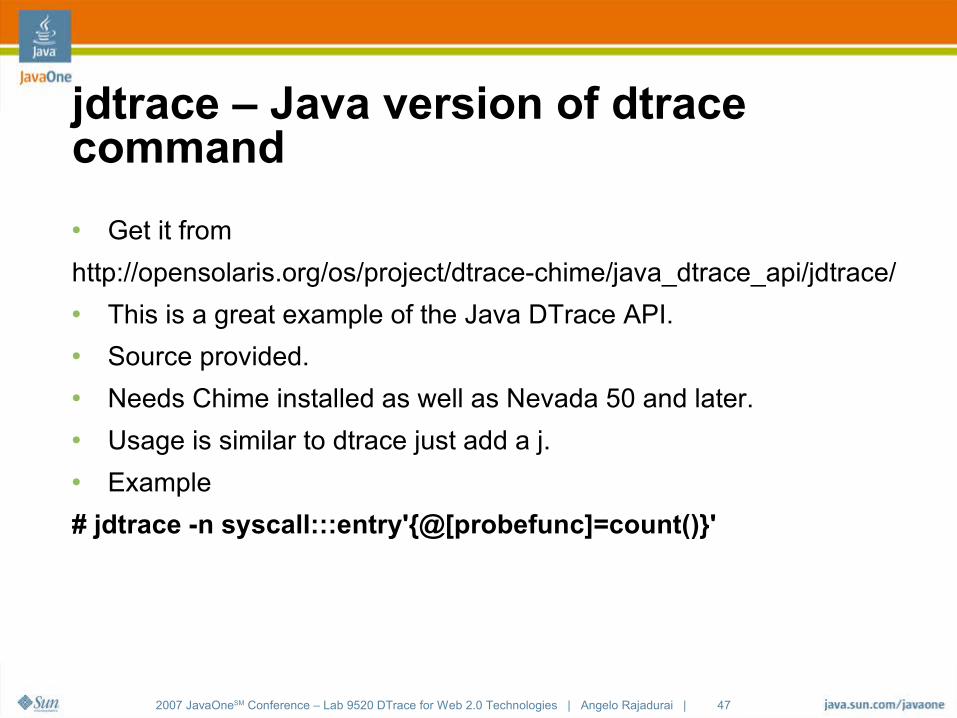
jdtrace – Java version of dtrace command
● Get it from
http://opensolaris.org/os/project/dtrace-chime/java_dtrace_api/jdtrace/● This is a great example of the Java DTrace API. ● Source provided. ● Needs Chime installed as well as Nevada 50 and later.● Usage is similar to dtrace just add a j.● Example
# jdtrace -n syscall:::entry'{@[probefunc]=count()}'
2007 JavaOneSM Conference – Lab 9520 DTrace for Web 2.0 Technologies | Angelo Rajadurai | 48
DTrace - Real life.
● We learnt about DTrace and how to develop D-scripts● Knowing to instrument is not the same as knowing where to
instrument.● Next we will see how to use DTrace in real life.● First we will see about the DTrace toolkit.
● Over a hundred useful D-scripts● Become an expert in minutes.
● Performance scenarios● A few real life scenarios and how to use Dtrace to address it.
2007 JavaOneSM Conference – Lab 9520 DTrace for Web 2.0 Technologies | Angelo Rajadurai | 49
DTrace ToolkitHow to become and instant hero!
2007 JavaOneSM Conference – Lab 9520 DTrace for Web 2.0 Technologies | Angelo Rajadurai | 50
DTrace Toolkit● The DTraceToolkit is a collection of useful
● Documented scripts developed by the OpenSolaris DTrace community
● Available under www.opensolaris.org● Ready to use D scripts● The toolkit contains:
● the scripts● the man pages● the example documentation● the notes files
2007 JavaOneSM Conference – Lab 9520 DTrace for Web 2.0 Technologies | Angelo Rajadurai | 51
DTrace Toolkit
● Get it from
http://www.opensolaris.org/os/community/dtrace/dtracetoolkit● Download
● gunzip & tar xvf● ./install● A nice guide comes with the script● See the Docs/Contents for more details.● Set PATH to include /opt/DTT

2007 JavaOneSM Conference – Lab 9520 DTrace for Web 2.0 Technologies | Angelo Rajadurai | 52
DTrace Toolkit Bin/ Symlinks to the scripts
Apps/ Application specific scripts
Cpu/ Scripts for CPU analysis
Disk/ Scripts for disk I/O analysis
Docs/ Documentation
Contents Command list for the Toolkit
Examples/ Examples of command usage
Faq Frequently asked questions
Links Further DTrace links
Notes/ Notes on Toolkit commands
Readme Readme for using the docs
Extra/ Misc scripts
Guide This file!
Kernel/ Scripts for kernel analysis
License The CDDL license
Locks/ Scripts for lock analysis
Man/ Man pages
man1m/ Man pages for the Toolkit commands
Mem/ Scripts for memory analysis
Net/ Scripts for network analysis
Proc/ Scripts for process analysis
System/ Scripts for system analysis
User/ Scripts for user based activity analysis
Zones/ Scripts for analysis by zone
Version DTraceToolkit version
install Install script, use for installs only
2007 JavaOneSM Conference – Lab 9520 DTrace for Web 2.0 Technologies | Angelo Rajadurai | 53
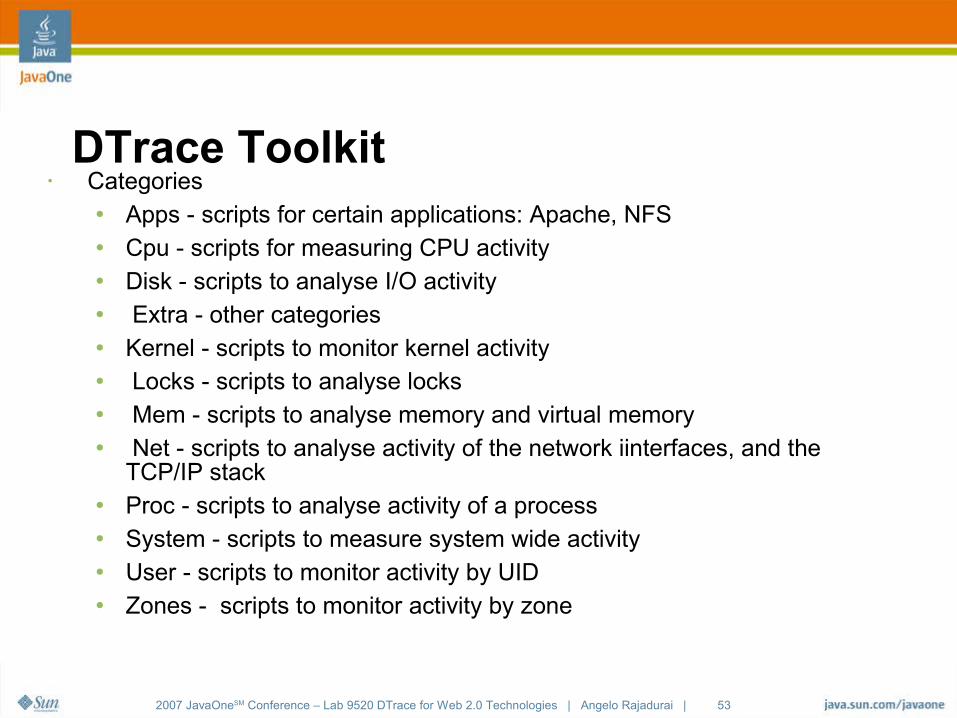
DTrace Toolkit● Categories
● Apps - scripts for certain applications: Apache, NFS● Cpu - scripts for measuring CPU activity● Disk - scripts to analyse I/O activity● Extra - other categories● Kernel - scripts to monitor kernel activity● Locks - scripts to analyse locks● Mem - scripts to analyse memory and virtual memory● Net - scripts to analyse activity of the network iinterfaces, and the
TCP/IP stack● Proc - scripts to analyse activity of a process● System - scripts to measure system wide activity● User - scripts to monitor activity by UID● Zones - scripts to monitor activity by zone
2007 JavaOneSM Conference – Lab 9520 DTrace for Web 2.0 Technologies | Angelo Rajadurai | 54
DTrace Toolkit●
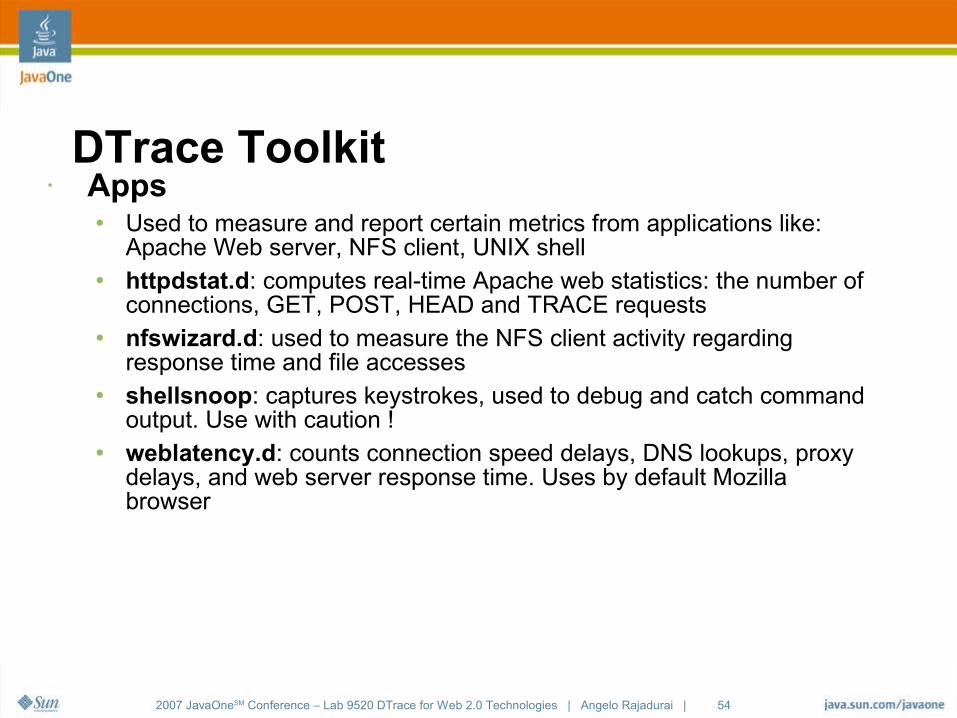
Apps● Used to measure and report certain metrics from applications like:
Apache Web server, NFS client, UNIX shell● httpdstat.d: computes real-time Apache web statistics: the number of
connections, GET, POST, HEAD and TRACE requests● nfswizard.d: used to measure the NFS client activity regarding
response time and file accesses● shellsnoop: captures keystrokes, used to debug and catch command
output. Use with caution !● weblatency.d: counts connection speed delays, DNS lookups, proxy
delays, and web server response time. Uses by default Mozilla browser
2007 JavaOneSM Conference – Lab 9520 DTrace for Web 2.0 Technologies | Angelo Rajadurai | 55
DTrace Toolkit● CPU
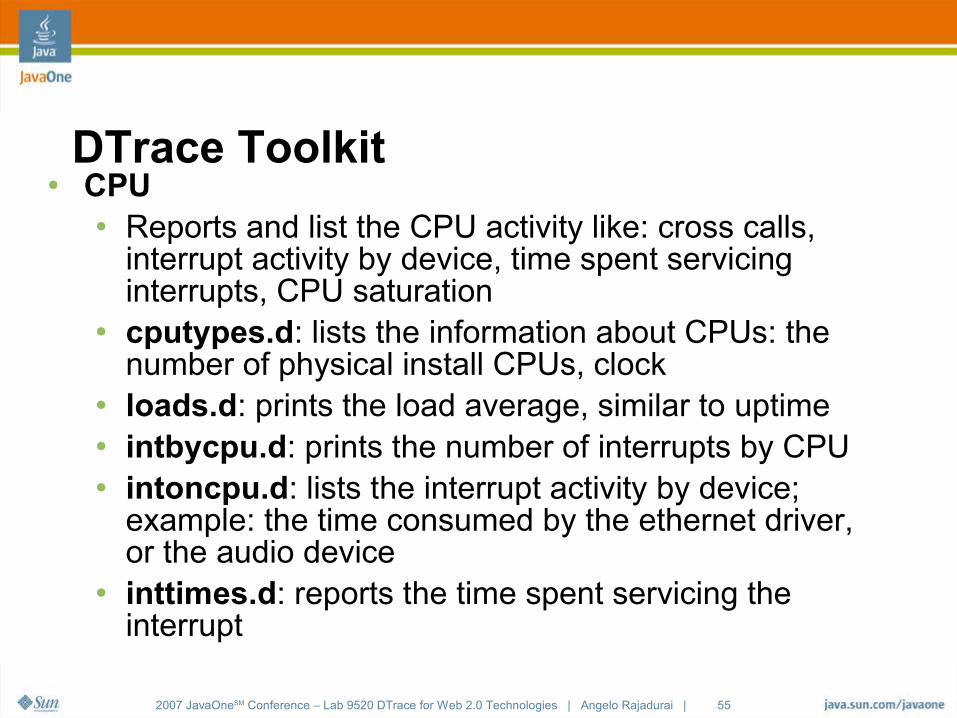
● Reports and list the CPU activity like: cross calls, interrupt activity by device, time spent servicing interrupts, CPU saturation
● cputypes.d: lists the information about CPUs: the number of physical install CPUs, clock
● loads.d: prints the load average, similar to uptime● intbycpu.d: prints the number of interrupts by CPU● intoncpu.d: lists the interrupt activity by device;
example: the time consumed by the ethernet driver, or the audio device
● inttimes.d: reports the time spent servicing the interrupt

2007 JavaOneSM Conference – Lab 9520 DTrace for Web 2.0 Technologies | Angelo Rajadurai | 56
DTrace Toolkit● CPU
● xcallsbypid.d: list the inter-processor cross-calls by process id. The inter-process cross calls is an indicator how much work a CPU sends to another CPU
● dispqlen.d : dispatcher queue length by CPU, measures the CPU saturation
● cpuwalk.d : identify if a process is running on multiple CPUs concurrently or not
● runocc.d : prints the dispatcher run queue, a good way to measure CPU saturation
2007 JavaOneSM Conference – Lab 9520 DTrace for Web 2.0 Technologies | Angelo Rajadurai | 57
DTrace Toolkit● Disk
● Analyses I/O activity using the io provider from DTrace: disk I/O patterns, disk I/O activity by process, the seek size of an I/O operation
● iotop: a top like utility which lists disk I/O events by processes
● iosnoop: a disk I/O trace event application. The utility will report UID, PID, filename regarding for a I/O operation
● bitesize.d: analyze disk I/O size by process ● seeksize.d: analyzes the disk I/O seek size by
identifying what sort I/O operation the process is making: sequential or random

2007 JavaOneSM Conference – Lab 9520 DTrace for Web 2.0 Technologies | Angelo Rajadurai | 58
DTrace Toolkit● Disk
● iofile.d: prints the total I/O wait times. Used to debug applications which are waiting for a disk file or resource
● iopattern: computes the percentage of events that were of a random or sequential nature. Used easily to identify the type of an I/O operation and the average, totals numbers
● iopending: prints a plot for the number of pending disk I/O events. This utility tries to identify the "serialness" or "parallelness" of the disk behavior
● diskhits: prints the load average, similar to uptime● iofileb.d: prints a summary of requested disk activity by
pathname, providing totals of the I/O events in byte
2007 JavaOneSM Conference – Lab 9520 DTrace for Web 2.0 Technologies | Angelo Rajadurai | 59
DTrace Toolkit● FS
● Analyses the activity on the file system level: write cache miss, read file I/O statistics, system calls read/write
● vopstat: traces the vnode activity● rfsio.d: provides statistics on the number of reads:
the bytes read from file systems (logical reads) and the number of bytes read from physical disk
● fspaging.d: used to examine the behavior of each I/O layer, from the syscall interface to what the disk is doing
● rfileio.d: similar with rfsio.d but reports by file
2007 JavaOneSM Conference – Lab 9520 DTrace for Web 2.0 Technologies | Angelo Rajadurai | 60
DTrace Toolkit● Kernel
● Analyses kernel activity: DNLC statistics, CPU time consumed by kernel, the threads scheduling class and priority
● dnlcstat: inspector of the Directory Name Lookup Cache (DNLC)
● cputimes: print CPU time consumed by the kernel, processes or idle
● cpudist: print CPU time distributions by kernel, processes or idle cswstat.d: prints the context switch count and average
● modcalls.d: an aggregation for kernel function calls by module
2007 JavaOneSM Conference – Lab 9520 DTrace for Web 2.0 Technologies | Angelo Rajadurai | 61
DTrace Toolkit● Kernel
● dnlcps.d: prints DNLC statistics by process● dnlcsnoop.d: snoops DNLC activity● kstat_types.d: traces kstat reads● pridist.d: outputs the process priority distribution.
Plots which process is on the CPUs, and under what priority it is
● priclass.d: outputs the priority distribution by scheduling class. Plots a distribution
● whatexec.d: determines the types of files which are executed by inspected the first four bytes of the executed file
2007 JavaOneSM Conference – Lab 9520 DTrace for Web 2.0 Technologies | Angelo Rajadurai | 62
DTrace Toolkit● Lock
● Analyses lock activity using lockstat provider● lockbydist.d: lock distribution by process name● lockbyproc.d: lock time by process name
2007 JavaOneSM Conference – Lab 9520 DTrace for Web 2.0 Technologies | Angelo Rajadurai | 63
DTrace Toolkit● Memory
● This category analyses memory and virtual memory things: virtual memory statistics, page management, minor faults
● vmstat.d: a vmstat like utility written in D● vmstat-p.d: a vmstat like utility written in D which
does display what “vmstat -p” does: reporting the paging information
● xvmstat: a much improved version of vmstat which does count the following numbers: free RAM, virtual memory free, major faults, minor faults, scan rate

2007 JavaOneSM Conference – Lab 9520 DTrace for Web 2.0 Technologies | Angelo Rajadurai | 64
DTrace Toolkit● Memory
● swapinfo.d: prints virtual memory info, listing all memory consumers related with virtual memory including the swap physical devices
● pgpginbypid.d: prints information about pages paged in by process id
● minfbypid.d: detects the biggest memory consumer using minor faults, an indication of memory consumption
2007 JavaOneSM Conference – Lab 9520 DTrace for Web 2.0 Technologies | Angelo Rajadurai | 65
DTrace Toolkit● Network
● These scripts analyse the activity of the network interfaces and the TCP/IP stack. Some scripts are using the mib provider. Used to monitor incoming
● icmpstat.d: reports ICMP statistics per second, based on mib● tcpstat.d: prints TCP statistics every second, retrieved from
the mib provider: TCP bytes received and sent, TCP bytes retransmitted
● udpstat.d: prints UDP statistics every second, retrieved from the mib provider
● tcpsnoop.d: analyses TCP network packets and prints the responsible PID and UID. Useful to detect which processes are causing TCP traffic.
2007 JavaOneSM Conference – Lab 9520 DTrace for Web 2.0 Technologies | Angelo Rajadurai | 66
DTrace Toolkit● Network
● connections: prints the inbound TCP connections. This displays the PID and command name of the processes accepting connections
● tcptop: display top TCP network packets by process. It can help identify which processes are causing TCP traffic
● tcpwdist.d: measures the size of writes from applications to the TCP level. It can help identify which process is creating network traffic
2007 JavaOneSM Conference – Lab 9520 DTrace for Web 2.0 Technologies | Angelo Rajadurai | 67
DTrace Toolkit● Process
● Analyses process activity: system calls/process, bytes written or read by process, files opened by process,
● sampleproc: inspect how much CPU the application is using● threaded.d: see how well a multithreaded application uses its
threads● writebytes.d: how many bytes are written by process● readbytes.d: how many bytes are read by process● kill.d: a kill inspector. What how signals are send to what
applications● newproc.d: snoop new processes as they are executed.
2007 JavaOneSM Conference – Lab 9520 DTrace for Web 2.0 Technologies | Angelo Rajadurai | 68
DTrace Toolkit● Process
● syscallbyproc.d & syscallbypid.d: system calls by process or by PID
● filebyproc.d: files opened by process● fddist: a file descriptor reporter, used to print distributions for
read and write events by file descriptor, by process. Used to determine which file descriptor a process is doing the most I/O with
● pathopens.d: prints a count of the number of times files have been successfully opened
● rwbypid.d: reports the no. of read/writes calls by PID● rwbytype.d: identifies the vnode type of read/write activity -
whether that is for regular files, sockets, character special devices
2007 JavaOneSM Conference – Lab 9520 DTrace for Web 2.0 Technologies | Angelo Rajadurai | 69
DTrace Toolkit● Process
● sigdist.d: prints the number of signals received by process and the signal number
● topsysproc: a report utility listing top number of system calls by process
● pfilestat: prints I/O statistics for each file descriptor within a process. Very useful for debug certain processes
● stacksize.d: measures the stack size for running threads● crash.d: reports about crashed applications. Useful to identify
the last seconds of a crashed application● shortlived.d: snoops the short life activity of some processes
2007 JavaOneSM Conference – Lab 9520 DTrace for Web 2.0 Technologies | Angelo Rajadurai | 70
DTrace Toolkit● System
● Used to measure system wide activity● uname-a.d: simulates 'uname -a' in D● syscallbysysc.d: reports a total on the number od system
calls on the system● sar-c.d: reports system calls usage similar to 'sar -c'● topsyscall: prints a report of the top system calls on the
system
2007 JavaOneSM Conference – Lab 9520 DTrace for Web 2.0 Technologies | Angelo Rajadurai | 71
DTrace Performance ScenariosDTrace for those with a day job!
2007 JavaOneSM Conference – Lab 9520 DTrace for Web 2.0 Technologies | Angelo Rajadurai | 72
DTrace for every day use.● We now move on how to apply DTrace for your day job.● We look at some broad guide lines and then talk about some
more detailed scenarios.● The goal of this section is to provide you with some ideas on how
to use DTrace.● I have heavily borrowed from Benoit Chaffanjon's presentation for
this section – Thanks.
An Ounce of Data is worth more than many pounds of opinions.
2007 JavaOneSM Conference – Lab 9520 DTrace for Web 2.0 Technologies | Angelo Rajadurai | 73
Supplement not Replace● One of the first thing to understand is that DTrace supplements
the Solaris tools and does not indent to replace it.● Continue to use tools like
● truss gives you very quick access to syscalls for a given process with some level of aggregation. But watch out for overhead.
● vmstat mpstat iostat almost all real life scenarios will start with using these tools. They are the pillars of performance tuning. Use them to get overview and then use dtrace to dig down deep.
● /proc tools – extremely useful to get quick overview of processes.
● trapstat cpustat sputrack intrstat – Harware statistics.
2007 JavaOneSM Conference – Lab 9520 DTrace for Web 2.0 Technologies | Angelo Rajadurai | 74
Scenarios ● We will look at the following scenarios
1. High user time 2. High system time3. Multi-threaded applications4. High cross calls5. Network traffic6. Disk usage
2007 JavaOneSM Conference – Lab 9520 DTrace for Web 2.0 Technologies | Angelo Rajadurai | 75
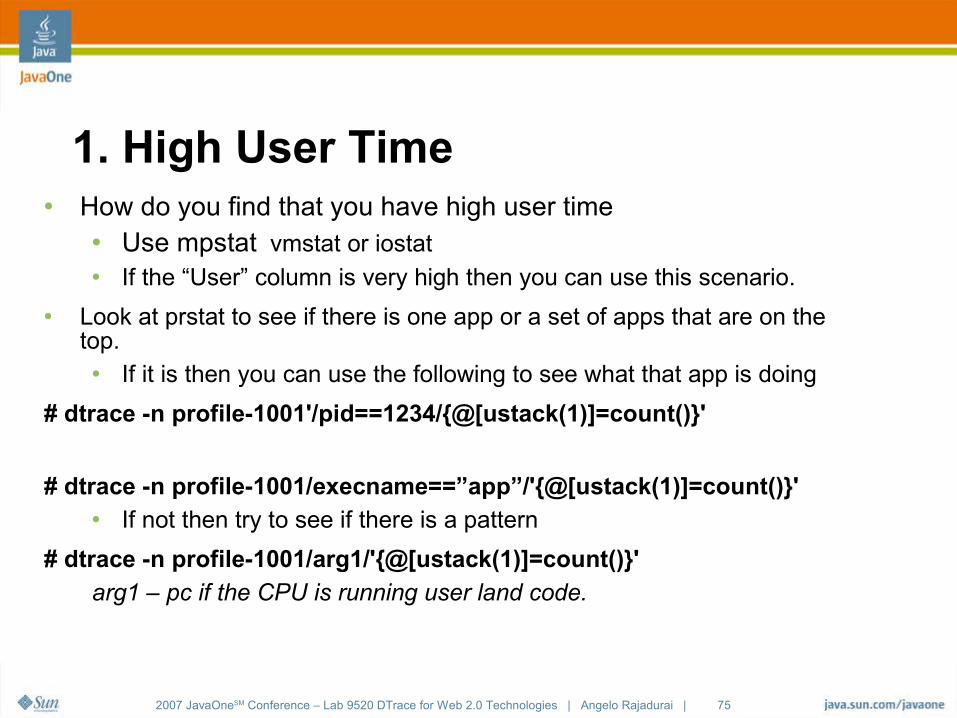
1. High User Time ● How do you find that you have high user time
● Use mpstat vmstat or iostat ● If the “User” column is very high then you can use this scenario.
● Look at prstat to see if there is one app or a set of apps that are on the top.● If it is then you can use the following to see what that app is doing
# dtrace -n profile-1001'/pid==1234/{@[ustack(1)]=count()}'
# dtrace -n profile-1001/execname==”app”/'{@[ustack(1)]=count()}'● If not then try to see if there is a pattern
# dtrace -n profile-1001/arg1/'{@[ustack(1)]=count()}'arg1 – pc if the CPU is running user land code.
2007 JavaOneSM Conference – Lab 9520 DTrace for Web 2.0 Technologies | Angelo Rajadurai | 76
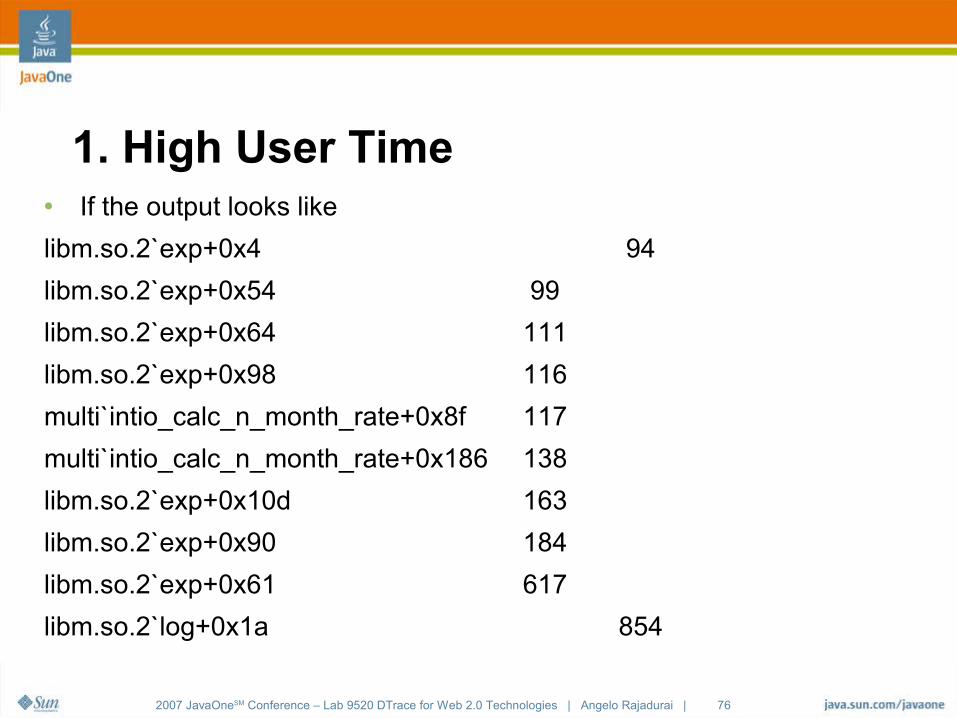
1. High User Time ● If the output looks like
libm.so.2`exp+0x4 94
libm.so.2`exp+0x54 99
libm.so.2`exp+0x64 111
libm.so.2`exp+0x98 116
multi`intio_calc_n_month_rate+0x8f 117
multi`intio_calc_n_month_rate+0x186 138
libm.so.2`exp+0x10d 163
libm.so.2`exp+0x90 184
libm.so.2`exp+0x61 617
libm.so.2`log+0x1a 854
2007 JavaOneSM Conference – Lab 9520 DTrace for Web 2.0 Technologies | Angelo Rajadurai | 77
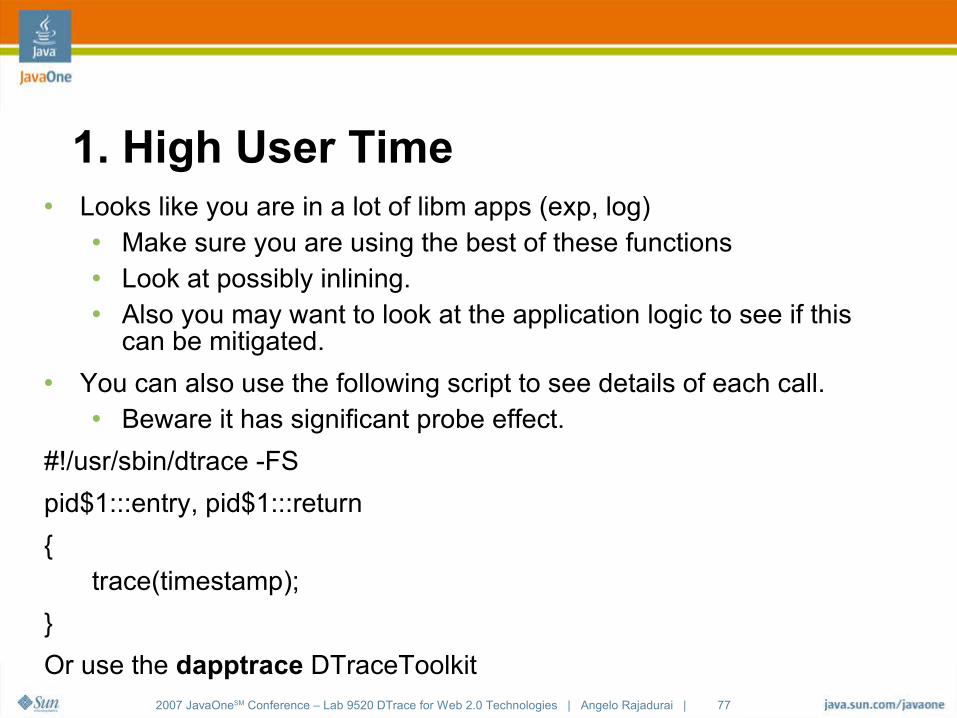
1. High User Time ● Looks like you are in a lot of libm apps (exp, log)
● Make sure you are using the best of these functions● Look at possibly inlining.● Also you may want to look at the application logic to see if this
can be mitigated.● You can also use the following script to see details of each call.
● Beware it has significant probe effect.
#!/usr/sbin/dtrace -FS
pid$1:::entry, pid$1:::return
{trace(timestamp);
}
Or use the dapptrace DTraceToolkit
2007 JavaOneSM Conference – Lab 9520 DTrace for Web 2.0 Technologies | Angelo Rajadurai | 78
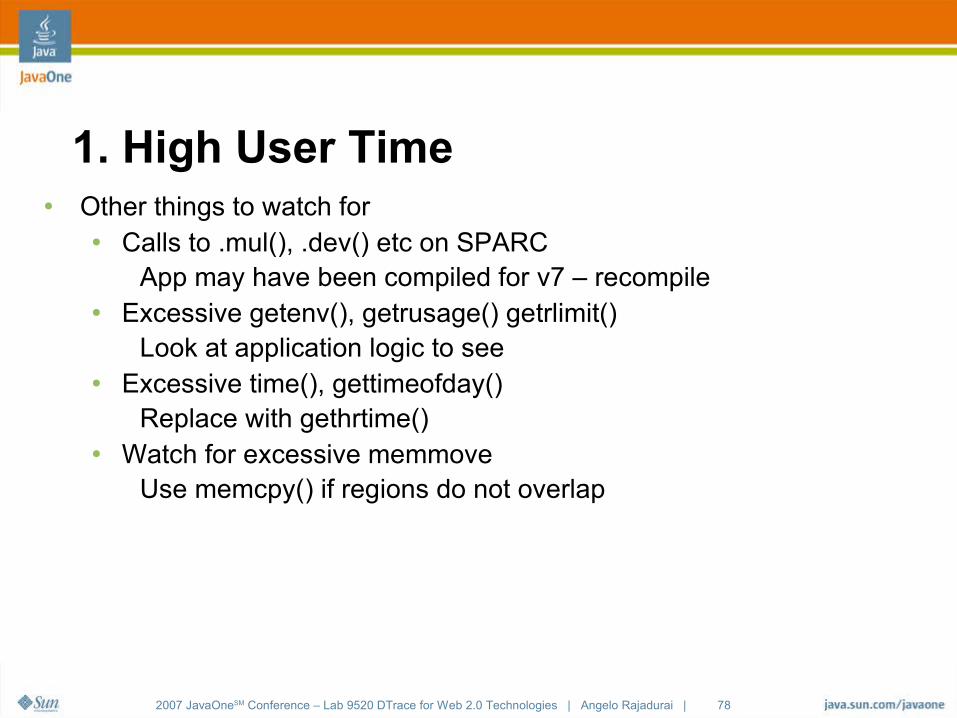
1. High User Time ● Other things to watch for
● Calls to .mul(), .dev() etc on SPARCApp may have been compiled for v7 – recompile
● Excessive getenv(), getrusage() getrlimit()Look at application logic to see
● Excessive time(), gettimeofday()Replace with gethrtime()
● Watch for excessive memmoveUse memcpy() if regions do not overlap
2007 JavaOneSM Conference – Lab 9520 DTrace for Web 2.0 Technologies | Angelo Rajadurai | 79
1. High User Time ● Looks for where mem* apps are coming from
dtrace -n pid1234::mem*:entry'{@[probemod,probefunc]=count()}'● This will print the function and lib name.
● Look for significant FPU usage.● kstat -n fpu_traps
● Consider AMD ● If high FPU usage on T2000s then beware
● Use cooltst to see if the workload fits CMT.● If you do not see one or one class of applications showing up in
the top then look at execsnoop from the toolkit to see if there are a bunch of jobs being started.
2007 JavaOneSM Conference – Lab 9520 DTrace for Web 2.0 Technologies | Angelo Rajadurai | 80
2. High System Time / Calls ● High system Calls
● Look at the vmstat under the Sys Faults● Use the following script to get a quick idea who is causing it.
# dtrace -n syscall:::entry'{@[execname]=count()}'● If you want to look at more details use
# dtrace -n syscall:::entry'{@[execname,probefunc]=count()}'● Use the argN for more details of particular system call.● Example to find what file is being read()/write()/send()/recv() etc
# dtrace -n syscall:::read:entry'{ printf("%s(%d) read file %s\n", execname, pid, fds[arg0].fi_pathname) }'
● Look at topsysproc from the toolkit.

2007 JavaOneSM Conference – Lab 9520 DTrace for Web 2.0 Technologies | Angelo Rajadurai | 81
2. High System Time / Calls ● How to recognize high system time● Look at vmstat under sys time● How to use DTrace ● Following scripts will tell you what execname(pid) is using kernel
# dtrace -n profile-1001'/arg0/{@[execname,pid]=count()}'● If you want to dig deeper and look at where in the kernel you are
# dtrace -n profile-1001'/arg0/{@[stack(1)]=count()}'● If you suspect locking use lockstat to drill down
2007 JavaOneSM Conference – Lab 9520 DTrace for Web 2.0 Technologies | Angelo Rajadurai | 82
3. Multi-threaded apps ● Tools like truss are not enough to analyze threaded apps.● Start with prstat -mL 1
● Look at the Lck section to see if there is high amount of locking
● If so use ploctstat (a dtrace consumer) to better understand.● Pay close attention to locks taken by malloc.
● libc malloc does not scale use libmtmalloc (LD_PRE_LOAD)● If there is a huge use of mutex_locks for small segments of code
just to increment a value replace with atomic ops see atomic_ops(3c)
2007 JavaOneSM Conference – Lab 9520 DTrace for Web 2.0 Technologies | Angelo Rajadurai | 83
4. High Cross Calls ● How to recognize high cross calls
● Use mpstat and see xcalls section● You can use xcals probe to find who is making these calls. ● Look at xcallsbypid.d in the toolkit● Look at the ustack() when making xcalls.
● Some usual culprits are segmap – consider Direct IO● Also look for unneeded munmap/mmaps
2007 JavaOneSM Conference – Lab 9520 DTrace for Web 2.0 Technologies | Angelo Rajadurai | 84
5. Network traffic● The network status utility netstat displays a status of all network
connections on a system. With the current tools there is no easy way to find out and co-relate a network connection with a process or the owner of it
● Extra tools like lsof can list what connections were made and by who What about incoming connections ?
● Solve the problem by using: tcptop, tcpsnoop and connections utilities from DTT● tcpsnoop – similar to snoop but just for tcp and light weight● tcptop – finally a top for tcp traffic● connections – watch the connections being made in the
system
2007 JavaOneSM Conference – Lab 9520 DTrace for Web 2.0 Technologies | Angelo Rajadurai | 85
6. Disk I/O● Disk utilisation can be monitored using iostat but to co-relate the
utilisation with a process is a hard mission● There are tools to check CPU usage by process but there are no
tools to check disk I/O by process● The old good friend: iostat -xnmp I/O type: reading iostat data a
SysAdmin can not describe if the I/O is sequential or random● It is important to know what type of I/O there is: sequential or
random● How can you list what processes are generating I/O, or list disk
events or how much a process is using the disk (size of the disk event or the service time of the disk events) ?
● Easily use the following DTT scripts: iotop, iosnoop from DTT root directory. Look at bitsize.d, seeksize.d iopattern
● Try dtrace -n io:::start'{printf(“%s(%d) \n”, execname, pid, args[0]->b_count)}'
2007 JavaOneSM Conference – Lab 9520 DTrace for Web 2.0 Technologies | Angelo Rajadurai | 86
DTrace for C AppsFor thos who debate K&R or ANCII
2007 JavaOneSM Conference – Lab 9520 DTrace for Web 2.0 Technologies | Angelo Rajadurai | 87
The pid Provider● The pid Provider is extremely flexible and allowing you to
instrument any instruction in user land including entry and exit.● pid provider creates probes on the fly when they are needed. This
is why they do not appear in the dtrace -l listing● We will see how to use the pid provider to trace
Function BoundariesAny arbitrary instruction in a given function
2007 JavaOneSM Conference – Lab 9520 DTrace for Web 2.0 Technologies | Angelo Rajadurai | 88
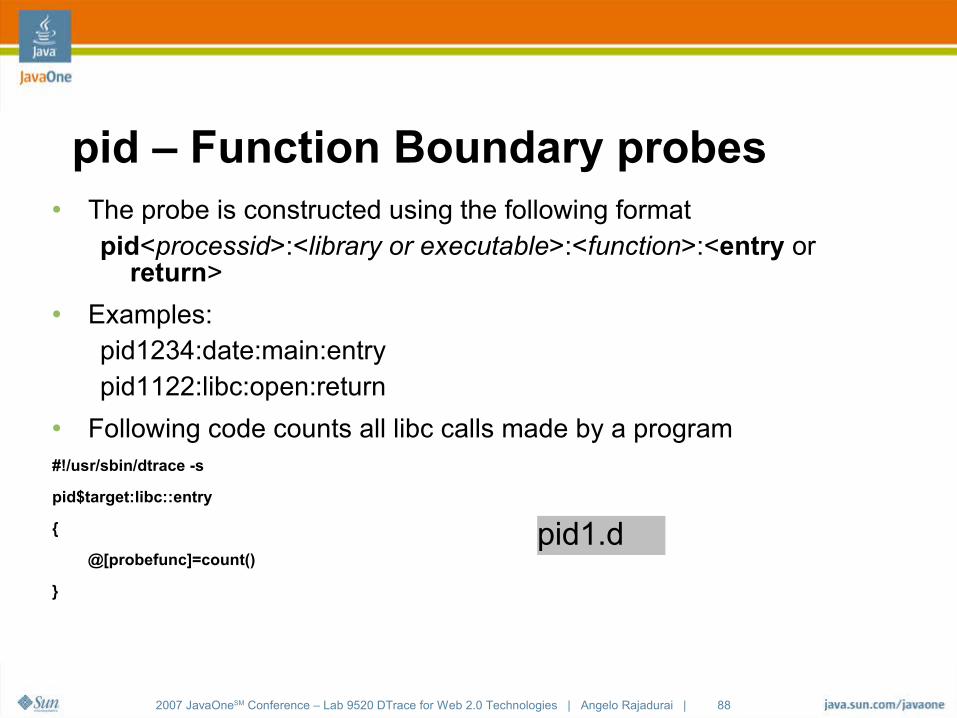
pid – Function Boundary probes● The probe is constructed using the following format
pid<processid>:<library or executable>:<function>:<entry or return>
● Examples:pid1234:date:main:entrypid1122:libc:open:return
● Following code counts all libc calls made by a program#!/usr/sbin/dtrace -s
pid$target:libc::entry
{
@[probefunc]=count()
}
pid1.d
2007 JavaOneSM Conference – Lab 9520 DTrace for Web 2.0 Technologies | Angelo Rajadurai | 89
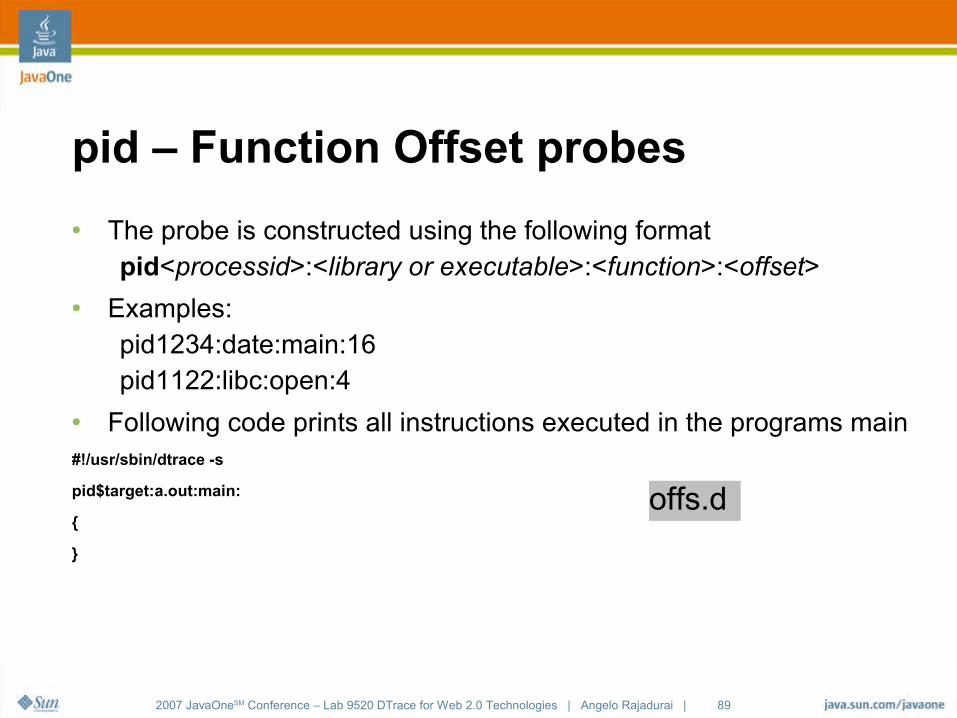
pid – Function Offset probes
● The probe is constructed using the following formatpid<processid>:<library or executable>:<function>:<offset>
● Examples:pid1234:date:main:16pid1122:libc:open:4
● Following code prints all instructions executed in the programs main#!/usr/sbin/dtrace -s
pid$target:a.out:main:
{
}
offs.d
2007 JavaOneSM Conference – Lab 9520 DTrace for Web 2.0 Technologies | Angelo Rajadurai | 90
DTrace User Process● DTrace provides a lot of features to probe into the
user process● We will look at routines that are specific to user code
tracing.● Some examples of using DTrace in user code will be
discussed● We will talk about “modifying” user process state
● A real neat example is discussed● This could be used in fault injection
2007 JavaOneSM Conference – Lab 9520 DTrace for Web 2.0 Technologies | Angelo Rajadurai | 91
Action & Subroutines● There are a few actions and subroutines that are useful for user land
dtrace.● ustack(<int nframes>, <int strsize>) - records user process stack.
nframes – specifies the number of frames to recordstrsize – if this is specified and non 0 then the address to name
translation is done when the stack is recorded into a buffer of
strsize. This will avoid problem with address to name
translation in user land when the process may have exited
For java code analysis you'd need Java 1.5 to use this ustack() functionality (see example)
2007 JavaOneSM Conference – Lab 9520 DTrace for Web 2.0 Technologies | Angelo Rajadurai | 92
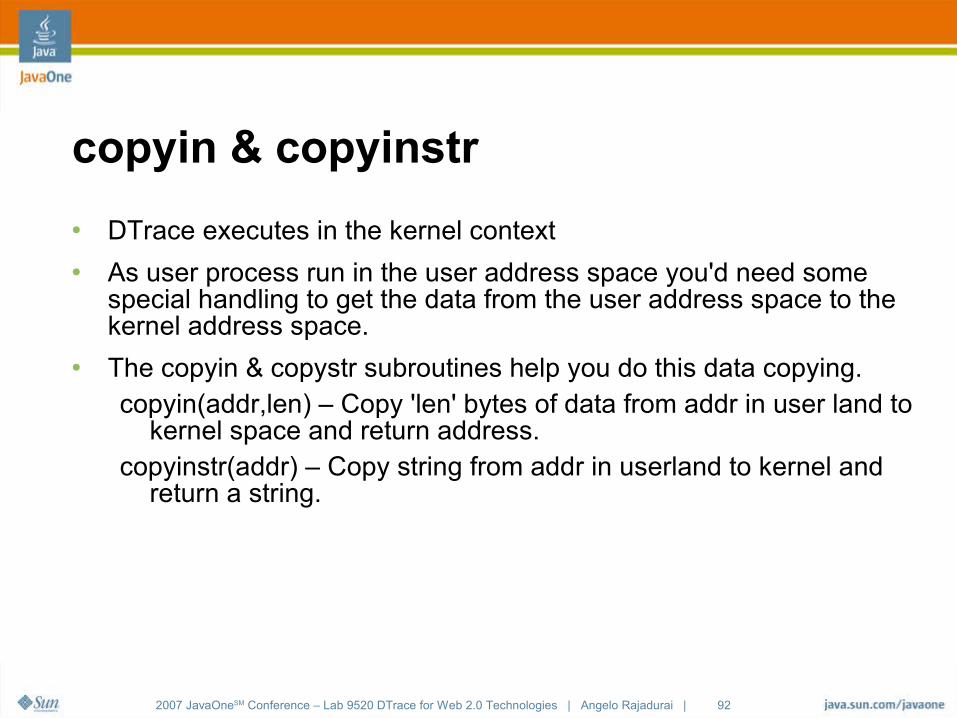
copyin & copyinstr
● DTrace executes in the kernel context● As user process run in the user address space you'd need some
special handling to get the data from the user address space to the kernel address space.
● The copyin & copystr subroutines help you do this data copying.copyin(addr,len) – Copy 'len' bytes of data from addr in user land to
kernel space and return address.copyinstr(addr) – Copy string from addr in userland to kernel and
return a string.
2007 JavaOneSM Conference – Lab 9520 DTrace for Web 2.0 Technologies | Angelo Rajadurai | 93
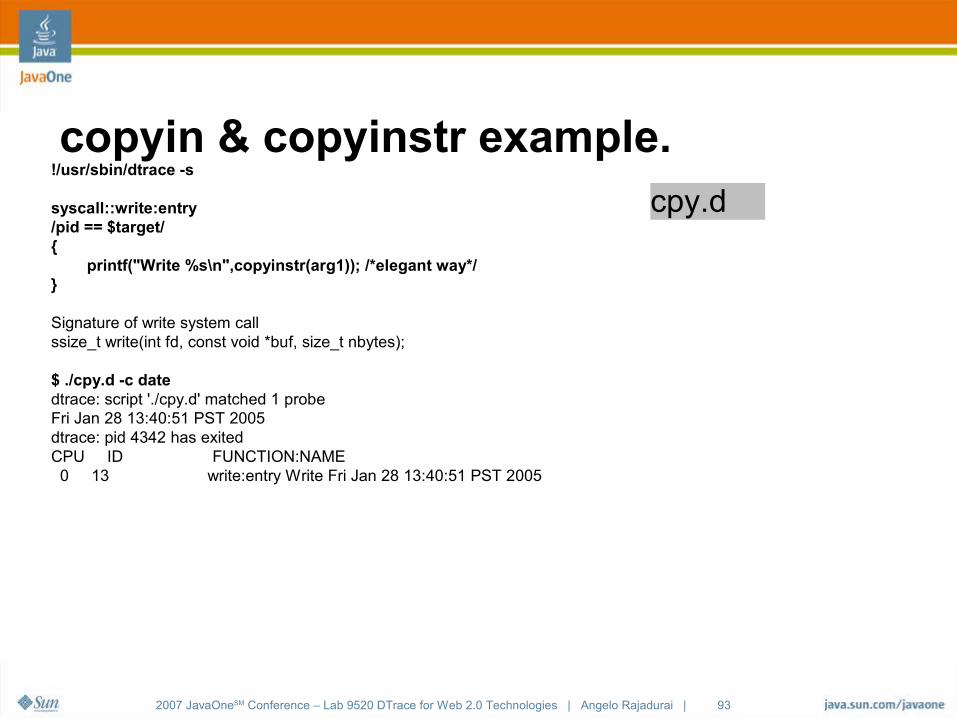
copyin & copyinstr example.!/usr/sbin/dtrace -s
syscall::write:entry/pid == $target/{ printf("Write %s\n",copyinstr(arg1)); /*elegant way*/}
Signature of write system callssize_t write(int fd, const void *buf, size_t nbytes);
$ ./cpy.d -c datedtrace: script './cpy.d' matched 1 probeFri Jan 28 13:40:51 PST 2005dtrace: pid 4342 has exitedCPU ID FUNCTION:NAME 0 13 write:entry Write Fri Jan 28 13:40:51 PST 2005
cpy.d
2007 JavaOneSM Conference – Lab 9520 DTrace for Web 2.0 Technologies | Angelo Rajadurai | 94
DTrace - Destructive actionsHow to use DTrace for more than just observation
2007 JavaOneSM Conference – Lab 9520 DTrace for Web 2.0 Technologies | Angelo Rajadurai | 95
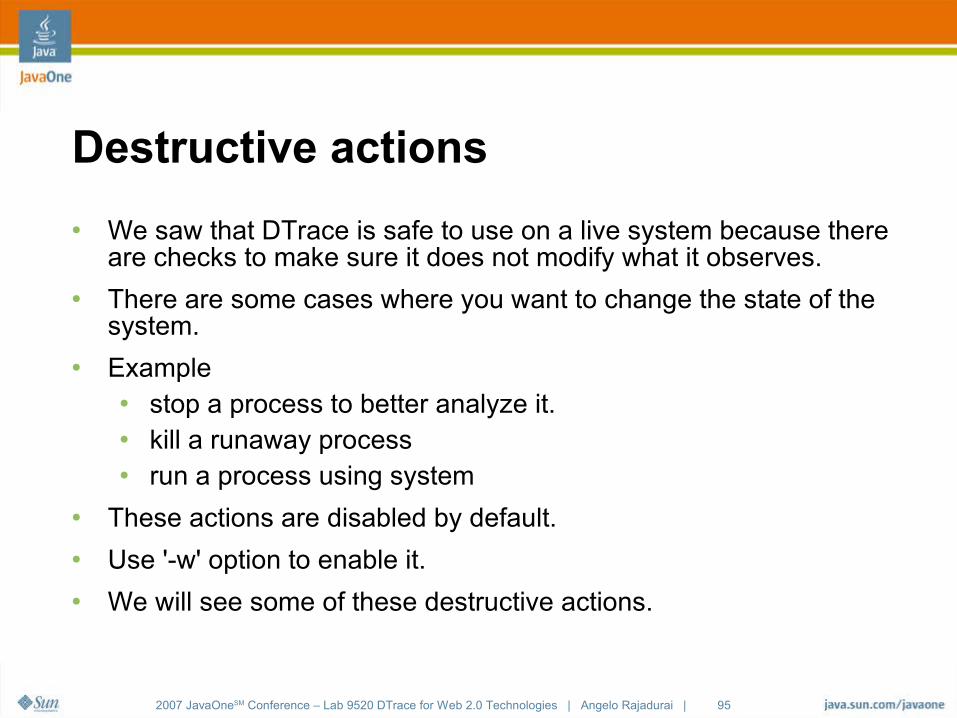
Destructive actions
● We saw that DTrace is safe to use on a live system because there are checks to make sure it does not modify what it observes.
● There are some cases where you want to change the state of the system.
● Example● stop a process to better analyze it.● kill a runaway process● run a process using system
● These actions are disabled by default. ● Use '-w' option to enable it.● We will see some of these destructive actions.
2007 JavaOneSM Conference – Lab 9520 DTrace for Web 2.0 Technologies | Angelo Rajadurai | 96
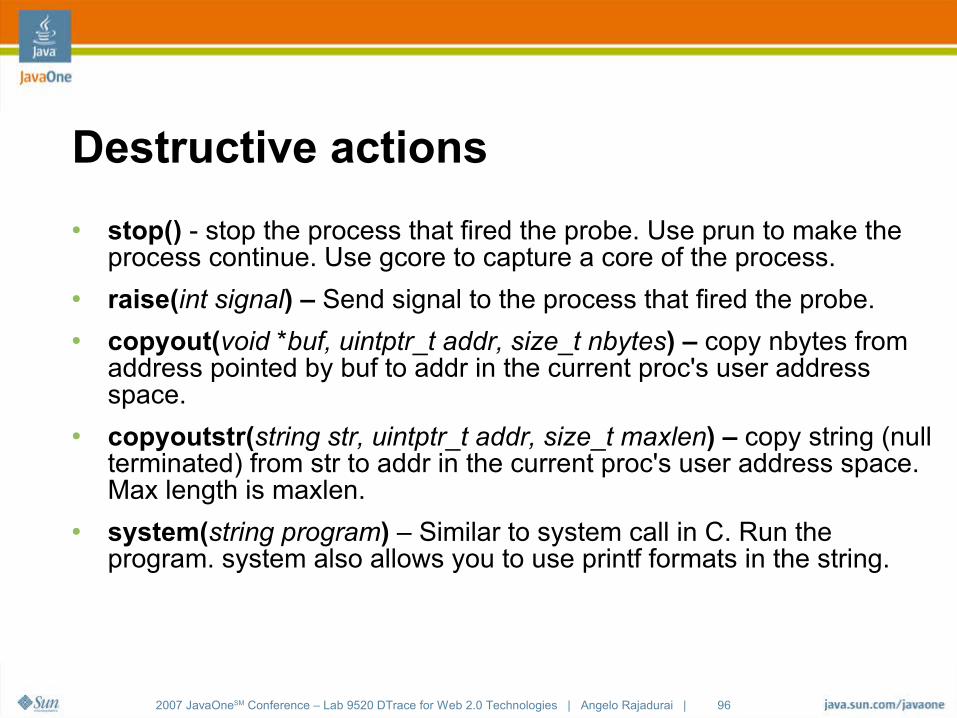
Destructive actions
● stop() - stop the process that fired the probe. Use prun to make the process continue. Use gcore to capture a core of the process.
● raise(int signal) – Send signal to the process that fired the probe.● copyout(void *buf, uintptr_t addr, size_t nbytes) – copy nbytes from
address pointed by buf to addr in the current proc's user address space.
● copyoutstr(string str, uintptr_t addr, size_t maxlen) – copy string (null terminated) from str to addr in the current proc's user address space. Max length is maxlen.
● system(string program) – Similar to system call in C. Run the program. system also allows you to use printf formats in the string.
2007 JavaOneSM Conference – Lab 9520 DTrace for Web 2.0 Technologies | Angelo Rajadurai | 97
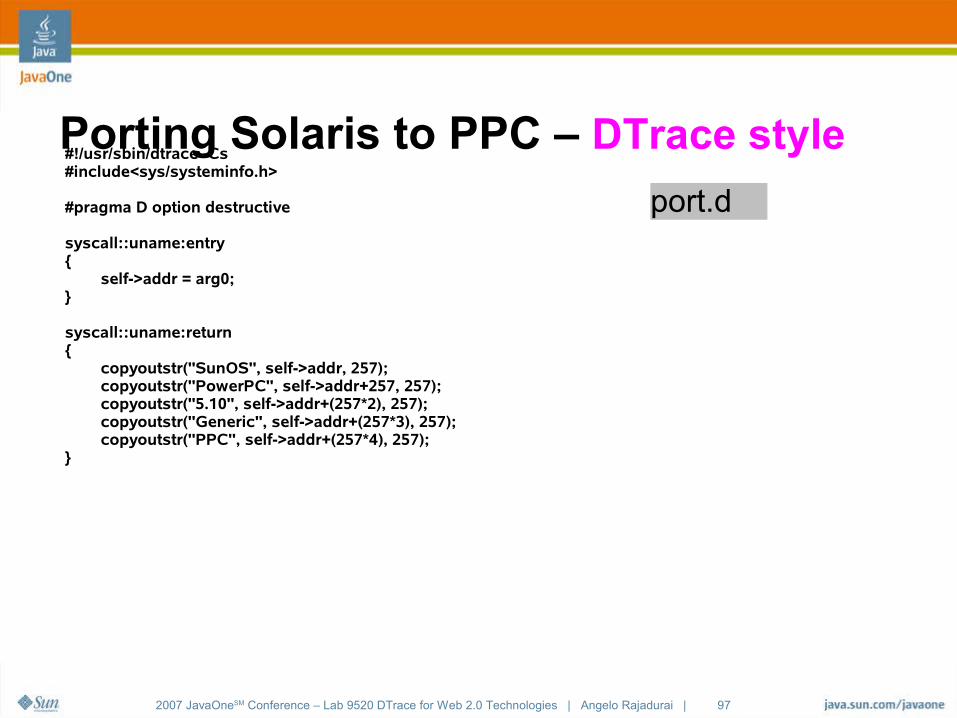
Porting Solaris to PPC – DTrace style#!/usr/sbin/dtrace -Cs#include<sys/systeminfo.h>
#pragma D option destructive
syscall::uname:entry{ self->addr = arg0;}
syscall::uname:return{ copyoutstr("SunOS", self->addr, 257); copyoutstr("PowerPC", self->addr+257, 257); copyoutstr("5.10", self->addr+(257*2), 257); copyoutstr("Generic", self->addr+(257*3), 257); copyoutstr("PPC", self->addr+(257*4), 257);}
port.d
2007 JavaOneSM Conference – Lab 9520 DTrace for Web 2.0 Technologies | Angelo Rajadurai | 98
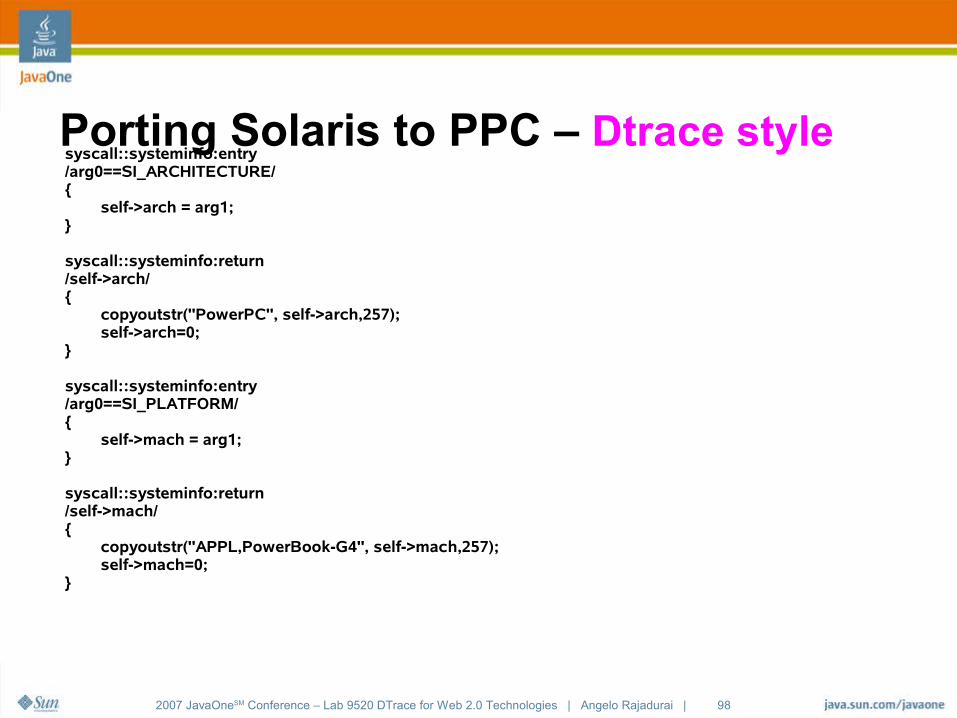
Porting Solaris to PPC – Dtrace stylesyscall::systeminfo:entry/arg0==SI_ARCHITECTURE/{ self->arch = arg1;}
syscall::systeminfo:return/self->arch/{ copyoutstr("PowerPC", self->arch,257); self->arch=0;}
syscall::systeminfo:entry/arg0==SI_PLATFORM/{ self->mach = arg1;}
syscall::systeminfo:return/self->mach/{ copyoutstr("APPL,PowerBook-G4", self->mach,257); self->mach=0;}
2007 JavaOneSM Conference – Lab 9520 DTrace for Web 2.0 Technologies | Angelo Rajadurai | 99
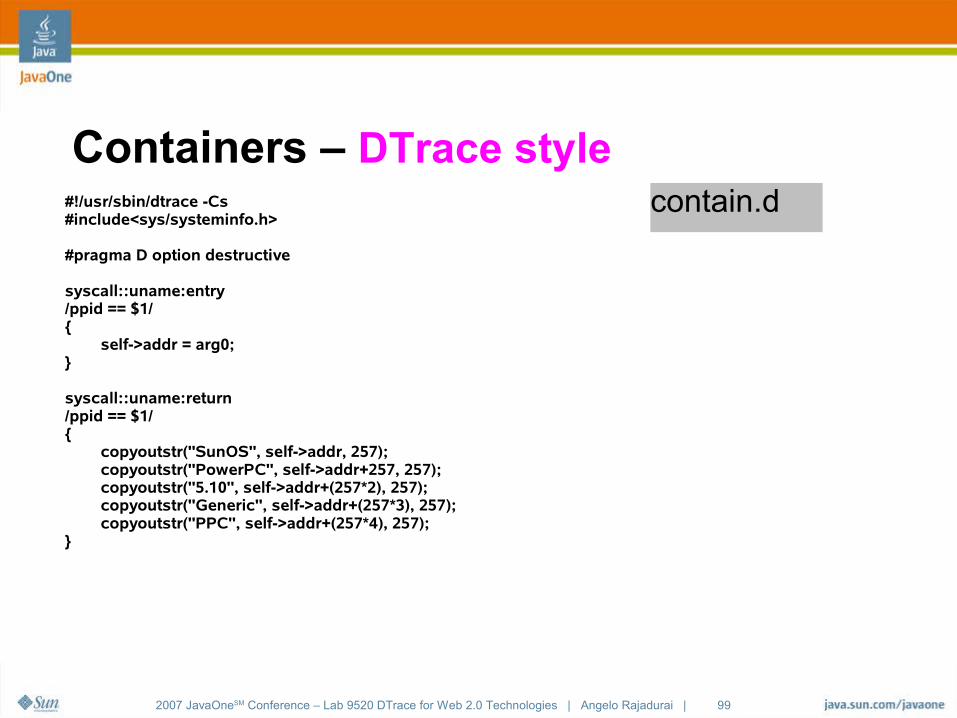
Containers – DTrace style#!/usr/sbin/dtrace -Cs#include<sys/systeminfo.h>
#pragma D option destructive
syscall::uname:entry/ppid == $1/{ self->addr = arg0;}
syscall::uname:return/ppid == $1/{ copyoutstr("SunOS", self->addr, 257); copyoutstr("PowerPC", self->addr+257, 257); copyoutstr("5.10", self->addr+(257*2), 257); copyoutstr("Generic", self->addr+(257*3), 257); copyoutstr("PPC", self->addr+(257*4), 257);}
contain.d
2007 JavaOneSM Conference – Lab 9520 DTrace for Web 2.0 Technologies | Angelo Rajadurai | 100
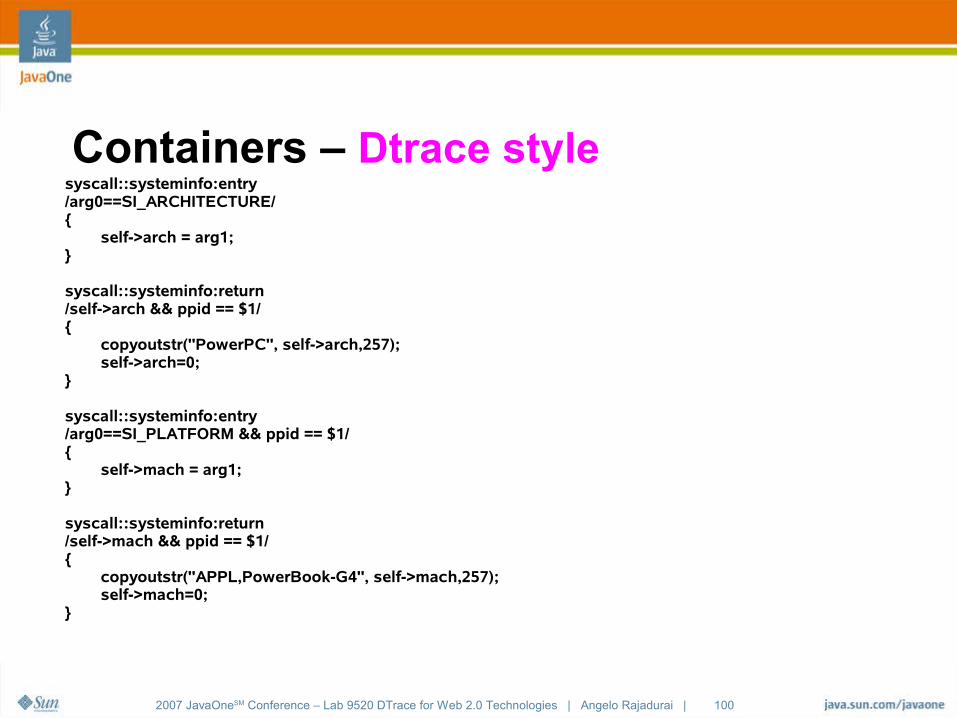
Containers – Dtrace stylesyscall::systeminfo:entry/arg0==SI_ARCHITECTURE/{ self->arch = arg1;}
syscall::systeminfo:return/self->arch && ppid == $1/{ copyoutstr("PowerPC", self->arch,257); self->arch=0;}
syscall::systeminfo:entry/arg0==SI_PLATFORM && ppid == $1/{ self->mach = arg1;}
syscall::systeminfo:return/self->mach && ppid == $1/{ copyoutstr("APPL,PowerBook-G4", self->mach,257); self->mach=0;}
2007 JavaOneSM Conference – Lab 9520 DTrace for Web 2.0 Technologies | Angelo Rajadurai | 101
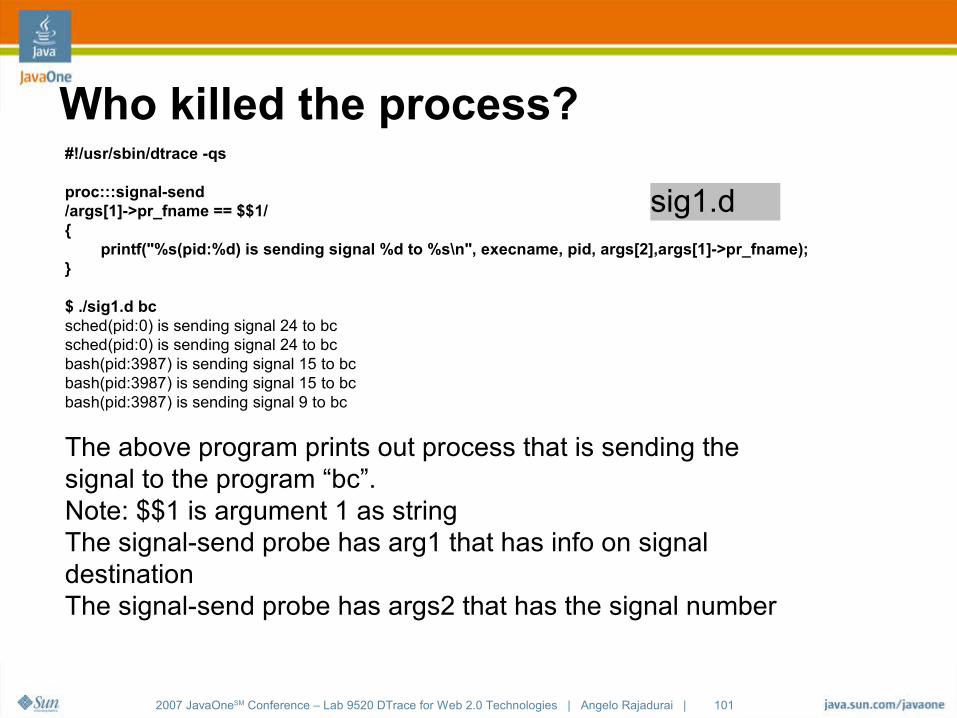
Who killed the process?#!/usr/sbin/dtrace -qs
proc:::signal-send/args[1]->pr_fname == $$1/{ printf("%s(pid:%d) is sending signal %d to %s\n", execname, pid, args[2],args[1]->pr_fname);}
$ ./sig1.d bcsched(pid:0) is sending signal 24 to bcsched(pid:0) is sending signal 24 to bcbash(pid:3987) is sending signal 15 to bcbash(pid:3987) is sending signal 15 to bcbash(pid:3987) is sending signal 9 to bc
The above program prints out process that is sending the signal to the program “bc”. Note: $$1 is argument 1 as stringThe signal-send probe has arg1 that has info on signal destinationThe signal-send probe has args2 that has the signal number
sig1.d
2007 JavaOneSM Conference – Lab 9520 DTrace for Web 2.0 Technologies | Angelo Rajadurai | 102
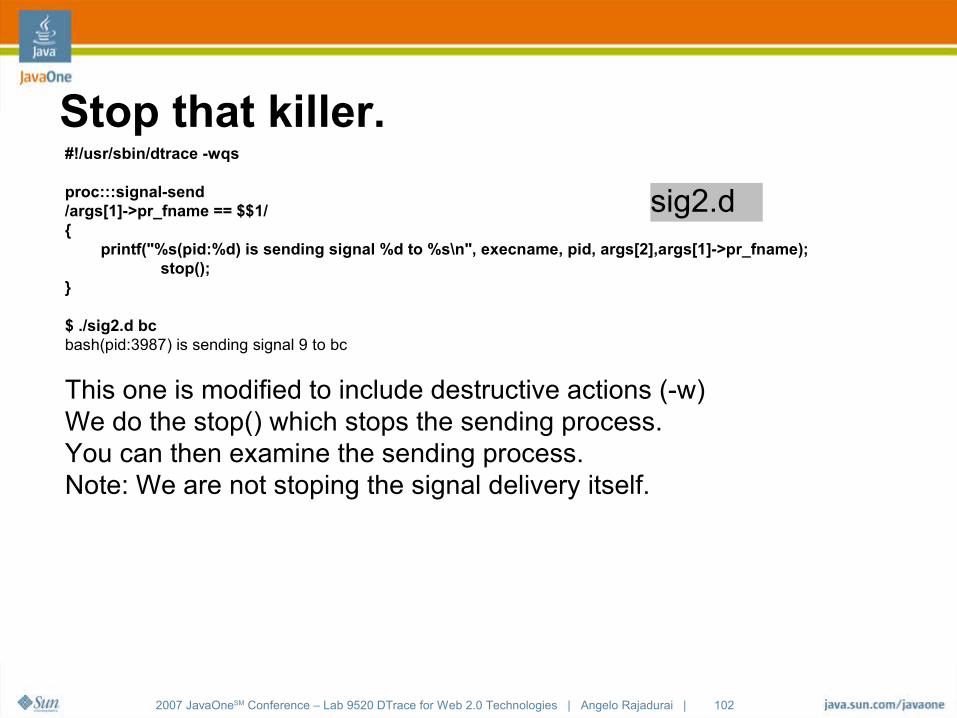
Stop that killer.#!/usr/sbin/dtrace -wqs
proc:::signal-send/args[1]->pr_fname == $$1/{ printf("%s(pid:%d) is sending signal %d to %s\n", execname, pid, args[2],args[1]->pr_fname);
stop();}
$ ./sig2.d bcbash(pid:3987) is sending signal 9 to bc
This one is modified to include destructive actions (-w)We do the stop() which stops the sending process. You can then examine the sending process.Note: We are not stoping the signal delivery itself.
sig2.d
2007 JavaOneSM Conference – Lab 9520 DTrace for Web 2.0 Technologies | Angelo Rajadurai | 103
DTrace for C++From Brian Cantrill to Bjarne Stroustrup!
2007 JavaOneSM Conference – Lab 9520 DTrace for Web 2.0 Technologies | Angelo Rajadurai | 104
C++ Name Mangling
● The C++ compiler mangles symbols● Sun's mangling rules are different from the g++ rules● DTrace cannot demangle the symbols as it does not make an
assumption on the compiler. ● So we need to demangle the symbols for dtrace.● Fortunately due to Unix magic this is pretty simple
dem `nm execname | cut -d'|' -f 8`(OK its not magic. Just do a nm (print symbol list) of an execname.
Cut only the 8th field and use the result as the input to the demagler. If this sounds complicated – Just do it.)
2007 JavaOneSM Conference – Lab 9520 DTrace for Web 2.0 Technologies | Angelo Rajadurai | 105
● We will use a simple example of using DTrace with C++.● A star of an example - staroffice8● Looking at live running staroffice app.● Find the pid of staroffice. “pgrep -l staroffice” works well.● Use oneliner
dtrace -n pid`pgrep soffice.bin`:::entry'{ @[probefunc]=count() }' -o soffice.out
● Stop script after a few minutes to collect info.● Now run the output through c++filt● DEMO
C++ & DTrace example
2007 JavaOneSM Conference – Lab 9520 DTrace for Web 2.0 Technologies | Angelo Rajadurai | 106
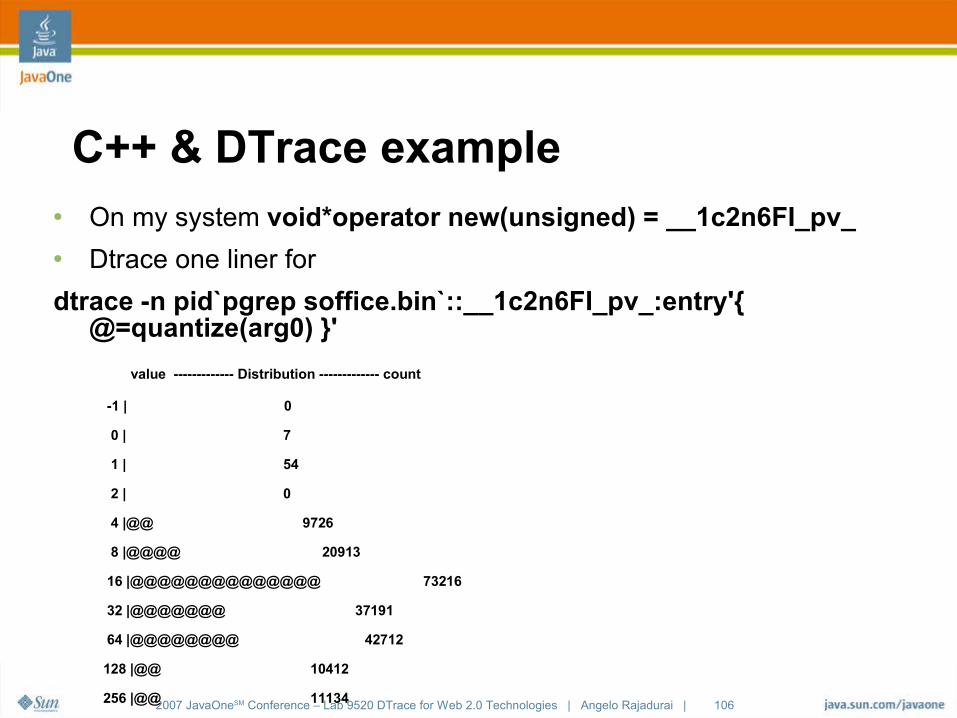
● On my system void*operator new(unsigned) = __1c2n6FI_pv_● Dtrace one liner for
dtrace -n pid`pgrep soffice.bin`::__1c2n6FI_pv_:entry'{ @=quantize(arg0) }'
value ------------- Distribution ------------- count
-1 | 0
0 | 7
1 | 54
2 | 0
4 |@@ 9726
8 |@@@@ 20913
16 |@@@@@@@@@@@@@@ 73216
32 |@@@@@@@ 37191
64 |@@@@@@@@ 42712
128 |@@ 10412
256 |@@ 11134
512 | 1636
1024 | 860
2048 |@ 5315
4096 | 6
C++ & DTrace example
2007 JavaOneSM Conference – Lab 9520 DTrace for Web 2.0 Technologies | Angelo Rajadurai | 107
DTrace and JavaWelcome to the Duke era!

2007 JavaOneSM Conference – Lab 9520 DTrace for Web 2.0 Technologies | Angelo Rajadurai | 108
DTrace and Java
● We already saw how to use ustack() on a java process.● We will see how dtrace can shed more light on...
● When VM starts and ends● When thread starts and ends● When class gets loaded and unloaded● When object allocated and freed● When GC starts and ends● When a method is called and method returns
2007 JavaOneSM Conference – Lab 9520 DTrace for Web 2.0 Technologies | Angelo Rajadurai | 109
DTrace for Java 6.0Tracing Java on a Mustang!
2007 JavaOneSM Conference – Lab 9520 DTrace for Web 2.0 Technologies | Angelo Rajadurai | 110
DTrace and Mustang
● JDK 6.0 (Mustang) has some very interesting embedded DTrace probes. Mustang provides probes in the following areas.● VM lifecycle ● Thread lifecycle● Garbage collection● Classloading● Method compilation● Monitor probes● Method entry and exit probes● JNI probes

2007 JavaOneSM Conference – Lab 9520 DTrace for Web 2.0 Technologies | Angelo Rajadurai | 111
DTrace and Mustang
● We will now look into details on some of these areas.● For each of these areas we will look at
● Probe names● Arguments provided● Sample scripts
2007 JavaOneSM Conference – Lab 9520 DTrace for Web 2.0 Technologies | Angelo Rajadurai | 112
DTrace and Mustang - args● For most of these probes the arguments have the following
format.● First argument gives string data● The second one gives the size
● So to get to the data you'd use the following format str_ptr = (char*) copyin(arg0, arg1+1); str_ptr[arg1] = '\0'; name = (string) self->str_ptr;
● As the arguments are not null terminated we cannot use copyinstr()
● The above code segment add the null termination to the string.● In Solaris.next you can use copyinstr(arg0,arg1).
2007 JavaOneSM Conference – Lab 9520 DTrace for Web 2.0 Technologies | Angelo Rajadurai | 113
DTrace and Mustang – VM life cycle probes
● Probe namesvm-init-begin – Probe fires when JVM initialization startsvm-init-end – Probe fires when JVM initialization ends and JVM
is ready to run user codevm-shutdown – Probe fires when JVM shuts down.
2007 JavaOneSM Conference – Lab 9520 DTrace for Web 2.0 Technologies | Angelo Rajadurai | 114
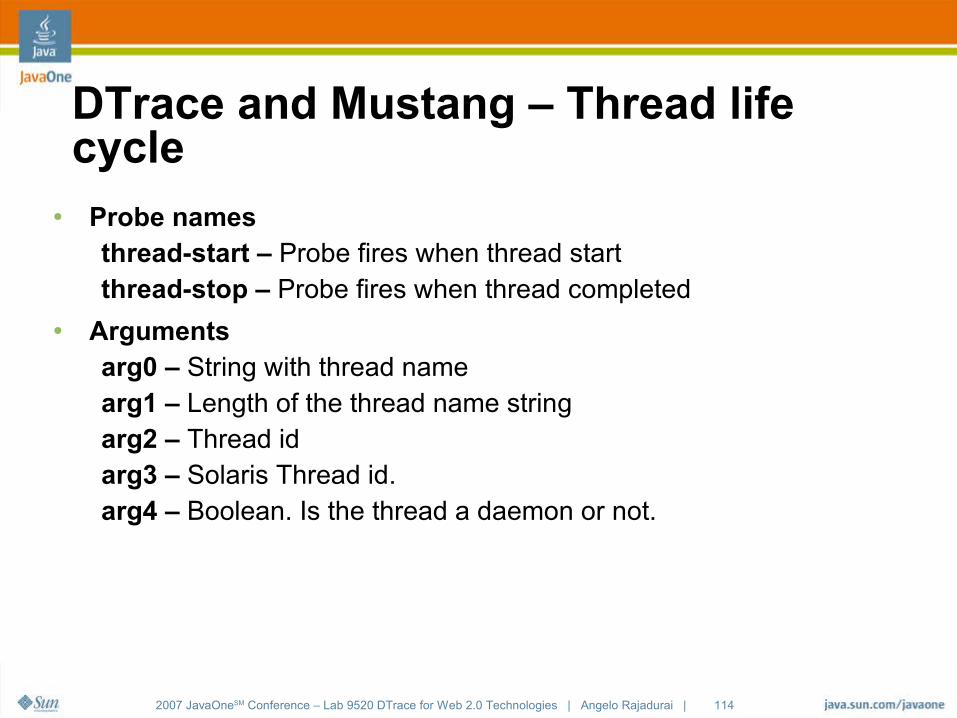
DTrace and Mustang – Thread life cycle
● Probe namesthread-start – Probe fires when thread startthread-stop – Probe fires when thread completed
● Argumentsarg0 – String with thread namearg1 – Length of the thread name stringarg2 – Thread idarg3 – Solaris Thread id.arg4 – Boolean. Is the thread a daemon or not.
2007 JavaOneSM Conference – Lab 9520 DTrace for Web 2.0 Technologies | Angelo Rajadurai | 115
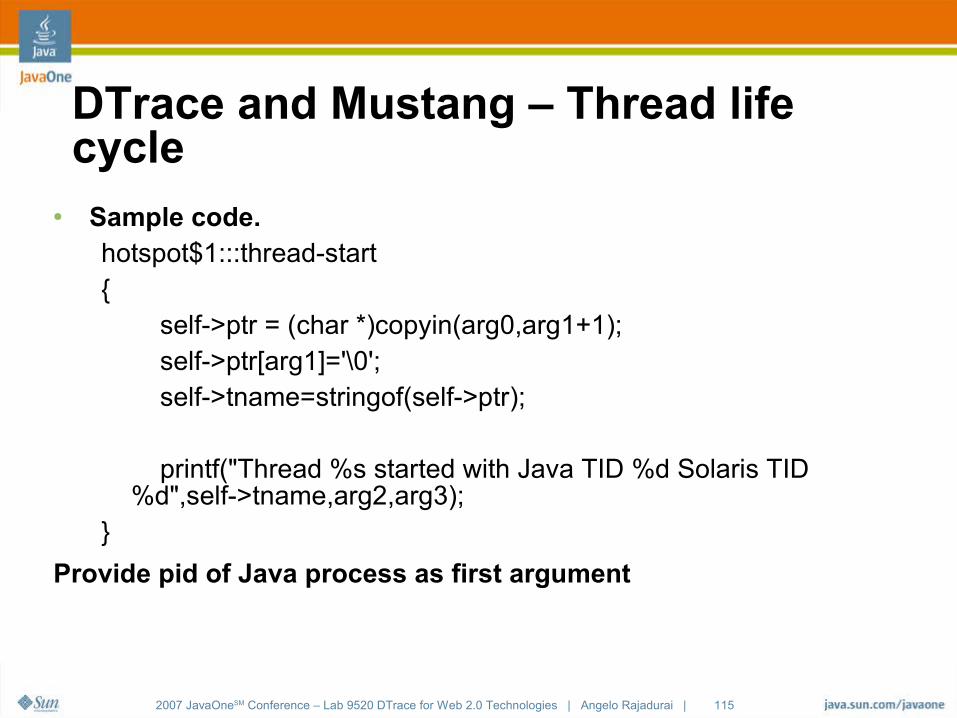
DTrace and Mustang – Thread life cycle
● Sample code.hotspot$1:::thread-start{ self->ptr = (char *)copyin(arg0,arg1+1); self->ptr[arg1]='\0'; self->tname=stringof(self->ptr);
printf("Thread %s started with Java TID %d Solaris TID %d",self->tname,arg2,arg3);
}
Provide pid of Java process as first argument
2007 JavaOneSM Conference – Lab 9520 DTrace for Web 2.0 Technologies | Angelo Rajadurai | 116
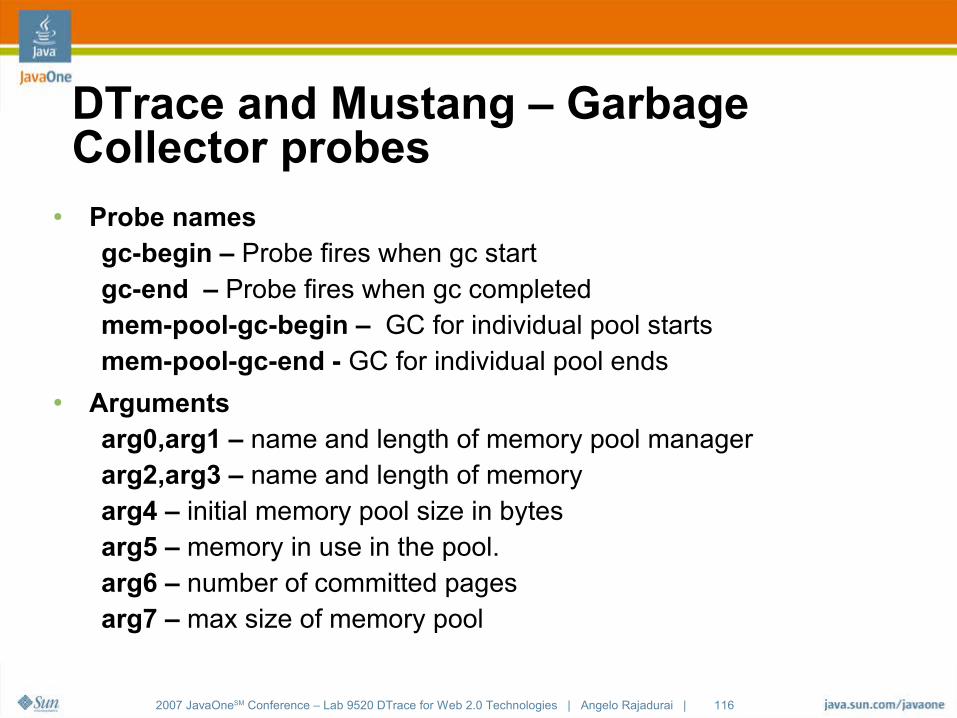
DTrace and Mustang – Garbage Collector probes
● Probe namesgc-begin – Probe fires when gc startgc-end – Probe fires when gc completedmem-pool-gc-begin – GC for individual pool startsmem-pool-gc-end - GC for individual pool ends
● Argumentsarg0,arg1 – name and length of memory pool managerarg2,arg3 – name and length of memoryarg4 – initial memory pool size in bytesarg5 – memory in use in the pool.arg6 – number of committed pages arg7 – max size of memory pool
2007 JavaOneSM Conference – Lab 9520 DTrace for Web 2.0 Technologies | Angelo Rajadurai | 117
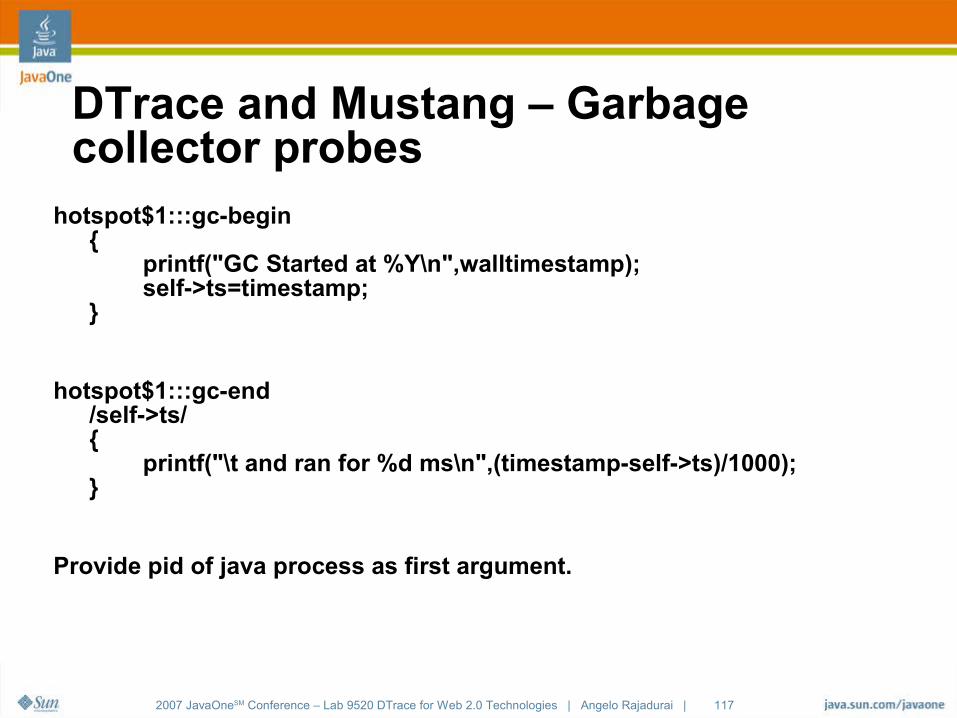
DTrace and Mustang – Garbage collector probes
hotspot$1:::gc-begin{ printf("GC Started at %Y\n",walltimestamp); self->ts=timestamp;}
hotspot$1:::gc-end/self->ts/{ printf("\t and ran for %d ms\n",(timestamp-self->ts)/1000);}
Provide pid of java process as first argument.
2007 JavaOneSM Conference – Lab 9520 DTrace for Web 2.0 Technologies | Angelo Rajadurai | 118
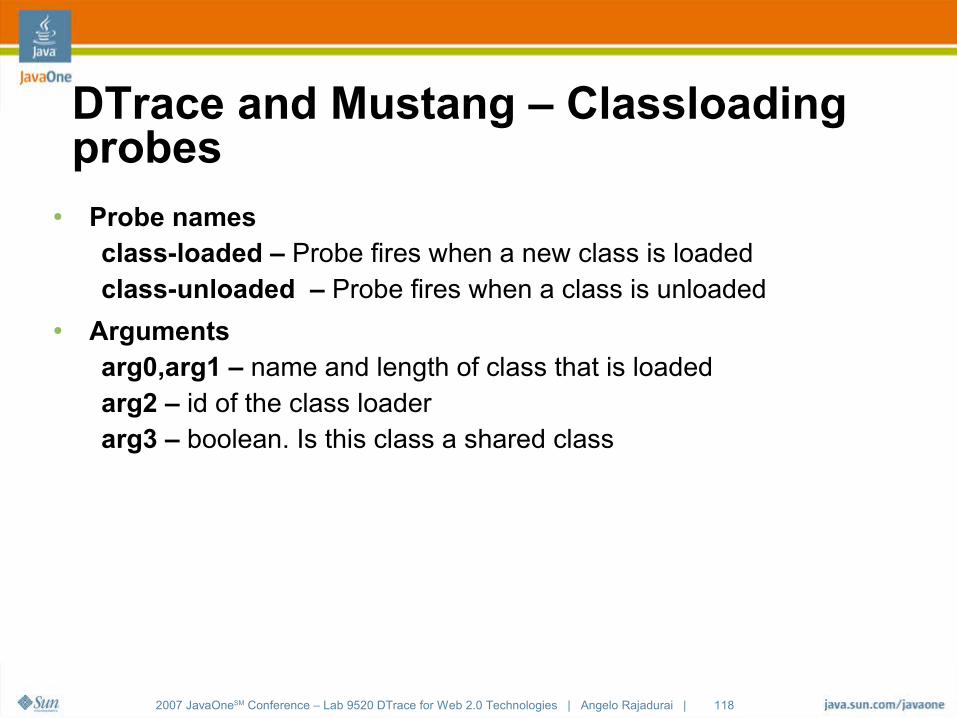
DTrace and Mustang – Classloading probes
● Probe namesclass-loaded – Probe fires when a new class is loadedclass-unloaded – Probe fires when a class is unloaded
● Argumentsarg0,arg1 – name and length of class that is loadedarg2 – id of the class loaderarg3 – boolean. Is this class a shared class
2007 JavaOneSM Conference – Lab 9520 DTrace for Web 2.0 Technologies | Angelo Rajadurai | 119
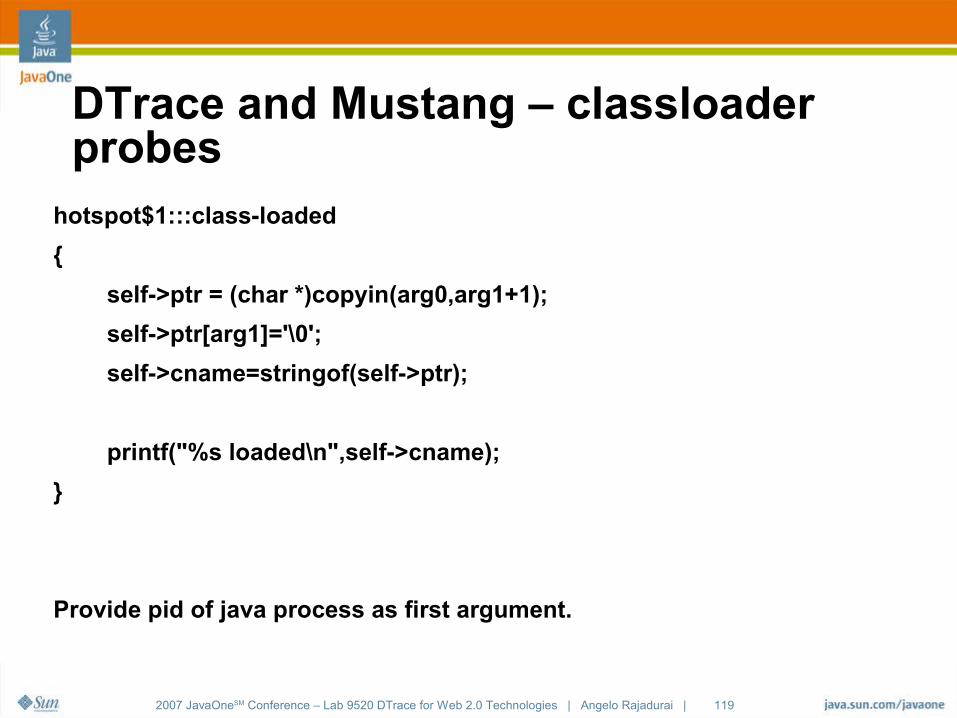
DTrace and Mustang – classloader probes
hotspot$1:::class-loaded
{
self->ptr = (char *)copyin(arg0,arg1+1);
self->ptr[arg1]='\0';
self->cname=stringof(self->ptr);
printf("%s loaded\n",self->cname);
}
Provide pid of java process as first argument.
2007 JavaOneSM Conference – Lab 9520 DTrace for Web 2.0 Technologies | Angelo Rajadurai | 120
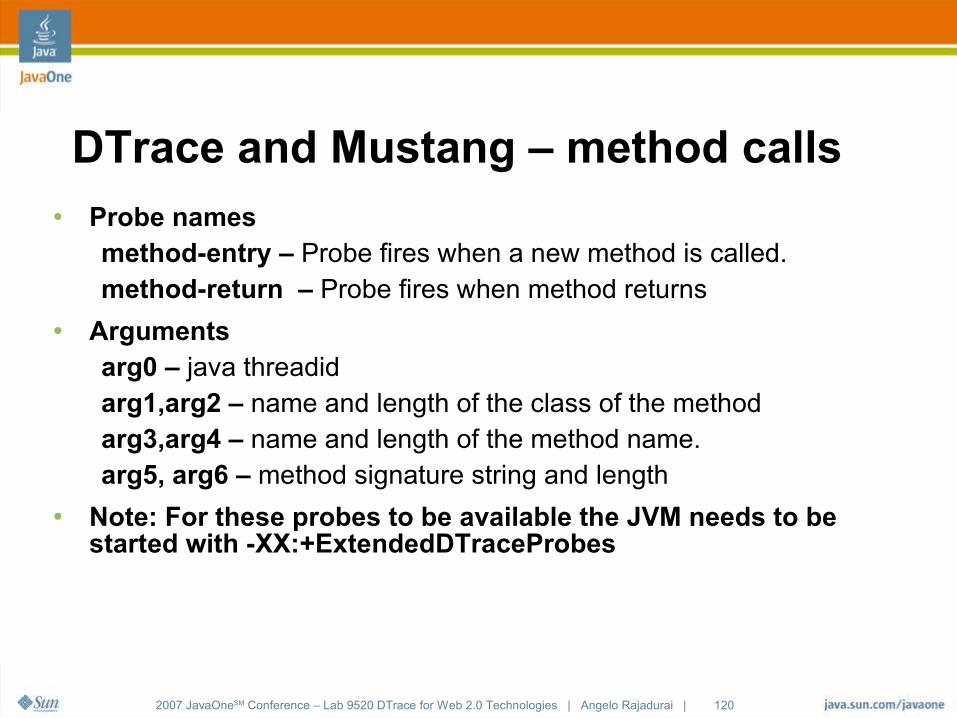
DTrace and Mustang – method calls● Probe names
method-entry – Probe fires when a new method is called.method-return – Probe fires when method returns
● Argumentsarg0 – java threadidarg1,arg2 – name and length of the class of the methodarg3,arg4 – name and length of the method name.arg5, arg6 – method signature string and length
● Note: For these probes to be available the JVM needs to be started with -XX:+ExtendedDTraceProbes
2007 JavaOneSM Conference – Lab 9520 DTrace for Web 2.0 Technologies | Angelo Rajadurai | 121
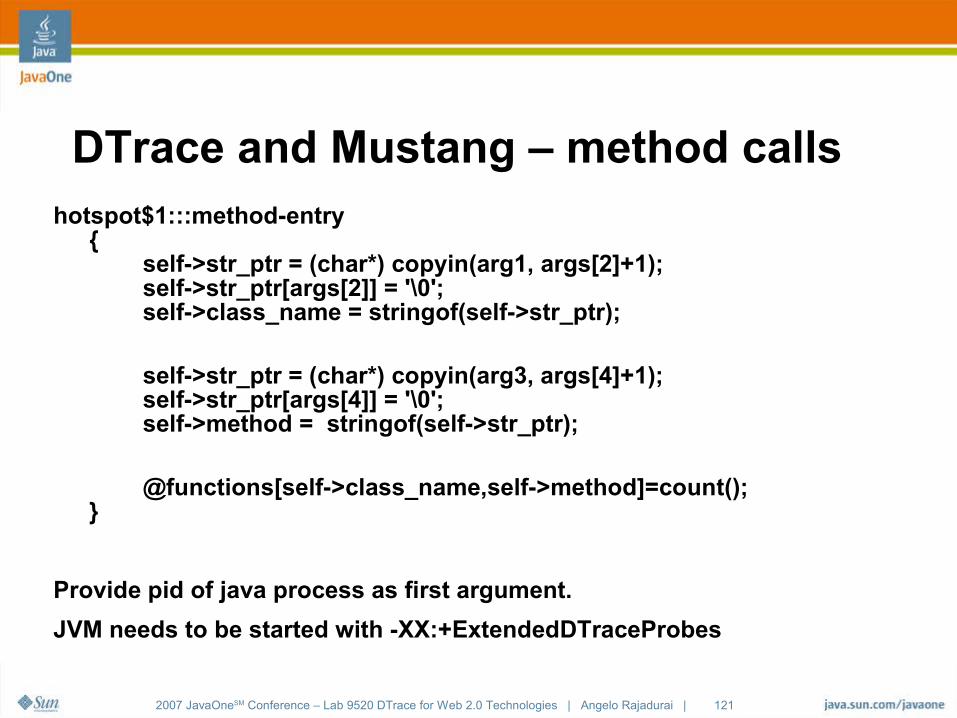
DTrace and Mustang – method callshotspot$1:::method-entry
{ self->str_ptr = (char*) copyin(arg1, args[2]+1); self->str_ptr[args[2]] = '\0'; self->class_name = stringof(self->str_ptr);
self->str_ptr = (char*) copyin(arg3, args[4]+1); self->str_ptr[args[4]] = '\0'; self->method = stringof(self->str_ptr);
@functions[self->class_name,self->method]=count();}
Provide pid of java process as first argument.
JVM needs to be started with -XX:+ExtendedDTraceProbes
2007 JavaOneSM Conference – Lab 9520 DTrace for Web 2.0 Technologies | Angelo Rajadurai | 122
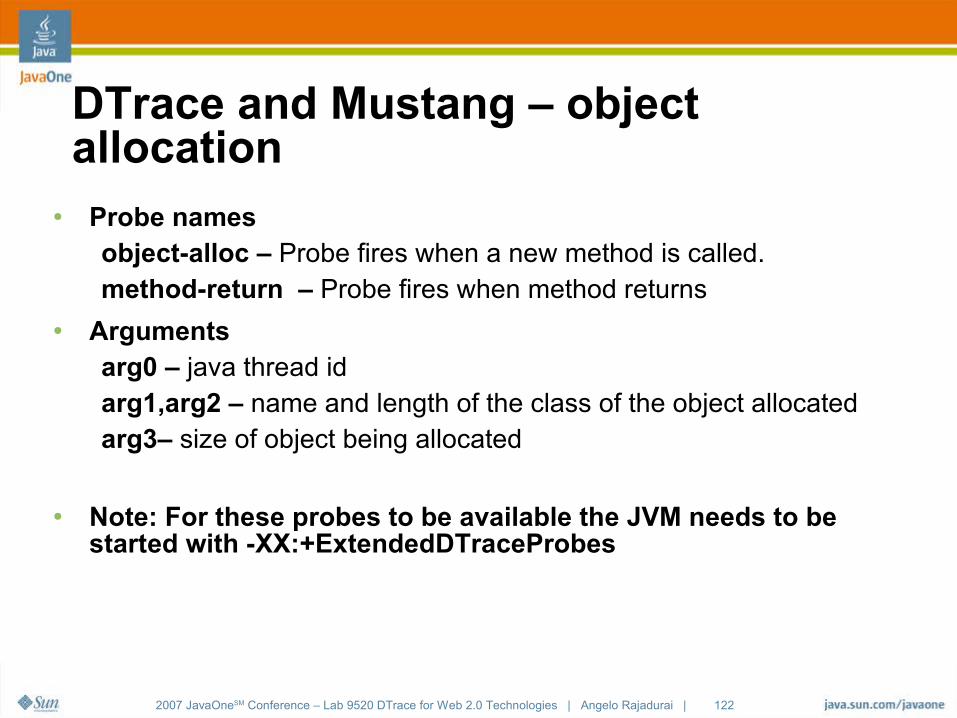
DTrace and Mustang – object allocation
● Probe namesobject-alloc – Probe fires when a new method is called.method-return – Probe fires when method returns
● Argumentsarg0 – java thread idarg1,arg2 – name and length of the class of the object allocatedarg3– size of object being allocated
● Note: For these probes to be available the JVM needs to be started with -XX:+ExtendedDTraceProbes
2007 JavaOneSM Conference – Lab 9520 DTrace for Web 2.0 Technologies | Angelo Rajadurai | 123
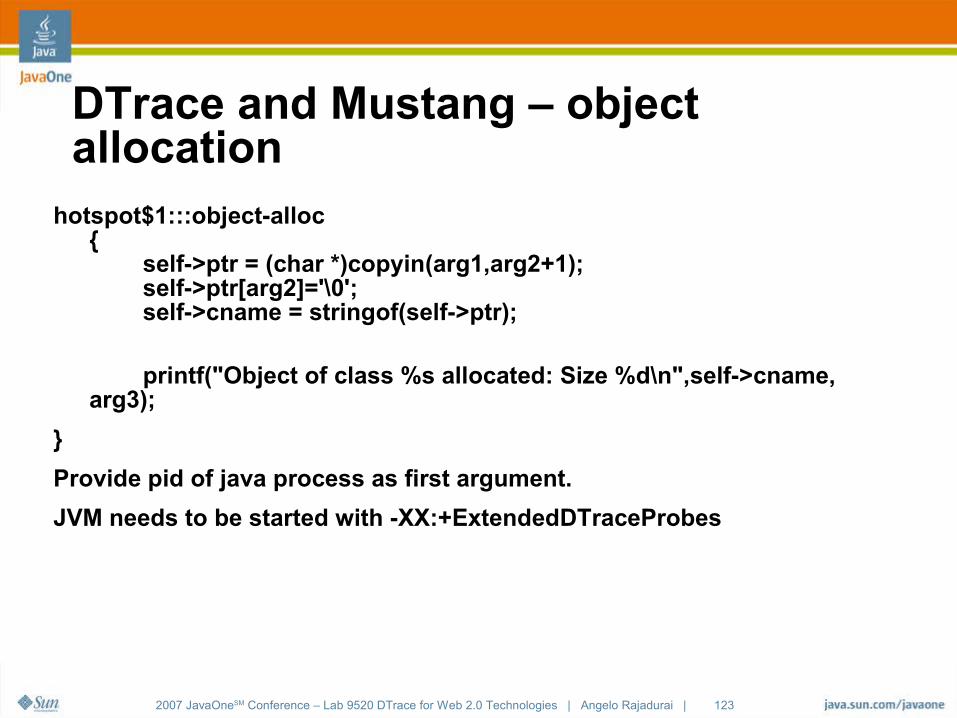
DTrace and Mustang – object allocation
hotspot$1:::object-alloc{ self->ptr = (char *)copyin(arg1,arg2+1); self->ptr[arg2]='\0'; self->cname = stringof(self->ptr);
printf("Object of class %s allocated: Size %d\n",self->cname, arg3);
}
Provide pid of java process as first argument.
JVM needs to be started with -XX:+ExtendedDTraceProbes
2007 JavaOneSM Conference – Lab 9520 DTrace for Web 2.0 Technologies | Angelo Rajadurai | 124
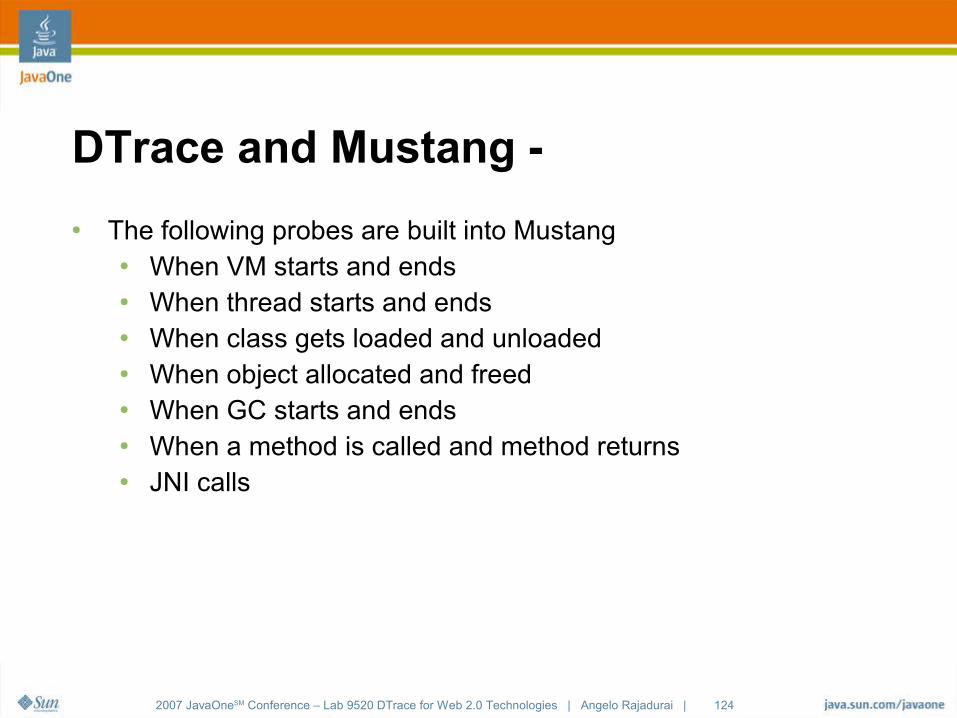
DTrace and Mustang -
● The following probes are built into Mustang● When VM starts and ends● When thread starts and ends● When class gets loaded and unloaded● When object allocated and freed● When GC starts and ends● When a method is called and method returns● JNI calls
2007 JavaOneSM Conference – Lab 9520 DTrace for Web 2.0 Technologies | Angelo Rajadurai | 125
DTrace for Java 1.4.2 & 1.5Well moving at Mustang speed is not for all.
2007 JavaOneSM Conference – Lab 9520 DTrace for Web 2.0 Technologies | Angelo Rajadurai | 126
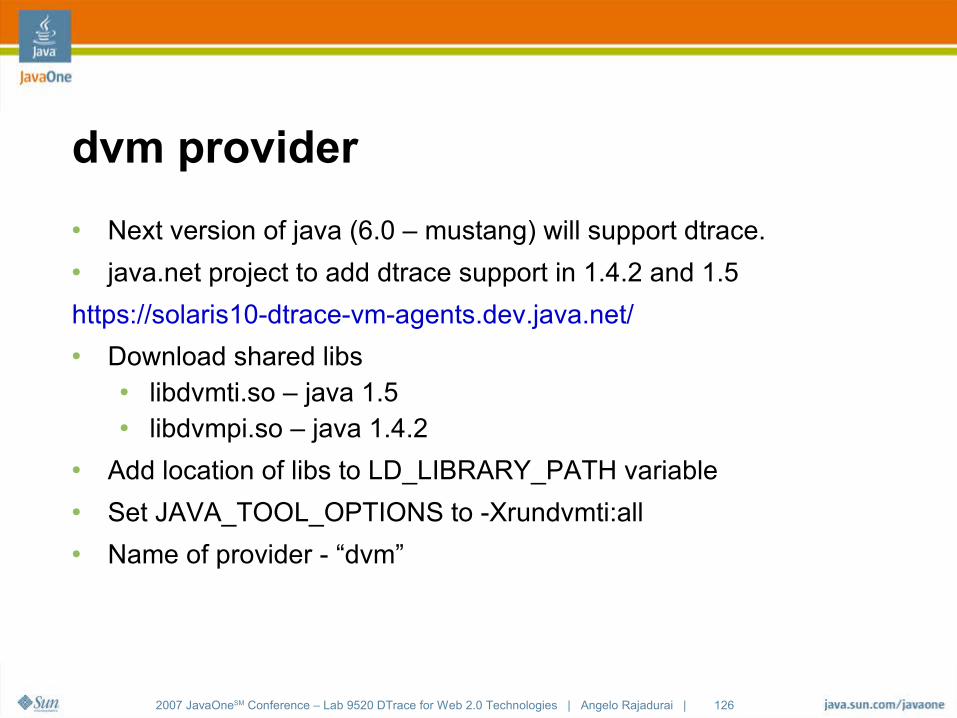
dvm provider
● Next version of java (6.0 – mustang) will support dtrace.● java.net project to add dtrace support in 1.4.2 and 1.5
https://solaris10-dtrace-vm-agents.dev.java.net/● Download shared libs
● libdvmti.so – java 1.5● libdvmpi.so – java 1.4.2
● Add location of libs to LD_LIBRARY_PATH variable● Set JAVA_TOOL_OPTIONS to -Xrundvmti:all● Name of provider - “dvm”
2007 JavaOneSM Conference – Lab 9520 DTrace for Web 2.0 Technologies | Angelo Rajadurai | 127
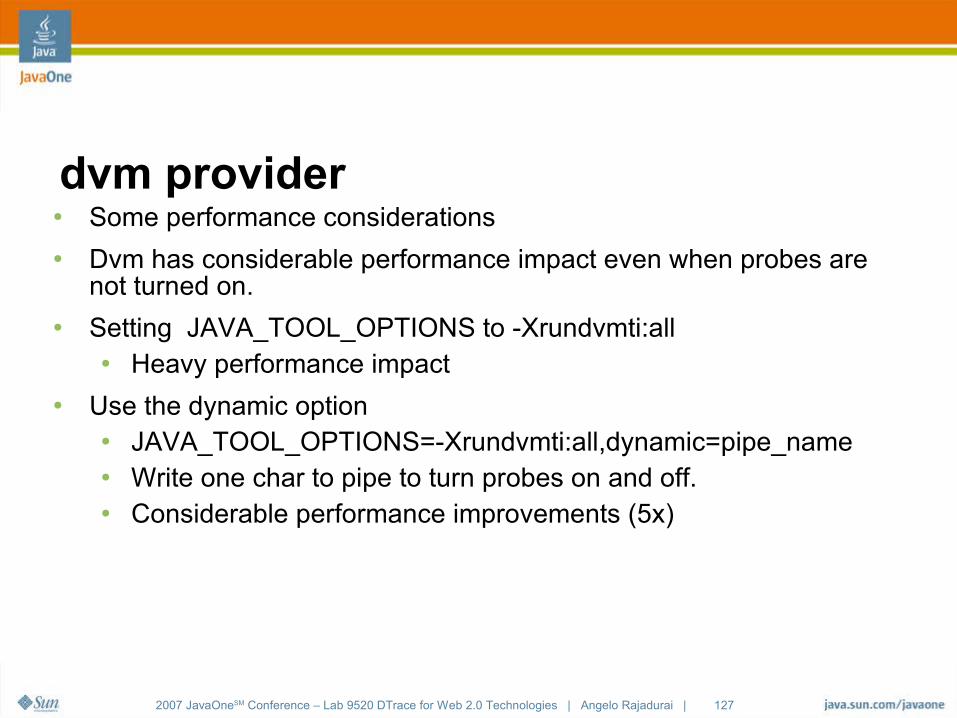
dvm provider● Some performance considerations● Dvm has considerable performance impact even when probes are
not turned on.● Setting JAVA_TOOL_OPTIONS to -Xrundvmti:all
● Heavy performance impact● Use the dynamic option
● JAVA_TOOL_OPTIONS=-Xrundvmti:all,dynamic=pipe_name● Write one char to pipe to turn probes on and off.● Considerable performance improvements (5x)
2007 JavaOneSM Conference – Lab 9520 DTrace for Web 2.0 Technologies | Angelo Rajadurai | 128
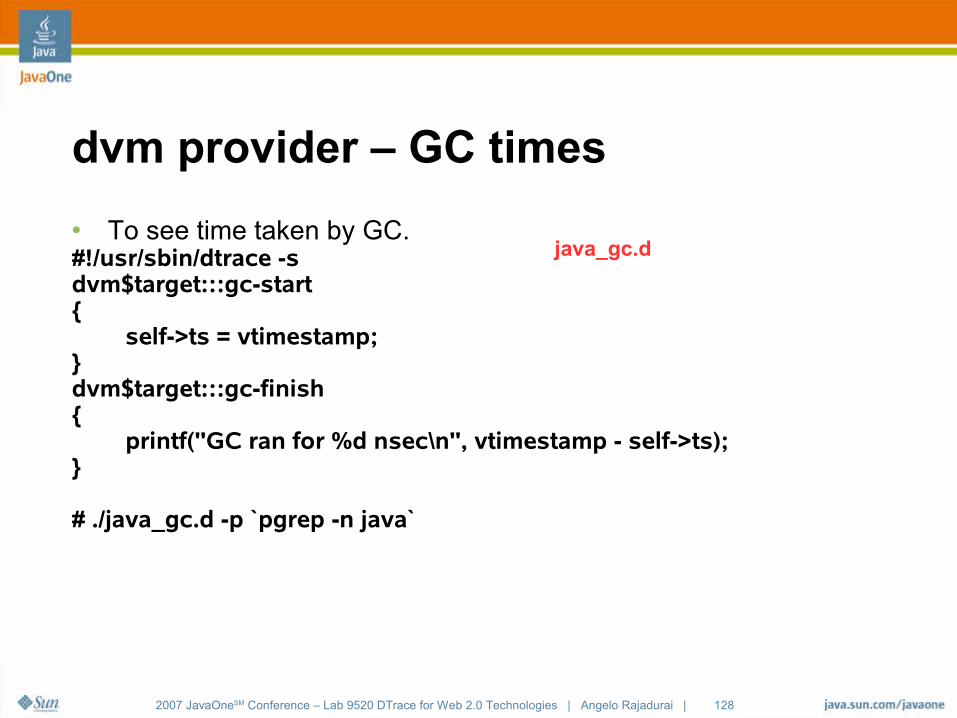
dvm provider – GC times
● To see time taken by GC.#!/usr/sbin/dtrace -sdvm$target:::gc-start{ self->ts = vtimestamp;}dvm$target:::gc-finish{ printf("GC ran for %d nsec\n", vtimestamp - self->ts);}
# ./java_gc.d -p `pgrep -n java`
java_gc.d
2007 JavaOneSM Conference – Lab 9520 DTrace for Web 2.0 Technologies | Angelo Rajadurai | 129
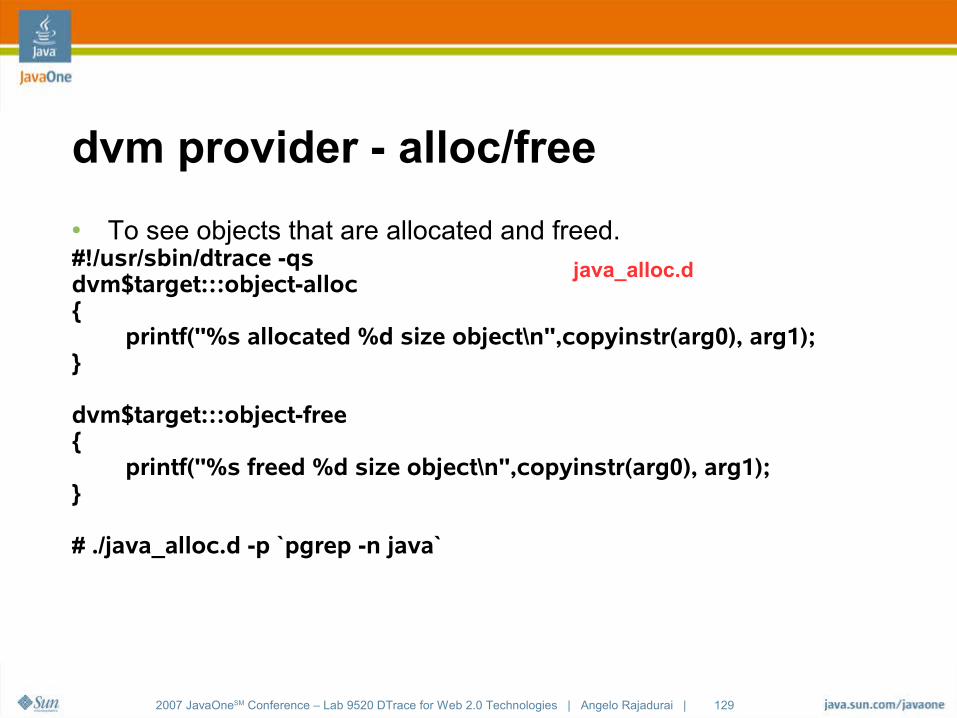
dvm provider - alloc/free
● To see objects that are allocated and freed.#!/usr/sbin/dtrace -qsdvm$target:::object-alloc{ printf("%s allocated %d size object\n",copyinstr(arg0), arg1);}
dvm$target:::object-free{ printf("%s freed %d size object\n",copyinstr(arg0), arg1);}
# ./java_alloc.d -p `pgrep -n java`
java_alloc.d
2007 JavaOneSM Conference – Lab 9520 DTrace for Web 2.0 Technologies | Angelo Rajadurai | 130
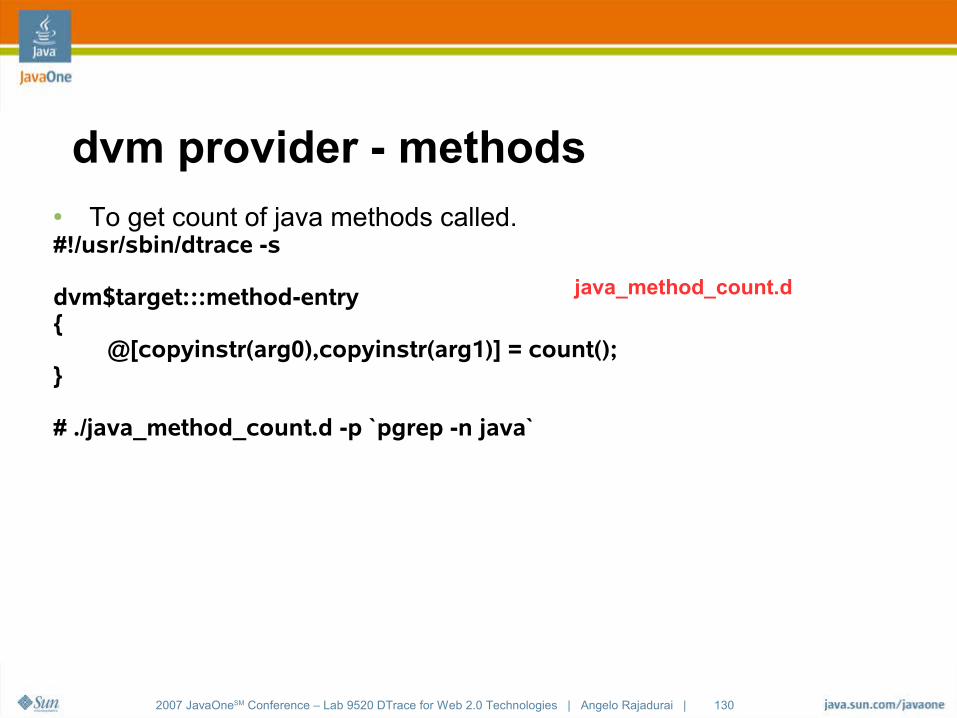
dvm provider - methods● To get count of java methods called.#!/usr/sbin/dtrace -s
dvm$target:::method-entry{ @[copyinstr(arg0),copyinstr(arg1)] = count();}
# ./java_method_count.d -p `pgrep -n java`
java_method_count.d
2007 JavaOneSM Conference – Lab 9520 DTrace for Web 2.0 Technologies | Angelo Rajadurai | 131
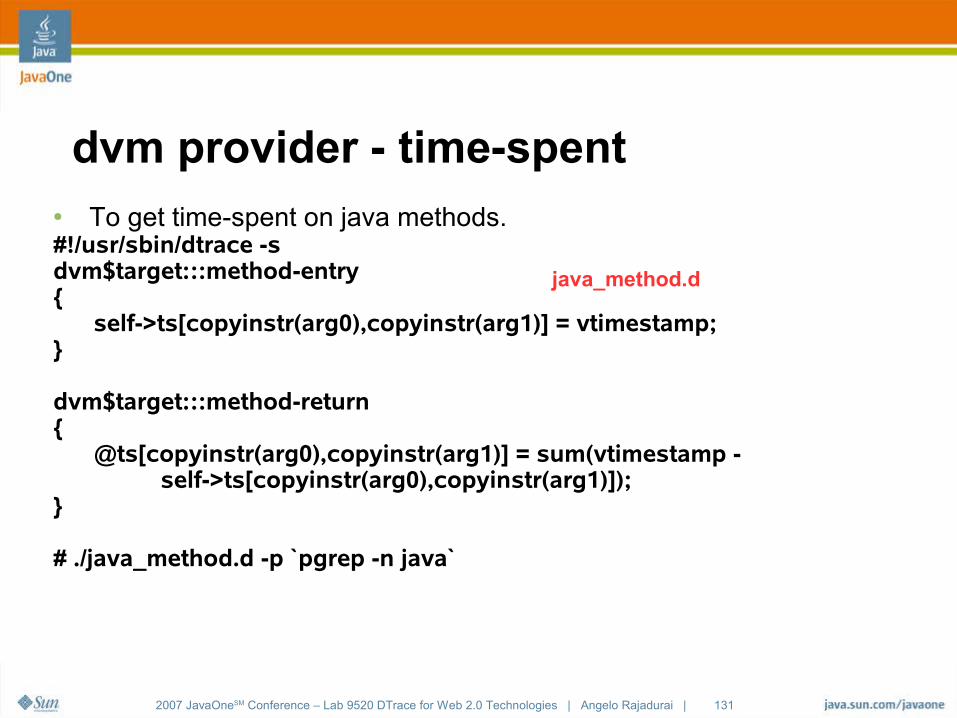
dvm provider - time-spent● To get time-spent on java methods.#!/usr/sbin/dtrace -sdvm$target:::method-entry{ self->ts[copyinstr(arg0),copyinstr(arg1)] = vtimestamp;}
dvm$target:::method-return{ @ts[copyinstr(arg0),copyinstr(arg1)] = sum(vtimestamp - self->ts[copyinstr(arg0),copyinstr(arg1)]);}
# ./java_method.d -p `pgrep -n java`
java_method.d
2007 JavaOneSM Conference – Lab 9520 DTrace for Web 2.0 Technologies | Angelo Rajadurai | 132
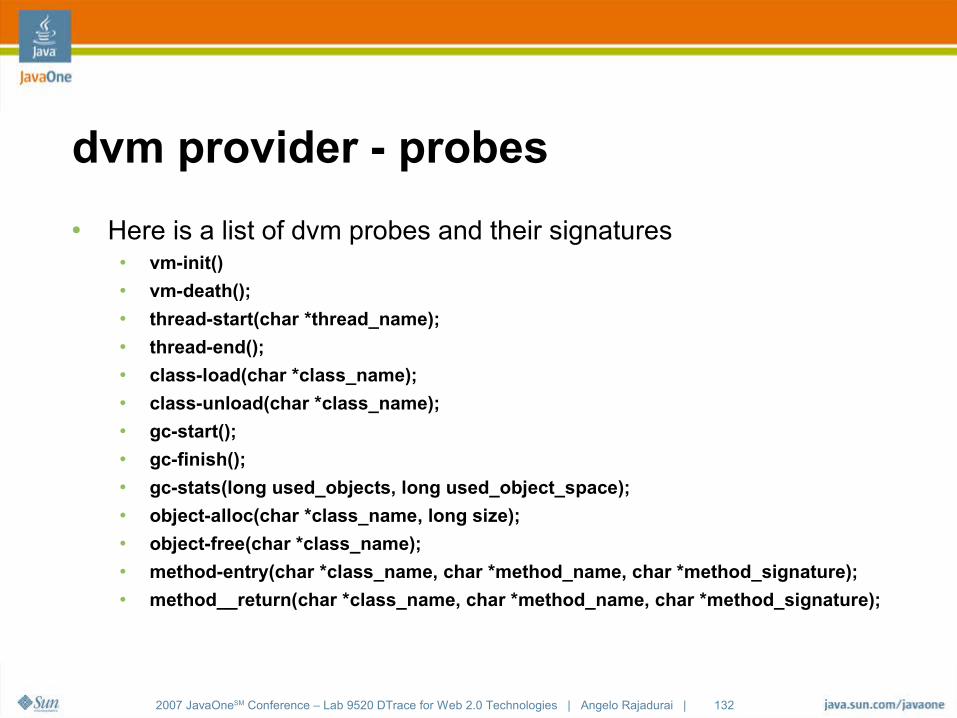
dvm provider - probes
● Here is a list of dvm probes and their signatures● vm-init()● vm-death();● thread-start(char *thread_name);● thread-end();● class-load(char *class_name);● class-unload(char *class_name);● gc-start();● gc-finish();● gc-stats(long used_objects, long used_object_space);● object-alloc(char *class_name, long size);● object-free(char *class_name);● method-entry(char *class_name, char *method_name, char *method_signature);● method__return(char *class_name, char *method_name, char *method_signature);
2007 JavaOneSM Conference – Lab 9520 DTrace for Web 2.0 Technologies | Angelo Rajadurai | 133
DTrace for scripting languagesDynamic Tracing for Dynamic development
2007 JavaOneSM Conference – Lab 9520 DTrace for Web 2.0 Technologies | Angelo Rajadurai | 134
DTrace and Scripting Language
● DTrace has been integrated into many scripting languages. ● We will see two samples.
● PHP● JavaScript
● For this exercise we will use Coolstack version of PHP.● Get coolstack from http://cooltools.sunsource.net/coolstack/
● Please note the DTrace providers are experimental and not official
2007 JavaOneSM Conference – Lab 9520 DTrace for Web 2.0 Technologies | Angelo Rajadurai | 135
DTrace for PHPD tracing for P Hyper Processor
2007 JavaOneSM Conference – Lab 9520 DTrace for Web 2.0 Technologies | Angelo Rajadurai | 136
DTrace and PHP
● DTrace provider for PHP is a PECL/PEAR module● To get the provider
# pear install dtraceor
# pecl install dtracethen add
“extension=dtrace.so” to the php.ini filethen
restart PHP
2007 JavaOneSM Conference – Lab 9520 DTrace for Web 2.0 Technologies | Angelo Rajadurai | 137
DTrace and PHP● Couple links for more information● Wez Furlong who created the provider has details in
http://netevil.org/node.php?uuid=42f82a8b-09b7-5013-1667-2f82a8b24ead● Bryan Cantrill has a nice demo script in his blog.
http://blogs.sun.com/bmc/entry/dtrace_and_php_demonstrated

2007 JavaOneSM Conference – Lab 9520 DTrace for Web 2.0 Technologies | Angelo Rajadurai | 138
DTrace and PHP● There are two probes in the provider.
function-returnfunction-entry
● You can use the 5 args in the action.● arg0 = the function name● arg1 = the filename● arg2 = the line number● arg3 = classname (or an empty string)● arg4 = object/class operator (::, ->, or an empty string)
2007 JavaOneSM Conference – Lab 9520 DTrace for Web 2.0 Technologies | Angelo Rajadurai | 139
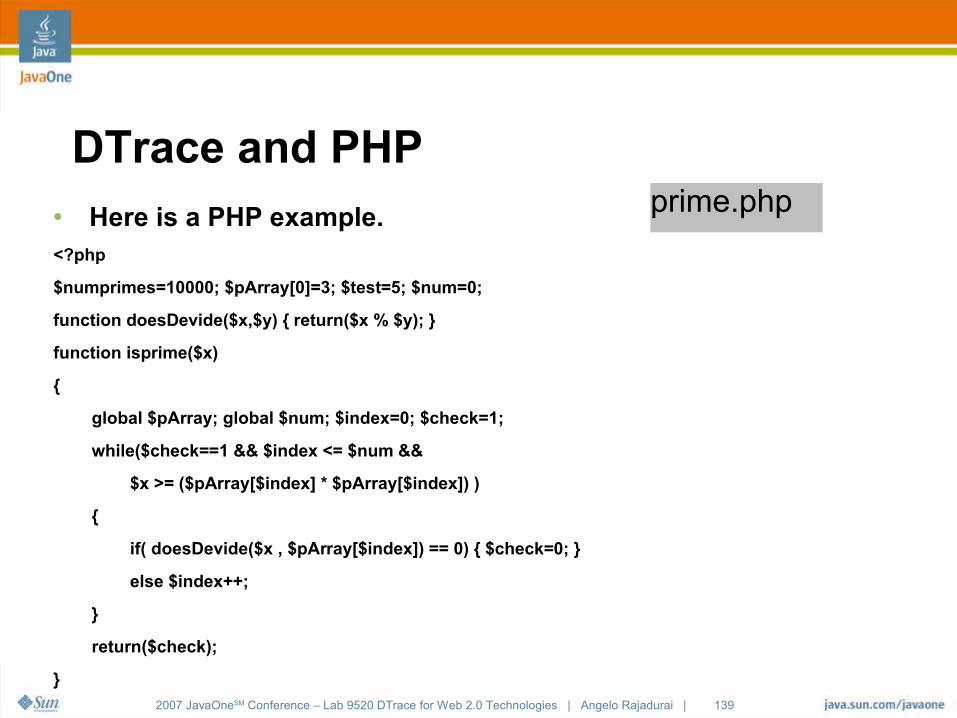
DTrace and PHP● Here is a PHP example.<?php
$numprimes=10000; $pArray[0]=3; $test=5; $num=0;
function doesDevide($x,$y) { return($x % $y); }
function isprime($x)
{
global $pArray; global $num; $index=0; $check=1;
while($check==1 && $index <= $num &&
$x >= ($pArray[$index] * $pArray[$index]) )
{
if( doesDevide($x , $pArray[$index]) == 0) { $check=0; }
else $index++;
}
return($check);
}
prime.php
2007 JavaOneSM Conference – Lab 9520 DTrace for Web 2.0 Technologies | Angelo Rajadurai | 140
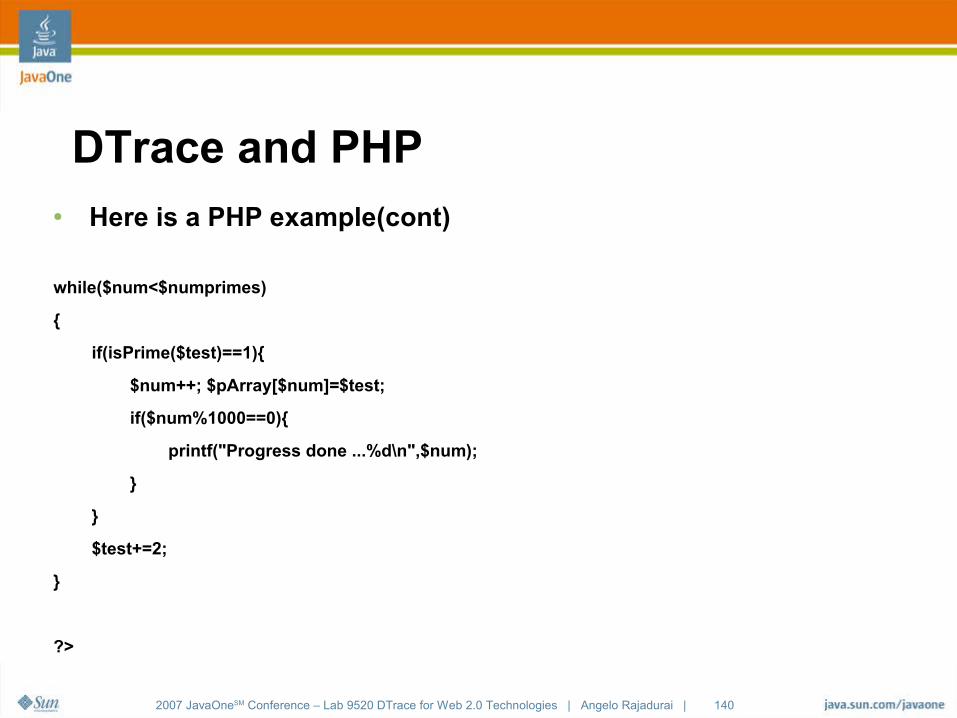
DTrace and PHP● Here is a PHP example(cont)
while($num<$numprimes)
{
if(isPrime($test)==1){
$num++; $pArray[$num]=$test;
if($num%1000==0){
printf("Progress done ...%d\n",$num);
}
}
$test+=2;
}
?>
2007 JavaOneSM Conference – Lab 9520 DTrace for Web 2.0 Technologies | Angelo Rajadurai | 141
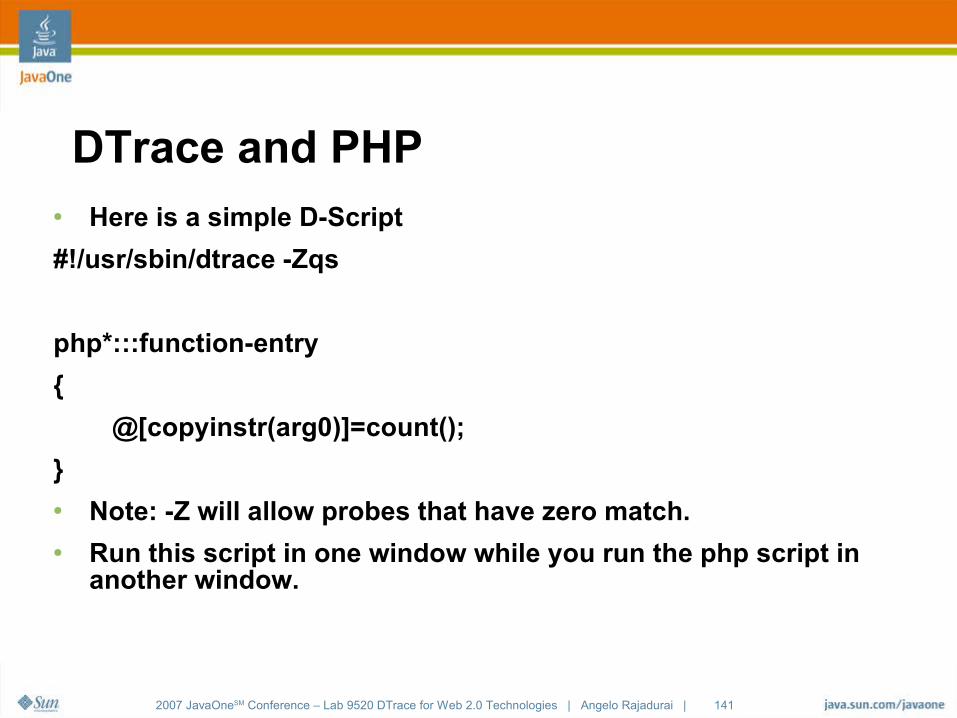
DTrace and PHP● Here is a simple D-Script
#!/usr/sbin/dtrace -Zqs
php*:::function-entry
{
@[copyinstr(arg0)]=count();
}● Note: -Z will allow probes that have zero match. ● Run this script in one window while you run the php script in
another window.
2007 JavaOneSM Conference – Lab 9520 DTrace for Web 2.0 Technologies | Angelo Rajadurai | 142
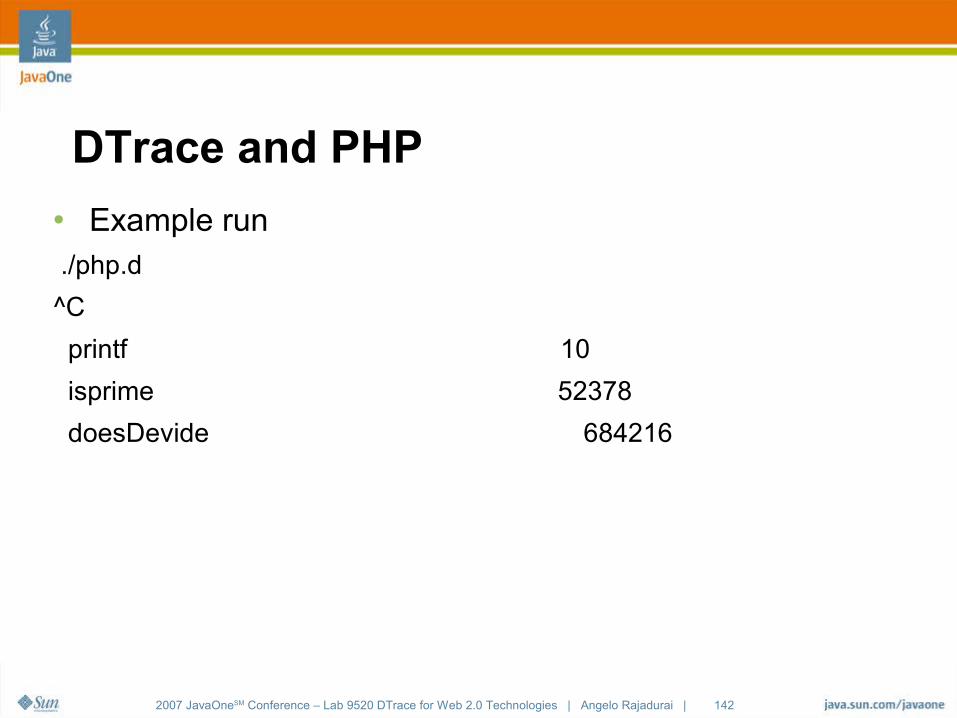
DTrace and PHP● Example run ./php.d
^C
printf 10
isprime 52378
doesDevide 684216
2007 JavaOneSM Conference – Lab 9520 DTrace for Web 2.0 Technologies | Angelo Rajadurai | 143
DTrace for JavascriptD tracing for P Hyper Processor
2007 JavaOneSM Conference – Lab 9520 DTrace for Web 2.0 Technologies | Angelo Rajadurai | 144
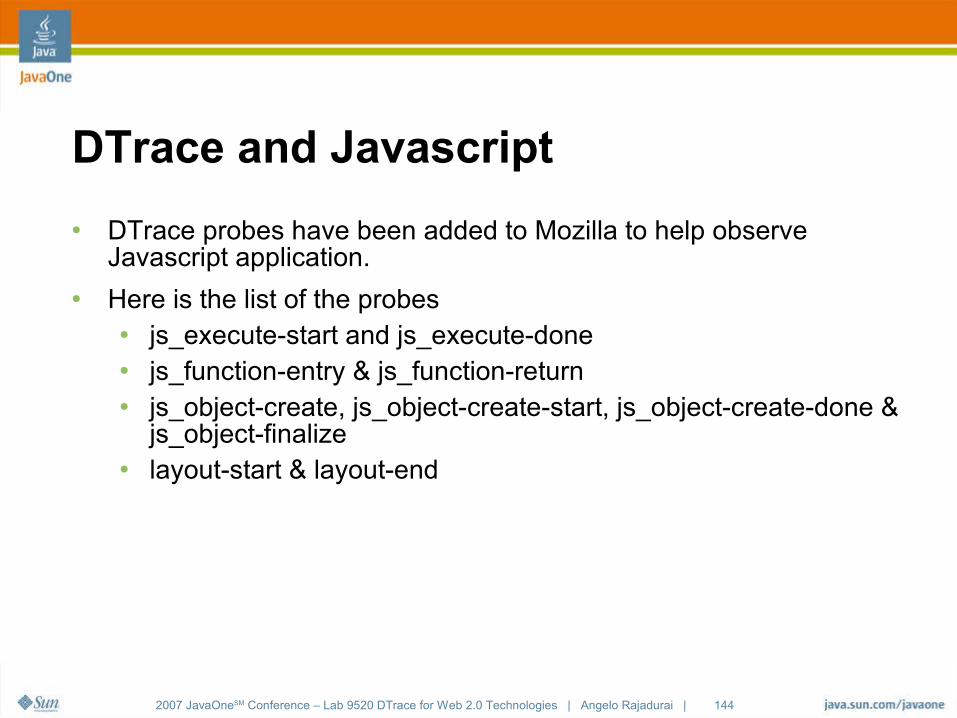
DTrace and Javascript
● DTrace probes have been added to Mozilla to help observe Javascript application.
● Here is the list of the probes● js_execute-start and js_execute-done● js_function-entry & js_function-return● js_object-create, js_object-create-start, js_object-create-done &
js_object-finalize● layout-start & layout-end
2007 JavaOneSM Conference – Lab 9520 DTrace for Web 2.0 Technologies | Angelo Rajadurai | 145
DTrace and Javascript
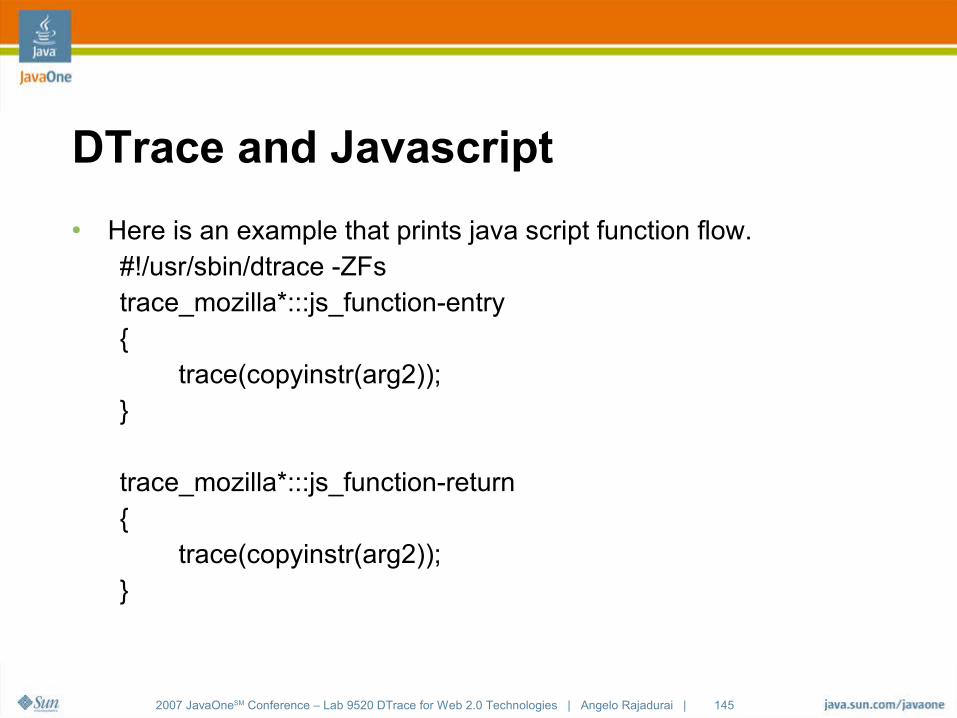
● Here is an example that prints java script function flow.#!/usr/sbin/dtrace -ZFstrace_mozilla*:::js_function-entry{ trace(copyinstr(arg2));}
trace_mozilla*:::js_function-return{ trace(copyinstr(arg2));}
2007 JavaOneSM Conference – Lab 9520 DTrace for Web 2.0 Technologies | Angelo Rajadurai | 146
DTrace for DatabasesDTrace -n for select *
2007 JavaOneSM Conference – Lab 9520 DTrace for Web 2.0 Technologies | Angelo Rajadurai | 147
DTrace and Databases
● DTrace has a lot of great features specially for databases● Look at the IO provider.
● This will give you some ideas on which disk is being used● There are also some more specific help DTrace can provide for some
databases.● We will see three examples
● PostgreSQL – embedded probes● MySQL – couple examples of DTrace usage.● Oracle – printing SQL statements
2007 JavaOneSM Conference – Lab 9520 DTrace for Web 2.0 Technologies | Angelo Rajadurai | 148
DTrace & PostgresObserve post deploy of PostgreSQL
2007 JavaOneSM Conference – Lab 9520 DTrace for Web 2.0 Technologies | Angelo Rajadurai | 149
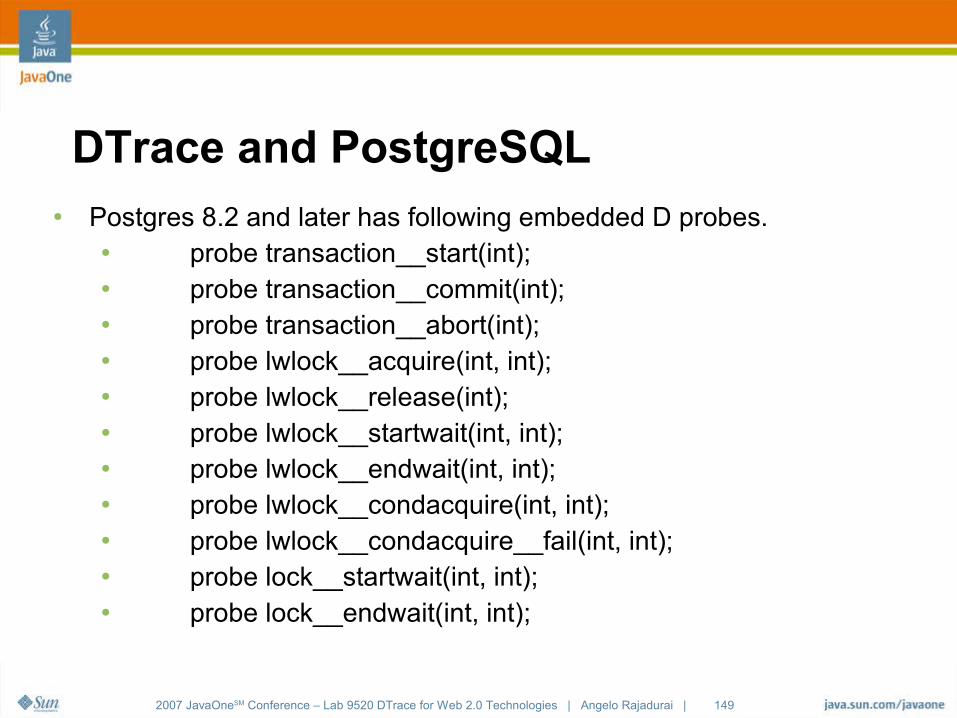
DTrace and PostgreSQL● Postgres 8.2 and later has following embedded D probes.
● probe transaction__start(int);● probe transaction__commit(int);● probe transaction__abort(int);● probe lwlock__acquire(int, int);● probe lwlock__release(int); ● probe lwlock__startwait(int, int);● probe lwlock__endwait(int, int);● probe lwlock__condacquire(int, int);● probe lwlock__condacquire__fail(int, int);● probe lock__startwait(int, int);● probe lock__endwait(int, int);
2007 JavaOneSM Conference – Lab 9520 DTrace for Web 2.0 Technologies | Angelo Rajadurai | 150
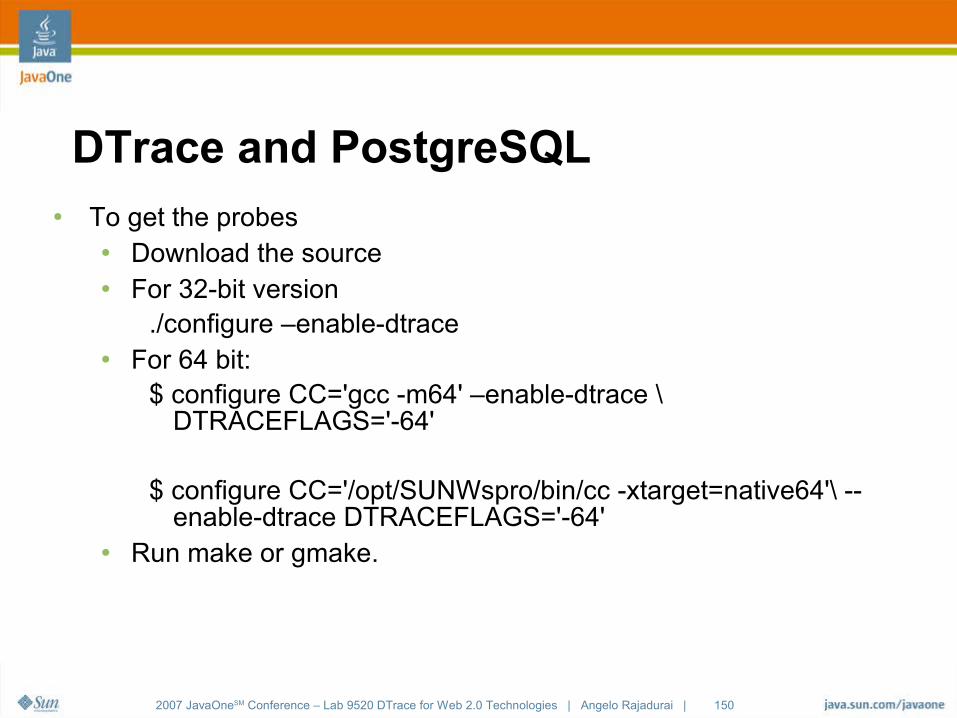
DTrace and PostgreSQL● To get the probes
● Download the source● For 32-bit version
./configure –enable-dtrace● For 64 bit:
$ configure CC='gcc -m64' –enable-dtrace \ DTRACEFLAGS='-64'
$ configure CC='/opt/SUNWspro/bin/cc -xtarget=native64'\ --
enable-dtrace DTRACEFLAGS='-64'● Run make or gmake.
2007 JavaOneSM Conference – Lab 9520 DTrace for Web 2.0 Technologies | Angelo Rajadurai | 151
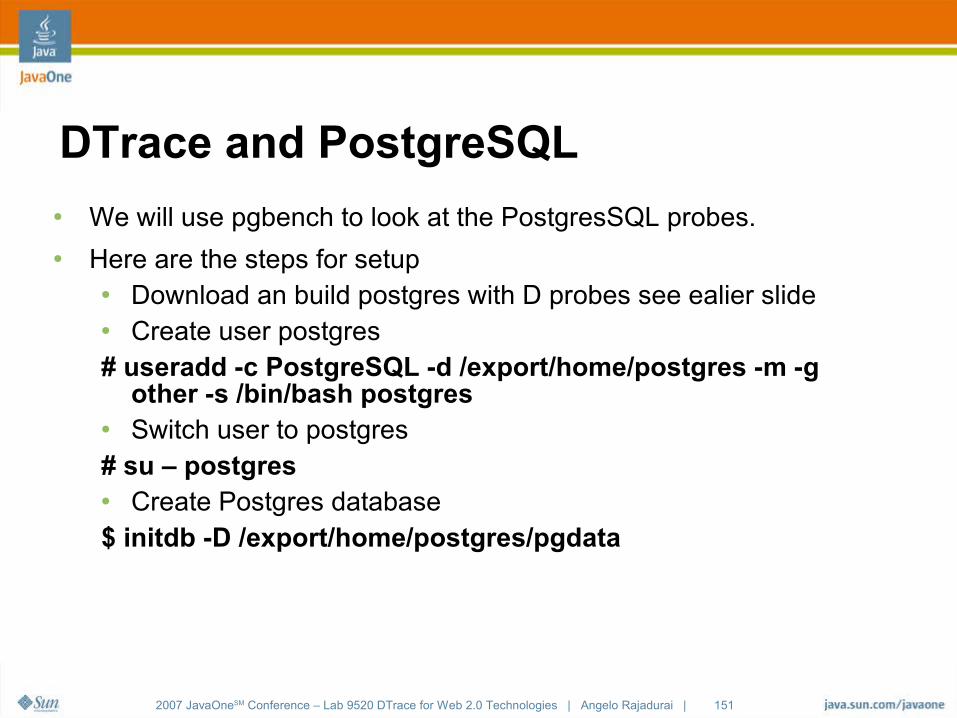
DTrace and PostgreSQL● We will use pgbench to look at the PostgresSQL probes.● Here are the steps for setup
● Download an build postgres with D probes see ealier slide● Create user postgres# useradd -c PostgreSQL -d /export/home/postgres -m -g
other -s /bin/bash postgres● Switch user to postgres# su – postgres● Create Postgres database$ initdb -D /export/home/postgres/pgdata
2007 JavaOneSM Conference – Lab 9520 DTrace for Web 2.0 Technologies | Angelo Rajadurai | 152
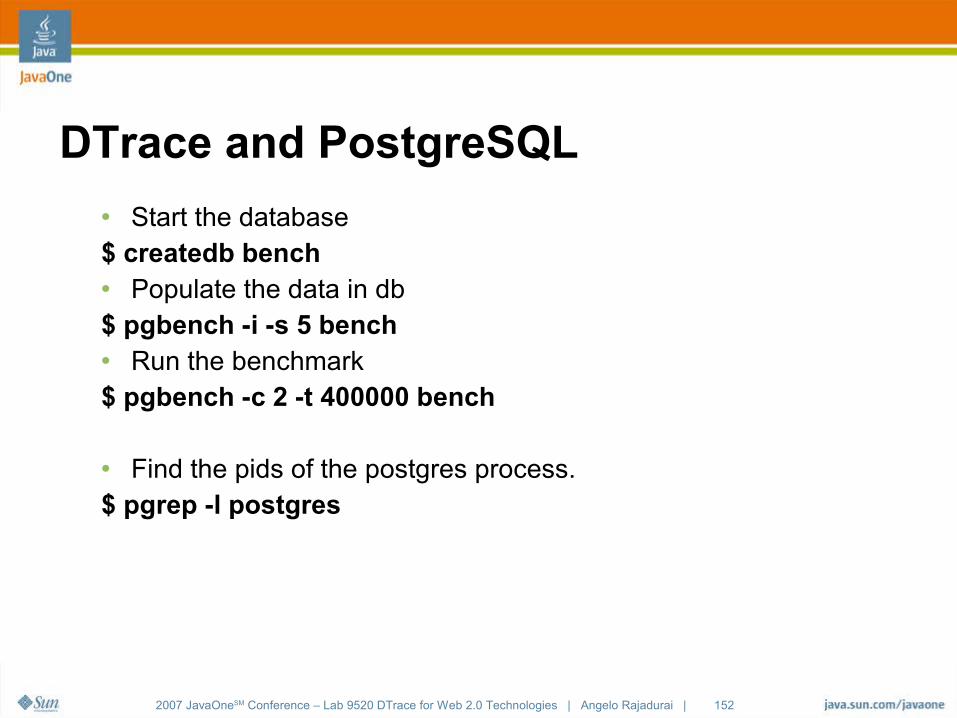
DTrace and PostgreSQL● Start the database$ createdb bench● Populate the data in db $ pgbench -i -s 5 bench● Run the benchmark$ pgbench -c 2 -t 400000 bench
● Find the pids of the postgres process.$ pgrep -l postgres
2007 JavaOneSM Conference – Lab 9520 DTrace for Web 2.0 Technologies | Angelo Rajadurai | 153
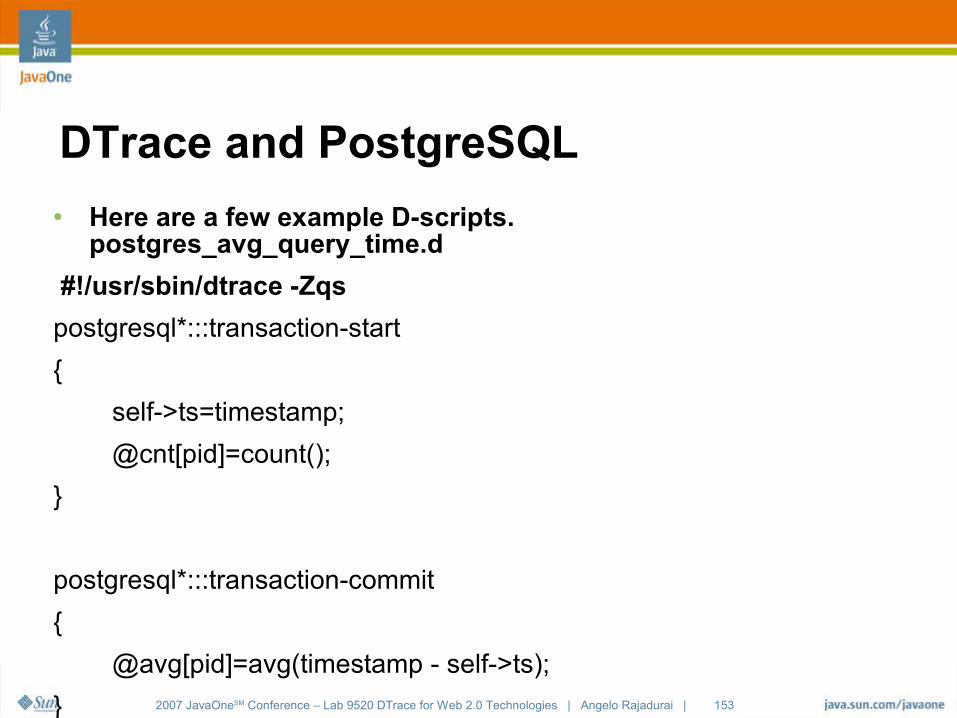
DTrace and PostgreSQL● Here are a few example D-scripts.
postgres_avg_query_time.d
#!/usr/sbin/dtrace -Zqs
postgresql*:::transaction-start
{
self->ts=timestamp;
@cnt[pid]=count();
}
postgresql*:::transaction-commit
{
@avg[pid]=avg(timestamp - self->ts);
}
2007 JavaOneSM Conference – Lab 9520 DTrace for Web 2.0 Technologies | Angelo Rajadurai | 154
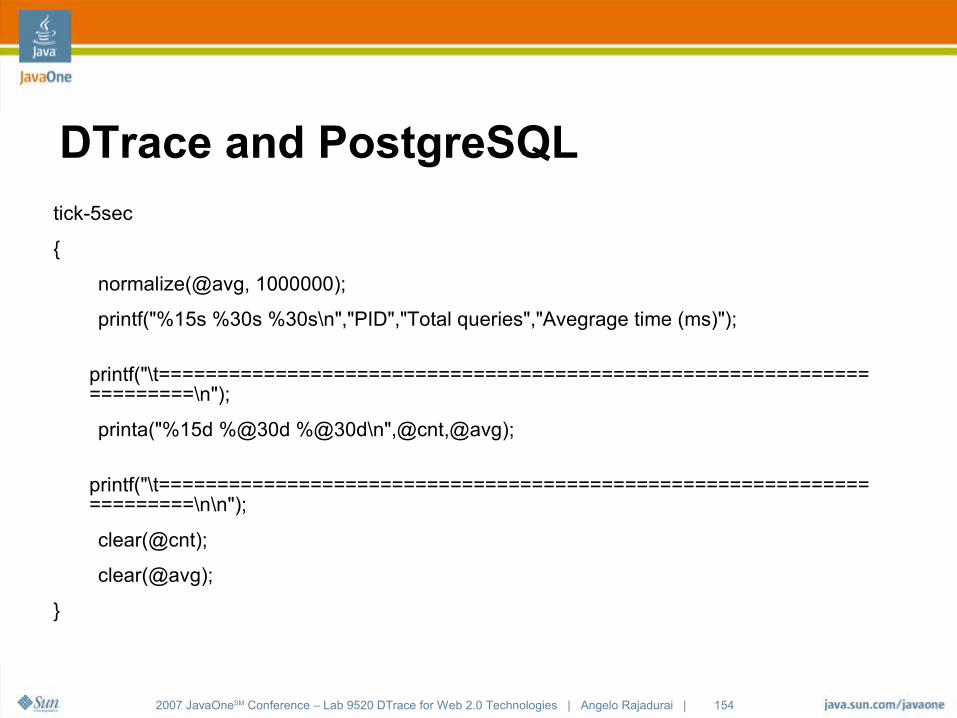
DTrace and PostgreSQLtick-5sec
{
normalize(@avg, 1000000);
printf("%15s %30s %30s\n","PID","Total queries","Avegrage time (ms)");
printf("\t======================================================================\n");
printa("%15d %@30d %@30d\n",@cnt,@avg);
printf("\t======================================================================\n\n");
clear(@cnt);
clear(@avg);
}
2007 JavaOneSM Conference – Lab 9520 DTrace for Web 2.0 Technologies | Angelo Rajadurai | 155
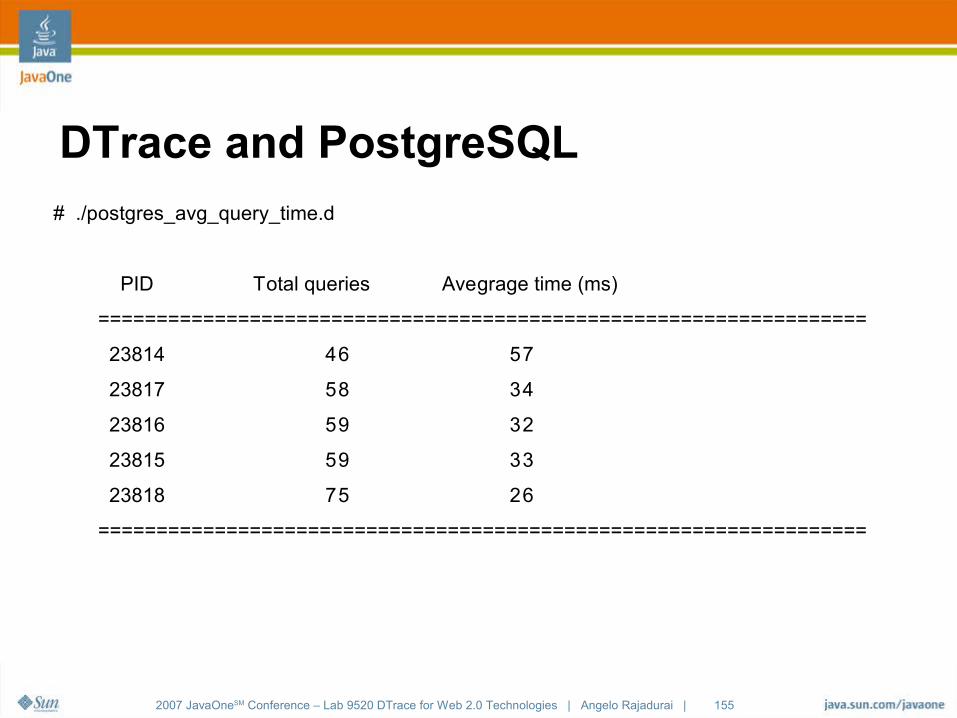
DTrace and PostgreSQL# ./postgres_avg_query_time.d
PID Total queries Avegrage time (ms)
==================================================================
23814 46 57
23817 58 34
23816 59 32
23815 59 33
23818 75 26
==================================================================
2007 JavaOneSM Conference – Lab 9520 DTrace for Web 2.0 Technologies | Angelo Rajadurai | 156
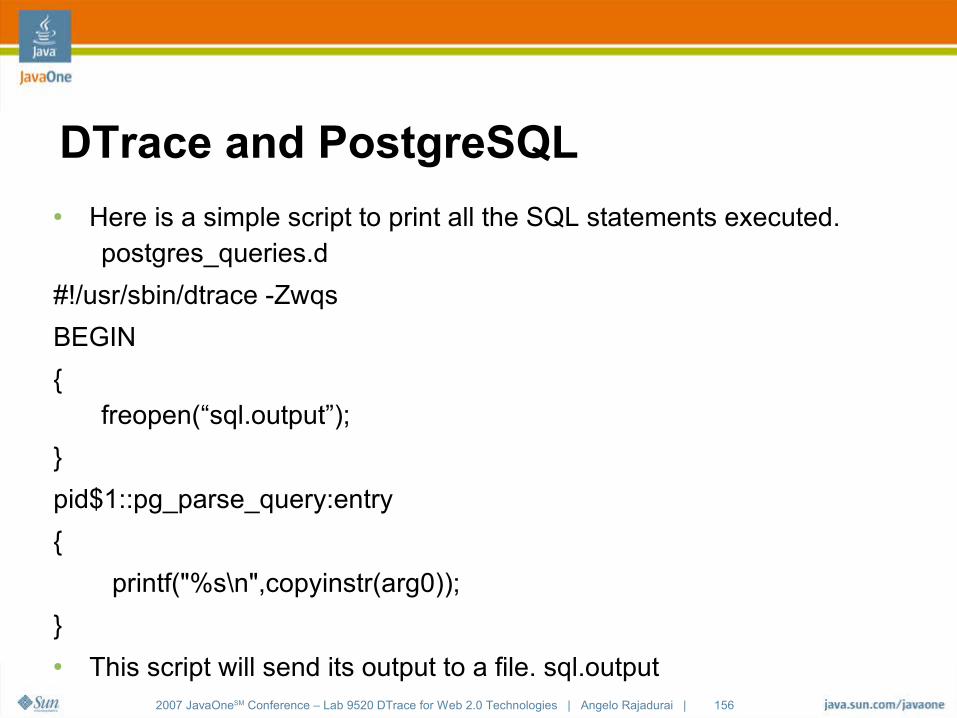
DTrace and PostgreSQL● Here is a simple script to print all the SQL statements executed.
postgres_queries.d
#!/usr/sbin/dtrace -Zwqs
BEGIN
{freopen(“sql.output”);
}
pid$1::pg_parse_query:entry
{
printf("%s\n",copyinstr(arg0));
}● This script will send its output to a file. sql.output
2007 JavaOneSM Conference – Lab 9520 DTrace for Web 2.0 Technologies | Angelo Rajadurai | 157
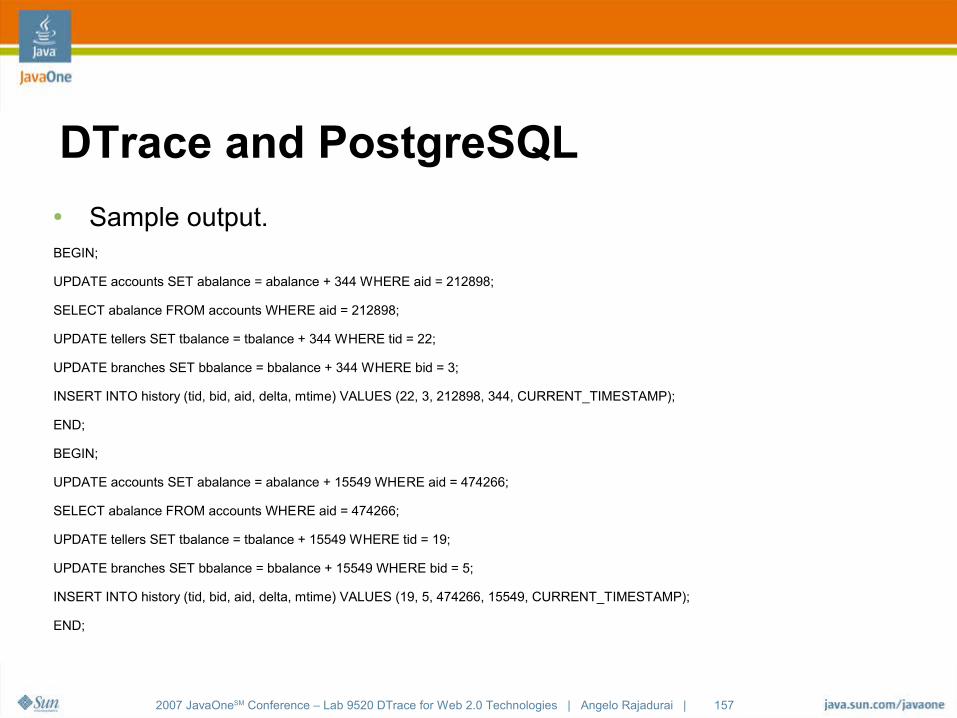
DTrace and PostgreSQL● Sample output.BEGIN;
UPDATE accounts SET abalance = abalance + 344 WHERE aid = 212898;
SELECT abalance FROM accounts WHERE aid = 212898;
UPDATE tellers SET tbalance = tbalance + 344 WHERE tid = 22;
UPDATE branches SET bbalance = bbalance + 344 WHERE bid = 3;
INSERT INTO history (tid, bid, aid, delta, mtime) VALUES (22, 3, 212898, 344, CURRENT_TIMESTAMP);
END;
BEGIN;
UPDATE accounts SET abalance = abalance + 15549 WHERE aid = 474266;
SELECT abalance FROM accounts WHERE aid = 474266;
UPDATE tellers SET tbalance = tbalance + 15549 WHERE tid = 19;
UPDATE branches SET bbalance = bbalance + 15549 WHERE bid = 5;
INSERT INTO history (tid, bid, aid, delta, mtime) VALUES (19, 5, 474266, 15549, CURRENT_TIMESTAMP);
END;
2007 JavaOneSM Conference – Lab 9520 DTrace for Web 2.0 Technologies | Angelo Rajadurai | 158
DTrace and PostgreSQL● More info on PostgreSQL and DTrace● Look at Robert Lor's Blog
http://blogs.sun.com/robertlor/entry/user_level_dtrace_probes_in● For more examples see
http://pgfoundry.org/projects/dtrace/
2007 JavaOneSM Conference – Lab 9520 DTrace for Web 2.0 Technologies | Angelo Rajadurai | 159
DTrace & MySQLOh My My see what SQL I'm running
2007 JavaOneSM Conference – Lab 9520 DTrace for Web 2.0 Technologies | Angelo Rajadurai | 160
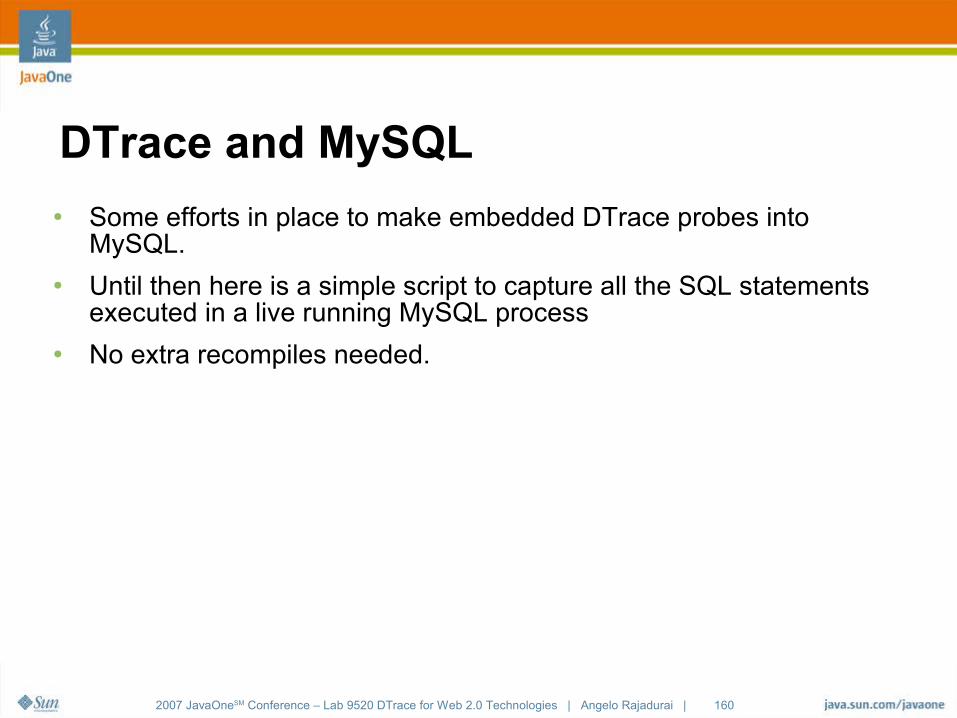
DTrace and MySQL● Some efforts in place to make embedded DTrace probes into
MySQL.● Until then here is a simple script to capture all the SQL statements
executed in a live running MySQL process● No extra recompiles needed.
2007 JavaOneSM Conference – Lab 9520 DTrace for Web 2.0 Technologies | Angelo Rajadurai | 161
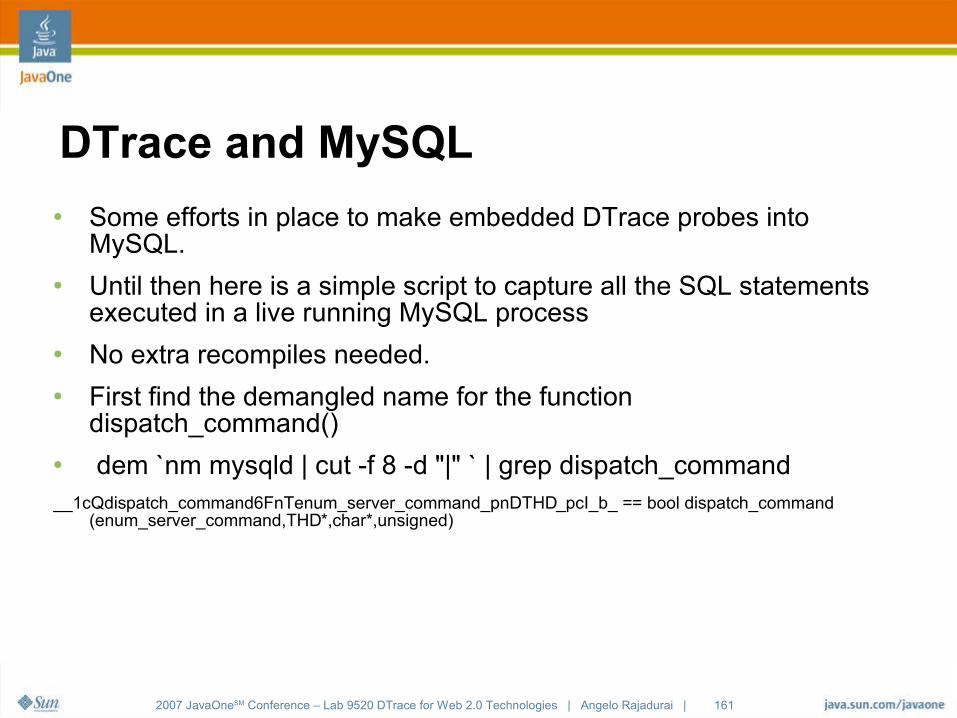
DTrace and MySQL● Some efforts in place to make embedded DTrace probes into
MySQL.● Until then here is a simple script to capture all the SQL statements
executed in a live running MySQL process● No extra recompiles needed. ● First find the demangled name for the function
dispatch_command()● dem `nm mysqld | cut -f 8 -d "|" ` | grep dispatch_command__1cQdispatch_command6FnTenum_server_command_pnDTHD_pcI_b_ == bool dispatch_command
(enum_server_command,THD*,char*,unsigned)
2007 JavaOneSM Conference – Lab 9520 DTrace for Web 2.0 Technologies | Angelo Rajadurai | 162
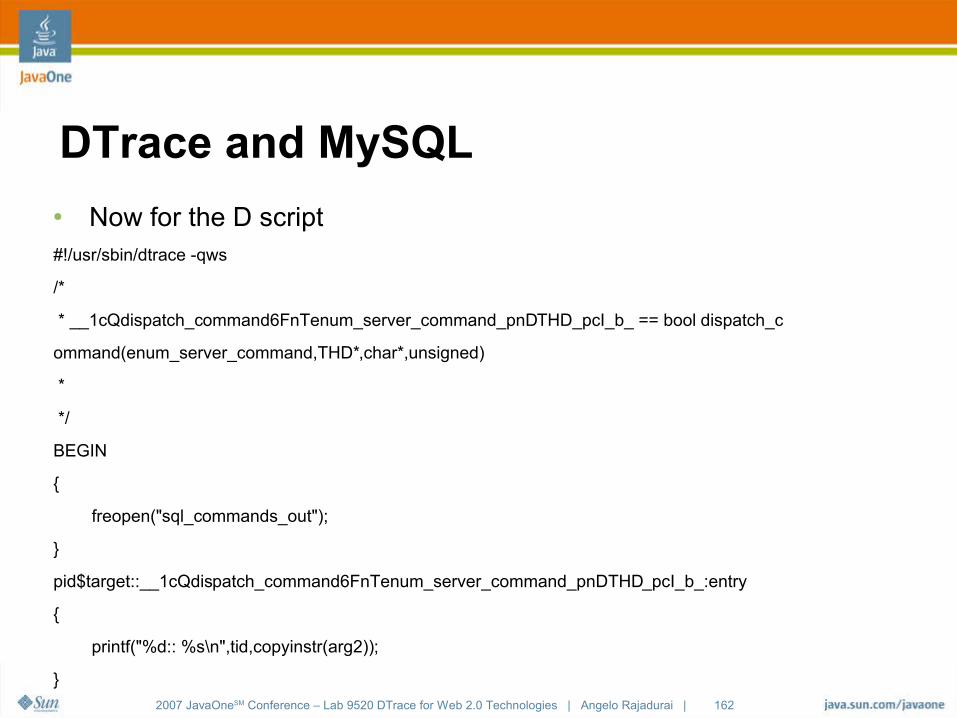
DTrace and MySQL● Now for the D script#!/usr/sbin/dtrace -qws
/*
* __1cQdispatch_command6FnTenum_server_command_pnDTHD_pcI_b_ == bool dispatch_c
ommand(enum_server_command,THD*,char*,unsigned)
*
*/
BEGIN
{
freopen("sql_commands_out");
}
pid$target::__1cQdispatch_command6FnTenum_server_command_pnDTHD_pcI_b_:entry
{
printf("%d:: %s\n",tid,copyinstr(arg2));
}
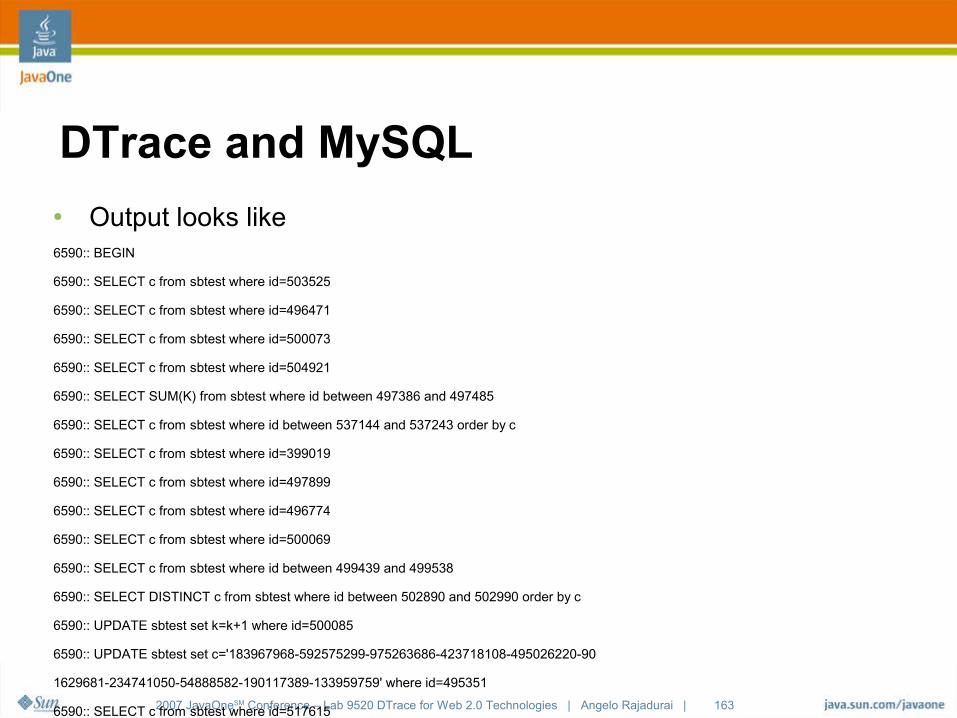
2007 JavaOneSM Conference – Lab 9520 DTrace for Web 2.0 Technologies | Angelo Rajadurai | 163
DTrace and MySQL● Output looks like6590:: BEGIN
6590:: SELECT c from sbtest where id=503525
6590:: SELECT c from sbtest where id=496471
6590:: SELECT c from sbtest where id=500073
6590:: SELECT c from sbtest where id=504921
6590:: SELECT SUM(K) from sbtest where id between 497386 and 497485
6590:: SELECT c from sbtest where id between 537144 and 537243 order by c
6590:: SELECT c from sbtest where id=399019
6590:: SELECT c from sbtest where id=497899
6590:: SELECT c from sbtest where id=496774
6590:: SELECT c from sbtest where id=500069
6590:: SELECT c from sbtest where id between 499439 and 499538
6590:: SELECT DISTINCT c from sbtest where id between 502890 and 502990 order by c
6590:: UPDATE sbtest set k=k+1 where id=500085
6590:: UPDATE sbtest set c='183967968-592575299-975263686-423718108-495026220-90
1629681-234741050-54888582-190117389-133959759' where id=495351
6590:: SELECT c from sbtest where id=517615
6590:: SELECT c from sbtest where id=503673
6590:: DELETE from sbtest where id=504804
6590:: INSERT INTO sbtest values(504804,0,' ','aaaaaaaaaaffffffffffrrrrrrrrrreee
eeeeeeeyyyyyyyyyy')
6590:: COMMIT
2007 JavaOneSM Conference – Lab 9520 DTrace for Web 2.0 Technologies | Angelo Rajadurai | 164
DTrace & OracleA SQL of Oracle.
2007 JavaOneSM Conference – Lab 9520 DTrace for Web 2.0 Technologies | Angelo Rajadurai | 165
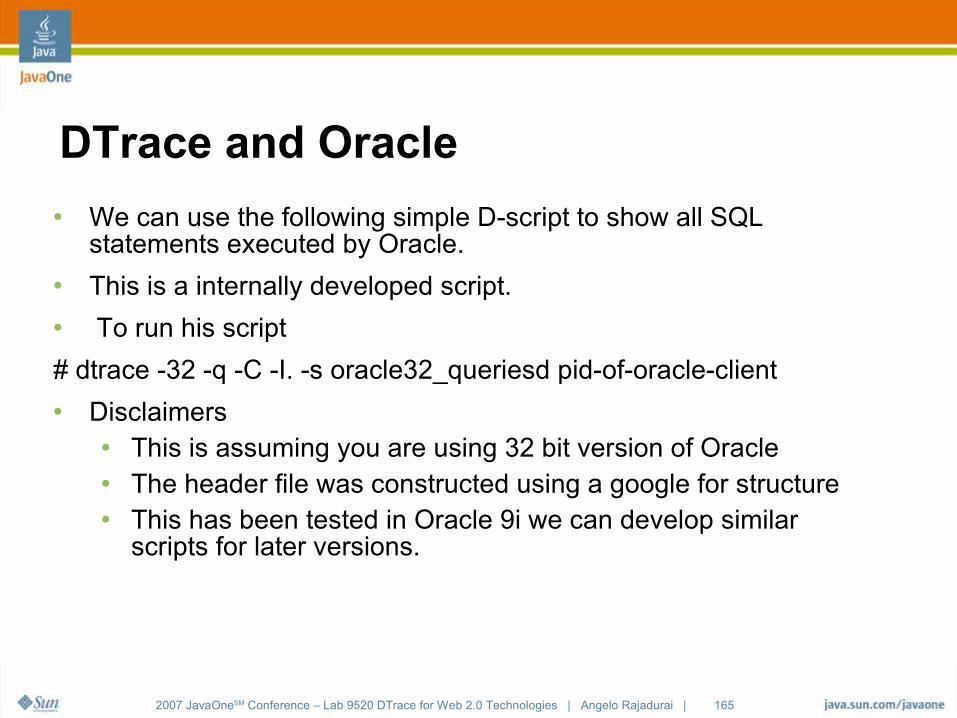
DTrace and Oracle● We can use the following simple D-script to show all SQL
statements executed by Oracle.● This is a internally developed script.● To run his script
# dtrace -32 -q -C -I. -s oracle32_queriesd pid-of-oracle-client● Disclaimers
● This is assuming you are using 32 bit version of Oracle● The header file was constructed using a google for structure● This has been tested in Oracle 9i we can develop similar
scripts for later versions.
2007 JavaOneSM Conference – Lab 9520 DTrace for Web 2.0 Technologies | Angelo Rajadurai | 166
DTrace and Oracle
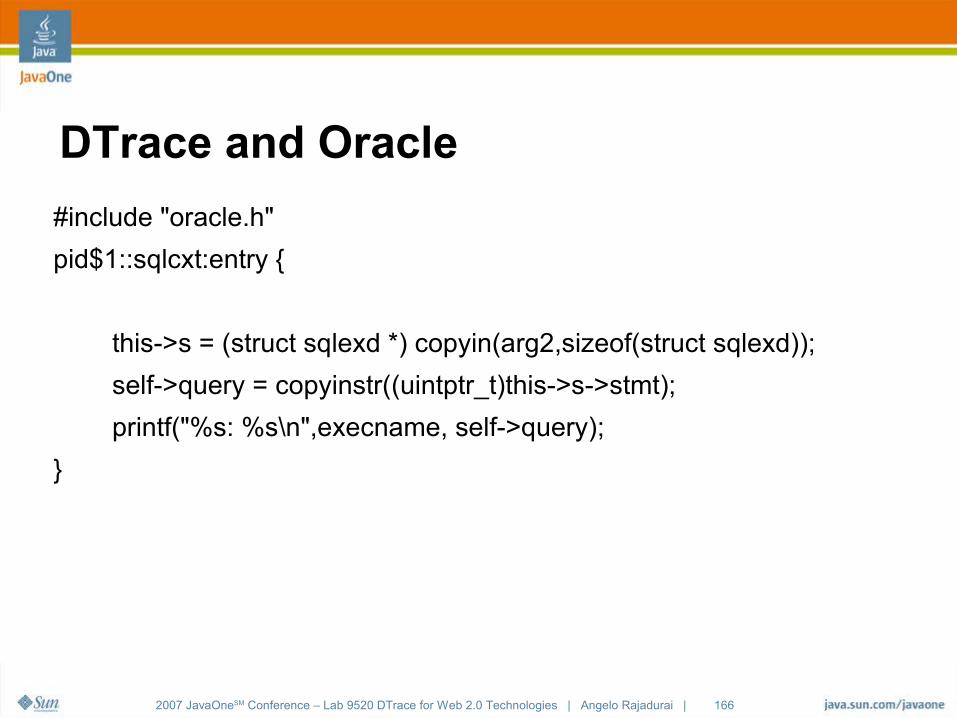
#include "oracle.h"
pid$1::sqlcxt:entry {
this->s = (struct sqlexd *) copyin(arg2,sizeof(struct sqlexd));
self->query = copyinstr((uintptr_t)this->s->stmt);
printf("%s: %s\n",execname, self->query);
}
2007 JavaOneSM Conference – Lab 9520 DTrace for Web 2.0 Technologies | Angelo Rajadurai | 167
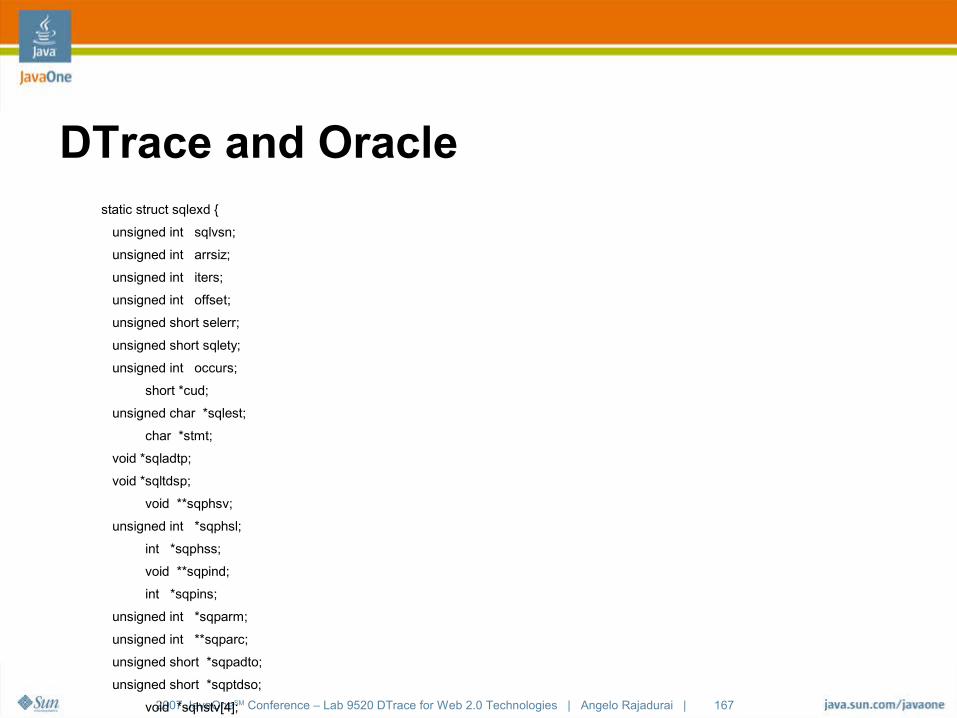
DTrace and Oraclestatic struct sqlexd {
unsigned int sqlvsn;
unsigned int arrsiz;
unsigned int iters;
unsigned int offset;
unsigned short selerr;
unsigned short sqlety;
unsigned int occurs;
short *cud;
unsigned char *sqlest;
char *stmt;
void *sqladtp;
void *sqltdsp;
void **sqphsv;
unsigned int *sqphsl;
int *sqphss;
void **sqpind;
int *sqpins;
unsigned int *sqparm;
unsigned int **sqparc;
unsigned short *sqpadto;
unsigned short *sqptdso;
void *sqhstv[4];
unsigned int sqhstl[4];
int sqhsts[4];
void *sqindv[4];
int sqinds[4];
unsigned int sqharm[4];
unsigned int *sqharc[4];
unsigned short sqadto[4];
unsigned short sqtdso[4];
};
2007 JavaOneSM Conference – Lab 9520 DTrace for Web 2.0 Technologies | Angelo Rajadurai | 168
DTrace and Oracle● Also see script oracle32.d for an example of capturing time taken
for each query● You can use other standard pid provider instrumentation to look at
the oracle process● No need to recompile or restart oracle to use these scripts
2007 JavaOneSM Conference – Lab 9520 DTrace for Web 2.0 Technologies | Angelo Rajadurai | 169
Make your own DTrace providerDIY guide to providers
2007 JavaOneSM Conference – Lab 9520 DTrace for Web 2.0 Technologies | Angelo Rajadurai | 170
Defining Provider & Probes
● Creating your own probe is very very simple. ● Step 1: Figure out what probes you want to add to your app. This is
probably the hardest part. Remember● probes will be used by users who do not understand your
implementation details● probes can be listed so you need to think of how long you want to
support these probes.● probe and provider names should be intuitive● location of probe should be intuitive
● You are more than 80% there.
2007 JavaOneSM Conference – Lab 9520 DTrace for Web 2.0 Technologies | Angelo Rajadurai | 171
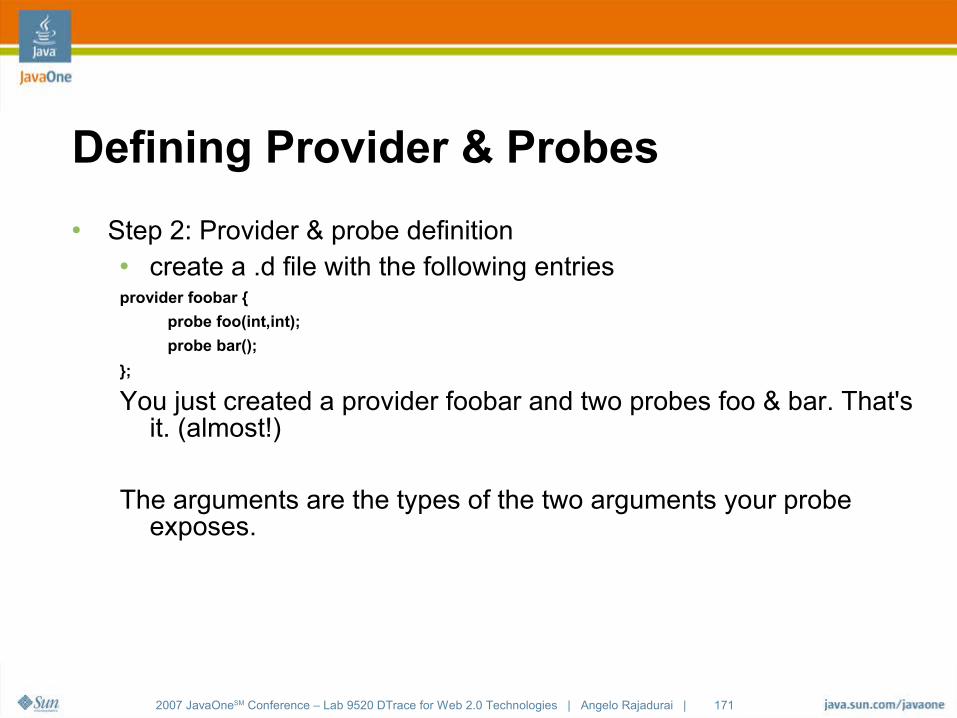
Defining Provider & Probes
● Step 2: Provider & probe definition● create a .d file with the following entriesprovider foobar {
probe foo(int,int);
probe bar();
};
You just created a provider foobar and two probes foo & bar. That's it. (almost!)
The arguments are the types of the two arguments your probe exposes.
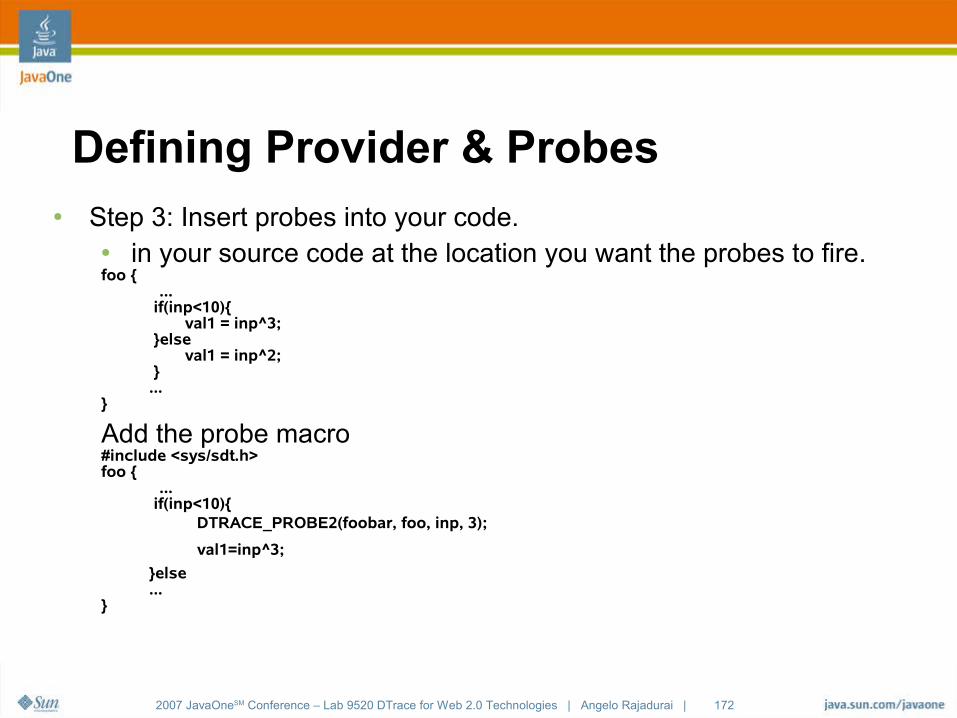
2007 JavaOneSM Conference – Lab 9520 DTrace for Web 2.0 Technologies | Angelo Rajadurai | 172
Defining Provider & Probes● Step 3: Insert probes into your code.
● in your source code at the location you want the probes to fire.foo { ...
if(inp<10){ val1 = inp^3; }else val1 = inp^2; }...
}
Add the probe macro#include <sys/sdt.h>foo { ...
if(inp<10){DTRACE_PROBE2(foobar, foo, inp, 3);
val1=inp^3;
}else...
}
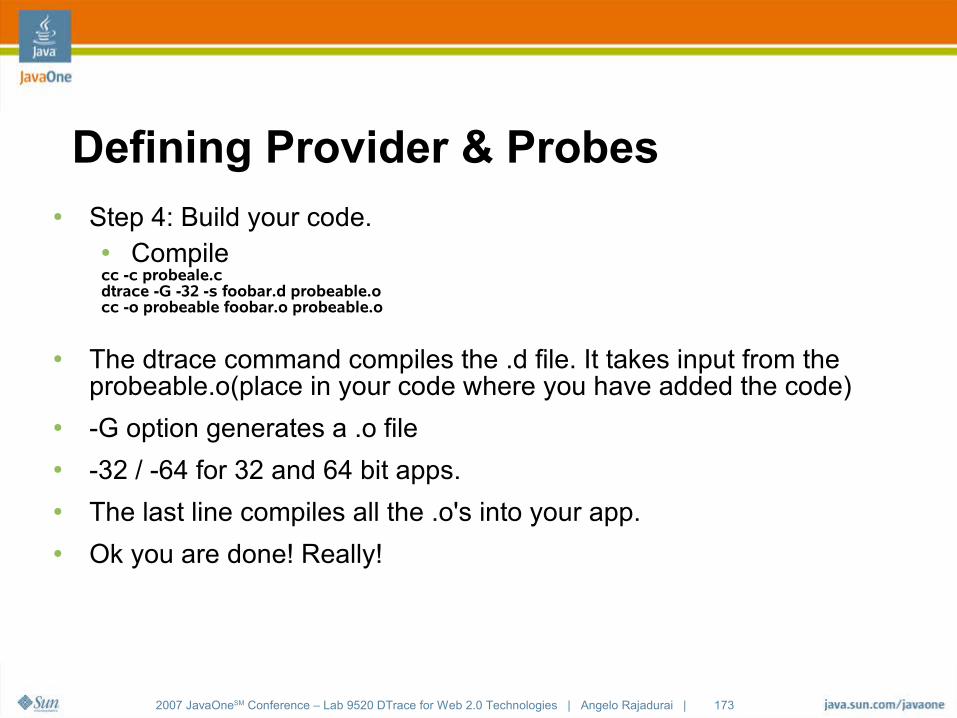
2007 JavaOneSM Conference – Lab 9520 DTrace for Web 2.0 Technologies | Angelo Rajadurai | 173
Defining Provider & Probes● Step 4: Build your code.
● Compilecc -c probeale.c dtrace -G -32 -s foobar.d probeable.o cc -o probeable foobar.o probeable.o
● The dtrace command compiles the .d file. It takes input from the probeable.o(place in your code where you have added the code)
● -G option generates a .o file● -32 / -64 for 32 and 64 bit apps.● The last line compiles all the .o's into your app.● Ok you are done! Really!
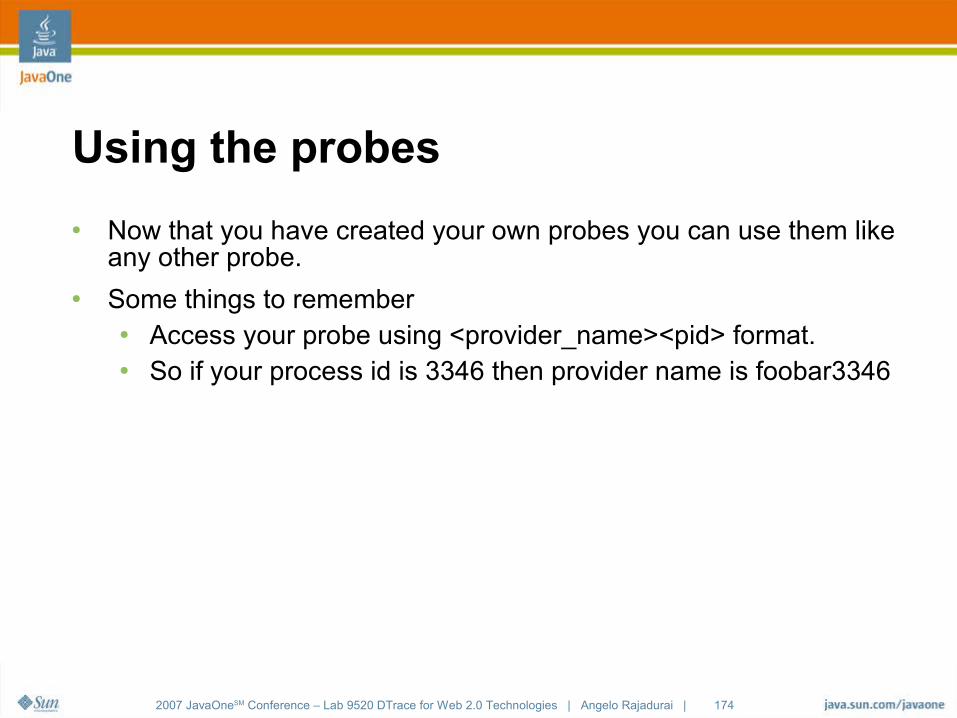
2007 JavaOneSM Conference – Lab 9520 DTrace for Web 2.0 Technologies | Angelo Rajadurai | 174
Using the probes
● Now that you have created your own probes you can use them like any other probe.
● Some things to remember● Access your probe using <provider_name><pid> format.● So if your process id is 3346 then provider name is foobar3346
2007 JavaOneSM Conference – Lab 9520 DTrace for Web 2.0 Technologies | Angelo Rajadurai | 175
Details on DTrace providersMore examples for providers.
2007 JavaOneSM Conference – Lab 9520 DTrace for Web 2.0 Technologies | Angelo Rajadurai | 176
Provider details
Here is some detailed info on providers
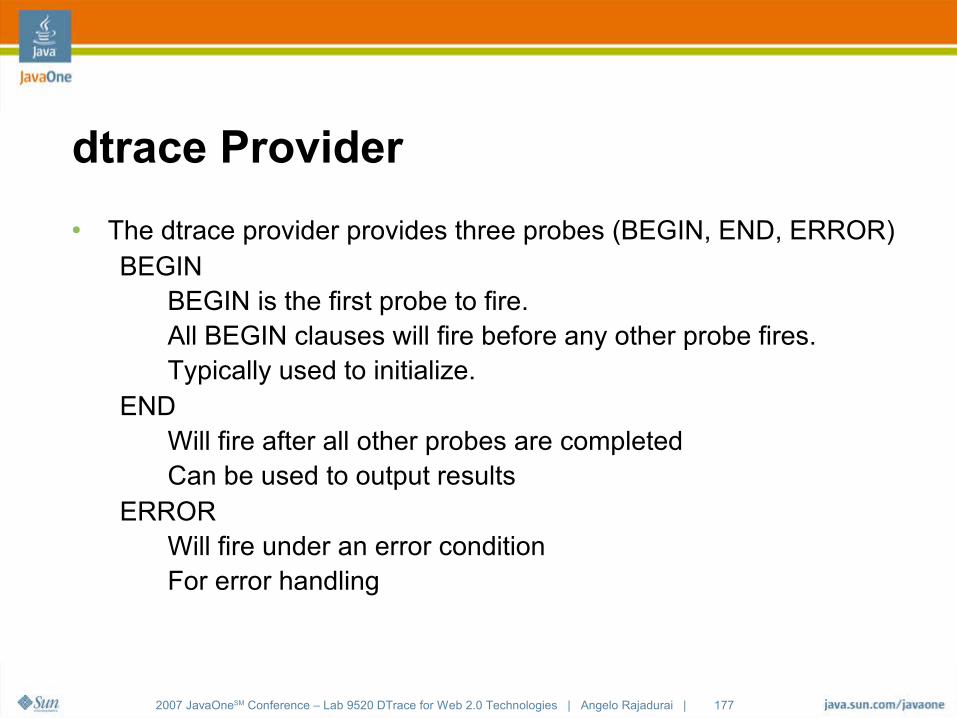
2007 JavaOneSM Conference – Lab 9520 DTrace for Web 2.0 Technologies | Angelo Rajadurai | 177
dtrace Provider
● The dtrace provider provides three probes (BEGIN, END, ERROR)BEGIN
BEGIN is the first probe to fire.All BEGIN clauses will fire before any other probe fires.Typically used to initialize.
END Will fire after all other probes are completedCan be used to output results
ERRORWill fire under an error conditionFor error handling
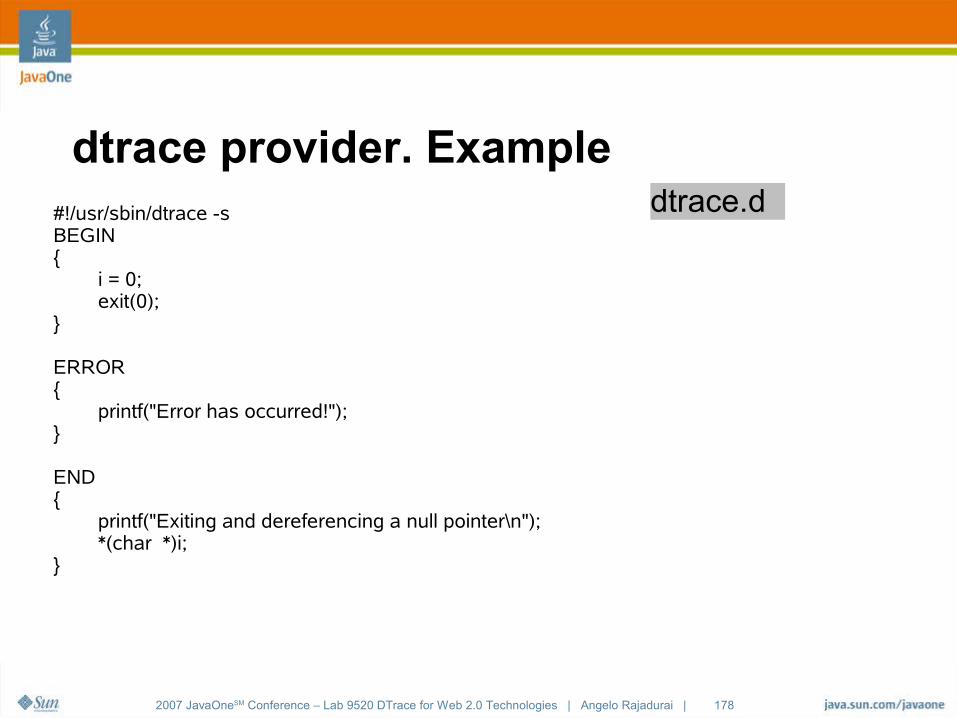
2007 JavaOneSM Conference – Lab 9520 DTrace for Web 2.0 Technologies | Angelo Rajadurai | 178
dtrace provider. Example#!/usr/sbin/dtrace -sBEGIN{ i = 0; exit(0);}
ERROR{ printf("Error has occurred!");}
END{ printf("Exiting and dereferencing a null pointer\n"); *(char *)i; }
dtrace.d

2007 JavaOneSM Conference – Lab 9520 DTrace for Web 2.0 Technologies | Angelo Rajadurai | 179
profile Provider
● Profile providers has probes that will fire at regular intervals. ● These probes are not associated with any kernel or user code
execution● profile provider has two probes. profile probe and tick probe.● format for profile probe: profile-n
● The probe will fire n times a second on every CPU.● An optional ns or nsec (nano sec), us or usec (microsec), msec or
ms (milli sec), sec or s (seconds), min or m (minutes), hour or h (hours), day or d (days) can be added to change the meaning of 'n'.
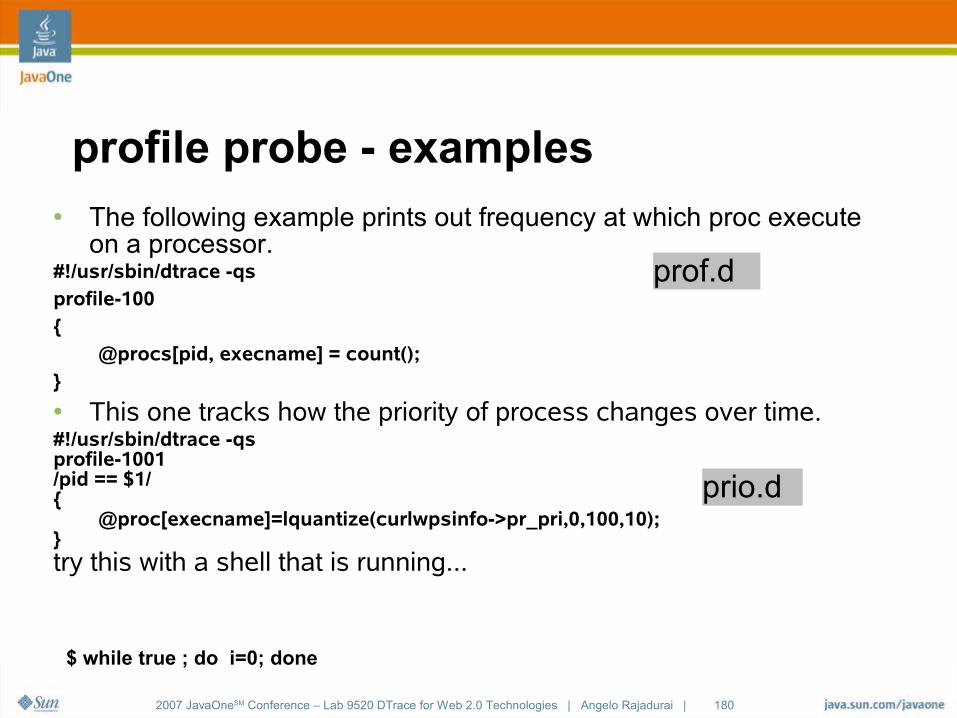
2007 JavaOneSM Conference – Lab 9520 DTrace for Web 2.0 Technologies | Angelo Rajadurai | 180
profile probe - examples● The following example prints out frequency at which proc execute
on a processor.#!/usr/sbin/dtrace -qsprofile-100{ @procs[pid, execname] = count();}● This one tracks how the priority of process changes over time.#!/usr/sbin/dtrace -qsprofile-1001/pid == $1/{ @proc[execname]=lquantize(curlwpsinfo->pr_pri,0,100,10);}try this with a shell that is running...
$ while true ; do i=0; done
prof.d
prio.d
2007 JavaOneSM Conference – Lab 9520 DTrace for Web 2.0 Technologies | Angelo Rajadurai | 181
tick-n probe
● Very similar to profile-n probe ● Only difference is that the probe only fires on one CPU.● The meaning of “n” is similar to the profile-n probe.
2007 JavaOneSM Conference – Lab 9520 DTrace for Web 2.0 Technologies | Angelo Rajadurai | 182
lockstat Provider
● lockstat has two kinds of probes. contention-event probes and hold-event probes.● contention-event – Used to track contention events. As these are
rare it does not impose too much of an overhead and so can be safely enabled
● hold-event – These are to track acquiring and releasing locks. Enabling these probes can incur an overhead as these events are more common.
● lockstat allows you to probe adaptive, spin, thread and reader and writer locks.
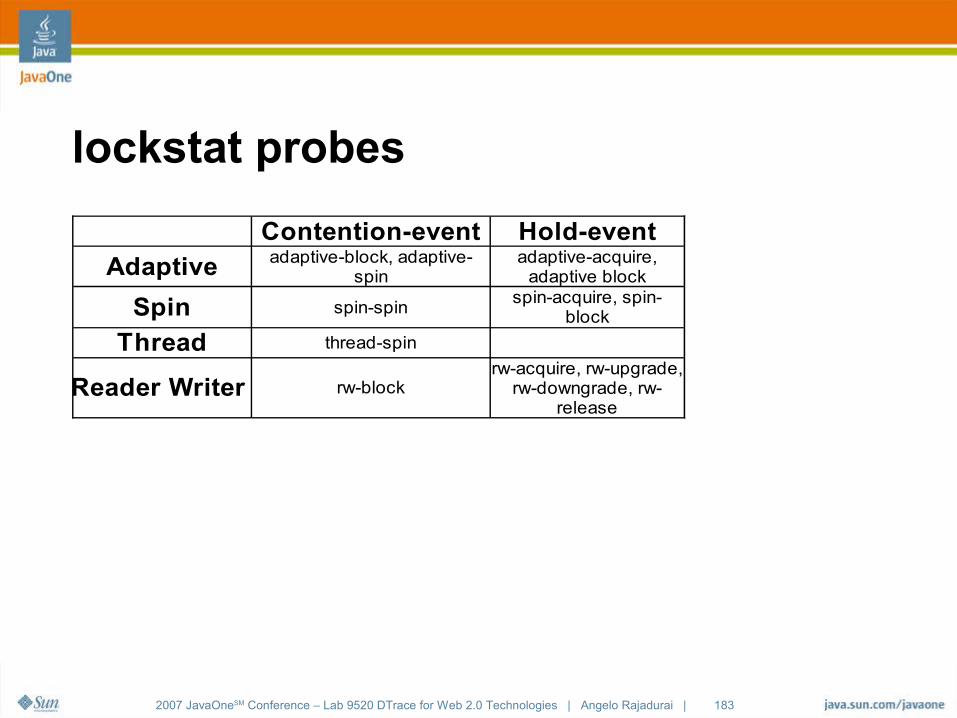
2007 JavaOneSM Conference – Lab 9520 DTrace for Web 2.0 Technologies | Angelo Rajadurai | 183
lockstat probes
Contention-event Hold-event
Adaptive
Spin spin-spin
Thread thread-spin
Reader Writer rw-block
adaptive-block, adaptive-spin
adaptive-acquire, adaptive block
spin-acquire, spin-block
rw-acquire, rw-upgrade, rw-downgrade, rw-
release
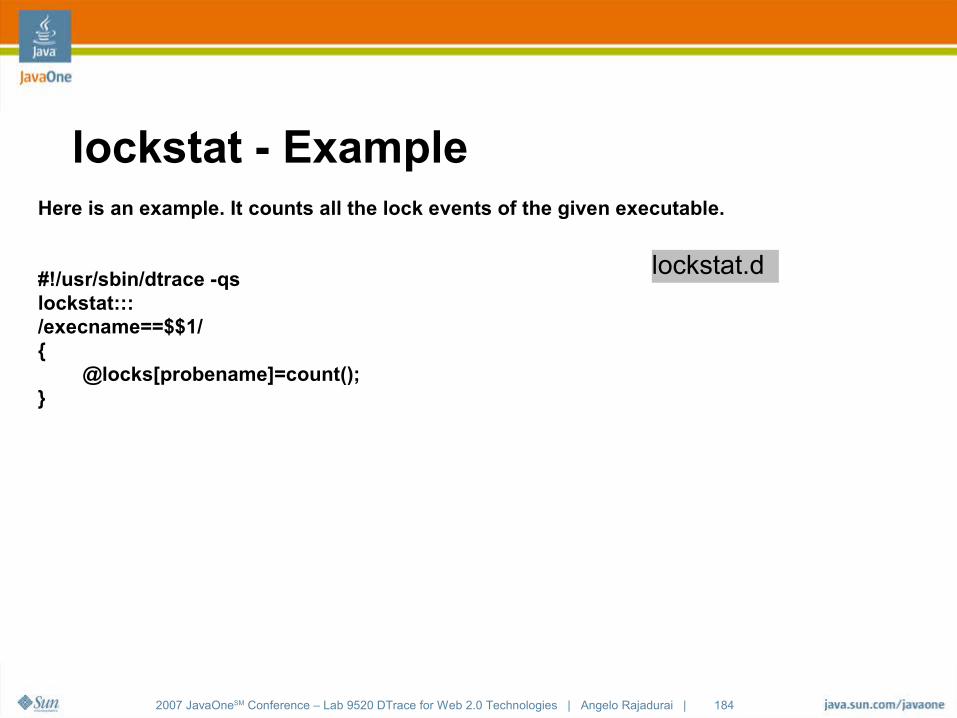
2007 JavaOneSM Conference – Lab 9520 DTrace for Web 2.0 Technologies | Angelo Rajadurai | 184
lockstat - ExampleHere is an example. It counts all the lock events of the given executable.
#!/usr/sbin/dtrace -qslockstat:::/execname==$$1/{ @locks[probename]=count();}
lockstat.d
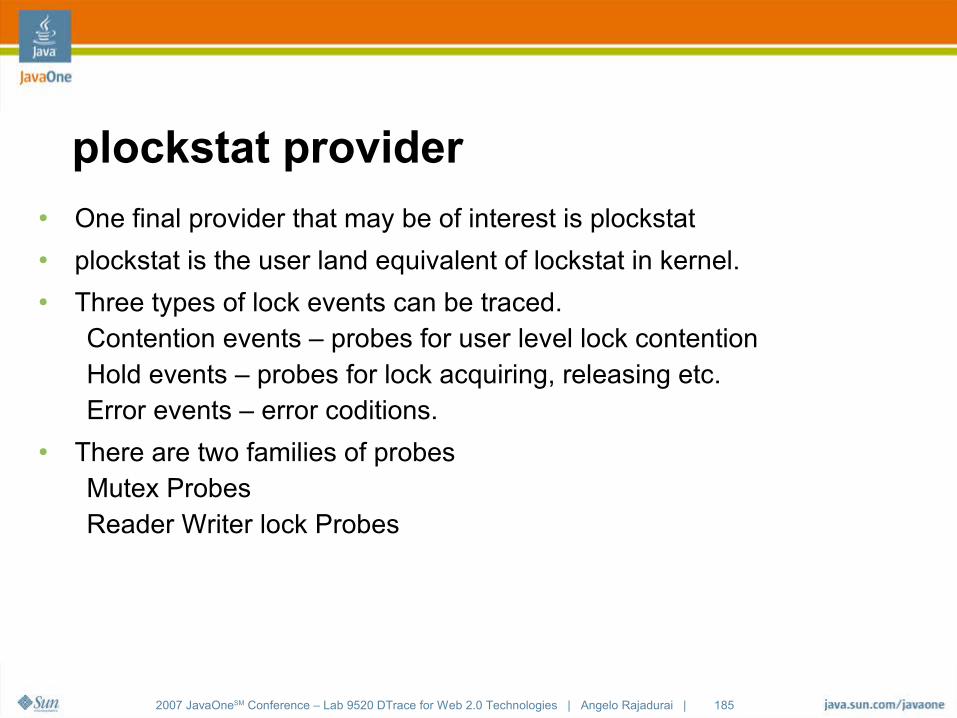
2007 JavaOneSM Conference – Lab 9520 DTrace for Web 2.0 Technologies | Angelo Rajadurai | 185
plockstat provider● One final provider that may be of interest is plockstat● plockstat is the user land equivalent of lockstat in kernel.● Three types of lock events can be traced.
Contention events – probes for user level lock contention Hold events – probes for lock acquiring, releasing etc.Error events – error coditions.
● There are two families of probesMutex ProbesReader Writer lock Probes
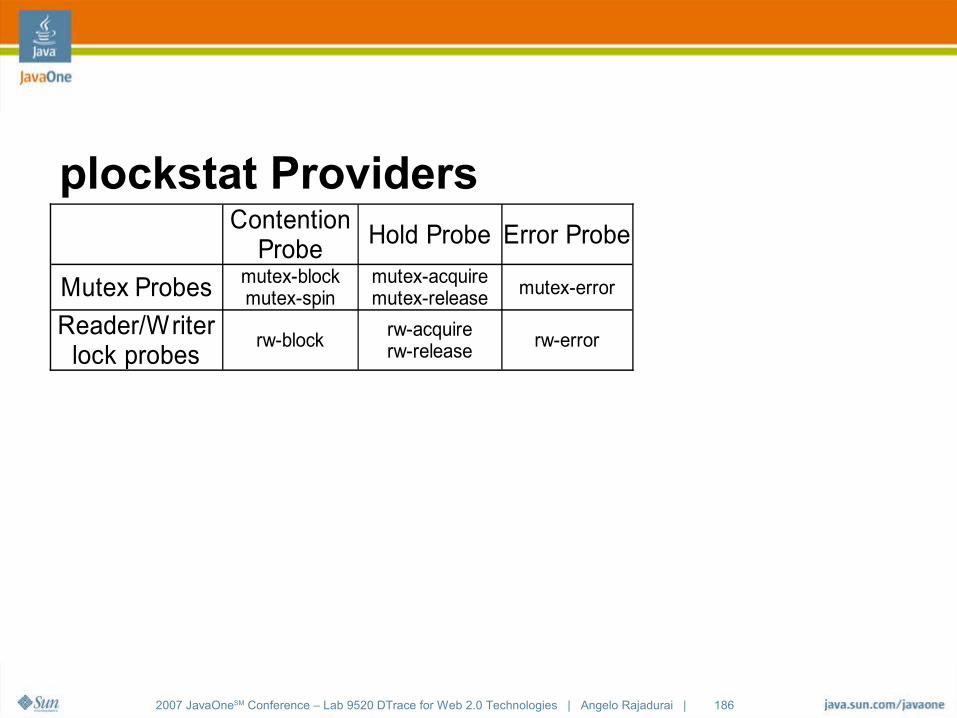
2007 JavaOneSM Conference – Lab 9520 DTrace for Web 2.0 Technologies | Angelo Rajadurai | 186
plockstat ProvidersHold Probe Error Probe
Mutex Probes mutex-error
rw-block rw-error
Contention Probe
mutex-block mutex-spin
mutex-acquire mutex-release
Reader/Writer lock probes
rw-acquire rw-release
2007 JavaOneSM Conference – Lab 9520 DTrace for Web 2.0 Technologies | Angelo Rajadurai | 187
fbt Provider
● The fbt – Function Boundary Tracing provider has probe into most functions in the kernel.
● Using fbt probe you can track entry and return from almost every function in the kernel.
● There are over 20,000 fbt probe in even the smallest Solaris systems● You'd need Solaris internal knowledge to be able to use this
effectively● Once opensolaris.org has entire Solaris code you will be able to use
these probes more effectively.● Very useful if you develop your own kernel module.● We will see a few examples.
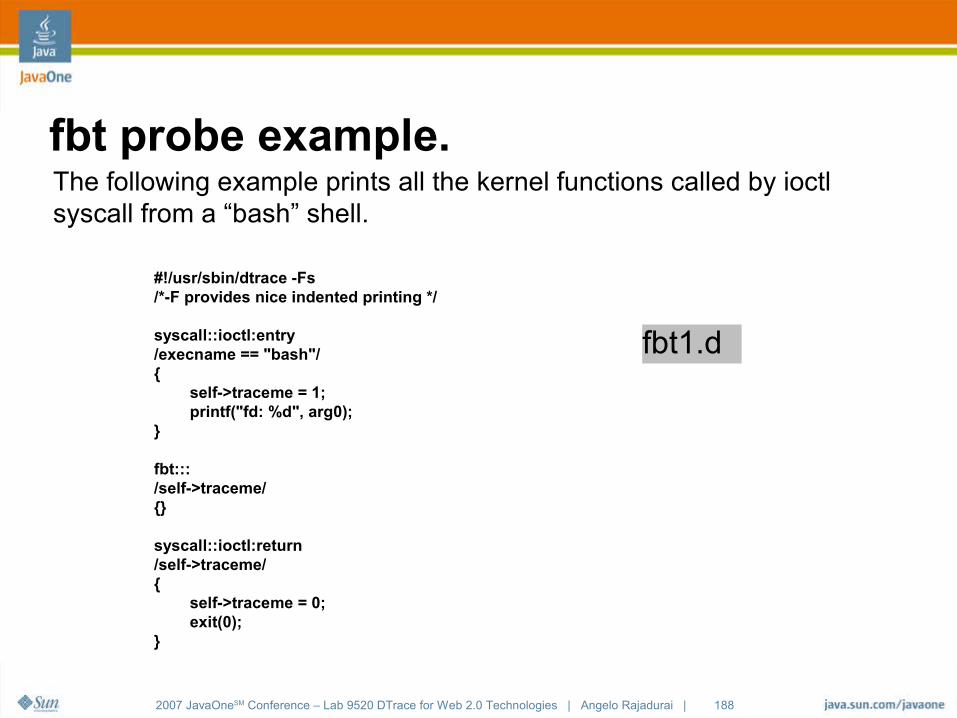
2007 JavaOneSM Conference – Lab 9520 DTrace for Web 2.0 Technologies | Angelo Rajadurai | 188
fbt probe example.
#!/usr/sbin/dtrace -Fs/*-F provides nice indented printing */
syscall::ioctl:entry/execname == "bash"/{ self->traceme = 1; printf("fd: %d", arg0);}
fbt:::/self->traceme/{}
syscall::ioctl:return/self->traceme/{ self->traceme = 0; exit(0);}
The following example prints all the kernel functions called by ioctl syscall from a “bash” shell.
fbt1.d

2007 JavaOneSM Conference – Lab 9520 DTrace for Web 2.0 Technologies | Angelo Rajadurai | 189
proc Provider
● The proc Provider has probes for process/lwp lifecyclecreate – fires when a proc is created using fork and its variantsexec – fires when exec and its variants are calledexec-failure & exec-success – when exec fails or succeedslwp-create, lwp-start, lwp-exit – lwp life cycle probessignal-send, signal-handle, signal-clear – probes for various
signal statesstart – fires when a process starts before the first instruction is
executed.
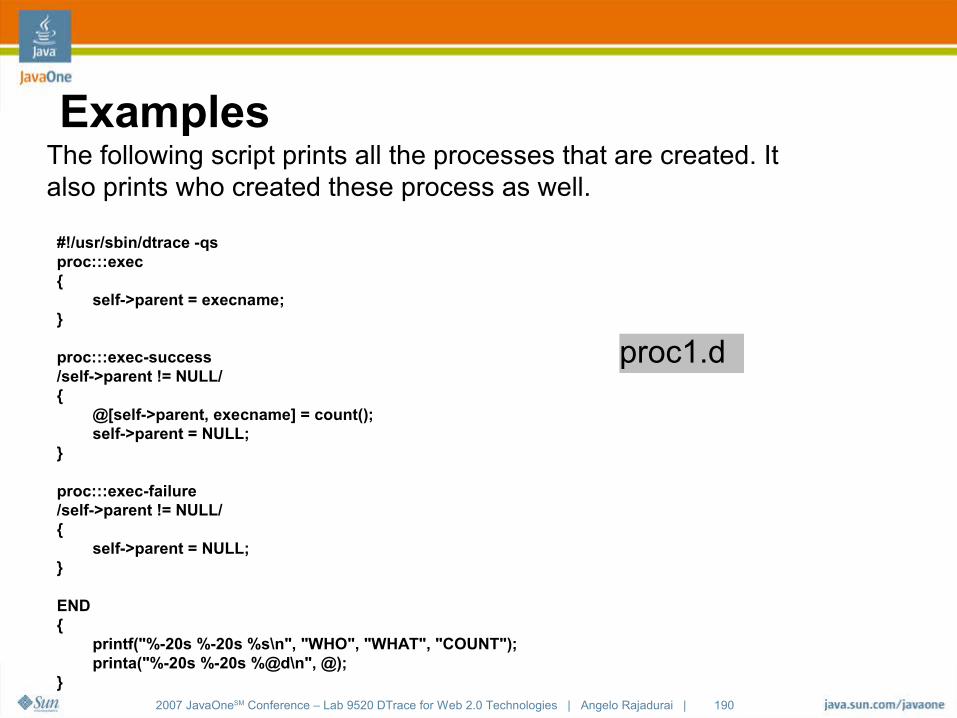
2007 JavaOneSM Conference – Lab 9520 DTrace for Web 2.0 Technologies | Angelo Rajadurai | 190
Examples
#!/usr/sbin/dtrace -qsproc:::exec { self->parent = execname; }
proc:::exec-success /self->parent != NULL/ { @[self->parent, execname] = count(); self->parent = NULL; }
proc:::exec-failure /self->parent != NULL/ { self->parent = NULL; }
END { printf("%-20s %-20s %s\n", "WHO", "WHAT", "COUNT"); printa("%-20s %-20s %@d\n", @); }
The following script prints all the processes that are created. It also prints who created these process as well.
proc1.d
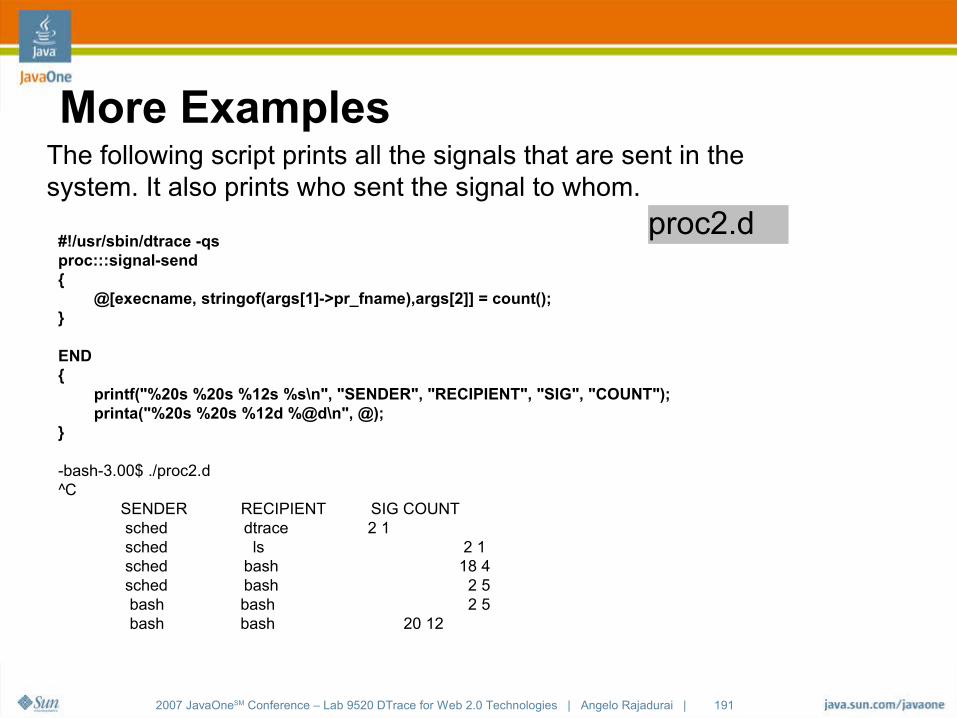
2007 JavaOneSM Conference – Lab 9520 DTrace for Web 2.0 Technologies | Angelo Rajadurai | 191
More Examples
#!/usr/sbin/dtrace -qsproc:::signal-send{ @[execname, stringof(args[1]->pr_fname),args[2]] = count();}
END{ printf("%20s %20s %12s %s\n", "SENDER", "RECIPIENT", "SIG", "COUNT"); printa("%20s %20s %12d %@d\n", @); } -bash-3.00$ ./proc2.d^C SENDER RECIPIENT SIG COUNT sched dtrace 2 1 sched ls 2 1 sched bash 18 4 sched bash 2 5 bash bash 2 5 bash bash 20 12
The following script prints all the signals that are sent in the system. It also prints who sent the signal to whom.
proc2.d
2007 JavaOneSM Conference – Lab 9520 DTrace for Web 2.0 Technologies | Angelo Rajadurai | 192
sched Provider
● The sched provider allows users to gain insight into how a process is scheduled. It helps answer questions like why and when did the thread of interest change priority.
● The following are a few probes that are part of the sched provider.change-pri – When priority changesdqueue/enqueue – when proc taken off or put on the run queueoff-cpu / on-cpu – when thread taken off or put on a cpu.preempt – when thread preemptedsleep / wakeup – when thread sleep on a synchronization object
and when it wakes up.
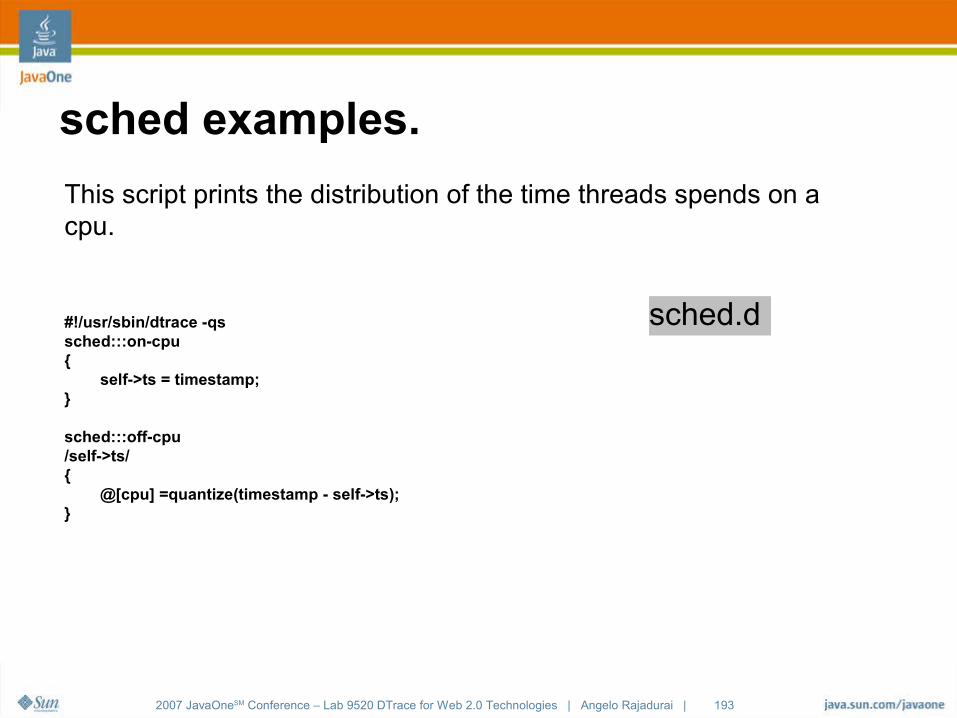
2007 JavaOneSM Conference – Lab 9520 DTrace for Web 2.0 Technologies | Angelo Rajadurai | 193
sched examples.
#!/usr/sbin/dtrace -qssched:::on-cpu{ self->ts = timestamp;}
sched:::off-cpu/self->ts/{ @[cpu] =quantize(timestamp - self->ts);}
This script prints the distribution of the time threads spends on a cpu.
sched.d
2007 JavaOneSM Conference – Lab 9520 DTrace for Web 2.0 Technologies | Angelo Rajadurai | 194
DTrace advanced topicsA peek into more that can be done with DTrace

2007 JavaOneSM Conference – Lab 9520 DTrace for Web 2.0 Technologies | Angelo Rajadurai | 195
Arrays
name[key] = expression;● name – name of array
● key – list of scalar expression values (tuples)
● expression – evaluates to the type of array#!/usr/sbin/dtrace -ssyscall::open*:entry,syscall::close*:entry{ ts[probefunc,pid,tid]=timestamp; /* save time stamp at entry */}
syscall::open*:return,syscall::close*:return{ timespent = timestamp - ts[probefunc,pid,tid]; printf("%s threadID %d spent %d nsecs in %s\n", execname, tid, timespent, probefunc); /* print time-spent at return */ ts[probefunc,pid,tid]=0; timespent = 0;}
array.d
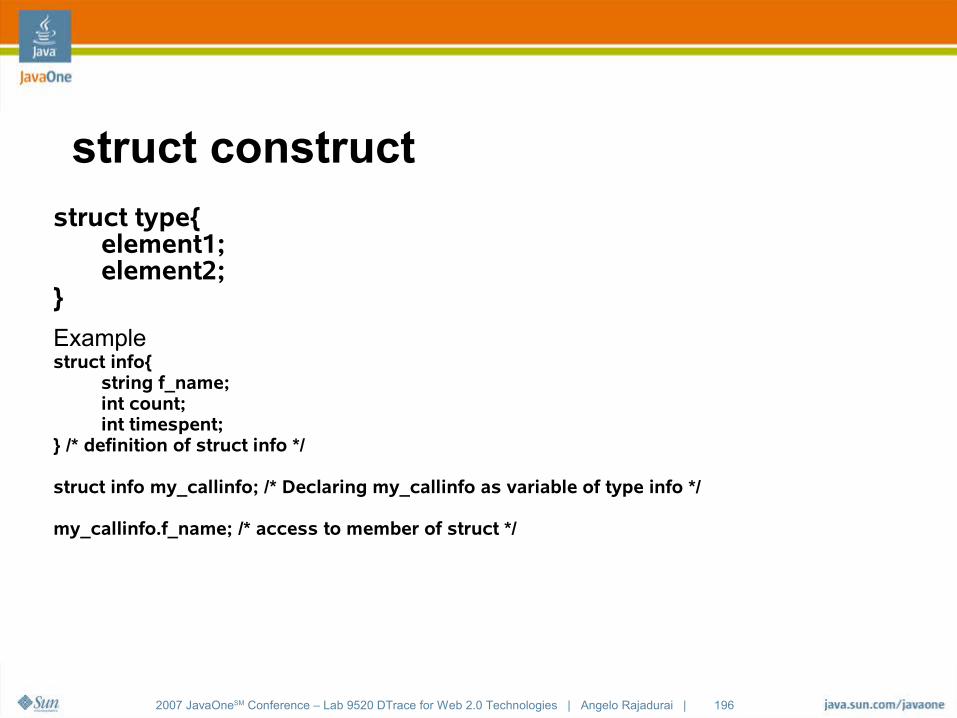
2007 JavaOneSM Conference – Lab 9520 DTrace for Web 2.0 Technologies | Angelo Rajadurai | 196
struct construct
struct type{element1;element2;
}
Examplestruct info{
string f_name;int count;int timespent;
} /* definition of struct info */
struct info my_callinfo; /* Declaring my_callinfo as variable of type info */
my_callinfo.f_name; /* access to member of struct */
2007 JavaOneSM Conference – Lab 9520 DTrace for Web 2.0 Technologies | Angelo Rajadurai | 197
Postmortem TracingCold cases!
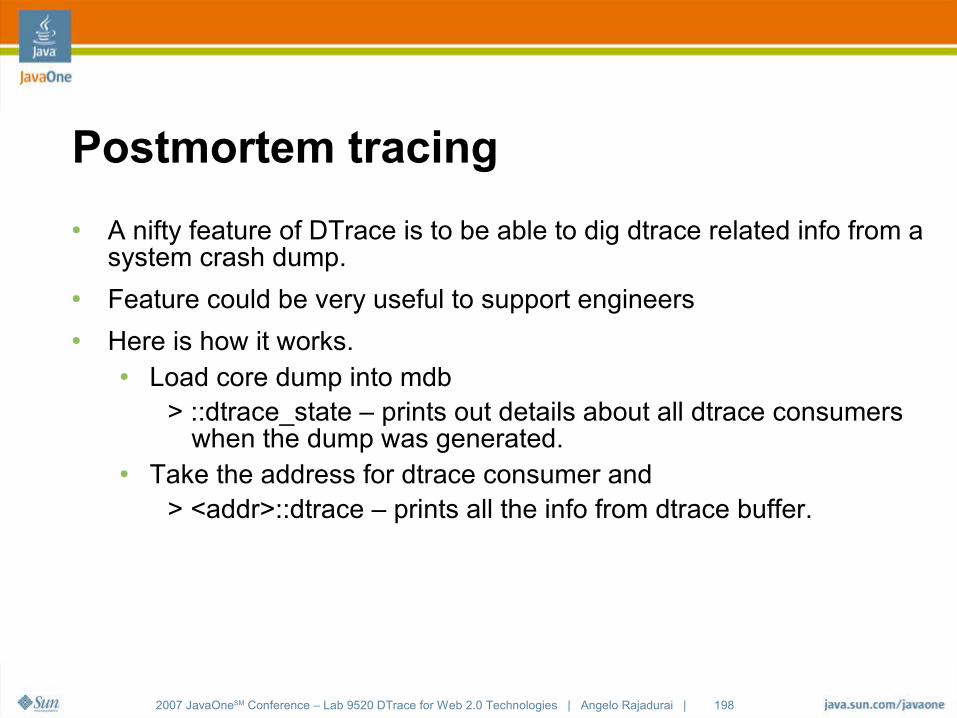
2007 JavaOneSM Conference – Lab 9520 DTrace for Web 2.0 Technologies | Angelo Rajadurai | 198
Postmortem tracing
● A nifty feature of DTrace is to be able to dig dtrace related info from a system crash dump.
● Feature could be very useful to support engineers● Here is how it works.
● Load core dump into mdb> ::dtrace_state – prints out details about all dtrace consumers
when the dump was generated. ● Take the address for dtrace consumer and
> <addr>::dtrace – prints all the info from dtrace buffer.
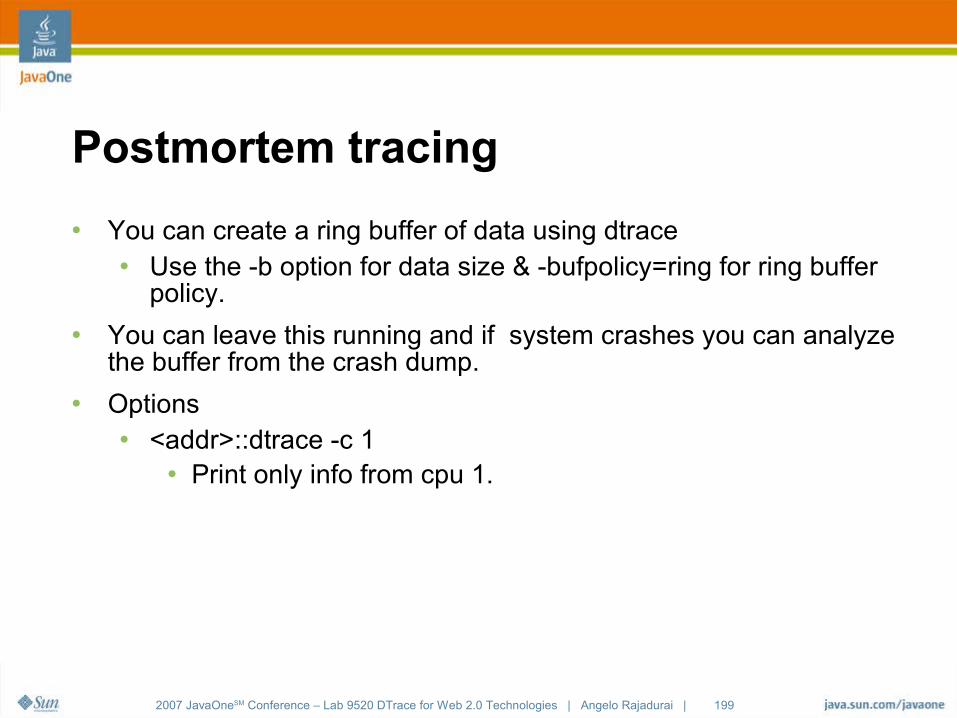
2007 JavaOneSM Conference – Lab 9520 DTrace for Web 2.0 Technologies | Angelo Rajadurai | 199
Postmortem tracing
● You can create a ring buffer of data using dtrace● Use the -b option for data size & -bufpolicy=ring for ring buffer
policy.● You can leave this running and if system crashes you can analyze
the buffer from the crash dump.● Options
● <addr>::dtrace -c 1● Print only info from cpu 1.
2007 JavaOneSM Conference – Lab 9520 DTrace for Web 2.0 Technologies | Angelo Rajadurai | 200
Speculative tracingDTrace meets Las Vegas

2007 JavaOneSM Conference – Lab 9520 DTrace for Web 2.0 Technologies | Angelo Rajadurai | 201
Speculation
● We will now see how to catch a bad code path using speculation!● Here is why we need speculation.
● Some time we only see error message after the error has occured.
For example: We see a function return an error but the problem was caused by something that the function did earlier.
We see the error and want to go back and find out what the function did wrong. But alas the function has already happened
● One solution could be to save details every time the function executes but this is wasting trace buffer with a lot of useless data when were are only concerned about the one time the function failed.
● A better solution - speculation
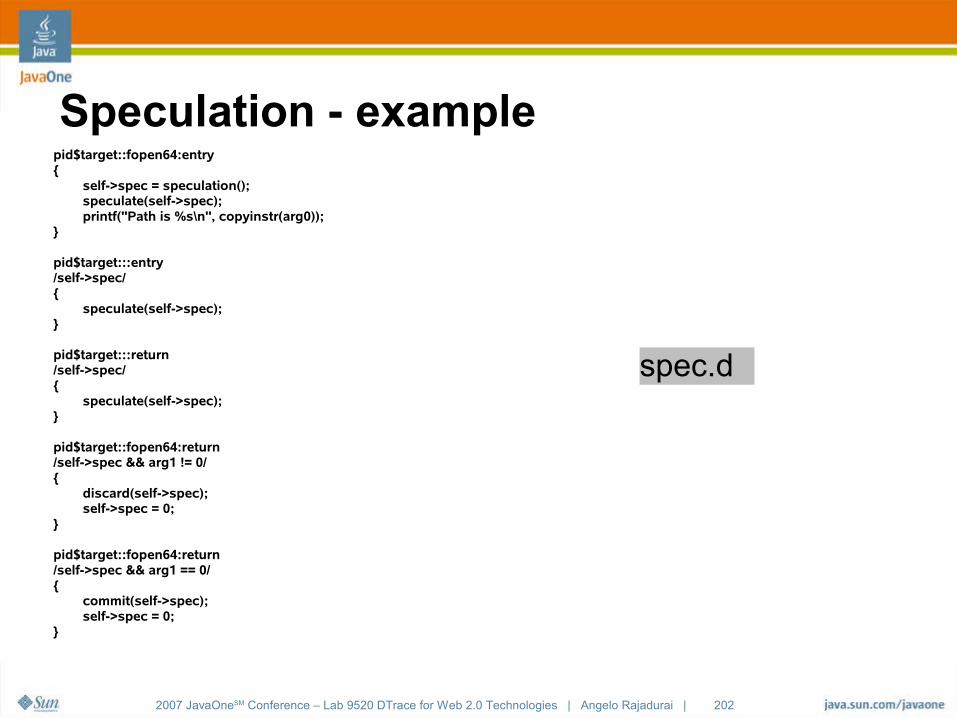
2007 JavaOneSM Conference – Lab 9520 DTrace for Web 2.0 Technologies | Angelo Rajadurai | 202
Speculation - examplepid$target::fopen64:entry { self->spec = speculation(); speculate(self->spec); printf("Path is %s\n", copyinstr(arg0));}
pid$target:::entry/self->spec/ { speculate(self->spec); }
pid$target:::return/self->spec/ { speculate(self->spec); }
pid$target::fopen64:return /self->spec && arg1 != 0/{ discard(self->spec); self->spec = 0; }
pid$target::fopen64:return /self->spec && arg1 == 0/ { commit(self->spec); self->spec = 0; }
spec.d
2007 JavaOneSM Conference – Lab 9520 DTrace for Web 2.0 Technologies | Angelo Rajadurai | 203
DTrace configurationFine tune the tool!
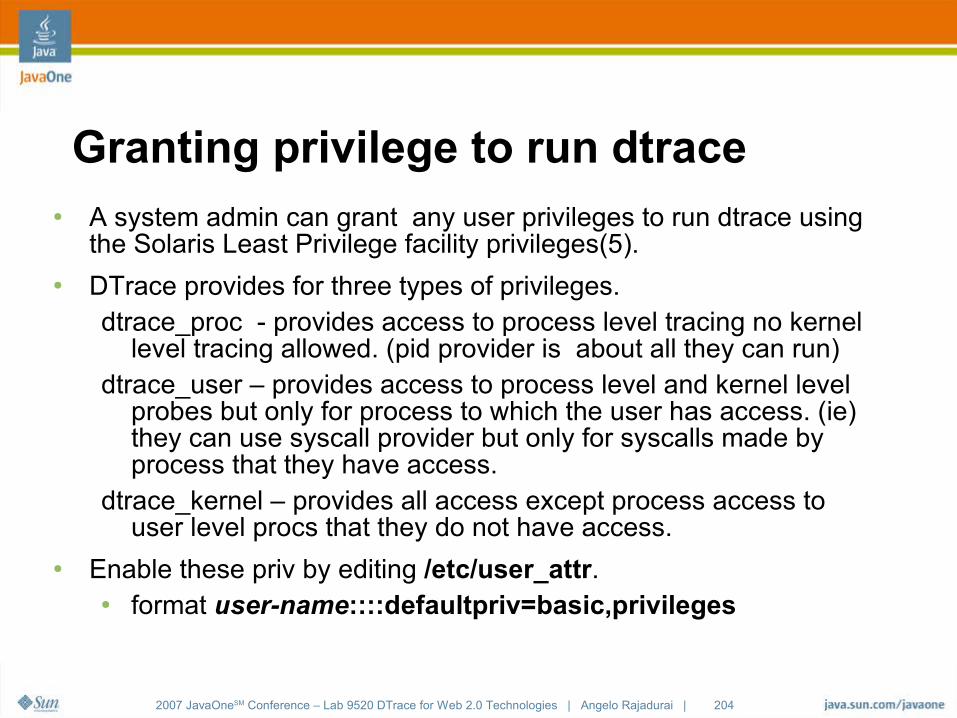
2007 JavaOneSM Conference – Lab 9520 DTrace for Web 2.0 Technologies | Angelo Rajadurai | 204
Granting privilege to run dtrace● A system admin can grant any user privileges to run dtrace using
the Solaris Least Privilege facility privileges(5).● DTrace provides for three types of privileges.
dtrace_proc - provides access to process level tracing no kernel level tracing allowed. (pid provider is about all they can run)
dtrace_user – provides access to process level and kernel level probes but only for process to which the user has access. (ie) they can use syscall provider but only for syscalls made by process that they have access.
dtrace_kernel – provides all access except process access to user level procs that they do not have access.
● Enable these priv by editing /etc/user_attr. ● format user-name::::defaultpriv=basic,privileges
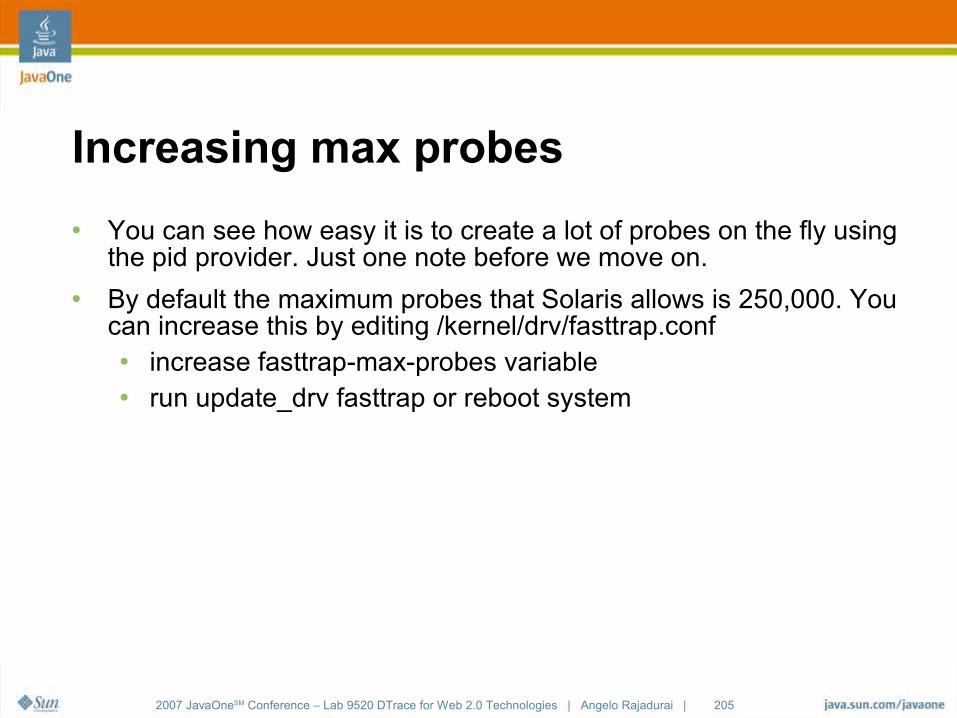
2007 JavaOneSM Conference – Lab 9520 DTrace for Web 2.0 Technologies | Angelo Rajadurai | 205
Increasing max probes
● You can see how easy it is to create a lot of probes on the fly using the pid provider. Just one note before we move on.
● By default the maximum probes that Solaris allows is 250,000. You can increase this by editing /kernel/drv/fasttrap.conf ● increase fasttrap-max-probes variable● run update_drv fasttrap or reboot system
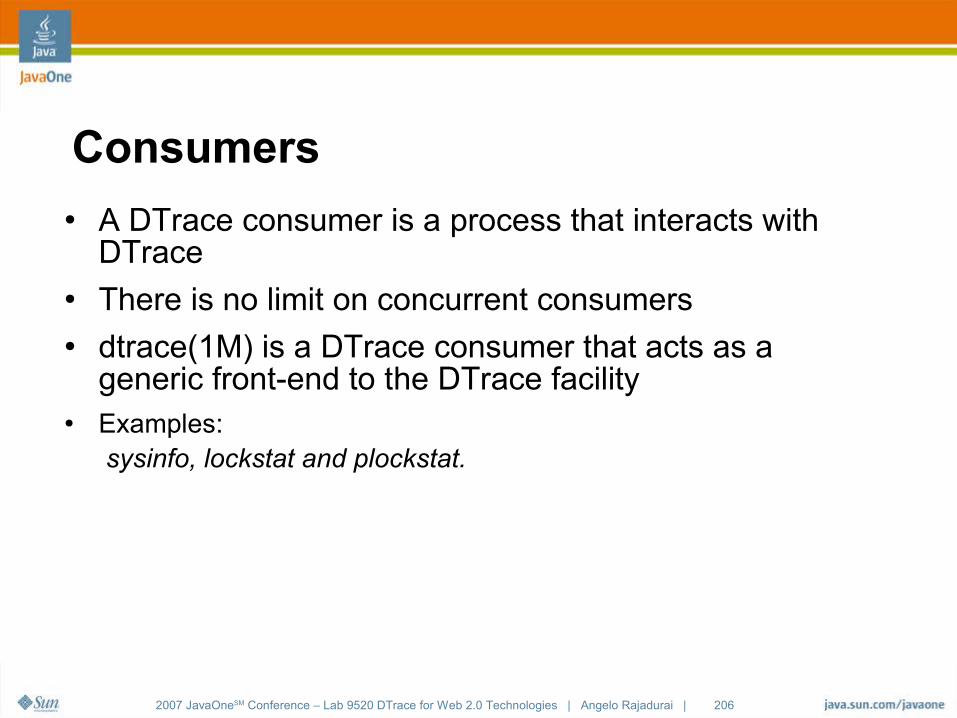
2007 JavaOneSM Conference – Lab 9520 DTrace for Web 2.0 Technologies | Angelo Rajadurai | 206
Consumers● A DTrace consumer is a process that interacts with
DTrace● There is no limit on concurrent consumers● dtrace(1M) is a DTrace consumer that acts as a
generic front-end to the DTrace facility● Examples:
sysinfo, lockstat and plockstat.
2007 JavaOneSM Conference – Lab 9520 DTrace for Web 2.0 Technologies | Angelo Rajadurai | 207
DTrace more resourcesYes there is more to DTrace than can be captured in 200 slides

2007 JavaOneSM Conference – Lab 9520 DTrace for Web 2.0 Technologies | Angelo Rajadurai | 208
DTrace Resources
● Here are a few of the many DTrace resources available for you● “Solaris Dynamic Tracing Guide” is an excellent resource. Many of
the examples in this presentation are from the Guide. http://docs.sun.com/db/doc/817-6223
● OpenSolaris DTrace community is one of the best places to get an answer on anything DTrace.http://opensolaris.org/os/community/dtrace/Forum: http://www.opensolaris.org/jive/forum.jspa?forumID=7
● The Big admin DTrace web page has a lot of good infohttp://www.sun.com/bigadmin/content/dtrace/
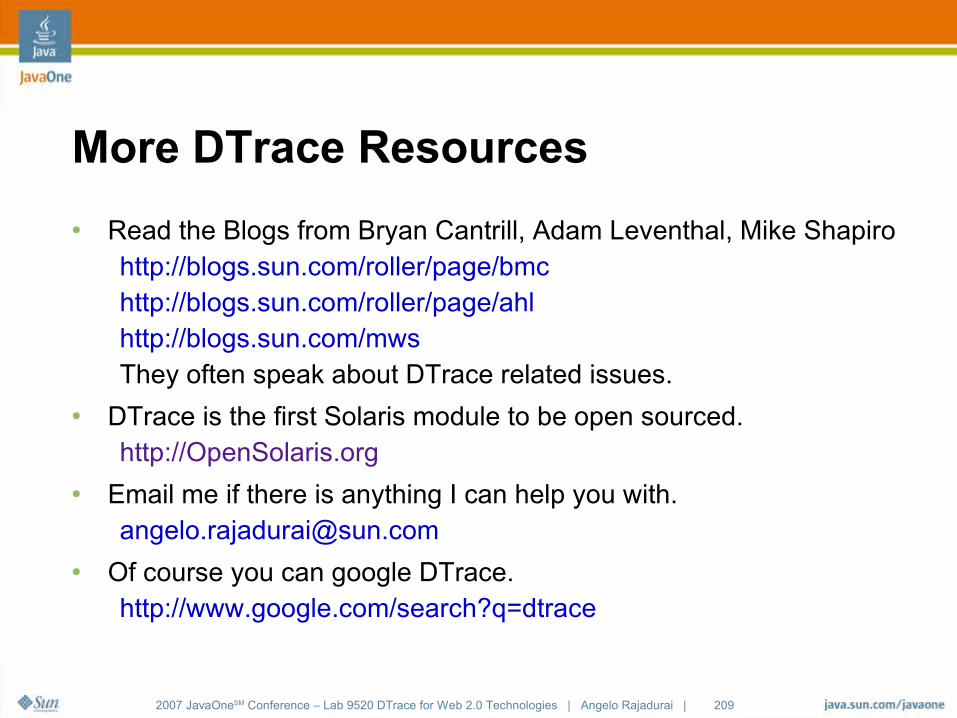
2007 JavaOneSM Conference – Lab 9520 DTrace for Web 2.0 Technologies | Angelo Rajadurai | 209
More DTrace Resources
● Read the Blogs from Bryan Cantrill, Adam Leventhal, Mike Shapirohttp://blogs.sun.com/roller/page/bmchttp://blogs.sun.com/roller/page/ahlhttp://blogs.sun.com/mwsThey often speak about DTrace related issues.
● DTrace is the first Solaris module to be open sourced.http://OpenSolaris.org
● Email me if there is anything I can help you [email protected]
● Of course you can google DTrace.http://www.google.com/search?q=dtrace
2007 JavaOneSM Conference – Lab 9520 DTrace for Web 2.0 Technologies | Angelo Rajadurai |
Angelo RajaduraiISV Engineering - AmericasSun Microsystems
Solaris Dynamic Tracing for Web 2.0 Technologies