Embed Size (px)
Citation preview

Lab 8Muscle Physiology
Gilbert R. Pitts, Ph.D., Joseph R. Schiller, Ph.D., and James F. Thompson, Ph.D.

Lab 8 Activities
1. Biopac Exercise L02-EMG-2: Skeletal Muscle Physiology
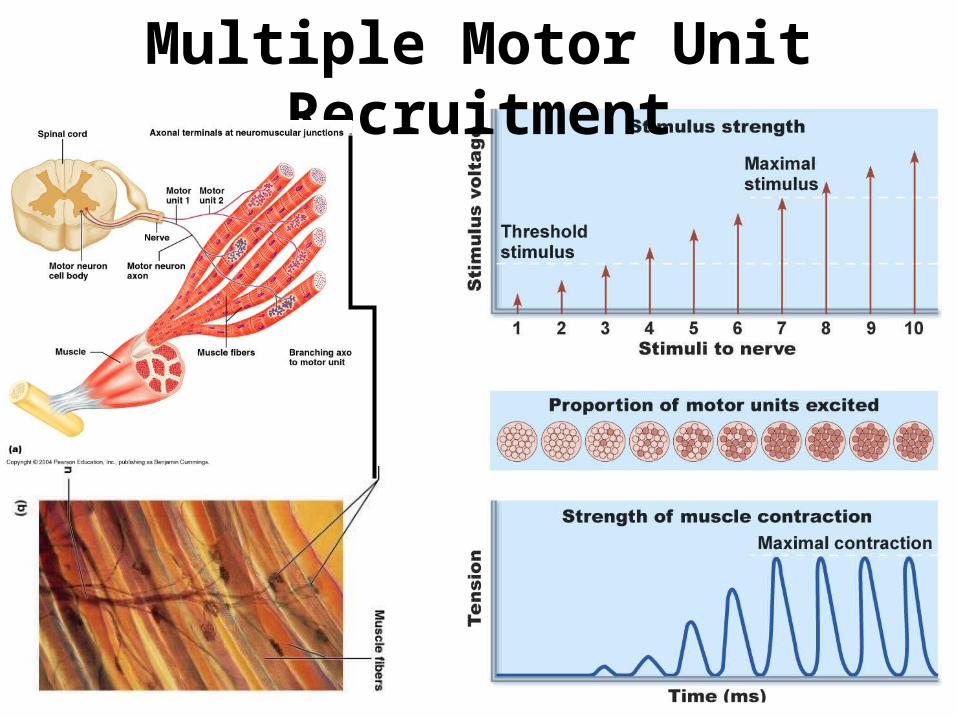
Multiple Motor Unit Recruitment
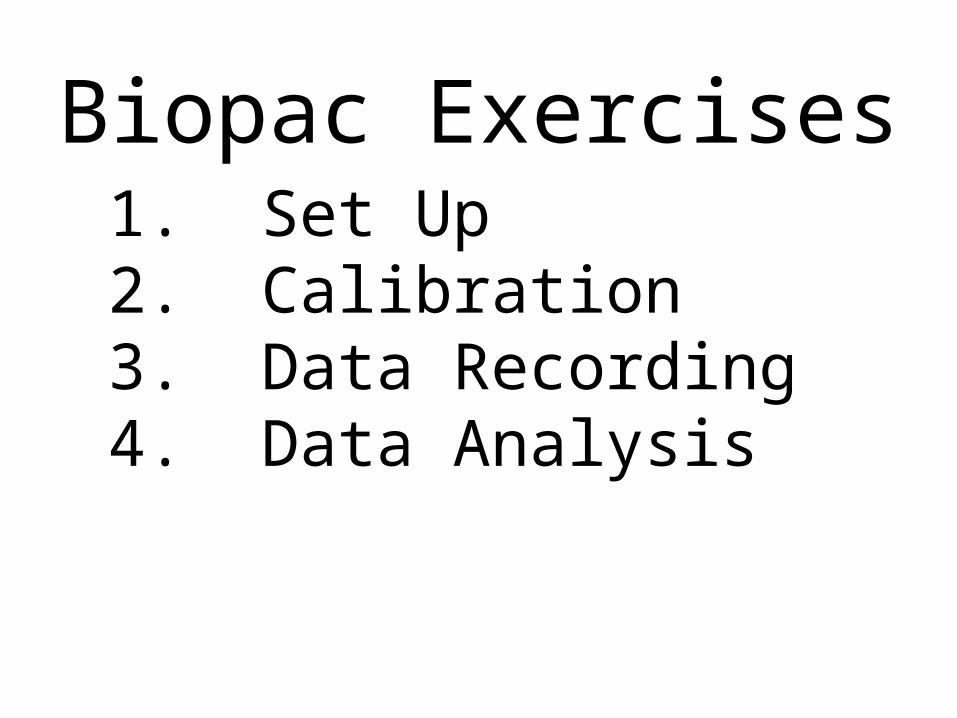
Biopac Exercises1. Set Up2. Calibration3. Data Recording4. Data Analysis
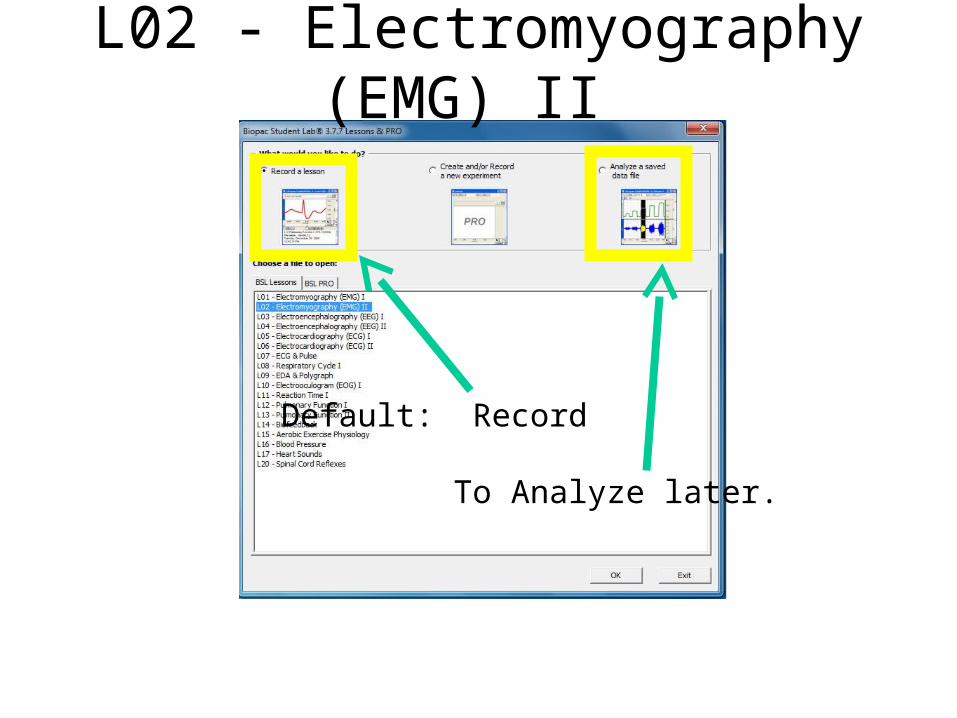
L02 - Electromyography (EMG) II
Default: Record
To Analyze later.
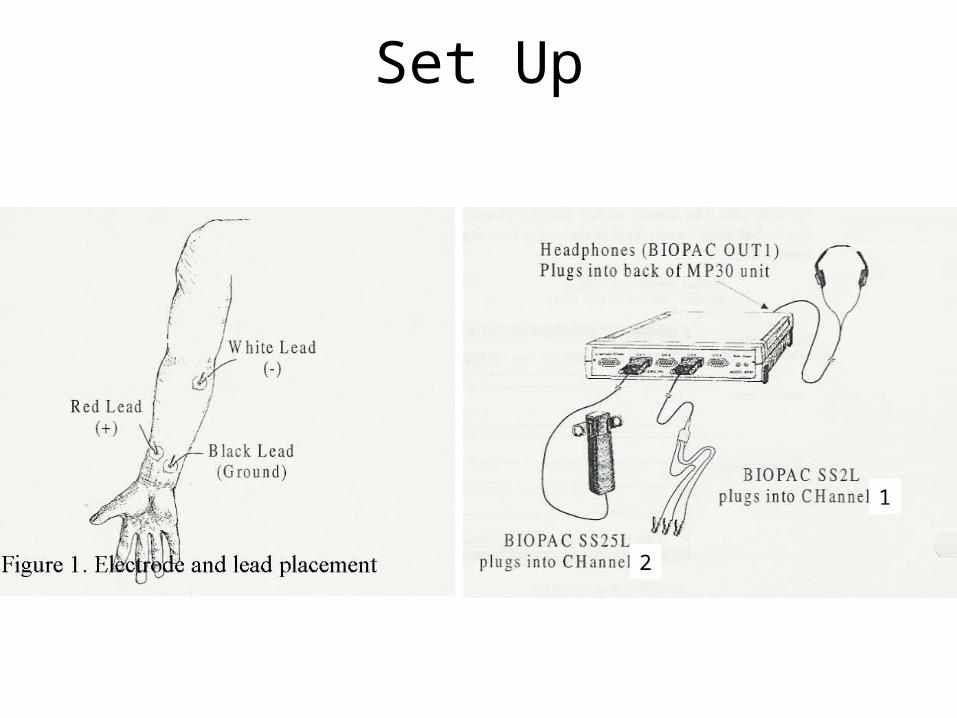
Set Up
2
1
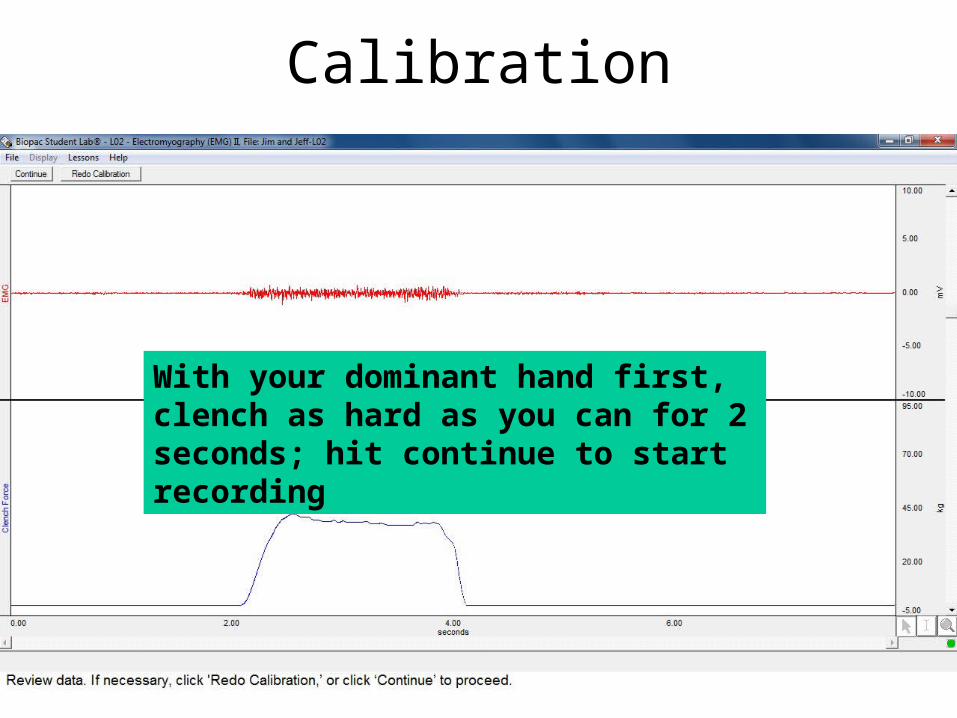
Calibration
With your dominant hand first, clench as hard as you can for 2 seconds; hit continue to start recording
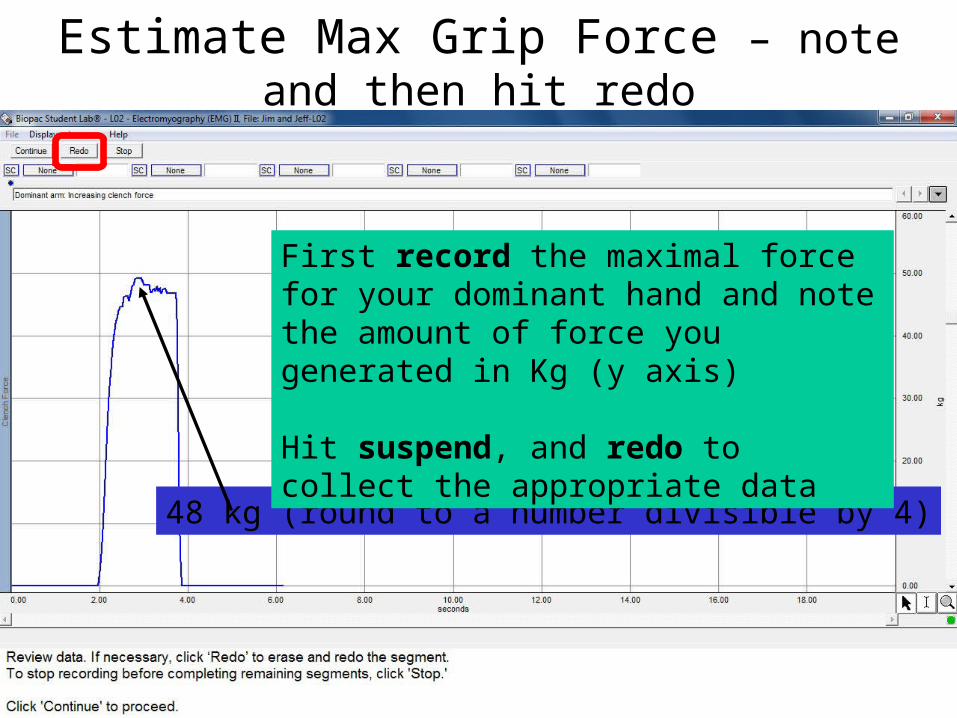
Estimate Max Grip Force – note and then hit redo
48 kg (round to a number divisible by 4)
First record the maximal force for your dominant hand and note the amount of force you generated in Kg (y axis)
Hit suspend, and redo to collect the appropriate data
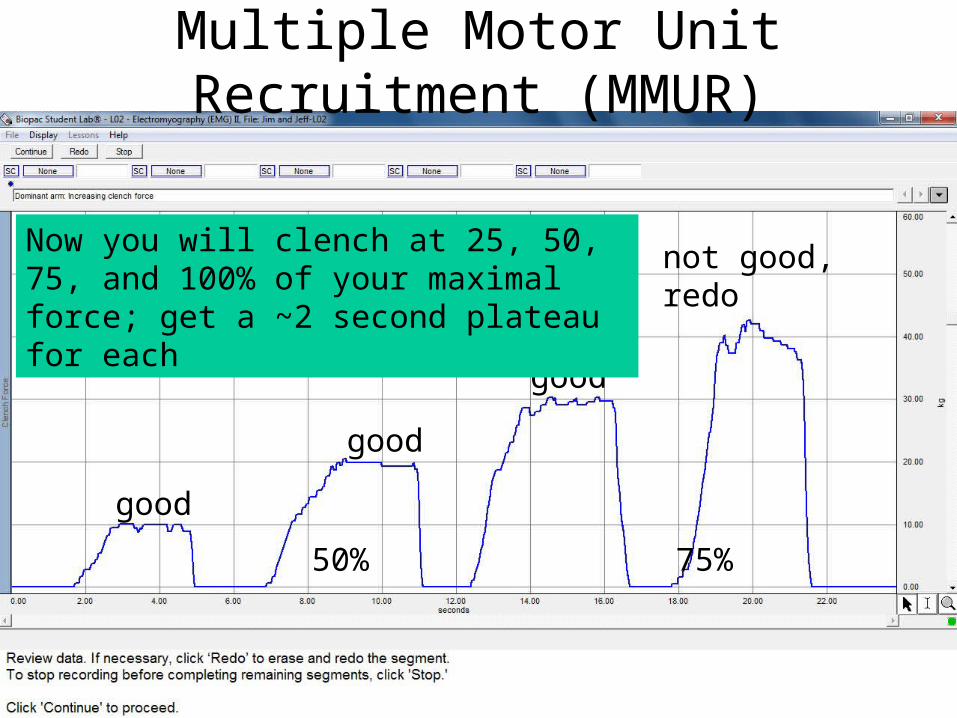
Multiple Motor Unit Recruitment (MMUR)
25% 50% 75% 100%
not good,redo
good
good
good
Now you will clench at 25, 50, 75, and 100% of your maximal force; get a ~2 second plateau for each
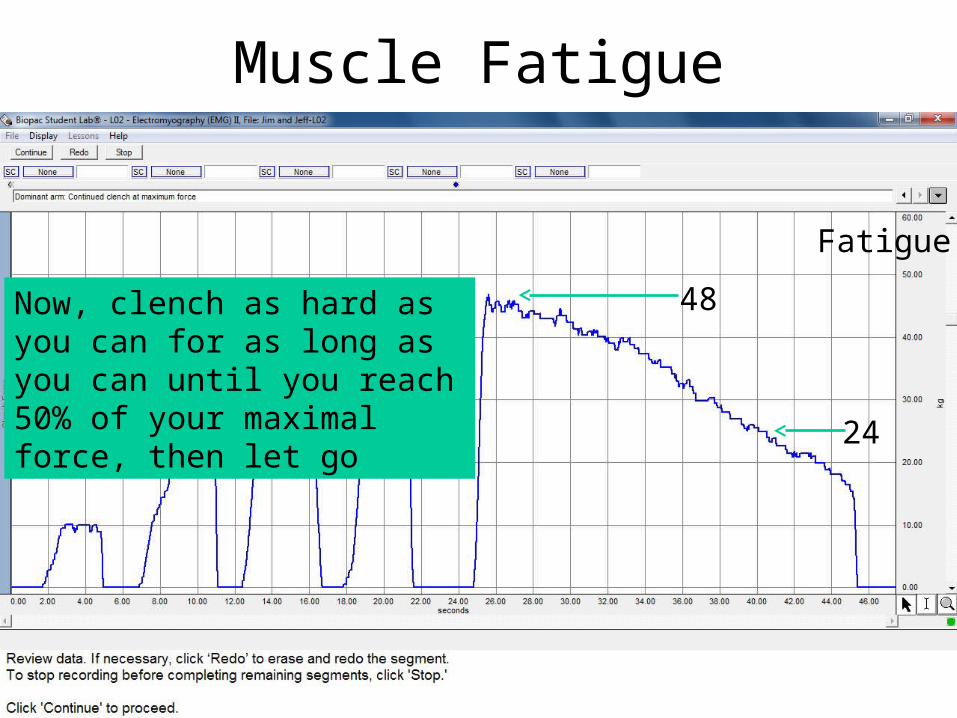
Muscle Fatigue
MMUR Fatigue
48
24
Now, clench as hard as you can for as long as you can until you reach 50% of your maximal force, then let go
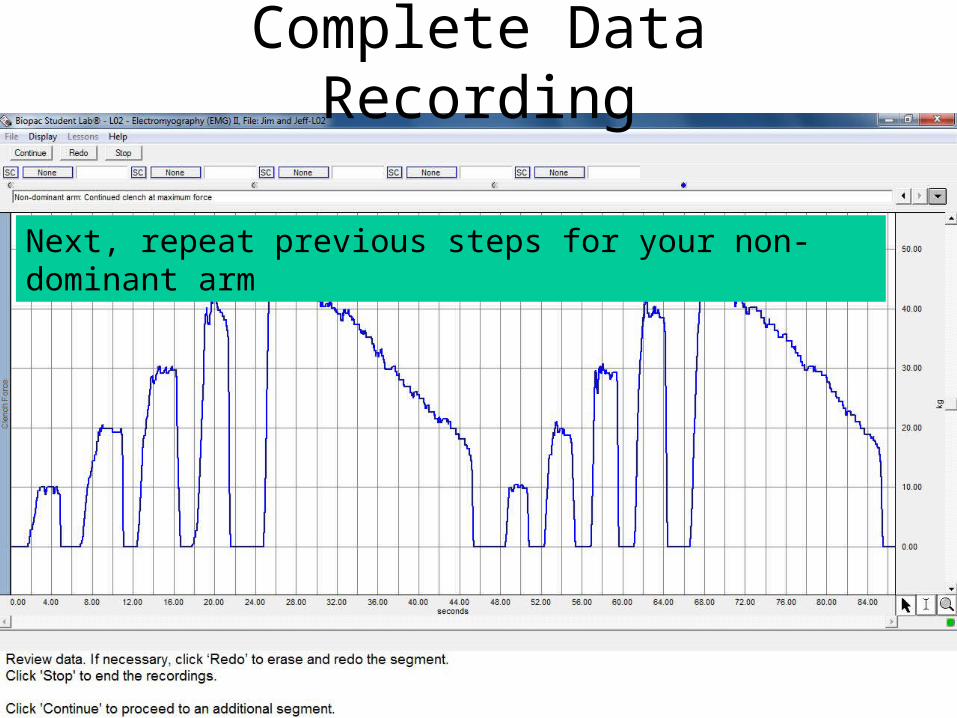
Complete Data Recording
Next, repeat previous steps for your non-dominant arm
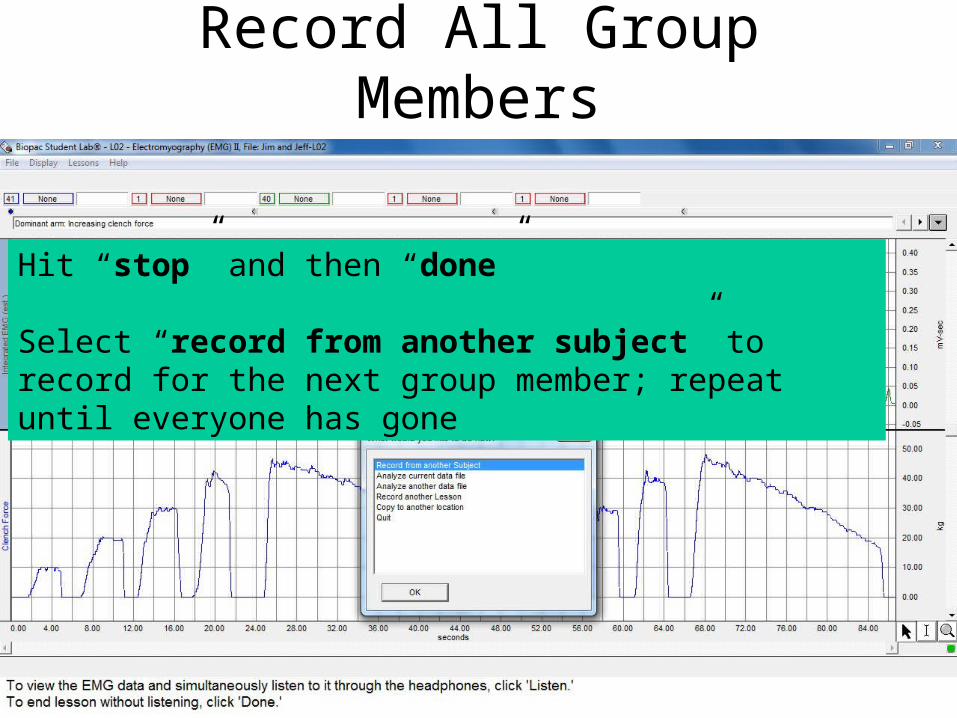
Record All Group Members
Hit “stop” and then “done”
Select “record from another subject” to record for the next group member; repeat until everyone has gone
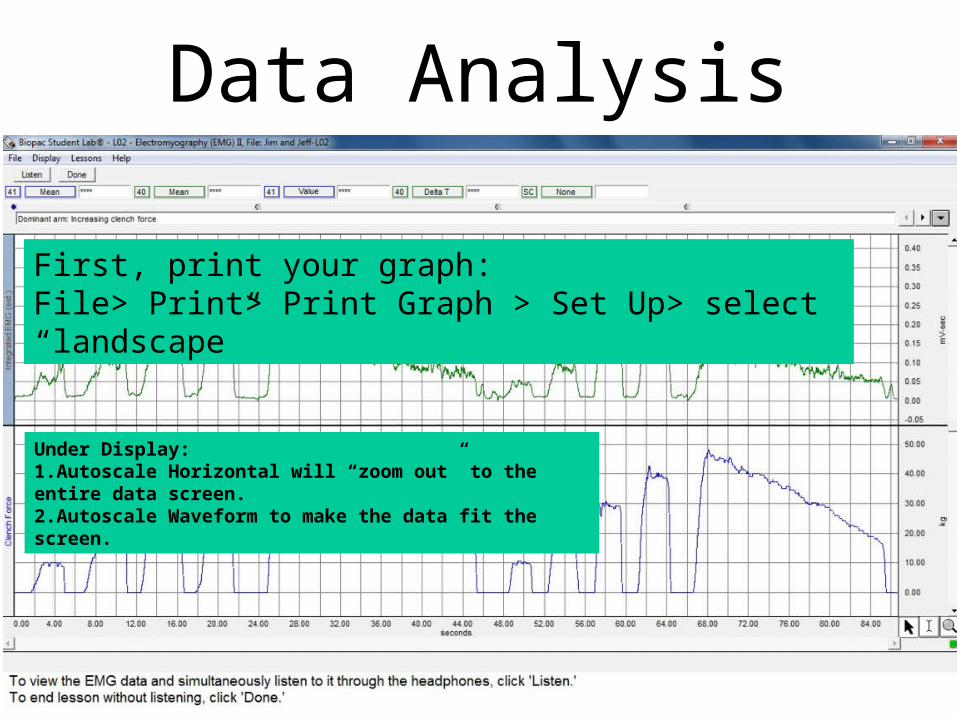
First, print your graph:File> Print> Print Graph > Set Up> select “landscape”
Under Display:1.Autoscale Horizontal will “zoom out” to the entire data screen.2.Autoscale Waveform to make the data fit the screen.
Data Analysis
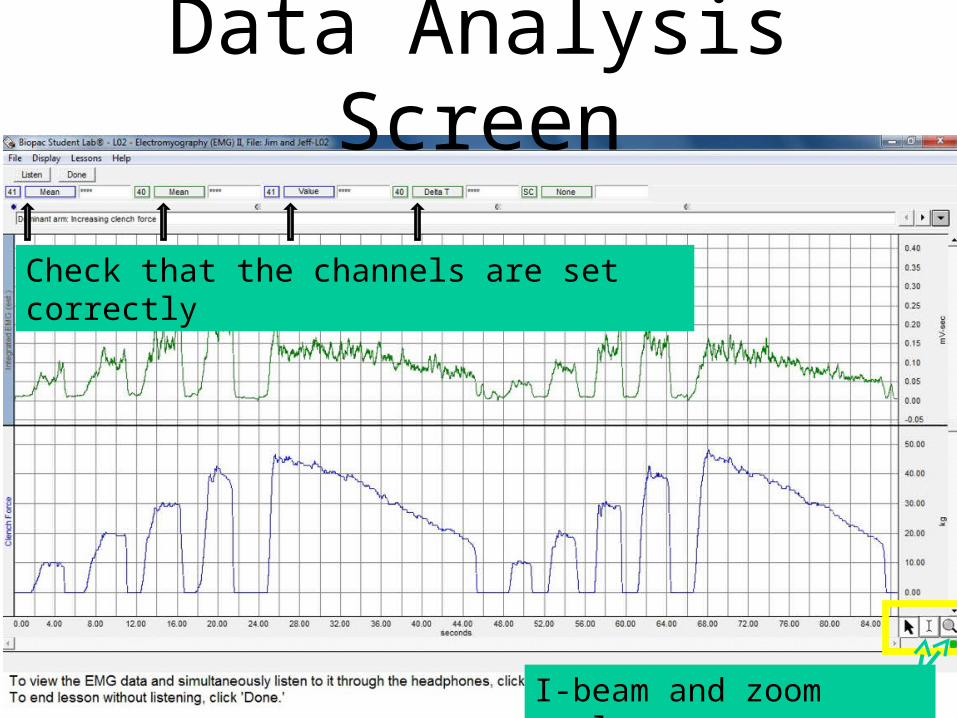
Data Analysis Screen
Check that the channels are set correctly
I-beam and zoom tools

Measuring MMUR on 4 Clenches
•Highlight the “plateau” of each clench on the clench force graph (blue line) and record clench data into table 1 on your lab report (page 8-9)
•Only highlight the flat portion for each clench (do not highlight the steep portions)
highlightplateau
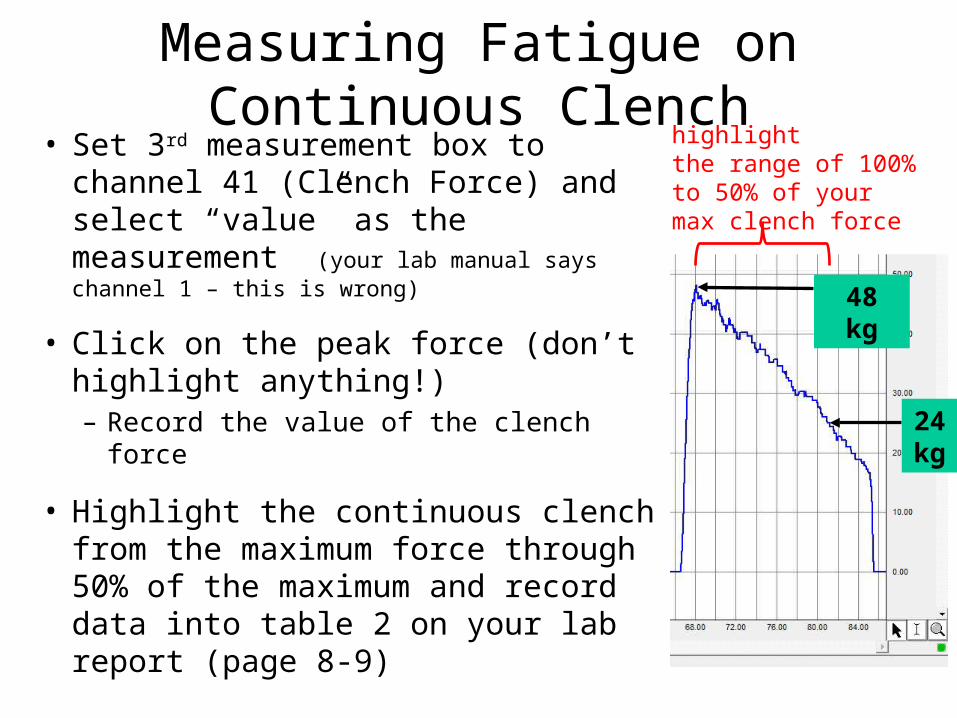
Measuring Fatigue on Continuous Clench• Set 3rd measurement box to channel 41
(Clench Force) and select “value” as the measurement (your lab manual says channel 1 – this is wrong)
• Click on the peak force (don’t highlight anything!)– Record the value of the clench force
• Highlight the continuous clench from the maximum force through 50% of the maximum and record data into table 2 on your lab report (page 8-9)
48 kg
24 kg
highlightthe range of 100% to 50% of your max clench force
Lab Report AssignmentWrite you instructor’s name as well as the day and time of your laboratory class on all sheets you turn in.
Attach the graph you printed to the lab report sheet (page Lab 8-9)
Mark and label on your data plot:25%max, 50%max, 75%max, 100%max, and Muscle Fatigue for both the dominant and non-dominant arm
Also label, with brackets, the dominant and non-dominant arm segments
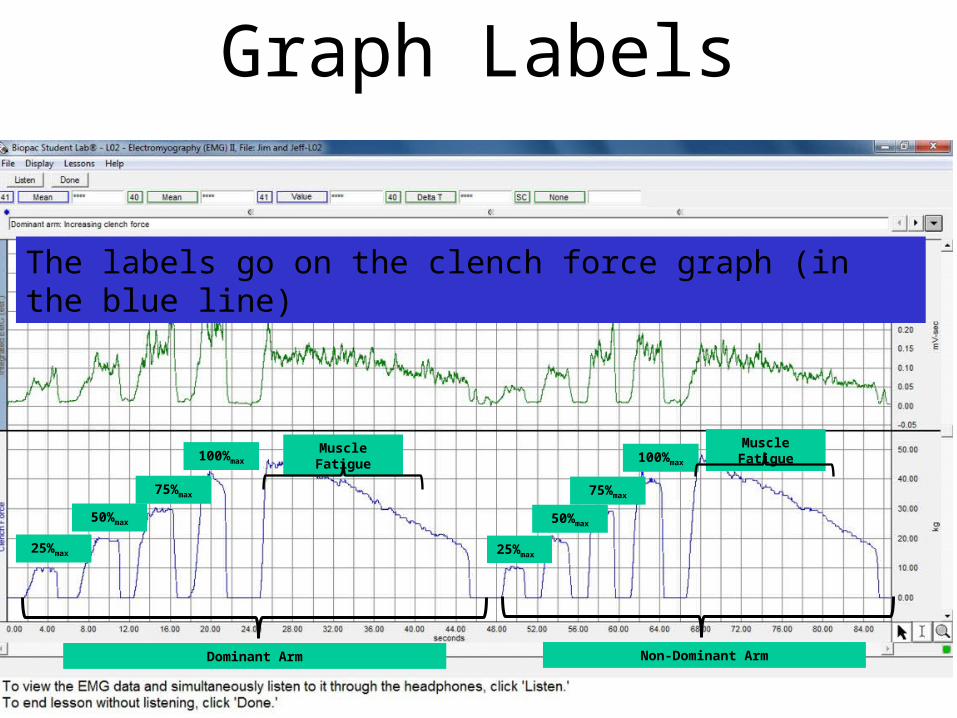
Graph Labels
25%max
50%max
75%max
100%ma
x
Muscle Fatigue
The labels go on the clench force graph (in the blue line)
Dominant Arm Non-Dominant Arm
25%ma
x
50%max
75%max
100%ma
x
Muscle Fatigue

End Lab 8 Presentation


![[PPT]Muscle Tissue - Austin Peay State University · Web viewLab 8 Muscle Physiology Gilbert R. Pitts, Ph.D., Joseph R. Schiller, Ph.D., and James F. Thompson, Ph.D. Lab 8 Activities](https://img.pdfslide.us/doc/110x75/5af1a6c27f8b9a8c308ec58a/pptmuscle-tissue-austin-peay-state-viewlab-8-muscle-physiology-gilbert-r-pitts.jpg)