Embed Size (px)
Citation preview

Lab 4
Cratering and the Martian Surface
4.1 Introduction
Human space travel enthusiasts hope that our manned missions to the Moon will serve asstepping stones for an eventual trip to Mars. Our “visit” to the Moon in our previous lunarcratering laboratory exercise has prepared us similarly to visit Mars today. We have alreadylearned that cratering is a key process in shaping the appearance of terrestrial planetarysurfaces, and that counting craters can help determine the ages of surface features. Westudied techniques used to decide which geological event occurred first, or which surface isyounger (relative dating techniques), and also learned how to determine absolute ages basedon radioactive dating of physical samples.
Lunar and Martian surfaces are similar in many ways (both types are heavily cratered insome places and covered with smooth ancient lava flows in others), but they exhibit severalimportant differences. First, volcanic features on Mars are much more prominent than thoseon the Moon. Mars has the largest volcanoes in the entire solar system, and some of themhave clearly become inactive only recently. (Some planetary scientists suspect that thelargest Martian volcano of all, Olympus Mons, may still be active today.) Second, unlikethe bone-dry Moon, Mars was once a very wet planet. Its surface contains channel and riverdelta-like features that were undeniably formed by flowing water in the past.
These differences lead us to two important questions. When did the last volcanic eruptionsoccur on Mars, and when did water last flow freely there? In this lab, you’ll use cratercounting techniques to help reconstruct a Martian surface chronology and investigate thesequestions.
These questions are important because they relate to how, and why, internal heat-drivenvolcanic processes differ on Mars and on Earth, and help us to form a coherent history of the
1

Martian climate. The evidence of widespread flows of surface water implies that Mars wasonce warmer and had a more substantial atmosphere. The current Martian atmosphere isso thin that it traps very little solar radiation, and provides less than 1% of the atmosphericpressure found at sea level on Earth. The resulting frigid temperatures make it impossiblefor liquid water to exist for very long at the surface, but it could be present in large quantitiesunderground (along with ice deposits). These reservoirs could provide an important resourcefor astronauts, if people ever set foot on Mars.
4.1.1 Goals
The primary goals of this laboratory exercise are to explore the appearance of the Martiansurface, qualitatively and quantitatively, to understand its geological and climate history,and then to use these data to contrast Mars with Earth and better understand similarevolutionary processes on the surface of our own planet.
4.1.2 Materials
All online lab exercise components can be reached from the GEAS project lab URL, listedhere.
http://astronomy.nmsu.edu/geas/labs/labs.html
You will also need a computer with an internet connection, and a calculator. Your primaryactivity for this exercise will be to analyze images of the Martian surface, so you do notnecessarily need to print out any materials. (You can view this document, and the images,online, and enter your results directly into your online report template.)
4.1.3 Primary Tasks
This lab is built around three activities: 1) dating volcanic activity, 2) dating water-carvedsurface features, and 3) dating water floods caused by volcanic activity. You will analyzeimages of regions on Mars which have been captured by spacecraft.
4.1.4 Grading Scheme
There are 100 points available for completing the exercise and submitting the lab reportperfectly. They are allotted as shown below, with set numbers of points being awardedfor individual questions within each section. The 19 questions in the body and the 6 finalquestions at the end of the laboratory exercise are each worth 3 points. Note that Section 4.9(§4.9) contains 5 extra credit points.
2

Table 4.1: Breakdown of PointsActivity Volcanic Activity Water Features Floods Questions SummarySection §4.4.2 §4.5.1 §4.6.1 §4.7 §4.8Page 12 19 23 25 31Points 10× 3 = 30 6× 3 = 18 3× 3 = 9 6× 3 = 18 25
4.1.5 Timeline
Week 1: Read §4.1–§4.5, complete activities in §4.4.2 and §4.5.1, and begin final (Post-Lab)questions in §4.7. Identify any issues that are not clear to you, so that you can receivefeedback and assistance from your instructors before Week 2. Enter your preliminary resultsinto your lab report template, and make sure that your instructors have been given accessto it so that they can read and comment on it.
Week 2: Read §4.6, complete activities in §4.6.1, finish final (Post-Lab) questions in §4.7,write lab summary, and submit completed lab report.
4.2 Terrestrial Craters, Volcanoes, and Channels
Our solar system used to be a very violent place, marked by frequent collisions betweencareening proto-planetoids and randomly-moving space debris. This was especially truebetween 4.5 and 3.7 billion years ago, as the tumultuous level of activity within the solarsystem led to the formation of the objects that we know today as our planets, satellites,asteroids, comets, and other debris, moving along fairly regular orbits in a single orbitalplane. We can identify heavily cratered surfaces on both the Moon and on Mars which dateback to this time period, but we find no analogs here on Earth. Why is this so?
The Moon and Mars are both far less geologically active than the Earth. The Moon isconsidered to be inert, lacking internal heat-driven geological processes which could alter itssurface. Mars is quite a bit more interesting in this regard. With a diameter more than twicethat of the Moon, Mars has retained much more internal heat from the epoch of formation.However, internal heat-driven volcanic processes have apparently not periodically resurfacedthe Martian surface as plate tectonic processes have done on Earth.
The Earth’s surface is broken up into several large plates. Some carry continents and othersoceanic crust, but they all float on hotter, partially molten rock found below. Plate interac-tions at the boundaries cause earthquakes and build mountains and volcanoes, and also formnew crust while destroying the old. The entire Earth is thus continually being resurfaced, ina cyclic process with a period of 500 million years. Given such significant resurfacing, vir-tually all terrestrial craters which formed during the planetary formation era (a time periodcharacterized by intense planetary bombardment) have long since been obliterated.
The Martian and lunar surfaces are thus covered with ancient craters, unlike that of the
3
Earth. But before you assume that the surfaces of these two worlds are very similar, weneed to discuss an important difference. A significant number of Martian craters formedthrough volcanic activity, but most lunar craters were caused by impact events. Mars andthe Earth are similar in this regard, as both have significant numbers of volcanic craters andimpact craters. However, on Earth only the youngest craters (those which formed withinthe last few million years) have been preserved.
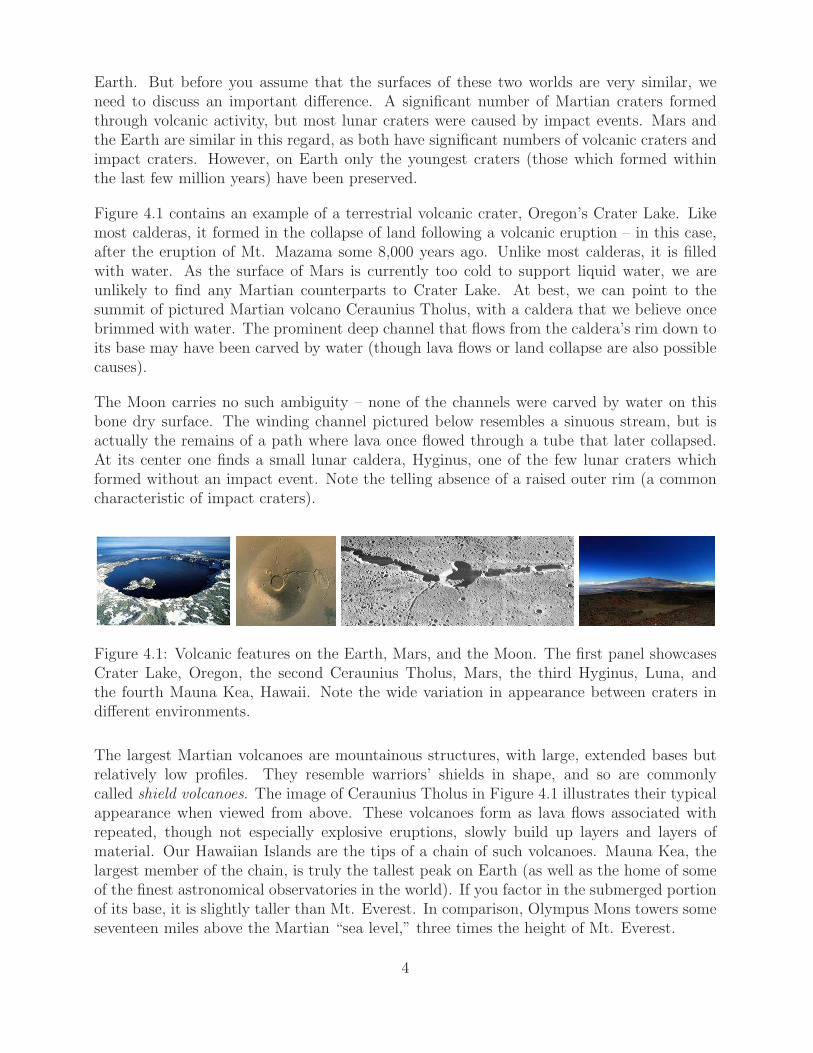
Figure 4.1 contains an example of a terrestrial volcanic crater, Oregon’s Crater Lake. Likemost calderas, it formed in the collapse of land following a volcanic eruption – in this case,after the eruption of Mt. Mazama some 8,000 years ago. Unlike most calderas, it is filledwith water. As the surface of Mars is currently too cold to support liquid water, we areunlikely to find any Martian counterparts to Crater Lake. At best, we can point to thesummit of pictured Martian volcano Ceraunius Tholus, with a caldera that we believe oncebrimmed with water. The prominent deep channel that flows from the caldera’s rim down toits base may have been carved by water (though lava flows or land collapse are also possiblecauses).
The Moon carries no such ambiguity – none of the channels were carved by water on thisbone dry surface. The winding channel pictured below resembles a sinuous stream, but isactually the remains of a path where lava once flowed through a tube that later collapsed.At its center one finds a small lunar caldera, Hyginus, one of the few lunar craters whichformed without an impact event. Note the telling absence of a raised outer rim (a commoncharacteristic of impact craters).
Figure 4.1: Volcanic features on the Earth, Mars, and the Moon. The first panel showcasesCrater Lake, Oregon, the second Ceraunius Tholus, Mars, the third Hyginus, Luna, andthe fourth Mauna Kea, Hawaii. Note the wide variation in appearance between craters indifferent environments.
The largest Martian volcanoes are mountainous structures, with large, extended bases butrelatively low profiles. They resemble warriors’ shields in shape, and so are commonlycalled shield volcanoes. The image of Ceraunius Tholus in Figure 4.1 illustrates their typicalappearance when viewed from above. These volcanoes form as lava flows associated withrepeated, though not especially explosive eruptions, slowly build up layers and layers ofmaterial. Our Hawaiian Islands are the tips of a chain of such volcanoes. Mauna Kea, thelargest member of the chain, is truly the tallest peak on Earth (as well as the home of someof the finest astronomical observatories in the world). If you factor in the submerged portionof its base, it is slightly taller than Mt. Everest. In comparison, Olympus Mons towers someseventeen miles above the Martian “sea level,” three times the height of Mt. Everest.
4

Why are Martian volcanoes so much taller than those of Earth? In part, it is easier to supportand stabilize tall structures in a lower surface gravity environment. Recall, as well, that Marslacks tectonic plate movement, so its volcanoes can nestle over sources of internal heat forbillions of years without displacement, giving them plenty of time to accrete material. OnEarth, the movement of crustal plates carries volcanoes away from such hot spots in just afew million years.
4.3 The Geological History of Mars
On stable terrestrial bodies like the Moon, Mars, and Mercury, impact craters are typicallywell-preserved, and ages for surface features from different regions can be obtained by com-paring the number density of local impact craters. The longer a surface has been exposedto meteoric bombardment, the more impact craters it should display. Older surfaces shouldthus exhibit more impact craters than younger ones, as shown in Figure 4.2.
Figure 4.2: The Cratered Highlands (Noachian period, left panel), Lunae Planum (Hesperianperiod, middle panel), and Northeast Tharsis (Amazonian period, right panel) illustrateancient, intermediate, and young epochs in Martian surface history. Each image is 300 by500 kilometers in size. Note the correlation between age and the surface density, and size,of observed craters.
We can divide the geological history of the Earth into the Paleozoic (oldest), Mesozoic(intermediate), and Cenozoic (youngest) eras. Figure 4.2 illustrates three similarly broadperiods in the geological history of Mars. It links their relative ages to crater density.Surfaces dating to the Noachian period (left panel) are the most heavily cratered, and olderthan those dating to the Hesperian period (middle panel), which themselves are older and
5
more cratered than the youngest, and most sparsely cratered, Amazonian surfaces (rightpanel). These three epochs were named after regions containing large-scale surface featuresthat formed at these times, such as large craters, wide-spread lava flows, and extensivewater-carved topography.
We briefly summarize Martian geological history below, characterizing these three time pe-riods and attaching dates to each one. These dates are estimates of the number of yearsthat have elapsed since each type of surface solidified from a molten state (lava). They areapproximations, and could be improved substantially if we could travel to Mars and backto obtain physical samples (rocks) from the Martian surface and date radioactive isotopeswithin them.
Noachian PeriodThe Noachian Period (ranging from the planetary formation epoch 4.5 billion years ago to 3.5billion years ago) was named for Noachis Terra, a vast highland in the southern hemisphere.Heavy bombardment left many craters, but widespread evidence of water erosion – mostnotably valley networks cut by slow-moving rivers – suggests that the surface was bothwarm and wet.
Hesperian PeriodThe Hesperian Period began as the intense Noachian bombardment eased, and lasted untilroughly 1.8 billion years ago (the lower boundary age is uncertain, lying between 3.0 billionand 1.5 billion years ago). Named for Hesperia Planum, a high plain in the southern hemi-sphere, the Hesperian was marked by intense volcanic activity which covered many cratersfrom the formation epoch. Olympus Mons dates back to this period, as do catastrophicreleases of water, which carved channels in areas like the Chryse Planitia basin (where theViking craft landed in 1976), and short-lived seas and lakes.
Amazonian PeriodThe Amazonian Period (from the end of the Hesperian to the present) was named for Ama-zonis Planitia, a low plain in the northern hemisphere. Amazonian regions have relativelyfew impact craters, but are otherwise quite varied in morphology. Lava flows, glacial activ-ity, and minor releases of liquid water continued during this period, although it’s likely thatmost of the Amazonian region was too cold to allow liquid water to exist at the surface.
6
Amazonian
Hesperian
Noachian
Noachian
EM
CP
HP
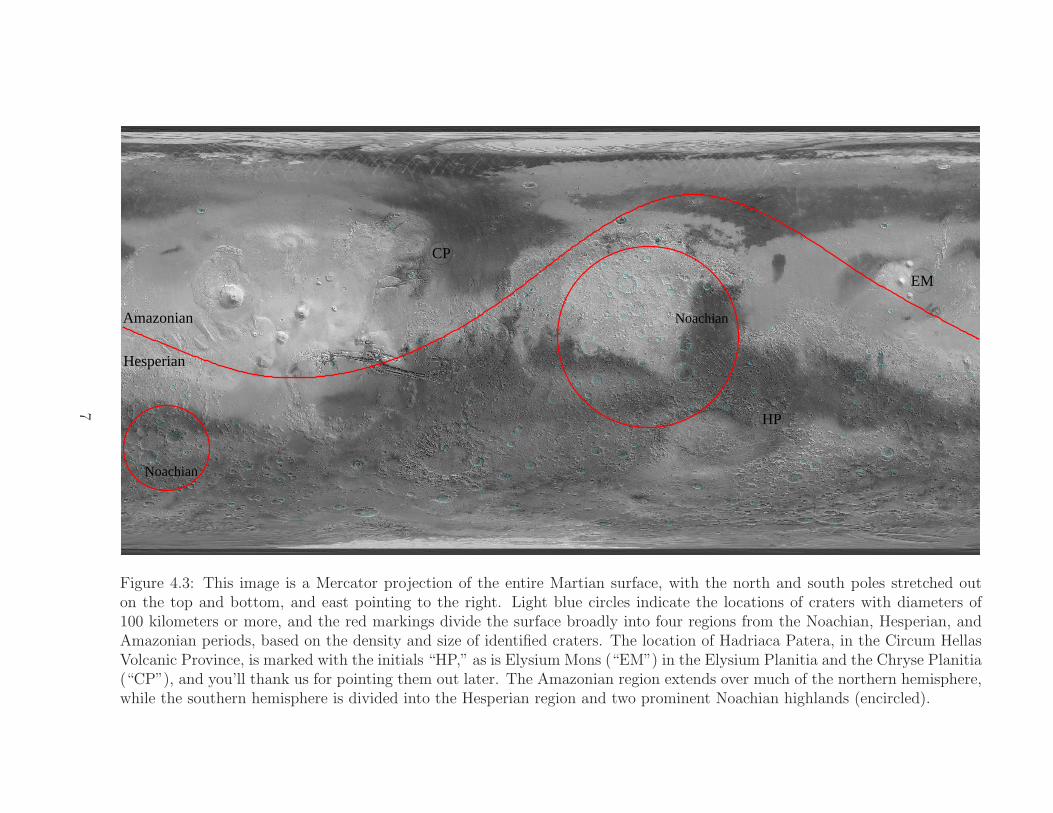
Figure 4.3: This image is a Mercator projection of the entire Martian surface, with the north and south poles stretched outon the top and bottom, and east pointing to the right. Light blue circles indicate the locations of craters with diameters of100 kilometers or more, and the red markings divide the surface broadly into four regions from the Noachian, Hesperian, andAmazonian periods, based on the density and size of identified craters. The location of Hadriaca Patera, in the Circum HellasVolcanic Province, is marked with the initials “HP,” as is Elysium Mons (“EM”) in the Elysium Planitia and the Chryse Planitia(“CP”), and you’ll thank us for pointing them out later. The Amazonian region extends over much of the northern hemisphere,while the southern hemisphere is divided into the Hesperian region and two prominent Noachian highlands (encircled).
7
4.4 Volcanic History of Mars
The southern hemisphere of Mars is dominated by highland regions, older and more heavilycratered than the low-elevation, sparsely cratered, and younger lands to the north. Thevast lowland region has been smoothed by lava flows, though water may have also played asignificant role in shaping and filling the surface.
Martian volcanoes range in age from the Noachian to late Amazonian. While they cover asignificant portion of the entire surface, the most notable volcanoes occur in three regions,Circum Hellas Volcanic Province, Elysium Planitia, and Tharsis Montes. Circum Hellas hasthe least conspicuous volcanoes, but also contains the red planet’s six oldest central ventvolcanoes (including the Hadriaca Patera). These structures formed after the creation ofthe huge Hellas impact basin, some 4.0 billion to 3.6 billion years ago. Elysium Planitiais a heavily cratered, ancient, uplifted volcanic plain which features several large volcanoesthat were active some 1.5 billion years ago. It also contains several long trenches (includingCerberus Fossae). There is no question that Tharsis contains the largest, most recentlyactive, and most visibly stunning volcanoes, pictured in Figure 4.4.
Large volcanic shields form over hundreds of millions of years, encompassing generations oflava flows. Surface ages derived from crater surface densities thus indicate the elapsed timesince the latest eruption, the one which erased any existing impact craters and “reset theclock” for the surface.
4.4.1 Geology and Crater Density Timescales
As we discussed in §4.3, we can estimate the ages over which various Martian surfaces haveremained undisturbed by lava or water flows, or any other obliterative processes, by countinghow many impact craters have accumulated over time. The age of a particular surface isproportional to the surface density of craters (the number per square area) it has collected.Because larger impact craters are created by larger impactors (meteoroids), which are morerare, we also expect to find lots of smaller craters, and fewer larger ones.
In this exercise, we will identify and count craters of various sizes on a variety of Martiansurface terrains, and then derive age estimates accordingly. Planetary scientists use thistechnique to study the geological history of Mars, commonly examining impact craters whichrange in size from 16 kilometers (large, but very rare) down to a mere 16 meters in diameter.You might wonder how we could possibly identify 16-meter-wide craters on Mars, when itlies so far away from us. Give thanks to NASA’s Mars Global Surveyor spacecraft, whichscanned the surface in 1997, resolving exquisite structures as small as half a meter in size.
Figure 4.5 is based upon these fantastic data. This plot tells us how many craters largerthan a certain limit we expect to observe per square area on the surface of Mars, for surfaceages ranging back as far as the planetary formation epoch.
Let’s work through an example together.
8
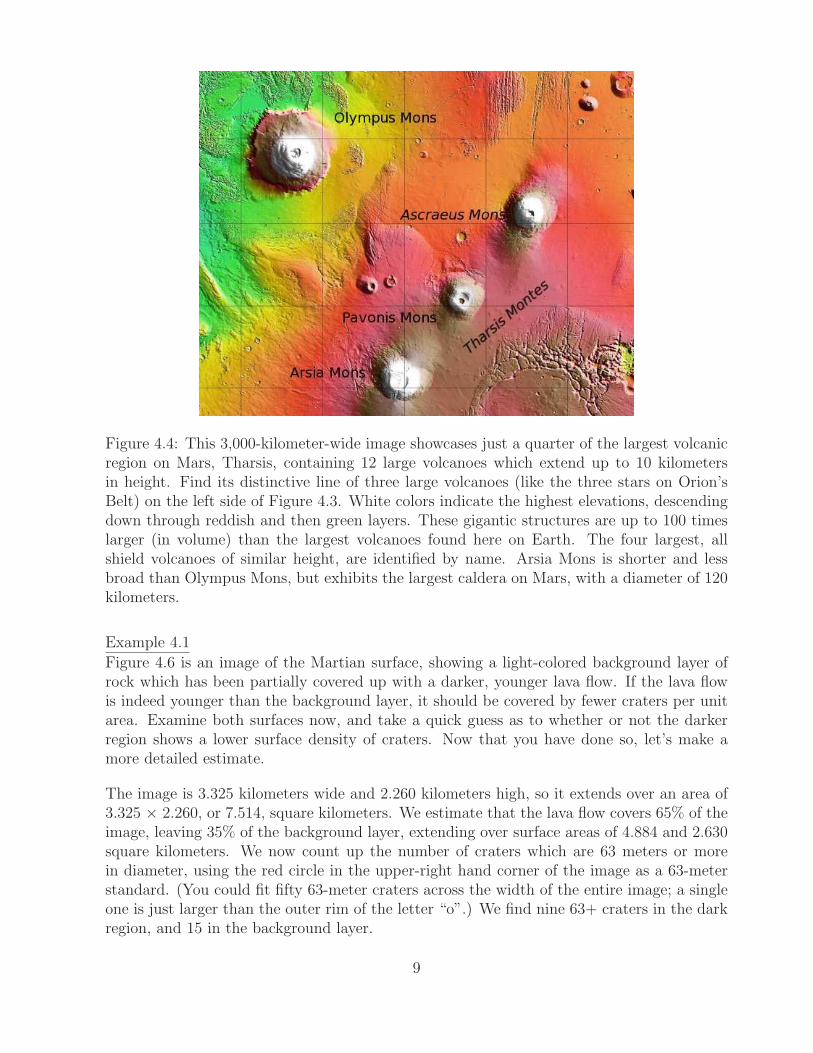
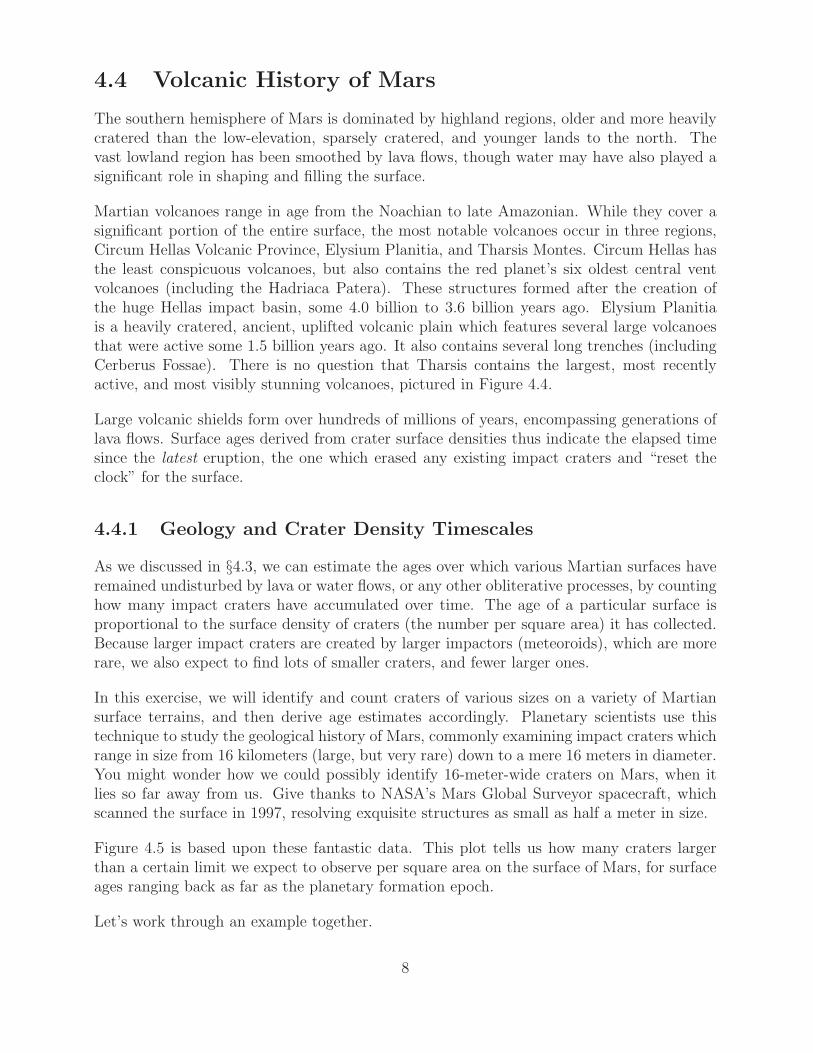
Figure 4.4: This 3,000-kilometer-wide image showcases just a quarter of the largest volcanicregion on Mars, Tharsis, containing 12 large volcanoes which extend up to 10 kilometersin height. Find its distinctive line of three large volcanoes (like the three stars on Orion’sBelt) on the left side of Figure 4.3. White colors indicate the highest elevations, descendingdown through reddish and then green layers. These gigantic structures are up to 100 timeslarger (in volume) than the largest volcanoes found here on Earth. The four largest, allshield volcanoes of similar height, are identified by name. Arsia Mons is shorter and lessbroad than Olympus Mons, but exhibits the largest caldera on Mars, with a diameter of 120kilometers.
Example 4.1
Figure 4.6 is an image of the Martian surface, showing a light-colored background layer ofrock which has been partially covered up with a darker, younger lava flow. If the lava flowis indeed younger than the background layer, it should be covered by fewer craters per unitarea. Examine both surfaces now, and take a quick guess as to whether or not the darkerregion shows a lower surface density of craters. Now that you have done so, let’s make amore detailed estimate.
The image is 3.325 kilometers wide and 2.260 kilometers high, so it extends over an area of3.325 × 2.260, or 7.514, square kilometers. We estimate that the lava flow covers 65% of theimage, leaving 35% of the background layer, extending over surface areas of 4.884 and 2.630square kilometers. We now count up the number of craters which are 63 meters or morein diameter, using the red circle in the upper-right hand corner of the image as a 63-meterstandard. (You could fit fifty 63-meter craters across the width of the entire image; a singleone is just larger than the outer rim of the letter “o”.) We find nine 63+ craters in the darkregion, and 15 in the background layer.
9
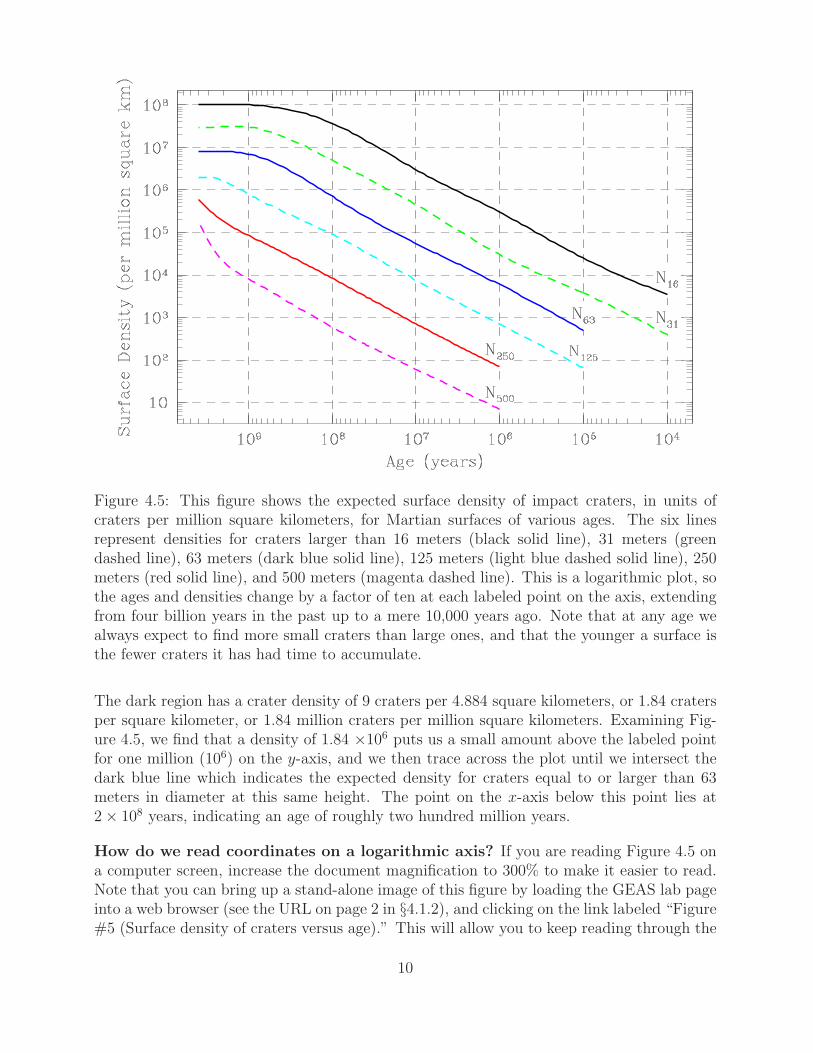
Figure 4.5: This figure shows the expected surface density of impact craters, in units ofcraters per million square kilometers, for Martian surfaces of various ages. The six linesrepresent densities for craters larger than 16 meters (black solid line), 31 meters (greendashed line), 63 meters (dark blue solid line), 125 meters (light blue dashed solid line), 250meters (red solid line), and 500 meters (magenta dashed line). This is a logarithmic plot, sothe ages and densities change by a factor of ten at each labeled point on the axis, extendingfrom four billion years in the past up to a mere 10,000 years ago. Note that at any age wealways expect to find more small craters than large ones, and that the younger a surface isthe fewer craters it has had time to accumulate.
The dark region has a crater density of 9 craters per 4.884 square kilometers, or 1.84 cratersper square kilometer, or 1.84 million craters per million square kilometers. Examining Fig-ure 4.5, we find that a density of 1.84 ×10⁶ puts us a small amount above the labeled pointfor one million (106) on the y-axis, and we then trace across the plot until we intersect thedark blue line which indicates the expected density for craters equal to or larger than 63meters in diameter at this same height. The point on the x-axis below this point lies at2× 108 years, indicating an age of roughly two hundred million years.
How do we read coordinates on a logarithmic axis? If you are reading Figure 4.5 ona computer screen, increase the document magnification to 300% to make it easier to read.Note that you can bring up a stand-alone image of this figure by loading the GEAS lab pageinto a web browser (see the URL on page 2 in §4.1.2), and clicking on the link labeled “Figure#5 (Surface density of craters versus age).” This will allow you to keep reading through the
10
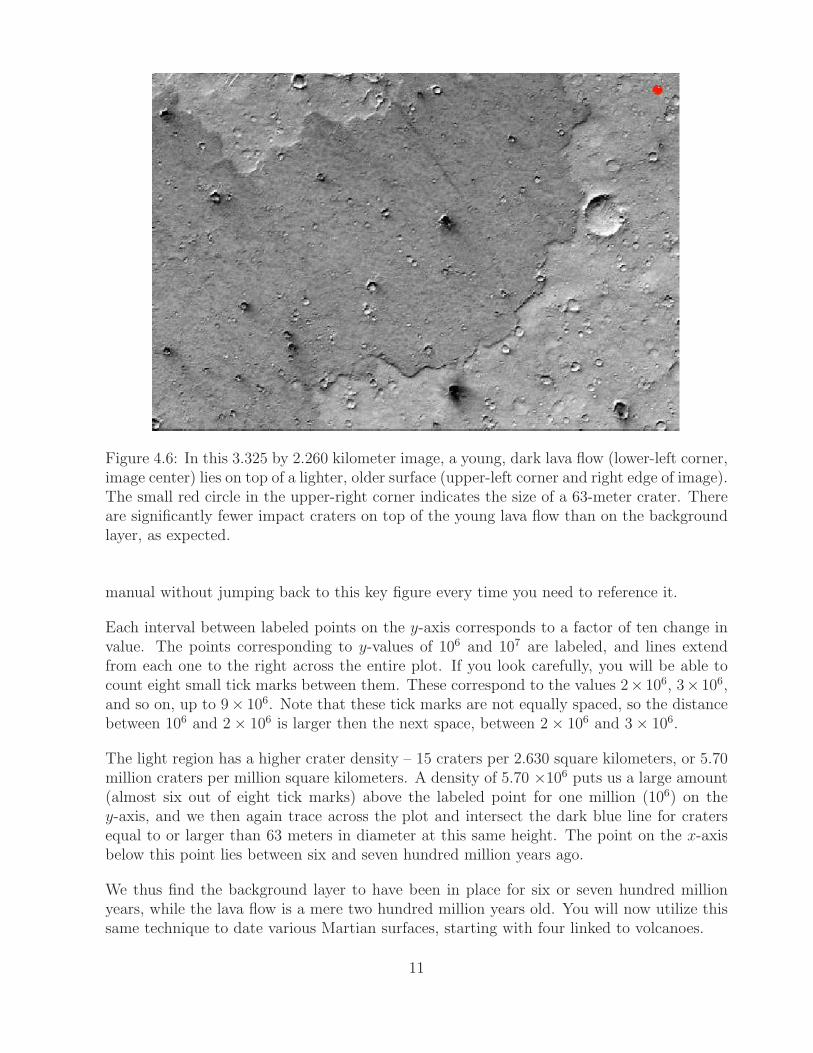
Figure 4.6: In this 3.325 by 2.260 kilometer image, a young, dark lava flow (lower-left corner,image center) lies on top of a lighter, older surface (upper-left corner and right edge of image).The small red circle in the upper-right corner indicates the size of a 63-meter crater. Thereare significantly fewer impact craters on top of the young lava flow than on the backgroundlayer, as expected.
manual without jumping back to this key figure every time you need to reference it.
Each interval between labeled points on the y-axis corresponds to a factor of ten change invalue. The points corresponding to y-values of 106 and 107 are labeled, and lines extendfrom each one to the right across the entire plot. If you look carefully, you will be able tocount eight small tick marks between them. These correspond to the values 2× 10⁶, 3× 10⁶,and so on, up to 9× 10⁶. Note that these tick marks are not equally spaced, so the distancebetween 106 and 2× 10⁶ is larger then the next space, between 2× 10⁶ and 3× 10⁶.
The light region has a higher crater density – 15 craters per 2.630 square kilometers, or 5.70million craters per million square kilometers. A density of 5.70 ×10⁶ puts us a large amount(almost six out of eight tick marks) above the labeled point for one million (106) on they-axis, and we then again trace across the plot and intersect the dark blue line for cratersequal to or larger than 63 meters in diameter at this same height. The point on the x-axisbelow this point lies between six and seven hundred million years ago.
We thus find the background layer to have been in place for six or seven hundred millionyears, while the lava flow is a mere two hundred million years old. You will now utilize thissame technique to date various Martian surfaces, starting with four linked to volcanoes.
11
4.4.2 Dating Volcanic Activity
Load the GEAS project lab exercise web page into a web browser (see the URL on page 2in §4.1.2), and click on the link labeled “Web application #1 (Martian craters).” This willcause a new browser tab to appear, containing a web application that we will use to examineimages of the surface of Mars. You will be using this tool to identify the density, and locationsand sizes, of craters in different regions on Mars.
Look over the entire screen carefully first, and make sure that you understand the optionsavailable to you. General options are shown in a row across the top of the screen: theseallow you to make a printout (a paper copy) of your images, or to save copies as JPG- orPNG-format image files on your computer disk. By clicking on the button labeled “Help”you will get a quick run-down on the tool options and purpose, and “Credits” will tell youa bit about the creator.
You should always click on the “Help” button when you examine a new web application,as your initial questions may be answered there. Please do so now. In addition to theseinstructions, you may find it useful to note that when you are in the process of shifting thelocation or size of a given crater, many of the general options will be grayed out (unavailable).To access them, just click on the “save feature” button on the left in the Update FeaturesPanel, or type the letter “s”.
Be aware that if you type the letter “b” and then shift the location or size of a feature usingthe keyboard, the effect will be ten times larger than normal. (Just as in the stories, yourstrength will be the strength of ten because your heart is pure – and because you typed “b”!)This is particularly useful when the default feature size is much smaller than a given craterand you want to increase the size of your feature to match the crater with as few actions aspossible. A well-marked crater should have a circle superimposed as closely as possible onits outer rim.
After loading an image by selecting it from the pull-down menu at the top of the screen andto the right, you’ll find and identify all of the craters larger than a certain size within it. Youmay choose to increase the size of your circular features to overlap the crater rims, but thisis not necessary, as we are simply interested in the number of craters equal to or larger thana given size. Note that the tool will not allow you to draw circles smaller than the limitingsize of the field.
As you mark craters, a table to the right of the image will fill in with the locations and sizes(in meters) of your marks. Once you have identified all of the appropriate craters on a givenimage, you can divide the number of craters by the surface area of the displayed region,deriving a local surface density of craters. You should also save a copy of each annotatedimage and the list of craters to your local disk (with the “Save” command), to use in yourlab report. Your instructor may ask you to include these figures for all ten fields, or for asubset of them.
We will examine four volcanic regions of interest with the web-app. As you work, keep in
12
mind that we are counting the number of impact craters, those with well-defined, raisedrims, not all craters. Skip any craters which you think formed through volcanic activity (likeCeraunius Tholus, shown in Figure 4.1), or through the collapse of a valley or tunnel (likeHyginus crater, also shown in Figure 4.1). If a crater lies partially on an image, you maychoose to include it if more than 50% of the outer rim appears.
Let’s start with a few quick questions related to Figure 4.5, to help everyone to becomecomfortable with using it. You can give your answers to the nearest power of ten.
1. Over the last billion years, there have been times fewer 500+ meterimpact craters than 250+ meter ones, and times more 63+ meter than250+ meter ones.
2. A billion-year-old surface should have times more 125+ meter impactcraters than a million-year-old surface.
3. The density curves for the smallest size craters are flat between four and one billion years,because there were so many impact events at that time that you couldn’t incur one withoutrubbing out a former crater. Is the same trend true for 250+ and 500+ meter craters, andif not, why not?
Hadriaca PateraReload the first image from the pull-down menu in the Martian craters web application, andexamine the area around Hadriaca Patera. One of the oldest central vent volcanoes on Mars,this ancient shield volcano is located in the Circum-Hellas Volcanic Province. The volcanooccupies most of the color image on the left of the web-app (labeled “view of the surroundingarea”), and the black-and-white image on which we will mark craters is a magnified viewof a portion of the floor of the volcanic caldera (shown as a small red square on the colorimage).
4. Mark all craters equal to or larger than 500 meters in diameter on the black-and-whiteimage, and then use your measurement of the crater surface density and Figure 4.5 to derivean age for this surface.
Examine the surface features carefully as you work. Avoid the temptation to include craterswhich are “just a bit” smaller than the size limit, such as the 411-meter crater at (22.7%,
13

20.4%) in the lower-left corner, and the 445-meter crater at (60.4%, 93.3%) near to the topedge of the image. To find the craters at these coordinates easily, note that the image is15.42 kilometers wide (running from 0 to 15420 meters from left to right), and also 15.42kilometers high (running from 0 to 15420 meters from top to bottom).
There are also several structures on this image that are not impact craters. The extended,dark-floored feature in the upper-right corner at (94.4%, 97.1%) has a non-circular shapeand an irregular “rim” which may be part of a mountain chain, while the dark floor could bean ancient lava flow. A smaller feature on the left edge at (5.3%, 48.4%) reveals the shadowof a mountain peak bounded by a couple of very small impact craters that together give theillusion of a larger, roughly circular, impact crater.
As you examine the entire series of images, keep an eye out for features like these whichmight contaminate your impact crater samples. On each image, as you complete the task ofmarking craters go back and re-examine the list you have assembled, to double-check thatyou are satisfied with each decision. If you are particularly uncertain about classifying aparticular feature, make a note of your concerns (and the structure coordinates) in your labreport.
Justify your final answer, by showing your work for each stage of the problem and describingyour intermediate results (as in the following example).
Example 4.2
The black-and-white image is 15.42 kilometers wide and 15.42 kilometers tall, as noted inits title, so it has an area of 15.42× 15.42 = 237.78 square kilometers. If you had found tencraters with radii greater than or equal to 500 meters on this image, then you would derivea surface density of 10 craters per 237.78 square kilometers, or 10/237.78 = 0.042056 cratersper square kilometer, or 42,056 craters per million square kilometers. From Figure 4.5, thisdensity (y-value) suggests an age of 3.0 billion years (x-value) for this surface.
14
Large craters are easier to identify than small ones, so a large size limit means that theprocess of identifying craters is more straight-forward. However, large craters are rare, andso the derived crater densities can vary greatly if just one more, or one less, large craterhappens to have formed within your sample region. To determine surface ages from thedistribution of the largest craters, one needs to spend lots of time studying fields which areas large as possible, in order to build up solid statistics. For a young enough surface, theremay not be any large craters yet to find!
Small craters are reliable measures of surface ages, because there are so many of them. If youhave counted 1,000 craters in a single field, for example, then being off by one or two craterswon’t bias your results very much. However, it is difficult to identify small craters reliably,because at the smallest size scales small variations in terrain (gullies and small depressions)tend to resemble small impact craters.
5. Your age estimate for Hadriaca Patera is based on the density of craters equal to or largerthan 500 meters in size. Why did we select that size limit for this image? We asked you tofocus on 500+ meter craters because there are enough of them present in a field of this sizeand this age to give a statistically useful answer. How would your age estimate change ifyou studied craters down to a limit of 250 meters?
To save you some time, we will tell you that we found 80 craters 250 meters or larger indiameter in the Hadriaca Patera image. Calculate a second age estimate based on thesecraters, and compare it to your first value. Do they agree?
Pavonis MonsOne of the three large shield volcanoes of the Tharsis Montes, the volcano again occupiesmost of the color image, while the magnified black-and-white image covers a portion of thefloor of the volcanic caldera.
6. Mark all craters equal to or larger than 63 meters in diameter on the black-and-white
15
image, and then use your measurement of the crater surface density to derive an age for thissurface. Show your work.
Arsia MonsAnother one of the three large shield volcanoes of the Tharsis Montes, the volcano againoccupies most of the color image, while the magnified black-and-white image covers a portionof the floor of the volcanic caldera.
7. Mark all craters equal to or larger than 63 meters in diameter on the black-and-whiteimage, and then use your measurement of the crater surface density to derive an age for thissurface. Show your work.
Olympus MonsOlympus Mons is possibly the largest volcano in the solar system. The western scarp of thishuge shield volcano, with a diameter of 600 kilometers at the base, is shown in the web-app
16
view of the surrounding area. The magnified region in which you will mark craters coversthe most recent lava flows in the area.
8. Mark all craters equal to or larger than 16 meters in diameter on the black-and-whiteimage, and then use your measurement of the crater surface density to derive an age for thissurface. Show your work.
9. Which crater field was the most difficult for you to mark, and which was the moststraightforward? Is there a connection between the terrain of the surface being sampled andthe accuracy with which craters are identified? Does it matter how small the minimum targetcrater size is, or how well-resolved the image is (the size of the smallest physical structurewhich can be observed on it)?
10. Consider the information given in the text, and Figures 4.3 and 4.4, and explore whetheryour age estimates for all four volcanic regions agree or disagree with the time line establishedfor the three major epochs of Martian surface evolution.
17
4.5 Surface Water Flows on Mars
We can count craters to estimate time intervals since lava flowed on surfaces, and we canapply the same technique to dating features carved by flowing water. In addition to exploringhow much time has passed since water was found in a liquid state on the surface, we wouldlike to know how much water there was, and for how long it was present. Just as wecontrasted Martian volcanic mountains to terrestrial ones, we will compare the behavior ofMartian water to that of terrestrial oceans, rivers, and catastrophic floods.
Mars exhibits a wealth of water-carved topographic features, and so planetary scientistshypothesize that a major portion of the surface was once covered by a large ocean. The datasuggest that 3.5 billion years ago, roughly one-third of the surface, centered in a flat, low-elevation region in the northern hemisphere, lay underneath a small ocean (with a volumeone-tenth that of the Earth’s oceans). The evidence includes delta-like regions where riversmay have emptied into the ocean, and relics of ancient shorelines. While we will not test thishypothesis directly, we will investigate two types of water-carved features, valley networksand outflow channels.
Earth contains many large rivers such as the Mississippi and the Colorado, which drain hugewatersheds and create networks of valleys. Outflow channels are less common here, thoughfound, for example, in the scablands region of eastern Washington. These channels wereproduced by repeated flooding at the end of the last ice age 14,000 years ago, as the glacialLake Missoula drained abruptly. While the river topography associated with valley networkstakes millions of years to develop, outflow channels can be created by floods on a time scaleof mere days.
Martian valley networks were formed by slow-moving, relatively long-lasting Martian rivers,
18
associated with atmospheric water cycles of rain and snow. The most mature have highlydeveloped, integrated branching patterns of tributaries. Some can be described as frettedchannels, or long, relatively wide valleys with flat floors and associated tributaries, whichgradually increase in size over large distances. Some of the most well-known include NirgalVallis, Echus and Melas Chasma (both in the Valles Marineris region), and Warrego Valles.
Outflow channels are formed by catastrophic floods involving huge amounts of water andoccurring over brief periods of time. They feature streamlined teardrop islands, longitudinalgrooves, terraced margins, inner channel cataracts, and generally chaotic terrain. They canbe tens of kilometers wide and more than a kilometer deep, indicating significant erosion.Tiu Vallis is an excellent example of a typical outflow valley, as are Ares Valles and MajaValles. Most such structures are found in the northern hemisphere near to the Chryse basin,almost three kilometers below the average surface level for the planet.
Which of these two types of water-carved features is older? The valley networks appear todate to the Noachian era, when the young Martian atmosphere was thicker and the climateboth warmer and wetter. In this ancient era, rivers flowed freely into oceans and large lakes.As the thin Martian atmosphere slowly seeped away, however, the air dried and cooled, andthe rain and snow that sustained these rivers ended.
As Mars shifted from the Noachian to the Hesperian Period, sustained water flow and rivershad ground to a halt, but significant amounts of water still remained, bound up in large lakes.Imagine such a reservoir, one lying at a slightly higher elevation than its surroundings. Ifa natural dam broke, the sudden release of water could easily carve out outflow channels.This is one likely hypothesis for their creation. We believe that this is how the HesperianPeriod topology formed in the Chryse Planitia basin region, for example.
These hypotheses suggest that Hesperian outflow channels should be younger than Noachianvalley networks. In the next activity, you’ll test this idea by estimating the ages of represen-tative examples of both type of features.
4.5.1 Dating Valley Networks and Outflow Channels
Nirgal VallisNirgal Vallis is one of the longest valley networks on Mars. It covers almost 500 kilometers,and tends to have short tributaries which end in steep-walled valleys.
1. Mark all craters equal to or larger than 500 meters in diameter on the black-and-whiteimage, and then use your measurement of the crater surface density to derive an age for thissurface. Show your work.
Look closely at the somewhat non-circular 811-meter feature at (9.8%, 14.4%) in the lower-left corner of this image. The prominent upper-right flank (between the 11 o’clock and 3o’clock positions) may indicate that the entire structure was first raised up and then latercollapsed, suggesting that it was not created by an impact event, but is of volcanic origin.
19
2. A crater is observed to cut through the Nirgal Vallis in the view of the surrounding area,suggesting that this water-carved valley is ( older / younger ) than the crater.
Tiu VallisTiu Valles is a typical outflow valley, and one of the major outflow channels leading to theChryse Planitia basin.
3. Mark all craters equal to or larger than 250 meters in diameter on the black-and-whiteimage, and then use your measurement of the crater surface density to derive an age for thissurface. Show your work.
20

Warrego VallisWarrego Valles is an example of a mature valley network, and roughly resembles similarstructures found here on Earth.
4. Mark all craters equal to or larger than 500 meters in diameter on the black-and-whiteimage, and then use your measurement of the crater surface density to derive an age for thissurface. Show your work.
Ares VallisAres Valles is an example of an outflow channel; note the tremendous amount of small-scale structure shown in the area surrounding our crater-marking region. Like Tiu Vallis, itconnects to the Chryse Planitia basin.
5. (a) Mark all craters equal to or larger than 250 meters in diameter on the black-and-whiteimage, and then use your measurement of the crater surface density to derive an age for thissurface. Show your work.
21

Figure 4.7: A 16.4-kilometer-wide image of the Ares Valley, showcasing a dramatic teardrop-shaped island and the evidence of ancient water flows which surrounds it. The impactresponsible for the large crater in the lower-right corner may have also formed numeroussmaller craters in the upper-right corner, as surface materials were ejected at the impactsite.
(b) Figure 4.7 shows a slightly larger region in the Ares Vallis (you may recognize the lower-left quadrant of the image as the region in which you just marked craters). Note how theteardrop-shaped island which crosses the region presented a wide face to the oncoming flowof water, but was then thinned out (forming a long, protected tail) downstream. Waterflowed into this region from the ( lower / upper) - ( right / left ) corner, and exited via the( lower / upper) - ( right / left ) corner.
6. Based on your estimates of the ages for these four water-carved surfaces, ( outflow channels/ valley networks ) are older. Explain your answer.
22
4.6 Fire and Ice on Mars
There is an alternate scenario which suggests that some Martian outflow channels may haveformed in even more recent times. In the Amazonian Period, it become too cold for surfacewater to exist in liquid form. Suppose that a large body of ice was present, however, elevatedslightly above the surrounding terrain and located near to a dormant volcano. Imagine thevolcano rekindling, in an event worthy of a blockbuster summer disaster movie (lava flowsthreaten a home for orphaned puppies on Mars – who will come to their rescue?). Volcanicmagma would heat and melt the ice reservoir, causing the newly liquefied water to burstthrough its boundaries. This sudden flood could then carve out a series of very young outflowchannels.
You will next examine two regions that may have formed in this fashion. Dao Vallis lies nearto the ancient volcano Hadriaca Patera. You estimated the age of one of its earliest lavaflows earlier, and now will study an outflow channel which may have formed due to a muchmore recent eruption event. Cerberus Fossae is believed to be an even younger surface. Yourage estimate will be of considerable interest, since evidence of both local volcanic activityand water flows suggest that both forms of activity may have occurred quite recently onMars.
4.6.1 Dating Water Floods Caused by Volcanic Activity
Dao VallisDao Vallis is a large outflow channel that starts on the southeast flank of the large ancientvolcano Hadriaca Patera and runs for 1,000 kilometers into the Hellas impact basin.
23

1. Mark all craters equal to or larger than 250 meters in diameter on the black-and-whiteimage, and then use your measurement of the crater surface density to derive an age for thissurface. Show your work.
Cerberus FossaeFissures in the Cerberus Fossae region cut sparsely cratered plains. These cracks are believedto be volcanic in origin, where magma rose up from below.
2. Mark all craters equal to or larger than 16 meters in diameter on the black-and-whiteimage, and then use your measurement of the crater surface density to derive an age for thissurface. Show your work.
3. How do the ages of these two outflow channels compare to those studied in §4.5.1?
24

4.7 Final (Post-Lab) Questions
1. Astronomers can learn a lot about conditions on all sorts of terrestrial bodies (planets andsatellites with solid surfaces) without visiting them, by examining their cratering records.Figure 4.8 contains images of four Jovian moons, all with thin atmospheres (too thin toprotect them from meteoroids). Examine the images and then answer the following questionsbased on your observations.
(a) Sort the four surfaces from oldest to youngest. Why did you rank them in this order?
(b) Which moon(s) are most likely to be geologically active, and why?
25
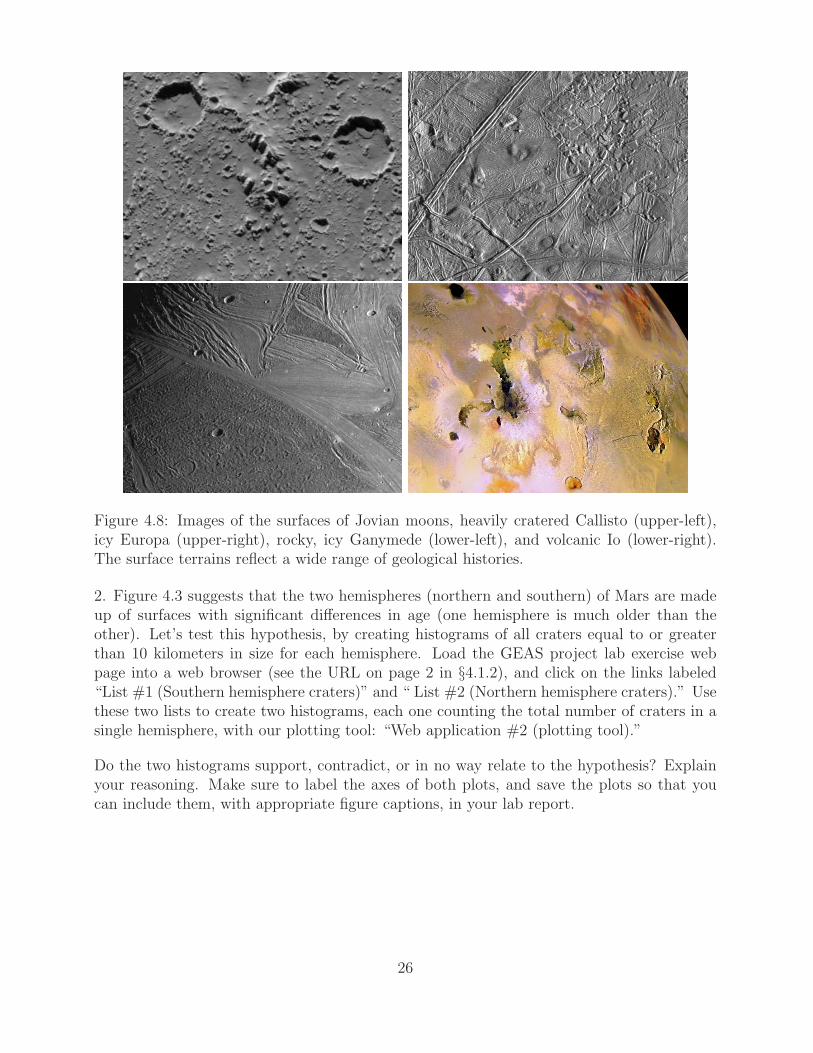
Figure 4.8: Images of the surfaces of Jovian moons, heavily cratered Callisto (upper-left),icy Europa (upper-right), rocky, icy Ganymede (lower-left), and volcanic Io (lower-right).The surface terrains reflect a wide range of geological histories.
2. Figure 4.3 suggests that the two hemispheres (northern and southern) of Mars are madeup of surfaces with significant differences in age (one hemisphere is much older than theother). Let’s test this hypothesis, by creating histograms of all craters equal to or greaterthan 10 kilometers in size for each hemisphere. Load the GEAS project lab exercise webpage into a web browser (see the URL on page 2 in §4.1.2), and click on the links labeled“List #1 (Southern hemisphere craters)” and “ List #2 (Northern hemisphere craters).” Usethese two lists to create two histograms, each one counting the total number of craters in asingle hemisphere, with our plotting tool: “Web application #2 (plotting tool).”
Do the two histograms support, contradict, or in no way relate to the hypothesis? Explainyour reasoning. Make sure to label the axes of both plots, and save the plots so that youcan include them, with appropriate figure captions, in your lab report.
26

3. Could you distinguish between a billion-year-old surface and a 3.5-billion-year-old surfaceby counting the surface density of craters with diameters equal to or greater than 16 meters?If so, how? If not, why, and what simple change could you make to your approach to do so?What results (specific values for your measurements) would you expect for each surface?
27
4. Figure 4.9 shows a portion of the caldera at the summit of Ceraunius Tholus. Theimage contains many circular depressions, but it is difficult to ascertain whether they areimpact craters, volcanic craters, or structures which formed otherwise, through the collapseof terrain. Many do not show the raised rims characteristic of impact craters, and the dataare ambiguous. You could derive an age for the surface by assuming that all of the craterswere caused by impactors. If you then realized that half of them were interlopers (volcanicor collapse features), how would your answer change – would your derived age increase ordecrease, and by how much? Explain your answer. You should find Figure 4.5 to be helpfulin answering this question.
5. Consider three possible sources of error that might affect your measurements of impactcrater densities (and derivative ages) in this exercise: (1) a natural variation in the numberand size of craters created in various locations across the planet, due to variations in themeteor distribution across the sky and with time, (2) measurement errors, in which youcount ghost craters or miss real craters, or under- or over-estimate crater diameters, and (3)systematic errors.
(a) Recall that a systematic bias is one which acts to either increase, or to decrease all ofyour measurements together (like leaving people’s shoes on when you measure their height).Describe a possible systematic bias which might affect the measurements of impact craterdensities that you made in this laboratory exercise.
28
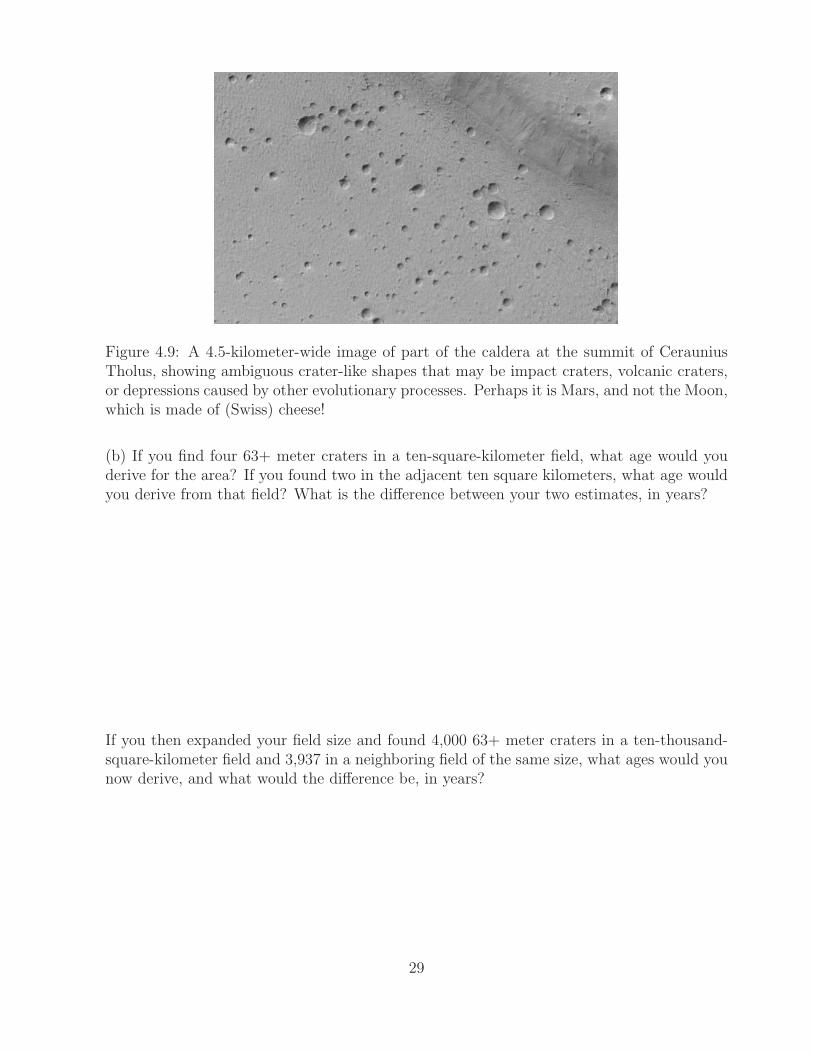
Figure 4.9: A 4.5-kilometer-wide image of part of the caldera at the summit of CerauniusTholus, showing ambiguous crater-like shapes that may be impact craters, volcanic craters,or depressions caused by other evolutionary processes. Perhaps it is Mars, and not the Moon,which is made of (Swiss) cheese!
(b) If you find four 63+ meter craters in a ten-square-kilometer field, what age would youderive for the area? If you found two in the adjacent ten square kilometers, what age wouldyou derive from that field? What is the difference between your two estimates, in years?
If you then expanded your field size and found 4,000 63+ meter craters in a ten-thousand-square-kilometer field and 3,937 in a neighboring field of the same size, what ages would younow derive, and what would the difference be, in years?
29
What can you conclude about the importance of field size in determining surface ages?You may notice that the difference in crater counts between adjacent fields of the samesize is roughly the square-root of the number of counts in this example. In the first case,4−
√4 = 4− 2 = 2 craters, and in the second case, 4, 000−
√4, 000 = 4, 000− 63 = 3, 937
craters. Because the first set of fields are a thousand times smaller than the second set (10versus 10,000 square kilometers), the crater counts are roughly a thousand times smaller aswell – 4 versus 4,000 craters. As the surface density, and the surface age, is derived from thecrater density per unit area, it need not change just because we change the size of our field.This is an example of a Poisson process, which is very common in nature, and in this caseis driven by the natural variation, or randomness in the rate at which meteoroids impact thesurface in various locations. The more impacts you examine, the smaller the variation intheir distribution due to randomness becomes.
6. The geological history of Earth has been controlled by both gradual and short-lived,catastrophic processes. Some believe that the landscape developed slowly over long periodsof time, in response to a variety of slow geological processes, while others maintain thatunusual, short-lived and energetic events have had a hugely significant effect on our history.Which of these two models best explains the formation of Martian valley networks, andwhich best explains the formation of Martian outflow channels?
30

4.8 Summary
After reviewing this lab’s goals (see §4.1.1), summarize the most important concepts exploredin this lab and discuss what you have learned. (25 points)
Be sure to cover the following points.
• Describe the appearance of the Martian surface, identify the primary drivers for itssurface evolution, and explain the scientific basis for our conclusions regarding theages of features.
• When did the last volcanic eruptions occur on Mars? Use your own age estimates forvarious regions to explain your answer.
• When did water last flow freely on Mars? Connect your answer to global changes inthe planetary climate, and again use your own age estimates for various regions toexplain your answer.
• Include the plots of Martian surfaces on which you marked craters, and the lists of thecraters which you marked, for the fields requested by your instructor.
• How can studying geological process on Mars increase our understanding of the Earth’shistory, and its future?
Use complete, grammatically correct sentences, and be sure to proofread your summary. Itshould be 300 to 500 words long.
4.9 Extra Credit
There are two notable craters in the Southwest, found near to Flagstaff, Arizona and namedBarringer and Sunset. Research them, explain their respective origins, and compare theirsizes and ages to those for craters of similar origins found on Mars. (5 points)
31