Embed Size (px)
Citation preview
1
Orange Coast College Physics 280
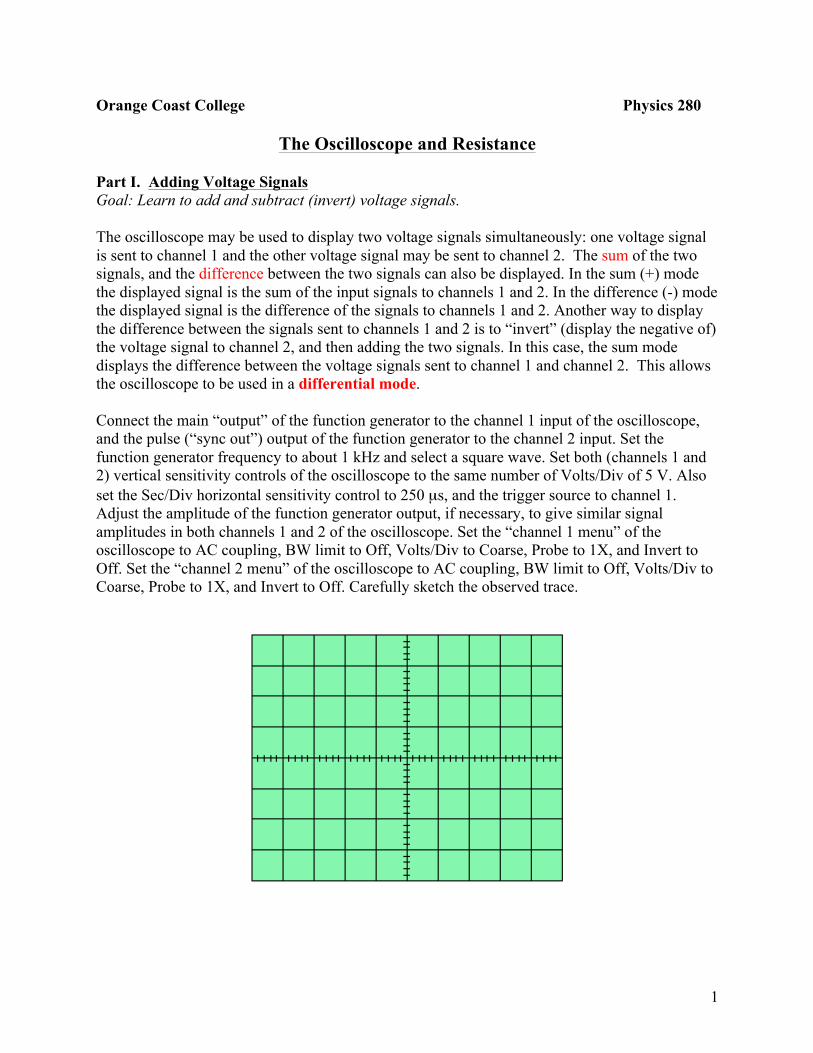
The Oscilloscope and Resistance Part I. Adding Voltage Signals Goal: Learn to add and subtract (invert) voltage signals. The oscilloscope may be used to display two voltage signals simultaneously: one voltage signal is sent to channel 1 and the other voltage signal may be sent to channel 2. The sum of the two signals, and the difference between the two signals can also be displayed. In the sum (+) mode the displayed signal is the sum of the input signals to channels 1 and 2. In the difference (-) mode the displayed signal is the difference of the signals to channels 1 and 2. Another way to display the difference between the signals sent to channels 1 and 2 is to “invert” (display the negative of) the voltage signal to channel 2, and then adding the two signals. In this case, the sum mode displays the difference between the voltage signals sent to channel 1 and channel 2. This allows the oscilloscope to be used in a differential mode. Connect the main “output” of the function generator to the channel 1 input of the oscilloscope, and the pulse (“sync out”) output of the function generator to the channel 2 input. Set the function generator frequency to about 1 kHz and select a square wave. Set both (channels 1 and 2) vertical sensitivity controls of the oscilloscope to the same number of Volts/Div of 5 V. Also set the Sec/Div horizontal sensitivity control to 250 µs, and the trigger source to channel 1. Adjust the amplitude of the function generator output, if necessary, to give similar signal amplitudes in both channels 1 and 2 of the oscilloscope. Set the “channel 1 menu” of the oscilloscope to AC coupling, BW limit to Off, Volts/Div to Coarse, Probe to 1X, and Invert to Off. Set the “channel 2 menu” of the oscilloscope to AC coupling, BW limit to Off, Volts/Div to Coarse, Probe to 1X, and Invert to Off. Carefully sketch the observed trace.
2
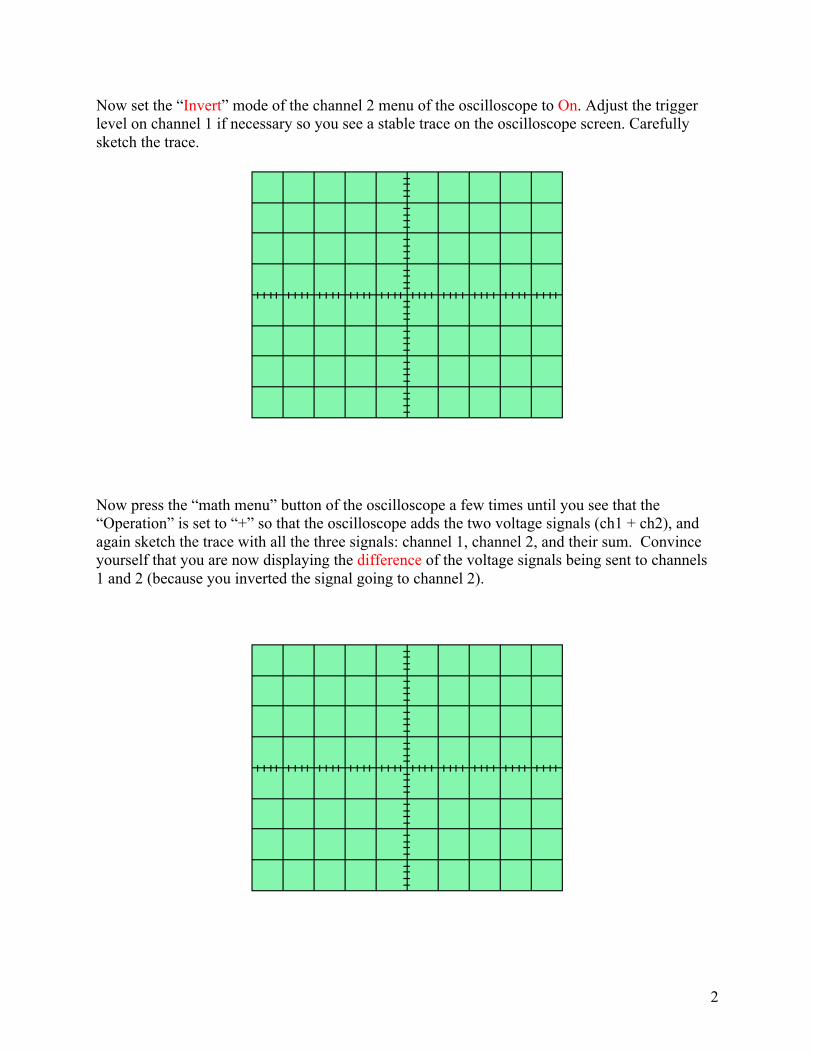
Now set the “Invert” mode of the channel 2 menu of the oscilloscope to On. Adjust the trigger level on channel 1 if necessary so you see a stable trace on the oscilloscope screen. Carefully sketch the trace.
Now press the “math menu” button of the oscilloscope a few times until you see that the “Operation” is set to “+” so that the oscilloscope adds the two voltage signals (ch1 + ch2), and again sketch the trace with all the three signals: channel 1, channel 2, and their sum. Convince yourself that you are now displaying the difference of the voltage signals being sent to channels 1 and 2 (because you inverted the signal going to channel 2).
3
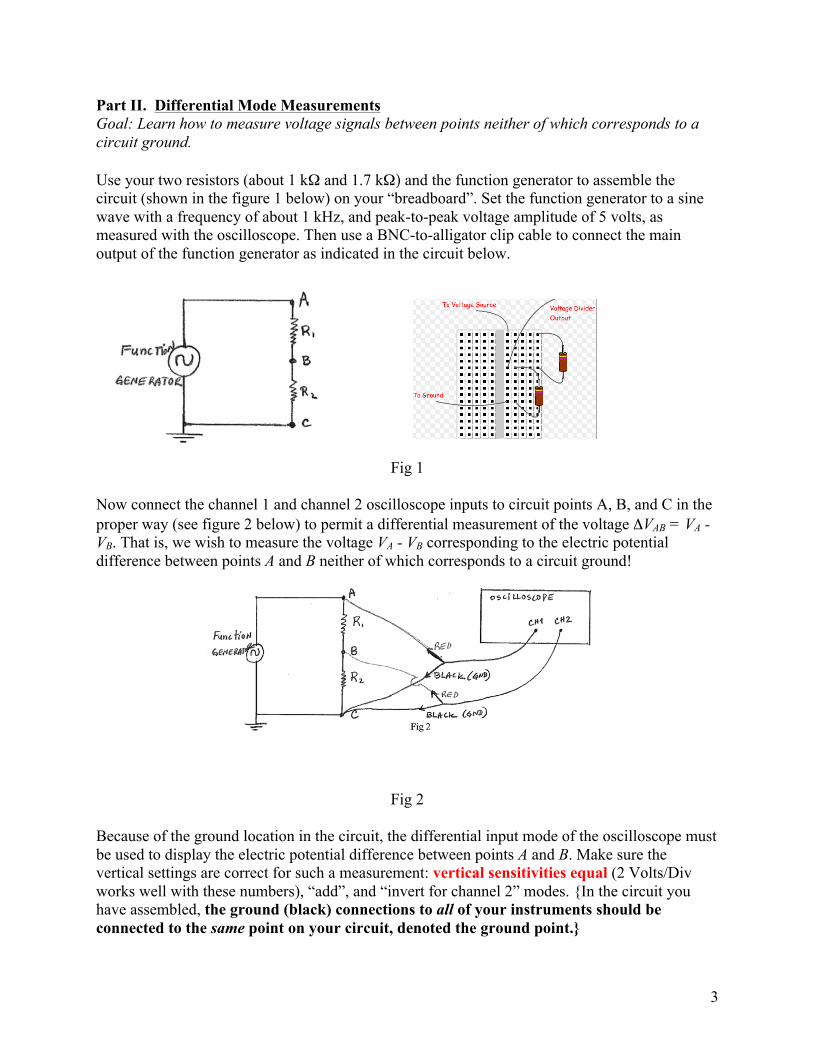
Part II. Differential Mode Measurements Goal: Learn how to measure voltage signals between points neither of which corresponds to a circuit ground. Use your two resistors (about 1 kΩ and 1.7 kΩ) and the function generator to assemble the circuit (shown in the figure 1 below) on your “breadboard”. Set the function generator to a sine wave with a frequency of about 1 kHz, and peak-to-peak voltage amplitude of 5 volts, as measured with the oscilloscope. Then use a BNC-to-alligator clip cable to connect the main output of the function generator as indicated in the circuit below.
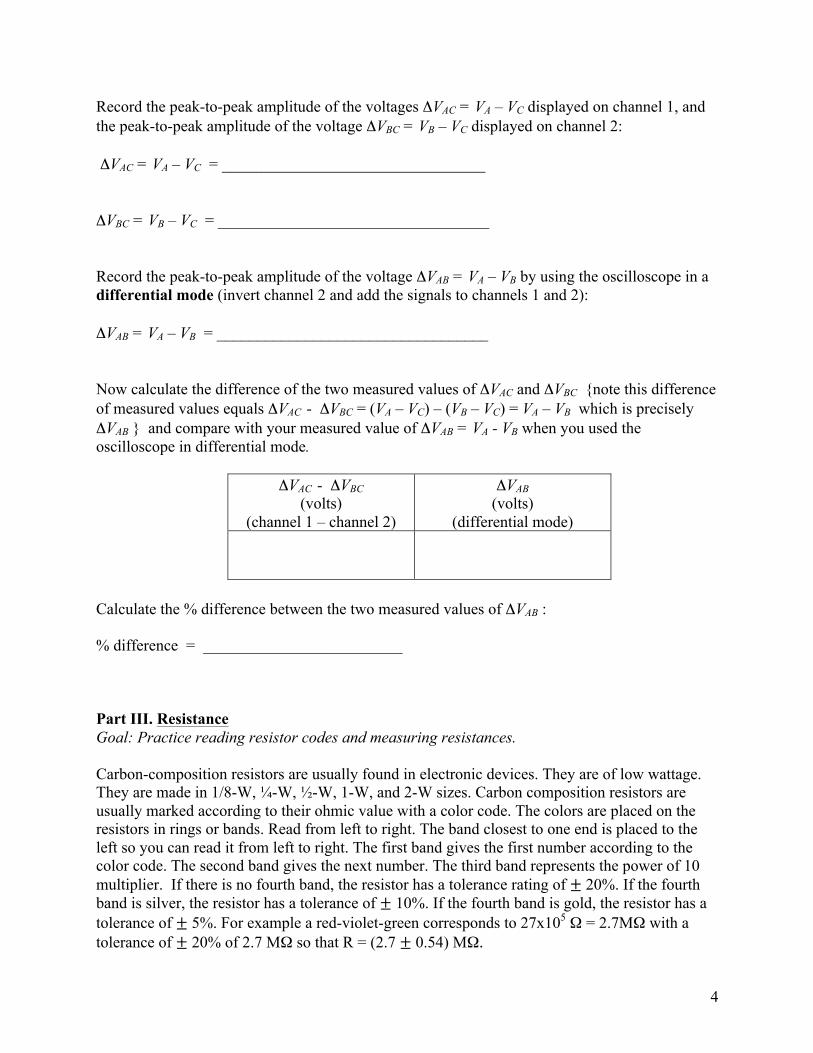
Fig 1 Now connect the channel 1 and channel 2 oscilloscope inputs to circuit points A, B, and C in the proper way (see figure 2 below) to permit a differential measurement of the voltage ΔVAB = VA - VB. That is, we wish to measure the voltage VA - VB corresponding to the electric potential difference between points A and B neither of which corresponds to a circuit ground!
Fig 2 Because of the ground location in the circuit, the differential input mode of the oscilloscope must be used to display the electric potential difference between points A and B. Make sure the vertical settings are correct for such a measurement: vertical sensitivities equal (2 Volts/Div works well with these numbers), “add”, and “invert for channel 2” modes. {In the circuit you have assembled, the ground (black) connections to all of your instruments should be connected to the same point on your circuit, denoted the ground point.}
4
Record the peak-to-peak amplitude of the voltages ΔVAC = VA – VC displayed on channel 1, and the peak-to-peak amplitude of the voltage ΔVBC = VB – VC displayed on channel 2: ΔVAC = VA – VC = _________________________________ ΔVBC = VB – VC = __________________________________ Record the peak-to-peak amplitude of the voltage ΔVAB = VA – VB by using the oscilloscope in a differential mode (invert channel 2 and add the signals to channels 1 and 2): ΔVAB = VA – VB = __________________________________ Now calculate the difference of the two measured values of ΔVAC and ΔVBC {note this difference of measured values equals ΔVAC - ΔVBC = (VA – VC) – (VB – VC) = VA – VB which is precisely ΔVAB } and compare with your measured value of ΔVAB = VA - VB when you used the oscilloscope in differential mode.
ΔVAC - ΔVBC (volts)
(channel 1 – channel 2)
ΔVAB (volts)
(differential mode)
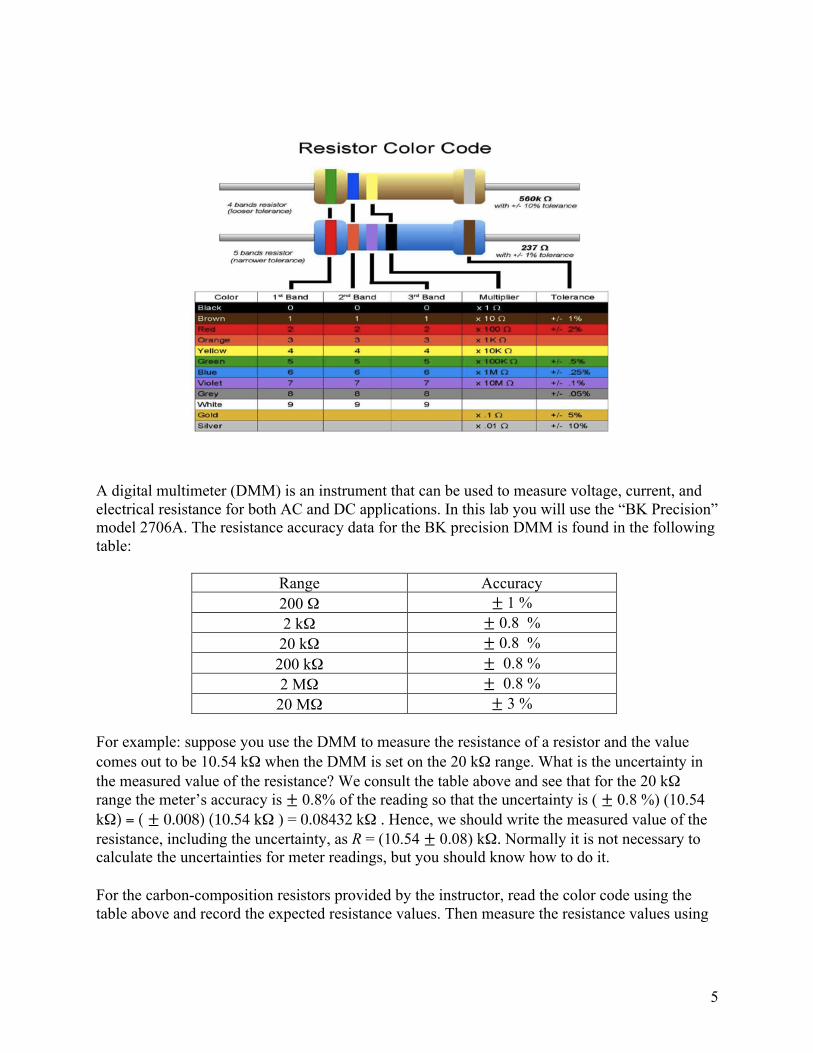
Calculate the % difference between the two measured values of ΔVAB : % difference = _________________________ Part III. Resistance Goal: Practice reading resistor codes and measuring resistances. Carbon-composition resistors are usually found in electronic devices. They are of low wattage. They are made in 1/8-W, ¼-W, ½-W, 1-W, and 2-W sizes. Carbon composition resistors are usually marked according to their ohmic value with a color code. The colors are placed on the resistors in rings or bands. Read from left to right. The band closest to one end is placed to the left so you can read it from left to right. The first band gives the first number according to the color code. The second band gives the next number. The third band represents the power of 10 multiplier. If there is no fourth band, the resistor has a tolerance rating of ± 20%. If the fourth band is silver, the resistor has a tolerance of ± 10%. If the fourth band is gold, the resistor has a tolerance of ± 5%. For example a red-violet-green corresponds to 27x105 Ω = 2.7MΩ with a tolerance of ± 20% of 2.7 MΩ so that R = (2.7 ± 0.54) MΩ.
5
A digital multimeter (DMM) is an instrument that can be used to measure voltage, current, and electrical resistance for both AC and DC applications. In this lab you will use the “BK Precision” model 2706A. The resistance accuracy data for the BK precision DMM is found in the following table:
Range Accuracy 200 Ω ± 1 % 2 kΩ ± 0.8 % 20 kΩ ± 0.8 % 200 kΩ ± 0.8 % 2 MΩ ± 0.8 % 20 MΩ ± 3 %
For example: suppose you use the DMM to measure the resistance of a resistor and the value comes out to be 10.54 kΩ when the DMM is set on the 20 kΩ range. What is the uncertainty in the measured value of the resistance? We consult the table above and see that for the 20 kΩ range the meter’s accuracy is ± 0.8% of the reading so that the uncertainty is ( ± 0.8 %) (10.54 kΩ) = ( ± 0.008) (10.54 kΩ ) = 0.08432 kΩ . Hence, we should write the measured value of the resistance, including the uncertainty, as R = (10.54 ± 0.08) kΩ. Normally it is not necessary to calculate the uncertainties for meter readings, but you should know how to do it. For the carbon-composition resistors provided by the instructor, read the color code using the table above and record the expected resistance values. Then measure the resistance values using
6
the DMM and record the values in the table below. Determine the uncertainty of each resistor reading made with the DMM. Are the resistor’s measured values within tolerance?
band colors Coded resistance value (kΩ)
Measured resistance value (kΩ)
Part IV. Series and Parallel Resistance Combinations Goal: Predict and measure resistances of resistor combinations. Choose two of your resistors (one with a resistance of about 120 kΩ and the other with a resistance of about 330 kΩ): R1 = ________________________ R2 = ________________________ Resistors in series Theory Using the measured values for their resistances in part 3 above, calculate the expected equivalent resistance (from theory: Req = R1 + R2 ) when the two resistors are connected in series. Req = ________________________ Experiment Now use the DMM to measure the resistance of the two resistors connected in series using the circuit board to connect the resistors, and compare with your prediction by calculating the % error. Req = ________________________ % error = _____________________ Resistors in parallel Theory
7
Now calculate the expected equivalent resistance (from theory: !!" =!!!!!!!!!
) when the two resistors are connected in parallel. Req = ________________________ Experiment Now use the DMM to measure the resistance of the two resistors connected in parallel using the circuit board to connect the resistors, and compare with your prediction by calculating the % error. Req = ________________________ % error = _____________________


![using an oscilloscope - Faculty Server Contactfaculty.uml.edu/dbowden/ClassPages/0_Common_Library/Lab Manuals... · using an oscilloscope 9/18/2013 7:14:30 PM] Many of the controls](https://img.pdfslide.us/doc/110x75/5b4fb1167f8b9a206e8cf0dc/using-an-oscilloscope-faculty-server-manuals-using-an-oscilloscope-9182013.jpg)