Embed Size (px)
Citation preview

La Vuelta and La Herradura Hydroelectric Project
Empresas Públicas de Medellín, Colombia July 2003
Prepared by MGM International, Ltda. Ayacucho 1435, 9º B C1111AAM Buenos Aires Argentina

La Vuelta and La Herradura Hydroelectric Project
La Vuelta and La Herradura Hydroelectric Project 2 MGM International, Ltda. © Copyright (July 14, 2003) All Rights Reserved
TABLE OF CONTENTS Acknowledgements 4
A. GENERAL DESCRIPTION OF PROJECT ACTIVITY 5 A.1. Title of the project activity: 5 A.2. Description of the project activity: 5 A.3. Project participants: 9 A.4. Technical description of the project activity: 10
A.4.1. Location of the project activity: 11 A.4.2. Category(ies) of project activity: 14 A.4.4. Brief explanation of how the anthropogenic emissions of greenhouse gas (GHGs) by sources are to be reduced by the proposed CDM project activity, including why the emission reductions would not occur in the absence of the proposed project activity, taking into account national and/or sectoral policies and circumstances: 18 A.4.5. Public funding of the project activity: 20
B. BASELINE METHODOLOGY 21 B.1 Title and reference of the methodology applied to the project activity: 21 B.2. Justification of the choice of the methodology and why it is applicable to the project activity: 21 B.3. Description of how the methodology is applied in the context of the project activity: 23 B.4. Description of how the anthropogenic emissions of GHG by sources are reduced below those that would have occurred in the absence of the registered CDM project activity (i.e. explanation of how and why this project is additional and therefore not the baseline scenario): 33 B.5. Description of how the definition of the project boundary related to the baseline methodology is applied to the project activity: 39 B.6. Details of baseline development 45
B.6.1. Date of completing the final draft of this baseline section 45
C. DURATION OF THE PROJECT ACTIVITY / CREDITING PERIOD 46 C.1 Duration of the project activity: 46
C.1.1. Starting date of the project activity: 46 C.1.2. Expected operational lifetime of the project activity: 47
C.2 Choice of the crediting period and related information: 47 C.2.1. Renewable crediting period 47 C.2.2. Fixed crediting period 48
D. MONITORING METHODOLOGY AND PLAN 49 D.1. Name and reference of approved methodology applied to the project activity: 49 D.2. Justification of the choice of the methodology and why it is applicable to the project activity: 49 D.3. Data to be collected in order to monitor emissions from the project activity, and how this data will be archived: 51 D.4. Potential sources of emissions which are significant and reasonably attributable to the project activity, but which are not included in the project boundary, and identification if and how data will be collected and archived on these emission sources: 51

La Vuelta and La Herradura Hydroelectric Project
La Vuelta and La Herradura Hydroelectric Project 3 MGM International, Ltda. © Copyright (July 14, 2003) All Rights Reserved
D.5. Relevant data necessary for determining the baseline of anthropogenic emissions by sources of GHG within the project boundary and identification if and how such data will be collected and archived:52 D.6. Quality control (QC) and quality assurance (QA) procedures are being undertaken for data monitored: 52 D.7 Name of person/entity determining the monitoring methodology: 53
E. CALCULATION OF GHG EMISSIONS BY SOURCES 54 E.1. Description of formulae used to estimate anthropogenic emissions by sources of greenhouse gases of the project activity within the project boundary: 54 E.2. Description of formulae used to estimate leakage, defined as: the net change of anthropogenic emissions by sources of greenhouse gases which occurs outside the project boundary, and that is measurable and attributable to the project activity: 59 E.3 The sum of E.1 and E.2 representing the project activity emissions: 62 E.4 Description of formulae used to estimate the anthropogenic emissions by sources of greenhouse gases of the baseline: 62 E.5 Difference between E.4 and E.3 representing the emission reductions of the project activity: 62 E.6 Table providing values obtained when applying formulae above: 63
F. ENVIRONMENTAL IMPACTS 66 F.1. Documentation on the analysis of the environmental impacts, including transboundary impacts 66 F.2. If impacts are considered significant by the project participants or the host Party: 66
G. STAKEHOLDERS COMMENTS 70 G.1. Brief description of the process on how comments by local stakeholders have been invited and compiled: 70 G.2. Summary of the comments received: 70 G.3. Report on how due account was taken of any comments received: 72
ANNEX 1: CONTACT INFORMATION ON PARTICIPANTS IN THE PROJECT ACTIVITY 73
ANNEX 2: INFORMATION REGARDING PUBLIC FUNDING 75
ANNEX 3: NEW BASELINE METHODOLOGY 76
ANNEX 4: NEW MONITORING METHODOLOGY 103
ANNEX 5: BASELINE DATA 110

La Vuelta and La Herradura Hydroelectric Project
La Vuelta and La Herradura Hydroelectric Project 4 MGM International, Ltda. © Copyright (July 14, 2003) All Rights Reserved
Acknowledgements
The MGM International Ltda. project team acknowledges the contribution of the following in the preparation of the PDD. Empresas Públicas de Medellín Mrs. Olga Lucía Velez Arango Mr. Carlos Alberto Valencia Echeverri Mr. Luis Fernando Rodríguez Arbeláez Mr. Jorge Alonso Arboleda González Subgerencia Planeación Generación Energía

La Vuelta and La Herradura Hydroelectric Project
La Vuelta and La Herradura Hydroelectric Project 5 MGM International, Ltda. © Copyright (July 14, 2003) All Rights Reserved
A. General description of project activity A.1. Title of the project activity:
La Vuelta and La Herradura Hydroelectric Project A.2. Description of the project activity: • Purpose: The purpose of the project is to build a hydroelectric power plant in order to take advantage of the capacity of La Herradura river, by means of two subprojects in a chain (La Herradura and La Vuelta). The plant will have a total installed capacity of 31.5 MW. Moreover, this would improve electricity service in the west of Antioquia Department, contributing to regional development. Simultaneously, the project will provide clean energy and reduce CO2 emissions.
Project Description: The use of La Herradura river would begin in the upper part of the basin at the La Vuelta Sub-Project. The mean flow is 12.3 m3/s with a fall of 112 m for a potential installed capacity of 11.7 MW. La Herradura Sub-Project is located 5 km downstream (on the same river). The mean flow is 14.0 m3/s with a fall of approximately 220 m which would permit generating about 19.8 MW.
Brief history of the project: Several studies for the utilization of La Herradura river basin were conducted between 1965 and 1997. The first study, commissioned by the Cooperative of Municipalities of Antioquia for a mini-hydro plant at La Vuelta, was executed by Gutiérrez and Montoya Civil Engineers. In 1994, the Medellín Integral S.A. firm carried out technical and economic feasibility studies of La Herradura for the former Electrificadora de Antioquia, today Antioquia Energy Company (EADE S.A.E.S.P.). Between 1995 and 1997 various environmental and design studies for both projects were also undertaken. These studies defined the basic outline of effective use for these subprojects, which remain valid today.
Finally, during 2001, Empresas Públicas de Medellín E.S.P. (EE.PP.M) conducted an internal review of the technical and environmental documentation of the subprojects, with the purpose of project optimization, as well as analyzing the economic and financial viability for their construction, and considering the possibilities of reducing financial risks through project formulation as CDM.
• Sustainable development considerations:

La Vuelta and La Herradura Hydroelectric Project
La Vuelta and La Herradura Hydroelectric Project 6 MGM International, Ltda. © Copyright (July 14, 2003) All Rights Reserved
a. Economic The project will generate revenue for the municipalities for economic transfer within the framework of Law 99/93. This amount could be about 200,000 US$/year during the project life. These resources will be available to the municipalities for the implementation of Municipal Development Plans, especially in basic sanitation and environmental protection programs. The Urabá region, influenced directly by the development of the project, is the only area of the Department that is connected to the Caribbean sea. This region includes export-oriented activities. In this region the exploitation of banana plantations (one of the main export items) is developed at industrial and commercial levels. Additionally, there is a potential development for meat industry which could be favored with a better quality of power supply. The project would improve electricity service in the region. Electricity service for the northwest of Antioquia Department is provided by a two-link transmission system (Fig. 1): • Transmission line of 115 kV with a total length of 230 km, reinforced with a series
compensation system in Apartadó substation, making it possible to increase its transportation and stability capacity.
• Transmission line of 230 kV with 49 km between Urrá and Urabá substations, connecting to Antioquia Department through Caucasia substation.
Figure 1: Electricity transmission system in the Antioquia Department
The current average demand of Urabá region is of about 50 MW, which is covered through Urrá-Urabá lines of 230 kV and West-Apartadó of 115 kV. But if frequent
EEPPM Elect. Equivalent
Distributed Generation Projects
ISA Electric Equivalent
Demand of the Urabá region
115 kV line
230 kV line
La Vuelta and La Herradura Hydroelectric Project
La Vuelta and La Herradura Hydroelectric Project 7 MGM International, Ltda. © Copyright (July 14, 2003) All Rights Reserved
guerrilla attacks in the region, which keep the 230 kV line out of order, are taken into account, the demand in the Urabá region should be limited, because through the 115 kV line it is not possible to transport 50 MW since the quality of the service cannot be secured due to the reduction in more than 10% of the nominal tension allowed in Apartadó substation. The length of the West-Apartadó line and the size of the demand covered bring about these problems of low voltage, which in spite of the installed series compensation, does not guarantee the transportation capacity required by the line in Frontino-Apartadó section.
As another additional benefit, the subprojects are bent towards distributed generation, key issue in the electric energy business all over the world, specially because they favor the development of small scale projects, near consumption centers, producing low environmental impact and minimizing the risk of technological change expected for the mid-term.
b. Environmental
The project will provide clean energy and reduce CO2 emissions in Colombia. The direct on-site emissions from the project are the emissions related to the production of electricity. Hydropower is a clean energy source that is emissions free, and there will be no GHG emissions that are directly related to the use of hydropower for electricity production. Subsequently, the direct emissions for the project are considered zero. Moreover, the run-of-river plants have no regulating reservoirs so that environmental impacts are minimal and under control through a periodic monitoring plan.
c. Social The project will contribute to job creation during the construction period and also during operation (about 1,000 direct and indirect employments). Also, the projects will contribute to regional development through institutional strengthening, with the goal that municipalities manage their own development projects, as well as providing new access roads for villages in the region. Likewise, through the construction of roads providing better connection among the municipalities of Abriaquí, Frontino and Cañasgordas, people living in the project area would gain access to basic health services, education and trading of local agricultural produce. Potential expansion and replicability are also possible.
d. National Sustainable Development Criteria
The Colombian government, through the Colombian Office for Climate Change Mitigation (OCMCC), has elaborated sustainable development criteria for CDM projects. The project can be reviewed in the context of a draft version of these criteria.
La Vuelta and La Herradura Hydroelectric Project
La Vuelta and La Herradura Hydroelectric Project 8 MGM International, Ltda. © Copyright (July 14, 2003) All Rights Reserved
In that sense, it can be stated that the project complies with the applicable sectoral legal framework and has completed the environmental impact assessment and received the environmental licenses, it has the corresponding authorization to be developed, and it respects community interests and rights. The project is in line with national policies and programs by promoting the use of renewable energy sources (Law 697/2001). It also contributes to improving long-term social and economic conditions of the local community, as stated above. Additionally, the project implements clean technology contributing to the cleaner production criterion. Specifically, the main concerns are summarized as follows:
Review of sustainable development criteria proposed by OCMCC (June 2003)
1. Commitment with sectoral regulation (property rights, rights over natural
resources, certificates, licenses, environmental impact studies, rights of local communities according to Art. 330 of National Constitution, Law 21/1991, Law 99/1993, and Decree 1320/1998)
A copy of property rights, environmental licenses, and rights over natural resources, environmental impact studies, and documentation related to local community opinion assessment are available for validation of the project. The specific files are referenced in a document attached to the PDD (see MGM_EPM_SD.doc). Section F also includes a summary of the main aspects and conclusions of the environmental impact studies.
2. Contribution and compatibility with government policy (local, regional, and
national planning, programs, and projects)
The projects are in line with criteria for the generation capacity expansion plan of the whole national electricity system and general environmental and energy policies of the country. A summary of the related legislation is included in the attached document MGM_EPM_SD.doc.
3. Contribution to improvements in social and economic conditions of local
community (institutional agreements, employment generation, capacity building, local market development, impact on the trade balance, consideration of social needs)
Actions to deal with local communities’ needs have been considered as part of the Environmental Management Plan. The corresponding information is attached to the PDD (see MGM_EPM_SD.doc).
4. Cleaner production implementation (minimization of environmental impact,
technology transfer)

La Vuelta and La Herradura Hydroelectric Project
La Vuelta and La Herradura Hydroelectric Project 9 MGM International, Ltda. © Copyright (July 14, 2003) All Rights Reserved
Hydroelectricity is a clean technology which helps to avoid air pollutant emissions coming from fossil fuel-fired power plants. A more detailed description is presented about environmental, social and economic contributions of the project in a separate document (MGM_EPM_SD.doc).
A.3. Project participants:
Host Party: Republic of Colombia
Project Developer and Sponsor: Empresas Públicas de Medellín E.S.P. (EE.PP.M)
Web address: http://www.eeppm.com Project sponsors’ capability in implementing the project (e.g. credentials): From 1955 and up to 1997, EE.PP.M was a decentralized municipal entity providing diverse public services (e.g. energy, water supply, sewage) to the Antioquia Department including the Valle de Aburrá region and other municipalities such as Bello, Copacabana, Girardota, Barbosa, Itaguí, Envigado, Sabaneta, La Estrella y Caldas. Since 1998 and considering both the Agreement 69 of 1997 issued by the Medellín Council and the Law 142 of 1994, EE.PP.M was modified to become an Industrial and Commercial State Enterprise with the specific objective of providing sustainable services and enhancing community progress. Effectively, EE.PP.M has 48 years of experience building and operating infrastructure as well as providing public services to the 2,500,000 inhabitants of the region including sewerage, wastewater transport and treatment, electricity, gas distribution and telecommunications. In the power sector, EE.PP.M has built the hydroelectric capacity base of the Antioquia Department (e.g. Guadalupe I, II, III and IV, Mocorongo, Playas, Niquía, La Tasajera and Porce II hydroelectric power plants). EE.PP.M also owns the only hydro plant in the country able to store water from one year to the next (Guatapé plant with the Peñol dam). The company has also diversified its portfolio of power generation assets finishing in 1998 the construction of the 300 MW gas-based thermal power plant La Sierra, from which a combined cycle project with additional 166 MW was later developed. This project started commercial operations on January 27, 2001. Currently, EE.PP.M is building La Vuelta and La Herradura hydro plants and Jepirachi wind farm of 19.5 MW, the first project to be carried out in the country with this technology. Jepirachi project belongs to the PCF portfolio (the Emission Reduction Purchase Agreement was signed in December 2002) and is also the first project in Colombia to be implemented within the CDM framework .

La Vuelta and La Herradura Hydroelectric Project
La Vuelta and La Herradura Hydroelectric Project 10 MGM International, Ltda. © Copyright (July 14, 2003) All Rights Reserved
Moreover, since 1998, EE.PP.M provides natural gas distribution service in 10 municipalities of the Valle de Aburrá Region. The EE.PP.M power generating business has a total installed capacity of 2,573 MW and generates an average of 9,100 GWh per year. At present, EE.PP.M is planning medium- to long-term capacity additions to its portfolio of power generation projects, taking into consideration the CDM learning-by-doing process, experience, positioning and revenues, and thus also considering the construction and operation of hydro plant Porce III (660 MW). In terms of the company’s financial status, it is estimated that by 2003 EE.PP.M investments will reach a total of 630 million USD with a balanced debt of 33% and equity of 2.8 billion USD. EE.PP.M has a solid capital and a sustainable transparent financial balance which is built on sales and that has never needed external contributions or governmental fund transfers. Decision making regarding investments, expansion and the operation of the diversified portfolio of EE.PP.M’s assets is exclusively conducted by internal administrative bodies, the Board of Directors and the director manager. Finally, EE.PP.M has received several national and international awards for its economic, financial and social performance. In particular, EE.PP.M was recipient of the national award “Premio Portafolio a la Empresa del Siglo XX”, which is decided by a board of experts composed by academia, industrial and banking sectors of Colombia.
Annex I Country Participant: Electric Power Development Company, Ltd. (Japan) See Contact Information in Annex 1. Official CDM contact: Name: Marco G. Monroy Address: MGM International, Ltda.
PDD Consultant Ayacucho 1435, 9º B C1111AAM Buenos Aires Argentina
Telephone: (54 11) 4816-1514 E-mail: [email protected] A.4. Technical description of the project activity:

La Vuelta and La Herradura Hydroelectric Project
La Vuelta and La Herradura Hydroelectric Project 11 MGM International, Ltda. © Copyright (July 14, 2003) All Rights Reserved
A.4.1. Location of the project activity: A.4.1.1 Host country Party(ies): Republic of Colombia
A.4.1.2 Region/State/Province etc.: Antioquia Department
A.4.1.3 City/Town/Community etc: Cañasgordas, Frontino and Abriaquí Municipalities
A.4.1.4 Detail on physical location, including information allowing the
unique identification of this project activity: Location: The Republic of Colombia is located in Northern South America, bordering the Caribbean Sea, between Panamá and Venezuela, and bordering the North Pacific Ocean, between Ecuador and Panamá. The project will be located in the northwestern part of Antioquia Department, using the water of La Herradura river, under municipalities of Cañasgordas, Frontino and Abriaquí jurisdiction, although it can be considered as regional area of influence, the whole of Urabá Antioqueño, which goes from Santa Fé de Antioquia to Arboletes. In this zone of approximately 230 km2, important municipalities, such as Dabeiba, Mutatá, Chigorodó, Apartadó and Turbo are found. (See Fig. 2).
La Herradura Sub-Project La Herradura subproject will take place on La Herradura river, starting from an existing topographic fall between this river and the Cañasgordas river; the two rivers later join to form the Sucio river basin, a tributary of the Atrato river. The hydrographic basin of La Herradura river used for this project covers an area of about 320 km2, which contributes to a mean flow of 14 m3/s at the catchment point. The construction will be located under Frontino and Cañasgordas jurisdictions.
La Vuelta Sub-Project The subproject will take place in the upper and middle La Herradura river basin, up to the fork at the Nancuí gulch, at 1595 m elevation, covering the whole of Abriaquí municipality and the limits coincide with the dividing basin and to a lesser extent with Frontino municipality. The hydrographic basin (catchment area) of La Herradura river used by the project covers an area of about 286 km2, which contributes to a mean flow of 12.3 m3/s at the catchment point.

La Vuelta and La Herradura Hydroelectric Project
La Vuelta and La Herradura Hydroelectric Project 12 MGM International, Ltda. © Copyright (July 14, 2003) All Rights Reserved

La Vuelta and La Herradura Hydroelectric Project
La Vuelta and La Herradura Hydroelectric Project 13 MGM International, Ltda. © Copyright (July 14, 2003) All Rights Reserved
Figure 2: Colombia (above) and Antioquia Department (below) Geographic coordinates: Approx. 6 N, 76 W
Source: http://www.cia.gov/cia/publications/factbook/geos/co.html Green points represent La Vuelta and La Herradura power plant locations.
Figure2. Colombia (above) and Antioquia Department (below) Geographics coordinates: Aprox 6N, 76 W
Source: http://www.eia.gov/cia/publications/factbook/geos/co.html Gren points represent La Vuelta and La Herradura power plant locations
The hydroelectric project sites can be reached along Medellín–Santa Fé de Antioquia–Cañasgordas–Dabeiba–Turbo roads, with a side road to Frontino municipality, 150 km from Medellín.

La Vuelta and La Herradura Hydroelectric Project
La Vuelta and La Herradura Hydroelectric Project 14 MGM International, Ltda. © Copyright (July 14, 2003) All Rights Reserved
A.4.2. Category(ies) of project activity:
There is neither a list of categories of project activities nor registered CDM project activities available yet on the UNFCCC web site to provide this information in this document. Nevertheless, in order to suggest a category for the current project activity it is decided to use the classification available for CDM small-scale project activities, according to the simplified modalities and procedures for CDM small-scale project activities.1 Thus, the proposed “La Vuelta and La Herradura Hydroelectric” project can be categorized as a “Renewable Energy Project with Renewable Electricity Generation for a Grid.” This category comprises renewables, such as photovoltaics, hydro, tidal/wave, wind, geothermal, and biomass, that supply electricity to an electricity distribution system that is or would have been supplied by at least one fossil fuel or non-renewable biomass fired generating unit.
A.4.3. Technology to be employed by the project activity: Technology description: La Vuelta Sub-Project The main components of the sub-project consist of:
Works to divert the stream flow and remove sand. A spillway with a capacity of 1,687 m3/s. Box coulvert conduction, free flow tunnel and penstock. A power house on the surface with a generating unit equipped with a Francis turbine. Main substation next to the power house. Connection to the electric system of EADE S.A. E.S.P. with the purpose of not saturating
the 44 kV Frontino-Cañasgordas power line.
Power plant characteristics Installed capacity 11.9 MW Plant nominal flow 12 m3/s Load tank normal level 1,590.80 m above sea level Discharge normal level 1,473.80 m above sea level Installation elevation in turbine belt wheel 1,470.80 m above sea level Normal gross head (1,590.80 – 1,473.80) 117 m Net design head 112.90 m Hydraulic turbine Type Francis, horizontal axis
1 Annex 6: “Indicative simplified baseline and monitoring methodologies for selected small-scale CDM project activity categories,” Recommendation by the Panel on Baseline and Monitoring Methodologies (Meth Panel) adopted by the Executive Board in its seventh session (20-21 January 2003).

La Vuelta and La Herradura Hydroelectric Project
La Vuelta and La Herradura Hydroelectric Project 15 MGM International, Ltda. © Copyright (July 14, 2003) All Rights Reserved
Number of units 1 Nominal power output 12.25 MW Rotation speed 514.28 min-1 Nominal submergence (1,473.80 – 1,470.80) 3 m Nominal flow 11.97 m3/s (approx.) Design net head 112.90 m Minimum efficiency (100% opening) 2.4% Generator Type Synchronic with horizontal axis Number of units 1 Nominal power output 14,000 kVA Nominal tension 13.8 kV Nominal frequency 60 Hz Power factor (cosine ø) 0.85 (lagging) Synchronic speed 514.28 min-1
La Herradura Sub-Project The main components of the sub-project consist of:
Works to divert stream flow and remove sand. Vertical reception well emptying its waters to conduction. Pressurized 1,534 m tunnel which receives the water from the vertical well. Pressurized pipes as last tract of the flow system. A power house on the left riverbank of the Cañasgordas river with two Francis turbines
within. Discharge channel to the Cañasgordas river and substation located on the north side of the
power house.
Power plant characteristics Net installed capacity 19.9 MW Central nominal flow 10.0 m3/s Load tank normal level 1184.5 m above sea level Discharge normal level 940 m above sea level Installation elevation of turbine belt wheel 937.5 m above sea level Normal gross head 244.5 m Design net head 230.6 m Hydraulic Turbine Type Francis, horizontal axis Number of units 2 Nominal power output 10.4 MW

La Vuelta and La Herradura Hydroelectric Project
La Vuelta and La Herradura Hydroelectric Project 16 MGM International, Ltda. © Copyright (July 14, 2003) All Rights Reserved
Rotation speed 900 min-1 Nominal submergence (940.0 – 937.5) 2.5 m Total nominal flow ( two turbines) 10.0 m3/s (approx.) Design net head 230.6 m Minimum efficiency (100% opening) 92.4% Admission valves (spherical type) 0.9 m nominal day
Taking into account the selected equipment, it was decided to assign two generating units to the power plant. Each turbine shall be equipped with a pressure relief valve synchronized with the closing of blades so as to limit spiral chamber internal pressure at gross leap 115%. Turbine Regulator: programmable digital type with electronic head operated from central or by remote control from another control center. It would have, additionally, an electro-hydraulic system for normal operations of synchronization, charge and discharge.
Generator Type synchronic, horizontal axis Number of units 2 Nominal power output 12.0 MVA Nominal tension 13.8 kV Nominal frequency 60 Hz Power factor (cosine ø) 0.85 (in delay) Synchronic speed 900 min-1
Transformers: It has been decided the use of an outdoors transformer for the two generators, with a capacity of 24 MVA: three-phase, with primary nominal voltage of 13.8 kV and secondary of 44 kV and 60 Hz, oil-cooled under normal conditions and by forced air under operating conditions at continual maximum capacity. Delta connection on the low tension side and star with ground neutral on the ground netting of the central. Mechanical auxiliary equipments: Oil in bolsters will be cooled in a dry type tower, the oil circuit will be closed and the pumps will be directly propelled by the unit axis. For the drainage of the spiral chamber, the relief valve discharge pit, the draft duct and infiltered waters and power house floors drainage, there is a system with submergible vertical pumps installed in the drainage pit to conduct water to the discharge channel. Electric auxiliary equipments: A 480 kV-13.8 kV transformer will be used as normal feed, fed from any of the two generators as main source. It will have a diesel electric generator of 480 V and 60 Hz emergency system.

La Vuelta and La Herradura Hydroelectric Project
La Vuelta and La Herradura Hydroelectric Project 17 MGM International, Ltda. © Copyright (July 14, 2003) All Rights Reserved
Each generation unit will have a control center and a 480 V distribution board so that maintenance and selection processes in auxiliary services operations will be independent. There will be a surveillance system and water level control in the load tank. Therefore, the central will be interconnected, so as to secure accurate load tank operation hydraulic conditions.
Turbine specifications: The turbines will be Francis type reaction turbines with martensitic stainless steel welded impeller, with spiral chamber and welded draft pipe from soothed carbon steel sheets, of thin austenitic grain size. A Francis turbine is a type of hydraulic reactor turbine in which the flow exits the turbine blades in the radial direction. Francis turbine are common in power generation and are used in applications where high flow rates are available at medium hydraulic head (e.g. Niagara Falls). Water enters the turbine through a casing and is directed onto the blades by wicket gates. The low momentum water then exits the turbine through a draft tube. Francis turbines can be mounted both vertically and horizontally. Figure 3 shows a Francis turbine where water can enter freely through the whole circumference and through the outer ring of the guide vanes. These guide vanes can be adjusted so the amount of incoming water may be controlled. Francis turbines are highly efficient and versatile turbines. They are of the inflow-impulse type on the first stage and of the outflow-axial reaction type on the second stage of their operation. That is, the blades of the first stage receive the impulse of the water entering the turbine from the outside, then the water passes down and out the bottom of the turbine and the lower section of the blades are reacted on by the water leaving the turbine. Francis turbines are most widely used among water turbines and the development of the Francis turbines in the last decade has opened up a large range of new application possibilities for this type. Figure 3 shows a typical configuration of a Francis turbine.

La Vuelta and La Herradura Hydroelectric Project
La Vuelta and La Herradura Hydroelectric Project 18 MGM International, Ltda. © Copyright (July 14, 2003) All Rights Reserved
Figure 3: Francis Turbine Spiral Cased Horizontal Shaft - typical arrangement
Previous Projects in the world The technology involved is quite standard with hundreds of similar projects all over the world. It is widely known as an environmentally sound and safe technology, since at the medium scale of the proposed run-of-river subprojects only small dams, permitting a few hours water storage, are involved. A.4.4. Brief explanation of how the anthropogenic emissions of greenhouse gas (GHGs) by
sources are to be reduced by the proposed CDM project activity, including why the emission reductions would not occur in the absence of the proposed project activity, taking into account national and/or sectoral policies and circumstances:
• Emission reductions: The project activity will reduce CO2 emissions in electricity generation through the use of renewable energy sources. It is expected that the project activity will serve to displace fossil fuel-fired plants (a combination of coal and gas based power plants in the Colombian Interconnected National System) with clean energy provided by hydroelectricity. The inclusion of the project into the interconnected grid will redistribute the dispatch of all the power plants giving rise to a most efficient electricity generation of the whole system. In the absence of the CDM project activity, no other project would have been implemented indeed, so that emission reductions would not occur. From a prospective dispatch analysis (a model developed in Annex 3) it is estimated that the project has the potential to reduce 1,559,984 tonne CO2 over a period of 21 years (535,793 tonne CO2 during the first crediting period, 2005-2011, and 989,149 tonne CO2 cumulated up to the end of the second crediting period).

La Vuelta and La Herradura Hydroelectric Project
La Vuelta and La Herradura Hydroelectric Project 19 MGM International, Ltda. © Copyright (July 14, 2003) All Rights Reserved
• Brief account of national and sectoral circumstances acting as barriers to investment in hydro projects:
Since the power sector reform in Colombia in year 1994 (Law 142 on public services and Law 143 on electricity), capacity additions have been performed by both the public and the private sector. Table 1 shows that independent power producers have privileged gas-based thermal generation. Most of the thermal plants were constructed due to the incentive created by the new electricity market. The only hydro project added in this period, the 405 MW Porce II owned by EE.PP.M, began its construction in 1992 prior to the power sector reform. (EE.PP.M is public sector, but it is highly focused on financial performance to the point that it is the most profitable company in Colombia,2 even though EE.PP.M sometimes invests in financially ‘second-class’ projects, for social or environmental considerations.)
Table 1: Capacity additions, 1995-2001 (values in MW) Type of generation Private Public TOTAL %
Hydro 405 405 10Coal 165 150 315 8Natural gas 2,415 755 3,170 81TOTAL 2,580 1,310 3,890% by investor 66 34
Source: Reference Expansion Plan 2002-2011, UPME, Bogotá, Oct. 2002. Public companies only contributed to 34% of the expansion, therefore the largest portion was in charge of independent producers. Over 80% of the 1995-2001 capacity addition was natural gas and only 10% was hydro. All the latter was by the public sector. Coal power plants added up to 8% of the total, evenly divided among private and public sectors. This electricity market behavior —favoring thermal power plants over hydroelectric projects—has indeed been the experience in all countries —both industrial and developing— where the power sector was deregulated in the 1990s. Independent producers have diminished their investment rate lately. While capacity additions exceeded 700 MW in 1995 and 1996, they were less than 200 MW in 2001. Guerrilla attacks on the transmission network are partly responsible for this outcome. The long interconnection lines required for hydroelectric generation have been highly exposed to guerrilla attacks. This leads to prioritize the installation of power plants close to the largest consumption centers; again favoring thermal power plants. There are also other factors such as the important increase in natural gas prices in 1999 and some regulatory uncertainties on capacity charge values. 2 See for example the Colombian journal Semana, July 7, 2003; http://www.semana.com.

La Vuelta and La Herradura Hydroelectric Project
La Vuelta and La Herradura Hydroelectric Project 20 MGM International, Ltda. © Copyright (July 14, 2003) All Rights Reserved
Considering Colombia’s important fuel reserves and the need to guarantee electricity supply through a more balanced mix between thermal and hydroelectric generation,3 have supported the trend towards thermal power generation. (Currently, Colombian reserves are equivalent to 34 years of natural gas production and more than 150 years of coal production.) La Vuelta and La Herradura project was not the exception in the context of this complicated sectoral situation. The project has remained under discussion since 1965. In that year the first studies for the use of La Herradura river basin began, in order to consider the potential to develop hydroelectric power plants. Several decades have elapsed until this project can become a reality. The main reason for that was CDM (see Section B.4). From the analysis above it is clear that the project itself was not an attractive option to be developed by EE.PP.M unless other incentives were involved. The low profitability for those subprojects, the very risky conditions for implementing electricity projects in rural areas, and many other circumstances, were important barriers to go further on these subprojects. These subprojects were on hold until conversations with relevant CDM actors influenced on the project sponsor’s point of view —focusing again on hydro plants in spite of barriers and political conditions and based on the incentive of getting a new source of income. Those facts contributed to renewing project development, in line with the environmental and social politics EE.PP.M. The CDM potential of the subprojects was a crucial incentive for EE.PP.M to consider the opportunity of developing a project activity for registration under the CDM based on the carbon credit revenues and the contribution to the sustainable development in Colombia. A.4.5. Public funding of the project activity: No public funding, including official development assistance, is involved in financing this project activity. The only funds involved are those handled by the project sponsor EE.PP.M.
3 Moreover, global climate change now produces more abrupt variations in hydrological cycles, altering water availability and thus hydroelectric generation in a unpredictable way.

La Vuelta and La Herradura Hydroelectric Project
La Vuelta and La Herradura Hydroelectric Project 21 MGM International, Ltda. © Copyright (July 14, 2003) All Rights Reserved
B. Baseline methodology B.1 Title and reference of the methodology applied to the project activity: There is neither a reference list nor approved baseline methodologies for this project activity on the UNFCCC / CDM website. Thus, a new methodology is introduced and entitled
“Baseline methodology for displaced electricity generation in a centrally dispatched hydrothermal interconnected power system.”
B.2. Justification of the choice of the methodology and why it is applicable to the
project activity: The baseline for the proposed project activity corresponds to the scenario that would occur if the proposed project activity were not carried out and its corresponding availability to generate electricity were not included into the system dispatch. It seems trivial since expressed in this way it actually looks like the definition of what a baseline is, but it is the situation of the present case as explained below. Specifically, the baseline considers the emissions coming from dispatching power plants, without and with the proposed project activity, according to market rules (least-generation costs) established for the Colombian interconnected system, considering the foreseen demand growth and the capacity expansion to satisfy such a demand as it was officially analyzed by the Ministry of Energy and Mines.4 The reason why those emissions corresponds to the baseline is justified in the fact that in the absence of the CDM registration opportunity the project would not have been chosen to be developed by the project sponsor and no other foreseeable alternative project would have been developed in place of the proposed one to be considered as the baseline. Therefore, the baseline considers emissions that would have occurred in the absence of the project and directly attributable to its absence, i.e. the part of the system emissions that would have been replaced by the presence of the proposed project activity. It includes emissions of all the power plants serving the national system, in the base year (2005) as well as in the future, excluding and including La Vuelta and La Herradura into this system. The Colombian electricity system in which power plants operate is dominated by hydro plants and to a lesser extent by thermal plants (approx. 65.6% hydro and 34.4% thermal of installed
4 The Mining-Energy Planning Unit (UPME) of the Ministry of Energy and Mines is in charge of preparing a annual report of the foreseen and planed system capacity expansion (National Expansion Plan).

La Vuelta and La Herradura Hydroelectric Project
La Vuelta and La Herradura Hydroelectric Project 22 MGM International, Ltda. © Copyright (July 14, 2003) All Rights Reserved
capacity of centrally dispatched plants, and 75.19% hydro and 24.81% thermal —80.63% natural gas and 19.37% coal— in terms of energy generation in 2001).5 Both hydro and thermal plants have generation costs different from zero. The setting of hydro generation cost is discussed below. Power plants which are not centrally dispatched are not included either in the baseline or in the project emissions calculation, since they are not affected by and do not affect the dispatch decisions, but they are included in the simulations (“must run” power plants, which are obliged to be dispatched in the base load, they are mainly minor plants, co-generators and self-producers). In order to estimate baseline emissions in the above mentioned electricity system, the calculation is made through a standard computer model (Stochastic Dual Dynamic Programming, SDDP6), which takes into account all relevant information to simulate the system dispatch according to the rules defined by the Colombian government and managed by the Wholesale Market Manager (AMM). It was selected one of the most widely used models for the kind of electricity system it is going to be handled in this project. Summarizing, the main characteristics of the proposed project activity and the selected baseline for this case are:
• Emissions to be accounted for are those generated by all thermal plants serving the national system, considering new additions as determined in the Reference National Expansion Plan, electricity demand trends, hydrological conditions, generation costs, fuel costs, vulnerability, reliability, rationing cost, and supply parameters, etc., without including the proposed project into these plants (see Section B.4).
• The Colombian systems is an interconnected hydrothermal grid. • Power plants are dispatched according to their generation costs, the least-cost plants
enter first, while plant dispatched later to cover the demand set the marginal price of electricity.
• Hydropower plants enter the system declaring the opportunity price of their water resources (water storage is a common business strategy, which many times leads to
5 See Section B.4 and Figure 6 for the discussion on additionality issues for a system dominated by hydro generation. 6 SDDP is a model developed by PSR Inc. and can be consulted at www.psr-inc.com.br/sddp.asp. SDDP has been licensed by utilities and agencies of several countries, including Argentina, Bolivia, Brazil, Chile, Colombia (under the name MPODE, Modelo de Planeamiento Operativo Dual Estocástico), the six countries in Central America, Spain and USA. SDDP has also been selected by CIER (Regional Electrical Integration Committee) as the operational planning tool to represent all South American countries in the gas/interconnection strategic evaluation. The same kind of model is already used by the Dispatch National Center (CND) to calculate the theoretical capacity value (CRT) in order to pay the capacity able to be required, with expected demand, expansion, and system parameters provided by UPME.

La Vuelta and La Herradura Hydroelectric Project
La Vuelta and La Herradura Hydroelectric Project 23 MGM International, Ltda. © Copyright (July 14, 2003) All Rights Reserved
hydro plants to be at the dispatch margin), taking into consideration hydrological conditions. (Note that in some Latin American power systems hydro plants are always dispatched in the base load since those plants do not declare generation costs and only thermal plants compete for entering into the electricity delivery).
• Real conditions are considered in which transmission problems along the interconnected grid are included (bottle necks, forced generation, etc.).
Taking these conditions into account, the best alternative is to consider a computational model able to simulate the dispatch under the constraints and characteristics of the interconnected system. Thus, a proven model was selected to estimate baseline emissions, according to its ability to deal with the features of the Colombian system. The model is able to handle power plants centrally dispatched in hydrothermal interconnected systems with a high hydraulic component, based on least-costs of generation, with the flexibility to incorporate the set of conditions and constraints determining the actual dispatch (hydrology, electricity demand, transmission constraints, generation costs, etc.). Since the project activity belongs to a system of these characteristics, the proposed methodology allows a conventional treatment of baseline emissions, in a more precise way than considering that displaced power plants are those of lowest efficiency or taking the average of the thermal generation of the system. A comparison with other alternative methodologies is also made in order to show that the choice considered in this project adds conservativeness to the presentation (see Annex 5). B.3. Description of how the methodology is applied in the context of the project activity: La Vuelta and La Herradura hydroelectric subprojects would displace energy produced by burning fossil fuels and substitute it with energy that would be generated from hydroelectricity. As such, the generation of the interconnected national grid as a whole would result in a production of carbon dioxide emissions lower than production that would occur if the proposed project were not implemented. The methodology is based on a simulation of the centrally planned dispatch of all the power plants serving the interconnected national system, without and with the proposed project activity. It is applied to the current project activity in a straightforward manner, by taking into account all relevant parameters and variables determining the dispatch decisions, as they are taken by the manager of the wholesale electricity market. In Annex 3 the explicit description of the methodology is developed and Annex 5 presents the overall results obtained from applying the methodology, so that only the steps followed and the main assumptions are shown in this section. Step 1 Collect data needed to run the simulation model. These data are obtained from
verifiable sources (UPME, CND, EE.PP.M, and so on). Step 2 Estimate the power plant emission factors per unit of generated energy.

La Vuelta and La Herradura Hydroelectric Project
La Vuelta and La Herradura Hydroelectric Project 24 MGM International, Ltda. © Copyright (July 14, 2003) All Rights Reserved
Step 3 Load input data into the software, without including La Vuelta and La Herradura plants.
Step 4 Run the simulation model without including La Vuelta and La Herradura plants. Step 5 Load the additional information of La Vuelta and La Herradura plants into the software
platform. Step 6 Run the simulation model but now including La Vuelta and La Herradura plants. Step 7 Gather the outputs in order to estimate relevant emissions from steps 4 and 6. This step
can be considered the first step of the methodology after running the simulation model (which could be considered as a sort of black box, since the model is an already sound computer program, and only input and output are relevant).
Step 8 Calculate thermal power plant emissions for the simulation performed in step 4. Step 9 Calculate total CO2 emissions per year of the thermal power plants serving the system
from results derived in step 8. Step 10 Calculate thermal power plant emissions for the simulation performed in step 6. Sept 11 Calculate total CO2 emissions per year of the thermal power plants serving the system
from results derived in step 10. Step 12 Take the difference between emissions of step 9 and emissions of step 11. The resulting
emissions are baseline emissions, representing the emission excess that would occur if La Vuelta and La Herradura project activity were not registered under the CDM, and attributable to it.
Step 13 Calculate the total amount of thermal electricity generated year by year from results of step 4.
Step 14 Obtain the average CO2 emissions of the thermal plants serving the system, combining steps 9 and 13.
Step 15 Calculate the total amount of thermal electricity generated year by year from results of step 6.
Step 16 Obtain the average CO2 emissions of the thermal plants serving the system, combining steps 11 and 15.
Step 17 Calculate the displaced thermal energy amount as the ratio between the energy obtained in step 13 minus the energy obtained in step 15 over the energy generated by La Vuelta and La Herradura plants.
Step 18 Obtain the energy displacement factor by dividing the displaced thermal energy calculated in step 17 by the energy generated by La Vuelta and La Herradura project. Steps 13 to 18 are useful for ex-ante determination of baseline key parameters. These parameters are closely associated to baseline emissions and fixed during the monitoring of project activity. Annex 3 has a complete explanation of the methodological aspects.
Step 19 Compare results obtained in step 12 with other methodological proposals to add conservativeness to the baseline determination.
Step 20 Express the results in a clear analytical manner. The main assumptions considered in running the simulation model are described below.
La Vuelta and La Herradura Hydroelectric Project
La Vuelta and La Herradura Hydroelectric Project 25 MGM International, Ltda. © Copyright (July 14, 2003) All Rights Reserved
1. Data base used The National Dispatch Center (CND) that coordinates the Wholesale Electricity Market (MEM) and operates the National Interconnected System (SIN) of Colombia, performs periodically short- and mid-term simulations of the SIN, using the Stochastic Dual Dynamic Programming (SDDP model), also called MPODE in its Spanish translation. MEM agents stakeholders must supply data to keep the database used by CND updated, for the simulations of the SIN through the SDDP model. Likewise, CND publishes the updated database and simulations results. For the calculation of La Vuelta and La Herradura emissions reduction, the MPODE database, supplied by CND, was used, updated until March 2003, complemented with the long-term demand, the expansion plan and other minor data (see below). 2. Demand The official demand projections in Colombia are performed by the Energy and Mining Planning Unit (UPME), affiliated to the Ministry of Energy and Mining. It periodically renders three demand growth scenarios: high, medium and low, corresponding to positive, moderate and pessimist perceptions of the electricity sector growth in the country. According to statistical studies in Colombia, the electric energy demand growth has a high correlation with the Gross Domestic Product (GDP). The official projections of the GDP in Colombia are carried out by the National Planning Department (DNP), and they are used by UPME as base for its projections. For energy simulations the mean demand projection performed by UPME in the Reference Expansion Plan for Generation and Transmission 2002-2011 (October 2002) was chosen as the most probable scenario. Since UPME energy demand projections were not done until 2011, for the following years a growth of 3.3% was considered, which is the average of 2011 growths for the three scenarios: low, medium and high. For the year 2002, the real demand was used (44,811 GWh) and the other years were updated considering the same growth percentages. Table 2 shows these demand projections.

La Vuelta and La Herradura Hydroelectric Project
La Vuelta and La Herradura Hydroelectric Project 26 MGM International, Ltda. © Copyright (July 14, 2003) All Rights Reserved
Table 2: Energy Demand Projections year GWh % 2002 44,811 1.9% 2003 45,662 3.0% 2004 47,032 3.7% 2005 48,772 3.5% 2006 50,480 3.4% 2007 52,196 3.5% 2008 54,023 3.6% 2009 55,967 3.7% 2010 58,038 3.7% 2011 60,186 3.6% 2012 62,352 3.3% 2013 64,410 3.3% 2014 66,536 3.3% 2015 68,731 3.3% 2016 70,999 3.3% 2017 73,342 3.3% 2018 75,763 3.3% 2019 78,263 3.3% 2020 80,845
3. Expansion Plan The official expansion plans of Colombia are performed by UPME. As from reforms introduced to the Colombian energy sector by Law 142 (public services, 1994) and Law 143 (electricity, 1994), the official expansion plans changed from compulsory to indicative plans. The dynamics of the variables associated to electric energy generation makes necessary a continuous follow-up in order to forecast its future behavior and its impact over the system in general. Therefore, UPME must carry out a short- and long-term generation analysis. The analysis must outline future generation needs, following as criteria, expansion planning and the operation of integrated transmission and generation available resources, with the objective to minimize operation costs of the system and trying to meet energy demand according to quality, reliability and safety levels needed by users.

La Vuelta and La Herradura Hydroelectric Project
La Vuelta and La Herradura Hydroelectric Project 27 MGM International, Ltda. © Copyright (July 14, 2003) All Rights Reserved
Alternatives (short-term) and strategies (long-term) have considered, among others, the following variables:
Fuel costs Energy demand and electricity capacity Occurrence of El Niño type phenomenon Recording of generation projects Reliability criteria established for planning Transmission grid Unavailability of generation units and of transmission lines Energy reserves Hydro contribution
The short-term analysis was performed for the period 2002-2006. UPME considered five alternatives representing, in the best possible way, the occurrence of different outstanding events: different scenarios of electric energy demand growth, international interconnections with Ecuador and Venezuela, unavailability of the transmission system, hydrological events, etc. CP3 was chosen from these alternatives. This alternative states that the SIN deals with the medium-demand scenario and the National Transmission System operates interconnected with Ecuador and Venezuela. The program for the recovery of the transmission network (June 2002) was considered. It comprises transmission lines recovery until December 2003. Additionally, to be able to meet demand requirements, it becomes necessary that the system includes a 150 MW combined cycle for January 2006. The plan also considers the two hydro projects, La Vuelta and La Herradura, to enter into the system. Since 1998 UPME has performed expansion plans according to CREG Resolution 051/1998. In the revisions of the first Expansion Plan several projects were proposed. From them the Primavera-Guatiguará-Tasajero & Sabanalarga-Cartagena 230 kV line has entered into operation. At present there are several projects under consideration for the expansion to the transmission system. The Expansion Plan of the years 2000 and 2001 are under revision, in which the execution of the 500 kV Bolivar-Copey-Ocaña-Primavera-Bacatá line, with an approximate distance of 923 km, was recommended. The new proposed expansions (220 kV Sabana-Fundación third circuit, recommended by CDN, and 220 kV Bolivar-Copey pre-energization line) and both, electricity imports and exports, are considered in the simulations for the least cost expansion plan. According to UPME, the interconnections with Ecuador and Venezuela have had so far a low impact on the Colombian electricity supply industry.

La Vuelta and La Herradura Hydroelectric Project
La Vuelta and La Herradura Hydroelectric Project 28 MGM International, Ltda. © Copyright (July 14, 2003) All Rights Reserved
As explained in Section B.4, EE.PP.M has already decided the construction of La Vuelta and La Herradura hydro plants, starting the civil works. UPME registered these projects a long time ago. For the new reference expansion plan there was a change of sponsors for La Vuelta and La Herradura, formerly registered by EADE and now by EE.PP.M. The fact that these projects were registered did not mean that the projects were going to be executed, as already was the case until last year, since the projects were on standby for a very long time. However, the early decision taken by EE.PP.M was also submitted to UPME. Thus UPME has included La Vuelta and La Herradura as future projects to be included in scenario CP3 since early 2004.7 It would appear that the proposed project might be considered to be a part of the baseline, since the expansion plan already accounts for the project situation. But we assert that in order to prove additionality one must compare the situation at the time the decision was taken, that is when EE.PP.M motivated by the CDM decided to go ahead with a pioneer sustainable project assuming risks beyond the normal CDM uncertainties. This means that in the baseline scenario the expansion plan was considered without including La Vuelta and La Herradura subprojects, while they are included when simulating the electricity dispatch in the “with project” scenario. Two additional comments are relevant. We have decided to use the latest expansion plan, instead of using the one developed at the time EE.PP.M decided to include the project into its future investment portfolio, in order to gain in accuracy of the whole description, since conditions actually change from one year to the next. On the other hand, we have used the same expansion plan for the baseline and for the project since it gives consistency to the analysis. The fact that in the expansion plan La Vuelta and La Herradura are included while in the baseline no, does not affect the rest of the variables determining the prospective demand scenarios, hydrology, transmission, fuel prices, energy reserves, etc. UPME submitted five long-term strategies covering the period 2007-2011. Each one with a short-term alternative as starting point. The composition of the different long-term strategies is the result of considering among other variables: installation costs, variable and fixed costs, the
7 These projects are expected to enter into the dispatch through the national grid in June 2004. Accordingly it is reflected in the data handled in the expansion plan developed by UPME. Nevertheless, in the UPME report these projects are supposed to be ready before that time, specifically December 2003 for La Vuelta and April 2004 for La Herradura. Moreover, UPME has considered that the projects are under a technical pre-feasibility phase with the inscription of the projects under the Ministry of Environment. The projects are actually beyond this stage since some civil works have started and feasibility and environmental impact studies were also performed (compare this information with Annex D of the “Plan de Expansión Referencia, Generación Transmisión 2002-2011”, UPME, Bogotá D.C., October 2002) and the environmental license was conceded.

La Vuelta and La Herradura Hydroelectric Project
La Vuelta and La Herradura Hydroelectric Project 29 MGM International, Ltda. © Copyright (July 14, 2003) All Rights Reserved
medium-scenario of coal and natural gas prices, as well as natural gas, coal and hydro potential projects registered in the UPME future projects record. Out of these strategies LP3 was picked up. This strategy considers in the first years CP3 alternative, it estimates a mean cost of natural gas at well-head, a free entry of natural gas, hydro and coal fired projects and a medium-scenario for demand growth. In order to meet the energy needs under these conditions, the result of the models shows that the country requires the installation of 960 MW, out of which 300 MW correspond to natural gas units and 660 MW to hydro projects.
The plants taken into account for the expansion of the generation system in the simulations for La Vuelta and La Herradura GHG emissions reduction calculation and their entry date can be seen in Table 3.
Table 3: Reference Expansion Plan Date Power Plant Capacity (MW)
Hydro Thermal 15/06/2004 La Vuelta 11.70 01/09/2004 La Herradura 19.80 01/01/2006 CC – Costa 1 150.00 01/01/2009 CC – Costa 2 300.00 01/01/2010 Hydro 1 660.00
4. Hydrology Colombian hydrology has random weather conditions mainly due to Colombia’s tropical location. This marked contingency, qualified by researchers as a chaotic type event, suggests a critical analysis of the energy projections. Due to the own characteristics of the generation system and to the influence of decisive variables such as hydrology may have over its behavior, and specially, events such as the “El Niño” Pacific phenomenon that may affect the system from the energy point of view, hydrology must be regarded as a variable in system planning. The Pacific phenomenon has been monitored by different international and national organizations and the variables that affect it can be identified. Although the phenomenon can be predicted, there are barriers which make it difficult to define its beginning, duration and intensity beforehand. For the relevance of the phenomenon, it must be considered in the different generation analyses, and, through the ARP model, incorporated in the simulation model. A set of 100 flow synthetic

La Vuelta and La Herradura Hydroelectric Project
La Vuelta and La Herradura Hydroelectric Project 30 MGM International, Ltda. © Copyright (July 14, 2003) All Rights Reserved
series was generated from historical data in the different seasons. The same 100 synthetic series were used for the two scenarios, with and without La Vuelta and La Herradura project. 5. Ideal Dispatch and Real Dispatch The “ideal” dispatch is the simulation of the electric system without considering the transmission grid. The ideal dispatch would be the one obtained by merit if there were not transmission restrictions. However the real operation (the generation) does take into consideration restrictions in transportation. By simulating the national interconnected system and considering the national transmission grid, the approximation to the real dispatch can be obtained. When simulations without transmission grid are considered, in theory, all the hydro energy produced by La Vuelta and La Herradura displaces thermal energy, but when simulations are carried out with the grid, energy transmission restrictions in the northern region of the country (the coast) are considered, and most of the thermal generation is concentrated there, so these thermal plants have to generate due to transmission restrictions, and La Vuelta and La Herradura hydroelectric plants, placed in the center of the country, are not able to displace all the energy that in theory (without grid) they could displace, thus increasing thermal generation and consequently emissions. As from above, simulations obtained in SDDP are assumed, considering the transmission grid as base to calculate GHG emissions reduction produced by the generation of La Vuelta and La Herradura. However, simulations without considering the transmission grid were also performed in order to see which would be the theoretical emissions reductions produced by La Vuelta and La Herradura, if restrictions would not exist in energy transmission in the northern region of the country or if the two hydro plants were placed in that region. 6. Emission Factors By knowing fuel types and considering the consumption patterns for each plant used in the SDDP simulation model, and taking fuel emission factors (on a plant-by-plant basis for natural gas and from IPCC default values8 for coal), emission factors per GWh produced were estimated for the different plants of the system (current and future). They are listed in Table 4.9 8 Revised 1996 IPCC Guidelines for National Greenhouse Gas Inventories, Greenhouse Gas Inventory Reference Manual, Volume 3 (IPCC 1996). 9 Fuel consumption is not declared by generators (is reserved as a part of their business strategy). Generators inform to CND, at most, specific consumptions (consumption by energy output unit), which are used to calculate the theoretical capacity value (CRT) for the payment of the available capacity. These values are shown in the attached documentation to this PDD (MGM_BSL_LvyLH_EM.doc). LHV of

La Vuelta and La Herradura Hydroelectric Project
La Vuelta and La Herradura Hydroelectric Project 31 MGM International, Ltda. © Copyright (July 14, 2003) All Rights Reserved
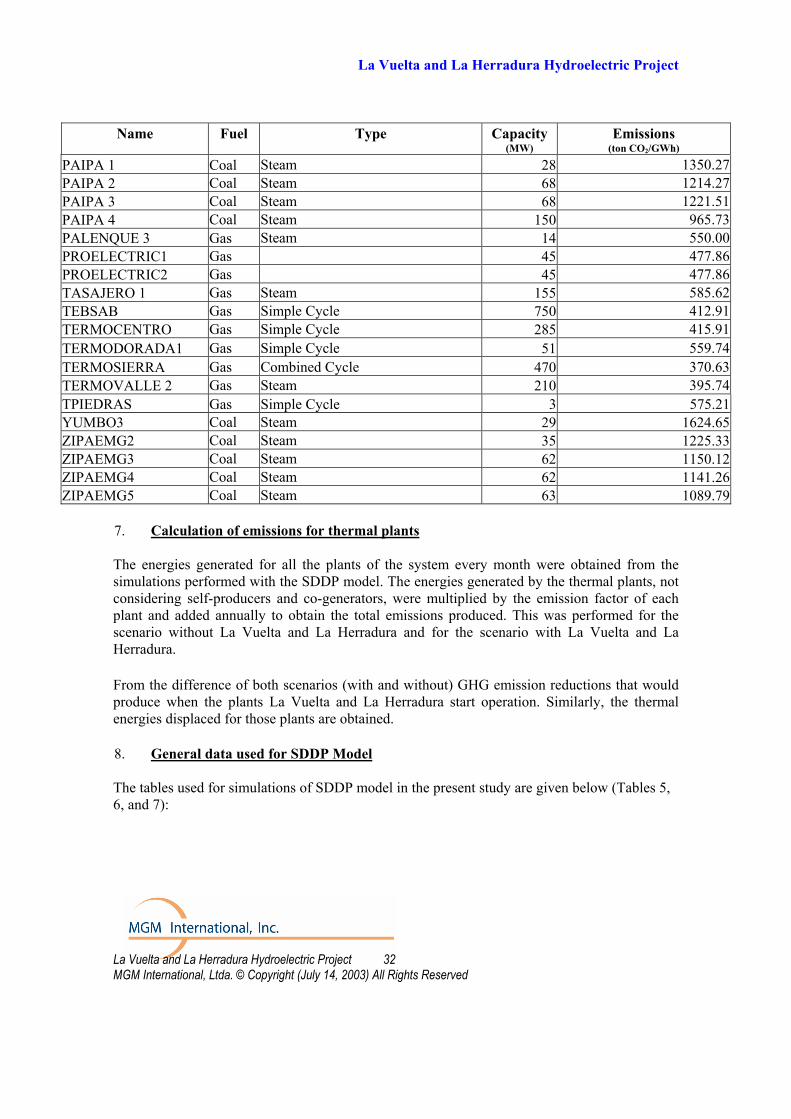
Table 4: Plant by plant emission factors
Name Fuel Type Capacity (MW)
Emissions (ton CO2/GWh)
BARRANCA 1 Gas Steam 12 608.08BARRANCA 2 Gas Steam 12 619.55BARRANCA 3 Gas Steam 63 690.76BARRANCA 4 Gas Simple Cycle 30 746.62BARRANCA 5 Gas Steam 20 740.50BARRANQUILL3 Gas Steam 64 574.33BARRANQUILL4 Gas Steam 65 579.80CANDELARIA1 Gas Simple Cycle 150 556.63CANDELARIA2 Gas Simple Cycle 150 575.21CARTAGENA 1 Gas Steam 60 651.77CARTAGENA 2 Gas Steam 50 772.55CARTAGENA 3 Gas Simple Cycle 67 674.06CC - COSTA1 Gas 150 370.63CC - COSTA2 Gas 300 370.63EMCALI Gas Combined Cycle 233 403.21FLORES 1 Gas Combined Cycle 150 422.20FLORES 2 Gas Combined Cycle 99 616.96FLORES 3 Gas Combined Cycle 550 370.63GUAJIRA 1 Gas Steam 151 572.50GUAJIRA 2 Gas Steam 151 564.45MERILECTRICA Gas Simple Cycle 154 581.50
coal plants are measured by generators to control the contractual agreements they have with fuel distributors, since these values are changing along time, depending on which kind of coal is being used (several mines supply coal to the system). Average values have been provided. Natural gas-based power plants have a similar problem since natural gas physical properties and composition depend on which oil well is producing. Thus, generators have provided average natural gas emission factors.
La Vuelta and La Herradura Hydroelectric Project
La Vuelta and La Herradura Hydroelectric Project 32 MGM International, Ltda. © Copyright (July 14, 2003) All Rights Reserved
Name Fuel Type Capacity
(MW) Emissions
(ton CO2/GWh) PAIPA 1 Coal Steam 28 1350.27PAIPA 2 Coal Steam 68 1214.27PAIPA 3 Coal Steam 68 1221.51PAIPA 4 Coal Steam 150 965.73PALENQUE 3 Gas Steam 14 550.00PROELECTRIC1 Gas 45 477.86PROELECTRIC2 Gas 45 477.86TASAJERO 1 Gas Steam 155 585.62TEBSAB Gas Simple Cycle 750 412.91TERMOCENTRO Gas Simple Cycle 285 415.91TERMODORADA1 Gas Simple Cycle 51 559.74TERMOSIERRA Gas Combined Cycle 470 370.63TERMOVALLE 2 Gas Steam 210 395.74TPIEDRAS Gas Simple Cycle 3 575.21YUMBO3 Coal Steam 29 1624.65ZIPAEMG2 Coal Steam 35 1225.33ZIPAEMG3 Coal Steam 62 1150.12ZIPAEMG4 Coal Steam 62 1141.26ZIPAEMG5 Coal Steam 63 1089.79
7. Calculation of emissions for thermal plants The energies generated for all the plants of the system every month were obtained from the simulations performed with the SDDP model. The energies generated by the thermal plants, not considering self-producers and co-generators, were multiplied by the emission factor of each plant and added annually to obtain the total emissions produced. This was performed for the scenario without La Vuelta and La Herradura and for the scenario with La Vuelta and La Herradura. From the difference of both scenarios (with and without) GHG emission reductions that would produce when the plants La Vuelta and La Herradura start operation. Similarly, the thermal energies displaced for those plants are obtained. 8. General data used for SDDP Model The tables used for simulations of SDDP model in the present study are given below (Tables 5, 6, and 7):

La Vuelta and La Herradura Hydroelectric Project
La Vuelta and La Herradura Hydroelectric Project 33 MGM International, Ltda. © Copyright (July 14, 2003) All Rights Reserved
Table 5 : Simulation data Type of study Isolated Stage size Months Flows 100 Stochastic series Maintenance program No Initial date March 2003 Duration of the study 204 months Initial conditions for hydro March 2003 Number of demand blocks 5 Number of additional years 1 Maximum number of iterations 100 Number of standard deviations 1 Discount rate 12%
Table 6 : Rationing costs
Segment (%) Cost ($/MWh) 1.5 426.01 98.5 772.34
Table 7: Demand blocks duration
Block Duration (%) 1 3.36
2, 3, 4, and 5 24.16 B.4. Description of how the anthropogenic emissions of GHG by sources are reduced
below those that would have occurred in the absence of the registered CDM project activity (i.e. explanation of how and why this project is additional and therefore not the baseline scenario):
EE.PP.M is a leading company in Colombia which has adopted an internal environmental strategy to deal with its main business activities and new investments. It is also one of the pioneer enterprises in considering CDM as a part of its decision-making process. Since people working for the World Bank –looking for projects to be presented to the Prototype Carbon Fund (PCF)– contacted EE.PP.M and suggested the possibility of developing CDM project activities,10 EE.PP.M has paid a great attention to the novel Clean Development
10 On that occasion EE.PP.M started working with two projects, the Jepirachi Carbon Offset Project (see the main text) and the previously low-priority –and almost already disregarded– subprojects La Vuelta and La Herradura.

La Vuelta and La Herradura Hydroelectric Project
La Vuelta and La Herradura Hydroelectric Project 34 MGM International, Ltda. © Copyright (July 14, 2003) All Rights Reserved
Mechanism.11 They were also involved in contacting experts in order to closely follow CDM consolidation and to be kept apprised of the status of current negotiations in this issue. Their first successful experience was the presentation of the Jepirachi Carbon Offset Project12 (19.5 MW Wind Power Plant in Alta Guajira, Colombia, 2002) to the PCF (the Emission Reduction Purchase Agreement was signed in December 2002). Aware of the potentiality the CDM offered, EE.PP.M submitted a letter to the Colombian Ministry of Environment, in September 2001, expressing the intention of exploring the possibility to develop a joint GHG mitigation project activity with two run-of-river hydro plants in La Herradura river basin. After that EE.PP.M reached a collaboration agreement with MGM International13 to identify and develop CDM project activities in a wider framework. This gave new goals to EE.PP.M to strongly plunge into the CDM arena.14 The proposed project activity is a consequence of those facts and circumstantial meetings, which contributed to the EE.PP.M decision to reconsider the project among their possibilities, also taking into account that a contact with an interested and involved potential buyer (Electric Power Development Corporation, of Japan) was already established thanks to the above mentioned agreement.
11 Take into account that by that time CER prices scenarios were highly optimistic, around US$ 20 per tonne of CO2. 12 Jepirachi Carbon Offset Project (19.5 MW Wind Power Plant in Alta Guajira, Colombia), Baseline Assessment, The Prototype Carbon Fund, May 2002. The information can be found in www.prototypecarbonfund.org. 13 MGM International, Inc. is one of the most active firms devoted to the development of CDM projects, with a strong presence in Latin America and the Caribbean. Its President, born in Bogotá, Colombia, has been distinguished as one of the “100 Global Leaders of Tomorrow” by the World Economic Forum in 2002, for his involvement in climate change business. This is highly valued by EE.PP.M, a company based in Colombia. 14 In particular, EE.PP.M has been dispatched to MGM Buenos Aires office a person from the Planning and Energy Sub-Manager Department in order to support work on the PDD and also to further knowledge in this new and evolving concept. The company has also devoted a person of this Department to work in the development of methodologies for the Colombian and project baseline determination. Therefore, the CDM portion of the project is highly regarded as a main part of La Vuelta and La Herradura hydroelectric project developments.

La Vuelta and La Herradura Hydroelectric Project
La Vuelta and La Herradura Hydroelectric Project 35 MGM International, Ltda. © Copyright (July 14, 2003) All Rights Reserved
EE.PP.M has considered that CDM brings into reality the participation of several high-level companies in an incipient market. In that sense they know that it is better to be ready from the very beginning, following international negotiations and instances (with milestones marked by UNFCCC decisions, AIJ pilot phase, creation of international funds, some announced country advanced commitments, etc.), taking advantage of the existence of interested buyers, positioning in this market, reaching anticipated optional contracts with potential buyers, and so on. Even if CDM was not created to serve as a strategic tool for positioning business companies in developing countries, it is realistic to keep in mind this ‘show window CDM’ situation when trying to give a reason of why the emission reductions would not have occurred in the absence of the proposed project activity under the CDM scheme. EE.PP.M has already demonstrated its high concern with environment and climate change. What is better? To say that the project is developed only for CER incomes? CDM was created to contribute to achieving GHG emission reductions beyond those that would have occurred anyway, to help developing countries in their sustainable development and to facilitate Annex I countries to comply with their commitments under Article 3 of the Kyoto Protocol. To demonstrate additionality it is necessary to show overwhelming evidence that in the absence of the project activity emission reductions would have not occurred, without judging the ‘ethical quality’ of the arguments if they are true. Due to many of the reasons mentioned above and the fact that the proposed project itself would not have been one of the highest priority projects selected by EE.PP.M into its project portfolio, the baseline would have been a scenario where the proposed project activity would not have been carried out. Thus the project is additional since emissions are going to be reduced below those that would have occurred in the absence of the proposed project activity to be registered under CDM, in agreement with the Marrakech Accords (Decision 17/CP.7, para. 43). CDM contribution to overcome financial barriers is too low in most of cases (around half a % point in the IRR for the current project proposal). What is needed to be justified is that CDM has been determinant in the decision-making process carried out by the company in charge of implementing the project. And this has been the case in the proposed project activity. This project was conceived many years ago, but it was just after CDM acquired a real body when EE.PP.M reconsidered the project giving it a high priority among its investment opportunities. In the absence of CDM registration, EE.PP.M. would have not made any other project or they would have waited and looked for another CDM project in the future. However, not any of these projects was and remains being today a feasible project to be implemented by EE.PP.M, due to the same kind of barriers La Vuelta and La Herradura met at that time, and which were able to be overcame thanks to the CDM (a possibility that EE.PP.M has also into consideration for other almost unviable projects in the future), making possible to catch a particular project on times of awaiting for better economic and social conditions.

La Vuelta and La Herradura Hydroelectric Project
La Vuelta and La Herradura Hydroelectric Project 36 MGM International, Ltda. © Copyright (July 14, 2003) All Rights Reserved
It is worth recognizing that, when evaluating the implementation of La Vuelta and La Herradura hydroelectric project, CDM is envisaged not only by its revenues and the added value supplemented by carbon credits but also by other monetarily non quantifiable qualities, such as positioning of EE.PP.M in an emergent market through the early participation in a learning-by-doing process, gaining public image and recognition through national and international certifications along the assessment process (the whole project cycle), contributing to sustainability and improving social conditions in a scantly developed rural region, etc., among other non-material aspects. Therefore, they started the development of the PDD and related documents with active involvement and close collaboration with MGM, and not only hiring consultants to develop the studies, which is the usual case in these type of projects. Sometimes investment comparisons are made in order to justify additionality. Furthermore, IRR is far from a correct indicator of comparing investments whose capital amounts are very different. NPV is certainly a better indicator. However, CDM does not support the use of an indicator such as the additional present value needed to make the project economically more attractive than other potential project activities. The indicators are not comparable. Figuratively, if one is thirsty one buys a drink although a potato may be cheaper. The additionality of the project can only be determined against the investor’s other investment choices, if there is any under consideration at the same time; but these other choices, which were in place by the time EE.PP.M decided to go further with the project, are not comparable to the project itself. Decisions are taken not one from the other in the same scenario. The Board of Directors sees the opportunity and evaluates it on its own merits. It does not necessarily mean that if this option were not selected then they would select another one. Most probably they will be waiting for another attractive opportunity to come along. In the baseline scenario other options under consideration by EE.PP.M were included as part of the National Reference Expansion Plan.
Some renewable energy projects, and specifically hydroelectric projects involving civil works, often take a lot of time to be implemented. If anticipated investment decisions and constructions go against project additionality, it seems very difficult that a project into this category can be certified before the first commitment period. In the proposed project activity, CDM has actually played a key role in determining the project implementation decision, since CDM served as a mechanism to raise the value of the environmental benefits of the project, and helped to tip the scales in favor of the project, which does not appear, at first sight, to be one of the most attractive option. The construction phase of the proposed project has already begun. However, the decision was taken including CDM as the relevant contribution. Some interpretations of para. 43 of Decision 17/CP.7 consider that if the project construction was already initiated by the time of presenting the project for validation, then the scenario that would have occurred would be one in which the project is implemented anyway. This argument must not be considered as strictly true, since para. 43 must be referred to the time when decisions were taken and not to the present, after

La Vuelta and La Herradura Hydroelectric Project
La Vuelta and La Herradura Hydroelectric Project 37 MGM International, Ltda. © Copyright (July 14, 2003) All Rights Reserved
much time has elapsed and CDM remained undefined.15 It is the spirit of para. 13 of Decision 17/CP.7, recognizing already initiated project activities. But the proposed project not even enter into retroactive projects category, since implementation of project activities will start by the end of 2004. Only the decision to go ahead and some civil works have began, but no credits are expected in this period. When companies do business they do so in an investment environment where they have to make business decisions today based on expected returns in the future. They may hedge their bets by diversifying their investments and take other steps to minimize the consequence of failed projects. Not all business ventures are successful but undoubtedly were expected to be so, when the projects were originally conceived, and taking into account prevailing views and investor’s perceptions of the future. The farmer sows a new genetically modified grain trusting in the weather report that forecasts a wet year, but nobody gave him the security of the occurrence of rainfalls. If activities which were initiated early are deemed to fall into non-additional projects, then CDM looks like a “bait and switch”: Come now to learn by doing while waiting for CDM consolidation and then say good bye: your project is not additional, because you started too soon. Pioneers take a risk which now seems to be punished, but if they did not exist it would be impossible to pave the way for CDM to be on the road and thus for others to follow. A minimal commitment to continuity in time should not go against additionality but, on the contrary, it is a necessary requirement to guarantee sustainability for clean development projects, and this is indeed one of the purposes of CDM for host countries. Many countries have suffered major devaluations, greatly reducing returns for foreign investors, but the latter continue working even though the rules of the game are very different from when they originally undertook business there. As regards the baseline it must represent the situation that would occur if the project were not implemented, and this is the scenario in which the whole national system, including the expected additions in the National Reference Expansion Plan,16 will manage to supply electricity in order to satisfy the demand (almost the part of the demand that could have been supplied by La Vuelta and La Herradura17), which is made through the use of less efficient power plants than those that would be dispatched if power generated by La Vuelta and La Herradura were available in the interconnected system. The project is relatively small and in this sense it is not necessarily true that another specific project would have been developed to cover 15 On the contrary, the delay in CDM consolidation would act as a strong disincentive to company involvement in CDM project activities. 16 Plan de Expansión de Referencia, Generación y Transmisión 2002-2011, Unidad de Planeación Minero Energética (UPME), Ministerio de Minas y Energía, República de Colombia, 2002. 17 La Vuelta and La Herradura do not substitute the same amount of energy as the one generated by these subprojects, since their presence reassigns the entry of all power plants into the dispatch, taking also into account the possibility of water storage by hydroelectric reservoirs and the corresponding value the water has, which not necessarily implies that all the electricity generated by La Vuelta and La Herradura would have been saved if the subprojects were not implemented.
La Vuelta and La Herradura Hydroelectric Project
La Vuelta and La Herradura Hydroelectric Project 38 MGM International, Ltda. © Copyright (July 14, 2003) All Rights Reserved
the part of the generation provided by La Vuelta and La Herradura. If one could assure that, then such an alternative project could have been considered as the baseline, but it is too difficult to demonstrate this fact, moreover when there are enough reasons to argue that no any particular project would have been implemented beyond the ones analyzed in the National Reference Expansion Plan. Moreover, if new power plants were added instead of La Vuelta and La Herradura by other companies, it would be mainly thermal, thus contributing to GHG emissions in a greater extent than that of the displaced power plants (since the last ones are a mixture of fossil-fuel based and hydro plants). Furthermore, the dispatch with these new plants would not differ significantly with respect to the one selected as the baseline. The baseline chosen is more conservative that this hypothetical alternative option, since in the dispatch analysis under consideration (see Annex 3) La Vuelta and La Herradura are going to replace a combination of power plants, which also include other hydro plants and not only fossil-fuel based plants. The conservative proposal18 selected here takes into account the inclusion of new plants, but only those discussed in the official National Reference Expansion Plan, since as it was mentioned before the proposed subprojects are not strictly built to cover the expected increase in electricity demand but only they were conceived to add efficiency to the system as a whole and to contribute to the sustainable development of the Antioquia department. The other important point to be handled in the baseline analysis is that emission reductions arisen from the project implementation are real and measurable, as established in article 12 of the Kyoto Protocol. And this is the case for the proposed project activity, since emission reductions are avoided emissions of the whole national system due to the project contribution to the electricity dispatch, through clean energy without burning fossil fuels.
18 See also the comparison with other alternative methodologies (attached spreadsheets MGM_BSL_LVyLH_EM.xls).

La Vuelta and La Herradura Hydroelectric Project
La Vuelta and La Herradura Hydroelectric Project 39 MGM International, Ltda. © Copyright (July 14, 2003) All Rights Reserved
B.5. Description of how the definition of the project boundary related to the baseline
methodology is applied to the project activity: The project boundary for the purpose of estimating baseline and project anthropogenic emissions is defined in terms of the GHG sources under the control of the project participants, as the Marrakech Accords establish (Decision 17/CP.7, para. 52). Project boundary plays an important role since emissions must be accounted consistently with the selection of the project boundary. Two possibilities are in place, according to the interpretation given to the phrase “under the control of the project participants.” Option 1: Under the first one, the project boundary can be chosen taking into account the system impacted by the operation of the proposed project and the operation and interaction of the project with this system. In this sense, the project boundary would be the whole interconnected national system. Baseline emissions would correspond to the emissions of all the thermal plants serving the system without including La Vuelta and La Herradura into it and project emissions would correspond to all power plant emissions but now including the project itself into the power plant dispatch. The national interconnected system in Colombia is an integrated network in which all regional grids are connected. La Vuelta and La Herradura will be connected to the national interconnected system of the Colombian electricity supply industry. They are run-of-river plants which will be dispatched in the base load. Their operation will therefore directly affect the power plants connected to the grid by displacing mainly those that are typically dispatched at the peak in the load duration curve and those hydro plants that storage water in wet seasons to sell at higher prices in dry seasons. The entire electricity supply industry as well as energy conservation impacts, off-grid generation, and electricity imports/exports are considered within the system (not project) boundaries for estimation of the baseline. For the baseline assessment both the electricity supply and the transmission systems were considered. As of October 2002, according to the UPME Reference Expansion Plan, the National Transmission System (STN) included 1,449 km of 500 kV lines and 10,823 km of 230 kV lines. The Colombian electricity industry includes international interconnections with Ecuador and Venezuela. The present interconnections are just radial connections to supply relatively isolated areas in the other countries or are weak interconnections, in the sense that they do not allow for an integrated dispatch and frequency control, as is usually the case in real interconnections. The advantage of this proposal is that baseline and project emissions are all direct emissions (on-site and off-site). Direct emissions stand for emissions which are measurable and attributable to the CDM project activity that can either be controlled or influenced by the project

La Vuelta and La Herradura Hydroelectric Project
La Vuelta and La Herradura Hydroelectric Project 40 MGM International, Ltda. © Copyright (July 14, 2003) All Rights Reserved
participants. Roughly following Netherlands CERUPT guidelines,19 direct on-site includes emissions from fuel combustion and process emissions on the site of the project (La Vuelta and La Herradura power plant locations in this case). Direct off-site involves emissions upstream and downstream of the project, which are directly influenced by the activity of the project (one step upstream: e.g. emissions connected with the transport of fuels used for the project; one step downstream: e.g. emissions connected with electricity produced by the project that replaces off-site electricity generation). However, it is necessary to justify the meaning of “under the control of the project participants.”
The idea behind is that the project implementation contributes to the improvement of the efficiency, in terms of emission reductions, of the whole interconnected system since emission reductions occur after redistributing the power plants dispatch. Since market rules are almost fixed (least-generation costs) and all operators are supposed to follow these rules, then it can be said that project participants are almost under the control of the system in the sense that their decision on the implementation of the project modify the system as a whole. Strictly this control is under the administrator of the electricity market, the CND, since it decides what plants enter into the dispatch, when and how. This is one of the disadvantages of this proposal, since CDN is not one of the project participants. Another disadvantage is that any generator can alter its way of declaring generation costs due to a redefinition of its financial decisions or due to reasons of force majeure, and this clearly is not under the control of project participants. Moreover, international interconnections with Ecuador and Venezuela would extend the project boundary beyond the national interconnected system and this is clearly out of the control of project participants. EE.PP.M is far from being under the control of such widely spread system. Option 2: On the other hand, the second possibility is to consider that the project boundary only accounts for the physical location of La Vuelta and La Herradura power plants, which is undoubtedly under the strict control of the project participants. They only have the control of their own project, so that what happen with the SIN is not under their domain. In this case what the baseline must establish are the emissions that would have occurred without the project implementation but only associated to it, not to the whole system. Thus, if the project were not implemented what would be about to be emitted is only the proportional part to the one that would be covered by the project.
19 “Operational Guidelines for Baseline Studies, Validation, Monitoring and Verification of Clean Development Mechanism Project Activities,” Volume 2a: Baseline Studies, Monitoring and Reporting, A guide for project developers, Version 1.0, Ministry of Housing, Spatial Planning and the Environment of the Netherlands, October 2001. It is described in extent since there are no further clarifications made by the Executive Board on this point and the cited guidelines are not officially adopted by this board.

La Vuelta and La Herradura Hydroelectric Project
La Vuelta and La Herradura Hydroelectric Project 41 MGM International, Ltda. © Copyright (July 14, 2003) All Rights Reserved
This is the option chosen for this PDD, since it is the one friendliest with the concept “under the control of the project participants.” In Section E the two possibilities are considered and it is shown how the emission reductions are the same independently of the choice selected. The two alternatives are reasonably appropriate due to the fact that emission reductions are definitively determined in agreement with the project boundary selected. Option 2 has also a significant advantage in formulating the monitoring plan and allows to more explicitly manifest the difference between baseline determination and key project parameters under the control of the project participants. The rest of the project boundary description in this section is made for option 2. Figure 4 shows the project boundary for options 1 and 2. Boxes with CO2 emissions represent emissions from fossil fuel burning. Strictly, there are also extremely small quantities of methane and nitrous oxide from fossil fuels burning (see Section E). GHG emission sources of the project: These emissions can be divided into three categories: (a) direct on-site, (b) direct off-site, and (c) leakage (indirect emissions, both on-site and off-site). These emissions are described under option 2.
a. Direct on-site and off-site emissions: The project does not generate emissions during generation of electricity, except for a potential small amount of methane from the flooding of the near areas. There are anthropogenic GHG emissions in the upstream lifecycle stages of the electricity generation process. These emissions can be considered as direct off-site emissions, but they are actually under the control of project participants. The stages with the most important sources of GHG emissions are those of materials processing, component manufacture and transportation of materials and fuel burning during the use of construction machinery.

La Vuelta and La Herradura Hydroelectric Project
La Vuelta and La Herradura HydroeMGM International, Ltda. © Copyrig
Option 1:
Option 2:
Interconnected grid and
distribution system
Thermal power plants Hydroelectric plants
La Vuelta La Herradura CH4 CH4
Transport Transport Construction Construction
CO2 CO2 CO2 CO2
CO2 CH4
End users
La Herradura
La Vuelta CH4
CH4
Transport
Transport Construction
Construction
CO2 CO2
CO2 CO2
Interconnected National Electric
Power System
Generation and Transmission
End users
Figure 4: Project boundary options (red line represents the project boundary)
CO2
lectric Project 42 ht (July 14, 2003) All Rights Reserved

La Vuelta and La Herradura Hydroelectric Project
La Vuelta and La Herradura Hydroelectric Project 43 MGM International, Ltda. © Copyright (July 14, 2003) All Rights Reserved
In Figure 4 transport boxes stand for emissions of the transportation of materials and people by trucks and medium-size vehicles and fuel consumption of machinery used during the construction phase of the plants. Emissions are estimated from standard default values as provided by the Revised 1996 IPCC Guidelines for National Greenhouse Gas Inventories. Construction means emissions arisen in the cement manufacturing industry that provides the concrete for the construction of the plants. These last emissions are related with the volume of concrete used in the two hydro plants through a default emission factor also taken from the Revised 1996 IPCC Guidelines for National Greenhouse Gas Inventories. They are considered as emissions under the control of project participants since they decide the amount of concrete to be used, but obviously they do not have any control on the manufacturing process. Direct emissions of the project are thus the almost negligible amount of methane emissions, and carbon dioxide (and in a minor extent methane and nitrous oxide) from transportation and construction. Section E shows the explicit calculation of these three direct emission contributions, which can be bounded by a maximum empirical value (see Section E.1). Carbon dioxide (and in a minor extent methane and nitrous oxide) emissions directly related to the production of electricity and methane released from hydro plants, due to anaerobic decomposition of organic matter in the flooded areas of the dams, are direct or indirect off-site emissions one step downstream, depending on the boundary choice. This second set of off-site emissions can be included within the project boundary under option 1 or excluded under option 2. This PDD deals with option 2, but the analysis can be easily replied for option 1 too. CO2 emissions are accounted for the thermal power plants serving the national system. The changes in methane emissions of hydro plants serving the national system are neglected (see Section E.2). The presence of the project activity modifies the system dispatch behavior in such a way that the displaced energy is in part of thermal origin and in part of hydro origin. This means that some times hydro plants are in the margin, thus having the possibility to store water that would have been used for electricity generation in the absence of the project activity. Therefore, it is assumed that the difference between La Vuelta and La Herradura energy output and the displaced thermal energy of the system is electricity generation displaced from hydro plants. In consequence it can be considered, although the relation is not necessarily linear, that the corresponding amount of displaced energy should be used to estimate methane emissions (actually the water excess is only important and how it is related to methane emissions). Even if it is mainly a second-order effect, the corresponding emissions

La Vuelta and La Herradura Hydroelectric Project
La Vuelta and La Herradura Hydroelectric Project 44 MGM International, Ltda. © Copyright (July 14, 2003) All Rights Reserved
occurs together with carbon dioxide emissions of redispatched plants and thus they would be considered as direct emissions and not as leakage. Emissions from changes in production of energy in other facilities of the system, when the electricity produced by the project is fed into the grid and when this is not the case, are associated to baseline emissions, since they represent what would have happened in the absence of the project, rather than directly relate to the project itself. Emissions resulting from operations of other plants are not within the strict control of the project developer. The presence of La Vuelta and La Herradura plants will change the patterns of plant dispatching in the national system. The shifts in production is considered in the baseline scenario and are not part of project emissions. Project emissions are zero except for the already accounted amounts of carbon dioxide, methane and nitrous oxide.
Electricity self-consumption, being the difference between power production (gross energy) and delivery of electricity to the grid (net energy), and grid losses, being losses between electricity supplied to the grid and the final electric output to the end user, are included into the simulation model (data is provided in document MGM_BSL_LVyLH_EM.doc), in which specifications for power plants (configuration) and transmission lines (resistance, reactance, etc.) are given. These emissions are also off-site emissions.
b. Leakage (indirect on- and off-site emissions):
No other emissions beyond the ones reported in item (a) are envisaged to be included. Since methane emissions of hydro plants serving the system are at the same level of avoided carbon dioxide emissions of thermal power plants, they are included as indirect off-site emissions under project boundary option 2. Therefore, baseline emissions are going to be accounted as leakage. Since baseline emissions are almost emission reductions of the project (except for the small amount of direct project emissions), all reductions are due to leakage effects (option 2). Section E.2 shows explicit calculations and Annex 3 explains in great detail all these issues under option 2 of the project boundary.

La Vuelta and La Herradura Hydroelectric Project
La Vuelta and La Herradura Hydroelectric Project 45 MGM International, Ltda. © Copyright (July 14, 2003) All Rights Reserved
B.6. Details of baseline development B.6.1. Date of completing the final draft of this baseline section
14/07/2003 B.6.2. Name of person/entity determining the baseline:
Eng. Carlos Alberto Valencia Echeverri Empresas Públicas de Medellín, E.S.P.
Carrera 58, Nº 42-125, Of. 9-053, A.A. 940 Medellín, Colombia Tel.: (57 4) 380-4320 E-mail: [email protected]
and
Dr. Fabián Gaioli MGM International, Ltda. Ayacucho 1435, 9 B C1111AAM Buenos Aires Argentina
Tel.: (54 11) 4816-1514 E-mail: [email protected]
Dr. Gaioli is not a project participant.

La Vuelta and La Herradura Hydroelectric Project
La Vuelta and La Herradura Hydroelectric Project 46 MGM International, Ltda. © Copyright (July 14, 2003) All Rights Reserved
C. Duration of the project activity / Crediting period C.1 Duration of the project activity: C.1.1. Starting date of the project activity: There is no guidance by the Executive Board available in the UNFCCC CDM web site yet. The starting date is then defined in this project as the date in which the project activity is previewed to come on-line, since it is the date in which emission reductions begin. Therefore the starting date for the project activity is: 01/01/2005 Time required before becoming operational: August 2002: Tunnel construction and civil works. September 2003: Plant construction is expected to be completed and operations are
expected to begin in early 2005, after proofs by the end of 2004. After estimating potential carbon offsets the project developer has decided to acquire the grounds and construct and improve ways in February 2002 and November 2002 (La Vuelta), respectively, and April 2002 and March 2003 (La Herradura), respectively. As showed in the additionality justification given in section B.4, the project became more attractive than other options due to CDM benefits and emission reduction revenues, also overcoming implementation barriers. Before the onset of project construction phase, it is necessary to carry out pre-construction activities, as an essential requirement for the fulfillment of the scheme. Civil works planned for the beginning of 2002 such as: • Technical improvement and revision of projects. • Creation of specifications for the leasing of homologation designs, execution of missing
designs and work supervision. • Additional financial and economic evaluations. • Revision of current environmental licenses. • Negotiations for the financing of projects. • Preliminary negotiations with municipality authorities and local communities. It is expected, with the proposed construction scheme, to finish works on La Vuelta subproject by the end of 2003; with an overall construction period of 28 months, being the power house construction the key point (see Table 8).

La Vuelta and La Herradura Hydroelectric Project
La Vuelta and La Herradura Hydroelectric Project 47 MGM International, Ltda. © Copyright (July 14, 2003) All Rights Reserved
For La Herradura subproject, the construction estimated time is 38 months, to initiate trading transactions by the end of 2004, being the conduction tunnel the scheme key point (see Table 9).
Table 8: La Vuelta project scheme Tasks Start End
premises acquisition 01-Oct-01 27-Feb-02road construction and fitting 15-Apr-02 02-Nov-02derivation works 09-Jun-02 30-Jun-03power house 01-Sep-02 31-Oct-03conduction: civil works, tunnel 08-Aug-02 31-Oct-03electromechanical equipments supply 15-Jun-03 31-Oct-03electromechanical equipments assembly 15-Jun-03 14-Jun-04pipelines supply 15-Jan-03 10-Aug-03pipelines assembly 01-Jun-03 30-Sep-03
Table 9: La Herradura project scheme
Tasks Start End premises acquisition 01-Nov-01 04-Apr-02roads construction and fitting 22-Apr-02 14-Mar-03derivation works 01-Mar-03 27-Dec-03power house 01-May-03 14-Sep-03conduction: civil works, tunnel 21-Aug-02 04-Dec-03electromechanical equipments supply 15-Jun-03 31-Oct-03transportation and assembly of electromechanical equipments 15-Jun-03 30-Aug-04pipelines supply 27-Feb-03 24-Oct-03pipelines assembly 15-Jun-03 31-Oct-03
C.1.2. Expected operational lifetime of the project activity:
50 y C.2 Choice of the crediting period and related information: C.2.1. Renewable crediting period
(at most seven (7) years per period) C.2.1.1. Starting date of the first crediting period: 01/01/2005 C.2.1.2. Length of the first crediting period: 7 y

La Vuelta and La Herradura Hydroelectric Project
La Vuelta and La Herradura Hydroelectric Project 48 MGM International, Ltda. © Copyright (July 14, 2003) All Rights Reserved
C.2.2. Fixed crediting period (at most ten (10) years): NOT SELECTED
C.2.2.1. Starting date: C.2.2.2. Length (max 10 years):
La Vuelta and La Herradura Hydroelectric Project
La Vuelta and La Herradura Hydroelectric Project 49 MGM International, Ltda. © Copyright (July 14, 2003) All Rights Reserved
D. Monitoring methodology and plan D.1. Name and reference of approved methodology applied to the project activity: There is no methodology choice available in the UNFCCC web site. This project only requires a straightforward monitoring methodology. The proposed name for this new monitoring methodology (see Annex 4) is:
“Monitoring methodology for displaced electricity generation in a centrally dispatched hydrothermal interconnected power system.”
D.2. Justification of the choice of the methodology and why it is applicable to the project activity: According to the baseline methodology developed for this project and taking into consideration anthropogenic GHG emissions generated by the project activity the selection of the monitoring plan is quite straightforward. Thus the monitoring methodology accounts for all data collection relevant to determine verifiable emission reductions achieved by the project. Annex 3 clearly explains the steps followed for determining the baseline and Section E shows the steps from which emission reductions can be inferred. So that these steps allows one to identify key parameters, variables and data sources that must be monitored in order to have a following of the registered CDM project activity. For this reason, once key issues were identified, the proposed new methodology directly applies to the present project in a consistent way. The main data is divided into two categories, one related to specific GHG abatement matters and the other with environmental, social, and economic project performance. GHG related data:
• Monthly electricity generation of La Vuelta and La Herradura hydroelectric plants, as routinely measured by EE.PP.M. (The EEPPM is likely to be taking measurements every hour, but we will only consider the monthly results.)
• Annual electricity generation of all thermal plants serving the interconnected national system, as provided by the National Dispatch Center (CND).
Non-GHG related data:
• EE.PP.M executes an Environmental Management Plant in order to deal with environmental, social and economic aspects of the region and their inhabitants. A following of this plan is performed and reported each three months. Several programs were created under this plan (impacts management, monitoring, and contingency) reflecting EE.PP.M commitment with sustainable development and will continue during

La Vuelta and La Herradura Hydroelectric Project
La Vuelta and La Herradura Hydroelectric Project 50 MGM International, Ltda. © Copyright (July 14, 2003) All Rights Reserved
project implementation. The company will deliver the monitoring of the environmental development of the project to the same consultants that have prepared the Following of the Environmental Management Plan, by controlling water quality, which is the most relevant parameter to be controlled under the project activity implementation phase.
A detailed of the monitoring procedure, for this project can be found in MGM_MVP_LVyLH_EM.xls. The MGM_MVP_LVyLH_EM.xls spreadsheet is structurally very similar to that used in order to determine baseline emissions and estimate emission reductions (MGM_BSL_LVyLH_EM.xls for this PDD). The assumptions defining emissions factors are the same in each case, and are unchanged throughout the project. While emissions factors remain unchanged, baseline emissions depend on electricity generation of the hydroelectric plant and electricity generation of all thermal plants, and are determined in a dynamic manner from data entered into the MGM_MVP_LVyLH_EM.xls spreadsheet. The spreadsheet thus also determines emissions reductions as a result of project implementation. EE.PP.M has many years with proven experience in the electricity market and carries out conventional procedures to give continuity to controls and auditing tasks in order to guarantee verifiable output information and to supply high quality data that can be straightforwardly replicated by a third party. The procedures are externally audited by auditing firms and validated by the Colombian regulation entity. If the validator considers that additional information is needed it will be provided under request.

La
Vue
lta a
nd L
a H
erra
dura
Hyd
roel
ectr
ic P
roje
ct
La
Vue
lta a
nd L
a He
rradu
ra H
ydro
electr
ic Pr
oject
51
MGM
Inte
rnat
ional,
Ltd
a. ©
Cop
yrigh
t (Ju
ly 14
, 200
3) A
ll Righ
ts Re
serv
ed
D.3
. D
ata
to b
e co
llect
ed in
ord
er to
mon
itor
emis
sion
s fro
m th
e pr
ojec
t act
ivity
, and
how
this
dat
a w
ill b
e ar
chiv
ed:
Ther
e ar
e no
pro
ject
em
issi
ons t
hat r
equi
re m
onito
ring.
D
.4.
Pote
ntia
l sou
rces
of e
mis
sion
s whi
ch a
re si
gnifi
cant
and
rea
sona
bly
attr
ibut
able
to th
e pr
ojec
t act
ivity
, but
whi
ch a
re n
ot in
clud
ed in
th
e pr
ojec
t bou
ndar
y, a
nd id
entif
icat
ion
if an
d ho
w d
ata
will
be
colle
cted
and
arc
hive
d on
thes
e em
issi
on so
urce
s:
This
sec
tion
is u
nder
stoo
d as
ref
errin
g to
lea
kage
. A
s it
was
exp
lain
ed i
n Se
ctio
n B
.5,
emis
sion
s of
all
ther
mal
pow
er p
lant
s se
rvin
g th
e in
terc
onne
cted
nat
iona
l sys
tem
(D.5
.2) a
re n
ot c
onsi
dere
d as
leak
age
but d
irect
off
-site
em
issi
ons.
So, i
t was
dec
ided
to in
clud
e th
at re
leva
nt d
ata
in
Sect
ion
D.5
. The
follo
win
g da
tum
can
be
incl
uded
in S
ectio
n D
.5 in
stea
d of
Sec
tion
D.4
, but
con
cept
ually
ther
e is
not
any
sign
ifica
nt d
iffer
ence
.
ID
num
ber
D
ata
type
D
ata
vari
able
D
ata
unit
Mea
sure
d (m
), ca
lcul
ated
(c) o
r es
timat
ed (e
)
Rec
ordi
ng
freq
uenc
y
Prop
ortio
n of
da
ta to
be
mon
itore
d
How
will
the
data
be
arc
hive
d?
(ele
ctro
nic/
pap
er)
For
how
long
is
arch
ived
dat
a to
be
kept
? C
omm
ent
D.4
.1
Elec
trici
ty
gene
rate
d by
La
Vue
lta a
nd L
a H
erra
dura
hyd
ro
plan
ts
g P
GW
h m
ho
urly
bu
t re
gist
ered
fo
r thi
s M
VP
on a
m
onth
ly
basi
s
100%
El
ectro
nic
(spr
eads
heet
) Pa
per
Hou
rly d
ata:
1 y
ear
Inte
grat
ed m
onth
ly
data
: 7 y
ears
In
tegr
ated
ann
ual
data
: 14
year
s
Prov
ided
by
EE.P
P.M
D.4
.2
Elec
trici
ty
gene
rate
d by
th
erm
al p
ower
pl
ant n
g n
GW
h m
m
onth
ly
100%
El
ectro
nic
(spr
eads
heet
) Pa
per
14 y
ears
Pr
ovid
ed b
y C
ND

La
Vue
lta a
nd L
a H
erra
dura
Hyd
roel
ectr
ic P
roje
ct
La
Vue
lta a
nd L
a He
rradu
ra H
ydro
electr
ic Pr
oject
52
MGM
Inte
rnat
ional,
Ltd
a. ©
Cop
yrigh
t (Ju
ly 14
, 200
3) A
ll Righ
ts Re
serv
ed
D.5
. R
elev
ant
data
nec
essa
ry f
or d
eter
min
ing
the
base
line
of a
nthr
opog
enic
em
issi
ons
by s
ourc
es o
f G
HG
with
in t
he p
roje
ct b
ound
ary
and
iden
tific
atio
n if
and
how
such
dat
a w
ill b
e co
llect
ed a
nd a
rchi
ved:
Th
ere
are
no b
asel
ine
emis
sion
s w
ithin
the
proj
ect b
ound
ary.
All
base
line
emis
sion
s ar
e at
oth
er p
ower
pla
nts,
outs
ide
the
proj
ect b
ound
ary,
and
in
clud
ed in
D.4
abo
ve.
D.6
. Q
ualit
y co
ntro
l (Q
C) a
nd q
ualit
y as
sura
nce
(QA
) pro
cedu
res a
re b
eing
und
erta
ken
for
data
mon
itore
d:
Dat
a U
ncer
tain
ty
leve
l of d
ata
Are
QA
/QC
pro
cedu
res
plan
ned
for
thes
e da
ta?
Out
line
expl
anat
ion
why
QA
/QC
pro
cedu
res a
re o
r ar
e no
t bei
ng p
lann
ed.
D.4
.1
Low
Y
es
The
QA
/QC
pro
cedu
res a
re st
anda
rd p
roce
dure
s fol
low
ed b
y th
e pr
ojec
t dev
elop
er, a
s exp
lain
ed b
elow
. D
.4.2
Lo
w
Yes
Th
e Q
A/Q
C p
roce
dure
s are
stan
dard
pro
cedu
res f
ollo
wed
by
the
proj
ect d
evel
oper
, as e
xpla
ined
bel
ow.
Cal
ibra
tion
of e
nerg
y eq
uipm
ents
fol
low
s na
tiona
l sta
ndar
ds, a
ccor
ding
to th
e ca
libra
tion
inst
ruct
ive
spec
ified
in C
olom
bian
nor
m N
TC 4
856
for
elec
trici
ty m
eter
ing
devi
ces,
desi
gned
to e
stab
lish
the
rout
ine
essa
ys to
be
perf
orm
ed o
n en
ergy
met
ers
in o
rder
to d
o in
itial
and
per
iodi
c ve
rific
atio
n of
met
ers
oper
atio
n. T
he m
etho
dolo
gy a
nd p
roce
dure
s ar
e ap
plie
d to
alte
rnat
ing
curr
ent a
ctiv
e en
ergy
met
ers
man
ufac
ture
d ac
cord
ing
to N
TC 2
288,
21
47, a
nd 4
052
stan
dard
s, an
d to
rea
ctiv
e en
ergy
met
ers
man
ufac
ture
d ac
cord
ing
to N
TC 2
148
and
4569
sta
ndar
ds. E
E.PP
.M h
as a
dopt
ed it
s ow
n pr
oced
ure
base
d on
the
Col
ombi
an t
echn
ical
nor
m N
TC-I
SO-I
EC 1
7025
and
NTC
485
6, u
nder
the
so-
calle
d “I
nstru
ctiv
e to
per
form
on-
site
el
ectri
city
met
er p
roof
s with
a p
atte
rn m
eter
ing
devi
ce”
(DIS
-EM
-LE-
IN-0
09-0
1). S
imila
r pro
cedu
res a
pply
to a
ll th
erm
al p
lant
s in
Col
ombi
a.

La
Vue
lta a
nd L
a H
erra
dura
Hyd
roel
ectr
ic P
roje
ct
La
Vue
lta a
nd L
a He
rradu
ra H
ydro
electr
ic Pr
oject
53
MGM
Inte
rnat
ional,
Ltd
a. ©
Cop
yrigh
t (Ju
ly 14
, 200
3) A
ll Righ
ts Re
serv
ed
D.7
N
ame
of p
erso
n/en
tity
dete
rmin
ing
the
mon
itori
ng m
etho
dolo
gy:
Eng.
Car
los A
lber
to V
alen
cia
Eche
verr
i Em
pres
as P
úblic
as d
e M
edel
lín, E
.S.P
.
C
arre
ra 5
8, N
º 42-
125,
Of.
9-05
3, A
.A. 9
40
Med
ellín
, Col
ombi
a
Te
l.:
(5
7 4)
380
-432
0
E-m
ail:
cv
alen
ce@
eepp
m.c
om
and
D
r. Fa
bián
Gai
oli
MG
M In
tern
atio
nal,
Ltda
. A
yacu
cho
1435
, 9 B
C
1111
AA
M B
ueno
s Aire
s A
rgen
tina
Tel.:
(54
11) 4
816-
1514
E-
mai
l:
fgai
oli@
mgm
inte
r.com
D
r. G
aiol
i is n
ot a
pro
ject
par
ticip
ant.

La Vuelta and La Herradura Hydroelectric Project
- 54 - MGM International, Ltda. Copyright (2003) All Rights Reserved
E. Calculation of GHG emissions by sources E.1. Description of formulae used to estimate anthropogenic emissions by sources of greenhouse gases of the project activity within the project boundary: a) Methane emissions due to biomass decomposition in flooded areas by the project There is no an already universally accepted methodology for quantifying methane emissions from dams. There only exist isolated studies which have calculated methane emissions from some measurements on an modeling basis. These data is used sometimes as statistical information to provide some upper bounds for methane release. IPCC has not provided any special recommendation on this issue. La Vuelta and La Herradura plants are placed over the high slope La Herradura river. The two run-of-river plants only need derivation structures –concrete irrigation water wheels of 7 meters high– for deviating water flows to the power-house intakes. They regulate flows on a daily basis to transfer generation from one demand block to another (base- to peak-load hours, in order to take price advantages). This kind of plants are considered as plants without dams,20 since the dams are very small and they are obviously needed to permit water access and avoid air penetration into the tunnels. In the case of La Vuelta and La Herradura plants there are only thin water films over flooded areas of 6,181 m2 (La Vuelta) and 3,194 m2 (La Herradura). The vegetation in these areas (backwater along the river-bed) corresponds to very small portions of grass since it was removed during the digging works. Thus no methane emissions are expected. In spite of that, since some confusion even remains about this issue, mainly as a consequence of disregarding the project scale into the discussion, an excessively conservative assumption is considered, consisting of bounding methane emissions by an upper limit extracted from literature. Several studies have shown that methane emissions are time-dependent, since they are related to organic decomposition in anaerobic conditions, which also depends on water deepness, climate conditions or region –boreal or tropical–, reservoir size, kind of vegetation, etc.). Hydro Québec21 has shown that methane emissions for run-of-river hydro plants with the best commercial technology (very good sites for renewables) in North America are bounded by approximately 3 tonne CO2e/GWh, when the so-called life-cycle assessment is carried out, including emissions from fuel extraction, processing and transportation, as well as from power plant construction and electricity generation. The result obtained by applying this proposal must be compared with other already suggested approaches and with emissions one step upstream estimated independently in a more direct way. This only serves for this PDD to show the negligible order of magnitude involved in that sources of GHG emissions. The main characteristics of the subprojects are (considering a maximal generation case) (see Table 10):
20 Moreover, plants that can storage water for ten days are considered as plants without dams. 21 Greenhouse Gas Emissions from Power Generation Options, by Luc Gagnon, Hydro Québec (Jaunary 2003). http://www.hydroquebec.com/environment.
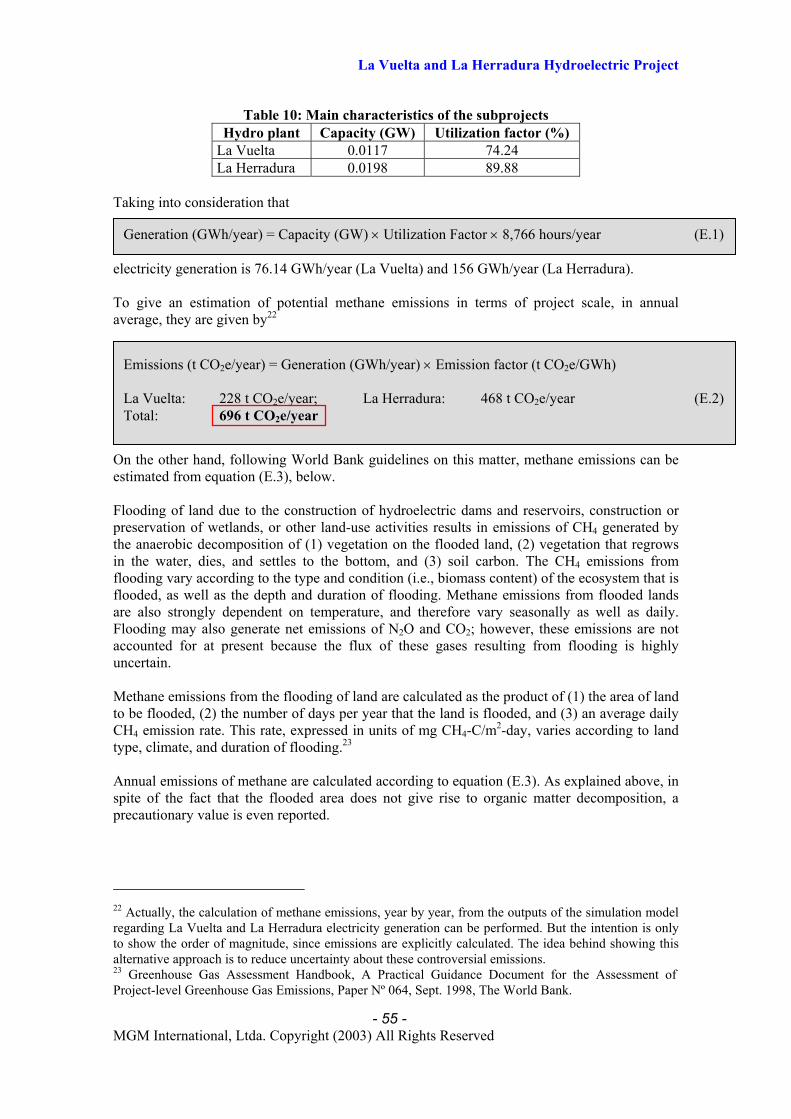
La Vuelta and La Herradura Hydroelectric Project
M
Table 10: Main characteristics of the subprojects Hydro plant Capacity (GW) Utilization factor (%)
La Vuelta 0.0117 74.24 La Herradura 0.0198 89.88
Taking into consideration that electricity generation is 76.14 GWh/year (La Vuelta) and 156 GWh/year (La Herradura). To give an estimation of potential methane emissions in terms of project scale, in annual average, they are given by22 Oe FptiffaFau
MtCt Asp 2
rta2
P
Generation (GWh/year) = Capacity (GW) × Utilization Factor × 8,766 hours/year (E.1)
Emissions (t CO2e/year) = Generation (GWh/year) × Emission factor (t CO2e/GWh) La Vuelta: 228 t CO2e/year; La Herradura: 468 t CO2e/year (E.2)Total: 696 t CO2e/year
- 55 -
GM International, Ltda. Copyright (2003) All Rights Reserved
n the other hand, following World Bank guidelines on this matter, methane emissions can be stimated from equation (E.3), below.
looding of land due to the construction of hydroelectric dams and reservoirs, construction or reservation of wetlands, or other land-use activities results in emissions of CH4 generated by he anaerobic decomposition of (1) vegetation on the flooded land, (2) vegetation that regrows n the water, dies, and settles to the bottom, and (3) soil carbon. The CH4 emissions from looding vary according to the type and condition (i.e., biomass content) of the ecosystem that is looded, as well as the depth and duration of flooding. Methane emissions from flooded lands re also strongly dependent on temperature, and therefore vary seasonally as well as daily. looding may also generate net emissions of N2O and CO2; however, these emissions are not ccounted for at present because the flux of these gases resulting from flooding is highly ncertain. ethane emissions from the flooding of land are calculated as the product of (1) the area of land
o be flooded, (2) the number of days per year that the land is flooded, and (3) an average daily H4 emission rate. This rate, expressed in units of mg CH4-C/m2-day, varies according to land
ype, climate, and duration of flooding.23
nnual emissions of methane are calculated according to equation (E.3). As explained above, in pite of the fact that the flooded area does not give rise to organic matter decomposition, a recautionary value is even reported.
2 Actually, the calculation of methane emissions, year by year, from the outputs of the simulation model egarding La Vuelta and La Herradura electricity generation can be performed. But the intention is only o show the order of magnitude, since emissions are explicitly calculated. The idea behind showing this lternative approach is to reduce uncertainty about these controversial emissions. 3 Greenhouse Gas Assessment Handbook, A Practical Guidance Document for the Assessment of roject-level Greenhouse Gas Emissions, Paper Nº 064, Sept. 1998, The World Bank.

La Vuelta and La Herradura Hydroelectric Project
- 56 - MGM International, Ltda. Copyright (2003) All Rights Reserved
Area of Duration Average Daily Conversion Molecular/ Annual CH4 Flooded × of × CH4 × Factor × Atomic = Emissions Land Flooding Emission Rate Weight Ratio Produced (m2) (days/year) (mg CH4-C/m2-day) (t/mg) (t CH4/ton CH4-C) (t CH4/year) Estimation of methane emissions from flooding of land (E.3) where the Emission Rate is assumed as 75 mg CH4-C/m2-day (average value as proposed for floodplains in the Greenhouse Gas Assessment Handbook, A Practical Guidance Document for the Assessment of Project-level Greenhouse Gas Emissions, Paper Nº 064, Sept. 1998, The World Bank), the Area of Flooded Land is taken from existing data of the project activity (9,375 m2), the Duration of Flooding is taken as the maximum possible value, 365.25 days, the Conversion Factor is equal to 10-9
t/mg, and the Molecular/Atomic Weight Ratio is 16 tonne CH4/12 tonne CH4-C. Applying equation (E.3) maximum project methane emissions are obtained: 7 tonne CO2e/year . This value is far enough from the one obtained with equation (E.2). The difference is mainly attributed to construction and transportation CO2 emissions (see (b) and (c) below).

La Vuelta and La Herradura Hydroelectric Project
Digression on methane emissions from dams
The scientific literature shows that reservoirs can emit methane due to the anaerobic decomposition of biomass andcarbon dioxide. The main scientific controversy centres on the extrapolation of measured emissions per m2 inselected parts of the reservoir to the whole reservoir area. Emissions almost certainly vary according to depth andthe distribution of the submerged biomass. They also vary through time, with a rapid peak occurring shortly aftersubmersion after which they tail off at an unknown rate. Studies have not yet been carried out over long periods tocharacterize the full life-cycle curve of the emissions. Many natural habitats emit methane, especially bogs and other wetlands, or forest habitats in tropical climates.When a dam reservoir floods these habitats, any methane emissions should be counted as net, which requires somemeasurements of the emissions from the reservoir site prior to impoundment. There is also evidence that the flows ofcarbon within a system are complex, and carbon may flow into a reservoir from the catchment (and leave it throughthe spillway and turbines) in a manner that is in some cases analogous to the pre-dam situation.1 Therefore significant differences stem from the quantification of these emissions, whether they represent a genuinenet additional emission over and above background gas releases, and how they compare to those from thermalpower. The IPCC has not created a separate category for GHG emissions from hydroelectric schemes. Some of theunresolved issues with regards to GHG emissions from reservoirs are how to measure and extrapolate emissionsfrom large reservoirs and how do post-flooding emissions compare to pre-flooding conditions (how much additionalGHG is emitted). Other aspects that make it difficult to compare hydropower to thermal power is that the pattern ofGHG emissions from a hydroelectric reservoir is different from the pattern of emissions from a thermal plant. WhileCO2 emissions from the combustion of fossil fuels in a thermal plant are released uniformly over the entire period ofoperation of the plant, part of the production of CH4 and CO2 from the bacterial decomposition of organic matter inthe reservoir can be concentrated in time and can decay over a period much shorter than the lifespan of the reservoir.Similarly, the time horizon used for the comparison can influence the outcome since methane breaks down to carbondioxide in the atmosphere after a period of 15-20 years, and because methane has a GWP 21 times higher thancarbon dioxide.2 Emissions from dams and reservoirs vary widely according to their geographical location and other factors.Reservoir depth and shape, the local climate, and the way in which the dam is operated, could all impact emissionlevels. In the tropics, emissions vary depending on how deep a reservoir is.3
1 WCD Thematic Review II.2 Environmental Issues, “Certainty and Uncertainty in the Science of Greenhouse Gas Emissions fromHydroelectric Reservoirs,” by L. Pinguelli Rosa and M. A. dos Santos, March 2002. World Commission on Dams(http://www.dams.org). 2 WCD Thematic Reviews, II.2 Dams and Global Change, “Introduction to Global Change,” Nov. 1999. World Commission onDams (http://www.dams.org). 3 D. Knight, “Report Highlights Dam’s Role in Global Warming,” http://www.commondreams.org, July 8, 2003.
- 57 - MGM International, Ltda. Copyright (2003) All Rights Reserved
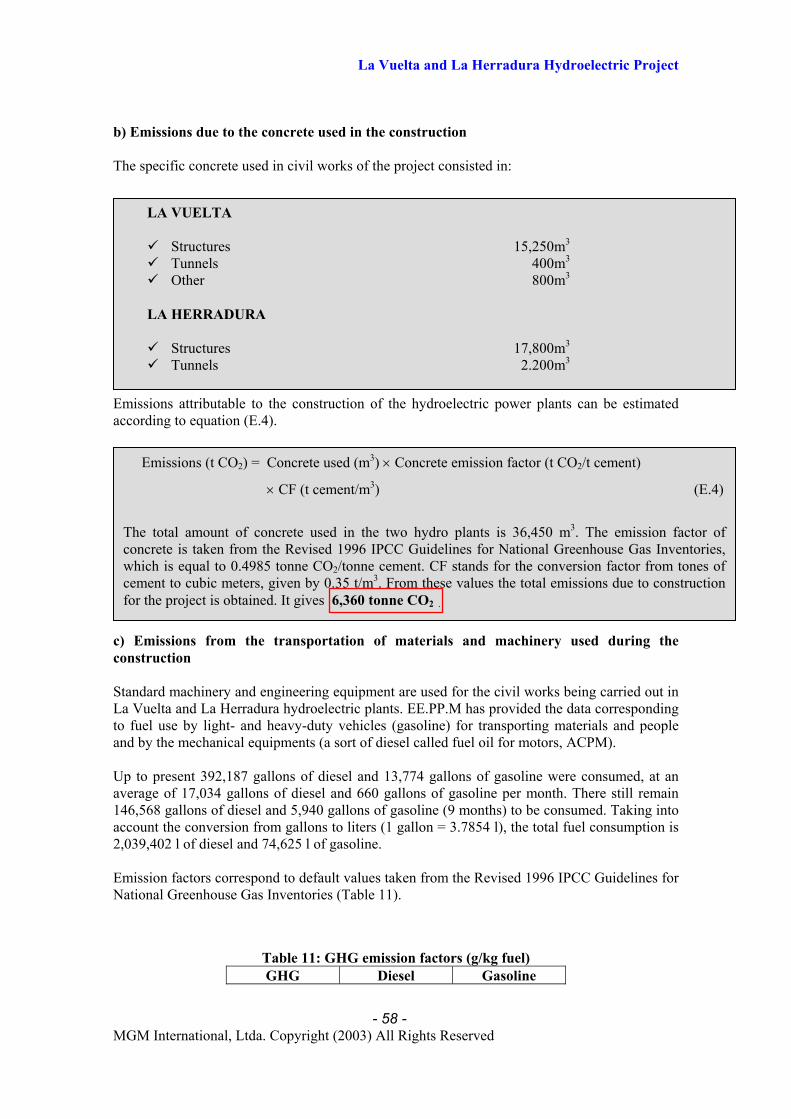
La Vuelta and La Herradura Hydroelectric Project
- 58 - MGM International, Ltda. Copyright (2003) All Rights Reserved
b) Emissions due to the concrete used in the construction The specific concrete used in civil works of the project consisted in: Emissions attributable to the construction of the hydroelectric power plants can be estimated according to equation (E.4). c) Emissions from the transportation of materials and machinery used during the construction Standard machinery and engineering equipment are used for the civil works being carried out in La Vuelta and La Herradura hydroelectric plants. EE.PP.M has provided the data corresponding to fuel use by light- and heavy-duty vehicles (gasoline) for transporting materials and people and by the mechanical equipments (a sort of diesel called fuel oil for motors, ACPM). Up to present 392,187 gallons of diesel and 13,774 gallons of gasoline were consumed, at an average of 17,034 gallons of diesel and 660 gallons of gasoline per month. There still remain 146,568 gallons of diesel and 5,940 gallons of gasoline (9 months) to be consumed. Taking into account the conversion from gallons to liters (1 gallon = 3.7854 l), the total fuel consumption is 2,039,402 l of diesel and 74,625 l of gasoline. Emission factors correspond to default values taken from the Revised 1996 IPCC Guidelines for National Greenhouse Gas Inventories (Table 11).
Table 11: GHG emission factors (g/kg fuel) GHG Diesel Gasoline
LA VUELTA
Structures 15,250 m3 Tunnels 400 m3 Other 800 m3
LA HERRADURA
Structures 17,800 m3 Tunnels 2.200 m3
Emissions (t CO2) = Concrete used (m3) × Concrete emission factor (t CO2/t cement)
× CF (t cement/m3) (E.4)
The total amount of concrete used in the two hydro plants is 36,450 m3. The emission factor of concrete is taken from the Revised 1996 IPCC Guidelines for National Greenhouse Gas Inventories, which is equal to 0.4985 tonne CO2/tonne cement. CF stands for the conversion factor from tones of cement to cubic meters, given by 0.35 t/m3. From these values the total emissions due to construction for the project is obtained. It gives 6,360 tonne CO2 .
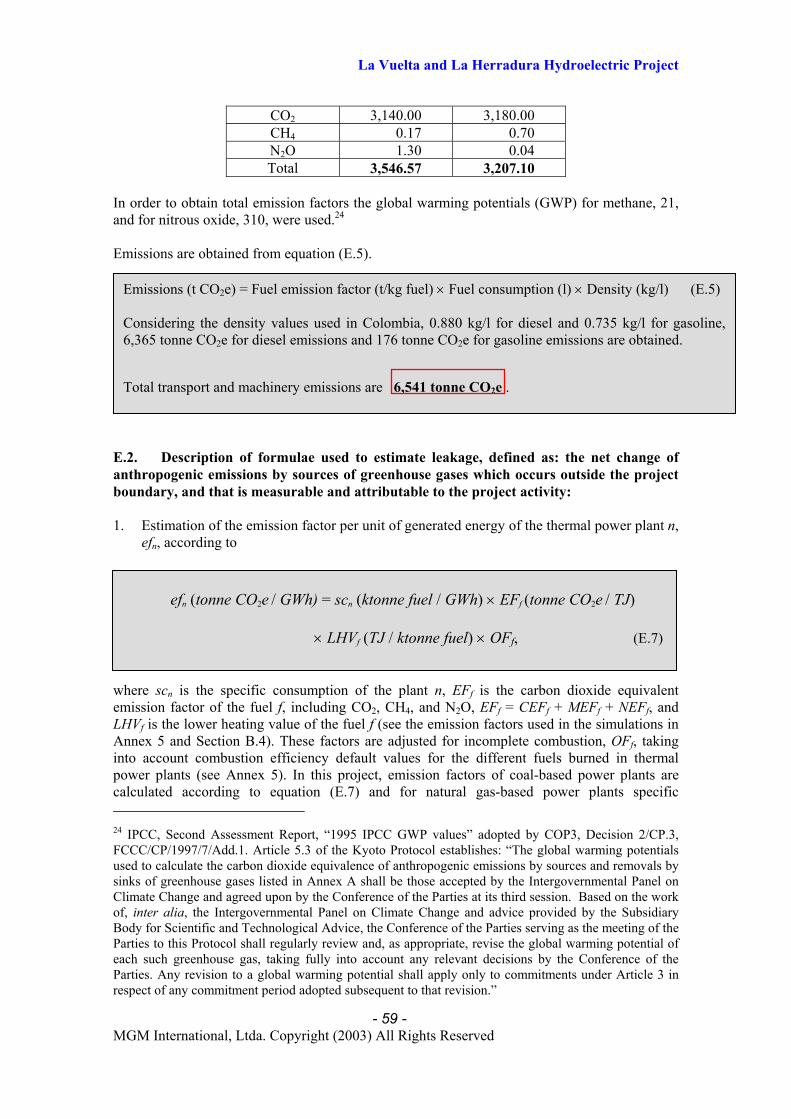
La Vuelta and La Herradura Hydroelectric Project
- 59 - MGM International, Ltda. Copyright (2003) All Rights Reserved
CO2 3,140.00 3,180.00 CH4 0.17 0.70 N2O 1.30 0.04 Total 3,546.57 3,207.10
In order to obtain total emission factors the global warming potentials (GWP) for methane, 21, and for nitrous oxide, 310, were used.24 Emissions are obtained from equation (E.5). E.2. Description of formulae used to estimate leakage, defined as: the net change of anthropogenic emissions by sources of greenhouse gases which occurs outside the project boundary, and that is measurable and attributable to the project activity: 1. Estimation of the emission factor per unit of generated energy of the thermal power plant n,
efn, according to
where scn is the specific consumption of the plant n, EFf is the carbon dioxide equivalent emission factor of the fuel f, including CO2, CH4, and N2O, EFf = CEFf + MEFf + NEFf, and LHVf is the lower heating value of the fuel f (see the emission factors used in the simulations in Annex 5 and Section B.4). These factors are adjusted for incomplete combustion, OFf, taking into account combustion efficiency default values for the different fuels burned in thermal power plants (see Annex 5). In this project, emission factors of coal-based power plants are calculated according to equation (E.7) and for natural gas-based power plants specific 24 IPCC, Second Assessment Report, “1995 IPCC GWP values” adopted by COP3, Decision 2/CP.3, FCCC/CP/1997/7/Add.1. Article 5.3 of the Kyoto Protocol establishes: “The global warming potentials used to calculate the carbon dioxide equivalence of anthropogenic emissions by sources and removals by sinks of greenhouse gases listed in Annex A shall be those accepted by the Intergovernmental Panel on Climate Change and agreed upon by the Conference of the Parties at its third session. Based on the work of, inter alia, the Intergovernmental Panel on Climate Change and advice provided by the Subsidiary Body for Scientific and Technological Advice, the Conference of the Parties serving as the meeting of the Parties to this Protocol shall regularly review and, as appropriate, revise the global warming potential of each such greenhouse gas, taking fully into account any relevant decisions by the Conference of the Parties. Any revision to a global warming potential shall apply only to commitments under Article 3 in respect of any commitment period adopted subsequent to that revision.”
Emissions (t CO2e) = Fuel emission factor (t/kg fuel) × Fuel consumption (l) × Density (kg/l) (E.5) Considering the density values used in Colombia, 0.880 kg/l for diesel and 0.735 kg/l for gasoline, 6,365 tonne CO2e for diesel emissions and 176 tonne CO2e for gasoline emissions are obtained.
Total transport and machinery emissions are 6,541 tonne CO2e .
efn (tonne CO2e / GWh) = scn (ktonne fuel / GWh) × EFf (tonne CO2e / TJ) × LHVf (TJ / ktonne fuel) × OFf, (E.7)

La Vuelta and La Herradura Hydroelectric Project
- 60 - MGM International, Ltda. Copyright (2003) All Rights Reserved
.~
~~ )()(
P
thth
gGGF +− −
= (E.12)
consumptions were provided given in TJ/GWh units, so that lower heating values are embedded in those values.
2. Calculation of emissions of thermal power plant n, ±ne~ , both with (+) and without (−) the
project, given by
where ±ng~ is the electricity generated by the thermal power plant n in a year.
3. Calculation of total CO2e emissions per year, )(~ thE± , of the thermal power plants serving the system as
where N is the number of thermal plants in the system and the sum extends only over thermal (th) plants. 4. Calculation of the total amount of thermal electricity generated in a year, )(~ thG± , from
5. Calculation of the average CO2e emissions, ±
E~ , of the thermal plants serving the
system, i.e. 6. Calculation of the thermal generation displacement factor, F, representing the rate between
the annual displaced thermal generation of the SIN and the annual generation of La Vuelta and La Herradura project,
±ne~ (tonne CO2e / year) = ±ng~ (GWh / year) × efn (tonne CO2e / GWh), (E.8)
)/(~)/(~2
)(12
)( yeareCOnetoneyeareCOtonneEN
thnn
th ∑=
±± = , (E.9)
)/(~)/(~)(1
)( yearGWhgyearGWhGN
thnn
th ∑=
±± = . (E.10)
±E~ (tonne CO2e / year) = )(~ thE± (tonne CO2e / GWh) / )(~ thG± (GWh / year). (E.11)

La Vuelta and La Herradura Hydroelectric Project
Using the outputs and results directly obtained from the simulation model, equation (E.9) can be applied in two situations, without (−) and with (+) the project, so that baseline emissions are given by:
where the subindex B stands for baseline emissions. However, this is only a theoretical ex ante estimation of baseline emissions in order to have an amount of potential baseline emissions and thus emission reductions, but in reality, when the project will be operating, the situation will be different. Only values in the situation with the project −denoted by (+)− will be obtained (measured and calculated). Therefore baseline emissions will have an ex post calculation component. What is important here is to fix ex ante baseline parameters that will be used for calculating baseline emissions. This is the key point of the new methodology proposed (see Annex 3). Consequently, two parameters are going to be fixed in the baseline methodology, the average emissions in the ‘without project’ situation, ⟨ E~ ⟩−, and the displacement factor, F, so that baseline emissions can be written in an equivalent way as
)/()/(~)/(~
2)(
2)(
2 yeareCOtEyeareCOtEyeareCOtE ththB +− −= , (E.13)
~)(th
- 61 - MGM International, Ltda. Copyright (2003) All Rights Reserved
F is different from 1 since part of the displaced energy generation is of hydroelectric origin, due to the value of water and consequent storage by hydropower generators, making that some hydro plants are at the margin - this is one of the main characteristics of a hydrothermal interconnected system-, and also due to there is a part of thermal energy that cannot be displaced due to transmission capacity. It is straightforward to prove that the first summand on the right hand side of equation (E.14) is equal to )(~ thE− in the theoretical case. Nevertheless in actual situation, it is not possible to obtain power plants generation, gn- (since they were only estimated by the simulation model), and thus calculating )(~ thE− from equations (E.9) and (E.8). Equation (E.14) provides a way to calculate baseline emissions based on ex post data and taking into account baseline parameters fixed ex ante. The advantage of this formulation is that the two parameters fixed ex ante have less sensitivity to variations in real conditions, since F is based on the difference between parameters of correlated scenarios and ⟨ E~ ⟩− is almost the same as ⟨E⟩+ (see Annex 3 for a detailed analysis on this relevant point). If one fixes )(~ thE− , baseline emissions can differ a lot from actual emissions displaced by the project activity, in the case when )(thE+ results very different from
the one estimated ex ante. But F compensates any shift in )(thE+ since )(~ thE− follows its behavior through the F linkage.
[ ])./(
)/()/()/()/(
2)(
22
yeareCOtE
GWheCOtEyearGWhGFyearGWhgyeareCOtEth
PB
+
−+
−
×+×= (E.14)

La Vuelta and La Herradura Hydroelectric Project
- 62 - MGM International, Ltda. Copyright (2003) All Rights Reserved
E.3 The sum of E.1 and E.2 representing the project activity emissions: Emissions derived in Section E.2 are not project emissions but baseline ones. These are considered leakage since they are reasonably attributable to the project activity that corresponds to avoided emissions by the project, which are accounted as baseline emissions, so that Section E.3 does not apply as the title proposes in a direct way. See Annex 3 for a whole understanding of this point. Only emissions of Section E.1 are involved. Therefore the sum accounts for emissions of methane from the reservoir (E.1.a), construction emissions (E.1.b), and transport emissions (E.1.c). It gives: If construction and transport emissions (12,901 tonne CO2e) are distributed only along the whole 21-year crediting period and not the project lifetime, representing 614 tonne CO2e per year, it can be appreciated that the greatest contribution to emissions comes from construction and transport and methane emissions can be assumed as negligible. Total emissions per year (621 tonne CO2e/year) are below the bound given by Hydro Québec, 696 tonne CO2e/year (see equation (E.2)). It can be considered as a cross-check of the results obtained under emission sources which are certainly difficult to quantify with high accuracy. E.4 Description of formulae used to estimate the anthropogenic emissions by sources of greenhouse gases of the baseline: Equation (E.14) represents baseline emissions as described in Section E.2. The confusion with leakage and baseline emissions was generated because Section E.2 asks for leakage (indirect emissions outside the project boundary), Section E.3 associates leakage to indirect project emissions and this section asks for baseline emissions (mainly interpreted as emissions with the project boundary as it is reflected in Section D.5. However, this project has a particular combination of all these concepts, which can be clearly explained in Annex 3 to this PDD. E.5 Difference between E.4 and E.3 representing the emission reductions of the project activity: Emission reductions are obtained as the difference between equation (E.14), representing baseline emissions, and emissions of equation (E.6), representing project emissions. Equation (E.15) shows emission reductions, ER, of the project activity:
EP (tonne CO2e) = [Ereservoir + Etrnasport + Econstruction ] (tonne CO2e), (E.6) where EP are project emissions. Applying the results obtained above, these emissions are: EP = [ (a) 7 + (b) 6,360 + (c) 5,605 ] tonne CO2e = 12,908 tonne CO2e in the first year (2005) EP = 7 tonne CO2e for the rest of the crediting period (2006-2025)
ER (tonne CO2e/year) = EB (tonne CO2e/year) – EP (tonne CO2e/year). (E.15)

La Vuelta and La Herradura Hydroelectric Project
- 63 - MGM International, Ltda. Copyright (2003) All Rights Reserved
E.6 Table providing values obtained when applying formulae above: NOTE: for more details please see spreadsheets MGM_BSL_LVyLH_EM.xls. Results are summarized below (Table 12).
Table 12: Baseline and project emissions and reductions during the 21-year crediting period
(tonnes CO2 equiv/year)
year EB (tonne CO2e) EP (tonne CO2e) ER (tonne CO2e) 2005 73,540 12.908 60,632 2006 73,606 7 73,599 2007 109,138 7 109,130 2008 80,758 7 80,751 2009 88,256 7 88,249 2010 62,560 7 62,553
2011 60,887 7 60,879 2012 63,069 7 63,062 2013 58,479 7 58,472 2014 49,894 7 49,887 2015 64,745 7 64,738 2016 61,688 7 61,681
2017 70,156 7 70,149
2018 85,374 7 85,367 2019 81,555 7 81,548
2020 81,555 7 81,548
2021 81,555 7 81,548
2022 81,555 7 81,548
2023 81,555 7 81,548
2024 81,555 7 81,548
2025 81,555 7 81,548
TOTAL 1,559,984 It is assumed that annual emissions in the period 2020-2025 are the same as those produced in 2019. This is due to model limitations, which make impossible to generate more outputs (the output data is 5 Gb size.
EMISSION REDUCTION ESTIMATES
crediting period tonnes of CO2 equiv
7-year 535,793
21-year 1,559,984

La Vuelta and La Herradura Hydroelectric Project
- 64 - MGM International, Ltda. Copyright (2003) All Rights Reserved
Notes:
• Data sources used to estimate GHG emissions can be consulted in document MGM_BSL_LVyLH_EM.xls.
• For natural gas has been considered that N2O emissions are negligible due to
combustion of this fuel in thermal power plants occurs at very high temperatures. Moreover, IPCC does not provide any value.
• As regards, thermal power plant emission factors, their derivation can be seen in
MGM_BSL_LVyLH_EM.xls. For calculating emission factors of natural gas-based power plants the chemical composition of natural gas was considered taken into account that during the year power plants use different composition of natural gas, since it comes from different wells. Natural gas suppliers have contracts with generators such that differencies in LHV are penalized against the seller, so that generators are periodically monitoring the natural gas they buy. In MGM_BSL_LVyLH_EM.xls data on composition of natural gas was provided from http://www.ecopetrol.com.co.
• In the case of coal, LHV are average of the coal used in a year, which daily comes from
different mines and regions.
• In relation to neglect the contribution of methane emissions from the hydro plants displaced by the project, from the value F takes in the simulation, it can be seen that around a 40% of the energy generated by La Vuelta and La Herradura is associated to hydroelectric plants. It is approximately 90 GWh/year representing 10 MW of 100% utilization of a plant, which is equivalent to a flow less than 1.5 m3/s. It represents around 47 million m3/year of water. A typical hydro plant, Peñol, has 1,200 million m3
flooding an area of around 6,000 ha. It means that the amount implied by the project is around 0.4% of the Peñol’s reservoir. The methane originated from that is extremally small. Moreover, most reservoirs in Colombia and old ones, so that no methane emissions are in place. Thus, it is reasonable to neglect these emissions, moreover considering that errors involved in emission calculation of the other relevant effects are surely higher than emissions coming form methane of reservoirs.
• The use of the simulation model can be considered as a very good approach for this
project since it is the same model used by all the generators. CND provides thedatabase of all inputs necessary to run the simulation model. CND uses this model to calculate the payment to capacity. There is money involved on that, so that generators are continuously running the model and auiting the database updated by CND in order to calculate fixed costs.
• Hydrology is provided by regional stations connected through a network and satellite,
with more than 40 years of experience. Moereover, many plants have their own hydrological station, so that historical databases are highly reliable.
• Transmission losses are simulated by the model and it is an important fact since
generation to be monitored is greater than the one needed to satisfy the demand, precisely as a consequence of losses. Therefore, in order the model represents more accurately real conditions, losses must be taken into account.

La Vuelta and La Herradura Hydroelectric Project
- 65 - MGM International, Ltda. Copyright (2003) All Rights Reserved
• Generation cost are informed by geenratos to CND, including operation and
maintenance cost. These data is also available.

La Vuelta and La Herradura Hydroelectric Project
- 66 - MGM International, Ltda. Copyright (2003) All Rights Reserved
F. Environmental impacts F.1. Documentation on the analysis of the environmental impacts, including transboundary impacts EE.PP.M has commissioned Integral Ingenieros Consultores to perform the environmental impact studies for La Vuelta and La Herradura project, complying with a requirement settled by the Colombian government for hydroelectric works. The specific documentation can be found mainly in two reports: • “Desarrollo Hidroeléctrico del Río Herradura: Proyecto La Herradura, Estudio de Impacto
Ambiental, Informe Final” (December 1996, Medellín) by Integral Ingenieros Consultores for Empresa Antioqueña de Energía (EADE).
• “Desarrollo Hidroeléctrico del Río Herradura: Proyecto La Vuelta, Estudio de Impacto Ambiental, Informe Final” (August 1996, Medellín) by Integral Ingenieros Consultores for Empresa Antioqueña de Energía (EADE).
Information regarding the Environmental Management Plan Following is included in a separate document (MGM_EPM_SD.doc). F.2. If impacts are considered significant by the project participants or the host Party: Summary of the Environmental Impact Studies for La Vuelta and La Herradura Hydroelectric Subprojects Considering its historical commitment with the environment, recently ratified with the approval of the environmental policy of Empresas Públicas de Medellín E.S.P., in order to incorporate the environmental variable to the development of all its project works or activities, during 1996, environmental impact studies for each one of the projects25 were carried out, taking into account the following general criteria:
• Maximum security, as much for the stability of the works as for the area in which they are located.
• Rational use of the hydraulic resource from the environmental, technical and economic point of view.
• Best use of available fall, causing the smallest possible impact on the landscape. • Minimum environmental impact due to construction and operation of the project.
These studies determined that the area where the projects are located are highly mountainous, with steep slopes, formed mostly by sedimentary and igneous rocks in active process of erosion. These are highly exploited areas, where the natural terrestrial ecosystems were turned into farming activities for subsistence and paddocks for extensive cattle raising. This has drastically changed the diversity and abundance of the wild and native flora and fauna, although some species in danger of extinction that have survived, will not be in danger because of the projects. Such modifications could be made due to the absence of naturally protected ecosystems,
25 Empresa Antioqueña de Energía, Integral Ingenieros Consultores, La Vuelta Hydroelectric Project Environmental Iimpact Study, August 1996. Empresa Antioqueña de Energía, Integral Ingenieros Consultores, La Herradura Hydroelectric Project Environmental Impact Study, December 1996.

La Vuelta and La Herradura Hydroelectric Project
- 67 - MGM International, Ltda. Copyright (2003) All Rights Reserved
although in the upper part of the basin, the National natural Park “Las Orquídeas”, which will not be affected by the project, can be found. As regards water quality, it has been determined that even when most streams are polluted specially due to coliforms, the macro-invertebrates in streams are clean waters indicators, with low occurrence and diversity. The area of the projects does not have wetlands ecosystems that can be affected. The use of natural resources between local communities and projects did not cause neither conflicts nor relevant displacement of anthropogenic activities. On the contrary, there have been benefits or positive impacts such as generation of local employment during construction stage, generation of economic resources for the three municipalities of the area of influence on law transfers for energy sales (3% of gross sales), the payment of industry and trade taxes and property tax. Likewise, energy efficiency due to the optimization of the regional electric system will be improved, and the generation supplied by the localization of small generation centrals near consumption centers such as Urabá region will be favored. Additionally, the projects will provide works of infrastructure to the region, mainly roads, favoring local development and access to basic health and education services, and trading of agricultural products. In the project area, there are no native or black communities, but only rural communities. Since there are no regulation reservoirs associated to the projects, massive population removals will not take place. Only three dwellings will be removed, mainly for security reasons, since they are located on the edge of the new roads slopes. These families will be resettled within the same grounds, keeping their own place, therefore minimizing completely the uprooting effect. In the archaeology studies a few remains were mentioned (depressions and hillocks, dwelling sites and interments) and it was necessary to perform more detailed archaeology surveying studies to define the importance and the type of intervention to be implemented during the construction phase. In agreement with this highly exploited environment and the projects’ characteristics (small centrals, no reservoirs, etc.), it was concluded that no significant environmental impacts that are unacceptable or that make the projects unfeasible will be generated, being the following the most relevant:
• Reduction of water flows in two sections of La Herradura river due to diversion of flows to power house penstock, affecting the water ecosystem and the quality of the landscape (these two natural elements do not hold relevant connotations).
• Increase of water flows in a sector of Cañasgordas river (approx. 8.5 km) due to La Herradura plant discharge, generating graduation and bed undercut processes.
• Air contamination through noise and dust for the grinding plant operation, the mixing of concrete and the increase in the transportation of machinery, materials and equipment.
Environmental management plans comprising procedures for the management of impacts, monitoring and follow-up programs and contingency plans were proposed in order to guarantee the implementation of the project in the framework of sustainable development and according to evaluation results. The costs of these plans have been duly included in the costs of the project. According to the information obtained from Environmental Impact Studies, the Compañía Antioqueña de Energía (EADE), initial owner of the projects, arranged the environmental licenses with Urabá Environmental Corporation for Sustainable Development (Corpourabá), environmental authority in the region, granting them through Resolutions Nº 194197, October

La Vuelta and La Herradura Hydroelectric Project
- 68 - MGM International, Ltda. Copyright (2003) All Rights Reserved
27, 1997 and 159397, August 21, 1997, which were given, later on, to Empresas Públicas de Medellín E.S.P., through Resolutions 702 and 402 of January 8, 2002. The environmental requirements demanded by Colombian legislation for these type of projects are, therefore, being fulfilled. Finally, the characteristics and dimensions of the projects, together with the environmental characteristics of the region where they are being developed, generate low scale impacts successfully managed or compensated. This can be demonstrated since the environmental authority has granted them the environmental license for its development. Positive impacts for the region are generated with the construction and functioning of the project, as previously mentioned, specially from the social point of view, emphasizing the transfers payment to the municipalities and Corpourabá, estimated at US$ 200,000/yearly during the project lifetime. The environmental and social performance of the project is controlled under the Following of the Environmental Management Plan. The main parameters under periodic monitoring are: Environmental parameters:
• Water quality: using the Languelier index, considering pH, alkalinity, hardness and dissolved solids as the main parameters. The analysis follows standard international procedures (AWWA, APHA and WPSF).
• Superficial water quality during the construction phase. The quality of superficial water of La Herradura river is monitored according to international NFS quality river index, considering pH, turbidity NTU, temperature, solids, dissolved oxygen, biochemical oxygen demand, nitrates, phosphates, and coliforms as main parameters. The analysis follows standard international procedures (AWWA, APHA and WPSF). Nine measurement stations were placed on La Herradura and Cañasgordas rivers.
• Air quality: the main air pollutant considered is particulate matter (PM), monitored through 24 hours sampling during 8 days every six months in two sites located close to the trituration plant and concrete blending. Output is going to be expressed in daily averages, in order to ensure the compliment of Decree 02/1982 of the Ministry of Health (PM levels must be lower than 400 µg/m3 at 25ºC and 760 mmHg). The equipment to be used for suspended PM is HI-VOL, standardized by the US Environmental Protection Agency.
Into the social issues some topics are under control:
• Protection of the archeological heritage: devoted to recover pre-Hispanic cultural material which can be affected by removal works and excavations. An archeologist is controlling the procedures.
• Contingency plan: based on a contingency prevention program to give assistance in emergencies and take corrective actions under unforeseeable facts. An emergency brigade is destined to provide attention with the participation of the trained local community. The team is trained to be ready to active a series of preventing measures and controlling procedures to mitigate unforeseeable events derived from the construction, anthropogenic actions, and external agents. In order to be able to give an immediate response the team must be prepared to predict dangerous situations, perform risk analysis, recommend preventing norms, design alarming system to detect the beginning and follow the evolution of an emergency, prepare corrective action procedures, and coordinate infrastructure and human resources to attend the emergency. Three groups were created each one attending a previously identified set of potential contingencies of each construction phase. Social contingencies, associated to labor situations, are also included in the plan in order to quickly inform to the corresponding authorities.
• Training, education and outreach programs: a social management plan is implemented in order to provide capacity building to the local community and follow its grade of involvement in the project activity. A set of periodic surveys is developed each three months.
• Social indicators (employment generation, satisfaction level, economic growth of the regional economy) are also periodically registered.

La Vuelta and La Herradura Hydroelectric Project
- 69 - MGM International, Ltda. Copyright (2003) All Rights Reserved
A detailed description of these issues is beyond the scope of the current PDD and it is left to be inspected by the operational entity in charge of the project verification. The complete information can be found in “Desarrollo Hidroeléctrico del Río Herradura: Proyecto La Herradura, Estudio de Impacto Ambiental, Informe Final” (December 1996, Medellín) by Integral Ingenieros Consultores for Empresa Antioqueña de Energía (EADE) and “Desarrollo Hidroeléctrico del Río Herradura: Proyecto La Vuelta, Estudio de Impacto Ambiental, Informe Final” (August 1996, Medellín) by Integral Ingenieros Consultores for Empresa Antioqueña de Energía (EADE).

La Vuelta and La Herradura Hydroelectric Project
- 70 - MGM International, Ltda. Copyright (2003) All Rights Reserved
G. Stakeholders comments G.1. Brief description of the process on how comments by local stakeholders have been invited and compiled: The process followed to collect stakeholder comments was a consultation through a survey for the evaluation of the environmental performance of La Vuelta and La Herradura subprojects. The following set of questions was sent to local stakeholders, during May and June, 2003:
1. Do you believe that the socio-economic situation of the region will improve due to the implementation of “La Vuelta” and “La Herradura” hydro projects?
2. Is the implementation of projects able to improve the environmental situation in the region?
3. How does the development of projects affect you (positively or negatively) or on your environment?
4. Would you recommend private companies or authorities to develop projects of this nature?
5. Do you think “La Vuelta” and “La Herradura” will contribute to the Sustainable Development of Colombia?
6. Any additional comments you would like to make. The surveys addressees were:
1. Dr. Adiela Reyes Collazos. Head of Planning at Frontino Municipality and Member of
the Supervising Committee for the Hiring of the Project Staff. 2. Dr. Diana Jannet Zapata. Frontino Municipality Representative and Member of the
Supervising Committee for the Hiring of the Project Staff. 3. Tech. Elkin Jaramillo Vergara. Director of the Farming and Environment Technical
Assistance Unit of Frontino Municipality. 4. Eng. John Fredy Cardona. Manager of the Far East Public Administration Company –
Empucol Ltd. (a company belonging to the municipalities of the region). 5. Dr. Rubén Rojo Moreno. Mayor of Abriaquí Municipality. 6. Soc. Doris Eugenia Montoya Álvarez. Community Development of the Abriaquí
Municipality. 7. Eng. Jairo de Jesús Ortiz Rojas. Head of Planning of Cañasgordas Municipality and
Member of the Supervising Committee for the Hiring of the Project Staff. 8. Tech. Humberto Quintero Manco. Head of Public Works at Cañasgordas
Municipality and Member of the Supervising Committee for the Hiring of the Project Staff.
9. Ms. Elvia Rosa Ramos Henao. Corregidor at Abriaquí Municipality and Member of the Supervising Committee for the Hiring of the Project Staff.
10. Mr. Luis Fernando Zapata. Mayor of Cañasgordas Municipality. 11. Eng. Edison Isaza Ceballos. Manager of Corpourabá at Urabá region.
G.2. Summary of the comments received: A synthesis of the comments received is summarized in Table 12. The most important point highlighted by local stakeholders is added to the answers.

La Vuelta and La Herradura Hydroelectric Project
- 71 - MGM International, Ltda. Copyright (2003) All Rights Reserved
Table 12: Stakeholder comments
Persons
Questions
Manager Empucol Ltd.
Head of Planning Frontino
Representative Frontino
Director of Farming and Environment
Manager Corpourabá
Do you believe that the socio-economic situation of the region will improve due to the implementation of “La Vuelta” and “La Herradura” hydro projects?
yes, employment generation and improvement of regional economics
yes, social and economics improvements
yes, under correct funds destination
yes, employment generation
yes, employment generation
Is the implementation of projects able to improve the environmental situation in the region?
indifferent yes, reforestation yes yes yes, under right use of electric sector transferences
How does the development of projects affect you (positively or negatively) or on your environment?
positively positively positively, under correct use of royalties
positively, strengthening of the region
Would you recommend private companies or authorities to develop projects of this nature?
yes Yes yes, improvement of life quality yes yes, contribution to
the electricity system
Do you think “La Vuelta” and “La Herradura” will contribute to the Sustainable Development of Colombia?
yes yes yes yes yes, depending on political decisions
Any additional comments you would like to make
needs for more investments high employment rate helping regional
development

La Vuelta and La Herradura Hydroelectric Project
- 72 - MGM International, Ltda. Copyright (2003) All Rights Reserved
Persons
Questions Corregidor Abriaquí Head of Planning
Cañasgordas Head Pub. Works Cañasgordas Mayor of Abriaquí Representative
Abriaquí
Do you believe that the socio-economic situation of the region will improve due to the implementation of “La Vuelta” and “La Herradura” hydro projects?
yes, economic improvement
yes, socioeconomic development
yes, under following of environmental plan
yes, employment generation and reforestation
yes, social: temporarily employment generation and economics: royal prerogatives
Is the implementation of projects able to improve the environmental situation in the region?
yes yes, good management plan
yes, under compliment of agreements with environmental authorities
yes, reforestation yes, adverse effects under control, reforestation
How does the development of projects affect you (positively or negatively) or on your environment?
positively positively, capacity building
positively, life quality improvement
positively, social investment and employment generation
yes, opportunity to learn about employment politics of EE.PP.M and capacity building
Would you recommend private companies or authorities to develop projects of this nature?
yes yes yes, under regional feasibility studies
yes, development must go on
yes, region with unsatisfied basic needs prior to the project
Do you think “La Vuelta” and “La Herradura” will contribute to the Sustainable Development of Colombia?
yes, new incomes for the region yes, renewable
energy
yes, clean energy source
yes, low environmental impact
yes, reforestation for all the region
Any additional comments you would like to make topographic
advantages
EE.PP.M has to support cultural activities
higher social investment due to the lack of economic resources
G.3. Report on how due account was taken of any comments received: The comments received by local stakeholders were highly positive. They were in line with a previous survey performed for identifying the main social and environmental concerns of local community, as a part of the environmental impact study and following tasks. The main issues and needs for corrective actions were already taken into consideration by EE.PP.M in order to comply with the Environmental Management Plan Following recommendations.

La Vuelta and La Herradura Hydroelectric Project
- 73 - MGM International, Ltda. Copyright (2003) All Rights Reserved
ANNEX 1: Contact information on participants in the project activity
Organization: EMPRESAS PÚBLICAS DE MEDELLÍN E.S.P. Street/P.O.Box: Carrera 58 N° 42-125 / P.O. Box: 940 Building: City: Medellín State/Region: Antioquia Postfix/ZIP: Country: Colombia Telephone: 011-57-54-3808080 FAX: E-Mail: URL: Represented by: Title: Ingeniero Salutation: Last Name: Rubiano Middle Name: Carlos First Name: Luis Department: Subgerencia Planeación Generación Energía Mobile: Direct FAX: 011-57-54-3806795 Direct tel: 011-57-54-3804230 Personal E-Mail: [email protected]

La Vuelta and La Herradura Hydroelectric Project
- 74 - MGM International, Ltda. Copyright (2003) All Rights Reserved
Organization: Electric Power Development Co., Ltd. Street/P.O. Box: 15-1, Ginza 6-Chome Building: City: Tokyo State/Region: Asia Postfix/ZIP: 104-8165 Country: Japan Telephone: (81.3) 3546-2211 FAX: E-Mail: [email protected] URL: www.jpower.co.jp/english/ Represented by: Title: Director, Climate Change Salutation: Last Name: Nonaka Middle Name: First Name: Yuzuru Department: Corporate Planning and Administration Dept. Mobile: Direct FAX: (81.3) 3546-9531 Direct tel: (81.3) 3546-9375 Personal E-Mail: [email protected]

La Vuelta and La Herradura Hydroelectric Project
- 75 - MGM International, Ltda. Copyright (2003) All Rights Reserved
ANNEX 2: INFORMATION REGARDING PUBLIC FUNDING No public funding is involved in the proposed project activity.

La Vuelta and La Herradura Hydroelectric Project
- 76 - MGM International, Ltda. Copyright (2003) All Rights Reserved
ANNEX 3: NEW BASELINE METHODOLOGY 1. Title of the proposed methodology: “Baseline methodology for displaced electricity generation in a centrally dispatched hydrothermal interconnected power system.” 2. Description of the methodology: 2.1. General approach ⊠⊠ Existing actual or historical emissions, as applicable; □□ Emissions from a technology that represents an economically attractive course of action, taking into account barriers to investment; □□ The average emissions of similar project activities undertaken in the previous five years, in similar social, economic, environmental and technological circumstances, and whose performance is among the top 20 per cent of their category. 2.2. Overall description (other characteristics of the approach): The methodology is based on a simulation of the centrally planned dispatch of all the power plants serving the interconnected national system, without and with the inclusion of the proposed project activity.
I. Methodological framework
First of all, it is necessary to identify the application field of this new methodology. a) Scope The methodology is applicable if three conditions are satisfied (key words are highlighted in bold): i) Electricity is supplied by independent producers, which deliver electricity by request of
the manager of the wholesale electricity market, to a centrally dispatched hydrothermal interconnected system, according to least costs of generation until satisfying the current demand.
ii) The project consist of a capacity addition to the interconnected system, through
renewable energy (although the methodology can also be applied to non-renewable projects that increase the efficiency of the system, e.g. an efficient combined cycle thermal power plant),
iii) The baseline corresponds to the scenario where the project activity is not carried out and
no other project is implemented instead of the project under consideration, so that its corresponding availability to generate electricity is not usable by the interconnected system to satisfy part of the electricity demand, and no other project covers this energy shortfall.

La Vuelta and La Herradura Hydroelectric Project
- 77 - MGM International, Ltda. Copyright (2003) All Rights Reserved
b) Additionality In fact, the approach must be in consonance with the additionality of the project, since the project is additional if emissions are reduced below those that would have occurred in the absence of the registered CDM project activity. Additionality and baseline are thus closely related to one and other. Nevertheless, in general, it is highly difficult that a methodology can assess additionality issues without appealing to project specific considerations. Some approaches commonly used to prove additionality in most cases are far from objective facts or even disconnected with project participants concerns regarding why they decided to go further with the project and why emission reductions would have not occurred in the absence of the registered CDM project activity. A specific CDM additionality test (as a sort of algorithm) for deciding to go ahead with a potential activity to turn it into a CDM project is mainly related to many aspects surrounding the project activity itself. Additionality has been already discussed at great length in Section B.4 for the particular case of the proposed project activity. The reasons given there are intimately connected with baseline determination, since it was shown which is the scenario that would occur in the absence of the project activity. Following the ideas exposed in such a section, it can be stated that this methodology applies to projects where no other option would replace the project itself and baseline emissions represent the amount of anthropogenic GHG emissions that are going to be displaced by the project activity. In order to provide an approach this proposal consists of presenting evidence that CDM has been determinant in deciding project implementation, e.g.
• Overcoming barriers to project implementation (political, social, financial, investment, economic, cultural, institutional, technological, due to prevailing practices, etc.);
• Taking risks under a difficult political situation; • Going ahead in spite of uncertain sectoral circumstances; • Facing financial unattractiveness; • Supporting project participants politics and sustainable development commitments; • Providing specific documentation or considering occasional disappointing
circumstances. • Issuing other relevant reasons considered by project participants.
In comparison with other alternatives the current proposal is quite simple and obeys factual matters. In contrast, it seems difficult to be convinced that by putting a number (derived from some algorithm, e.g. IRR, NVP, investment costs, hypothetical alternative projects, and so on) one can demonstrate project additionality. It is highly risky to rely on that number since it is often calculated to avoid any other justification and to hide the fact that the project obeys other causes, beyond the CDM requirement that it is essential to show that the project would have not been developed anyway. For example, hydroelectric projects generally involve higher investment costs compare to thermal power projects. But this is not enough to prove additionality. If it were the case, then it would be true that all investors would develop the same kind of projects, which is clearly wrong. Diversification is almost the most important aspect of successful business strategies. c) Baseline determination In order to estimate baseline emissions in the above mentioned electricity system, the calculation is made through a standard computer model (Stochastic Dual Dynamic

La Vuelta and La Herradura Hydroelectric Project
- 78 - MGM International, Ltda. Copyright (2003) All Rights Reserved
Programming, SDDP26), which takes into account all relevant information to simulate the system dispatch. It is one of the most widely used models for the kind of electricity system described above. Once the model was run a specific approach to deal with baseline emissions is established. The methodology is applied according to a series of straightforward steps (see item 6 below), after having defined the project boundary (see item 4 below).
II. SDDP simulation model
The model27 calculates the least-cost operational dispatch of a hydrothermal system in a stochastic way, taking into account:
• Hydro plants operating details (hydraulic balance, turbined outflow and storage limitations, safety volumes, spillage, filtration, etc.).
• Details of thermal plants (“commitment”, generation restrictions by group, cost curves, maintenance, fuel consumption, multi-fuel capability of thermal power plants, gas pipeline restrictions, etc.).
• Aspects of hydrological uncertainty: a stochastic model of flows representing the hydrological characteristics of the system can be used (seasons, spatial and temporal flows dependence, droughts, etc.), or historical sequences, or specific hydrology models which take into consideration, for instance, El Niño phenomenon.
• Details of the transmission system: Kirchhoff laws, power flux limits in each circuit, losses, safety restrictions, exporting and importing limits by electric area, etc.
• Demand variation by bar and by block of the system along monthly or weekly stages (mid- or long term-studies) or at hourly level (short-term studies).
The model outputs are in ASCII files, that can be directly managed or through a graphic interface with MS Excel link. The main results are:
• Operating statistics: hydro and thermal generation, operating costs of thermal plants, energy exchange, fuel consumption, deficit risks and non-supplied energy for each stage at annual level; statistics are presented through averages, standard deviation, histograms, excess probabilities, minimum and maximum observed; results are presented by items (by demand block, by plant and by circuit) or aggregated at sub-system level (representing, for instance, a region or a company).
• Short-term marginal costs: these costs are used to represent purchasing and energy supply prices in the dispatch; statistics are presented through averages, standard deviation, minimum and maximum observed; results are presented by items (by demand block, by plant and by circuit) or aggregated at sub-system level (representing, for instance, a region or a company).
26 SDDP is a model developed by PSR Inc. and can be consulted at www.psr-inc.com.br/sddp.asp. SDDP has been licensed by utilities and agencies of several countries, including Argentina, Bolivia, Brazil, Chile, Colombia (under the name MPODE, Modelo de Planeamiento Operativo Dual Estocástico), the six countries in Central America, Spain and USA. SDDP has also been selected by CIER (Regional Electrical Integration Committee) as the operational planning tool to represent all South American countries in the gas/interconnection strategic evaluation. The same kind of model is already used by the Dispatch National Center (CND) to calculate the theoretical capacity value (CRT) in order to pay the capacity able to be required, with expected demand, expansion, and system parameters provided by UPME. 27 The SDDP User Manual can be obtained from the web: http://www.psr-inc.com.br/sddp_manual.asp.

La Vuelta and La Herradura Hydroelectric Project
- 79 - MGM International, Ltda. Copyright (2003) All Rights Reserved
• Marginal capacity costs: these costs estimate the operating benefit of increasing the installed capacity of a thermal plant, the turbined outflow limitations of a hydro plant or the storage capacity of a dam, and they are used to determine the maximum profitability additions of a system.
SDDP data is organized in two basic clusters:28
• mid-term – refers to all data for weekly or monthly hydrothermal scheduling, • short-term – refers to the data for hourly short-term scheduling in a given week or
month of the mid-term study horizon. The data in each cluster is in turn sub-divided into screens. For example, the mid-term scheduling data comprises:
• hydro plants, • thermal plants, • demand, • hydrology, • operation (execution options), • transmission (detailed network data), • interconnection (simplified transfer capacity among systems), • contracts.
After the directory is selected, the main screen appears, as shown next.
SDDP METHODOLOGY The methodology used to solve the optimum dispatch problem in electric generation systems is described below.
1. DISPATCH OF THERMAL SYSTEMS
28 Reproduced from the SDDP User Manual.

La Vuelta and La Herradura Hydroelectric Project
- 80 - MGM International, Ltda. Copyright (2003) All Rights Reserved
The economic dispatch problem of a thermal system presented below, consists of the minimization of the system operating cost subject to constraints given by the electricity demand and the generation limits. The operating dispatch is a linear programming problem (LP), which can be solved by means of available computational packages. In the simplest situation, the generation dispatch can be solved by loading the generators according to a criterion of increasing operating variable costs (by means of “a merit list”) until demand is satisfied. The last loaded unit is known as marginal generator. Besides the minimum operating cost, the LP minimum solution produces a set of simplex multipliers that measure the derivative of the operating cost with respect to a perturbation on the right side of each constraint. These multipliers correspond, in terms of the economic theory, to the short-term marginal costs of the system. Therefore, it is possible to estimate the spot price.
2. DISPATCH OF HYDROTHERMAL SYSTEMS As mentioned before, the thermal system dispatch can be solved by loading the plants increasingly with respect to the production cost until the demand is met. Although there are additional factors making this problem more complex (energy losses, limitations in the transmission lines, starting point costs, energy production variation rate, etc.), the thermal plant operation problem has the following basic characteristics:
• It is uncoupled in time, that is, an operating decision today, does not affect the operating cost in the next week;
• The units have a direct operation cost, that is, the operating cost of a unit depends only on its own generation level, and not on the generation level of the other units. Besides, the operation of a given unit does not affect the generating capacity or availability of another unit.
2.1 Hydrothermal systems operation 2.1.1 Time dependence of the operation The most evident characteristic of a system with hydroelectric generation is to be able to use the energy “without cost” stored in dams to meet the demand, avoiding fuel expenses with thermal units. However, the availability of hydroelectric energy is limited by the storage capacity of the dams. A dependence is introduced between the operating decision of today and the operating costs in the future. In other words, if we use today the hydroelectric energy reserves, in order to minimize thermal costs, and a severe drought takes place in the future, a high cost rationing might occur. (A prolonged use of this approach lead to the Brazilian power crisis of 2001.) If, on the other hand, we preserve the hydroelectric energy reserves by means of a more intensive use of thermal generation, and future affluences are high, a spillage in the system dams might occur, representing an energy loss and consequently, an increase in the operating cost. This situation can be seen in Figure A3.1.
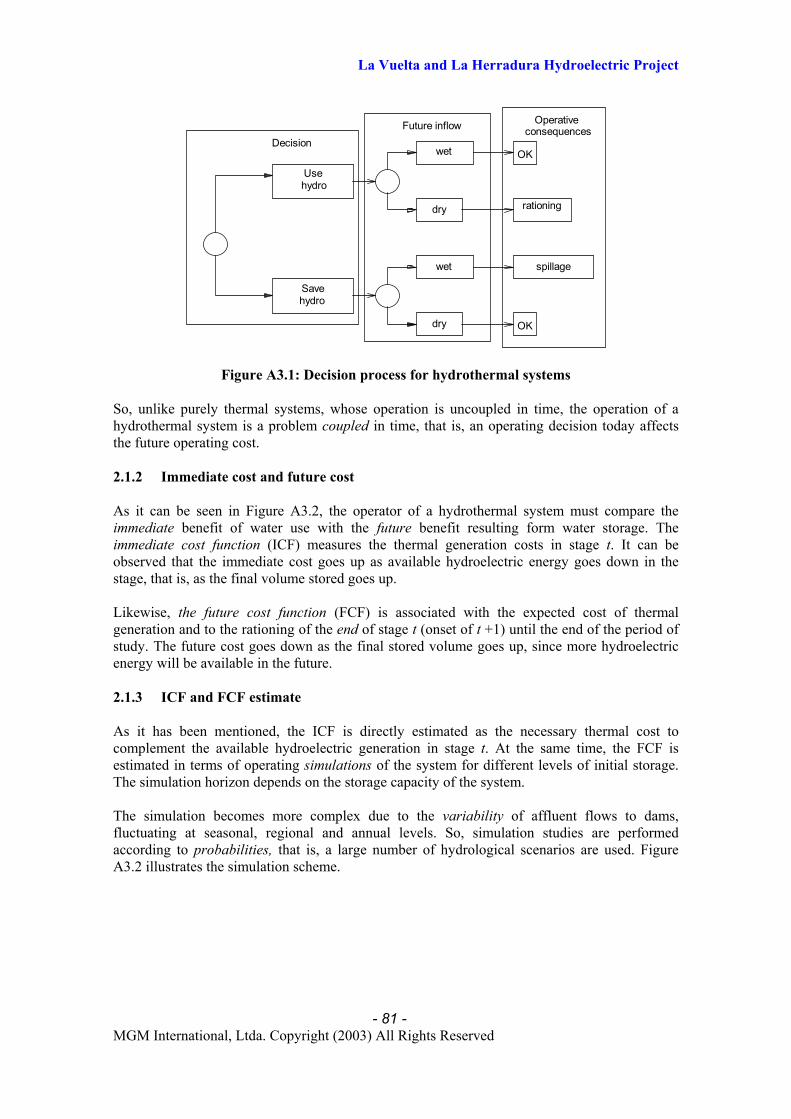
La Vuelta and La Herradura Hydroelectric Project
- 81 - MGM International, Ltda. Copyright (2003) All Rights Reserved
wet
dry
OK
rationing dry
wet
Future inflow
Use hydro
Decision
Save hydro
OK
Operative consequences
spillage
Figure A3.1: Decision process for hydrothermal systems So, unlike purely thermal systems, whose operation is uncoupled in time, the operation of a hydrothermal system is a problem coupled in time, that is, an operating decision today affects the future operating cost. 2.1.2 Immediate cost and future cost As it can be seen in Figure A3.2, the operator of a hydrothermal system must compare the immediate benefit of water use with the future benefit resulting form water storage. The immediate cost function (ICF) measures the thermal generation costs in stage t. It can be observed that the immediate cost goes up as available hydroelectric energy goes down in the stage, that is, as the final volume stored goes up. Likewise, the future cost function (FCF) is associated with the expected cost of thermal generation and to the rationing of the end of stage t (onset of t +1) until the end of the period of study. The future cost goes down as the final stored volume goes up, since more hydroelectric energy will be available in the future. 2.1.3 ICF and FCF estimate As it has been mentioned, the ICF is directly estimated as the necessary thermal cost to complement the available hydroelectric generation in stage t. At the same time, the FCF is estimated in terms of operating simulations of the system for different levels of initial storage. The simulation horizon depends on the storage capacity of the system. The simulation becomes more complex due to the variability of affluent flows to dams, fluctuating at seasonal, regional and annual levels. So, simulation studies are performed according to probabilities, that is, a large number of hydrological scenarios are used. Figure A3.2 illustrates the simulation scheme.

La Vuelta and La Herradura Hydroelectric Project
- 82 - MGM International, Ltda. Copyright (2003) All Rights Reserved
1 2 3 4 stage
spillage
rationing
replaces thermal
generation
Maximum storage
Figure A3.2: FCF estimate In practice, future cost functions are estimated through a recursive procedure called stochastic dynamic programming, discussed in detail in Subsection 3. 2.1.4 Marginal value of water The optimum use of stored water corresponds to the point that minimizes the sum of future and immediate costs. As it is shown in Figure A3.3, the point of minimum global cost is also where ICF and FCF derivatives with respect to storage are equal. These derivatives are known as water values.
ICF
FCF
Final volume
Water value
ICF + FCF
Optimal decision
Figure A3.3: Optimal water use
To summarize, unlike thermal plants, which have a direct operating cost, hydro plants have an indirect value, associated with the fuel economy of the thermal plants displaced today or in the future. The best use of water is obtained when the immediate and future values of water are balanced. 2.2 One-stage hydrothermal dispatch The estimate of the best operating decision for each stage is now detailed, supposing the future cost function is already known. In the next section, the estimate procedure of the FCF itself is discussed.

La Vuelta and La Herradura Hydroelectric Project
- 83 - MGM International, Ltda. Copyright (2003) All Rights Reserved
The problem of hydro dispatch for stage t is stated as the minimization of the immediate operating costs sum, given by thermal costs in stage t in addition to the FCF future expected cost, subject to the following operating restrictions:
• Hydraulic balance • Turbined outflow and storage limits • Thermal generation limits • Supplying the demand
a) Future cost function The dependence between future cost and storage level at the end of the stage is quite intuitive. As it was discussed in Section 2.1.2, the future cost goes down as final stored volume goes up, since more hydroelectric energy will be available in the future. Likewise, the dependence between the future cost and affluences of stage t is due to the temporal correlation of flows in consecutive months.29 In other words, the wet flow in stage t indicates that the average flows from stage t+1 will also be wet. Consequently, emptying the dam today, if the flow observed was high, will be less expensive in the future than in the case of a low flow. b) Hydraulic balance As shown in Figure A3.4, the hydraulic balance equation relates the storage and input and output volumes of the dam: the stage t final volume (onset of stage t + 1) equals the initial volume minus the output volumes (turbining and spillage) plus the input volumes (lateral flows plus output volumes of the plants upstream).
Upstream outflow
Plant outflow
Lateral inflow
Figure A3.4: Reservoir water balance 2.3 Solution algorithm and marginal costs
29 A portion of the rain of each month does not go directly to the river, since it seeps into the ground and is stored in the so called underground water table. At the same time, the emptying rate of the water table in each month (feeding the affluent flow of rivers) depends on the integral of water seeped in the previous months (as if it were a capacitor). This makes the flow of a month to be affected by the values of the previous months, although the rain in different months may not be correlated.

La Vuelta and La Herradura Hydroelectric Project
- 84 - MGM International, Ltda. Copyright (2003) All Rights Reserved
The problem of one stage can be solved by a linear programming algorithm (LP). Besides the best operating decision, LP scheme estimates simplex multipliers, or shadow prices, associated with each restriction. In particular, the hourly spot price of the system is the simplex multiplier associated with the restriction of supply to the demand, and the value of water is the multiplier associated with the hydraulic balance equation.
3. ESTIMATE OF THE FUTURE COST FUNCTION 3.1 Stochastic dynamic programming As previously said, the operating decisions of a hydrothermal system is based on the equilibrium between the opportunity cost today and its future expected value, represented by FCF. This function is calculated through a recursive procedure called stochastic dynamic programming (SDP), whose most relevant steps are summarized below.30
a) For each stage t (normally a month or a week) define a set of states of the system, for instance, storage levels 100%, 90%, etc. until 0%. Figure A3.5 illustrates the definition of states for a dam. The initial storage of the first stage is supposed to be known.
1 2 t-1 t
System states (initial storage level)
for stage t
Initial state
Figure A3.5: Definition of system states
b) Initiate in the last stage t, and solve the dispatch problem of this stage supposing that the initial storage corresponds to the first level selected in step (a), for instance, 100%. Since it is in the last stage, the FCF is supposed to equal 0. Solve the dispatch problem for each one of the N flow scenarios for the stage. The scheme is shown in Figure A3.6.
1 2 t-1 t
One-stage problem Inflow scenario #1
One-stage problem
One-stage problem Inflow scenario #2
Inflow scenario #N
Figure A3.6: Optimal strategy calculation by scenario: last stage
c) Estimate the expected value of the operating cost associated with 100% level, as the average of the N sub-problem costs of a stage. Then, the FCF first point
30 For the sake of simplicity, the dependence regarding flows is not presented.
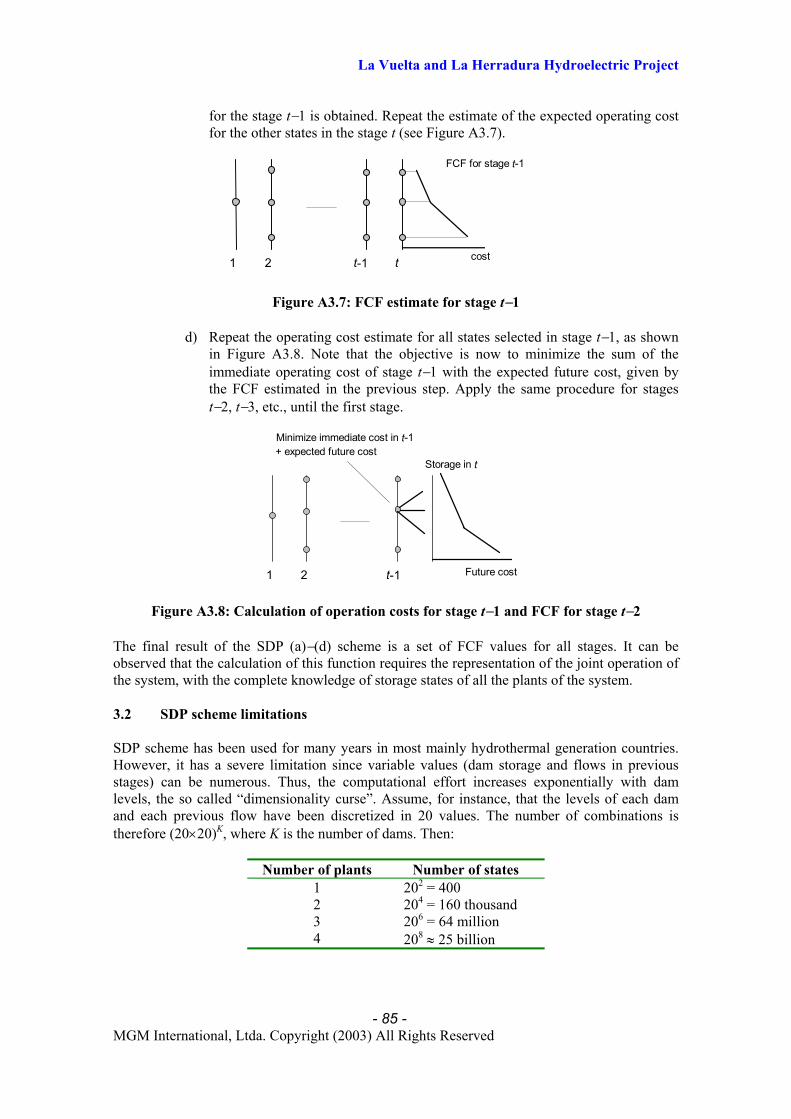
La Vuelta and La Herradura Hydroelectric Project
- 85 - MGM International, Ltda. Copyright (2003) All Rights Reserved
for the stage t−1 is obtained. Repeat the estimate of the expected operating cost for the other states in the stage t (see Figure A3.7).
1 2 t-1 t cost
FCF for stage t-1
Figure A3.7: FCF estimate for stage t−1
d) Repeat the operating cost estimate for all states selected in stage t−1, as shown in Figure A3.8. Note that the objective is now to minimize the sum of the immediate operating cost of stage t−1 with the expected future cost, given by the FCF estimated in the previous step. Apply the same procedure for stages t−2, t−3, etc., until the first stage.
1 2 t-1 Future cost
Minimize immediate cost in t-1+ expected future cost
Storage in t
Figure A3.8: Calculation of operation costs for stage t−1 and FCF for stage t−2 The final result of the SDP (a)−(d) scheme is a set of FCF values for all stages. It can be observed that the calculation of this function requires the representation of the joint operation of the system, with the complete knowledge of storage states of all the plants of the system. 3.2 SDP scheme limitations SDP scheme has been used for many years in most mainly hydrothermal generation countries. However, it has a severe limitation since variable values (dam storage and flows in previous stages) can be numerous. Thus, the computational effort increases exponentially with dam levels, the so called “dimensionality curse”. Assume, for instance, that the levels of each dam and each previous flow have been discretized in 20 values. The number of combinations is therefore (20×20)K, where K is the number of dams. Then:
Number of plants Number of states 1 202 = 400 2 204 = 160 thousand 3 206 = 64 million 4 208 ≈ 25 billion

La Vuelta and La Herradura Hydroelectric Project
- 86 - MGM International, Ltda. Copyright (2003) All Rights Reserved
Due to this computational limitation, it has been necessary to use approximations such as merging the dams of the system in a unique dam, representing the waterfall energy production capacity and the use of partial solution schemes (typically, estimate of separate future cost functions for each basin). When hydro plants were owned by the government, these approximation schemes were considered reasonable, since the entering into the system of the plants was in general associated with long-term contracts, and eventual differences of each individual plant production with respect to an ideal optimized dispatch would tend to be cancelled in time. However, the implementation of competitive schemes in many countries brought about several concerns:
• Unlike thermal systems, where the “spot” price estimate and its economic interpretation are direct, “spot” prices calculated for hydrothermal systems are difficult to explain and verify, since they reflect the expected value of opportunity costs along years and diverse hydrological scenarios.
• Since the entering into the system of plants depends on the product of “spot” prices times the individual generation, the modeling of the system needs to be detailed, preventing the use of aggregated models.
Therefore, there has been a renewed interest in the application of stochastic optimization algorithms able to manage hydrothermal system dispatch in detail. Guidelines for a solution algorithm called stochastic dual dynamic programming used in SDDP model, which has been implemented in several countries in Latin America, apart from USA, New Zealand,31 Spain, Norway and Australia,32 are presented below. 3.3 Dual Dynamic Programming The dual dynamic programming scheme is based on a step by step linear function; i.e. it is not necessary to interpolate values in a discretized table. It is also shown that the FCF slope around a point correspond to the expected values of water, corresponding in turn to simplex multipliers associated with hydraulic balance equations (see Section 2.3). Figure A3.9 illustrates the dual dynamic programming for the estimation of the expected operating cost and of the FCF slope for the last stage, initial storage = 100% (step (c) of the traditional dynamic programming procedure).
1 2 t-1 t cost
Expected operation cost
Slope = derivative of operation cost with respect to storage
31 The conceptual basis of dual dynamic programming schemes developed in New Zealand and Brazil is similar. New Zealand’s scheme is totally analytical but it is limited to two dams; in turn, the scheme developed in Brazil is iterative, but it can manage a very large number of dams. 32 An analogue procedure to dual dynamic programming called “Constructive dynamic programming” is being used.

La Vuelta and La Herradura Hydroelectric Project
- 87 - MGM International, Ltda. Copyright (2003) All Rights Reserved
Figure A3.9: Dual dynamic programming: first FCF segment calculation
Figure A3.10 illustrates the calculation of the operating cost and FCF slopes for each state in stage t. The resulting linear function by parts is FCF for stage t−1.
1 2 t-1 t cost
Piecewise future cost surface for stage t-1
Figure A3.10: Calculation of a linear FCF by parts for stage t−1 Apart from the FCF analytic representation, the dual dynamic programming uses an iterative optimization/simulation scheme to select only relevant states decisions. As a consequence, this makes possible to solve stochastic dispatch problems with a large number of dams, by means of a reasonable computational effort. 3. Key parameters/assumptions (including emission factors and activity levels), and data sources considered and used: The first set of key parameters is the one associated with input data to be loaded within the dispatch model. All necessary data must be provided by the manager of the wholesale electricity market or the governmental department in charge of the dispatch decisions (the national dispatch center or a similar body). In general, in centrally dispatched interconnected systems the data is loaded by the responsible for dispatch from information supplied by market operators (generators: e.g. power plant configurations and operating data, transmission companies: e.g. transmission line interconnections and grid arrangement, and distributors: e.g. contractual agreements). Other data is provided by national or regional centers taken as official sources, which in turn collect data from involved companies (e.g. fuel providers from which fuel costs are registered, hydrological stations or national or regional meteorological office from which hydrology is accounted for, etc.). There is not a unique rule to collect necessary data, but some recommendations are in place. They are mainly to find the way to have access to the database handled by the manager or responsible of the power plants dispatch. Usually, all generators have the possibility to acquire this information, which is a substantial part of their usual practices, since they need to know by themselves how to be prepared for delivering and selling electricity to the system. On the contrary, the methodology is too hard to be applied. These parameters are pointed out in Table A3.1.
Table A3.1: Parameters of the model (configuration input data)33 TOPIC PARAMETERS
33 SDDP User Manual.

La Vuelta and La Herradura Hydroelectric Project
- 88 - MGM International, Ltda. Copyright (2003) All Rights Reserved
5. HYDRO CONFIGURATION 5.1.2 Basic hydro plants data
Plant data is organized as follows: plant parameters: topological data, operating data
tables: storage vs. production, storage vs. area, storage vs. filtration storage vs. head, monthly evaporation coefficients.
5.1.3 Plant parameters – topological data
Number of hydrological station, number of downstream plant for spillage, switch for controllable spillage, number of downstream plant for turbining, number of downstream plant for filtration, number of generating units, regulation factor for run of the river (ROR) plants, construction status.
5.1.4 Plant parameters – operating data
Minimum turbining (m3/s), maximum turbining (m3/s), minimum total outflow (m3/s),production coefficient (MW/m3/s), minimum/maximum reservoir storage (hm3), installed capacity (MW), O&M cost ($/MWh), production factor depends on head difference, initial condition (storage or head), Spillage cost (k$/hm3), forced outage rate - FOR (%), composite outage rate - COR (%), generator outages sampling, production coefficient in the "backward" phase.
5.1.5 Hydro plant data tables
Production factor vs. volume, area vs. volume, filtration. vs. volume, head vs. volume, evaporation.
5.2 Maintenance There are two types of hydro maintenance information: 1. available: defines a value that remains after the maintenance 2. reduction: defines a value to be subtracted from the plant capacity Each maintenance type can in turn be expressed in terms of # of units, % of plant capacity, MW, .m3/s.
5.4 Irrigation Irrigation values (in m3/s). 5.5 Alert volume and minimum volume
Alert volume – the penalty cost in the automatic calculation option is 1.1 times the variable cost of the most expensive thermal plant. In other words, the program will only enter the alert zone to avoid an energy rationing, after all thermal plants are dispatched. Minimum volume – the penalty cost in this case is 1.1 times the rationing cost. As a consequence, the program will only violate this constraint if it is physically impossible to avoid it. This happens for example if the minimum curve boundary increases from one stage to the other and the inflow is not sufficient to meet the new (and higher) minimum volume.
5.6 Flood control storage
The user specifies the maximum reservoir storage that avoids downstream flooding in each stage.
5.7 Maximum total outflow
Allows the definition of chronological maximum outflow limits (sum of turbined and spilled flows) for each plant.
5.8 Minimum total outflow
Allows the definition of chronological minimum outflow limits (sum of turbined and spilled flows) for each plant.
6. FUEL 6.1.2 Basic fuel data Fuel identifier number, name, unit (ton, m3, gallon, etc.), Cost ($/unit), Modify 6.2 Fuel availability Total Consumption (in thousands of units of fuel per stage), Consumption
Rate (in units of fuels per hour) 7. THERMAL CONFIGURATION
7.1.1 Basic operating data
Minimum generation (MW), maximum generation (MW), number of units forced outage rate - FOR (%), composite outage rate - COR (%), number of alternative fuels, commitment (two options) , plant type (standard, must- run and benefit), construction status , generator outage sampling
7.1.2 Fuel consumption
Fuel code, variable O&M cost ($/MWh), fuel transportation cost ($/unit)
7.1.3 Multiple fuels A dual (or triple) fuel plant is represented as two (or three) separate plants with the same basic parameters (installed capacity, number of units, O&M cost, outage rate etc.). The only difference is in the efficiency curve and, naturally, the fuel used.

La Vuelta and La Herradura Hydroelectric Project
- 89 - MGM International, Ltda. Copyright (2003) All Rights Reserved
7.2 Maintenance Thermal plant maintenance data is handled in the same way as hydro plant maintenance
7.4 Minimum generation
Data of minimun generation
8. HYDROLOGY There are three activities in this module:
Inflows - edit the historical inflow record. Parameters - calculate the stochastic streamflow model parameters. Reduced uncertainty - define different stochastic inflow parameter files for different periods.
8.1 Inflow records Adding hydrological station 8.2 Parameter estimation for the stochastic inflow model
The hydrologic parameters screen has a list with all hydro stations included in the hydrological record data set.
8.3 Reduced uncertainty
Allows the use of different stochastic inflow model parameters for different stages of study period.
9. LOAD 9.1 Medium/long term load
An Excel-like table presents the load (in GWh) for each block and stage. The duration of each load block is given as a % of the stage duration. Of course, the sum of durations be 100%.
9.2 From hourly load to load block
Block, Duration, Value (GWh) NOTE: d(t) is the number of hours of the stage (month, week, etc.).
9.3 Generation reserve
Generation reserve is a percentage of system load; generation reserve can compensate the outage of any generation unit that does not belong to the reserve subset; generation reserve can compensate the outage of any generation unit that belongs to the reserve subset.
9.4 Hydro spinning reserve
Defines the spinning reserve constraint for each hydro plant. These limits are given in MW for each stage (weekly or monthly) and load block. The spinning reserve is an operating margin that allows the adjustment of the programmed operation with respect to the real time operation. The reserve is represented as a value that is subtracted from the maximum plant capacity.
9.5 Thermal spinning reserve
Spinning reserve data is handled in the same way as in the hydro case
9.6 Generation constraints
This type of constraint may be required to represent voltage support or system security (stability) in a given area:
10. TRANSMISSION There are two mutually exclusive alternatives for representing transmission
aspects: linearized power flow model AND interchange model 10.1 Linearized power flow model
There are eight activities in this module, corresponding to the definition of existing configuration and future additions or modifications of the following data: bus, circuit, DC links, constraints on area import/export
10.2 Bus data The generation data associated with each bus includes: area – used to define power import/export constraints hydro plants connected to the bus thermal plants connected to the bus
For each bus m and load block k, the user provides three values, all in MW:
10.3 Circuit data The basic circuit data comprises: circuit resistance (%), circuit reactance (%), flow limit - base case (MW), flow limit - post-contingency situation (MW), circuit type - Existing - circuit is included in the initial configuration; Future - construction date will be informed in the corresponding Modifications file. security constraints

La Vuelta and La Herradura Hydroelectric Project
- 90 - MGM International, Ltda. Copyright (2003) All Rights Reserved
DC links are characterized by the following parameters: number, name, FROM bus, TO bus, flow limit (MW) in the FROM TO direction, loss factor (p.u.) in the FROM TO direction
10.4 Interconnection model
System interconnections are characterized by the following parameters: number, name, FROM system, TO system, power exchange capacity (MW) in the FROM TO direction per load block, loss factor (p.u.) in the FROM TO direction, power exchange capacity (MW) in the TO FROM direction per load block, loss factor (p.u.) in the TO FROM direction
11. CONTRACTS 11.1 Contract types Three types of contracts can be modeled in SDDP:
a) take or pay b) energy per block c) energy integral
Information needed: contract name, initial and final contract dates, maximum contracted power (MW), maximum contracted energy (GWh), Price 1 ($/MWh), Price 2 (optional) ($/MWh), Number of de cycles (only for energy integral contracts)
11.2 Take or pay contracts
In take or pay contracts, the user “pre-pays” for an energy per stage of E MWh with a maximum instantaneous power of P MW.
11.3 Energy block This contract also provides an energy amount of E MWh with a maximum instantaneous power of P MW in each stage.
11.4 Integral contracts
An integral contract provides an energy amount of E MWh with a maximum instantaneous power of P MW, with variable charges of $C1/MWh up to the contracted energy and $C2/MWh for the additional energy. However, differently from the previous case, the contracted energy can be used along several stages, as defined in the contract; it is not limited to one stage.
Besides the parameters used as input data for the simulation model the other key parameters are those related to emissions calculation. Specifically, generation of thermal plants, gn+, generation of the project gP, and emission factors of thermal power plants efn. For the latter lower heating values of fuels used, LHVf, fuel emission factors, EFf, for carbon dioxide, methane and nitrous oxide, and specific consumptions of thermal power plants, scn, are needed to estimate GHG emission factors. In some cases, physical properties and chemical composition of the fuels may be required or occasionally annual fuel consumption of the thermal plants. It depends on the manner relevant data are collected from available sources. Activity levels are those related to electricity generation of the thermal plants serving the system and the project itself; other parameters are already included in the modeling input data (projected demand, system expansion, fuel prices, generation costs, etc.). From the environmental impact point of view, water quality is an important parameter to be periodically monitored, as well as, other relevant indicators, such as those related to social and economic development of the region in which the project operates. Key factors associated with emissions from transportation of material and people in the construction phase, from concrete used in the construction, and methane released from reservoirs can also be expressed in term of the emission factors of fuels, cement and flooded areas, respectively. Because the corresponding emissions are usually very small, adequate data source include the National GHG Inventory and default emission factors, such as those compiled in the Revised 1996 IPCC Guidelines for Greenhouse Gas National Inventories. These factors are key parameters of the project and not the baseline and they are included here for the sake of completeness.

La Vuelta and La Herradura Hydroelectric Project
- 91 - MGM International, Ltda. Copyright (2003) All Rights Reserved
Table A3.2 summarizes the key parameter information associated with activity levels.
Table A3.2: activity level parameters parameter unit Data source
1. Project sponsor 2. Dispatch Center
Project generation: gP
GWh
3. National statistics 1. Dispatch Center 2. Generators
Generation of power plants serving the system: gn
GWh
3. National statistics 1. Generators 2. Dispatch Center
Specific consumptions of power plants serving the system: scn
tonne (coal) or m3 (natural gas) or l (liquid fuels) 3. Distributors
Regarding emission factors the key parameters are summarized in Table A3.3. It leaves a row to add other fuels.
Table A3.3: emission factors key parameters
Fuel GHG Source Variable
name Emissions
factor
Data sources. No. indicates data priority. No. 1 is best, if data not available, choose No. 2, and if not available, choose No. 3.
1. National GHG inventory 2. IPCC, fuel type and technology
specific
Coal CO2 Combustion CEFf, f=coal
kg CO2 per GJ LHV basis
3. IPCC, near fuel type and technology 1. IPCC, fuel type and technology
specific CH4 Combustion MEFf,
f=coal kg CH4 per TJ LHV basis
2. IPCC, near fuel type and technology 1. IPCC, fuel type and technology
specific N2O Combustion NEFf,
f=coal kg N2O per TJ LHV basis
2. IPCC, near fuel type and technology 1. National GHG inventory 2. IPCC, fuel type and technology
specific
Natural gas
CO2 Combustion CEFf, f=NG
kg CO2 per GJ LHV basis
3. IPCC, near fuel type and technology 1. IPCC, fuel type and technology
specific CH4 Combustion MEFf,
f=NG kg CH4 per TJ LHV basis
2. IPCC, near fuel type and technology 1. IPCC, fuel type and technology
specific N2O Combustion NEFf,
f=NG kg N2O per TJ LHV basis
2. IPCC, near fuel type and technology Other
4. Definition of the project boundary related to the baseline methodology: According to the baseline assumptions and additionality issues, the project boundary only accounts for the physical location and those aspects within reach of the project, which are undoubtedly under the strict control of the project participants. For this kind of systems, participants can only directly control their own project activities, while what happens within the interconnected system is not under their domain.

La Vuelta and La Herradura Hydroelectric Project
- 92 - MGM International, Ltda. Copyright (2003) All Rights Reserved
In this case what the baseline must establish are the emissions that would have occurred without the project implementation but only associated with it, not to the whole system. Thus, if the project were not implemented what would be about to be emitted is only the proportional part to the one that would be covered by the project, i.e. emissions associated with the displaced thermal energy in the system. This project boundary definition is the one that can be best identified with the concept “under the control of the project participants.” Figure A3.11 shows the project boundary. Boxes labeled “GHG” stand for emissions from fossil fuel combustion.
Figure A3.11: Project boundary. Dashed red line indicates the project boundary.
Sources of anthropogenic GHG emissions that are measurable and reasonably attributable to the CDM project activity: Before determining sources and GHG it is appropriate to review the definitions used in this methodology (which are obviously in agreement with the Marrakech Accords definitions, but it is useful to recall them again). Definition 1: The project boundary includes all anthropogenic GHG sources under the control of the project participants. Definition 2: Anthropogenic GHG emissions occurring inside the project boundary are called direct emissions. There are two types of direct emissions. Definition 3: Direct on-site emissions are anthropogenic GHG emissions released by sources located inside the physical location of the project, which is in turn inside the project boundary. Definition 4: Direct off-site emissions are anthropogenic GHG emissions released by sources located outside the physical location of the project, but these sources still are inside the project boundary.
Project
Flooded areaCH4
Transport Construction
GHG
Interconnected Electric Power
System
Generation and Transmission
End users
GHG GHG
Project boundary
Direct on-site
Direct off-site
Direct on-site
Indirect off-site (leakage)

La Vuelta and La Herradura Hydroelectric Project
- 93 - MGM International, Ltda. Copyright (2003) All Rights Reserved
Definition 5: Leakage is defined as the net change of anthropogenic emissions by sources of GHG which occurs outside the project boundary. Leakage includes two types of emissions. Definition 6: Indirect on-site emissions are anthropogenic GHG emissions which are not under the control of the project participants and occurs inside the physical location of the project activity. These emissions are considered leakage. Definition 7: Indirect off-site emissions are anthropogenic GHG emissions which are not under the control of the project participants and occurs outside the physical location of the project activity. These emissions are also considered leakage.
• Sources included in the project boundary and associated GHG: The sources of anthropogenic GHG included in the project boundary (under the control of the project participants) are:
- Reservoir from which methane emissions are generated as a consequence of organic
matter decomposition in flooded areas by the project. The emissions are a direct consequence of the project implementation. Even if these are uncontrollable emissions they are under the strict responsibility of project participants, who decide the characteristics of the reservoir (area, depth, etc.). These CH4 emissions belong to the direct on-site category defined above.
- Vehicles and machinery used during the construction phase of the project. These sources are directly associated with the project and are under the control of project participants. These can be fixed or mobile sources placed inside or outside the physical location of the project. For the sake of simplicity, their corresponding emissions (CO2, CH4, and N2O) originated in fuel combustion are going to be considered as direct on-site GHG emissions.
- Concrete used in the construction of the power plant. Actually the concrete is not a source. The source is the cement plant that manufactures the concrete used in the construction, which is outside the physical location of the project and are not under the strict control of the project participants. However, its CO2 emissions can be considered as direct off-site GHG emissions, under the control of project participants, since it is assumed that the controlled amount of concrete used by the project activity produces emissions for exactly this amount, originated in a standard manufacturing process.
In order to generalize the methodology to a broader class of projects, other sources and GHG can be considered, to include other renewables (e.g. wind) and eventually highly efficient thermal power plants (e.g. combined cycle, if additionality can be justified). The current methodology is mainly described for hydroelectric projects, but it is not exclusive. If the project corresponds to the installation of a thermal plant its direct emissions from having burnt fossil fuel (mainly natural gas), should be included as direct on-site emissions.
• Sources outside the project boundary and associated GHG emissions (leakage): Leakage are emissions that take place as a consequence of the project activity. Such emissions include those associated with the displaced energy generation of the whole interconnected system. Specifically, emissions are produced by
- Thermal power plants serving the centrally dispatched interconnected system. These are CO2, CH4, and N2O indirect off-site emissions, which are not under the control of project participants.

La Vuelta and La Herradura Hydroelectric Project
- 94 - MGM International, Ltda. Copyright (2003) All Rights Reserved
In a strictly rigorous and highly refined approach, displaced hydroelectric energy in other power plants allows the possibility of water storage by those plants. Depending on the way this water is stored, additional methane emissions can arise. If this were the case, these emissions could be also included as indirect off-site emissions. However, in most cases these methane emissions are negligible. This is clearly a second-order effect in this methodology. It is only mentioned in order to account for all possible sources of GHG but it is not proposed any approach for dealing with this. Comparing this emission contribution with the errors involved in the relevant emissions from other sources, it can be decided if methane emissions from hydro plants are non sense within this framework. This cannot be established through an algorithm proposed by the methodology; it is actually project-specific and we are also awaiting international scientific consensus on the appropriate or modeling of methane emissions from reservoirs (see discussion in Section E.1 of the PDD). 5. Assessment of uncertainties: There are two categories of uncertainties in this methodology. Because a software is involved, there are standard uncertainties addressed by the software developers, related to the input data handled to run the simulation model. The SDDP User Manual can be looked up at http://www.psr-inc.com.br/sddp_manual.asp. The other type of uncertainties is the one related to variables and parameters used to determine baseline and project emissions after model outputs were obtained. Handling simulation model uncertainties: In the first case, the model is flexible to be adapted to particular needs of project specific matters. It permits the calculation of standard deviations of the relevant variables under manipulation and one can introduce the level of uncertainty and error margins of the input data loaded before running the computational algorithm. Since several data are going to be provided by the entity responsible of managing the system dispatch or a governmental agency, some level of confidence is needed and error bars can be assumed by project developers under reasonable and justifiable hypotheses. It is decided here to account only for the most relevant variables and to leave the rest open for future revisions. Water valorization: from the theoretical point of view, the value of stored energy in reservoirs is obtained as an avoided future cost, which is associated with the avoided thermal cost in interconnected hydrothermal systems (avoided rationing cost). This valuation assumes that all operators have the same perception of the hydrological risk and that the rationing cost would be absorbed by generators if they did not supply the associated energy. This is not necessarily what really occurs, so that modeling is handling some subjective rules which add uncertainty to the generated outputs. But it is one of the core assumptions of the simulation model and it is hard to minimize it on a theoretical basis. Short-term marginal cost: the model assumes that power plants are dispatched according to least-generation variable costs in a perfect competitive market, i.e. the selling price of electricity is equal to the cost of the marginal generator. But it depends on how many actors dominate the market. Additionally there are ‘take or pay’ contracts for fuel supply to gas-based thermal plants, so that their costs are based on fixed costs of these contracts instead of variable
La Vuelta and La Herradura Hydroelectric Project
- 95 - MGM International, Ltda. Copyright (2003) All Rights Reserved
generation costs. It changes some of the dispatch previously assumed conditions. The software incorporates these facts. Long-term contracts: the opportunity cost of long-term contracts are key decision elements for generators. This adds another quote of uncertainty in a least-generation cost modeling of the electricity system. Forecasting demand and capacity expansions: these are based on prospective governmental analyses, which in many cases are based on incomplete and inaccurate data. Hydrology: it is based on historical patterns and then stochastically simulated. Reality will say what conditions actually occurs. It is difficult to accurate and stochastic series has been proposed as the best way to deal with hydrological uncertainties. Stochastic series of flows are time-dependent series constructed from a stochastic variable but preserving the mean value and the standard deviation of the reference historical series. Monthly flow series are adjusted by a Normal frequency distribution, where values are within the standard deviation interval around the mean values. Real series is expected to have a 90% of accuracy. The model provides mean values and standard deviations. In spite of these facts, it must be remembered that electricity agents in the market, mainly hydroelectric generators, base their decisions using the same tools as the one proposed here, that is to say, running a SDDP model, so that they offer their energy resources on the same background. Output data: the outputs useful for estimating GHG emissions are thermal plants generation. These variables are calculated in mean values and with their standard deviations. From that error propagation can be applied to determine error intervals. It is addressed below. Uncertainties associated with the baseline and project emissions calculation: As it was already mentioned in Section E.2 and explained in more detail in item 6 below, baseline emissions are calculated in such a way that deviations between theoretical estimation and reality are minimized by defining appropriate baseline fixed factors (ex ante).
The errors associated with the variables derived from the model can be roughly estimated assuming the following:
Since ∑ ++ = n
th gG )( and ∑ ++ = nnth efgE )( , ∑ ++ ∆=∆ n
th gG )( and
( ) )(
)()()()(
th
ththth
nnnnnnth
GGEGEgefefgefgE+
+++++++
∆=∆≈∆≈∆+∆=∆ ∑∑ , considering that
the power plant emission factors can be approximated by the thermal system average value,
+E . This is a simple approximate way to propagate errors for the main variables to be used in
baseline emissions. 6. Description of how the baseline methodology addresses the calculation of baseline emissions and the determination of project additionality: Additionality is considered in item 2.2 above. The baseline is supposed to be applied to electricity generation projects in centrally dispatched interconnected hydrothermal systems, under the assumption that the project displace a portion of thermal energy that would have been

La Vuelta and La Herradura Hydroelectric Project
- 96 - MGM International, Ltda. Copyright (2003) All Rights Reserved
delivered by other thermal plants serving the system in the absence of the proposed project activity. No other alternative option would have been developed instead of the proposed project activity, mainly justified in the fact that the project itself is not merged into the interconnected system to cover unsatisfied demand and/or it would have not been selected as a priority project into the company business portfolio, only becoming a reality through CDM being determinant in the decision-making process conducted by the project sponsor. The following steps identify the baseline methodology. Step 1 Collect data needed to run the simulation dispatch model. These data are obtained from
verifiable and/or official sources.34 National and sectoral circumstances influencing the baseline are included in this step, gathering information on characteristics of the interconnected electricity system, historical trends and activity levels, capacity expansion plans, prospective analyses on future electricity demand, fuel prices, unavailability of generation plants and transmission lines, programmed maintenance activities, energy reserves, historical hydrology, scenario analysis under political and economic trends of the sector and the country, relevant data for estimating emission factors (net calorific values, physical properties and chemical composition of fuels, specific emission factors for fuels used in the local industry, efficiencies, etc.).
Step 2 Estimate the power plant emission factors per unit of generated energy, based on local
or national data and eventually using default values from international sources (IPCC, International Energy Agency, etc.). The already collected necessary data in step 1 is going to be used in this step. Equation (A3.1) proposes an alternative way of estimating the emission factors, efn, corresponding to each thermal power plant centrally dispatched in the interconnected system.
where scn is the specific consumption of the plant n, EFf is the carbon dioxide equivalent emission factor of the fuel f, including CO2, CH4, and N2O, EFf = CEFf + MEFf + NEFf, and LHVf is the lower heating value of the fuel f. These factors are adjusted for incomplete combustion, OFf, taking into account combustion efficiency default values for the different fuels burned in thermal power plants. Other alternatives can be used, depending on the initial data that can be obtained. In the absence of reliable base information, IPCC default values should be used, from the Revised 1996 IPCC Guidelines for National Greenhouse Gas Inventories.
34 Even though official sources, such as the Ministry of Energy, an Energy Planning Governmental Unit, or the Manager of the Wholesale Electricity Market, sometimes do not have information with the desired degree of accuracy as a consequence of the lack of data from companies, in many cases they are the only available sources, e.g. to forecast energy demand, system expansion, fuel prices, and so on. Nevertheless these sources are often better than international reports performed by foreign experts which do not know as well the particular country details and idiosyncrasies that can be determinant in the handling and collection of dispersed information. Capacity building in this direction would be an important contribution of CDM to developing countries, a fact that has been considered by the project participants when deciding their participation in this mechanism.
efn (tonne CO2e / GWh) = scn (ktonne fuel / GWh) × EFf (tonne CO2e / TJ)
× LHVf (TJ / ktonne fuel) × OFf, (A3.1)

La Vuelta and La Herradura Hydroelectric Project
- 97 - MGM International, Ltda. Copyright (2003) All Rights Reserved
Step 3 Load input data into the software platform to run simulation model. These data include,
among others (see a complete set of parameters in item 3 above):
a. Configuration and topology of the power plants belonging to the interconnected system and operating data. This includes technical data of the power plants and the system; identification of the centrally dispatched power plants; specific technology; nominal and net capacity; water flow, production factor and storage capacity of hydro plants; fuel efficiencies and specific consumption of thermal plants; bar and load data of the transmission lines; etc. (item 3 deals with these data in more detail).
b. Historical hydrology. c. Projections of the electricity demand. d. Load curve discriminated in five hourly demand blocks. e. Annual distribution of new plants according to the Reference Expansion Plan.
Step 4 Run the simulation model without including the project. (The explanation of how this
model works is given in item II above.) Step 5 Run the simulation model but now including the project. Step 6 Gather the outputs (daily power plants generation, ±ng~ , where + stands for the
simulation with the project and – without the project) in order to estimate relevant emissions from steps 4 and 5, formatted in MS Excel files on a monthly and yearly easily-to-handle basis. Here, “~” stands for variables estimated through the simulation model, to distinguish them from the same variables obtained in real conditions.
This step can be considered the first step of the methodology after running the simulation model (which could be considered as a sort of black box, since the model is an already sound computer program, and only input and output are relevant). Step 7 Calculate annual emissions of thermal power plant n, ±ne~ , both without (–) and with (+)
the project, for the simulations performed in steps 4 and 5, respectively.
where ±ng~ is the electricity generated by the thermal power plant n in a year.
Step 8 Calculate total CO2e emissions per year, )(~ thE± , of the thermal power plants serving the system from results derived in step 7.
±ne~ (tonne CO2e / year) = ±ng~ (GWh / year) × efn (tonne CO2e / GWh), (A3.2)
)/(~)/(~2
)(12
)( yeareCOnetoneyeareCOtonneEN
thnn
th ∑=
±± = , (A3.3)

La Vuelta and La Herradura Hydroelectric Project
- 98 - MGM International, Ltda. Copyright (2003) All Rights Reserved
(A3.6)
where N is the number of thermal plants in the system and the sum extends only over thermal (th) plants.
Step 9 Calculate the total amount of thermal electricity generated in a year, )(~ thG± , from results
of steps 4 and 5.
Step 10 Obtain the annual average CO2e emissions,
±E~ , of the thermal plants serving the
system, combining steps 8 and 9.
Step 11 Calculate the thermal generation displacement factor, F, as the rate between the
difference of the energies obtained in step 9 (‘without the project’ minus ‘with the project’) over the energy generated by the project itself.
.~
~~ )()(
P
thth
gGGF +− −
=
Steps 10 and 11 are useful for ex ante determination of baseline key parameters. These parameters are closely associated with baseline emissions and fixed during the monitoring of project activity. Step 12 Calculate baseline emissions. Baseline emissions can be derived from the model making the difference between )(~ thE− and
)(~ thE+ . This provides a way to estimate the order of magnitude of baseline emissions. In actual
conditions baseline emissions could be obtained as )(~ thE− – )(thE+ . Note that the ~ in )(thE+ was deleted, meaning that emissions are now calculated under actual conditions. However this is not a good approach to estimate baseline emissions during the project implementation phase and monitoring process. The main reason is that while both, )(~ thE− and )(~ thE+ , were obtained ex ante under the same simulation scenario, that is, the same hydrological conditions, the same electricity demand, etc., )(thE+ is calculated ex post in a highly probable different scenario. Thus
while )(~ thE− and )(~ thE+ are correlated, since a change in the basic input data will modify the two
variables in a similar way, )(thE+ is not correlated with )(~ thE− . If )(thE+ were to be higher than the
expected value derived from the model ( )(~ thE+ ), because actual conditions are unlike those
)/(~)/(~)(1
)( yearGWhgyearGWhGN
thnn
th ∑=
±± = . (A3.4)
±E~ (tonne CO2e / year) = )(~ thE± (tonne CO2e / GWh) / )(~ thG± (GWh / year). (A3.5)

La Vuelta and La Herradura Hydroelectric Project
M
simulated, one would have expected that )(thE− would grow in a similar form,35 which is not the case. Therefore it is more appropriate to express baseline emissions in a way such that baseline emissions do not depend on )(~ thE− –which can only be estimated ex ante because it will not occur in reality– but baseline emissions be most independent of the actual scenario that were to happen. A way to do that is to express baseline emissions in terms of a parameter that takes into account the difference of relevant variables between the two scenarios. And this is the factor F calculated in step 11. Then, )(thE− can be rewritten as (no ~ variables are now involved) so that baseline emissions, EB = )(thE− – )(thE+ , result Ea
Ie C Iiped
3
[ ] ,−+− ×+×= EGFgE P (A3.7)
~)(th
~)()( thth
quation (A3.8) has two parameters that are going to be fixed in the baseline methodology, the verage emissions in the ‘without project’ situation,
−E~ , and the displacement factor, F.
f what actually happen during project implementation gives as a result the same values as those stimated in ideal conditions with the simulation model, then
[ ])./(
)/()/()/()/(
2)(
22
yeareCOtE
GWheCOtEyearGWhGFyearGWhgyeareCOtEth
PB
+
−+
−
×+×= (A3.8)
.~~ )()()()( thththth EEEEE −=−= (A3.9)
omparing baseline emissions of equation (A3.8) with BE~ = )(~ thE− – )(thE+ , it can be show that
B +−+−
)()(~~~~ thth
- 99 -
GM International, Ltda. Copyright (2003) All Rights Reserved
t is quite obvious that in general the second parenthesis is greater than the first one, since )(thG+ s much greater than gP and also its deviation from the mean value. Moreover the first arenthesis is even multiplied by F < 1. Thus the second parenthesis dominates the bracket of quation (A3.10). Thus, if )()(~ thth GG ++ > , then BE~ > EB, which means that under an eventual ecrease in activity levels outside the project activity or due to force majeure, baseline
5 Note that )(thE− does not have the ~, meaning that it is going to be calculated from actual data.
( ) ( )[ ]PPBB GGggFEEE ++−−+−××=− . (A3.10)

La Vuelta and La Herradura Hydroelectric Project
- 100 - MGM International, Ltda. Copyright (2003) All Rights Reserved
emissions are lower than expected from model simulation, so that CERs cannot be earned under such a circumstance (cf. para. 47 of Decision 17/CP.7). On the other hand, if )()(~ thth GG ++ < , then
BE~ < EB, which accounts for an eventual scenario where future anthropogenic emissions rise above projected (assumed as current) levels, due to the specific circumstances of the host Party (cf. para. 46 of Decision 17/CP.7). Recall that F is different from 1 because a part of the displaced energy generation is also hydroelectric, due to the value of water and consequent storage by hydropower generators, implying that some hydro plants are at the margin (this is one of the main characteristics of a hydrothermal interconnected system), and also because a part of thermal energy cannot be displaced due to transmission capacity limitations. The advantage of the formulation given by equation (A3.8) is motivated by the fact that, under actual conditions, it is not possible to obtain power plant generation, gn– (since they can only be estimated through the simulation model), and thus calculating )(thE− from equation (A3.3). Equation (A3.8) provides a way to calculate baseline emissions based on ex post data and taking into account baseline parameters fixed ex ante. The two parameters fixed ex ante have less sensitivity to variations in real conditions, since F is based on the difference between correlated scenarios and
−E~ is almost the same as
+E . The last is due to average emissions account
for contributions from all thermal power plants (ratio between total emissions and total generation of the entire thermal system) and in spite of the redistribution caused by the presence of the project in the (+) case with respect to the (–) case, the shift introduced by the project is negligible with respect to the sum of generation and emissions of all the thermal plants that are centrally dispatched. This would not be the case if the project under consideration is so large as to influence the overall system to a significant extent. If one were to fix )(thE− instead of F and
−E~ , baseline emissions could differ a lot from actual
emissions displaced by the project activity, in the case when )(thE+ result very different from the one estimated ex ante. But F compensates any deviation in )(thE+ since )(thE− follows a similar behavior through the F linkage. On the other hand, equation (A3.8) can be rewritten as As commented before,
−E~ ≅
+E and then, in a first approximation, EB results
The last equation is a key equation to understand the proposed methodology. It reads: baseline emissions represent the amount of thermal plants emissions displaced by the project activity,
[ ] .1~~
)(
−×+×××=
+
−+
+
−+ E
EE
E
EEFgE th
PB (A3.11)
.+
××≅ EFgE PB (A3.12)

La Vuelta and La Herradura Hydroelectric Project
M
where F accounts for the fraction of this thermal energy with respect to the energy generated by the project; (1 – F) is the hydroelectric energy displaced by the project. Moreover, F × ⟨E⟩+ can be considered as a system emission factor,
sysE , which includes part of the hydroelectric
contribution. It can be also seen that an alternative methodology based on average thermal emissions (“operating margin” approach, proposed for small-scale CDM project activities36), does not account for real emissions and does not take into account displaced hydroelectric energy. Such an approach would read in this case as where
−E~ represents average emissions of the past three years obtained from data provided
by the manager of the wholesale electricity market or the official dispatch center. These baseline emissions are greater than those obtained through the use of the proposed methodology, mainly due to the exclusion of displaced hydroelectric energy, which is an important part of interconnected hydrothermal systems. This adds conservativeness to the proposed approach. Finally, in order to extend the methodology, if the project consists of a thermal plant, baseline emissions are going to be straightforwardly modified as i Sc S Tp 7t Tepv
3
p(
,−
×≅ EgE PB (A3.13)
,)()( thth eEEE −−= (A3.14)
GM In
n order
tep 13 onserva
tep 14
his comresents
. he proj
he spemissionarticipaery beg
6 Annexroject aMeth Pa
~~
- 101 -
ternational, Ltda. Copyright (2003) All Rights Reserved
to account for the emissions displaced by the implementation of the project activity.
Compare results obtained in step 12 with other methodological proposals to add tiveness to the baseline determination.
Perform a sensitivity analysis (see item 5).
pletes the overall description of the proposed baseline methodology steps. Item II a description of the simulation model.
Description of how the baseline methodology addresses any potential leakage of ect activity:
cial characteristics of the proposed new baseline methodology accounts for baseline s departing from off-site project emissions which are not under the control of project nts. These are considered leakage, so that the methodology addresses leakage from the inning. Baseline emissions are indeed all “leakage.”
6: “Indicative simplified baseline and monitoring methodologies for selected small-scale CDM ctivity categories,” Recommendation by the Panel on Baseline and Monitoring Methodologies nel) adopted by the Executive Board in its seventh session (20-21 January 2003).
PB +−

La Vuelta and La Herradura Hydroelectric Project
- 102 - MGM International, Ltda. Copyright (2003) All Rights Reserved
8. Criteria used in developing the proposed baseline methodology, including an explanation of how the baseline methodology was developed in a transparent and conservative manner: The main criteria considered were the consistency among additionality, project boundary, baseline and monitoring, and the selection of an approach that represents a conservative way to deal with baseline and project emissions. It was justified in items 5 and 6 above. All calculations are transparent and all the assumptions are explicit. This methodology gives emission reductions which are lower than emission reductions obtained from other methodologies, such as the “operating or even combined margin approach”, the simulation of the system without including transmission lines problems, etc. A comparison among these different alternatives is presented in the Excel file MGM_BLS_LvyLH_EM.xls. 9. Assessment of strengths and weaknesses of the baseline methodology: Strenghts: the methodology permits the estimation of baseline emissions from easy and accurate algorithms and allowing to fix ex ante baseline parameters. Moreover, the approach deals with an assessment of uncertainties easy-to-handle. Weaknesses: the lack of essential data and the simulation model complexity are the main weaknesses of the methodology. But, if one considers that the model is a standard software often used by generators (which are the candidates to be the project participants), no major problems are visualized for using this approach. 10. Other considerations, such as a description of how national and/or sectoral policies and circumstances have been taken into account: When analyzing additionality issues sectoral and national circumstances must be taken into account, because they are key elements to understand the environment in which the project is going to be developed. These are matters to be considered under a project-specific basis. In general, the methodology addresses these circumstances by taking into account projected energy demand, capacity expansions, sectoral activity levels, system characteristics and electricity trends, regulatory framework, sectoral policies and other specific legislation determining system functioning, standard official data used as input modeling data, etc.

La Vuelta and La Herradura Hydroelectric Project
- 103 - MGM International, Ltda. Copyright (2003) All Rights Reserved
ANNEX 4: NEW MONITORING METHODOLOGY The new monitoring methodology is designated:
“Monitoring methodology for displaced electricity generation in a centrally dispatched hydrothermal interconnected power system”
1. Brief description of new methodology This methodology was specifically developed for the case involving the construction of a hydroelectric power plant to be connected to a centrally dispatched hydrothermal interconnected power system. However, the new power plant to be constructed could be based on another renewable energy source, or even a thermal power plant with a low emissions factor (e.g. natural gas combined cycle). The methodology proposed here may be easily extended to cover such cases. This methodology is closely related to the proposed new baseline methodology denominated “Baseline methodology for displaced electricity generation in a centrally dispatched hydrothermal interconnected power system.” The monitoring plan permits the determination of anthropogenic GHG emissions generated by the project activity, and in the baseline, in a straightforward manner. The Monitoring and Verification Plan is based on recording electricity generation of the proposed hydroelectric plant and the electricity generation of all thermal plants serving the interconnected national system. Data should be collected on a monthly basis for the duration of the project lifetime and crediting period. Since most hydroelectric projects last longer than the maximum crediting period permitted under CDM, the later value of 21 years will also determine the monitoring period. GHG emissions following project implementation are determined from the above data. The baseline emissions basically comprise CO2 emissions from natural gas and coal combustion in the thermal plants. There are also some methane and nitrous oxide emissions from natural gas and coal combustion. In the case of new hydroelectric plants, such as the specific methodology covered here, project emissions are due to the construction of the power plant (which take place before power generation takes place) and methane emissions from the reservoir (which are assumed to be constant in time in this model). Thus, project GHG emissions are entirely determined before project implementation and remain unchanged throughout the crediting period. However, baseline emissions are determined in a dynamic manner from monitored data, which also permit estimation of emissions reductions achieved by the project. This type of project will require only straightforward collection of data, described below. Considering the project boundary, the following data need to be monitored in order to estimate baseline emissions and emissions reductions:

La Vuelta and La Herradura Hydroelectric Project
- 104 - MGM International, Ltda. Copyright (2003) All Rights Reserved
GHG related data: Monthly electricity generation of the project hydroelectric plant. (The generation
company is likely to be taking measurements every hour, but we will only consider the monthly results.)
Annual electricity generation of all thermal plants serving the interconnected national system.
Non-GHG related data:
The generation company should execute an Environmental Management Plan in order to deal with environmental, social and economic aspects of the region and their inhabitants.
A detailed example of the monitoring procedure, for the specific project considered in this PDD, can be found in MGM_MVP_LVyLH_EM.xls. With minimal changes in the spreadsheet, mainly for modifying parameter estimates to suit individual project circumstances, this spreadsheet model can be applied to any other hydroelectric plant. With small changes, the model can be adapted to other types of renewable energy power plants as well. For low emissions fossil fuel power generation, there will be project emissions as well, and will depend on the electricity output and fuel input of the power plant in question. This would require more changes in the methodology and spreadsheet proposed here. The spreadsheet model takes monitored data as input, and automatically calculates baseline emissions, for each year following project implementation, in a dynamic manner. The spreadsheet model is an electronic GHG monitoring and calculation workbook for hydroelectric projects to be connected to a national interconnected grid. The electronic workbook serves as the data management and analysis system for the project managers and operators, and can be used throughout the lifetime of the project. The MGM_MVP_LVyLH_EM.xls spreadsheet is structurally very similar to that used in order to determine baseline emissions and estimate emission reductions (MGM_BSL_LVyLH_EM.xls for this PDD). The assumptions defining emissions factors are the same in each case, and are unchanged throughout the project. While emissions factors remain unchanged, baseline emissions depend on electricity generation of the hydroelectric plant and electricity generation of all thermal plants, and are determined in a dynamic manner from data entered into the MGM_MVP_LVyLH_EM.xls spreadsheet. The spreadsheet thus also determines emissions reductions as a result of project implementation. The staff responsible for Project monitoring should complete the electronic worksheets on a monthly basis. Given that some of these data may be collected more frequently, data need to be aggregated to allow monthly inputs into the spreadsheet. The spreadsheet automatically provides annual totals in terms of GHG reductions achieved through the implementation of the project. The MGM_MVP_LVyLH_EM.xls determines the emissions associated with project implementation. The model contains a series of worksheets with different functions:
Data entry sheets:
o Monthly electricity generation of the specific hydroelectric plant.
o Monthly electricity generation of each thermal plant in the interconnected system.

La Vuelta and La Herradura Hydroelectric Project
- 105 - MGM International, Ltda. Copyright (2003) All Rights Reserved
Calculation sheets:
o Annual electricity generation of each thermal plant in the interconnected system, and the total.
o Annual CO2-equivalent emissions associated with each thermal plant, and the total.
o Annual total CO2-equivalent emissions in the baseline.
Result sheet:
o Annual reduction of CO2-equivalent emissions. This monitoring methodology is highly compatible with the baseline methodology termed “Baseline methodology for displaced electricity generation in a centrally dispatched hydrothermal interconnected power system.” A monitoring methodology must be compatible with the baseline methodology used and with the formulation of the baseline scenario for a candidate project.

La
Vue
lta a
nd L
a H
erra
dura
Hyd
roel
ectr
ic P
roje
ct
- 106
- M
GM
Inte
rnat
iona
l, Lt
da. C
opyr
ight
(200
3) A
ll R
ight
s Res
erve
d
2.
Dat
a to
be
colle
cted
or
used
in o
rder
to m
onito
r em
issi
ons f
rom
the
proj
ect a
ctiv
ity, a
nd h
ow th
ese
data
will
be
arch
ived
ID
num
ber
D
ata
type
D
ata
vari
able
D
ata
unit
Mea
sure
d (m
), ca
lcul
ated
(c) o
r es
timat
ed (e
)
Rec
ordi
ng
freq
uenc
y
Prop
ortio
n of
da
ta to
be
mon
itore
d
How
will
the
data
be
arc
hive
d?
(ele
ctro
nic/
pap
er)
For
how
long
is
arch
ived
dat
a to
be
kep
t?
Com
men
t
D.2
.1
Elec
trici
ty
gene
rate
d by
the
hydr
oele
ctric
pl
ant
g P
GW
h m
m
onth
ly
100%
Elec
troni
c: 1
4 ye
ars
Pape
r: 1
year
Elec
troni
c: 1
4 ye
ars
Pape
r: 1
year
D.2
.2
Elec
trici
ty
gene
rate
d by
th
erm
al p
ower
pl
ant n
g n
GW
h m
m
onth
ly
100%
Elec
troni
c: 1
4 ye
ars
Pape
r: 1
year
Elec
troni
c: 1
4 ye
ars
Pape
r: 1
year

La Vuelta and La Herradura Hydroelectric Project
- 107 - MGM International, Ltda. Copyright (2003) All Rights Reserved
3. Potential sources of emissions which are significant and reasonably attributable to the project activity, but which are not included in the project boundary, and identification if and how data will be collected and archived on these emission sources Monitoring to determine all significant emissions associated with project activities has been included in section 2 above. Notes:
1. It is possible to monitor the fuel consumption of each thermal plant over the monitoring/crediting period to determine the real value of emissions in these power plants, considering changes in power plant efficiency and its change in time. However, not only would this increase the monitoring complexity, but it will also make the emissions factors variable.
2. On the other hand, another parameter to monitor could be the electricity generated by the hydroelectric plants that make up the interconnected system with the objective of estimating the methane emissions associated with it.
4. Assumptions used in elaborating the new methodology: The monitoring methodology and its application is compatible with the baseline methodology and the development of the baseline scenario for this type of project. The assumptions regarding heating value and emissions factors of fuels used in the thermal power plants are country specific and should be established in the PDD.

La
Vue
lta a
nd L
a H
erra
dura
Hyd
roel
ectr
ic P
roje
ct
- 108
- M
GM
Inte
rnat
iona
l, Lt
da. C
opyr
ight
(200
3) A
ll R
ight
s Res
erve
d
5. P
leas
e in
dica
te w
heth
er q
ualit
y co
ntro
l (Q
C) a
nd q
ualit
y as
sura
nce
(QA
) pro
cedu
res a
re b
eing
und
erta
ken
for
the
item
s mon
itore
d (s
ee ta
bles
in it
ems 2
and
3 a
bove
)
The
tabl
e be
low
des
crib
es Q
A/Q
C p
roce
dure
s for
with
eac
h da
ta v
aria
ble,
toge
ther
with
add
ition
al re
leva
nt in
form
atio
n on
eac
h va
riabl
e.
Dat
a U
ncer
tain
ty le
vel o
f dat
a (H
igh/
Med
ium
/Low
) A
re Q
A/Q
C p
roce
dure
s pl
anne
d fo
r th
ese
data
? O
utlin
e ex
plan
atio
n w
hy Q
A/Q
C p
roce
dure
s are
or
are
not b
eing
pla
nned
.
D.2
.1
Low
Y
es
Thes
e da
ta w
ill b
e di
rect
ly u
sed
for c
alcu
latio
n of
em
issi
ons r
educ
tions
D.2
.2
Low
Y
es
Thes
e da
ta w
ill b
e us
ed a
s sup
porti
ng in
form
atio
n to
cal
cula
te e
mis
sion
re
duct
ions
by
proj
ect a
ctiv
ity
La Vuelta and La Herradura Hydroelectric Project
- 109 - MGM International, Ltda. Copyright (2003) All Rights Reserved
6. What are the potential strengths and weaknesses of this methodology? Since there are no methodologies approved by the UNFCCC, at this time, specific to this type of projects, the strengths and weaknesses of the methodology need to be evaluated on their own merits. The strengths of the methodology are:
Simple and easy to use, based on data normally already collected at the project site. Complete compatibility with calculation of baseline emissions. Baseline emissions are automatically determined in a dynamic manner, based on
electricity generation data, in the spreadsheet model associated with the monitoring plan.
The spreadsheet model permits GHG emission reductions to be automatically calculated, taking into account the above considerations.
There are no known weaknesses of the methodology.
7. Has the methodology been applied successfully elsewhere and, if so, in which circumstances?
This methodology was developed especially for this Project, which is the first hydroelectric project being developed by MGM International. We developed hydroelectric CDM projects in the small scale category, where simplified methodologies have been proposed by the CDM EB. Thus, the proposed methodology has not previously been applied. However, the methodology has been developed to be generalizable and can thus be replicated in other projects involving hydroelectric plants connected to centrally dispatched hydrothermal interconnected grids. With minor modifications it can be applied to any new renewable power project, and with somewhat more modifications to low-emission fossil power plants as well. Standard procedures for calibrating metering devices used to measure power plant electricity output are already a part of routine good practices. With minor modifications, the spreadsheets can be adapted to unforeseen variations in the key parameters (corrective actions).

La
Vue
lta a
nd L
a H
erra
dura
Hyd
roel
ectr
ic P
roje
ct
- 110
- M
GM
Inte
rnat
iona
l, Lt
da. C
opyr
ight
(200
3) A
ll R
ight
s Res
erve
d
AN
NE
X 5
: BA
SEL
INE
DA
TA
For
deta
ils p
leas
e se
e sp
read
shee
ts M
GM
_BSL
_LV
yLH
_EM
.xls
. Res
ults
are
sum
mar
ized
bel
ow.
BA
SELI
NE
EMIS
SIO
NS
B
asic
dat
a an
d so
urce
s
Coa
l
It
em
Val
ue
Uni
ts
Dat
a so
urce
s
OF
coal
O
xida
tion
Fact
or
0.98
R
ef.1
, Tab
le 1
-6 p
age
1.29
Coa
l - F
ract
ion
of c
arbo
n ox
idis
ed
CE
Fco
al
CO
2 em
issi
ons f
acto
r 94
.6to
n C
O2/
TJ
Ref
. 1, T
able
1-1
pag
e 1.
13. O
ther
Bit.
Coa
l: 25
,8 t
C/T
J low
er
heat
ing
valu
e ba
sis.
X 4
4/12
= 9
4,6
ton
CO
2/TJ.
ME
Fco
al
CH
4 em
issi
on fa
ctor
0.
7kg
CH
4/TJ
R
ef. 1
, Tab
le I-
15 p
age
1.53
. Coa
l - P
ulve
rised
Bito
min
ous C
ombu
stio
n- D
ry B
otto
m, w
all f
ired
ME
Fco
al-C
O2e
quiv
C
H4 e
mis
sion
fact
or (
in C
O2e
quiv
) 0.
0147
ton
CO
2e/T
J C
alcu
late
d M
EFco
alx
GW
P(C
H4)/
1000
NE
Fco
al
N2O
em
issi
on fa
ctor
1.
6kg
N2O
/TJ
Ref
. 1, T
able
I-15
pag
e 1.
53. C
oal-P
ulve
rised
Bito
min
ous C
ombu
stio
n- D
ry B
otto
m, w
all f
ired
NE
Fco
al-C
O2e
quiv
N
2O e
mis
sion
fact
or (
in C
O2e
quiv
) 0.
496
ton
CO
2e/T
J C
alcu
late
d N
EFco
alx
GW
P(N
2O)/1
000
GW
P (N
2O)
Glo
bal W
arm
ing
Pote
ntia
l (N
2O)
310
R
ef. 2
, for
nitr
ous o
xide
this
was
310
.
GW
P (C
H4)
G
loba
l War
min
g Po
tent
ial (
CH
4)
21
Ref
. 2, f
or m
etha
ne th
is w
as 2
1.

La
Vue
lta a
nd L
a H
erra
dura
Hyd
roel
ectr
ic P
roje
ct
- 111
- M
GM
Inte
rnat
iona
l, Lt
da. C
opyr
ight
(200
3) A
ll R
ight
s Res
erve
d
Nat
ural
gas
Item
V
alue
U
nits
D
ata
sour
ces
OF
NG
Oxi
datio
n Fa
ctor
0.
995
R
ef.1
, Tab
le 1
-6 p
age
1.29
Gas
- Fr
actio
n of
car
bon
oxid
ised
CE
FN
G
CO
2 em
issi
ons f
acto
r (c
ombu
stio
n)
56.1
kg/G
J R
ef. 1
, Tab
le 1
-1 p
ag 1
.13.
Nat
ural
gas
(dry
): 15
.3 t
C/T
J low
er
heat
ing
valu
e ba
sis.
X 4
4/12
= 5
6.1
t CO
2/TJ.
ME
FN
G
CH
4 em
issi
on fa
ctor
6
kg C
H4/
TJ
Ref
. 1, T
able
I-15
pag
e 1.
53. N
atur
al g
as -
Lar
ge g
as-F
ired
gas t
urbi
nes >
3 M
W
ME
FN
G-C
O2e
quiv
C
H4 e
mis
sion
fact
or (
in C
O2e
quiv
) 0.
126
ton
CO
2e/T
J C
alcu
late
d M
EFN
Gx
GW
P(C
H4)/
1000
GW
P (C
H4)
G
loba
l War
min
g Po
tent
ial (
CH
4)
21
Ref
. 2, f
or m
etha
ne th
is w
as 2
1.

La Vuelta and La Herradura Hydroelectric Project
- 112 - MGM International, Ltda. Copyright (2003) All Rights Reserved
The CO2 emission factors of thermal power plants in the Colombian interconnected system are shown in the table below. (Note that decimals are shown as commas.)
Name Fuel Type Capacity, MW Emission Factor (t CO2/GWh)
RACIONAMIENTO nat gas comb cycle 470 370,63 BARRANCA 1 nat gas steam 12 608,08 BARRANCA 2 nat gas steam 12 619,55 BARRANCA 3 nat gas steam 63 690,76 BARRANCA 4 nat gas simple cycle 30 746,62 BARRANCA 5 nat gas steam 20 740,5 BARRANQUILL3 nat gas steam 64 574,33 BARRANQUILL4 nat gas steam 65 579,8 CANDELARIA1 nat gas simple cycle 150 556,63 CANDELARIA2 nat gas simple cycle 150 575,21 CARTAGENA 1 nat gas steam 60 651,77 CARTAGENA 2 nat gas steam 50 772,55 CARTAGENA 3 nat gas simple cycle 67 674,06 CC_COSTA1 nat gas TBD 150 370,63 CC_COSTA2 nat gas TBD 300 370,63 EMCALI nat gas comb cycle 233 403,21 FLORES 1 nat gas comb cycle 150 422,2 FLORES 2 nat gas comb cycle 99 616,96 FLORES 3 nat gas comb cycle 550 370,63 GUAJIRA 1 nat gas steam 151 572,5 GUAJIRA 2 nat gas steam 151 564,45 MERILECTRICA nat gas simple cycle 154 581,5 OCOAFO nat gas TBD 27 474,83 PAIPA 1 coal steam 28 1350,27 PAIPA 2 coal steam 68 1214,27 PAIPA 3 coal steam 68 1221,51 PAIPA 4 coal steam 150 965,73 PALENQUE 3 nat gas steam 14 550 PROELECTRIC1 nat gas TBD 45 477,86 PROELECTRIC2 nat gas TBD 45 477,86 TASAJERO 1 nat gas steam 155 585,62 TEBSAB nat gas simple cycle 750 412,91 TERMOCENTRO nat gas simple cycle 285 415,91 TERMODORADA1 nat gas simple cycle 51 559,74 TERMOSIERRA nat gas comb cycle 470 370,63 TERMOVALLE 2 nat gas steam 210 395,74 TPIEDRAS nat gas simple cycle 3 575,21 YUMBO3 coal steam 29 1624,65 ZIPAEMG2 coal steam 35 1225,33 ZIPAEMG3 coal steam 62 1150,12 ZIPAEMG4 coal steam 62 1141,26 ZIPAEMG5 coal steam 63 1089,79

La Vuelta and La Herradura Hydroelectric Project
- 113 - MGM International, Ltda. Copyright (2003) All Rights Reserved
BASELINE EMISSIONS Baseline emissions are calculated considering 100 stochastic hydrological series and including the power transmission network. Baseline emissions are given by:
EB = (gP F + G+)<E>- - E+ The values of the parameters and resulting emissions are summarized below. (Note that decimals are shown as commas, and thousands are separated by periods.)
year gP (GWh) F G+
(GWh) <E>-
(tonne CO2e/GWh)E+
(tonne CO2e) EB
(tonne CO2e)
2005 227,88 0,47 3.706,47 509,31 1.869.084,44 73.539,88 2006 225,07 0,52 5.460,32 579,98 3.161.168,59 73.606,21 2007 230,76 0,73 6.645,40 611,92 4.060.488,55 109.137,61 2008 230,19 0,57 8.691,76 606,55 5.271.212,97 80.757,82 2009 230,71 0,63 9.972,53 604,23 6.025.184,30 88.256,02 2010 231,02 0,50 11.034,65 596,61 6.589.640,48 62.560,12 2011 229,03 0,48 12.620,29 612,32 7.733.997,17 60.886,63 2012 228,54 0,54 14.922,51 608,62 9.094.330,17 63.069,02 2013 228,59 0,52 16.497,94 586,11 9.680.934,47 58.478,96 2014 229,58 0,46 17.721,37 579,90 10.288.258,51 49.894,12 2015 229,27 0,57 20.229,27 564,28 11.423.600,58 64.745,19 2016 232,23 0,55 21.987,18 555,63 12.226.509,29 61.688,40 2017 229,46 0,60 24.461,66 546,04 13.362.438,39 70.155,97 2018 229,85 0,73 26.681,53 540,24 14.420.096,22 85.373,72 2019 229,61 0,71 29.493,77 535,61 15.803.148,70 81.555,10 2020 229,61 0,71 29.493,77 535,61 15.803.148,70 81.555,10 2021 229,61 0,71 29.493,77 535,61 15.803.148,70 81.555,10 2022 229,61 0,71 29.493,77 535,61 15.803.148,70 81.555,10 2023 229,61 0,71 29.493,77 535,61 15.803.148,70 81.555,10 2024 229,61 0,71 29.493,77 535,61 15.803.148,70 81.555,10 2025 229,61 0,71 29.493,77 535,61 15.803.148,70 81.555,10

La Vuelta and La Herradura Hydroelectric Project
- 114 - MGM International, Ltda. Copyright (2003) All Rights Reserved
PROJECT EMISSIONS A hydroelectric project in operation does not emit GHGs during its operation. There are emissions from the transport of materials for the construction of the dam and associated works. There are also emission associated with the manufacture of cement used in dam. Besides being energy intensive, cement manufacture is a source of CO2 itself. Finally, methane is emitted from the reservoir itself. The GHG emissions from each of these sources are quantified below. TRANSPORT
Fuel use in transport
Diesel consumption (US gallons)
Gasoline consumption (US gallons)
Past Future Past Future roads 339871 119700 power house LV 77 17 power house LH 220 63 derivation works LV 4431 950 derivation works LH 12 8 tunnel LH 33749 21696 conduction works LV 13288 3797 conduction works LH 190 68 others LV 33 others LH 316 271 TOTAL (US gallons) 392187 146568 13774 5940
Total consumption Diesel Gasoline
litres 2,039,402 74,625
Properties of diesel and gasoline
Diesel Gasoline Data
source LHV (MJ/kg fuel) 42.9 46.5 Ref. 5 Density (kg/l) 0.880 0.735
Emissions factors of diesel and gasoline
CO2 CH4 N2O Total (CO2 equiv)
Data source
Diesel g/kg fuel 3140 0.17 1.3 3547 Ref 3 g/MJ 73 0.004 0.03
Gasoline g/kg fuel 3180 0.7 0.04 3207 Ref. 4 g/MJ 73 0.02 0.001
Total emissions from transport (t CO2-equivalent)
Diesel 6365 Gasoline 176 TOTAL 6541

La Vuelta and La Herradura Hydroelectric Project
- 115 - MGM International, Ltda. Copyright (2003) All Rights Reserved
Cement manufacture Emission factor 0.4985 t CO2/tonne cement
Data source: Ref. 7 Cement volume m3
La Vuelta structure 15250
tunnels 400 other 800 16450
La Herradura structure 17800
tunnels 2200 20000
Total concrete used 36450 m3 Concrete density 0.35 tonne/m3
Emissions (tonne CO2) 6360 Methane from flooding Flooded area (m2) La Vuelta La Herradura Total 6181 3194 9375
Days 365
Methane GWP
21 Methane emissions (ton CO2e) 7.19 Emission rate (mg CH4-C/m2-day) 75 Data source: Ref. 6 Molecular/atomic weight ratio 1.333
Total project emissions Item t CO2 equivalent emissions Transport 6541 Cement manufacture 6360 Methane from flooding 7 (annual) TOTAL 12908 (first year)
Note that, while emissions from transport and cement manufacture accrue only at the start of the project, methane emissions continue for the lifetime of the reservoir.

La Vuelta and La Herradura Hydroelectric Project
- 116 - MGM International, Ltda. Copyright (2003) All Rights Reserved
BASELINE AND PROJECT EMISSIONS (Note that thousands are separated by periods.)
year EB (tonne CO2e) EP (tonne CO2e) ER (tonne CO2e) 2005 73.540 12.908 60.632 2006 73.606 7 73.599 2007 109.138 7 109.130 2008 80.758 7 80.751 2009 88.256 7 88.249 2010 62.560 7 62.553 2011 60.887 7 60.880 2012 63.069 7 63.062 2013 58.479 7 58.472 2014 49.894 7 49.887 2015 64.745 7 64.738 2016 61.688 7 61.681 2017 70.156 7 70.149 2018 85.374 7 85.367 2019 81.555 7 81.548 2020 81.555 7 81.548 2021 81.555 7 81.548 2022 81.555 7 81.548 2023 81.555 7 81.548 2024 81.555 7 81.548 2025 81.555 7 81.548

La Vuelta and La Herradura Hydroelectric Project
- 117 - MGM International, Ltda. Copyright (2003) All Rights Reserved
REFERENCES 1. IPCC Guidelines for National Greenhouse Gas Inventories: Reference Manual Volume
3 (1996) 2. According to Article 5, section 3 of the Kyoto Protocol, GWP value is as agreed on at COP3.
3. Ref 1, Table 1-49 page 1.91. Estimated emission factors for European non-road mobile sources and machinery - Diesel engines – Industry
4. Ref 1, Table 1-41 page 1.83. Estimated emission factors for European gasoline heavy-duty vehicles – Evaporative.
5. Ref 1, Table 1-24 page 1.62. Net calorific values for preceding table - Liquid - Diesel/Distillated and Gasoline
6. Greenhouse Gas Assessment Handbook, A Practical Guidance Document for the Assessment of Project-level Greenhouse Gas Emissions, Paper Nº 064, Sept. 1998, The World Bank.
7. Ref. 1, page 2.6.